Embed Size (px)
Citation preview
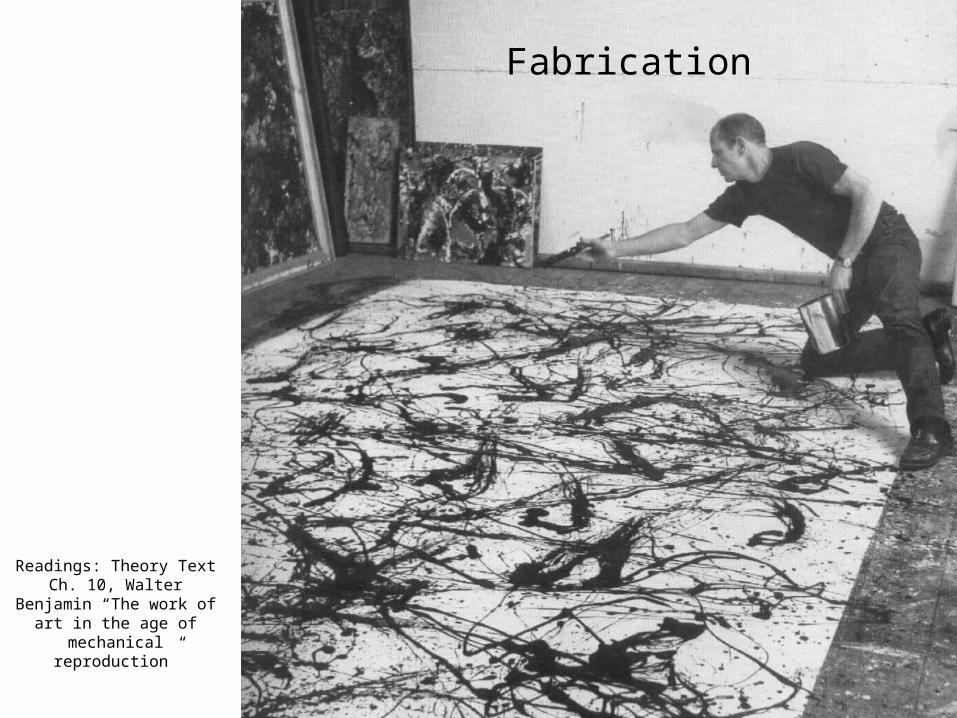
Fabrication
Readings: Theory Text Ch. 10, Walter Benjamin “The work of art in the age of
mechanical reproduction”

Image-making & thinking about images
• objectives & practices, materials and techniques of image-makers– http://www.caiguoqiang.com/

Paul Klee-- Taking a Line for a Walk

Klee (continued)

Klee (continued)

Bridget Riley--Movement in Square

Bridget Riley
• Blaze

Mitchell--Electronic Tools,
• Problematic nature of “tool” in communications research
• Digital Images and Manipulation as Challenges to authority of photographic records
• Rethinking conventions in visual discourse
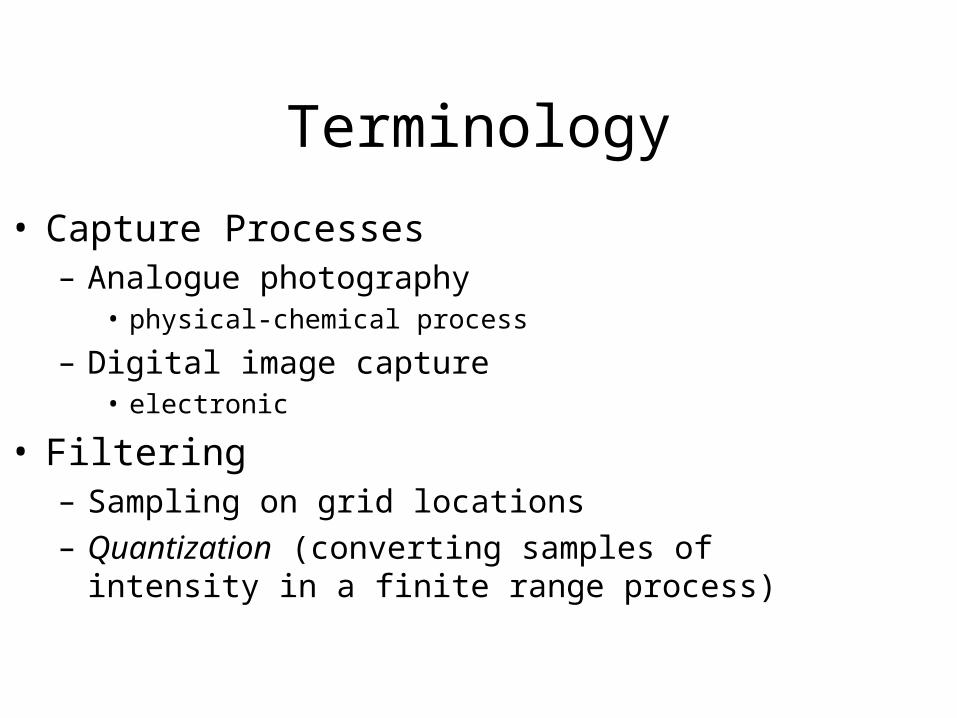
Terminology
• Capture Processes– Analogue photography
• physical-chemical process
– Digital image capture• electronic
• Filtering– Sampling on grid locations– Quantization (converting samples of intensity in a
finite range process)
Pixel Values
• Relation– To artist’s production– To “scene” or thing or phenomenon
depicted

Spatial and Tonal Resolution of an Image
Pixels as Signifiers
• About relationships, context
• Prominent pixels -- create tensions between process and objects of depiction
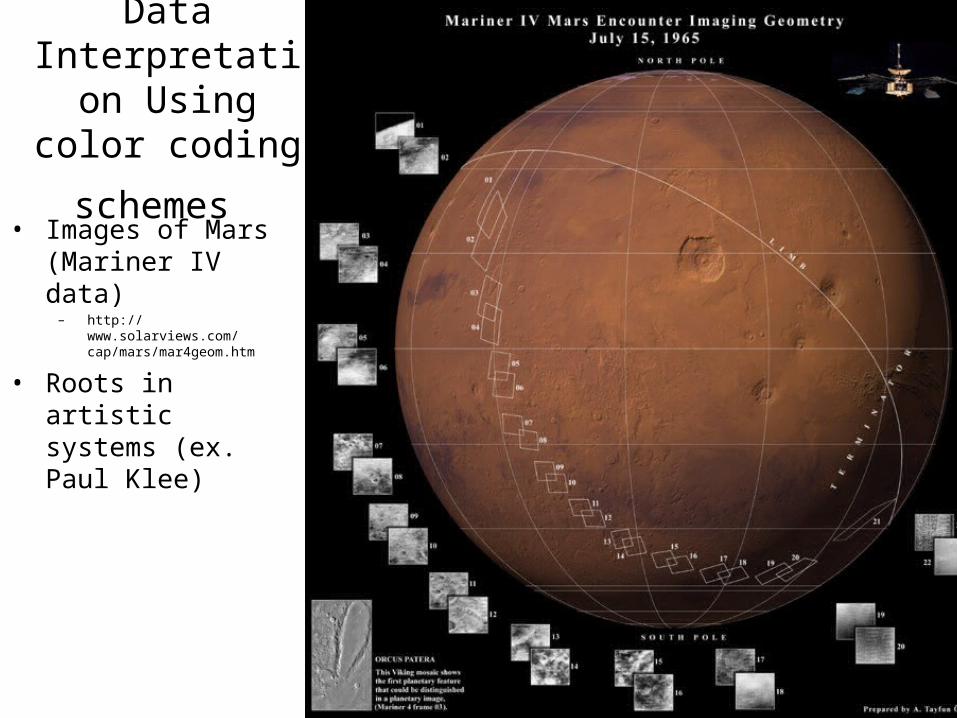
Data Interpretation Using color
coding schemes • Images of Mars
(Mariner IV data)– http://www.solarviews.com/
cap/mars/mar4geom.htm
• Roots in artistic systems (ex. Paul Klee)

Paul Klee-New Harmony
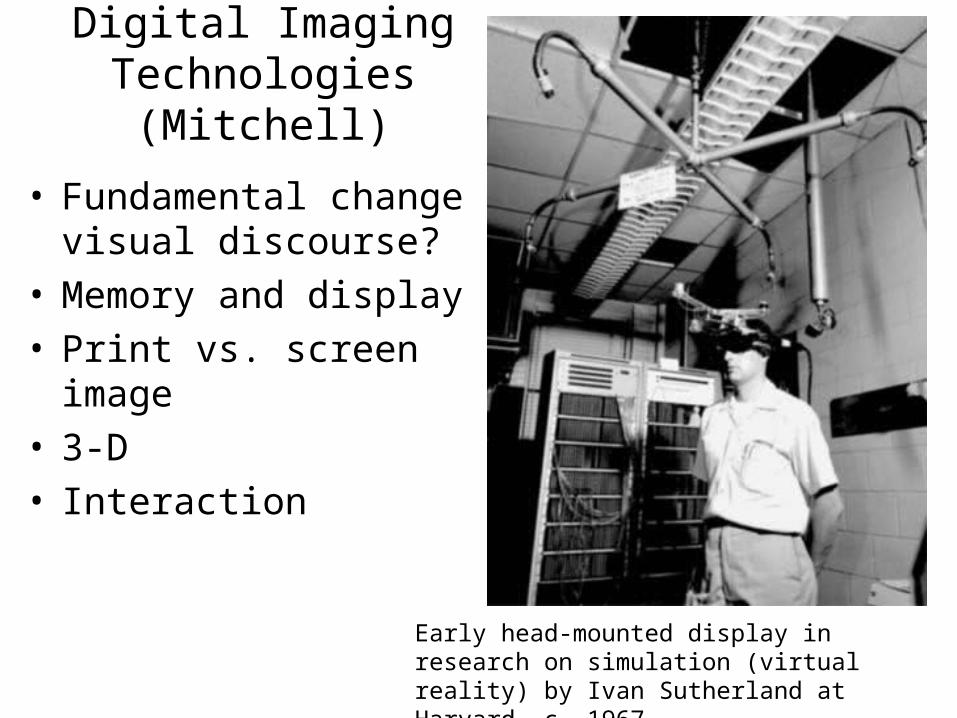
Digital Imaging Technologies
(Mitchell)
• Fundamental change in visual discourse?
• Memory and display• Print vs. screen image• 3-D• Interaction
Early head-mounted display in research on simulation (virtual reality) by Ivan Sutherland at Harvard, c. 1967

Virtual Worlds?? Actively inhabit and interact with images in ways not possible before
•Photograph by Robbie Cooper (New York Times 2007)

Other Directions--visualization of mouvement (scientific research)
• Link to Pixar mathematical research on simulations of movement for Ratatouille

David Hockney on uses of technology by
“Old Masters”• Camera Lucida (an optical aid)

Artist Using Camera Lucida

Hockney with Camera
Lucida

Giotto

Masolino-- Healing of the Lame Man and Raising of Tabitha

Hockney’s Collage of the History of the Use of Optical Aids by Artists

Galison on Scientific Image-making & controversies
• Competing systems for gathering information and analyzing it
• Tensions between visual images and other ways of knowing
• Example from Marontate’s Digital Dialogues Team (R. Karsten’s oceonographic research)

The Motion of the Ocean:Imaging Ocean Currents and
Environmental Changes Richard Karsten
Digital Dialogues:connecting in art and science
18 September 2003

Images of the ocean …
The beach.
Waves
Tides

Oceanography … heading out to sea
Atlantis, 1931-1964WHOI
WHOI Cruises

Cruise Results (from Pedlosky 1987)
(Fuglister 1963)

The wind driven ocean currents
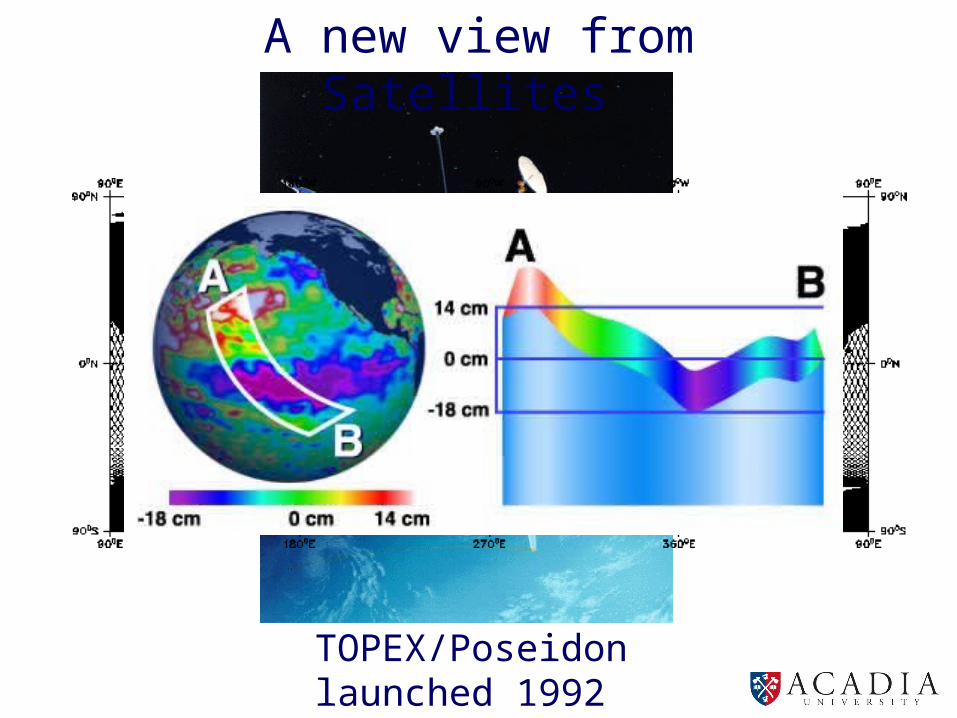
A new view from Satellites
TOPEX/Poseidonlaunched 1992

The wind driven ocean currents from altimetry

The turbulent ocean
•the ocean is full of eddies
•satellites allow us to see and quantify the effect of these eddies
Australia
CCAR Real-Time Altimeter Data Research Group
L H

Getting a 3D Image

Argo data

The Southern Ocean is warming
Gille, Science 2001
Difference between recent ALACE Float data temperatures measured from 700–1100 m and historical mean temperatures.
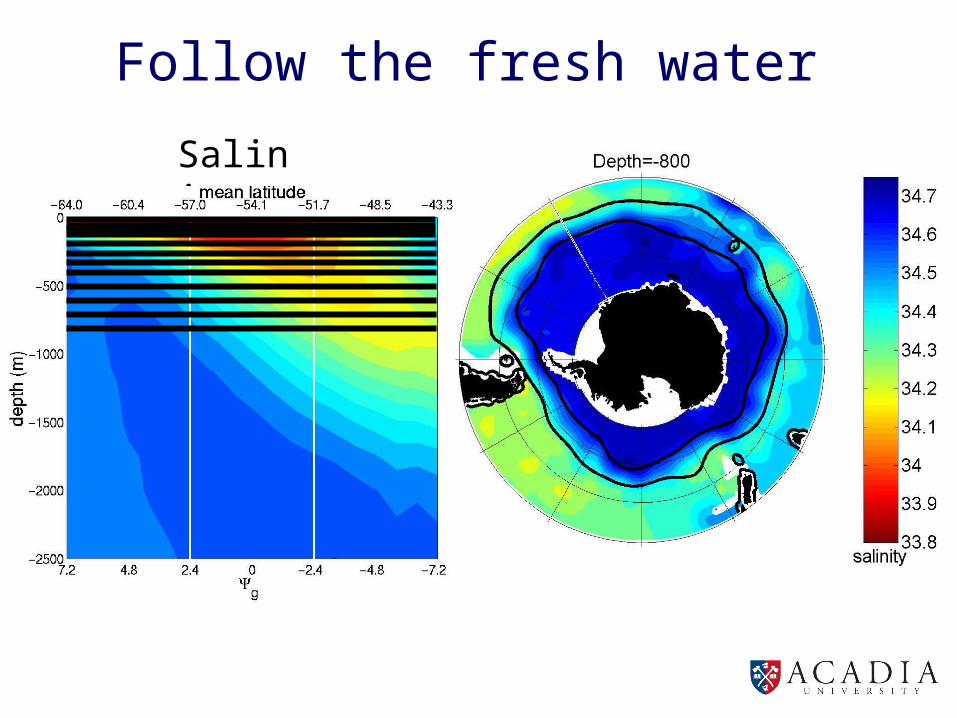
Follow the fresh water
Salinity

Photograph taken from space shuttle showing the Indian Ocean.
Ocean images

Enhanced sea colour images showing the coast
of B.C.
Provided by the SeaWiFS Project, NASA/Goddard Space
Flight Center and ORBIMAGE.
Ocean images
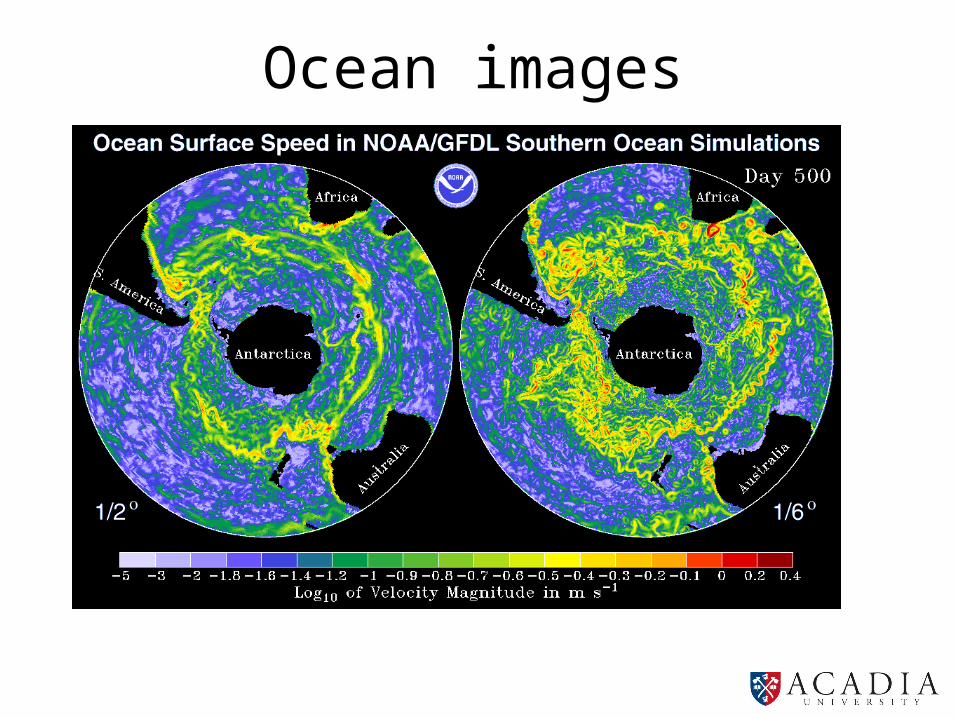
Ocean images

Colouring science?•data showing something?•use colours to represent complex data•scale chosen to emphasize result•further emphasize by comparison

The thermohaline circulation I
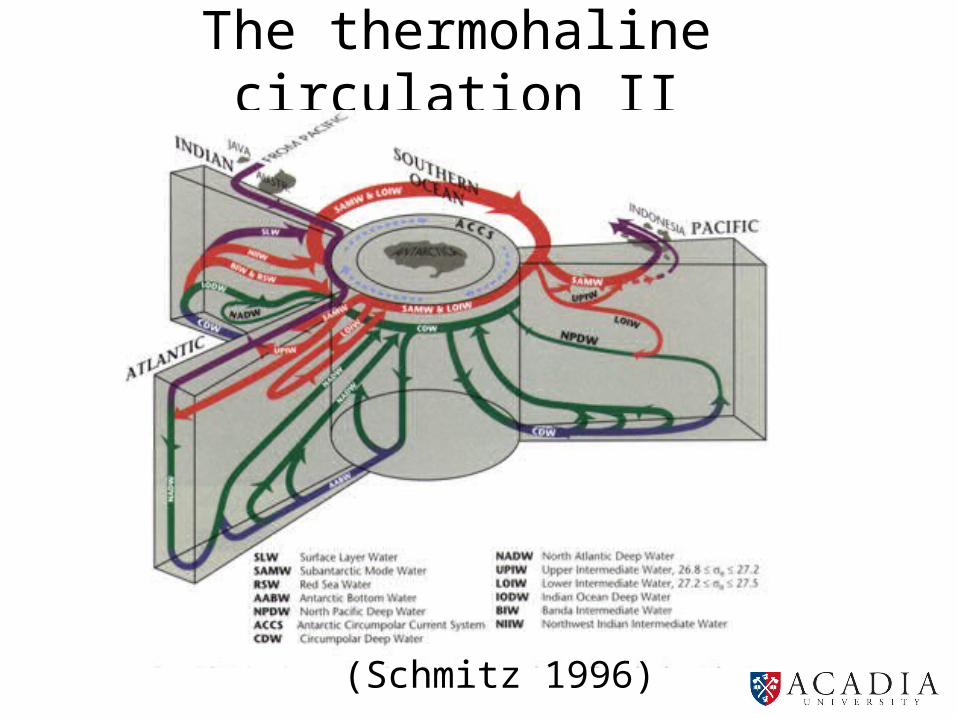
The thermohaline circulation II
(Schmitz 1996)


Catastrophic climate change(www.whoi.edu/institutes/occi/currenttopics/climatechange_wef.html)
R.B. Alley, from The Two-Mile Time Machine, 2000
Conclusions
•oceanography has become a science of data and thus images
•digital images are changing how oceanography is done
•images can enhance or obscure good science