Embed Size (px)
Citation preview
Fabrication of Nano-Structured
Palladium Membranes
By Yue Hua (Hope) Tan
A thesis submitted to the Faculty of Graduate Studies and Research in partial fulfillment of the requirements for the degree of Master of
Engineering
Department of Mining and Materials Engineering McGill University, Montreal, Quebec, Canada
January, 2009
© By Yue Hua (Hope) Tan, 2009
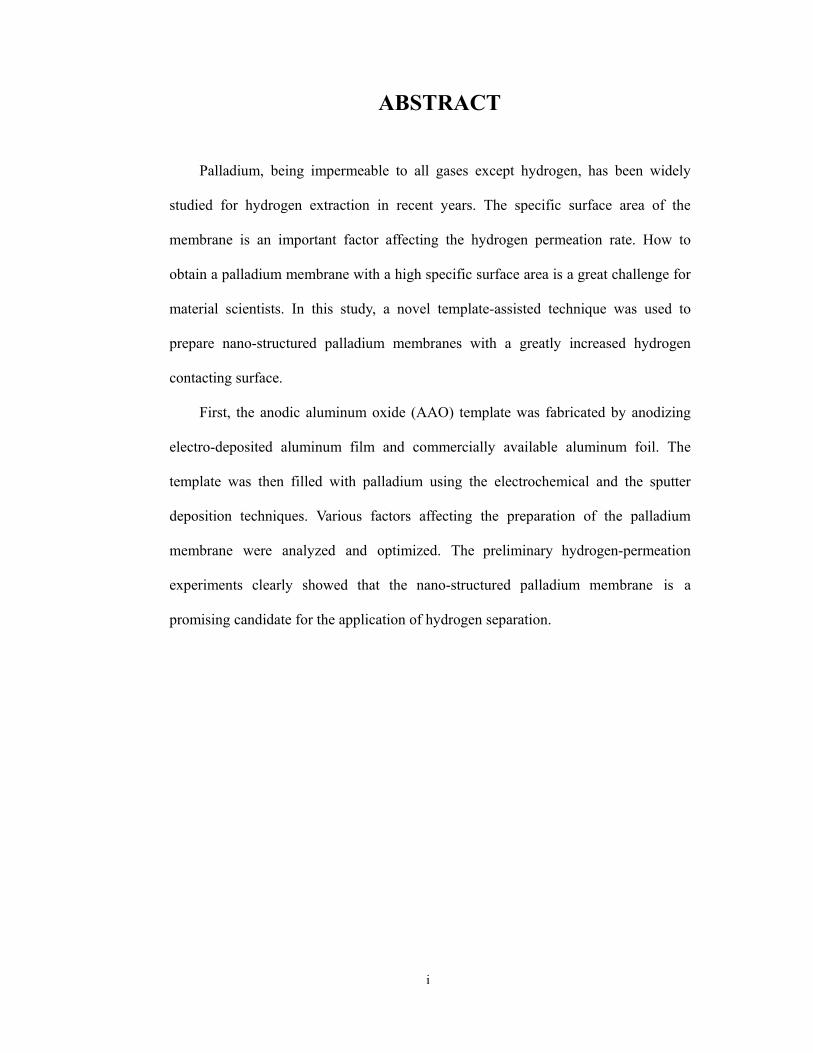
ABSTRACT
Palladium, being impermeable to all gases except hydrogen, has been widely
studied for hydrogen extraction in recent years. The specific surface area of the
membrane is an important factor affecting the hydrogen permeation rate. How to
obtain a palladium membrane with a high specific surface area is a great challenge for
material scientists. In this study, a novel template-assisted technique was used to
prepare nano-structured palladium membranes with a greatly increased hydrogen
contacting surface.
First, the anodic aluminum oxide (AAO) template was fabricated by anodizing
electro-deposited aluminum film and commercially available aluminum foil. The
template was then filled with palladium using the electrochemical and the sputter
deposition techniques. Various factors affecting the preparation of the palladium
membrane were analyzed and optimized. The preliminary hydrogen-permeation
experiments clearly showed that the nano-structured palladium membrane is a
promising candidate for the application of hydrogen separation.
i
ii
RÉSUMÉ
Le palladium, étant imperméable à tous les gaz à l’exception de l'hydrogène, a
été largement étudié pour l'extraction d'hydrogène dans les dernières années. La
surface spécifique de la membrane est un facteur important qui affecte le taux de
perméabilité d'hydrogène. Un grand défi pour la communauté scientifique est
d’obtenir une membrane en palladium avec une surface spécifique élevée. Dans cette
étude, une nouvelle technique utilisant une matrice ordonnée a été employée pour
préparer des membranes de palladium nano-structurées avec une surface de contact
avec l’hydrogène considérablement accrue.
Tout d’abord, l'oxyde d'aluminium anodique (OAA) a été fabriqué en anodisant
une couche d’aluminium électro-déposée et un papier d'aluminium commercial. Puis, la
matrice d'OAA a été remplie de palladium utilisant la technique électrochimique et la
technique par pulvérisation. De divers facteurs affectant la préparation de la membrane
de palladium ont été analysés et optimisés. Les expériences préliminaires de la
perméabilité d’hydrogène ont clairement prouvé que de telles membranes de palladium
sont un candidat prometteur pour l'application de la séparation d'hydrogène.
iii
ACKNOWLEDGEMENT
First I would like to offer my heartfelt thanks to my supervisor, Professor Jerzy A.
Szpunar, who has provided me with guidance, inspiration, scholarly support and
constant encouragement throughout my Master’s studies. His keen aptitude for
research and his scientific approach to problems have played a pivotal role in my
learning and in the completion of this work.
I would also like to express my appreciation to Dr. Shanqiang Wu of the H2 TEC
Company for assisting me in the completion of the hydrogen permeation tests; and to
Mr. Slavek Poplaski for his assistance with the XRD and texture measurements and
the other experiments.
Thank you to all the members of the texture lab, including research fellow Dr.
Marwan Azzi, Dr. Zhongliang Shi, Dr. Wen Qin, Dr. Hualong Li, Mr. Arafin
Muhammad, Mr. Minhui Huang, and Miss Emilie Hsu. I have enjoyed sharing the
cheerful atmosphere of Professor Szpunar’s group.
Finally, I wish to express my gratitude to my family and especially my son
Yingpeng Cheng for his continuous support and help during my studies at McGill.
iv
TABLE OF CONTENTS
ABSTRACT ............................................................................................................. i
RÉSUMÉ ............................................................................................................ ii
ACKNOWLEDGEMENT ............................................................................................ iii
TABLE OF CONTENTS .............................................................................................. iv
LIST OF FIGURES ..................................................................................................... vii
LIST OF TABLES ........................................................................................................ xi
CHAPTER 1 Introduction .............................................................................................. 1
CHAPTER 2 Literature Review .................................................................................... 3
2.1 Introduction ....................................................................................................... 3
2.2 Palladium membranes for hydrogen permeation .............................................. 4
2.2.1 Mechanism for hydrogen permeation (Sievert’s Law) ........................... 4
2.2.2 Gas permeation in porous medium ......................................................... 6
2.2.3 Selectivity and stability ........................................................................... 7
2.2.4 Resistance models for composite type palladium membranes................ 8
2.2.5 Different type composite palladium membranes .................................. 10
2.3 Electro-deposition of aluminum in non-aqueous solution .............................. 13
2.3.1 Tetrahydrofuran (THF) solution for electroplating aluminum .............. 14
2.3.2 Reaction of the solvent and the solutes in THF .................................... 14
2.3.3 Species of aluminum complex ions in THF solution ............................ 15
2.3.4 Effect of water in the solution ............................................................... 15
2.3.5 Fundamental of electro-deposited aluminum in THF solution ............. 16
2.4 Formation of anodic aluminum oxide (AAO) template .................................. 19
2.4.1 Electrochemical reaction in AAO ......................................................... 19
v
2.4.2 Pore structure in anodic aluminum oxide membranes .......................... 20
2.4.3 Mechanism of self-ordered pore formation .......................................... 20
CHAPTER 3 Fabrication of Al films by electroplating ............................................... 23
3.1 Experimental procedure .................................................................................. 23
3.1.1 Solution preparation .............................................................................. 24
3.1.2 Electro-deposition of aluminum films .................................................. 25
3.1.3 Characterization method of as-deposited aluminum films ................... 25
3.2 Optimization of the fabrication process in electroplating aluminum films .... 26
3.2.1 Factors affecting covering power .......................................................... 26
3.2.2 Factors affecting microstructure of as-deposited aluminum films ........ 33
3.3.3 Crystalline structure of as-deposited films............................................ 39
3.3.4 Texture of as-deposited films ................................................................ 41
3.3 Summary ......................................................................................................... 42
CHAPTER 4 Fabrication of AAO template ................................................................. 44
4.1 Experimental procedure .................................................................................. 44
4.1.1 AAO template fabricated on aluminum foils ........................................ 45
4.1.2 AAO template fabricated on as-deposited aluminum films .................. 46
4.1.3 AAO template fabricated by anodizing electro-polished aluminum ..... 47
4.2 Results and discussion .................................................................................... 48
4.2.1 Factors affecting on the formation of AAO template ........................... 48
4.2.2 Removal of barrier layer on the bottom of the as-prepared AAO
template ........................................................................................ 50
4. 2.3 Electrochemical behavior in anodization of as-deposited aluminum
films ............................................................................................. 51
4. 2.4 Morphology of anodized as-deposited aluminum films ...................... 55
vi
4.2.5 AAO templates obtained using optimum anodization conditions ......... 60
4.3 Summary ......................................................................................................... 62
CHAPTER 5 Nano-structured Palladium Membranes ................................................ 63
5.1 Experimental procedure .................................................................................. 63
5.1.1 Preparation of palladium membranes using electro-deposition ............ 63
5.1.2 Preparation of nano-structured palladium membranes using sputtering
...................................................................................................... 64
5.1.3 Hydrogen permeation test on sputtered palladium membranes ............ 64
5.2 Results and discussion .................................................................................... 67
5.2.1 Formation of nano-structured palladium membrane by
electro-deposition ......................................................................... 67
5.2.2 Possible prospect and currently existing problems ............................... 70
5.2.3 Formation of nano-structured palladium membrane by sputtering ....... 71
5.2. 4 Hydrogen permeation test of as-prepared palladium membranes ........ 73
5.3 Summary ......................................................................................................... 76
CHAPTER 6 Conclusions ............................................................................................ 78
References .......................................................................................................... 80
vii
LIST OF FIGURES
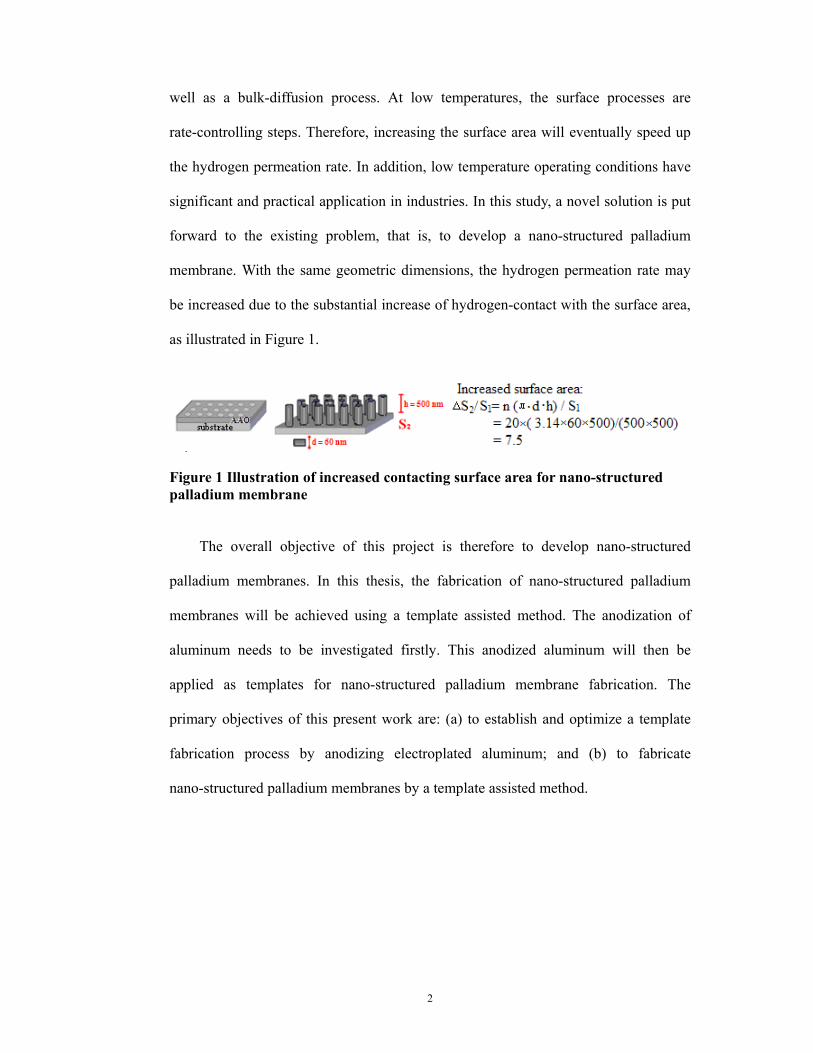
Figure 1 Illustration of increased contacting surface area for nano-structured
palladium membrane……………………………………………………… 2
Figure 2 Mechanism of hydrogen permeation across palladium membrane [5]…… 5
Figure 3 Schematic drawings depicting Poisseuille and Knudsen flow [6]………… 6
Figure 4 Schematic diagram of gas permeation via composite Pd membrane……… 8
Figure 5 Schematic diagram of gas permeation through composite Pd membrane
with pinholes and modified/diffusion resistance block…………………… 9
Figure 6 Hydrogen fluxes of palladium membranes as a function of temperature… 13
Figure 7 Structures of aluminate species possibly present in the hydride bath [23]…15
Figure 8 Schematic diagram of porous oxide film structure [7]……………………20
Figure 9 Schematic diagram of self-organized formation of pore structure…………22
Figure 10 SEM images of as-deposited Al obtained in solution AlCl3 = 0.60 mol/l (at
constant LiAlH4 = 0.30 mol/l) ……………………………………………28
Figure 11 SEM images of as-deposited Al obtained in solution AlCl3 = 0.94 mol/l (at
constant LiAlH4 = 0.30 mol/l) ……………………………………………28
Figure 12 SEM images of as-deposited Al obtained in solution AlCl3 = 1.18 mol/l (at
constant LiAlH4 = 0.30 mol/l) ……………………………………………29
Figure 13 SEM images of as-deposited Al obtained in solution LiAlH4 = 0.29 mol/l (at
constant AlCl3 = 0.58 mol/l) …………………………………………… 30
Figure 14 SEM images of as-deposited Al obtained in solution LiAlH4 = 0.19 mol/l (at
constant AlCl3 = 0.58 mol/l)………………………………………………30
viii
Figure 15 SEM images of as-deposited Al obtained in solution LiAlH4 = 0.15 mol/l (at
constant AlCl3 = 0.58 mol/l)………………………………………………31
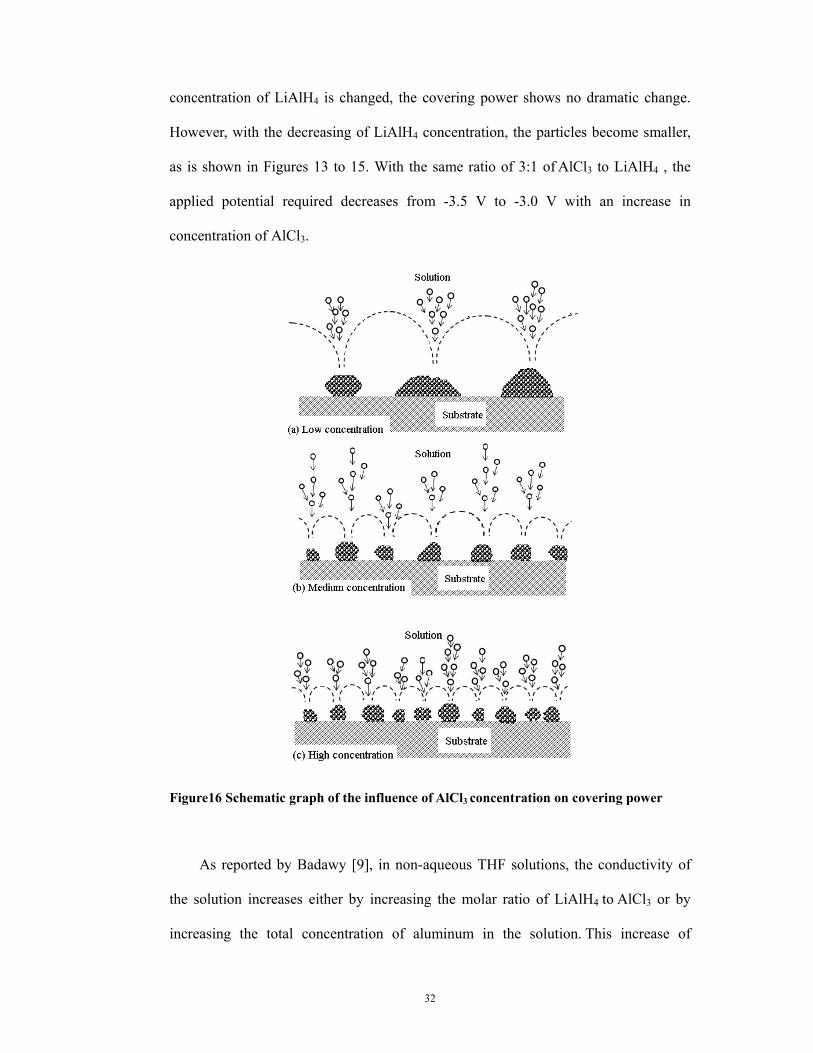
Figure 16 Schematic graph of the influence of AlCl3 concentration on covering power
……………………………………………………………………………32
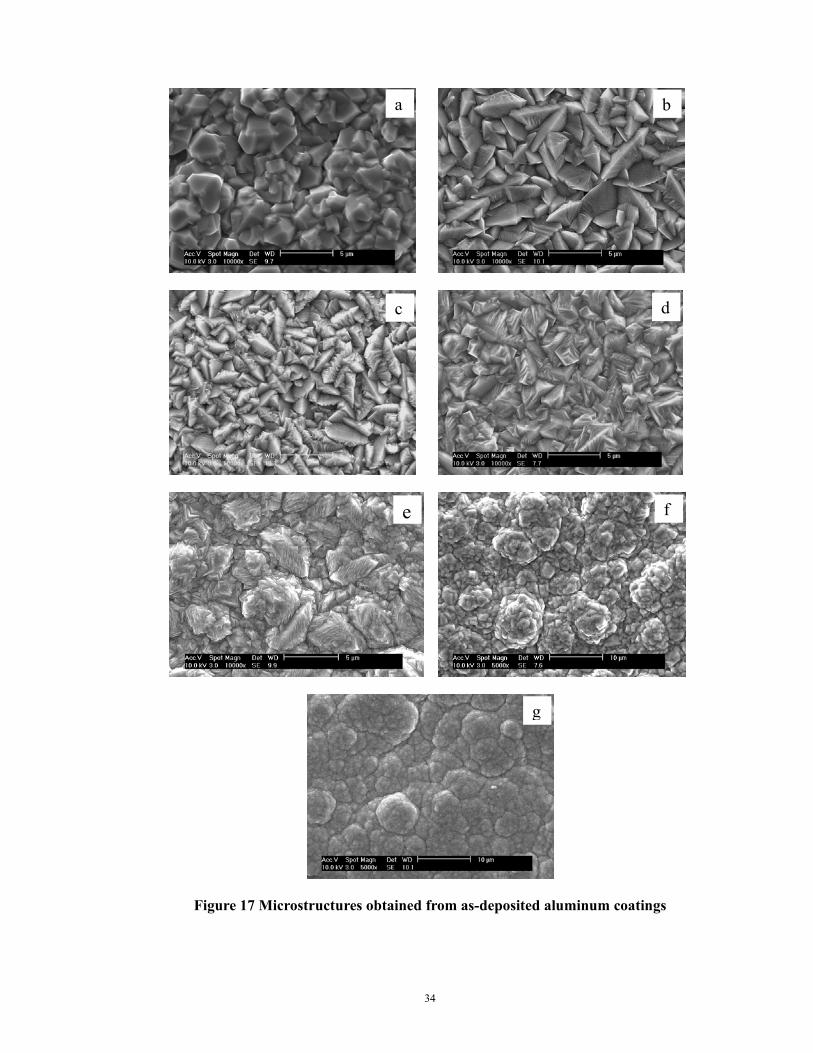
Figure 17 Microstructures obtained from as-deposited aluminum coatings ……… 34
Figure18 Schematic illustration of the mechanism of formation of different
microstructures …………………………………………………………37
Figure 19 Coating thickness vs. potential obtained with AlCl3:LiAlH4 = 4:1 ………37
Figure 20 Coating thickness vs. potential obtained with AlCl3:LiAlH4 = 3:1………38
Figure 21 XRD pattern obtained on as-deposited Al coating from normal scan (AlCl3:
LiAlH4 = 3:1 in Al total concentration 1.24 mol/l) …………………… 40
Figure 22 XRD pattern obtained on as-deposited Al coating obtained from grazing
angle at 1.5° (AlCl3:LiAlH4 = 3:1 in Al total concentration 1.24 mol/l)…40
Figure 23 XRD patterns of aluminum coating obtained in solution AlCl3:LiAlH4 = 4:1
in total Al concentration 1.48 mol/l under normal and grazing angle
mode ……………………………………………………………………41
Figure 24 Pole figures (111), (200), (220) of as-deposited aluminum coating with
AlCl3:LiAlH4 = 3:1in total Al concentration of 1.24 mol/l ………………41
Figure 25 Pole figures (111), (200), (220) of as-deposited aluminum coating with
AlCl3:LiAlH4 = 4:1 in total Al concentration of 1.48 mol/l ……………42
Figure 26 Schematic illustration of anodizing device ………………………………46
Figure 27 Relationship between anodizing time and thickness of AAO template …48
Figure 28 Relationship between anodizing rate and concentration and applied voltage
……………………………………………………………………………49
ix
Figure 29 SEM image of AAO in 0.6 M oxalic acid solution ………………………49
Figure 30 Pore bottom opening in a 5 wt. % H3PO4 solution ………………………50
Figure 31 XRD pattern of AAO template …………………………………………50
Figure 32 Current density vs. time during anodization of as-deposited 9 μm aluminum
……………………………………………………………………………51
Figure 33 SEM image of template fabrication with “burning” ……………………54
Figure 34 Current density vs. time during anodization of as-deposited 6 μm aluminum
………………………………………………………………………………54
Figure 35 Current density vs. time during anodizion of as-deposited 15 μm aluminum
………………………………………………………………………………55
Figure 36 Schematic illustration of two-step anodization pre-pattern process……56
Figure 37 SEM image of anodizing as-deposited aluminum at 10 V………………57
Figure 38 Template obtained after pore widening in 5 wt% H3PO4 ………………57
Figure 39 SEM images of anodizing as-deposited aluminum at 30 V ……………58
Figure 40 SEM image of anodizing as-deposited aluminum at 40 V………………59
Figure 41 SEM image of the cross section of as-deposited aluminum sample……60
Figure 42 Schematic illustration of obtaining ordered pore in anodization process
…………………………………………………………………………60
Figure 43 SEM images of template obtained by anodizing electro-polished aluminum
……………………………………………………………………………61
Figure 44 SEM cross section image of anodized electro-polished as-deposited Al
……………………………………………………………………………61
Figure 45 Template from as-deposited aluminum after pore widening …………… 62
x
Figure 46 Schematic diagram of experimental setup for hydrogen permeation test
…………………………………………………………………………… 65
Figure 47 Schematic illustrations of hydrogen permeation cell and inside sealing…65
Figure 48 Schematic sketch of palladium membrane sealing in hydrogen permeation
…………………………………………………………………………66
Figure 49 Schematic illustration of self-sealing palladium membrane fabrication…67
Figure 50 Schematic graph of fabrication process of electro-deposited Pd membrane
……………………………………………………………………………68 Figure 51 SEM images of removed nano-structured Pd membrane embedded in AAO
……………………………………………………………………………69
Figure 52 SEM images of nano-structured palladium membrane bottom view ……69
Figure 53 EDS spectrum and SEM image of freed electro-deposited Pd membrane
……………………………………………………………………………70
Figure 54 SEM images of unevenly electro-deposited palladium membrane ………70
Figure 55 SEM image of cracking in electroplated Pd membrane at high potential…71
Figure 56 SEM image of palladium membrane fabrication with deposition time……72
Figure 57 EDS spectrums of Pd membranes after 40 and 50 minutes sputtering……73
Figure 58 Hydrogen permeation rate vs. temperature performed on sputtered Pd …74
Figure 59 SEM image of sputtered Pd membrane after hydrogen permeation………75
Figure 60 XRD pattern for sputtered palladium sample after hydrogen permeation
……………………………………………………………………………75
xi
LIST OF TABLES
Table 1 Typical anodization conditions for various electrolytes ………………….…22
Table 2 Solution Preparation with constant AlCl3 concentration…………………….25
Table 3 Solution Preparation with constant LiAlH4 concentration ………………… .25
Table 4 Summary of the covering power at different electroplating conditions ……..31
Table 5 Microstructure of as-deposited aluminum films under different concentrations
and different potentials……………………………………………………...35
1
CHAPTER 1 Introduction
Hydrogen is not only an environmentally clean energy resource, but also an
important raw material and product in chemical industries. Environmental concerns
and energy crisis have led to continuously increased global interest in the development
of a hydrogen economy. Hydrogen separation and purification are essential processes
when hydrogen is applied in low temperature fuel cells and chemical plants. As far as
hydrogen separation and purification are concerned, palladium is outstanding due to
its good selectivity, permeability and stability.
Starting in the 1960s, many studies were conducted on self-supported dense
metallic membranes, which had a thickness between 100 and 200 microns. Although
these membranes have a high selectivity, their low hydrogen flux and high material
cost make them impractical in industrial applications.
Since the permeation rate of hydrogen is inversely proportional to membrane
thickness, an effective solution for the improvement of permeation rate is to reduce
membrane thickness. In order to ensure a reasonable permeation flux and lower the
material cost, composite-type palladium membranes have been developed. This kind
of palladium membranes consists of a thin palladium layer with a thickness of 4 to 25
microns deposited on porous supports. The thermal stability and mechanical strength
of a film are directly related to film thickness. A certain membrane thickness is
therefore needed to provide the necessary mechanical strength and thermal stability.
How to increase the hydrogen permeation rate and obtain pinhole-free palladium
membranes are the major concerns of researchers.
The mechanism of hydrogen permeation through palladium membranes shows
that hydrogen permeation consists of surface adsorption and desorption processes as
2
well as a bulk-diffusion process. At low temperatures, the surface processes are
rate-controlling steps. Therefore, increasing the surface area will eventually speed up
the hydrogen permeation rate. In addition, low temperature operating conditions have
significant and practical application in industries. In this study, a novel solution is put
forward to the existing problem, that is, to develop a nano-structured palladium
membrane. With the same geometric dimensions, the hydrogen permeation rate may
be increased due to the substantial increase of hydrogen-contact with the surface area,
as illustrated in Figure 1.
Figure 1 Illustration of increased contacting surface area for nano-structured palladium membrane
The overall objective of this project is therefore to develop nano-structured
palladium membranes. In this thesis, the fabrication of nano-structured palladium
membranes will be achieved using a template assisted method. The anodization of
aluminum needs to be investigated firstly. This anodized aluminum will then be
applied as templates for nano-structured palladium membrane fabrication. The
primary objectives of this present work are: (a) to establish and optimize a template
fabrication process by anodizing electroplated aluminum; and (b) to fabricate
nano-structured palladium membranes by a template assisted method.
3
CHAPTER 2 Literature Review
2.1 Introduction
Increased public awareness of global warming and increasing environmentally
clean energy demands have led to the advancement of new energy sources. Hydrogen,
the lightest chemical element in universe, has the highest energy content per unit
weight of any known elements (143 kJ/g). Unlike petroleum, it can be easily
generated using renewable energy sources (i.e. water, wind and solar energy). It forms
non-polluting, harmless byproduct during usage, and is an environmentally friendly
alternative to conventional fossil fuels. When hydrogen is used in fuel cells, the
efficiency can be up to about 50-60%, which is more than twice that of a thermal cycle.
In addition, hydrogen can be employed as a fuel in internal combustion engines. As a
clean energy source, hydrogen has been of great interest in recent decades and is an
attractive energy source for the future. Over the next several decades, a shift away
from the fossil fuel economy is expected towards a much cleaner hydrogen economy.
However, hydrogen must be extracted and purified before use. Palladium and its
alloys are the most promising candidates for hydrogen separation and purification due
to their good hydrogen permeability and selectivity.
Much research has been done on palladium membranes for hydrogen separation
and purification. The earliest palladium membranes studied for hydrogen separation
and purification was self-supported dense metallic membranes having a thickness of
100 to 200 μm, made by conventional metallurgical processes. As the hydrogen flux is
inversely proportional to the membrane thickness, a thick membrane is a poor
separator. In addition, palladium is too expensive to be used as a bulk material.
Thinner palladium membranes are favored in industrial applications. Therefore, the
4
second category, composite-type palladium membranes, has been developed. These
membranes consist of thin palladium films deposited on porous substrates that can
provide a certain mechanical strength to the membranes. This chapter will mainly
discuss the hydrogen selectivity and diffusion mechanisms in palladium, and at the
same time, give an overview of literature for two types of palladium membranes.
Following this, the theories related to template fabrication process will be presented.
2.2 Palladium membranes for hydrogen permeation
2.2.1 Mechanism for hydrogen permeation (Sievert’s Law)
Hydrogen can permeate through many pure metals, including palladium,
vanadium, tantalum, niobium and titanium. All of these, with the exception of
palladium, are unstable. Poisoning of the membrane surface by oxidation or sulfur
deposition from traces of hydrogen sulfide often take place and make these metals
unsuitable for applications.
When hydrogen gas permeates through a dense palladium membrane, the
solution-diffusion model, as illustrated in Figure 2, can be used to illustrate this
process. The mechanism occurs in 6 steps [5] as follows: First, hydrogen molecules
are captured by the palladium atoms on the surface of palladium membrane. Then, the
captured hydrogen molecules are dissociated and adsorbed on the Pd membrane
surface: thus, atomic hydrogen is formed on the surface. In the third step, atomic
hydrogen is dissolved in the bulk layer of palladium by the pressure gradient, and
diffuses through the bulk palladium films. When hydrogen atoms reach the opposite
surface of palladium membrane, the atomic hydrogen forms molecules and become
desorbed.
5
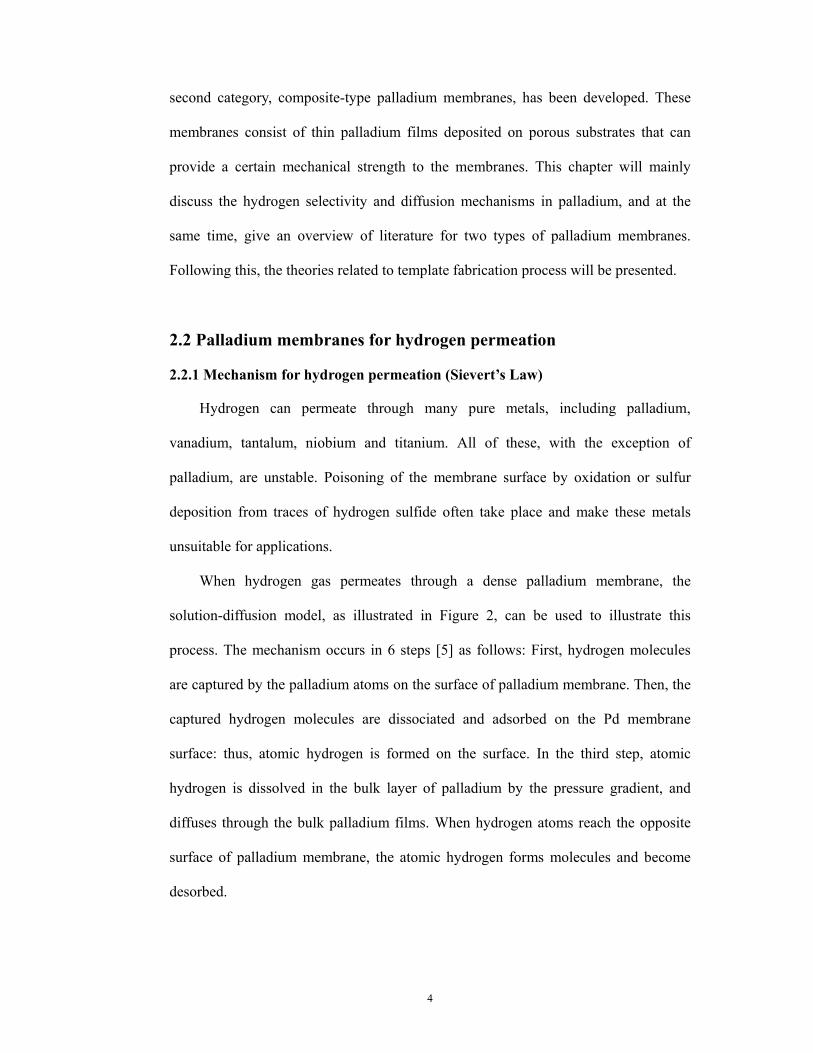
Figure 2 Mechanism of hydrogen permeation across palladium membrane [5]
When hydrogen permeates in a dense palladium membrane, the above
mechanism of hydrogen permeation is generally assumed. It involves both surface
processes (step 1, step 2, step 5, and step 6) and a bulk-diffusion process (step 3, step
4). It was reported by R.W. Baker [8] that at high temperatures ( >300 ˚C), the surface
sorption and dissociation processes are fast; the rate-controlling step is the diffusion of
atomic hydrogen through the palladium metal lattice, which can be expressed as
follows:
(2.1)
where J represents hydrogen permeation flux (mol/m2·s), FPl is a premultiplication
factor, and n is a constant. Q, the permeability of hydrogen through a membrane
(mol/m·s·Pan), which is the product of diffusivity and solubility, while l is the
membrane thickness, and PH2, f and PH2, ,P are the partial pressures of hydrogen on the
feed and permeation sides, respectively. For a bulk-diffusion process, n = 0.5. The
hydrogen flux can be described by Sieverts' Law
(2.2)
where D and S are the hydrogen diffusion coefficient and the hydrogen solubility
6
constant, respectively. While at low temperatures, the surface processes are the
rate-controlling steps, any increase of surface area will speed up the hydrogen
permeation rate.
2.2.2 Gas permeation in porous medium
.
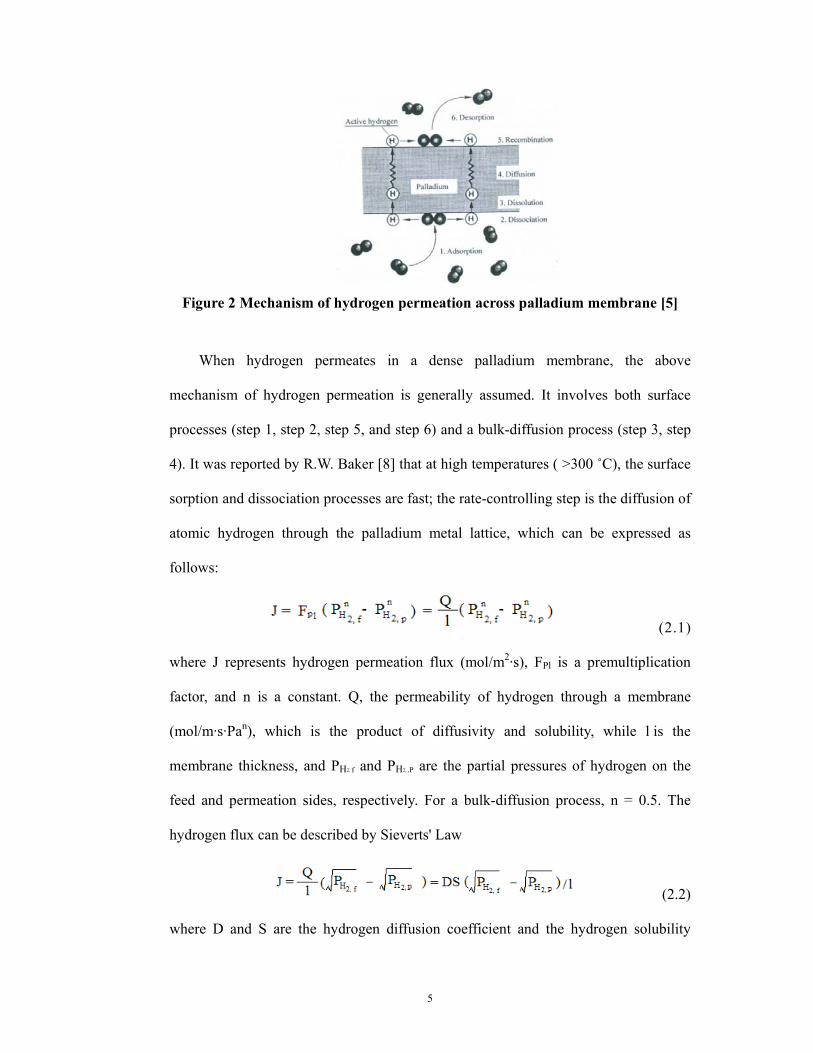
Figure 3 Schematic drawings depicting Poisseuille and Knudsen flow [6]
The gas permeation mechanism in a porous medium can be described by
Poiseuille flow (or viscous flow), or by Knudsen diffusion, as shown in Figure 3. The
relative contribution of Knudsen diffusion to the overall transport rate depends on the
Knudsen number, Kn , which is defined as the ratio of mean free path of the gas
molecules λ [nm] to the pore radius of the medium r [nm] [9], that is,
Kn = λ / r (2.3)
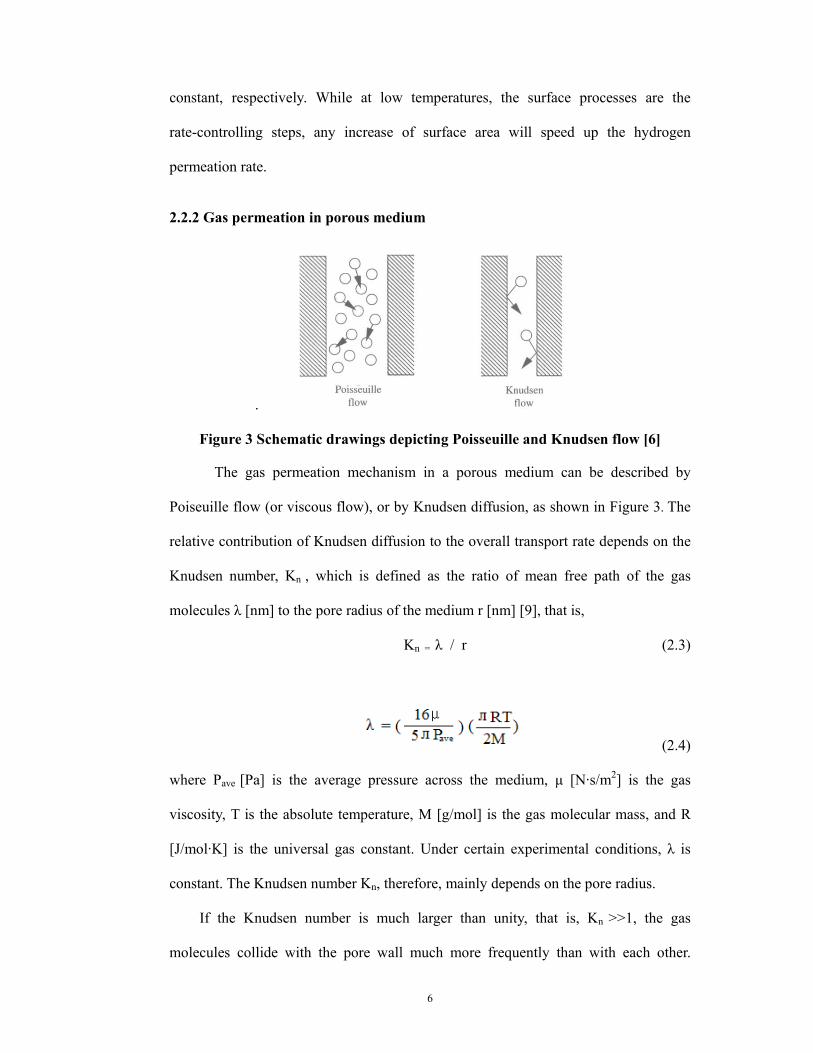
(2.4)
where Pave [Pa] is the average pressure across the medium, μ [N·s/m2] is the gas
viscosity, T is the absolute temperature, M [g/mol] is the gas molecular mass, and R
[J/mol·K] is the universal gas constant. Under certain experimental conditions, λ is
constant. The Knudsen number Kn, therefore, mainly depends on the pore radius.
If the Knudsen number is much larger than unity, that is, Kn >>1, the gas
molecules collide with the pore wall much more frequently than with each other.
7
Under this condition, gas transport mechanism can be described as Knudsen flow, as
illustrated in Figure3. If, on the other hand, the Knudsen number is much smaller than
unity, Poiseuille flow mechanism is dominant. In the range of 0.01< Kn<10, the
transition from Knudsen to Poiseuille flow occurs.
2.2.3 Selectivity and stability
The high stability and high selectivity of the palladium membranes are the two
major attractions of these membranes. Usually, hydrogen permeation through the
dense membranes increases with increasing temperature. However, as the operating
temperature increases, the use of the membranes in industrial applications becomes
increasingly inconvenient. The selectivity coefficient (αij*), or ideal separation factor,
defined as the ratio of permeability of two gases (pure hydrogen and non-permeable
gas Ar, N2, or He, etc) is expressed as follows:
αij* = Fp,i / Fp,j (2.5)
Theoretically, composite membranes should have an infinite selectivity, given
that these membranes are only permeable to hydrogen. However, the presence of
cracks and pinholes can permeate unwanted species, lowering the purity of hydrogen,
and thus decreasing the selectivity.
Cracking of membrane layers can be results of the formation of pinholes and
might be related to specific operation conditions, or interactions between the support
and palladium layer, or phase transformation process. Low temperature of operation
will definitely reduce the interaction between the support and membrane, and make
the palladium membrane more stable.
8
2.2.4 Resistance models for composite type palladium membranes
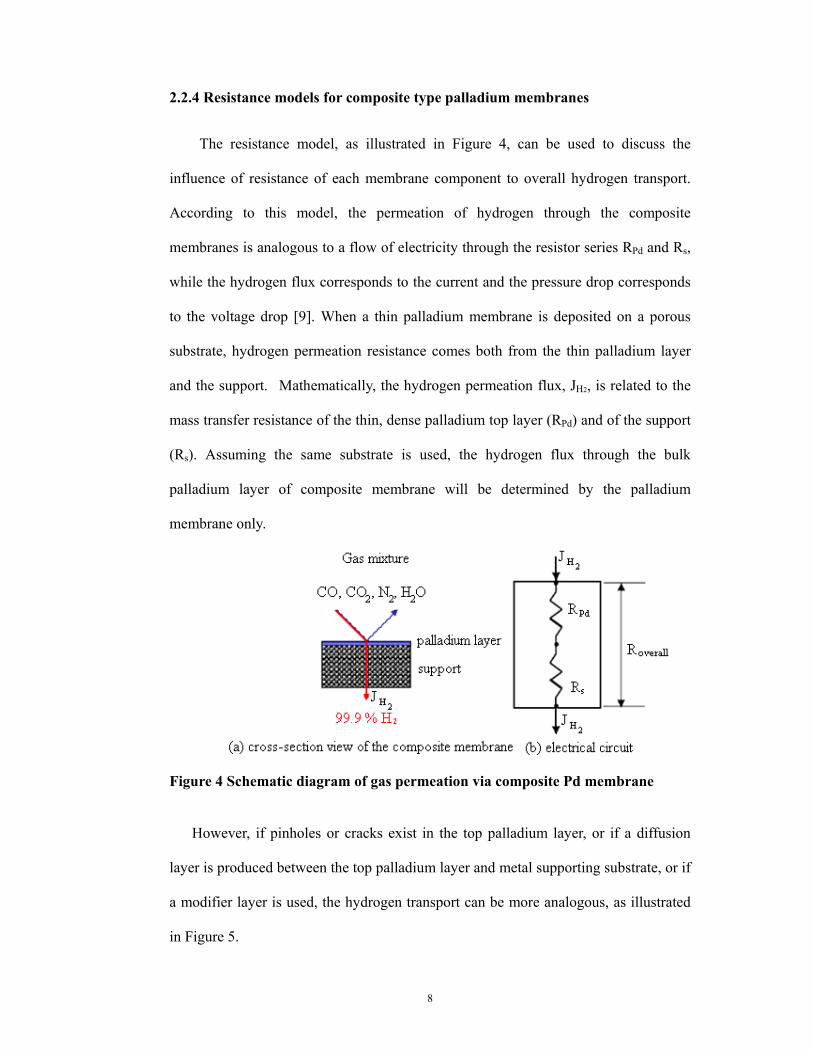
The resistance model, as illustrated in Figure 4, can be used to discuss the
influence of resistance of each membrane component to overall hydrogen transport.
According to this model, the permeation of hydrogen through the composite
membranes is analogous to a flow of electricity through the resistor series RPd and Rs,
while the hydrogen flux corresponds to the current and the pressure drop corresponds
to the voltage drop [9]. When a thin palladium membrane is deposited on a porous
substrate, hydrogen permeation resistance comes both from the thin palladium layer
and the support. Mathematically, the hydrogen permeation flux, JH2, is related to the
mass transfer resistance of the thin, dense palladium top layer (RPd) and of the support
(Rs). Assuming the same substrate is used, the hydrogen flux through the bulk
palladium layer of composite membrane will be determined by the palladium
membrane only.
Figure 4 Schematic diagram of gas permeation via composite Pd membrane
However, if pinholes or cracks exist in the top palladium layer, or if a diffusion
layer is produced between the top palladium layer and metal supporting substrate, or if
a modifier layer is used, the hydrogen transport can be more analogous, as illustrated
in Figure 5.
9
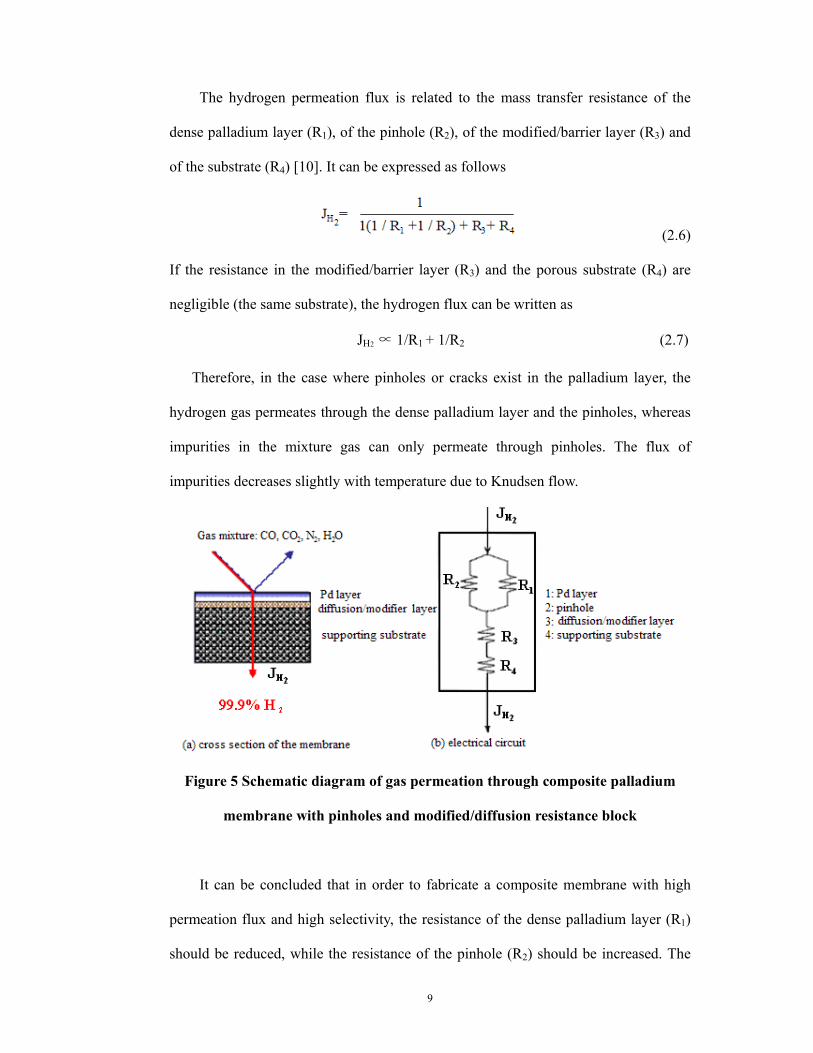
The hydrogen permeation flux is related to the mass transfer resistance of the
dense palladium layer (R1), of the pinhole (R2), of the modified/barrier layer (R3) and
of the substrate (R4) [10]. It can be expressed as follows
(2.6)
If the resistance in the modified/barrier layer (R3) and the porous substrate (R4) are
negligible (the same substrate), the hydrogen flux can be written as
JH2 ∝ 1/R1 + 1/R2 (2.7)
Therefore, in the case where pinholes or cracks exist in the palladium layer, the
hydrogen gas permeates through the dense palladium layer and the pinholes, whereas
impurities in the mixture gas can only permeate through pinholes. The flux of
impurities decreases slightly with temperature due to Knudsen flow.
Figure 5 Schematic diagram of gas permeation through composite palladium
membrane with pinholes and modified/diffusion resistance block
It can be concluded that in order to fabricate a composite membrane with high
permeation flux and high selectivity, the resistance of the dense palladium layer (R1)
should be reduced, while the resistance of the pinhole (R2) should be increased. The
10
resistance of the dense palladium layer (R1) is determined by the film thickness
(where the diffusion process is rate-determining) and surface area (the surface
processes are rate-determining). The resistance of pinholes (R2) can be increased by
reducing the number of pinholes, as well as the pinhole size. A thinner and
pinhole-free palladium membrane is therefore important for practical applications.
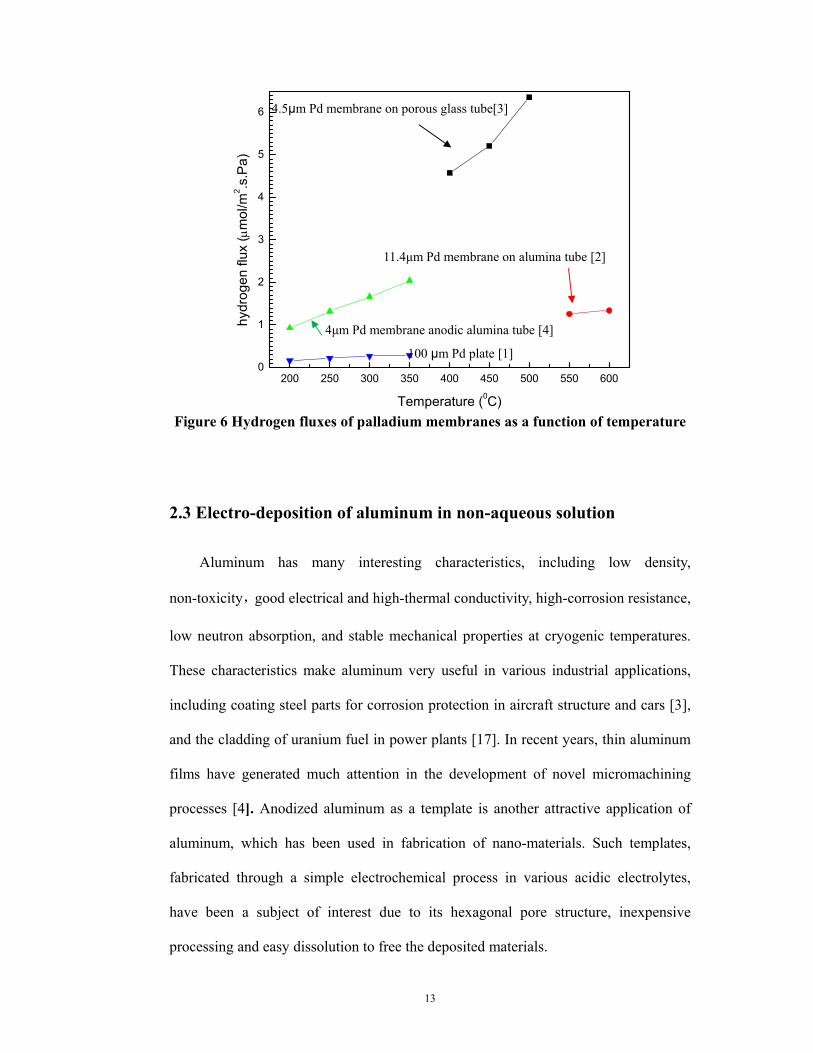
2.2.5 Different type composite palladium membranes
Palladium-based membranes can be classified into two types, self-supported
dense metallic membranes and composite type membranes. Itoh and Xu [1] have
studied the hydrogen flux in 100 μm Pd plate at a temperature range from 200˚C to
350˚C, the results are presented in Figure 6. This membrane had an infinite selectivity;
however, its hydrogen permeation rate was very low. Generally, massive palladium
sheets or plates are not suitable for hydrogen separation due to low hydrogen
permeation flux and high costs.
In order to reduce the material cost and gain a higher hydrogen permeation rate,
composite palladium membranes have been developed. This kind of palladium
membranes consists of a thin selective layer deposited on porous supports. Composite
palladium membranes combine high permeation flux, provided by a thin selective top
layer, and a reasonable mechanical stability, which results from the underlying porous
structure. There is large literature dealing with this kind of membranes. In 1988
Uemiya [11] and his co-workers used electroless plating to deposit palladium
membranes ranging from 13 to 20 μm on the outside of a porous glass tube with 0.3
μm pore size. There was an infinite hydrogen selectivity, which meant a pinhole free
palladium membrane was obtained. In 1990, they [12] reported a composite
palladium-ceramic membrane with an 8.6 μm layer of palladium on the outside
11
surface of a porous alumina cylinder. The hydrogen selectivity for this membrane was
not reported. In 1991, Uemiya and his coworkers [4] reported a 4.5 μm thickness
palladium membrane deposited on porous glass tube with 0.3 μm pore size by
electroless plating. In 2000 Itoh and his coworkers [13] reported a composite
palladium membrane (electroplating 4 μm palladium on porous ceramics), with a
hydrogen permeation rate almost six times higher than for the 100 μm Pd plate. The
selectivity of this membrane was estimated to be higher than 10,000, which meant
pinholes or cracks had existed in the palladium membrane.
Studies were also conducted with the aim of modifying the pore size in the
substrates for composite palladium membranes. Collins and Way [2] deposited a 11.4
μm palladium film on a macro-porous ceramic tube support with an inner surface
covered by thin multiple layers with 0.1 to 0.2 μm micro-porous membrane to modify
the pore size by electroless plating. The selectivity of H2/N2 at 550˚C was 650.
An important problem in ceramic or glass composite membranes is the structural
instability resulting from the mismatch of thermal expansion coefficient between the
palladium film and the nonmetallic substrate. Therefore, small differences in
expansion coefficients are beneficial for membranes. This problem was addressed by
Rakesh Govind and Devendra Atnoor [14] in 1991. They developed a composite
palladium membrane consisting of about 5 μm palladium on porous silver disks
because both metals have similar thermal expansion coefficients. Considering the cost
of silver, stainless steel composite Pd-based membranes seem to be more promising
for the manufacture of technical membranes due to similar thermal expansion
coefficients. In addition, such membranes are easy to process and have high thermal
stability, mechanical strength, corrosion resistance and low cost.
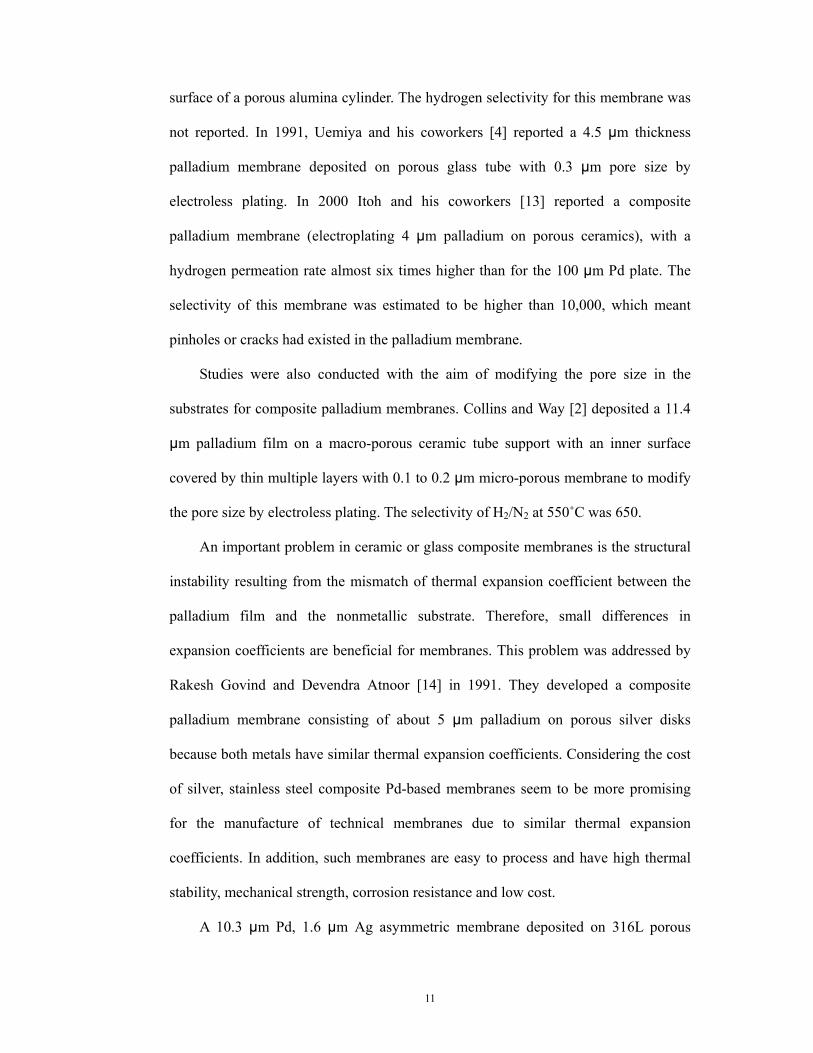
A 10.3 μm Pd, 1.6 μm Ag asymmetric membrane deposited on 316L porous
12
stainless steel with a pore size of 0.5 μm prepared by successively palladium and
silver plating in an electroless hydrazine bath was reported by J. Shu and co-authors
[15] in 1995. However, an atomic inter-diffusion layer between the thin palladium
layer and the stainless steel components took place during high temperature
processing. To inhibit the interface reactions between the neighboring layers, an
ultrathin 0.1 μm titanium nitride intermediate barrier layer between the Pd-Ag alloy
membranes and the porous stainless steel was introduced.
As commercially available sintered porous stainless steel substrates in forms of
either sheets or tubes have too large pores, a relatively thick palladium membrane had
to be deposited to obtain an impervious composite membrane. One of the solutions
was surface modification. A shot peening surface treatment was practiced on a 0.5
μm-size piece of 316 L stainless steel by Jemaa and his co-authors [16]. As a result,
modified porous stainless steel substrates with reduced surface pore sizes were
obtained. For a 6 μm palladium film thickness, there was no argon permeation through
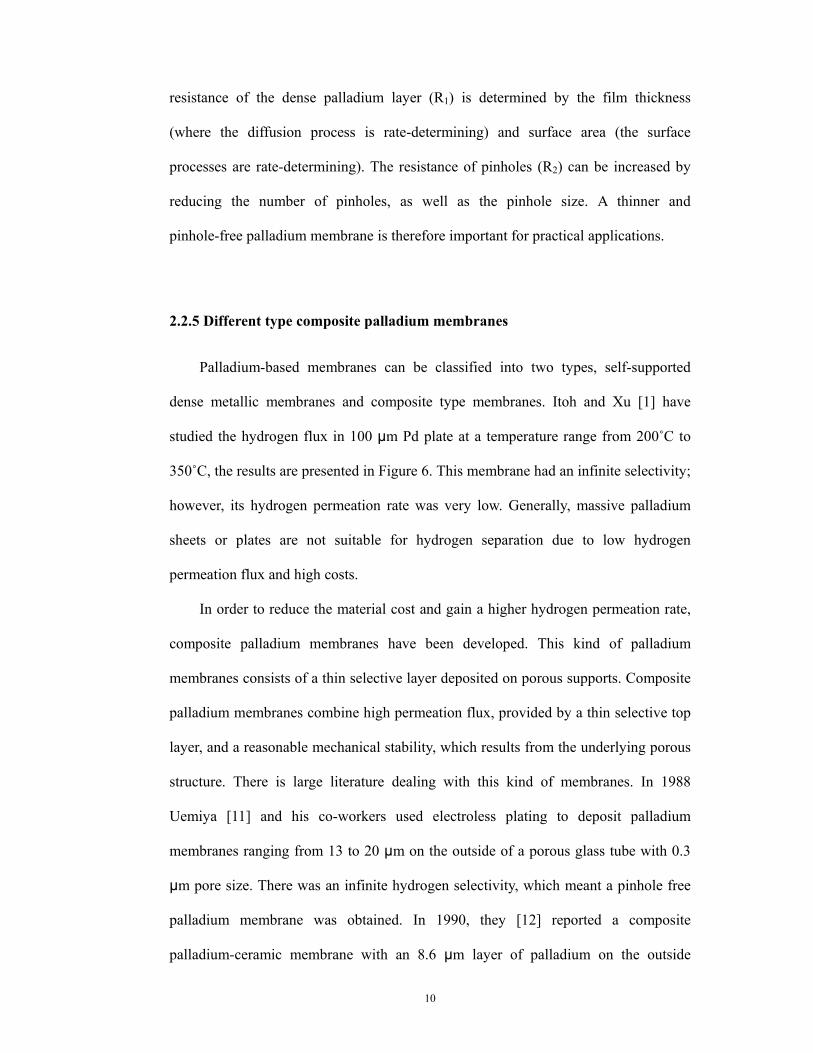
this membrane at 673 K. Some of the results obtained are summarized in Figure 6. It
can be seen that the hydrogen permeation flux can be increased by two ways: the
reduction of the palladium thickness and the increase of operating temperatures. As
the increase of temperature can affect the membrane structure in industrial
applications, the main focus of future research is on obtaining a pinhole-free
palladium membrane with high hydrogen permeation rate, even using at low
temperatures.
13
200 250 300 350 400 450 500 550 6000
1
2
3
4
5
6
hydr
ogen
flux
(μm
ol/m
2 .s.P
a)
Temperature (0C) Figure 6 Hydrogen fluxes of palladium membranes as a function of temperature
2.3 Electro-deposition of aluminum in non-aqueous solution
Aluminum has many interesting characteristics, including low density,
non-toxicity,good electrical and high-thermal conductivity, high-corrosion resistance,
low neutron absorption, and stable mechanical properties at cryogenic temperatures.
These characteristics make aluminum very useful in various industrial applications,
including coating steel parts for corrosion protection in aircraft structure and cars [3],
and the cladding of uranium fuel in power plants [17]. In recent years, thin aluminum
films have generated much attention in the development of novel micromachining
processes [4]. Anodized aluminum as a template is another attractive application of
aluminum, which has been used in fabrication of nano-materials. Such templates,
fabricated through a simple electrochemical process in various acidic electrolytes,
have been a subject of interest due to its hexagonal pore structure, inexpensive
processing and easy dissolution to free the deposited materials.
4.5μm Pd membrane on porous glass tube[3]
11.4μm Pd membrane on alumina tube [2]
4μm Pd membrane anodic alumina tube [4]
100 μm Pd plate [1]
14
2.3.1 Tetrahydrofuran (THF) solution for electroplating aluminum
As the reduction potential of aluminum is negative, only non-aqueous inorganic,
or organic electrolytes systems, or molten salts can be used for electrolytic deposition
of aluminum. The low volatile and inflammable THF bath is a typical solution used in
aluminum electroplating. Non-aqueous solution, however, has low conductivity, and
require proper choice of electrolytes [18]. In THF bath, the colorless tetrahydrofuran
(C4H8O) is often employed as the solvent. Two kinds of electrolytes are applied in the
THF bath. AlCl3 is the aluminum containing component, while LiAlH4 plays an
important role in enhancing the solution conductivity.
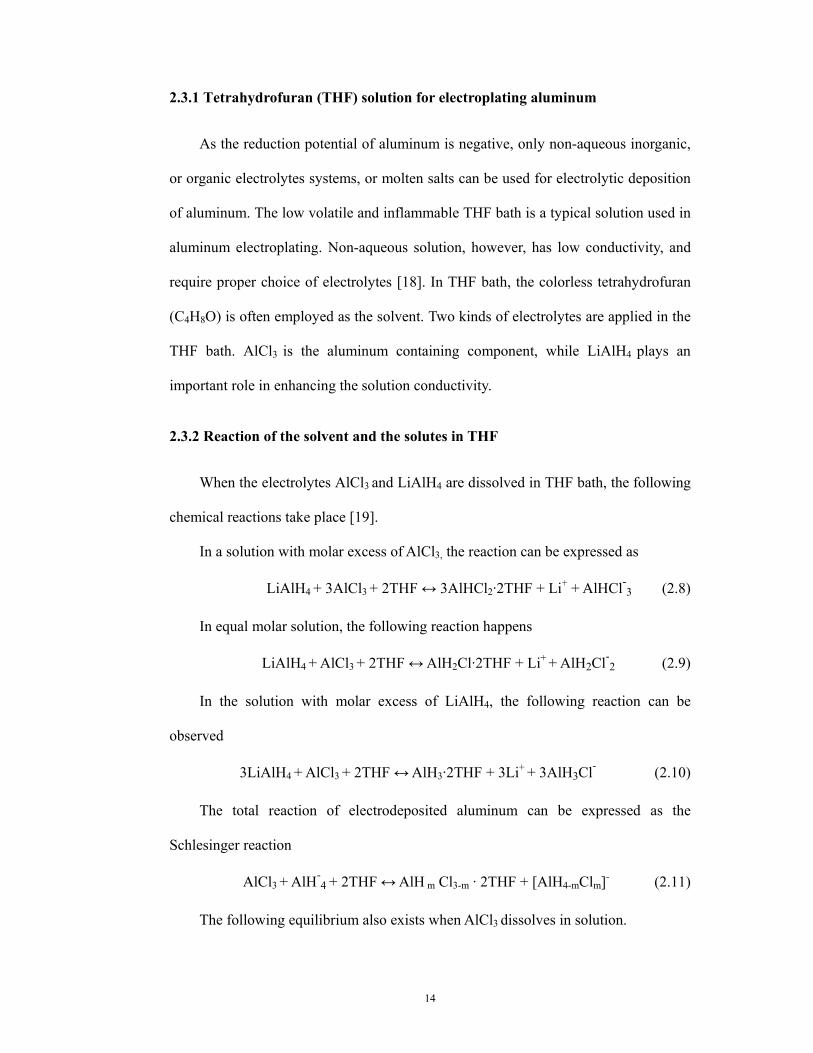
2.3.2 Reaction of the solvent and the solutes in THF
When the electrolytes AlCl3 and LiAlH4 are dissolved in THF bath, the following
chemical reactions take place [19].
In a solution with molar excess of AlCl3, the reaction can be expressed as
LiAlH4 + 3AlCl3 + 2THF ↔ 3AlHCl2·2THF + Li+ + AlHCl-3 (2.8)
In equal molar solution, the following reaction happens
LiAlH4 + AlCl3 + 2THF ↔ AlH2Cl·2THF + Li+ + AlH2Cl-2 (2.9)
In the solution with molar excess of LiAlH4, the following reaction can be
observed
3LiAlH4 + AlCl3 + 2THF ↔ AlH3·2THF + 3Li+ + 3AlH3Cl- (2.10)
The total reaction of electrodeposited aluminum can be expressed as the
Schlesinger reaction
AlCl3 + AlH-4 + 2THF ↔ AlH m Cl3-m · 2THF + [AlH4-mClm]- (2.11)
The following equilibrium also exists when AlCl3 dissolves in solution.
15
2AlCl3 ↔ AlCl-4 + AlCl+2 (2.12)
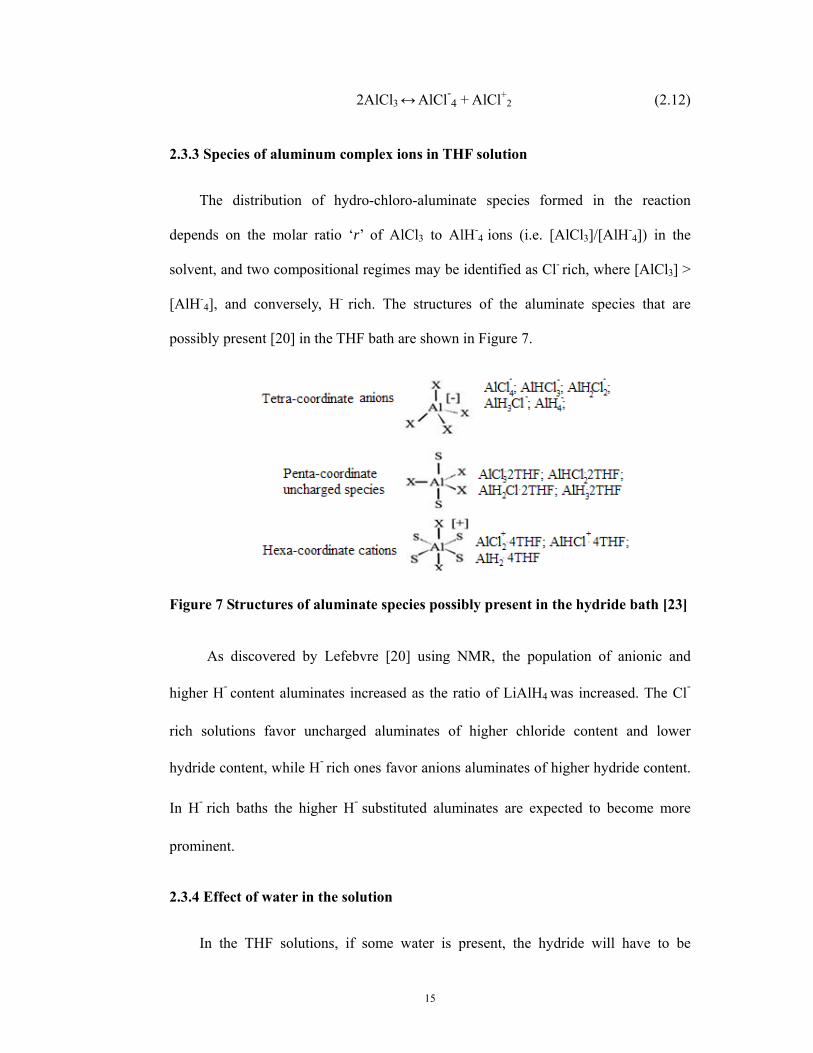
2.3.3 Species of aluminum complex ions in THF solution
The distribution of hydro-chloro-aluminate species formed in the reaction
depends on the molar ratio ‘r’ of AlCl3 to AlH-4 ions (i.e. [AlCl3]/[AlH-
4]) in the
solvent, and two compositional regimes may be identified as Cl- rich, where [AlCl3] >
[AlH-4], and conversely, H- rich. The structures of the aluminate species that are
possibly present [20] in the THF bath are shown in Figure 7.
Figure 7 Structures of aluminate species possibly present in the hydride bath [23]
As discovered by Lefebvre [20] using NMR, the population of anionic and
higher H- content aluminates increased as the ratio of LiAlH4 was increased. The Cl-
rich solutions favor uncharged aluminates of higher chloride content and lower
hydride content, while H- rich ones favor anions aluminates of higher hydride content.
In H- rich baths the higher H- substituted aluminates are expected to become more
prominent.
2.3.4 Effect of water in the solution
In the THF solutions, if some water is present, the hydride will have to be
16
reduced, accompanied by the release of hydrogen gas [21].
LiAlH4 + 4H2O → LiOH + Al(OH)3 + 4H2 ↑ (2.13)
Small amount of water causes no significant change, but high water content leads to
the deterioration of the hydride electrolyte.
AlCl3 can also react with water by the following reactions:
AlCl3 + H2O ↔ AlCl2OH + HCl (2.14)
AlCl3+ HCl ↔ H+ + AlCl-4 (2.15)
Since water-free chemicals are required in the solution, the preparation of
electrolyte should be carried out in a nitrogen-filled or argon-filled gas glove box to
avoid moisture and reduce contamination that results from described reaction with
water.
2.3.5 Fundamental of electro-deposited aluminum in THF solution
(1) General principles
Electroplated aluminum coatings can be obtained using a non-aqueous THF
solution that contains LiAlH4 and AlCl3. The electrolytic reactions can be expressed as
follows:
Anodic reaction: Al → Al3+ + 3e- (2.16)
Cathodic reaction (overall electrode reaction [22]):
AlX- + 3e- → 4X- + Al ↓ (2.17)
where AlX- can be AlCl-4, AlHCl-3, AlH2Cl-2, AlH3Cl-, AlHCl2, depending on the
composition of the situation.
For example, if it is AlHCl2, the cathodic reaction can be expressed as:
AlHCl2 + 3 e- → H- + Cl- + Al ↓ (2.18) ↑ ↓ ↓
AlHCl2 + 3AlCl-4 ← H- + 2Cl- + 4AlCl3 (2.19)
17
In the solution with a molar excess of AlCl3 over LiAlH4 , the dominant species
are AlCl-4 and AlHCl-3; whereas when there is an excess of AlH-4 the dominant
species is AlH3Cl-.
The chloride and hydride anions, denoted by X- in the overall reaction equation
(2.19), are unstable and can further react with neutral molecules.
AlX3 + X- → AlX-4 (2.20)
In this way, all the aluminum present in the solution in the form of anions and
neutral molecules are reduced at the electrode.
(2) Mechanism of aluminum deposition
The mechanism of electro-deposition of aluminum is relatively complex since
aluminum possesses three valence electrons and can exist only in one stable oxidation
state. Therefore the reduction of Al3+ solution species necessarily implies a multi-step,
multi-electron mechanism. There are various mechanisms in THF solution proposed
by different authors:
(a) GÁLOVÁ’s mechanism
The following mechanism from AlCl3—LiAlH4—THF electrolyte was suggested
by J. Eckert and M. GÁLOVÁ in 1981 [22]:
Step 1: AlX-4 + e-↔ AlX2 + 2X- (2.21)
Step 2: 2AlX2 ↔ Al2X4 (2.22)
Step 3: Al2X4 ↔ Al+ + AlX-4 (2.23)
Step 4: AlX2 + e- ↔ Al+ + 2X- (2.24)
Step 5: 2 Al+ + 2e- ↔ 2Al (2.25)
The combined reaction is as follows:
AlX-4 + 3e- → Al + 4X- (2.26)
18
If there is an excess of AlCl3 in the electrolyte, the charge transfer (step1) is the
rate-determining step; whereas if LiAlH4 is in excess, the chemical reaction step 2 and
step 3 determine the rate of the overall process at higher over-potential values.
(b) Badawy’s mechanism
In 1987, Badawy [23] and his coworkers put forward another mechanism for
AlCl3 - LiAlH4 /THF-toluene.
Step1: AlX-4 + e- ↔ AlX2 + 2X- (2.27)
Step2: AlX2 + e- ↔ Al+ + 2X- (2.28)
Step3: Al+ + e- ↔ Al (2.29)
AlX-4 may be AlHCl-3, AlH2Cl-2, AlH3, according to the solution composition.
The primary product of the electrode process, the anions X-, which are chlorides and
hydrides, are not sufficiently stable in this medium and can react quickly with neutral
molecules present in the solution to form new anionic electro-active particles.
X- + AlX3 ↔ AlX-4 (2.30)
AlX3 represents AlH2Cl, AlHCl2, or AlH3. In this way, the aluminum is reduced
at the electrode independently, whether it was originally in the solution in the form of
electro-active anions or inactive neutral molecules.
(c) Nucleation mechanism of aluminum in THF bath
The nucleation and growth mechanism was studied by M.C. Lefebvre and his
coworkers [24]. It was described as a kinetically controlled, three-dimensional growth
with instantaneous nucleation on glassy carbon with poor adhesion. It was a
diffusion-controlled process which occurs on the gold substrate.
19
2.4 Formation of anodic aluminum oxide (AAO) template
An oxide film can be grown on certain metals such as aluminum, niobium,
tantalum, titanium, tungsten, and zirconium through an electrochemical process called
anodizing. Aluminum is unique among these metals due to its highly dense hexagonal
pore structure. The history of electrochemical oxidation of aluminum dates back to the
beginning of the nineteenth century. In recent years there has been an increasing
interest in anodic aluminum oxide due to its large surface area and a relatively narrow,
hexagonal pore size structure, which can be used in nano-material fabrication. The
AAO membrane is an ideal template because it possesses many desirable
characteristics, including tunable dimension of pores, good mechanical strength and
thermal stability. The oxide layer formed by anodization provides an advantageous
combination of a good conducting layer and an insulting layer, which can be
successfully applied in electrical engineering and electronics [25]. In addition,
alumina is easy to be dissolved to free the deposited nano-materials.
2.4.1 Electrochemical reaction in AAO
The anodizing process can be attained by establishing an electrical circuit
between a cathode and the aluminum through an acidic electrolyte. During the
anodization process, the aluminum piece serves as the anode of a DC power supply
based on any chromic, sulfuric, phosphoric, or oxalic acid electrolyte. The cathode
can be any electronic conductor that is inert in the anodizing bath. Once the circuit is
closed, electrons are withdrawn from the metal at the positive terminal and allow ions
at the metal surface to react with water to form the oxide layer on the aluminum
surface. The electrons return to the bath at the cathode where they react with hydrogen
ions to produce hydrogen gas [7]. When aluminum is anodized, aluminum oxide is
20
produced from the reaction, which can be summarized as follows [26]:
Al + 3H2O → Al2O3 + 6H2 (2.31)
This represents the sum of two partial processes
Anodic process: 2Al + 3H2O → Al2O3 + 6e- + 6H+ (2.32)
Cathodic process: 6H+ + 6 e- → 3H2 (2.33)
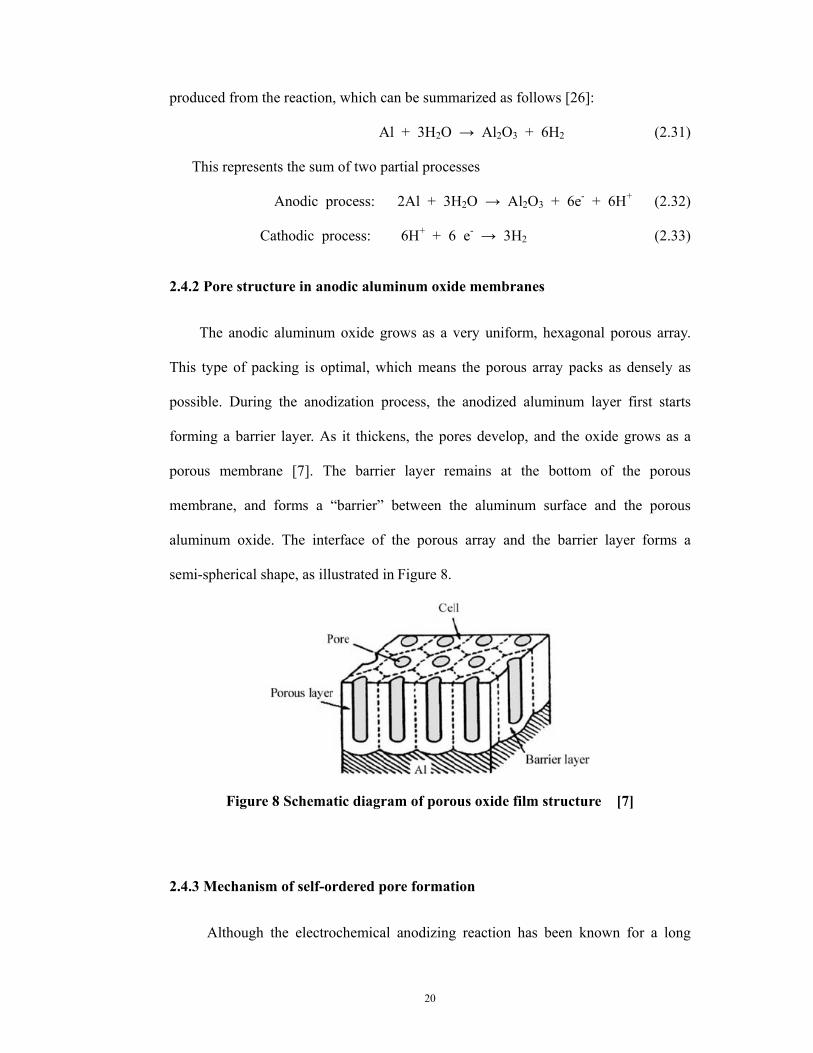
2.4.2 Pore structure in anodic aluminum oxide membranes
The anodic aluminum oxide grows as a very uniform, hexagonal porous array.
This type of packing is optimal, which means the porous array packs as densely as
possible. During the anodization process, the anodized aluminum layer first starts
forming a barrier layer. As it thickens, the pores develop, and the oxide grows as a
porous membrane [7]. The barrier layer remains at the bottom of the porous
membrane, and forms a “barrier” between the aluminum surface and the porous
aluminum oxide. The interface of the porous array and the barrier layer forms a
semi-spherical shape, as illustrated in Figure 8.
Figure 8 Schematic diagram of porous oxide film structure [7]
2.4.3 Mechanism of self-ordered pore formation
Although the electrochemical anodizing reaction has been known for a long
21
time, the physical mechanisms underlying this remarkable self-organization process
are not well understood yet. One pore formation mechanism supported by O.
Jessensky [27], Parkhutik [28], Wu [29], and Huang [30] is as follows: when an
electric field is applied to aluminum during the anodizing process, there is an
electrical breakdown at the beginning, and an aluminum oxide layer grows on the
entire surface. Thus, surface roughness is increased by the volumetric expansion
associated with the conversion of aluminum into aluminum oxide, resulting in
fluctuations on the surface. This volume expansion leads to compressive stress during
the oxide formation on the oxide/metal interface. The anodic oxide layer builds on the
surface of aluminum and simultaneously penetrates the substrates. When the
aluminum oxide mask becomes sufficiently thick, the electrical breakdown cycle stops,
and a barrier type aluminum oxide is formed. This surface fluctuation causes the local
electric field redistribution. During the early stage, the film on the convex parts of the
surface becomes thicker than in the depressions. With a concave geometry developing,
the electric field is slightly higher inside the depressions, and field-assisted dissolution
promotes local oxide thinning. As reported by Q. Huang, dielectric breakdown always
initiates along the local electric field direction, and electrochemical dissolution is also
higher along the local maximum electric field direction. This field-enhanced
dissolution starts within the formed oxide, and pores begin to nucleate. In addition to
the mechanical stress at the metal-oxide interface, repulsive forces also exist among
the neighboring pores, promoting the formation of a hexagonally ordered pore
arrangement, while the expansion stress in the vertical direction pushes the pore wall
upwards. The morphology is transformed until a steady state governs the film growth,
and deep pores continuously grow as the anodization continues. The dissolution at the
electrolyte/oxide interface is equilibrated with oxide growth at the metal/oxide
22
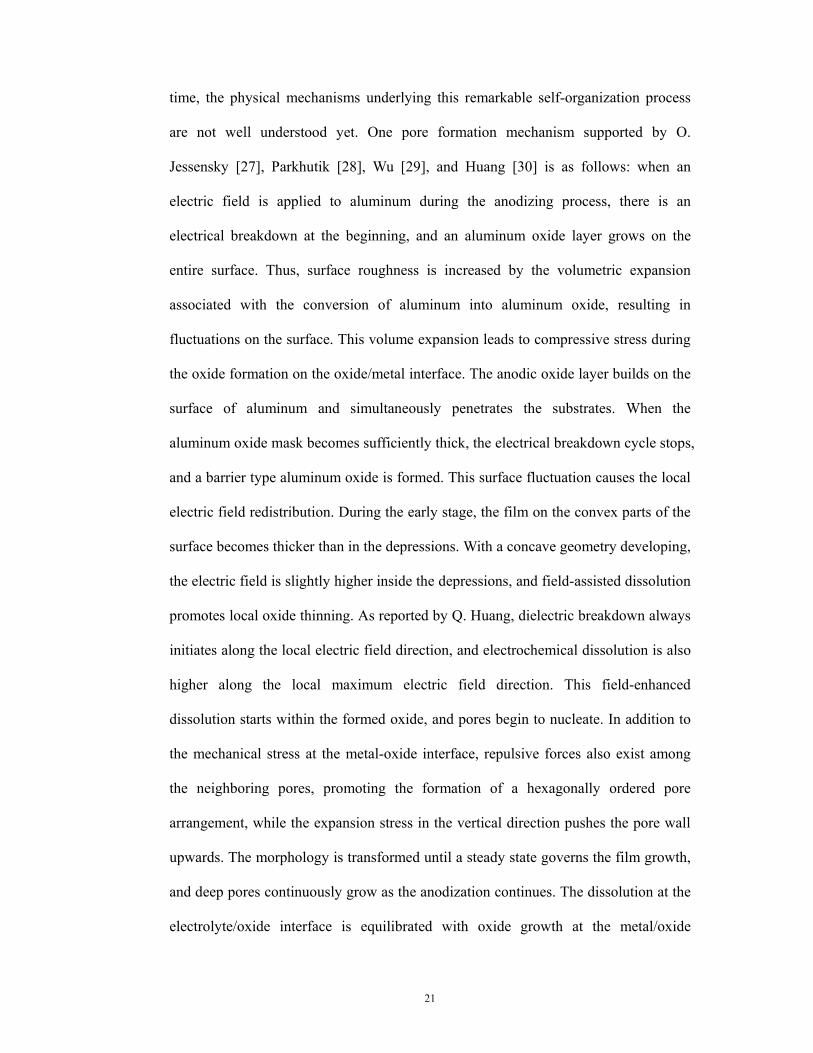
interface. The formed anodic oxide film consists of two regions: a thick top region of
the porous oxide and a thin bottom region of the barrier oxide.
Figure 9 Schematic diagram of self-organized formation of pore structure
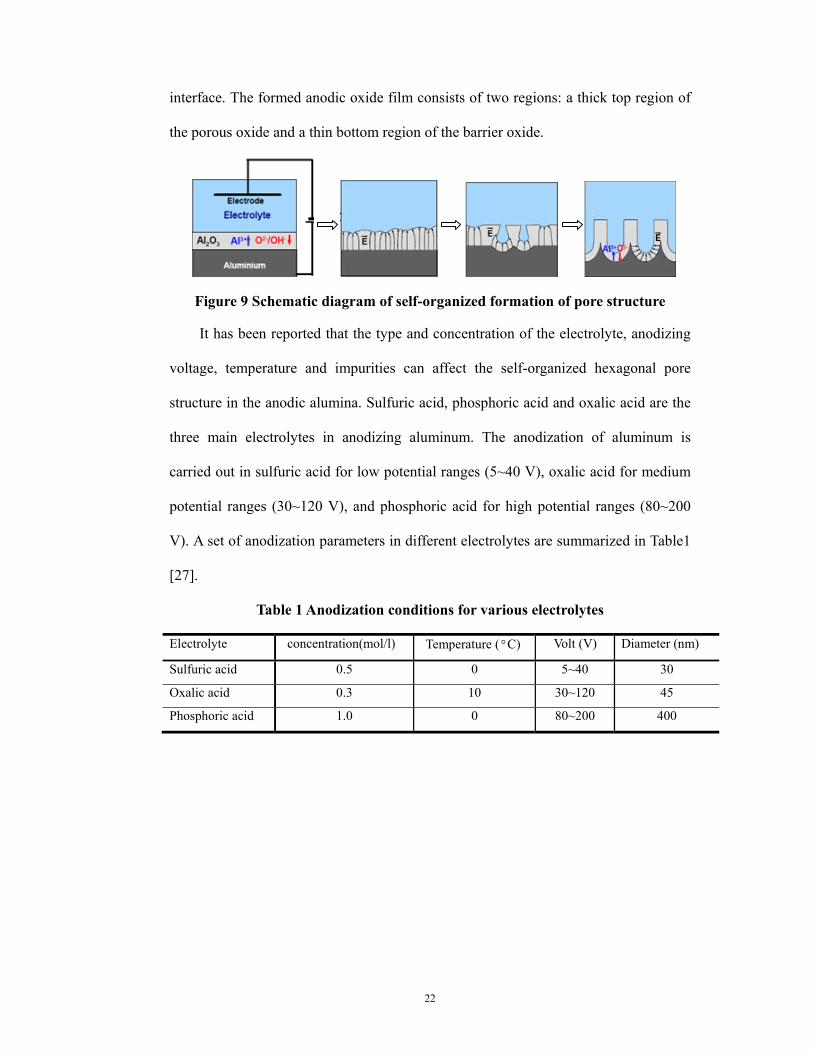
It has been reported that the type and concentration of the electrolyte, anodizing
voltage, temperature and impurities can affect the self-organized hexagonal pore
structure in the anodic alumina. Sulfuric acid, phosphoric acid and oxalic acid are the
three main electrolytes in anodizing aluminum. The anodization of aluminum is
carried out in sulfuric acid for low potential ranges (5~40 V), oxalic acid for medium
potential ranges (30~120 V), and phosphoric acid for high potential ranges (80~200
V). A set of anodization parameters in different electrolytes are summarized in Table1
[27].
Table 1 Anodization conditions for various electrolytes Electrolyte concentration(mol/l) Temperature (°C) Volt (V) Diameter (nm)
Sulfuric acid 0.5 0 5~40 30
Oxalic acid 0.3 10 30~120 45
Phosphoric acid 1.0 0 80~200 400
23
CHAPTER 3 Fabrication of Al films by electroplating
Fabrication of anodic alumina template is closely related with the choice of
aluminum substrate. In general, pure aluminum foils with different thicknesses are
used [31-33]. Thin aluminum film obtained by deposition using sputtering or
electroplating is another choice [34]. Sputtering deposition method has an advantage
of flexible control of the coating thickness on substrate, but it is impractical because
of the high cost of the process. In comparison, the use of electroplating may reduce
cost, allow controlling the thickness, obtaining desirable sample size, and at the same
time reducing the thermal stress in the substrate.
In recent years, there has been a considerable literature concerning electroplating
aluminum in THF bath. However, most of the work is concentrated on the speciation
of aluminum complex ions in THF solution [5], the nucleation and growth mechanism
of aluminum deposits in THF solution [6], and the mechanisms of the reaction during
the electroplating [7,8]. The characterization of the electroplating aluminum films
obtained in THF solution and investigation of its effect on the later anodizing process
have not been reported yet.
The aims of this chapter are to study the effects of various electrochemical
conditions on the formation of deposited aluminum films. The crystalline structure of
the coatings and the texture will be analyzed. The obtained Al films will be used for
further fabrication of AAO template.
3.1 Experimental procedure
In order to achieve good AAO templates, homogeneous electroplated aluminum
films are essential. This section will introduce the process to prepare aluminum films
24
using the electroplating method, and then the as-deposited aluminum films are
characterized.
3.1.1 Solution preparation
The solvent tetrahydrofuran (THF), purchased from Fisher Scientific, was used as
received. The anhydrous aluminum chloride (AlCl3 concentration 99%) in the form of
a yellowish powder is a commercial product obtained from Alfa Aesar. White lithium
aluminum hydride powder (97%) was also supplied by the same company.
As mentioned in the literature review, water reacts with the solution;
consequently, the preparations of all the solution were carried out in a glove box,
avoiding the access of air and humidity. In order to eliminate the traces of oxygen or
water in the atmosphere gas, nitrogen was introduced into this closed system for half
an hour before the solutes were mixed with solvent.
In order to study the effect of concentration of aluminum chloride and lithium
aluminum hydride on microstructures of deposited aluminum films, two groups of
solutions were prepared. The first group was composed of solutions with a constant
aluminum chloride concentration, but with different concentrations of lithium
aluminum hydride. The second group consisted of solutions with a constant lithium
aluminum hydride concentration, but with different concentrations of aluminum
chloride. The solutions were prepared in the following manner: firstly, the AlCl3
powder was added in small amounts to the THF solution. Because temperature
increases during the process, the solution was left to cool for half an hour. Then the
LiAlH4 powder was dissolved into this solution. As the THF solution vaporizes during
the solution preparation process, the solution concentration was calculated by
weighing the THF solution, and this weight was converted into volume of the THF.
The density used for calculating the THF volume is 0.888 g/ml. The concentrations of
25
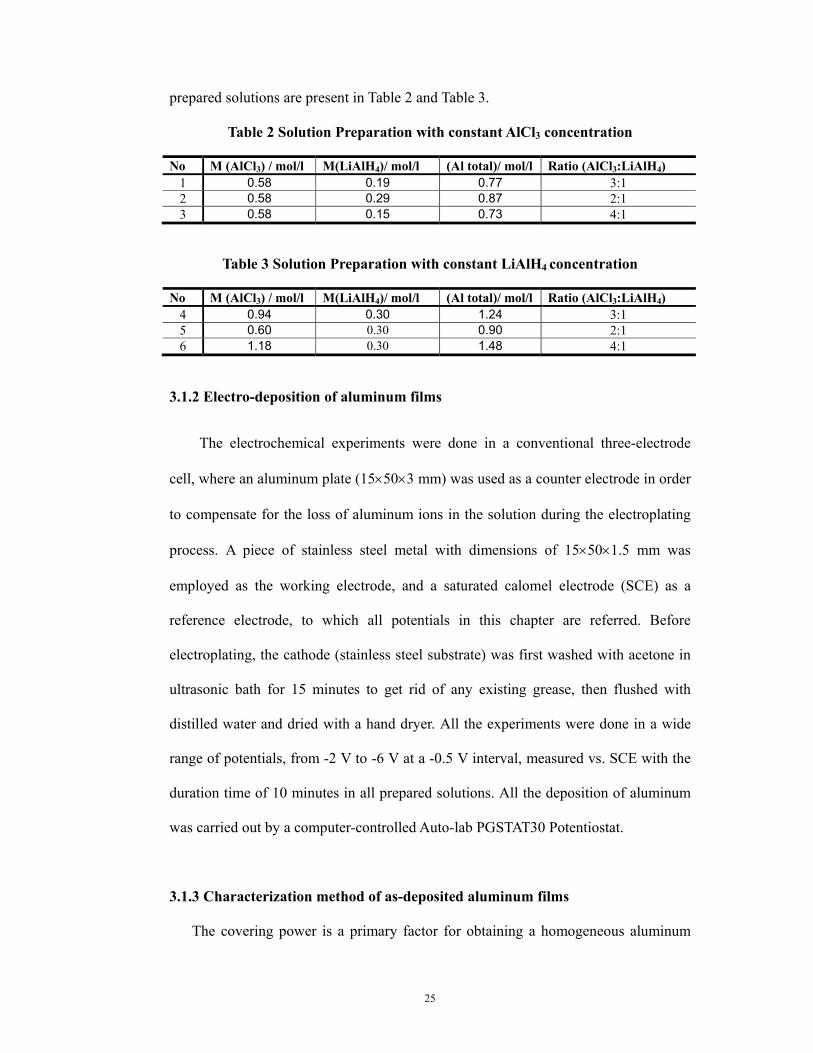
prepared solutions are present in Table 2 and Table 3.
Table 2 Solution Preparation with constant AlCl3 concentration No M (AlCl3) / mol/l M(LiAlH4)/ mol/l (Al total)/ mol/l Ratio (AlCl3:LiAlH4)
1 0.58 0.19 0.77 3:1 2 0.58 0.29 0.87 2:1 3 0.58 0.15 0.73 4:1
Table 3 Solution Preparation with constant LiAlH4 concentration
No M (AlCl3) / mol/l M(LiAlH4)/ mol/l (Al total)/ mol/l Ratio (AlCl3:LiAlH4)
4 0.94 0.30 1.24 3:1 5 0.60 0.30 0.90 2:1 6 1.18 0.30 1.48 4:1
3.1.2 Electro-deposition of aluminum films
The electrochemical experiments were done in a conventional three-electrode
cell, where an aluminum plate (15×50×3 mm) was used as a counter electrode in order
to compensate for the loss of aluminum ions in the solution during the electroplating
process. A piece of stainless steel metal with dimensions of 15×50×1.5 mm was
employed as the working electrode, and a saturated calomel electrode (SCE) as a
reference electrode, to which all potentials in this chapter are referred. Before
electroplating, the cathode (stainless steel substrate) was first washed with acetone in
ultrasonic bath for 15 minutes to get rid of any existing grease, then flushed with
distilled water and dried with a hand dryer. All the experiments were done in a wide
range of potentials, from -2 V to -6 V at a -0.5 V interval, measured vs. SCE with the
duration time of 10 minutes in all prepared solutions. All the deposition of aluminum
was carried out by a computer-controlled Auto-lab PGSTAT30 Potentiostat.
3.1.3 Characterization method of as-deposited aluminum films
The covering power is a primary factor for obtaining a homogeneous aluminum
26
films. The covering power and microstructures were investigated with a scanning
electron microscopy (SEM), employing a Philips XL30 field-emission-gun system.
All the samples were cut and mounted in order to observe the thickness of the
as-deposited aluminum films.
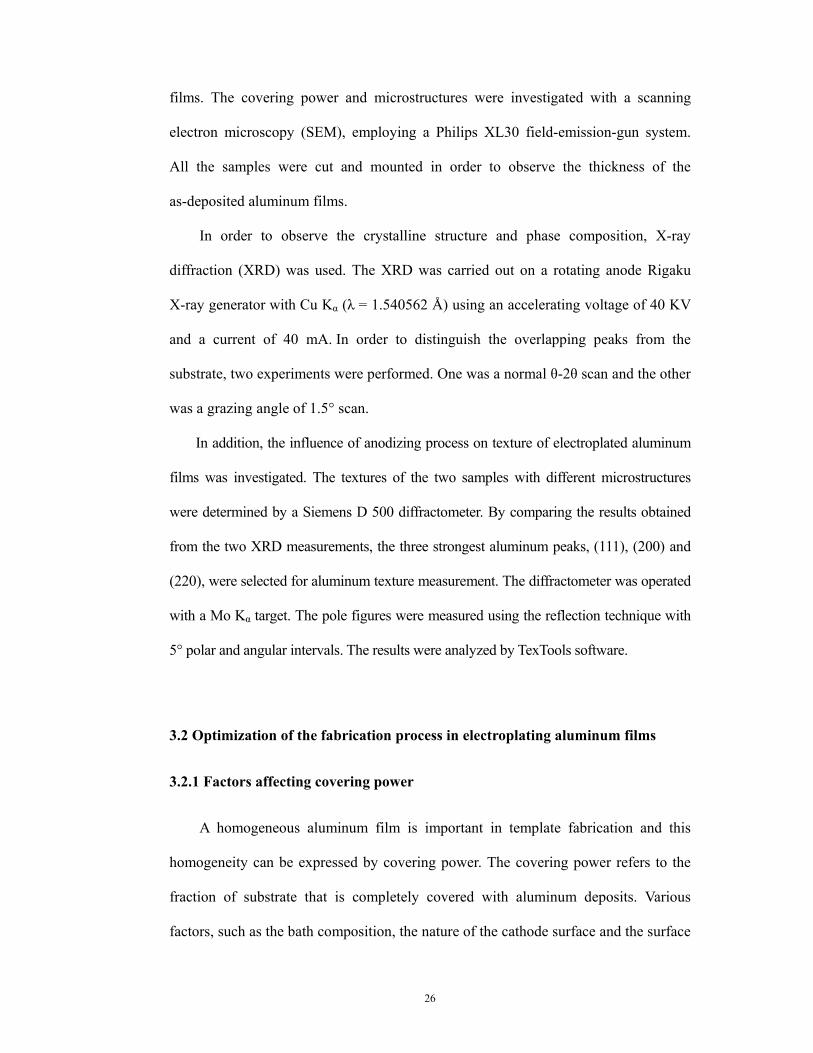
In order to observe the crystalline structure and phase composition, X-ray
diffraction (XRD) was used. The XRD was carried out on a rotating anode Rigaku
X-ray generator with Cu Kα (λ = 1.540562 Å) using an accelerating voltage of 40 KV
and a current of 40 mA. In order to distinguish the overlapping peaks from the
substrate, two experiments were performed. One was a normal θ-2θ scan and the other
was a grazing angle of 1.5° scan.
In addition, the influence of anodizing process on texture of electroplated aluminum
films was investigated. The textures of the two samples with different microstructures
were determined by a Siemens D 500 diffractometer. By comparing the results obtained
from the two XRD measurements, the three strongest aluminum peaks, (111), (200) and
(220), were selected for aluminum texture measurement. The diffractometer was operated
with a Mo Kα target. The pole figures were measured using the reflection technique with
5° polar and angular intervals. The results were analyzed by TexTools software.
3.2 Optimization of the fabrication process in electroplating aluminum films
3.2.1 Factors affecting covering power
A homogeneous aluminum film is important in template fabrication and this
homogeneity can be expressed by covering power. The covering power refers to the
fraction of substrate that is completely covered with aluminum deposits. Various
factors, such as the bath composition, the nature of the cathode surface and the surface
27
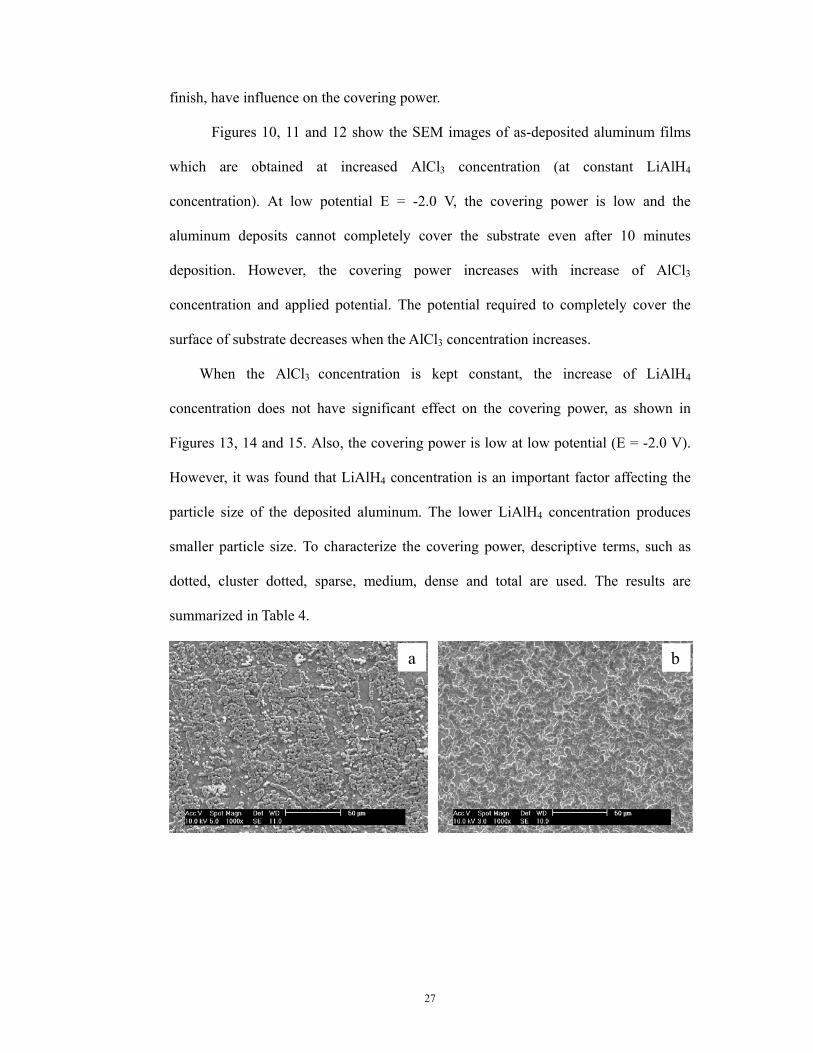
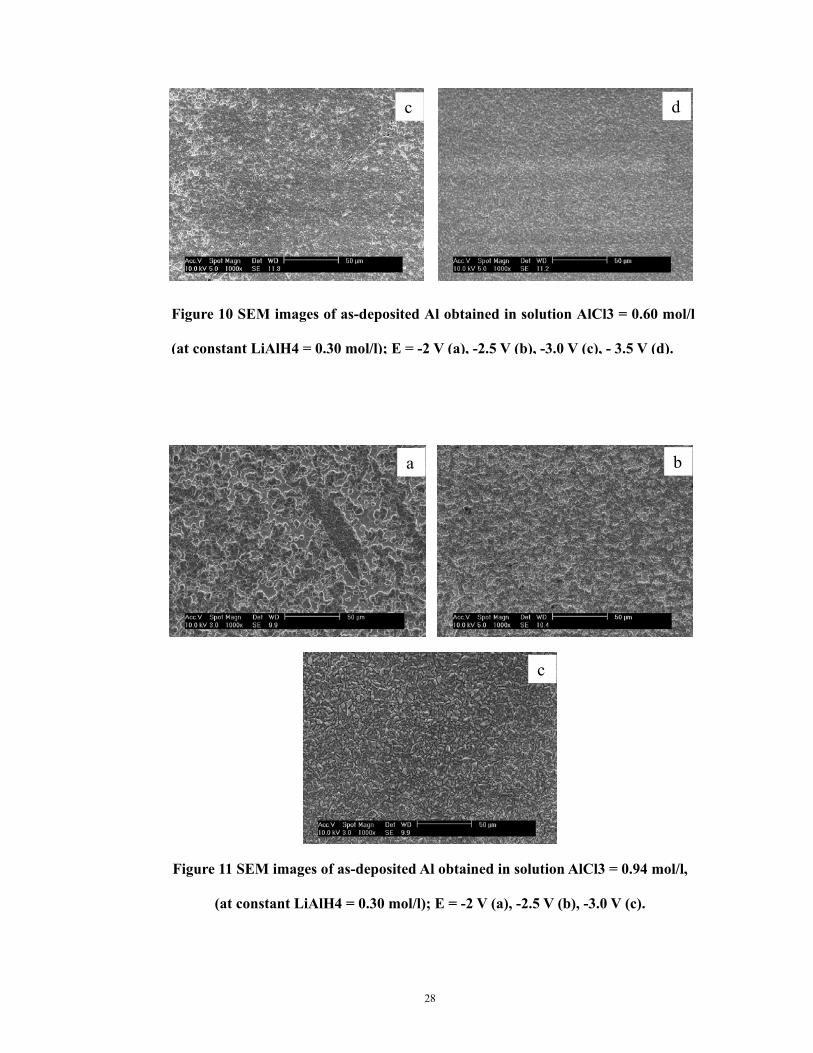
finish, have influence on the covering power.
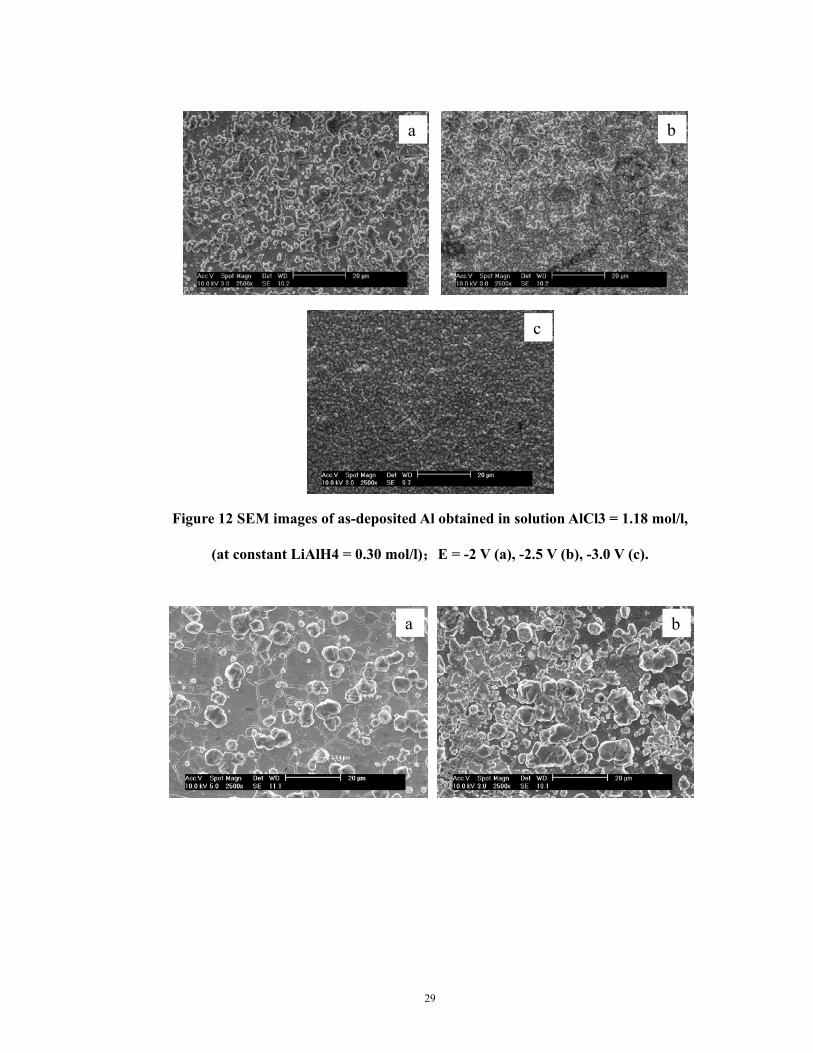
Figures 10, 11 and 12 show the SEM images of as-deposited aluminum films
which are obtained at increased AlCl3 concentration (at constant LiAlH4
concentration). At low potential E = -2.0 V, the covering power is low and the
aluminum deposits cannot completely cover the substrate even after 10 minutes
deposition. However, the covering power increases with increase of AlCl3
concentration and applied potential. The potential required to completely cover the
surface of substrate decreases when the AlCl3 concentration increases.
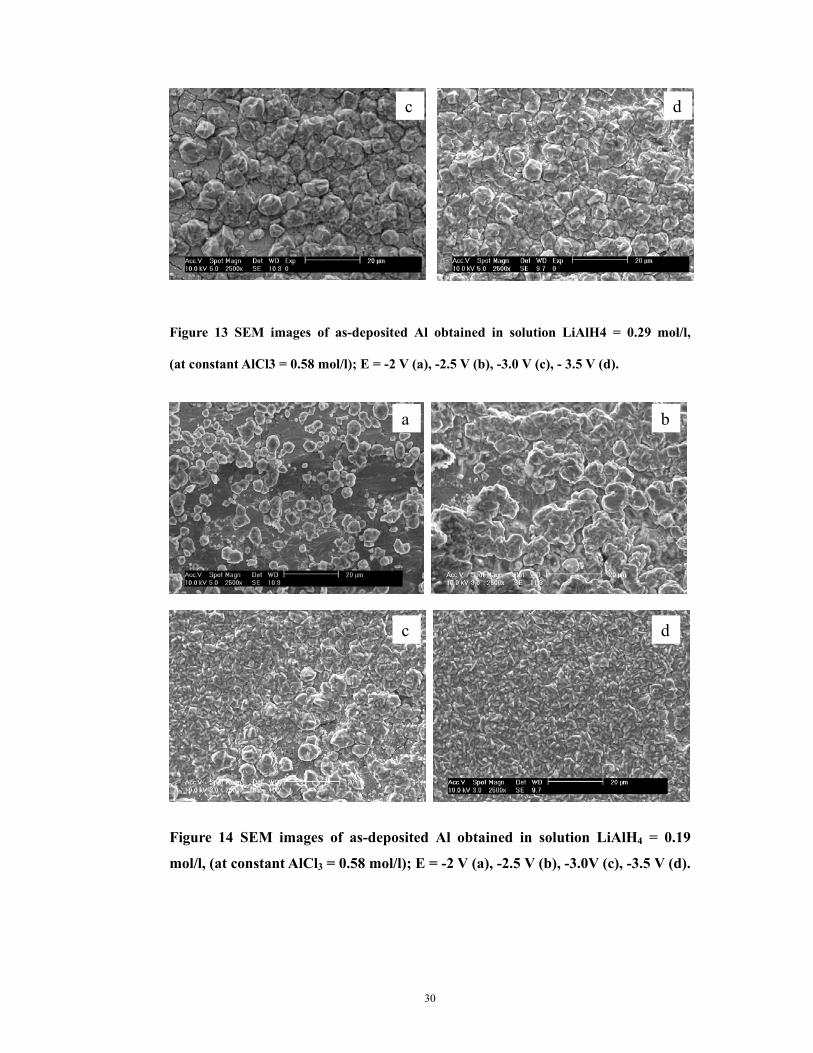
When the AlCl3 concentration is kept constant, the increase of LiAlH4
concentration does not have significant effect on the covering power, as shown in
Figures 13, 14 and 15. Also, the covering power is low at low potential (E = -2.0 V).
However, it was found that LiAlH4 concentration is an important factor affecting the
particle size of the deposited aluminum. The lower LiAlH4 concentration produces
smaller particle size. To characterize the covering power, descriptive terms, such as
dotted, cluster dotted, sparse, medium, dense and total are used. The results are
summarized in Table 4.
a b
28
Figure 11 SEM images of as-deposited Al obtained in solution AlCl3 = 0.94 mol/l,
(at constant LiAlH4 = 0.30 mol/l); E = -2 V (a), -2.5 V (b), -3.0 V (c).
c d
a b
c
Figure 10 SEM images of as-deposited Al obtained in solution AlCl3 = 0.60 mol/l
(at constant LiAlH4 = 0.30 mol/l); E = -2 V (a), -2.5 V (b), -3.0 V (c), - 3.5 V (d).
29
Figure 12 SEM images of as-deposited Al obtained in solution AlCl3 = 1.18 mol/l,
(at constant LiAlH4 = 0.30 mol/l);E = -2 V (a), -2.5 V (b), -3.0 V (c).
a
c
b
a b
30
Figure 13 SEM images of as-deposited Al obtained in solution LiAlH4 = 0.29 mol/l,
(at constant AlCl3 = 0.58 mol/l); E = -2 V (a), -2.5 V (b), -3.0 V (c), - 3.5 V (d).
Figure 14 SEM images of as-deposited Al obtained in solution LiAlH4 = 0.19
mol/l, (at constant AlCl3 = 0.58 mol/l); E = -2 V (a), -2.5 V (b), -3.0V (c), -3.5 V (d).
c d
a b
c d
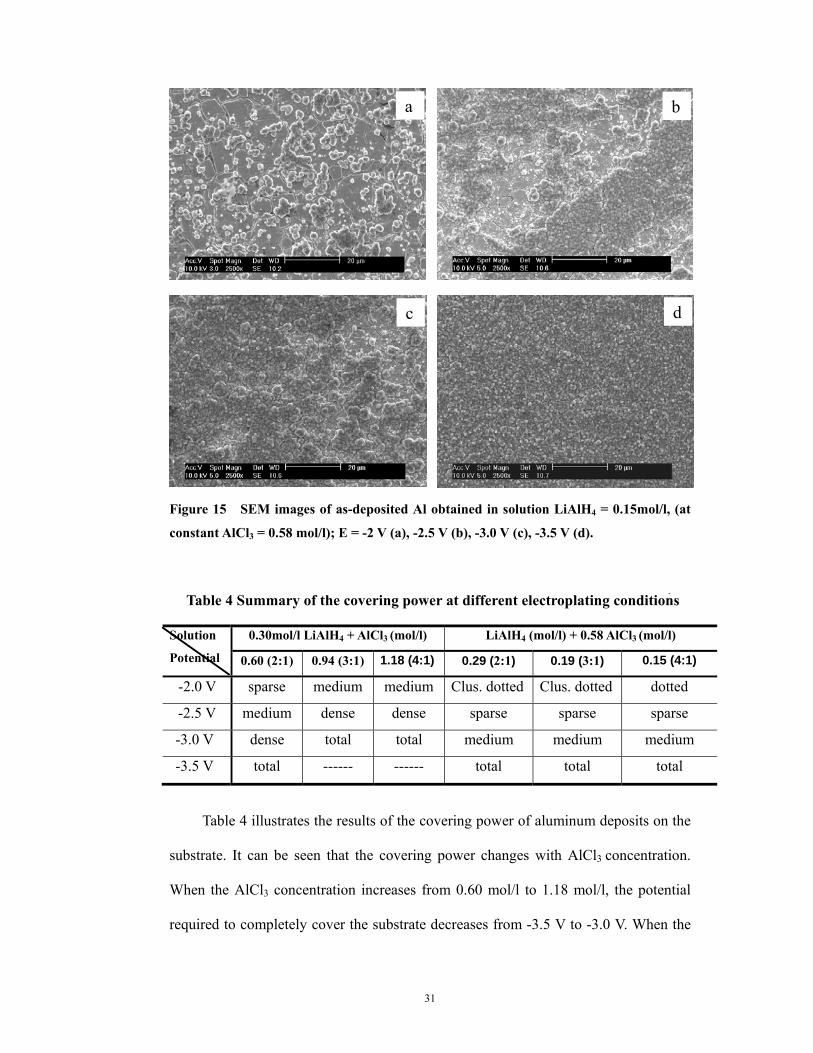
31
Figure 15 SEM images of as-deposited Al obtained in solution LiAlH4 = 0.15mol/l, (at
constant AlCl3 = 0.58 mol/l); E = -2 V (a), -2.5 V (b), -3.0 V (c), -3.5 V (d).
Table 4 Summary of the covering power at different electroplating conditions
Solution
Potential
0.30mol/l LiAlH4 + AlCl3 (mol/l) LiAlH4 (mol/l) + 0.58 AlCl3 (mol/l)
0.60 (2:1) 0.94 (3:1) 1.18 (4:1) 0.29 (2:1) 0.19 (3:1) 0.15 (4:1)
-2.0 V sparse medium medium Clus. dotted Clus. dotted dotted
-2.5 V medium dense dense sparse sparse sparse
-3.0 V dense total total medium medium medium
-3.5 V total ------ ------ total total total
Table 4 illustrates the results of the covering power of aluminum deposits on the
substrate. It can be seen that the covering power changes with AlCl3 concentration.
When the AlCl3 concentration increases from 0.60 mol/l to 1.18 mol/l, the potential
required to completely cover the substrate decreases from -3.5 V to -3.0 V. When the
a b
c
d
d
32
concentration of LiAlH4 is changed, the covering power shows no dramatic change.
However, with the decreasing of LiAlH4 concentration, the particles become smaller,
as is shown in Figures 13 to 15. With the same ratio of 3:1 of AlCl3 to LiAlH4 , the
applied potential required decreases from -3.5 V to -3.0 V with an increase in
concentration of AlCl3.
Figure16 Schematic graph of the influence of AlCl3 concentration on covering power
As reported by Badawy [9], in non-aqueous THF solutions, the conductivity of
the solution increases either by increasing the molar ratio of LiAlH4 to AlCl3 or by
increasing the total concentration of aluminum in the solution. This increase of
33
conductivity with increasing concentration of LiAlH4 is attributed to the formation of
both AlHCl2 and AlH2Cl which generate the ionic species AlCl2+
, AlH2Cl2-, and AlHl2+.
These ionic species are directly responsible for an increase of conductivity of the
solution. At a constant molar ratio of LiAlH4 to AlCl3 any increase in the total
concentration of aluminum may also lead to an increase in the concentration of the
ionic species and consequently increase in the conductivity of the solution. This
means that both the increases of LiAlH4 concentration and the total aluminum
concentration may generate more species migrating towards the working electrode at
the same time. The resultant higher speed-up of migration will accelerate the growth
of nuclei at the surface, thus producing larger particle size. As AlCl3 is the aluminum
component, any increase of AlCl3 concentration may also lead to an increase of
nucleation rate, as explained in Figure 16. As more nucleation sites are produced on
the substrate, this would undoubtedly result in an increase in covering power.
3.2.2 Factors affecting microstructure of as-deposited aluminum films
3.2.2.1 Influences of solution concentration and potential on surface morphology
In process of the aluminum film fabrication, various microstructures were
obtained. Figure 17 shows the SEM images of microstructure obtained by
electroplating aluminum in the THF solutions. It can be seen that the deposited
aluminum particles are of different morphologies under different conditions. They
may be divided into different classifications, such as (a) tetrahedron, (b) cone, (c)
dendrite, (d) cedar, (e) rhombic, (f) oval and (g) semi-sphere particles. This illustrates
that the microstructure of the deposited aluminum films changes with the applied
potential and the solution concentration. These observations are summarized in Table
5.
34
Figure 17 Microstructures obtained from as-deposited aluminum coatings
a
d
fe
c
b
g
35
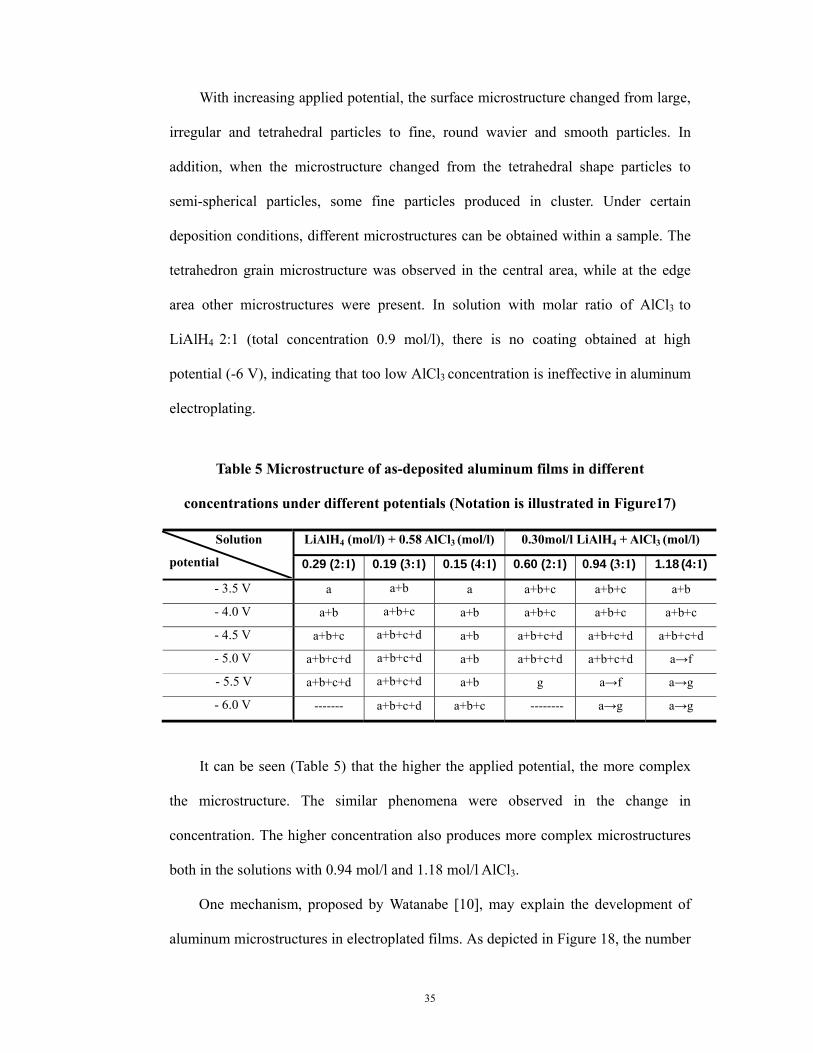
With increasing applied potential, the surface microstructure changed from large,
irregular and tetrahedral particles to fine, round wavier and smooth particles. In
addition, when the microstructure changed from the tetrahedral shape particles to
semi-spherical particles, some fine particles produced in cluster. Under certain
deposition conditions, different microstructures can be obtained within a sample. The
tetrahedron grain microstructure was observed in the central area, while at the edge
area other microstructures were present. In solution with molar ratio of AlCl3 to
LiAlH4 2:1 (total concentration 0.9 mol/l), there is no coating obtained at high
potential (-6 V), indicating that too low AlCl3 concentration is ineffective in aluminum
electroplating.
Table 5 Microstructure of as-deposited aluminum films in different
concentrations under different potentials (Notation is illustrated in Figure17)
Solution
potential
LiAlH4 (mol/l) + 0.58 AlCl3 (mol/l) 0.30mol/l LiAlH4 + AlCl3 (mol/l)
0.29 (2:1) 0.19 (3:1) 0.15 (4:1) 0.60 (2:1) 0.94 (3:1) 1.18 (4:1)
- 3.5 V a a+b a a+b+c a+b+c a+b
- 4.0 V a+b a+b+c a+b a+b+c a+b+c a+b+c
- 4.5 V a+b+c a+b+c+d a+b a+b+c+d a+b+c+d a+b+c+d
- 5.0 V a+b+c+d a+b+c+d a+b a+b+c+d a+b+c+d a→f
- 5.5 V a+b+c+d a+b+c+d a+b g a→f a→g
- 6.0 V ------- a+b+c+d a+b+c -------- a→g a→g
It can be seen (Table 5) that the higher the applied potential, the more complex
the microstructure. The similar phenomena were observed in the change in
concentration. The higher concentration also produces more complex microstructures
both in the solutions with 0.94 mol/l and 1.18 mol/l AlCl3.
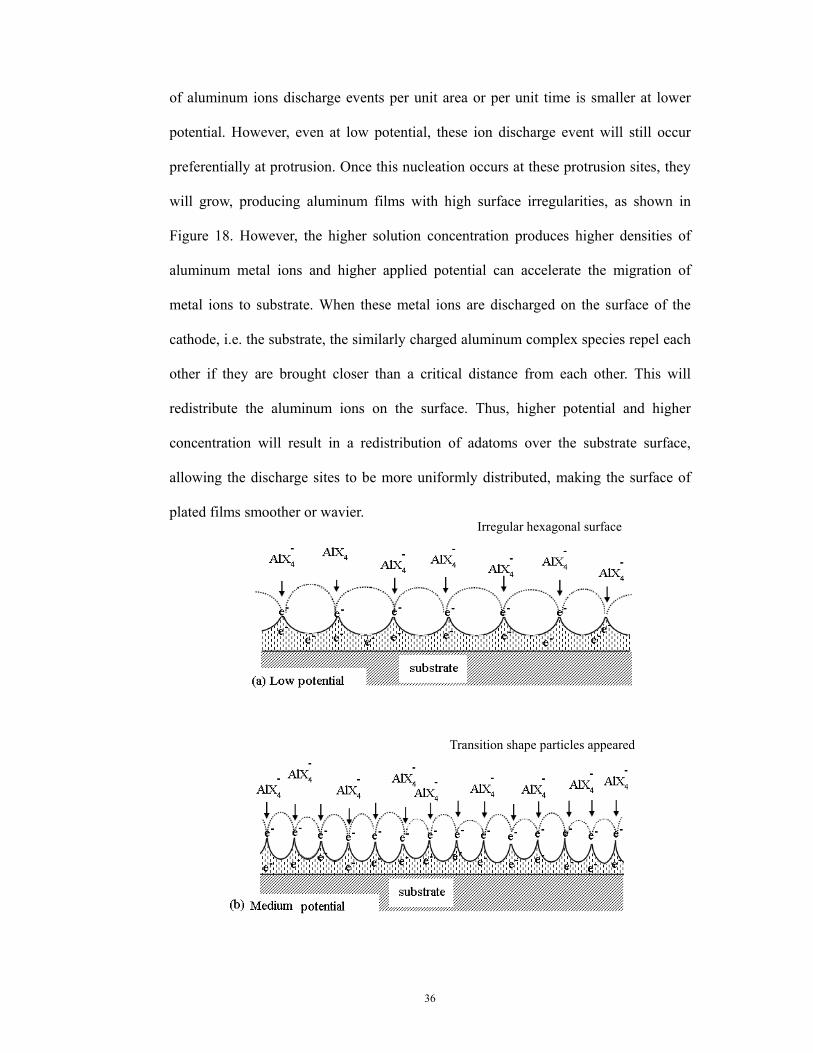
One mechanism, proposed by Watanabe [10], may explain the development of
aluminum microstructures in electroplated films. As depicted in Figure 18, the number
36
Transition shape particles appeared
Irregular hexagonal surface
of aluminum ions discharge events per unit area or per unit time is smaller at lower
potential. However, even at low potential, these ion discharge event will still occur
preferentially at protrusion. Once this nucleation occurs at these protrusion sites, they
will grow, producing aluminum films with high surface irregularities, as shown in
Figure 18. However, the higher solution concentration produces higher densities of
aluminum metal ions and higher applied potential can accelerate the migration of
metal ions to substrate. When these metal ions are discharged on the surface of the
cathode, i.e. the substrate, the similarly charged aluminum complex species repel each
other if they are brought closer than a critical distance from each other. This will
redistribute the aluminum ions on the surface. Thus, higher potential and higher
concentration will result in a redistribution of adatoms over the substrate surface,
allowing the discharge sites to be more uniformly distributed, making the surface of
plated films smoother or wavier.
37
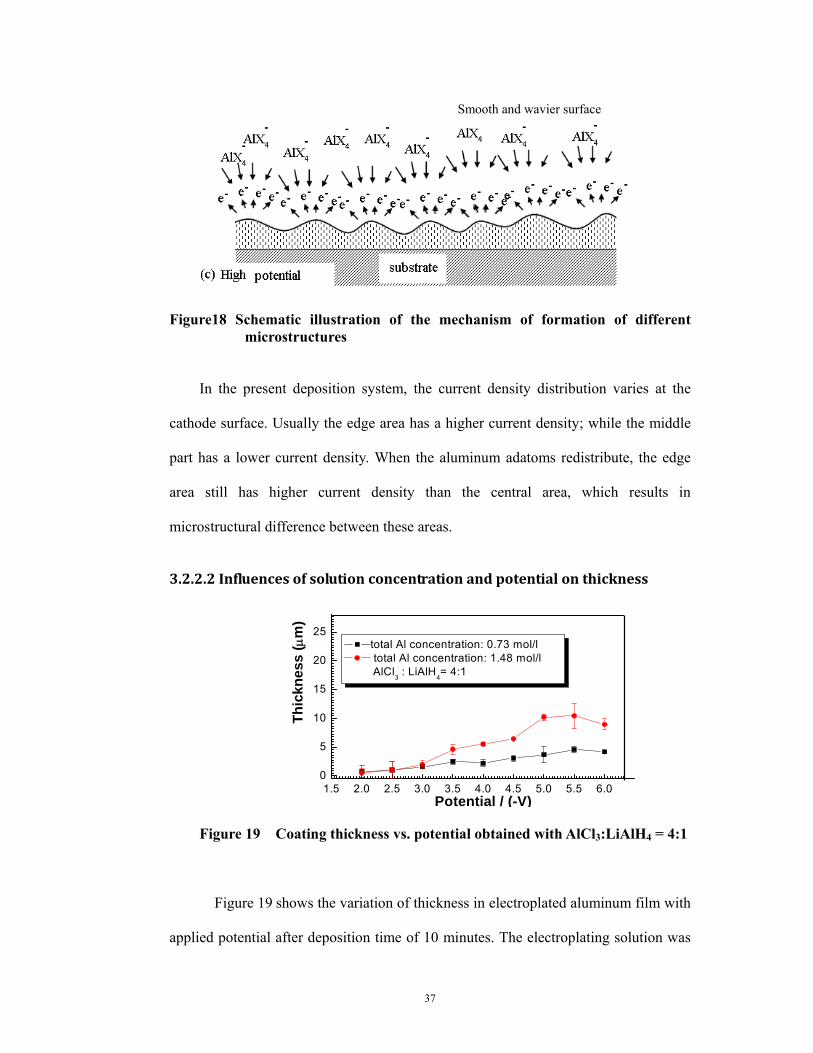
Smooth and wavier surface
Figure18 Schematic illustration of the mechanism of formation of different microstructures
In the present deposition system, the current density distribution varies at the
cathode surface. Usually the edge area has a higher current density; while the middle
part has a lower current density. When the aluminum adatoms redistribute, the edge
area still has higher current density than the central area, which results in
microstructural difference between these areas.
3.2.2.2 Influences of solution concentration and potential on thickness
1.5 2.0 2.5 3.0 3.5 4.0 4.5 5.0 5.5 6.00
5
10
15
20
25
Thic
knes
s (μ
m)
Potential / (-V)
total Al concentration: 0.73 mol/l total Al concentration: 1.48 mol/l
AlCl3 : LiAlH4= 4:1
Figure 19 Coating thickness vs. potential obtained with AlCl3:LiAlH4 = 4:1
Figure 19 shows the variation of thickness in electroplated aluminum film with
applied potential after deposition time of 10 minutes. The electroplating solution was
38
AlCl3 and LiAlH4 solutes dissolved in THF solvent, with the ratio AlCl3 to LiAlH4,
4:1. Two different solution concentrations, 0.73 mol/l and 1.48 mol/l were studied
respectively.
As illustrated in Figure 19, the film thickness increases with an increase of the
aluminum concentration from 0.73 mol/l to 1.48 mol/l around electroplating potential
of -3 V. However, at low applied potential, this trend is not obvious. This might be due
to the fact that the covering power of the deposited aluminum is very low at low
potential; below -3 volts the surface of the sample is not completely covered with
aluminum deposits. This low covering power has already been confirmed by the SEM
images. Starting from -3 V potential, the thickness gradually increases. However, there
is a slight drop after -5.5 V. This drop can be explained because aluminum is mainly
supplied by AlCl3, while the solution conductivity is mainly determined by LiAlH4. At
higher applied potential, the deposition rate is higher. In a Cl- rich solution, (AlCl3:
LiAlH4 = 4:1 > 3:1), the lack of lithium aluminum hydride may lead to a decrease in
conductivity of the solution at higher deposition rates; and thus might cause the
decline of the total aluminum ions reaching the surface. A decrease in the observed
electroplating films thickness may result from this process.
1.5 2.0 2.5 3.0 3.5 4.0 4.5 5.0 5.5 6.00
5
10
15
20
Thic
knes
s (μ
m)
Potential / (- V )
total Al concentration 0.77 mol/l total Al concentration 1.24 mol/l
AlCl3 : LiAlH4 = 3:1
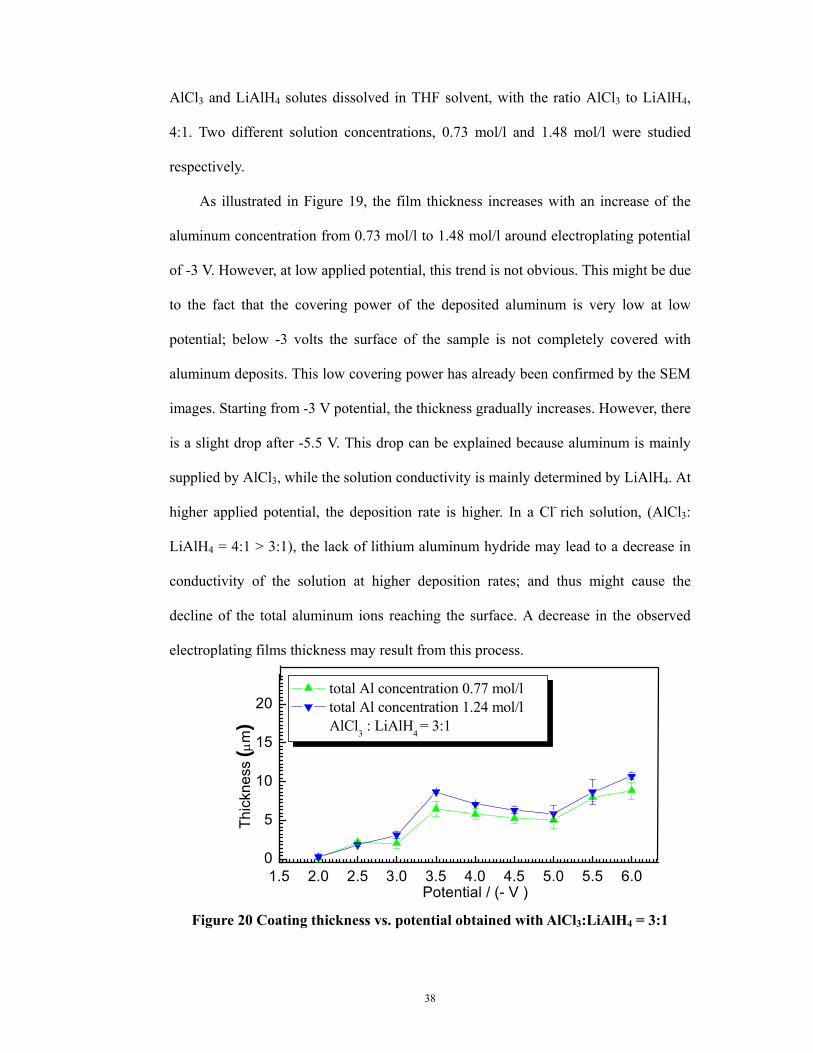
Figure 20 Coating thickness vs. potential obtained with AlCl3:LiAlH4 = 3:1
39
The relationship between the film thickness and potential obtained under the
preciously described conditions (except that the mole ratio of AlCl3 to LiAlH4 is 3:1 in
total aluminum concentrations of 0.77 mol/l and 1.24 mol/l) is depicted in Figure 20.
A similar trend as for 0.77 mol/l was observed in these solutions, e.g. the higher
concentration solution produces the thicker aluminum films in both solutions. An
increase in AlCl3 can essentially increase the film thickness, as more aluminum ions
are deposited on sample surfaces. A peak around -3.5 V is observed, indicating that at
this potential more aluminum ions are deposited. When the potential increased to -5.0
V, there is further increase in film thickness with potential.
As investigated by Lefebvre [5], the species of aluminum complex ions in THF
solution are concentration dependent. The reduction of Al3+ solution species is a
multi-step and multi-electron mechanism. When the potential increases above -5.0 V,
the energy might be so high enough to discharge more different species at the cathode
surface, resulting in a further increase of the film thickness.
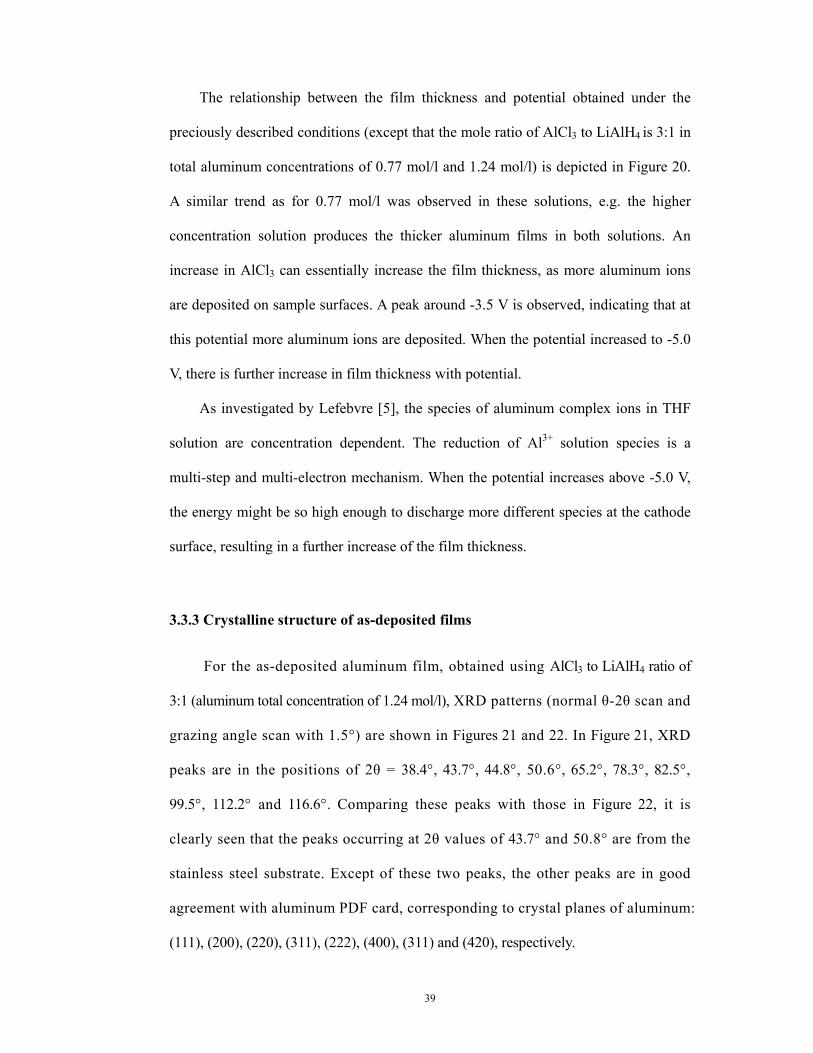
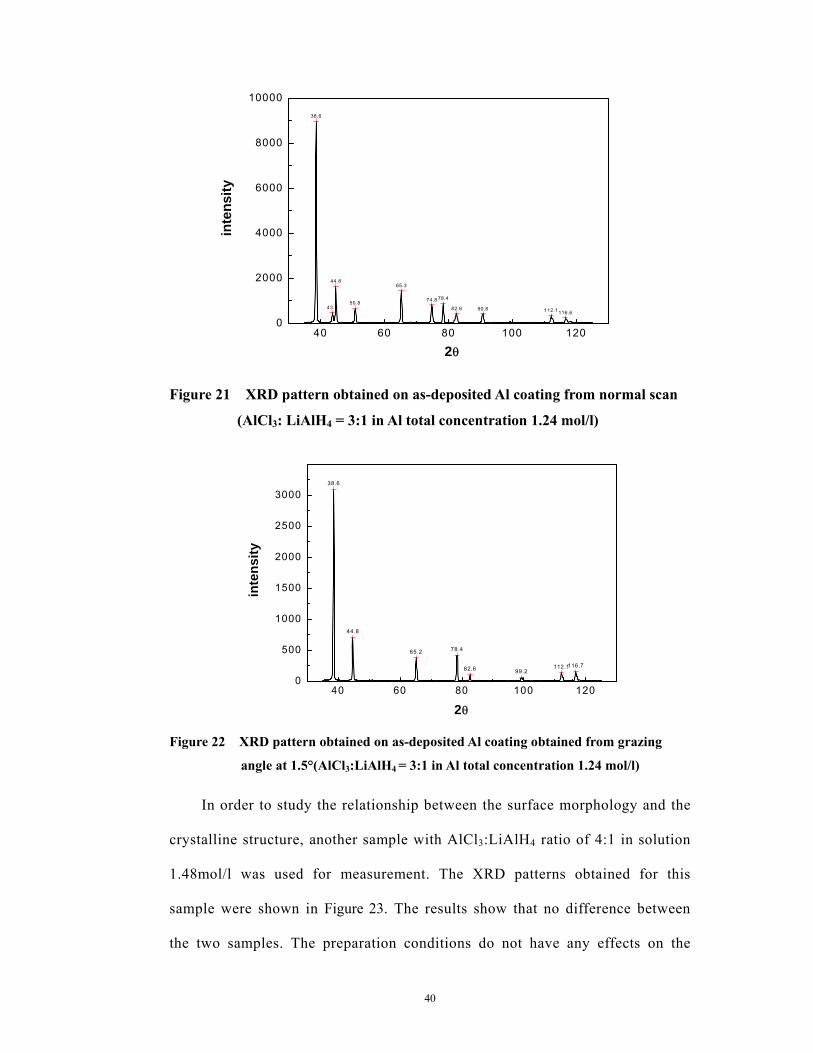
3.3.3 Crystalline structure of as-deposited films
For the as-deposited aluminum film, obtained using AlCl3 to LiAlH4 ratio of
3:1 (aluminum total concentration of 1.24 mol/l), XRD patterns (normal θ-2θ scan and
grazing angle scan with 1.5°) are shown in Figures 21 and 22. In Figure 21, XRD
peaks are in the positions of 2θ = 38.4°, 43.7°, 44.8°, 50.6°, 65.2°, 78.3°, 82.5°,
99.5°, 112.2° and 116.6°. Comparing these peaks with those in Figure 22, it is
clearly seen that the peaks occurring at 2θ values of 43.7° and 50.8° are from the
stainless steel substrate. Except of these two peaks, the other peaks are in good
agreement with aluminum PDF card, corresponding to crystal planes of aluminum:
(111), (200), (220), (311), (222), (400), (311) and (420), respectively.
40
40 60 80 100 1200
2000
4000
6000
8000
1000038.6
43.7
44.8
50.8
65.3
74.8 78.4
82.6 90.8 112.1116.6
inte
nsity
2θ
Figure 21 XRD pattern obtained on as-deposited Al coating from normal scan
(AlCl3: LiAlH4 = 3:1 in Al total concentration 1.24 mol/l)
40 60 80 100 1200
500
1000
1500
2000
2500
300038.6
44.8
65.2 78.4
82.6 99.2112.1116.7
inte
nsity
2θ Figure 22 XRD pattern obtained on as-deposited Al coating obtained from grazing
angle at 1.5°(AlCl3:LiAlH4 = 3:1 in Al total concentration 1.24 mol/l)
In order to study the relationship between the surface morphology and the
crystalline structure, another sample with AlCl3:LiAlH4 ratio of 4:1 in solution
1.48mol/l was used for measurement. The XRD patterns obtained for this
sample were shown in Figure 23. The results show that no difference between
the two samples. The preparation conditions do not have any effects on the
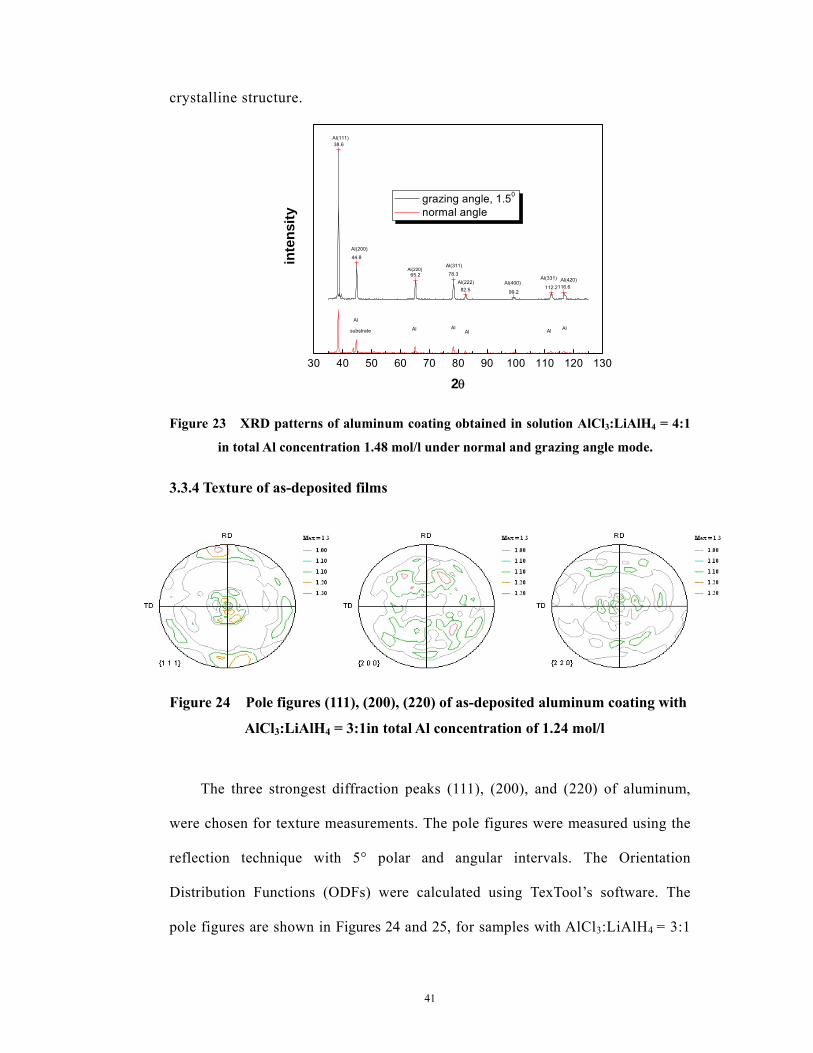
41
crystalline structure.
30 40 50 60 70 80 90 100 110 120 130
38.6
44.8
65.2 78.3
82.5 99.2112.2116.6
AlAlAlAlAl
Al
Al(420)Al(331)Al(400)Al(222)
Al(311)Al(220)
Al(200)
inte
nsity
2θ
grazing angle, 1.50
normal angle
Al(111)
Al
substrate
Figure 23 XRD patterns of aluminum coating obtained in solution AlCl3:LiAlH4 = 4:1
in total Al concentration 1.48 mol/l under normal and grazing angle mode.
3.3.4 Texture of as-deposited films
Figure 24 Pole figures (111), (200), (220) of as-deposited aluminum coating with
AlCl3:LiAlH4 = 3:1in total Al concentration of 1.24 mol/l
The three strongest diffraction peaks (111), (200), and (220) of aluminum,
were chosen for texture measurements. The pole figures were measured using the
reflection technique with 5° polar and angular intervals. The Orientation
Distribution Functions (ODFs) were calculated using TexTool’s software. The
pole figures are shown in Figures 24 and 25, for samples with AlCl3:LiAlH4 = 3:1
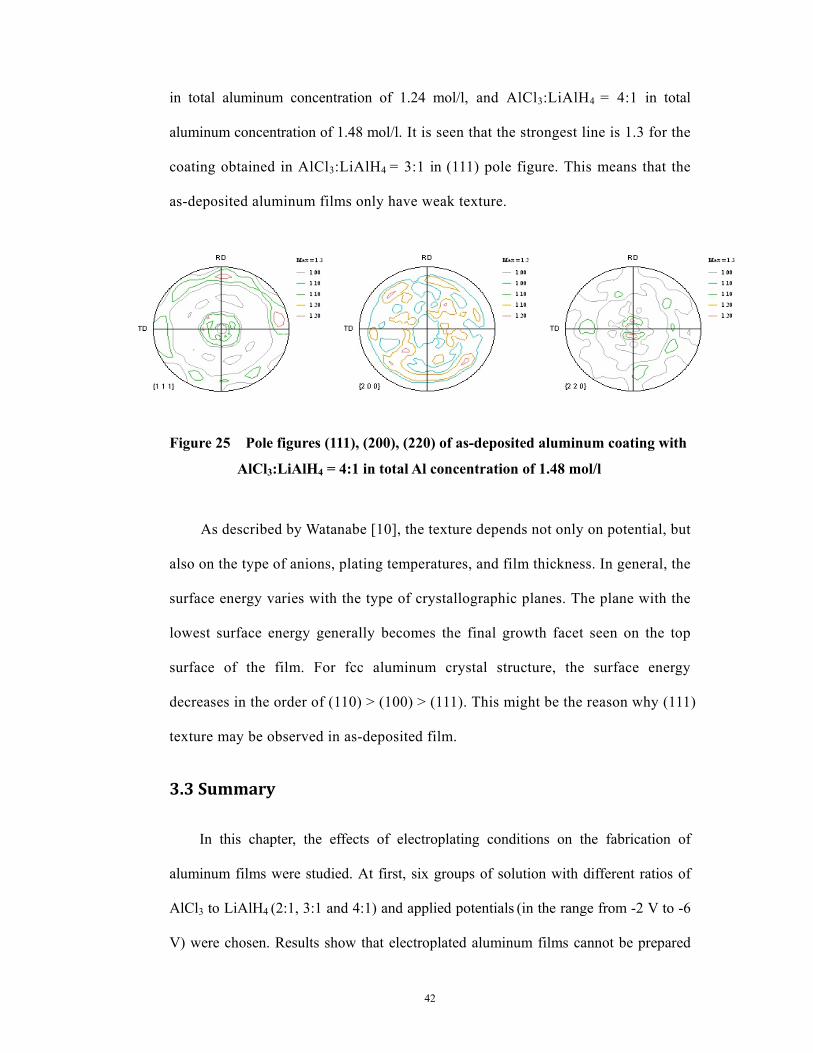
42
in total aluminum concentration of 1.24 mol/l, and AlCl3:LiAlH4 = 4:1 in total
aluminum concentration of 1.48 mol/l. It is seen that the strongest line is 1.3 for the
coating obtained in AlCl3:LiAlH4 = 3:1 in (111) pole figure. This means that the
as-deposited aluminum films only have weak texture.
Figure 25 Pole figures (111), (200), (220) of as-deposited aluminum coating with
AlCl3:LiAlH4 = 4:1 in total Al concentration of 1.48 mol/l
As described by Watanabe [10], the texture depends not only on potential, but
also on the type of anions, plating temperatures, and film thickness. In general, the
surface energy varies with the type of crystallographic planes. The plane with the
lowest surface energy generally becomes the final growth facet seen on the top
surface of the film. For fcc aluminum crystal structure, the surface energy
decreases in the order of (110) > (100) > (111). This might be the reason why (111)
texture may be observed in as-deposited film.
3.3 Summary
In this chapter, the effects of electroplating conditions on the fabrication of
aluminum films were studied. At first, six groups of solution with different ratios of
AlCl3 to LiAlH4 (2:1, 3:1 and 4:1) and applied potentials (in the range from -2 V to -6
V) were chosen. Results show that electroplated aluminum films cannot be prepared
43
under high applied potential and low ratio of AlCl3 to LiAlH4 (2:1). The optimum
experimental for the preparation of homogeneous electroplated aluminum films are in
the applied potential range from -3 V to -4 V and the solution range from 3:1 to 4:1.
The as-prepared polycrystalline aluminum film has a very weak (111) texture.
44
CHAPTER 4 Fabrication of AAO template
Anodic aluminum oxide can be used for corrosion protection, as dielectric
materials in microelectronics applications [35], electronic, magnetic [36,37] and
optical devices [38,39], industry filters [40,41], and bio-devices [42]. It can also be
used as templates in fabricating nano-scale materials [43,44]. In this chapter, we will
study the possibility that deposited aluminum films are used for the preparation of
AAO templates.
There is extensive literature on fabrication of AAO templates on aluminum foils.
However, for the anodic alumina obtained by anodizing electrodeposited aluminum,
no study has been conducted. For comparison and better understanding of anodization
process, the anodization of commercial available aluminum foil is also studied. The
main purposes of this chapter are to study the influence of electrochemical conditions
on the formation and morphology of AAO templates obtained by as-deposited
aluminum and to prepare AAO templates for further fabrication of nano-structured
palladium membranes.
4.1 Experimental procedure
Anodization of as-deposited aluminum films is the second step for the fabrication of
nano-structured palladium membranes. Effects of the anodization behavior of
electroplated aluminum, the microstructure and the etching time on the formation of AAO
template were studied so that we can obtain optimum preparation condition. At the same
time, in order to in depth understand the formation process in AAO template, some
anodization experiments were done using aluminum foils.
45
4.1.1 AAO template fabricated on aluminum foils
In order to obtain the optimal conditions to guide the anodization of as-deposited
aluminum films, three groups of experiments were first done on aluminum foils. The
aluminum foil was purchased from Alfa Aesar, with a purity of 99% and 0.025 mm in
thickness. All the samples were cut into 30×15 mm pieces, cleaned using acetone
solution with a piece of cotton, gently rinsed with distilled water, and finally dried
with a hand dryer.
The experiments in first group were performed with varying anodizing time at a
constant potential of 35 V in 0.3 M oxalic acid solution to study the effect of the
anodizing time on oxide morphology. The other experiments were carried out in 0.3 M
(group 2) and 0.6 M (group 3) oxalic acid solution with changing anodizing voltage
from 30 V to 55 V at 5 V interval at room temperature, employing the electrochemical
cell shown in Figure 26.
This cell contains a 1 cm diameter opening where the aluminum foil was placed
for anodization using a DC voltage source. A rubber o-ring made the opening
watertight to prevent the electrolyte from leaking. A long conductive plate was placed
on the back of aluminum foil in order to connect to the alligator clip at the positive
terminal. A spiral platinum wire was used as a cathode.
After anodization, the remaining aluminum on the back of the anodized samples
was removed using a tin (IV) chloride anhydrous solution supplied by Fisher, and then
oxide specimen were rinsed with water and dried. The morphology and the thickness
of the cross section were observed using a Philips XL30 FEG-SEM. Effects of
concentration and applied voltage on anodizing rate were determined.
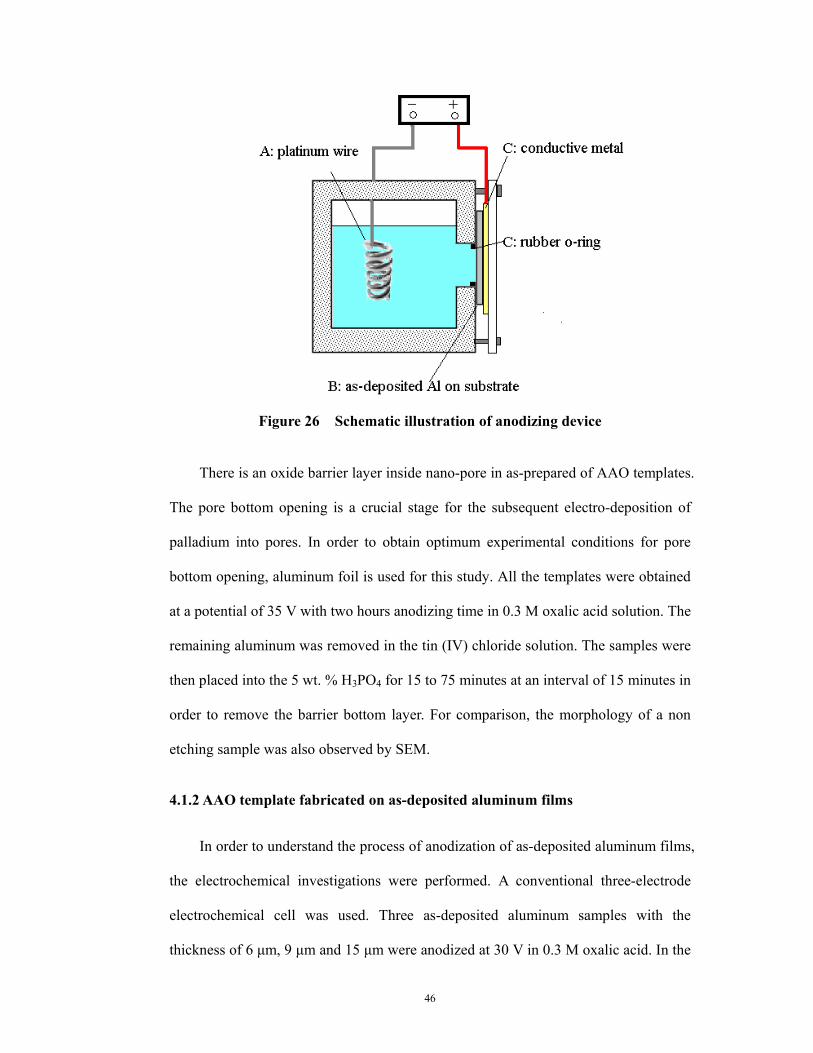
46
Figure 26 Schematic illustration of anodizing device
There is an oxide barrier layer inside nano-pore in as-prepared of AAO templates.
The pore bottom opening is a crucial stage for the subsequent electro-deposition of
palladium into pores. In order to obtain optimum experimental conditions for pore
bottom opening, aluminum foil is used for this study. All the templates were obtained
at a potential of 35 V with two hours anodizing time in 0.3 M oxalic acid solution. The
remaining aluminum was removed in the tin (IV) chloride solution. The samples were
then placed into the 5 wt. % H3PO4 for 15 to 75 minutes at an interval of 15 minutes in
order to remove the barrier bottom layer. For comparison, the morphology of a non
etching sample was also observed by SEM.
4.1.2 AAO template fabricated on as-deposited aluminum films
In order to understand the process of anodization of as-deposited aluminum films,
the electrochemical investigations were performed. A conventional three-electrode
electrochemical cell was used. Three as-deposited aluminum samples with the
thickness of 6 μm, 9 μm and 15 μm were anodized at 30 V in 0.3 M oxalic acid. In the
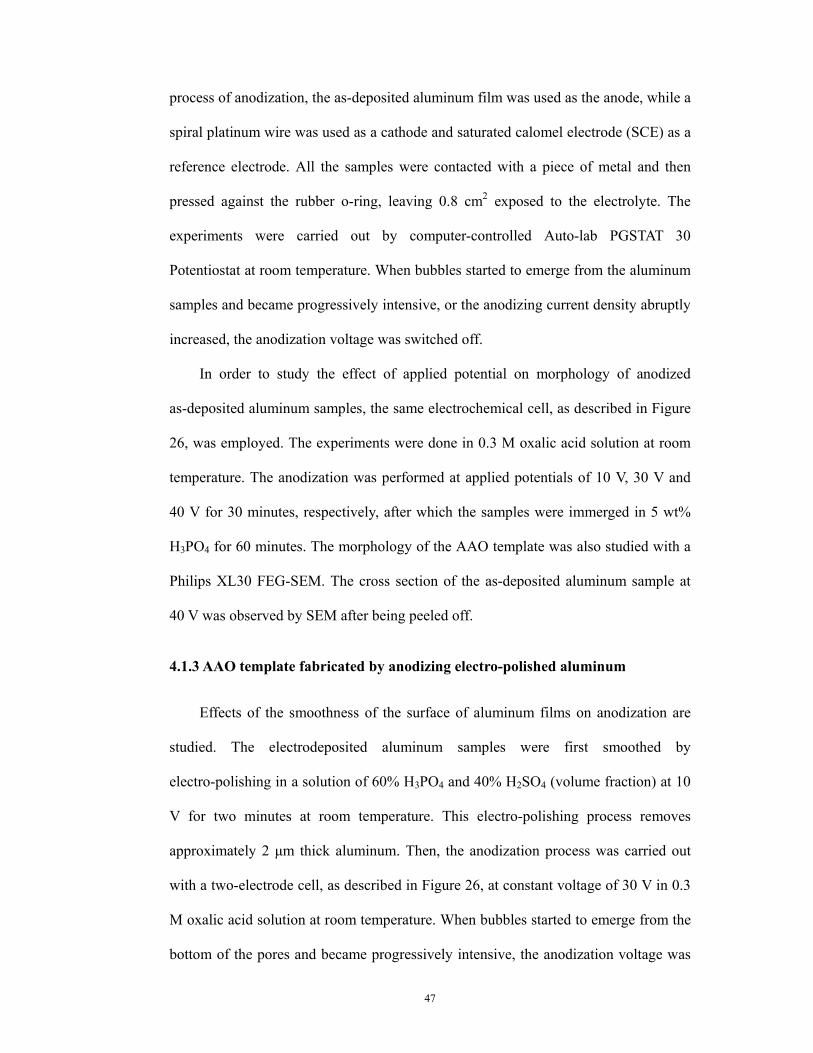
47
process of anodization, the as-deposited aluminum film was used as the anode, while a
spiral platinum wire was used as a cathode and saturated calomel electrode (SCE) as a
reference electrode. All the samples were contacted with a piece of metal and then
pressed against the rubber o-ring, leaving 0.8 cm2 exposed to the electrolyte. The
experiments were carried out by computer-controlled Auto-lab PGSTAT 30
Potentiostat at room temperature. When bubbles started to emerge from the aluminum
samples and became progressively intensive, or the anodizing current density abruptly
increased, the anodization voltage was switched off.
In order to study the effect of applied potential on morphology of anodized
as-deposited aluminum samples, the same electrochemical cell, as described in Figure
26, was employed. The experiments were done in 0.3 M oxalic acid solution at room
temperature. The anodization was performed at applied potentials of 10 V, 30 V and
40 V for 30 minutes, respectively, after which the samples were immerged in 5 wt%
H3PO4 for 60 minutes. The morphology of the AAO template was also studied with a
Philips XL30 FEG-SEM. The cross section of the as-deposited aluminum sample at
40 V was observed by SEM after being peeled off.
4.1.3 AAO template fabricated by anodizing electro-polished aluminum
Effects of the smoothness of the surface of aluminum films on anodization are
studied. The electrodeposited aluminum samples were first smoothed by
electro-polishing in a solution of 60% H3PO4 and 40% H2SO4 (volume fraction) at 10
V for two minutes at room temperature. This electro-polishing process removes
approximately 2 μm thick aluminum. Then, the anodization process was carried out
with a two-electrode cell, as described in Figure 26, at constant voltage of 30 V in 0.3
M oxalic acid solution at room temperature. When bubbles started to emerge from the
bottom of the pores and became progressively intensive, the anodization voltage was
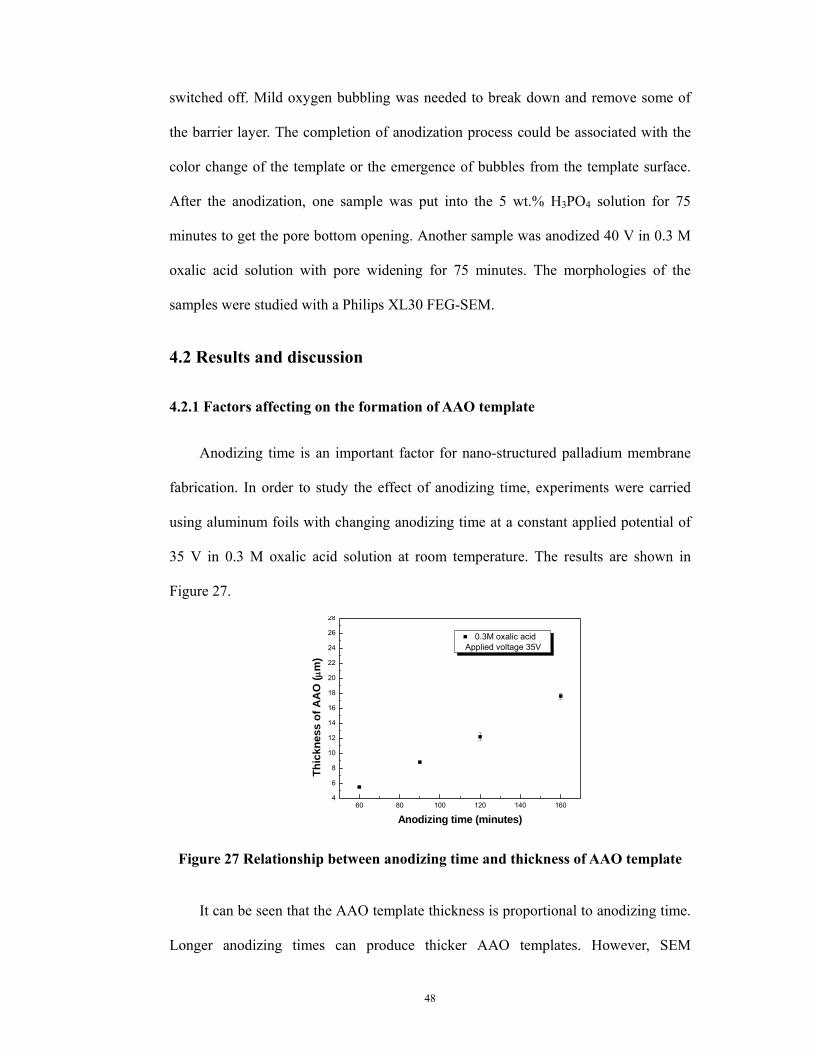
48
switched off. Mild oxygen bubbling was needed to break down and remove some of
the barrier layer. The completion of anodization process could be associated with the
color change of the template or the emergence of bubbles from the template surface.
After the anodization, one sample was put into the 5 wt.% H3PO4 solution for 75
minutes to get the pore bottom opening. Another sample was anodized 40 V in 0.3 M
oxalic acid solution with pore widening for 75 minutes. The morphologies of the
samples were studied with a Philips XL30 FEG-SEM.
4.2 Results and discussion
4.2.1 Factors affecting on the formation of AAO template
Anodizing time is an important factor for nano-structured palladium membrane
fabrication. In order to study the effect of anodizing time, experiments were carried
using aluminum foils with changing anodizing time at a constant applied potential of
35 V in 0.3 M oxalic acid solution at room temperature. The results are shown in
Figure 27.
60 80 100 120 140 1604
6
8
10
12
14
16
18
20
22
24
26
28
Thic
knes
s of
AA
O (μ
m)
Anodizing time (minutes)
0.3M oxalic acid Applied voltage 35V
Figure 27 Relationship between anodizing time and thickness of AAO template
It can be seen that the AAO template thickness is proportional to anodizing time.
Longer anodizing times can produce thicker AAO templates. However, SEM
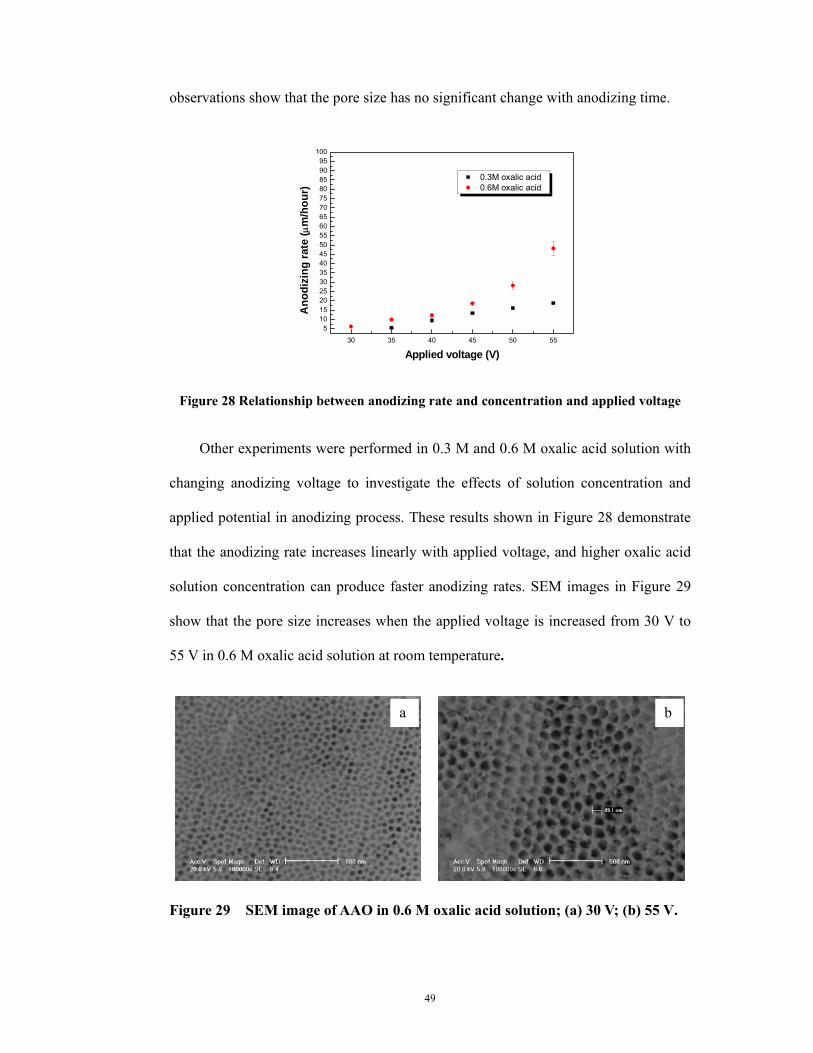
49
observations show that the pore size has no significant change with anodizing time.
30 35 40 45 50 55
5101520253035404550556065707580859095
100
Ano
dizi
ng ra
te (μ
m/h
our)
Applied voltage (V)
0.3M oxalic acid 0.6M oxalic acid
Figure 28 Relationship between anodizing rate and concentration and applied voltage
Other experiments were performed in 0.3 M and 0.6 M oxalic acid solution with
changing anodizing voltage to investigate the effects of solution concentration and
applied potential in anodizing process. These results shown in Figure 28 demonstrate
that the anodizing rate increases linearly with applied voltage, and higher oxalic acid
solution concentration can produce faster anodizing rates. SEM images in Figure 29
show that the pore size increases when the applied voltage is increased from 30 V to
55 V in 0.6 M oxalic acid solution at room temperature.
Figure 29 SEM image of AAO in 0.6 M oxalic acid solution; (a) 30 V; (b) 55 V.
a b
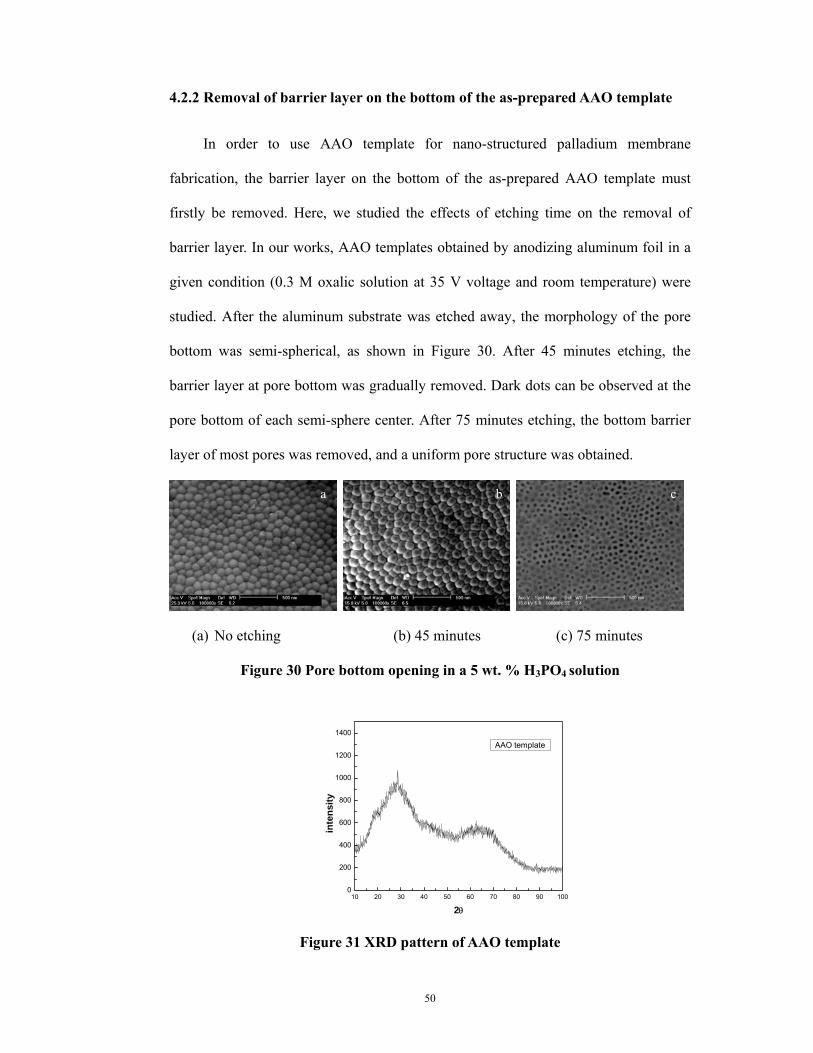
50
4.2.2 Removal of barrier layer on the bottom of the as-prepared AAO template
In order to use AAO template for nano-structured palladium membrane
fabrication, the barrier layer on the bottom of the as-prepared AAO template must
firstly be removed. Here, we studied the effects of etching time on the removal of
barrier layer. In our works, AAO templates obtained by anodizing aluminum foil in a
given condition (0.3 M oxalic solution at 35 V voltage and room temperature) were
studied. After the aluminum substrate was etched away, the morphology of the pore
bottom was semi-spherical, as shown in Figure 30. After 45 minutes etching, the
barrier layer at pore bottom was gradually removed. Dark dots can be observed at the
pore bottom of each semi-sphere center. After 75 minutes etching, the bottom barrier
layer of most pores was removed, and a uniform pore structure was obtained.
(a) No etching (b) 45 minutes (c) 75 minutes
Figure 30 Pore bottom opening in a 5 wt. % H3PO4 solution
10 20 30 40 50 60 70 80 90 100
0
200
400
600
800
1000
1200
1400
inte
nsity
2θ
AAO template
Figure 31 XRD pattern of AAO template
a b c
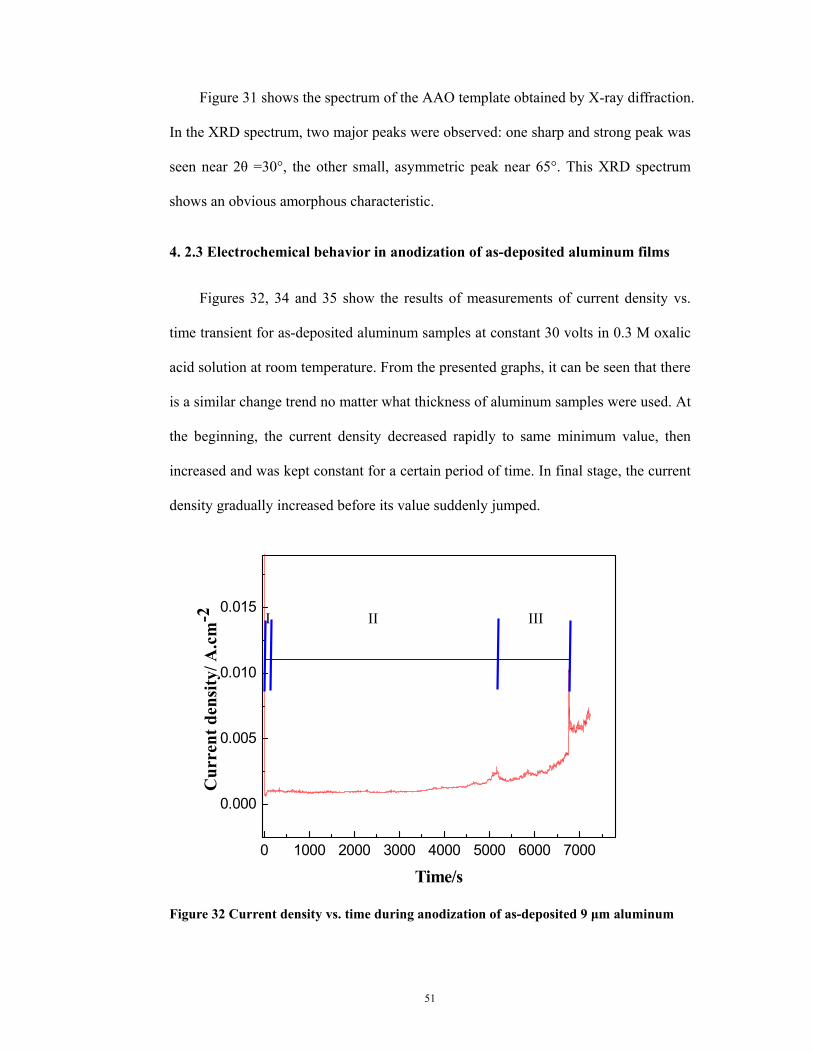
51
Figure 31 shows the spectrum of the AAO template obtained by X-ray diffraction.
In the XRD spectrum, two major peaks were observed: one sharp and strong peak was
seen near 2θ =30°, the other small, asymmetric peak near 65°. This XRD spectrum
shows an obvious amorphous characteristic.
4. 2.3 Electrochemical behavior in anodization of as-deposited aluminum films
Figures 32, 34 and 35 show the results of measurements of current density vs.
time transient for as-deposited aluminum samples at constant 30 volts in 0.3 M oxalic
acid solution at room temperature. From the presented graphs, it can be seen that there
is a similar change trend no matter what thickness of aluminum samples were used. At
the beginning, the current density decreased rapidly to same minimum value, then
increased and was kept constant for a certain period of time. In final stage, the current
density gradually increased before its value suddenly jumped.
0 1000 2000 3000 4000 5000 6000 7000
0.000
0.005
0.010
0.015
Cur
rent
den
sity
/ A.c
m-2
Time/s Figure 32 Current density vs. time during anodization of as-deposited 9 μm aluminum
I II III
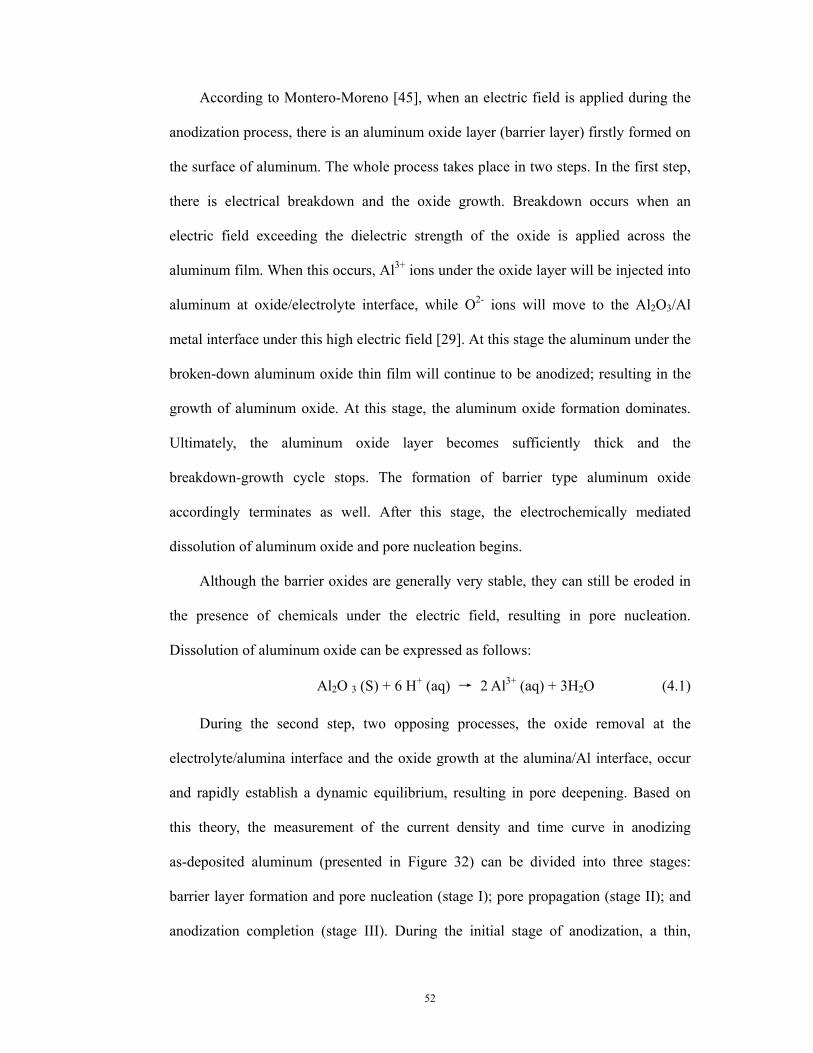
52
According to Montero-Moreno [45], when an electric field is applied during the
anodization process, there is an aluminum oxide layer (barrier layer) firstly formed on
the surface of aluminum. The whole process takes place in two steps. In the first step,
there is electrical breakdown and the oxide growth. Breakdown occurs when an
electric field exceeding the dielectric strength of the oxide is applied across the
aluminum film. When this occurs, Al3+ ions under the oxide layer will be injected into
aluminum at oxide/electrolyte interface, while O2- ions will move to the Al2O3/Al
metal interface under this high electric field [29]. At this stage the aluminum under the
broken-down aluminum oxide thin film will continue to be anodized; resulting in the
growth of aluminum oxide. At this stage, the aluminum oxide formation dominates.
Ultimately, the aluminum oxide layer becomes sufficiently thick and the
breakdown-growth cycle stops. The formation of barrier type aluminum oxide
accordingly terminates as well. After this stage, the electrochemically mediated
dissolution of aluminum oxide and pore nucleation begins.
Although the barrier oxides are generally very stable, they can still be eroded in
the presence of chemicals under the electric field, resulting in pore nucleation.
Dissolution of aluminum oxide can be expressed as follows:
Al2O 3 (S) + 6 H+ (aq) → 2 Al3+ (aq) + 3H2O (4.1)
During the second step, two opposing processes, the oxide removal at the
electrolyte/alumina interface and the oxide growth at the alumina/Al interface, occur
and rapidly establish a dynamic equilibrium, resulting in pore deepening. Based on
this theory, the measurement of the current density and time curve in anodizing
as-deposited aluminum (presented in Figure 32) can be divided into three stages:
barrier layer formation and pore nucleation (stage I); pore propagation (stage II); and
anodization completion (stage III). During the initial stage of anodization, a thin,
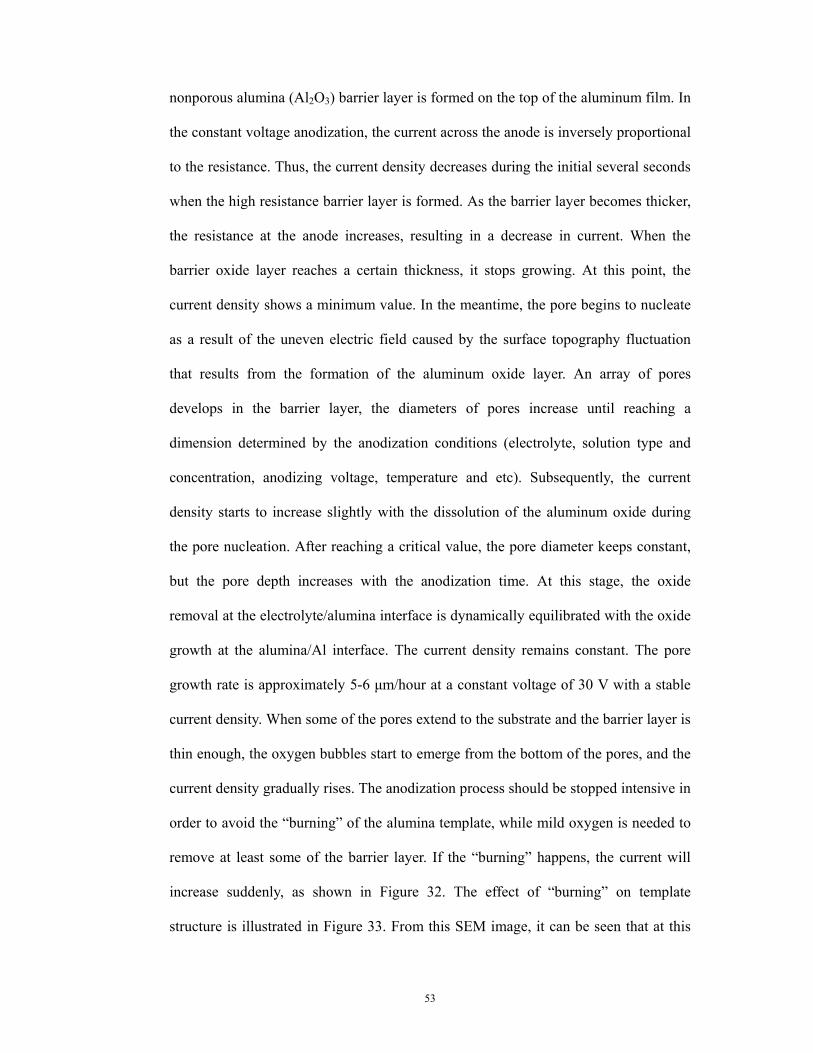
53
nonporous alumina (Al2O3) barrier layer is formed on the top of the aluminum film. In
the constant voltage anodization, the current across the anode is inversely proportional
to the resistance. Thus, the current density decreases during the initial several seconds
when the high resistance barrier layer is formed. As the barrier layer becomes thicker,
the resistance at the anode increases, resulting in a decrease in current. When the
barrier oxide layer reaches a certain thickness, it stops growing. At this point, the
current density shows a minimum value. In the meantime, the pore begins to nucleate
as a result of the uneven electric field caused by the surface topography fluctuation
that results from the formation of the aluminum oxide layer. An array of pores
develops in the barrier layer, the diameters of pores increase until reaching a
dimension determined by the anodization conditions (electrolyte, solution type and
concentration, anodizing voltage, temperature and etc). Subsequently, the current
density starts to increase slightly with the dissolution of the aluminum oxide during
the pore nucleation. After reaching a critical value, the pore diameter keeps constant,
but the pore depth increases with the anodization time. At this stage, the oxide
removal at the electrolyte/alumina interface is dynamically equilibrated with the oxide
growth at the alumina/Al interface. The current density remains constant. The pore
growth rate is approximately 5-6 μm/hour at a constant voltage of 30 V with a stable
current density. When some of the pores extend to the substrate and the barrier layer is
thin enough, the oxygen bubbles start to emerge from the bottom of the pores, and the
current density gradually rises. The anodization process should be stopped intensive in
order to avoid the “burning” of the alumina template, while mild oxygen is needed to
remove at least some of the barrier layer. If the “burning” happens, the current will
increase suddenly, as shown in Figure 32. The effect of “burning” on template
structure is illustrated in Figure 33. From this SEM image, it can be seen that at this
54
time, there are some big holes formed in the template although most of the areas still
consists of nano-size pores.
Figure 33 SEM image of template fabrication with “burning”
0 500 1000 1500 2000 2500 3000 3500 4000 45000.000
0.002
0.004
0.006
0.008
0.010
0.012
0.014
0.016
Cur
rent
den
sity
/A.c
m-2
Time/s
Figure 34 Current density vs. time during anodization of as-deposited 6 μm aluminum
Figures 34 and 35 show the graphs of current density vs. time during anodization
of as-deposited aluminum samples with the thickness of 6 μm and 15 μm, respectively.
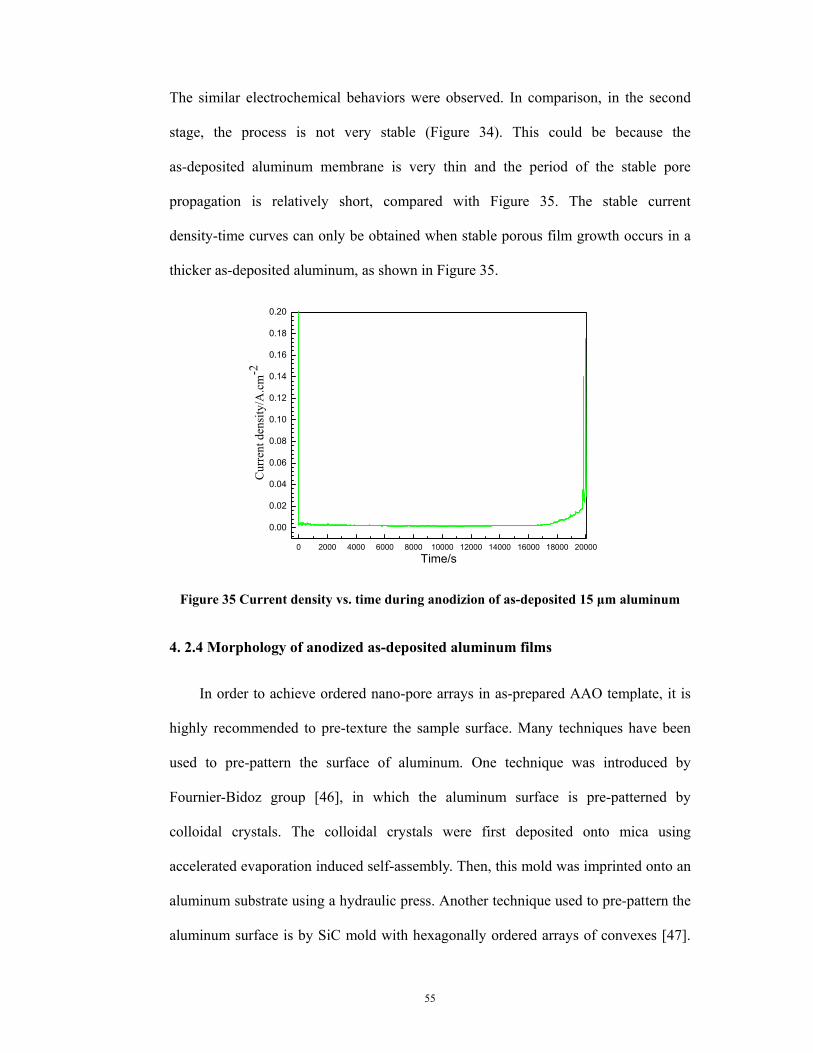
55
The similar electrochemical behaviors were observed. In comparison, in the second
stage, the process is not very stable (Figure 34). This could be because the
as-deposited aluminum membrane is very thin and the period of the stable pore
propagation is relatively short, compared with Figure 35. The stable current
density-time curves can only be obtained when stable porous film growth occurs in a
thicker as-deposited aluminum, as shown in Figure 35.
0 2000 4000 6000 8000 10000 12000 14000 16000 18000 20000
0.00
0.02
0.04
0.06
0.08
0.10
0.12
0.14
0.16
0.18
0.20
Cur
rent
den
sity
/A.c
m-2
Time/s
Figure 35 Current density vs. time during anodizion of as-deposited 15 μm aluminum
4. 2.4 Morphology of anodized as-deposited aluminum films
In order to achieve ordered nano-pore arrays in as-prepared AAO template, it is
highly recommended to pre-texture the sample surface. Many techniques have been
used to pre-pattern the surface of aluminum. One technique was introduced by
Fournier-Bidoz group [46], in which the aluminum surface is pre-patterned by
colloidal crystals. The colloidal crystals were first deposited onto mica using
accelerated evaporation induced self-assembly. Then, this mold was imprinted onto an
aluminum substrate using a hydraulic press. Another technique used to pre-pattern the
aluminum surface is by SiC mold with hexagonally ordered arrays of convexes [47].
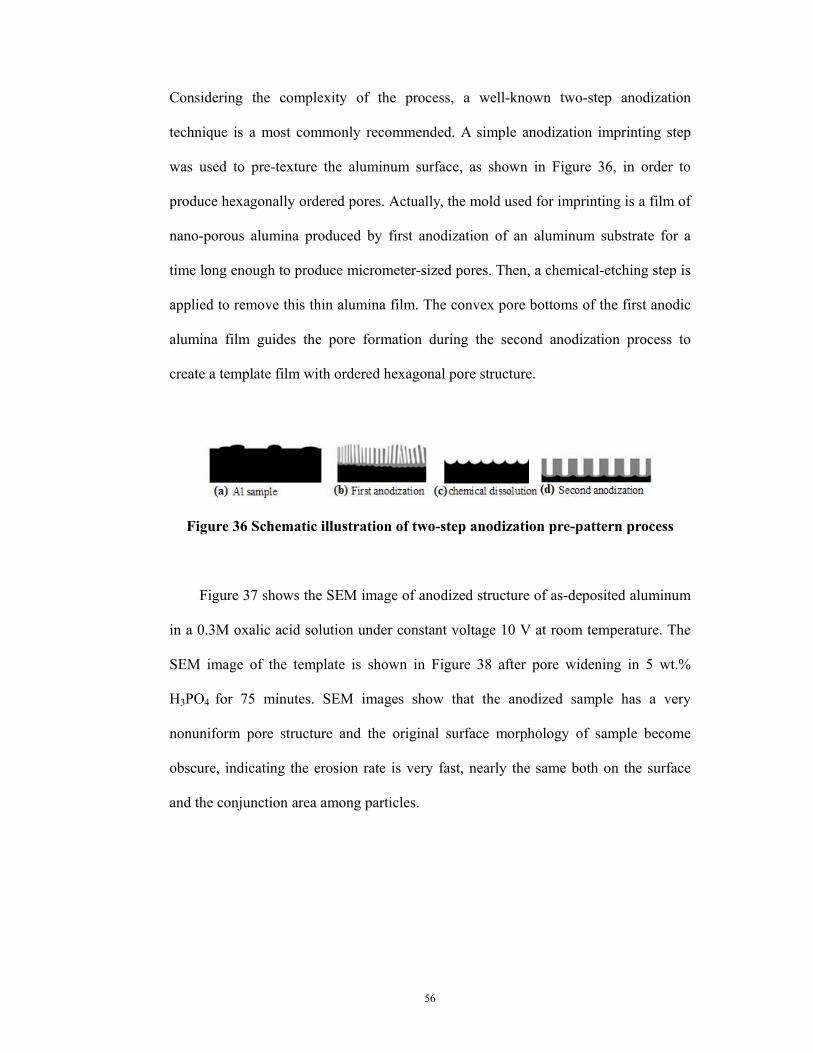
56
Considering the complexity of the process, a well-known two-step anodization
technique is a most commonly recommended. A simple anodization imprinting step
was used to pre-texture the aluminum surface, as shown in Figure 36, in order to
produce hexagonally ordered pores. Actually, the mold used for imprinting is a film of
nano-porous alumina produced by first anodization of an aluminum substrate for a
time long enough to produce micrometer-sized pores. Then, a chemical-etching step is
applied to remove this thin alumina film. The convex pore bottoms of the first anodic
alumina film guides the pore formation during the second anodization process to
create a template film with ordered hexagonal pore structure.
Figure 36 Schematic illustration of two-step anodization pre-pattern process
Figure 37 shows the SEM image of anodized structure of as-deposited aluminum
in a 0.3M oxalic acid solution under constant voltage 10 V at room temperature. The
SEM image of the template is shown in Figure 38 after pore widening in 5 wt.%
H3PO4 for 75 minutes. SEM images show that the anodized sample has a very
nonuniform pore structure and the original surface morphology of sample become
obscure, indicating the erosion rate is very fast, nearly the same both on the surface
and the conjunction area among particles.
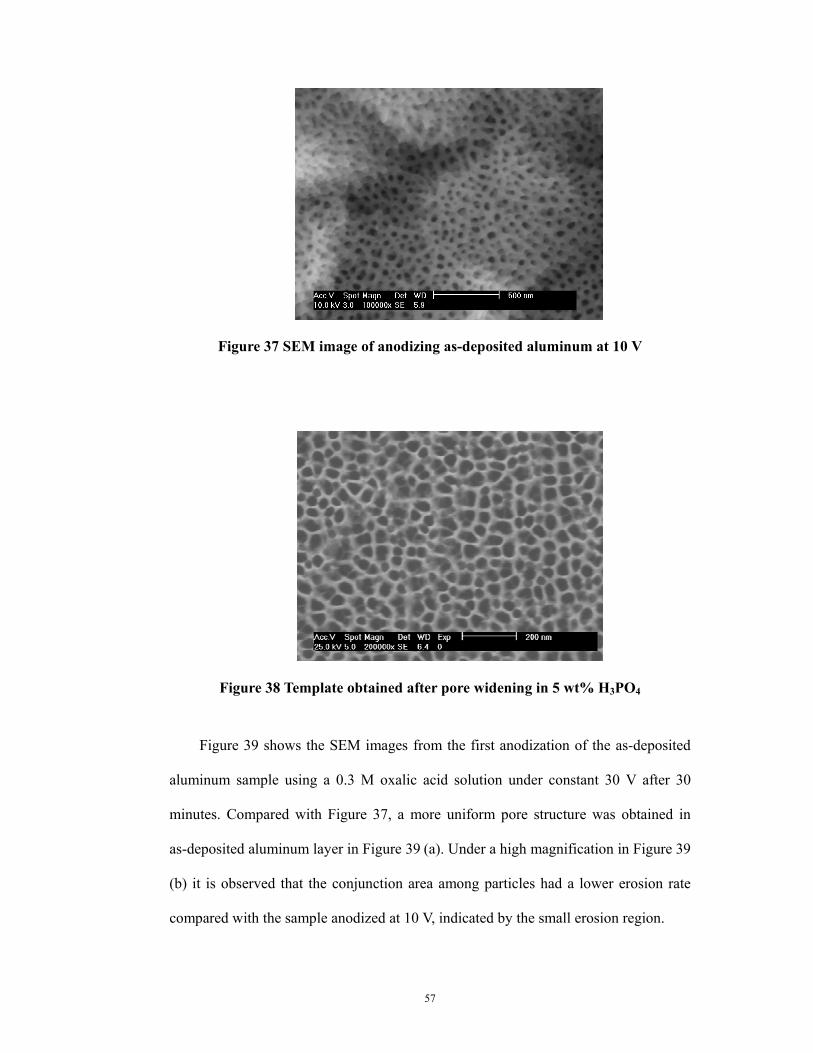
57
Figure 37 SEM image of anodizing as-deposited aluminum at 10 V
Figure 38 Template obtained after pore widening in 5 wt% H3PO4
Figure 39 shows the SEM images from the first anodization of the as-deposited
aluminum sample using a 0.3 M oxalic acid solution under constant 30 V after 30
minutes. Compared with Figure 37, a more uniform pore structure was obtained in
as-deposited aluminum layer in Figure 39 (a). Under a high magnification in Figure 39
(b) it is observed that the conjunction area among particles had a lower erosion rate
compared with the sample anodized at 10 V, indicated by the small erosion region.
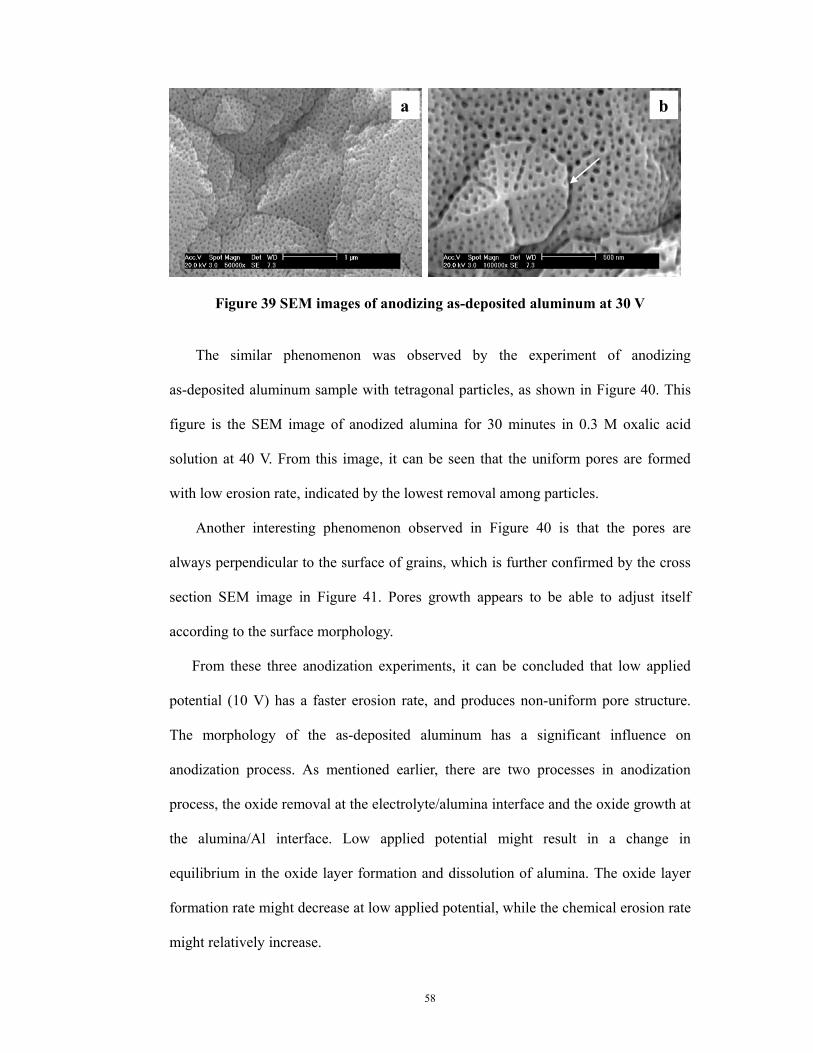
58
Figure 39 SEM images of anodizing as-deposited aluminum at 30 V
The similar phenomenon was observed by the experiment of anodizing
as-deposited aluminum sample with tetragonal particles, as shown in Figure 40. This
figure is the SEM image of anodized alumina for 30 minutes in 0.3 M oxalic acid
solution at 40 V. From this image, it can be seen that the uniform pores are formed
with low erosion rate, indicated by the lowest removal among particles.
Another interesting phenomenon observed in Figure 40 is that the pores are
always perpendicular to the surface of grains, which is further confirmed by the cross
section SEM image in Figure 41. Pores growth appears to be able to adjust itself
according to the surface morphology.
From these three anodization experiments, it can be concluded that low applied
potential (10 V) has a faster erosion rate, and produces non-uniform pore structure.
The morphology of the as-deposited aluminum has a significant influence on
anodization process. As mentioned earlier, there are two processes in anodization
process, the oxide removal at the electrolyte/alumina interface and the oxide growth at
the alumina/Al interface. Low applied potential might result in a change in
equilibrium in the oxide layer formation and dissolution of alumina. The oxide layer
formation rate might decrease at low applied potential, while the chemical erosion rate
might relatively increase.
a b
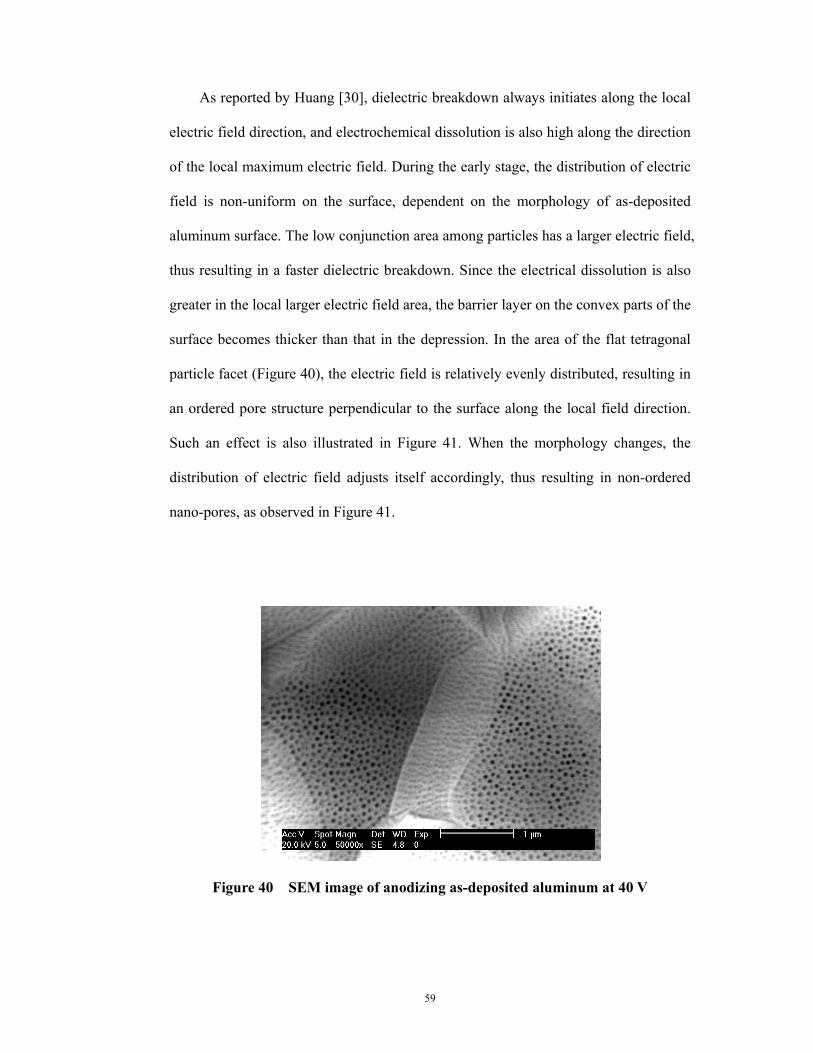
59
As reported by Huang [30], dielectric breakdown always initiates along the local
electric field direction, and electrochemical dissolution is also high along the direction
of the local maximum electric field. During the early stage, the distribution of electric
field is non-uniform on the surface, dependent on the morphology of as-deposited
aluminum surface. The low conjunction area among particles has a larger electric field,
thus resulting in a faster dielectric breakdown. Since the electrical dissolution is also
greater in the local larger electric field area, the barrier layer on the convex parts of the
surface becomes thicker than that in the depression. In the area of the flat tetragonal
particle facet (Figure 40), the electric field is relatively evenly distributed, resulting in
an ordered pore structure perpendicular to the surface along the local field direction.
Such an effect is also illustrated in Figure 41. When the morphology changes, the
distribution of electric field adjusts itself accordingly, thus resulting in non-ordered
nano-pores, as observed in Figure 41.
Figure 40 SEM image of anodizing as-deposited aluminum at 40 V
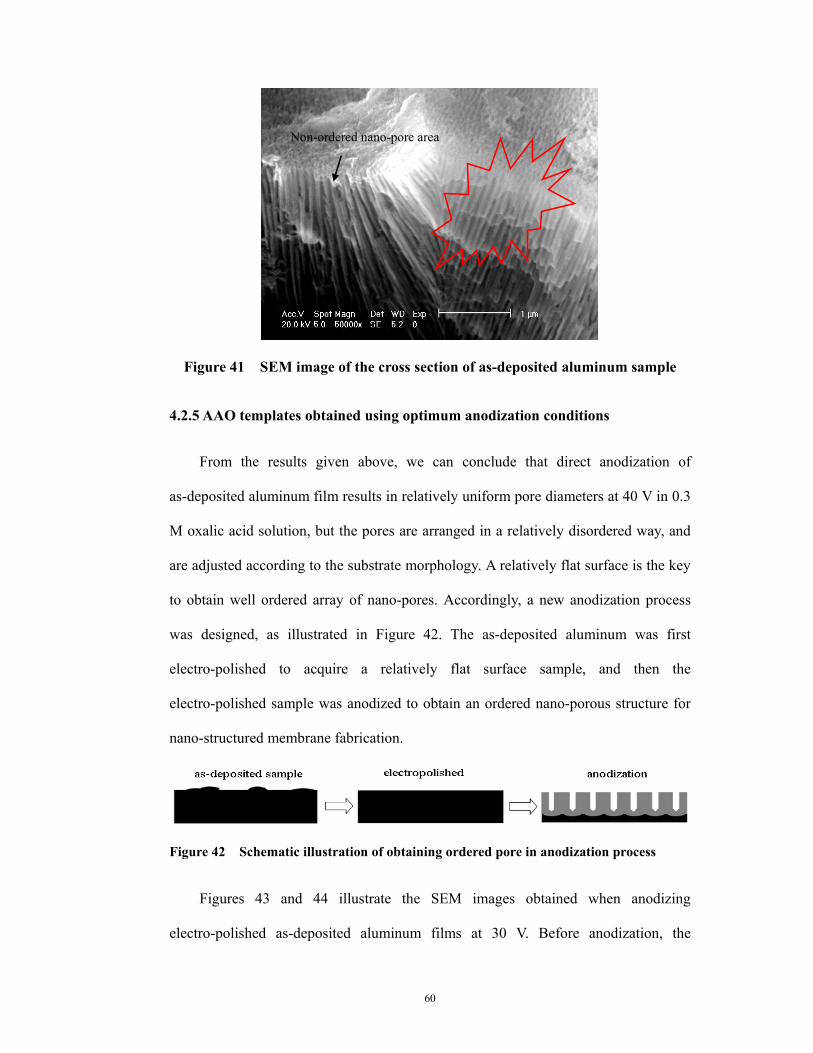
60
Figure 41 SEM image of the cross section of as-deposited aluminum sample
4.2.5 AAO templates obtained using optimum anodization conditions
From the results given above, we can conclude that direct anodization of
as-deposited aluminum film results in relatively uniform pore diameters at 40 V in 0.3
M oxalic acid solution, but the pores are arranged in a relatively disordered way, and
are adjusted according to the substrate morphology. A relatively flat surface is the key
to obtain well ordered array of nano-pores. Accordingly, a new anodization process
was designed, as illustrated in Figure 42. The as-deposited aluminum was first
electro-polished to acquire a relatively flat surface sample, and then the
electro-polished sample was anodized to obtain an ordered nano-porous structure for
nano-structured membrane fabrication.
Figure 42 Schematic illustration of obtaining ordered pore in anodization process
Figures 43 and 44 illustrate the SEM images obtained when anodizing
electro-polished as-deposited aluminum films at 30 V. Before anodization, the
Non-ordered nano-pore area
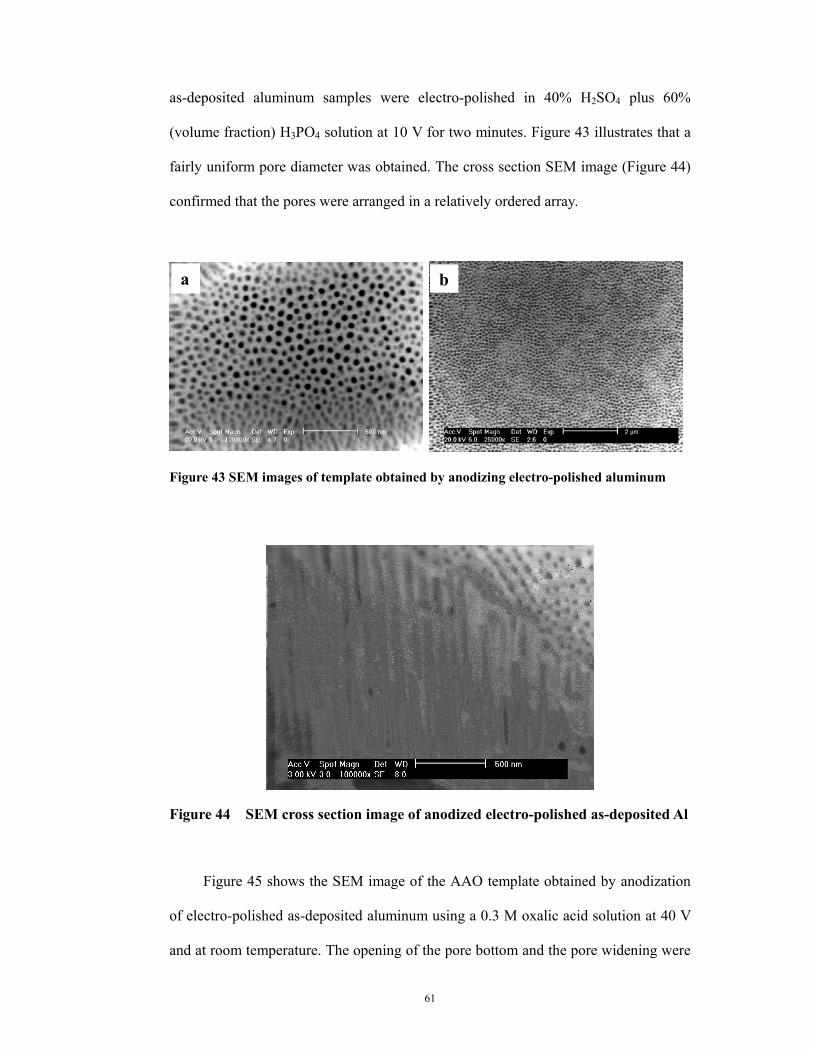
61
as-deposited aluminum samples were electro-polished in 40% H2SO4 plus 60%
(volume fraction) H3PO4 solution at 10 V for two minutes. Figure 43 illustrates that a
fairly uniform pore diameter was obtained. The cross section SEM image (Figure 44)
confirmed that the pores were arranged in a relatively ordered array.
Figure 43 SEM images of template obtained by anodizing electro-polished aluminum
Figure 44 SEM cross section image of anodized electro-polished as-deposited Al
Figure 45 shows the SEM image of the AAO template obtained by anodization
of electro-polished as-deposited aluminum using a 0.3 M oxalic acid solution at 40 V
and at room temperature. The opening of the pore bottom and the pore widening were
a b
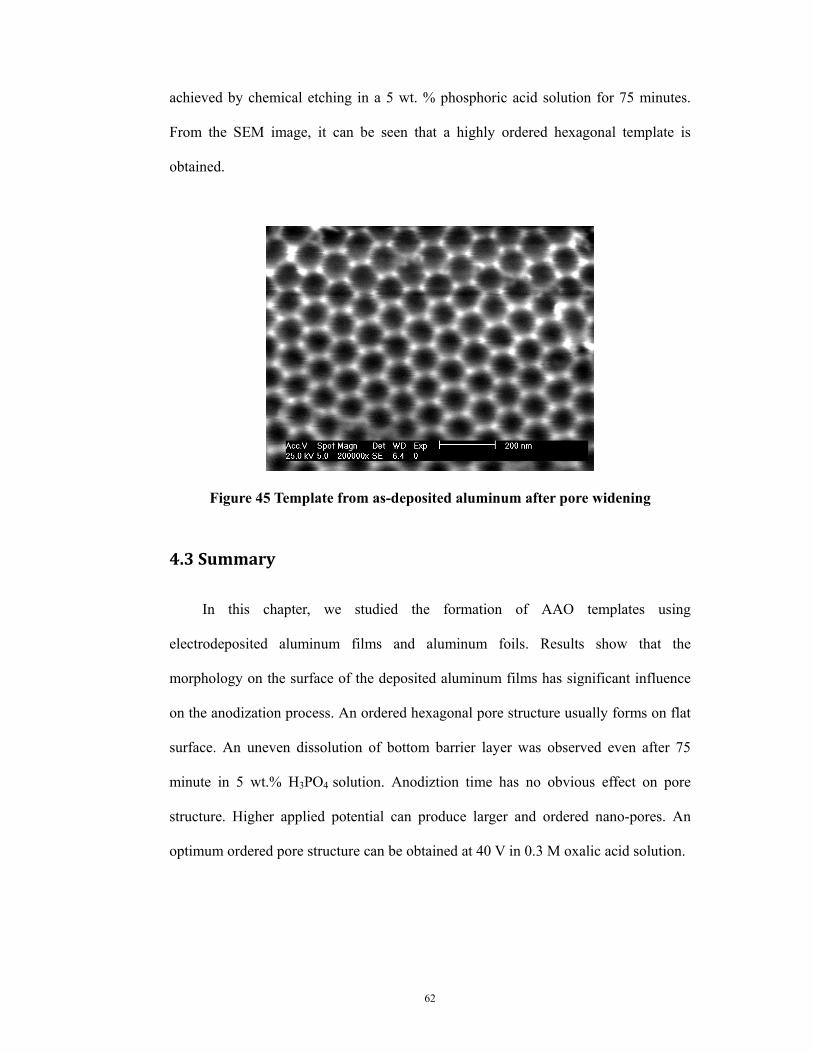
62
achieved by chemical etching in a 5 wt. % phosphoric acid solution for 75 minutes.
From the SEM image, it can be seen that a highly ordered hexagonal template is
obtained.
Figure 45 Template from as-deposited aluminum after pore widening
4.3 Summary
In this chapter, we studied the formation of AAO templates using
electrodeposited aluminum films and aluminum foils. Results show that the
morphology on the surface of the deposited aluminum films has significant influence
on the anodization process. An ordered hexagonal pore structure usually forms on flat
surface. An uneven dissolution of bottom barrier layer was observed even after 75
minute in 5 wt.% H3PO4 solution. Anodiztion time has no obvious effect on pore
structure. Higher applied potential can produce larger and ordered nano-pores. An
optimum ordered pore structure can be obtained at 40 V in 0.3 M oxalic acid solution.
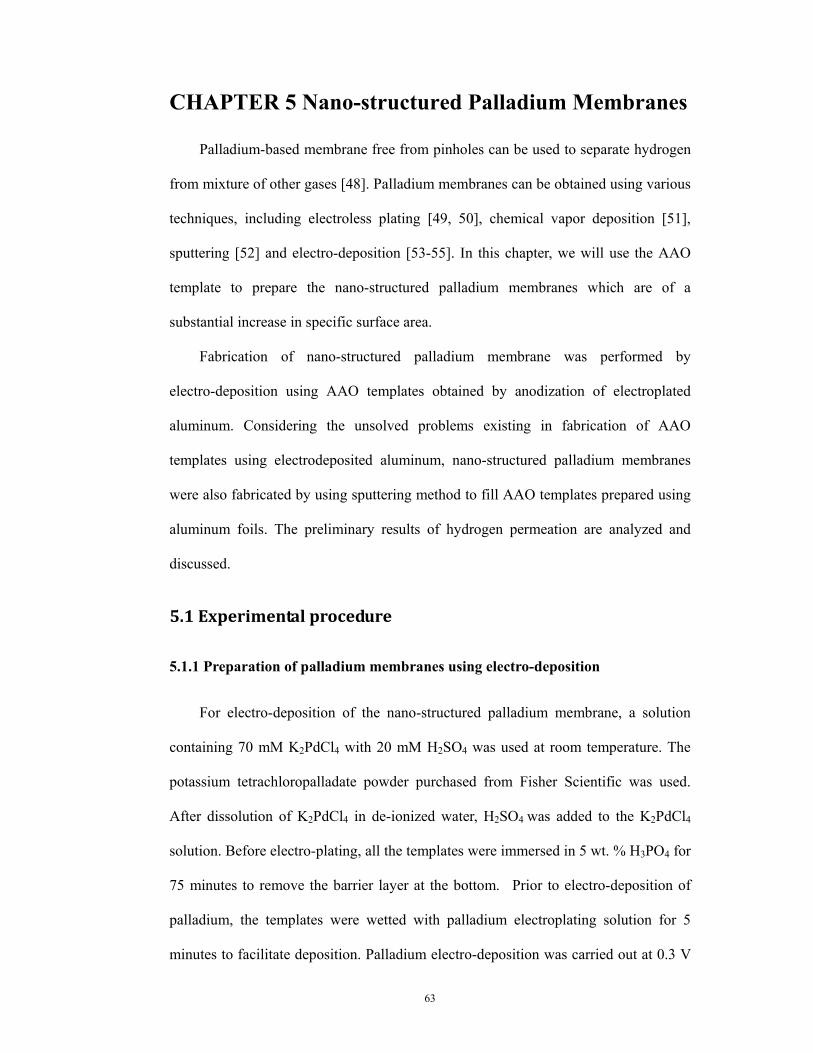
63
CHAPTER 5 Nano-structured Palladium Membranes
Palladium-based membrane free from pinholes can be used to separate hydrogen
from mixture of other gases [48]. Palladium membranes can be obtained using various
techniques, including electroless plating [49, 50], chemical vapor deposition [51],
sputtering [52] and electro-deposition [53-55]. In this chapter, we will use the AAO
template to prepare the nano-structured palladium membranes which are of a
substantial increase in specific surface area.
Fabrication of nano-structured palladium membrane was performed by
electro-deposition using AAO templates obtained by anodization of electroplated
aluminum. Considering the unsolved problems existing in fabrication of AAO
templates using electrodeposited aluminum, nano-structured palladium membranes
were also fabricated by using sputtering method to fill AAO templates prepared using
aluminum foils. The preliminary results of hydrogen permeation are analyzed and
discussed.
5.1 Experimental procedure
5.1.1 Preparation of palladium membranes using electro-deposition
For electro-deposition of the nano-structured palladium membrane, a solution
containing 70 mM K2PdCl4 with 20 mM H2SO4 was used at room temperature. The
potassium tetrachloropalladate powder purchased from Fisher Scientific was used.
After dissolution of K2PdCl4 in de-ionized water, H2SO4 was added to the K2PdCl4
solution. Before electro-plating, all the templates were immersed in 5 wt. % H3PO4 for
75 minutes to remove the barrier layer at the bottom. Prior to electro-deposition of
palladium, the templates were wetted with palladium electroplating solution for 5
minutes to facilitate deposition. Palladium electro-deposition was carried out at 0.3 V
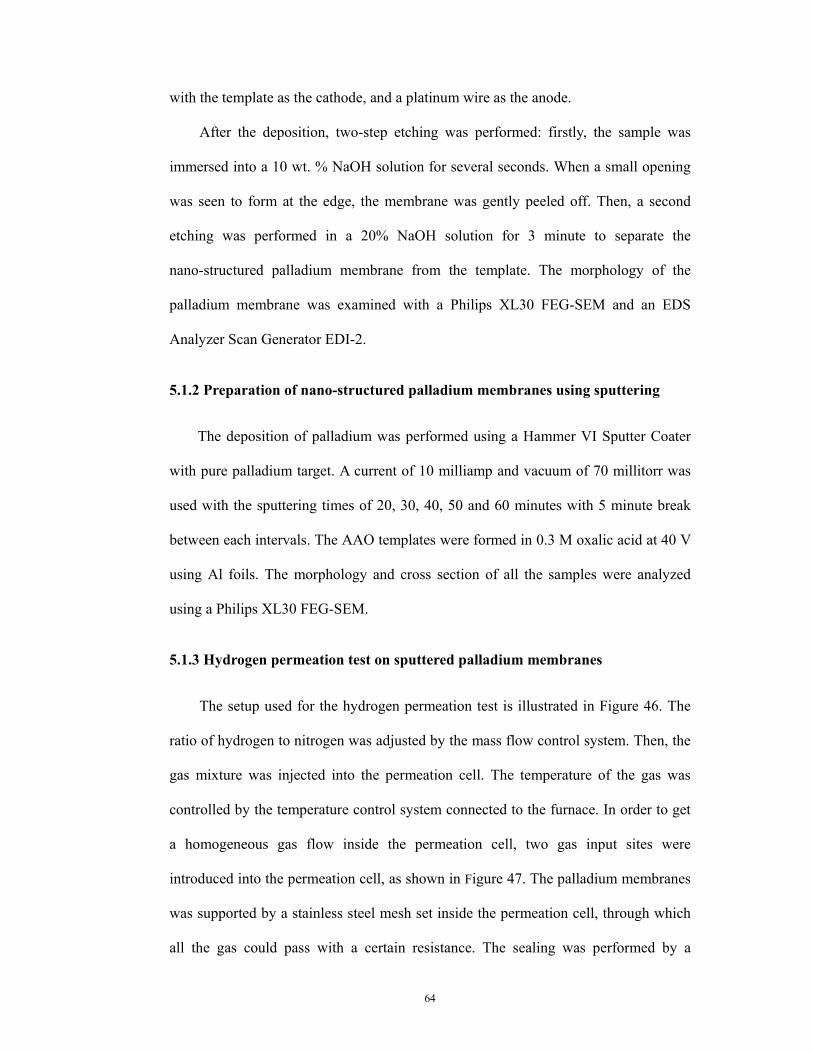
64
with the template as the cathode, and a platinum wire as the anode.
After the deposition, two-step etching was performed: firstly, the sample was
immersed into a 10 wt. % NaOH solution for several seconds. When a small opening
was seen to form at the edge, the membrane was gently peeled off. Then, a second
etching was performed in a 20% NaOH solution for 3 minute to separate the
nano-structured palladium membrane from the template. The morphology of the
palladium membrane was examined with a Philips XL30 FEG-SEM and an EDS
Analyzer Scan Generator EDI-2.
5.1.2 Preparation of nano-structured palladium membranes using sputtering
The deposition of palladium was performed using a Hammer VI Sputter Coater
with pure palladium target. A current of 10 milliamp and vacuum of 70 millitorr was
used with the sputtering times of 20, 30, 40, 50 and 60 minutes with 5 minute break
between each intervals. The AAO templates were formed in 0.3 M oxalic acid at 40 V
using Al foils. The morphology and cross section of all the samples were analyzed
using a Philips XL30 FEG-SEM.
5.1.3 Hydrogen permeation test on sputtered palladium membranes
The setup used for the hydrogen permeation test is illustrated in Figure 46. The
ratio of hydrogen to nitrogen was adjusted by the mass flow control system. Then, the
gas mixture was injected into the permeation cell. The temperature of the gas was
controlled by the temperature control system connected to the furnace. In order to get
a homogeneous gas flow inside the permeation cell, two gas input sites were
introduced into the permeation cell, as shown in Figure 47. The palladium membranes
was supported by a stainless steel mesh set inside the permeation cell, through which
all the gas could pass with a certain resistance. The sealing was performed by a
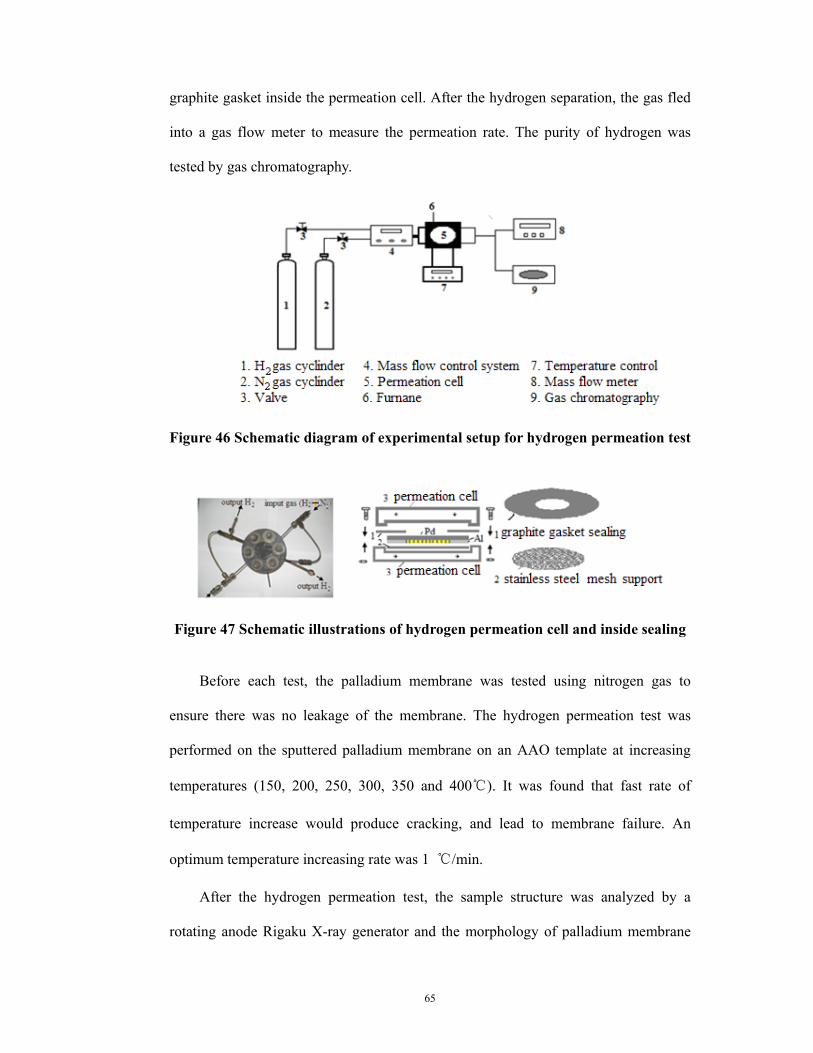
65
graphite gasket inside the permeation cell. After the hydrogen separation, the gas fled
into a gas flow meter to measure the permeation rate. The purity of hydrogen was
tested by gas chromatography.
Figure 46 Schematic diagram of experimental setup for hydrogen permeation test
Figure 47 Schematic illustrations of hydrogen permeation cell and inside sealing
Before each test, the palladium membrane was tested using nitrogen gas to
ensure there was no leakage of the membrane. The hydrogen permeation test was
performed on the sputtered palladium membrane on an AAO template at increasing
temperatures (150, 200, 250, 300, 350 and 400℃). It was found that fast rate of
temperature increase would produce cracking, and lead to membrane failure. An
optimum temperature increasing rate was 1 ℃/min.
After the hydrogen permeation test, the sample structure was analyzed by a
rotating anode Rigaku X-ray generator and the morphology of palladium membrane
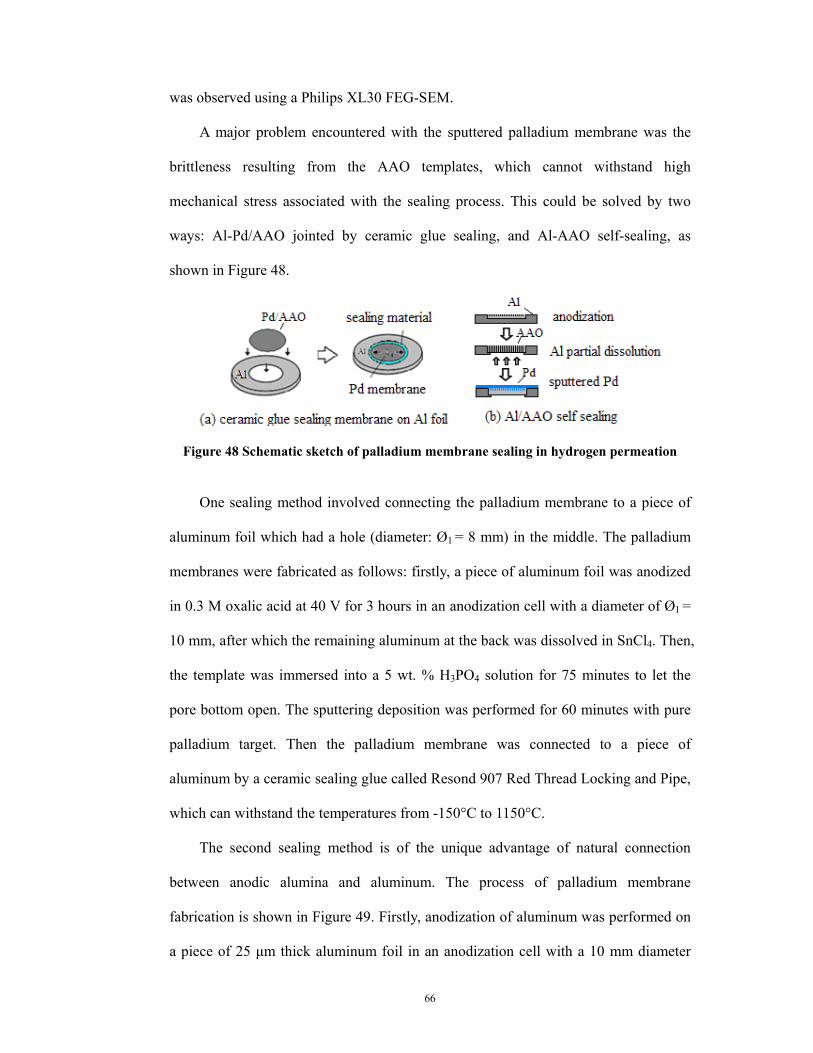
66
was observed using a Philips XL30 FEG-SEM.
A major problem encountered with the sputtered palladium membrane was the
brittleness resulting from the AAO templates, which cannot withstand high
mechanical stress associated with the sealing process. This could be solved by two
ways: Al-Pd/AAO jointed by ceramic glue sealing, and Al-AAO self-sealing, as
shown in Figure 48.
Figure 48 Schematic sketch of palladium membrane sealing in hydrogen permeation
One sealing method involved connecting the palladium membrane to a piece of
aluminum foil which had a hole (diameter: Ø1 = 8 mm) in the middle. The palladium
membranes were fabricated as follows: firstly, a piece of aluminum foil was anodized
in 0.3 M oxalic acid at 40 V for 3 hours in an anodization cell with a diameter of Ø1 =
10 mm, after which the remaining aluminum at the back was dissolved in SnCl4. Then,
the template was immersed into a 5 wt. % H3PO4 solution for 75 minutes to let the
pore bottom open. The sputtering deposition was performed for 60 minutes with pure
palladium target. Then the palladium membrane was connected to a piece of
aluminum by a ceramic sealing glue called Resond 907 Red Thread Locking and Pipe,
which can withstand the temperatures from -150°C to 1150°C.
The second sealing method is of the unique advantage of natural connection
between anodic alumina and aluminum. The process of palladium membrane
fabrication is shown in Figure 49. Firstly, anodization of aluminum was performed on
a piece of 25 μm thick aluminum foil in an anodization cell with a 10 mm diameter
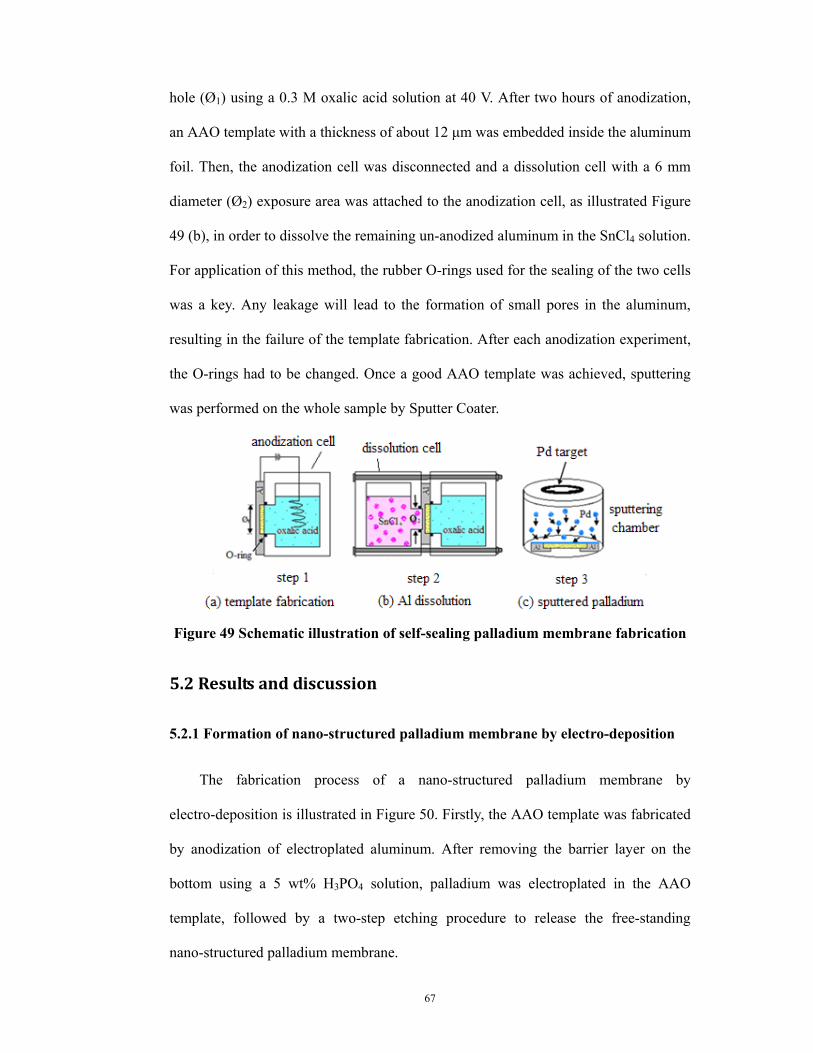
67
hole (Ø1) using a 0.3 M oxalic acid solution at 40 V. After two hours of anodization,
an AAO template with a thickness of about 12 μm was embedded inside the aluminum
foil. Then, the anodization cell was disconnected and a dissolution cell with a 6 mm
diameter (Ø2) exposure area was attached to the anodization cell, as illustrated Figure
49 (b), in order to dissolve the remaining un-anodized aluminum in the SnCl4 solution.
For application of this method, the rubber O-rings used for the sealing of the two cells
was a key. Any leakage will lead to the formation of small pores in the aluminum,
resulting in the failure of the template fabrication. After each anodization experiment,
the O-rings had to be changed. Once a good AAO template was achieved, sputtering
was performed on the whole sample by Sputter Coater.
Figure 49 Schematic illustration of self-sealing palladium membrane fabrication
5.2 Results and discussion
5.2.1 Formation of nano-structured palladium membrane by electro-deposition
The fabrication process of a nano-structured palladium membrane by
electro-deposition is illustrated in Figure 50. Firstly, the AAO template was fabricated
by anodization of electroplated aluminum. After removing the barrier layer on the
bottom using a 5 wt% H3PO4 solution, palladium was electroplated in the AAO
template, followed by a two-step etching procedure to release the free-standing
nano-structured palladium membrane.
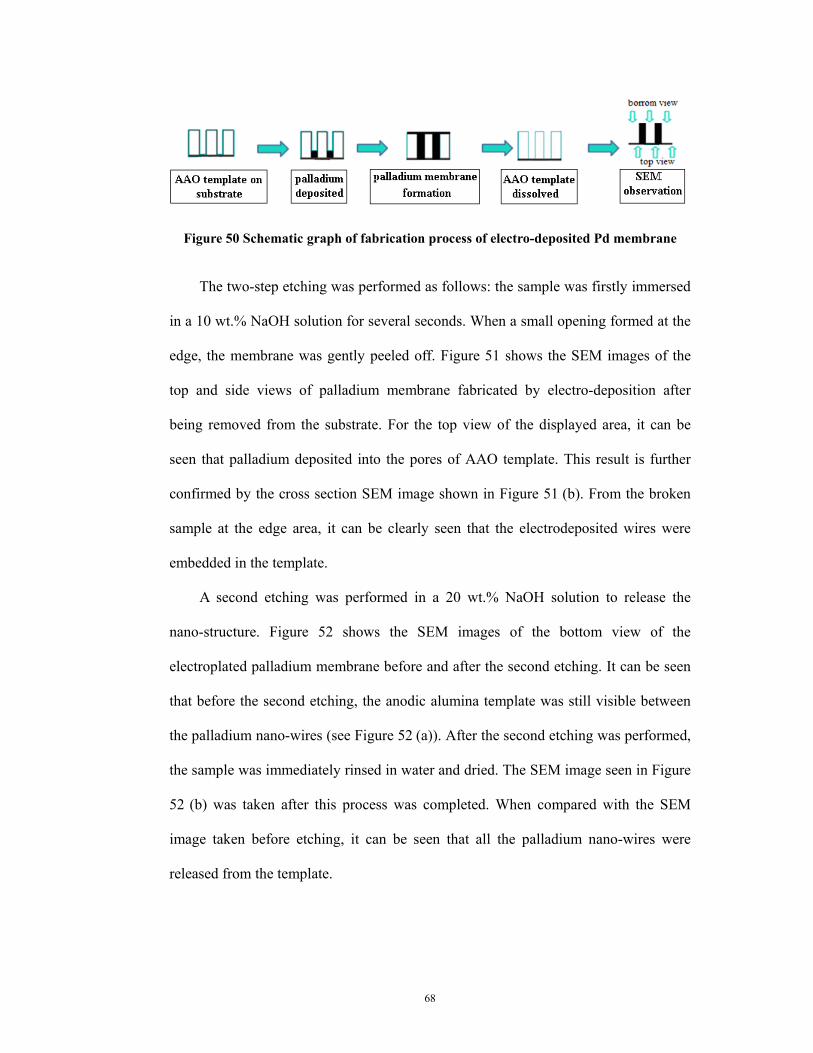
68
Figure 50 Schematic graph of fabrication process of electro-deposited Pd membrane
The two-step etching was performed as follows: the sample was firstly immersed
in a 10 wt.% NaOH solution for several seconds. When a small opening formed at the
edge, the membrane was gently peeled off. Figure 51 shows the SEM images of the
top and side views of palladium membrane fabricated by electro-deposition after
being removed from the substrate. For the top view of the displayed area, it can be
seen that palladium deposited into the pores of AAO template. This result is further
confirmed by the cross section SEM image shown in Figure 51 (b). From the broken
sample at the edge area, it can be clearly seen that the electrodeposited wires were
embedded in the template.
A second etching was performed in a 20 wt.% NaOH solution to release the
nano-structure. Figure 52 shows the SEM images of the bottom view of the
electroplated palladium membrane before and after the second etching. It can be seen
that before the second etching, the anodic alumina template was still visible between
the palladium nano-wires (see Figure 52 (a)). After the second etching was performed,
the sample was immediately rinsed in water and dried. The SEM image seen in Figure
52 (b) was taken after this process was completed. When compared with the SEM
image taken before etching, it can be seen that all the palladium nano-wires were
released from the template.
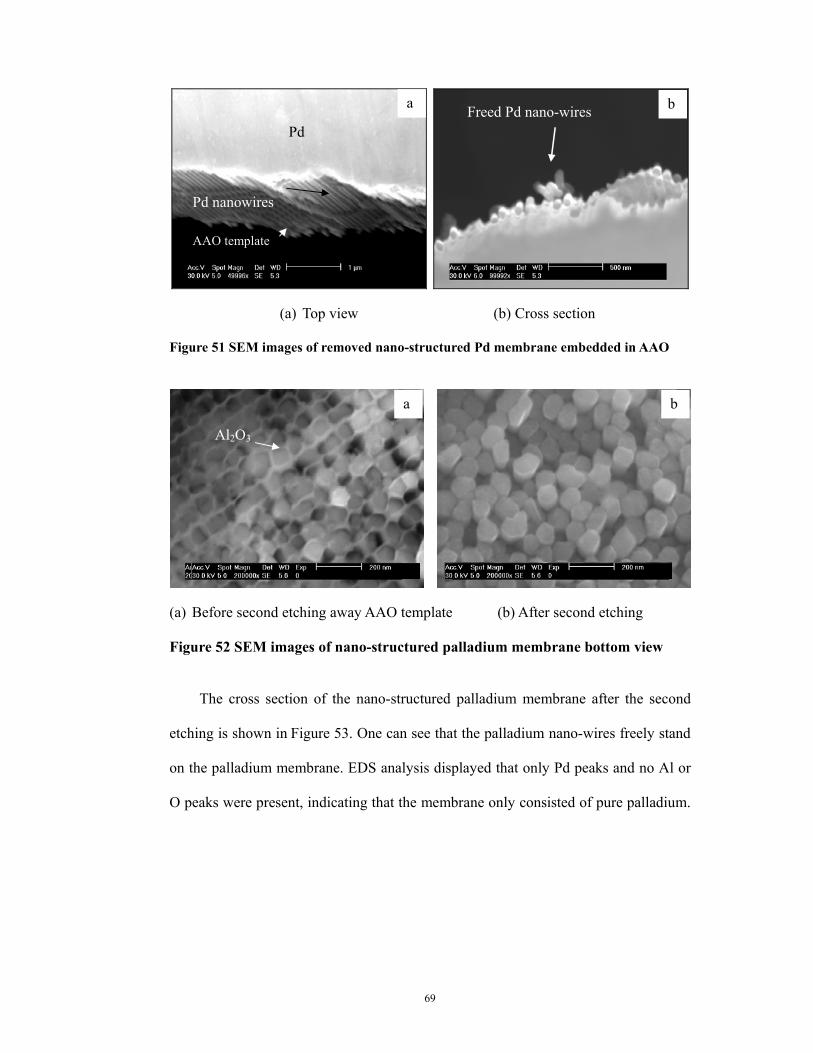
69
(a) Top view (b) Cross section
Figure 51 SEM images of removed nano-structured Pd membrane embedded in AAO
(a) Before second etching away AAO template (b) After second etching
Figure 52 SEM images of nano-structured palladium membrane bottom view
The cross section of the nano-structured palladium membrane after the second
etching is shown in Figure 53. One can see that the palladium nano-wires freely stand
on the palladium membrane. EDS analysis displayed that only Pd peaks and no Al or
O peaks were present, indicating that the membrane only consisted of pure palladium.
Pd
Pd nanowires
AAO template
Freed Pd nano-wires
Al2O3
a b
a b
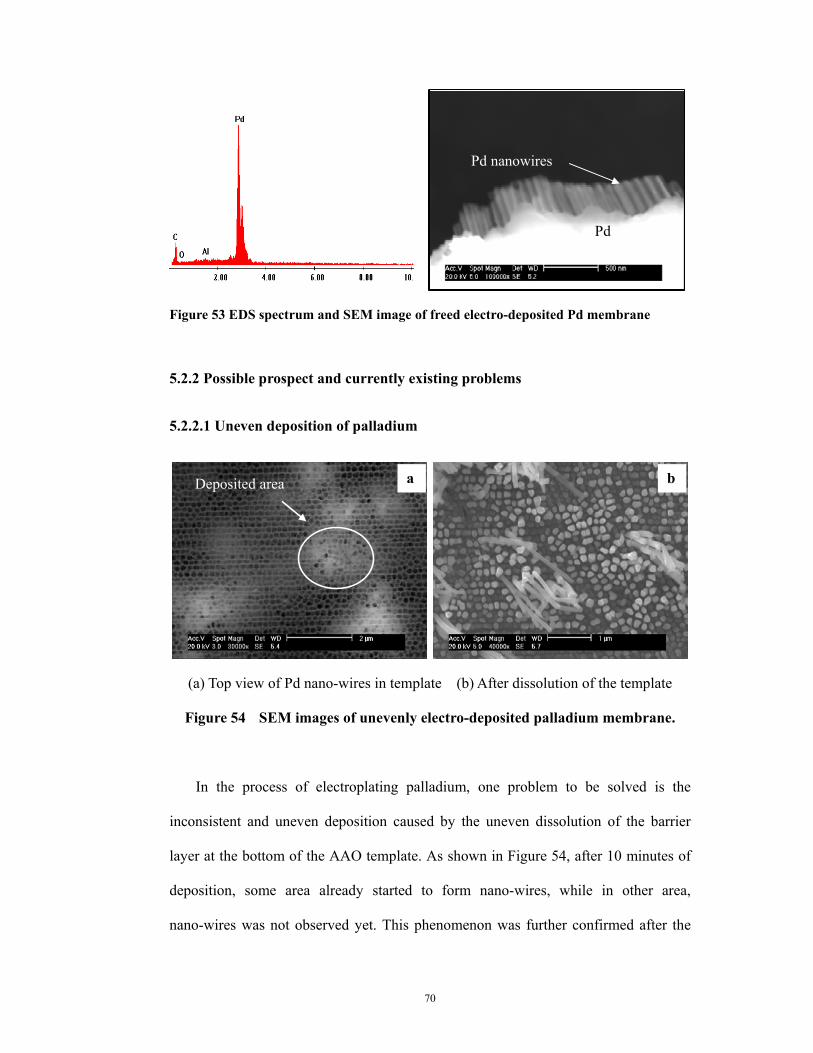
70
Figure 53 EDS spectrum and SEM image of freed electro-deposited Pd membrane
5.2.2 Possible prospect and currently existing problems
5.2.2.1 Uneven deposition of palladium
(a) Top view of Pd nano-wires in template (b) After dissolution of the template
Figure 54 SEM images of unevenly electro-deposited palladium membrane.
In the process of electroplating palladium, one problem to be solved is the
inconsistent and uneven deposition caused by the uneven dissolution of the barrier
layer at the bottom of the AAO template. As shown in Figure 54, after 10 minutes of
deposition, some area already started to form nano-wires, while in other area,
nano-wires was not observed yet. This phenomenon was further confirmed after the
Pd
Pd nanowires
a b Deposited area
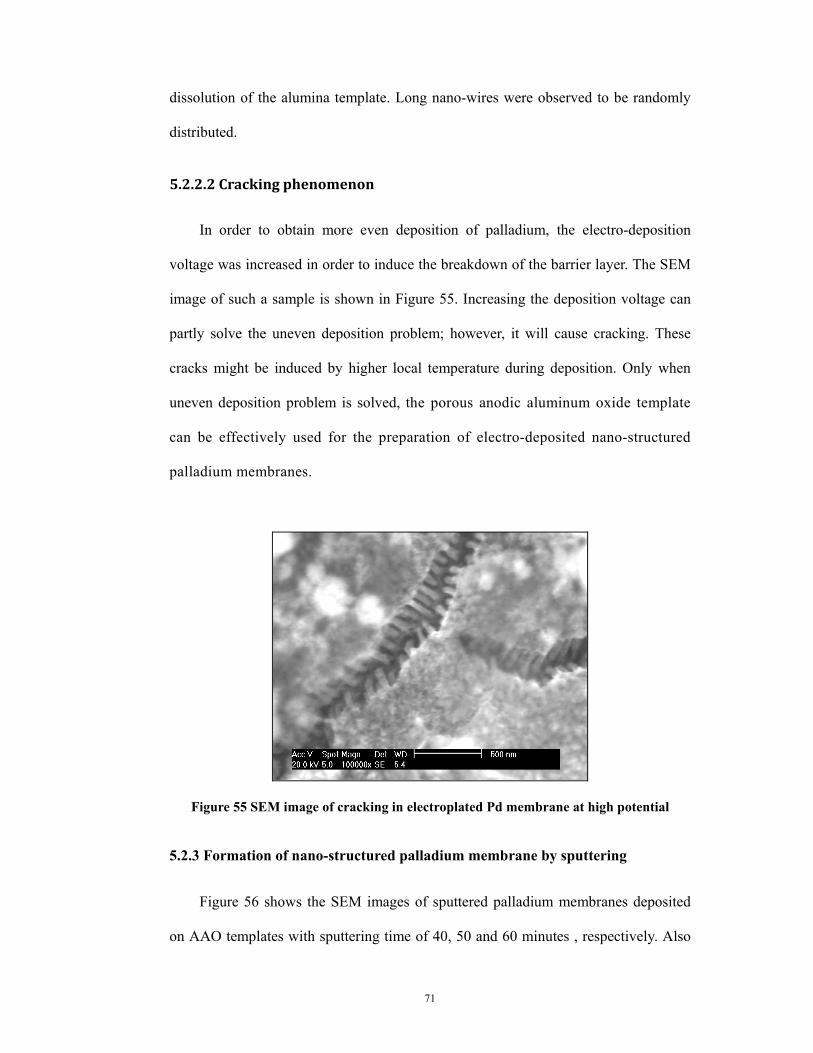
71
dissolution of the alumina template. Long nano-wires were observed to be randomly
distributed.
5.2.2.2 Cracking phenomenon
In order to obtain more even deposition of palladium, the electro-deposition
voltage was increased in order to induce the breakdown of the barrier layer. The SEM
image of such a sample is shown in Figure 55. Increasing the deposition voltage can
partly solve the uneven deposition problem; however, it will cause cracking. These
cracks might be induced by higher local temperature during deposition. Only when
uneven deposition problem is solved, the porous anodic aluminum oxide template
can be effectively used for the preparation of electro-deposited nano-structured
palladium membranes.
Figure 55 SEM image of cracking in electroplated Pd membrane at high potential
5.2.3 Formation of nano-structured palladium membrane by sputtering
Figure 56 shows the SEM images of sputtered palladium membranes deposited
on AAO templates with sputtering time of 40, 50 and 60 minutes , respectively. Also
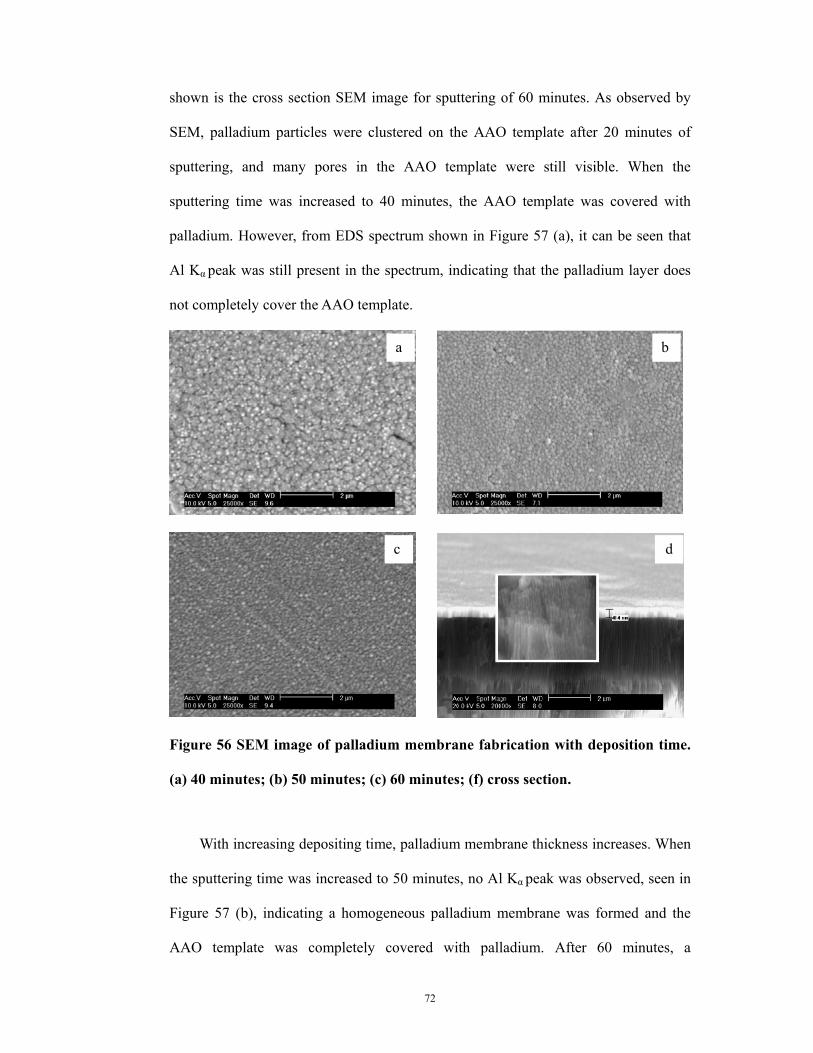
72
shown is the cross section SEM image for sputtering of 60 minutes. As observed by
SEM, palladium particles were clustered on the AAO template after 20 minutes of
sputtering, and many pores in the AAO template were still visible. When the
sputtering time was increased to 40 minutes, the AAO template was covered with
palladium. However, from EDS spectrum shown in Figure 57 (a), it can be seen that
Al Kα peak was still present in the spectrum, indicating that the palladium layer does
not completely cover the AAO template.
Figure 56 SEM image of palladium membrane fabrication with deposition time.
(a) 40 minutes; (b) 50 minutes; (c) 60 minutes; (f) cross section.
With increasing depositing time, palladium membrane thickness increases. When
the sputtering time was increased to 50 minutes, no Al Kα peak was observed, seen in
Figure 57 (b), indicating a homogeneous palladium membrane was formed and the
AAO template was completely covered with palladium. After 60 minutes, a
a b
c d
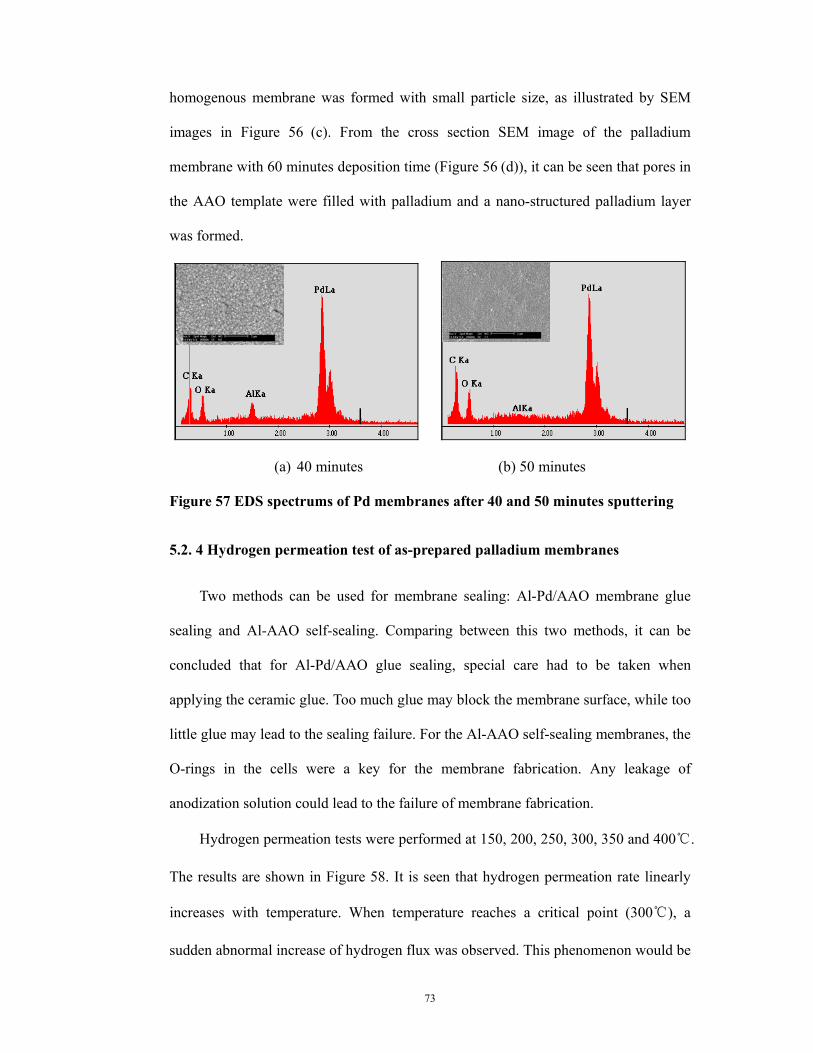
73
homogenous membrane was formed with small particle size, as illustrated by SEM
images in Figure 56 (c). From the cross section SEM image of the palladium
membrane with 60 minutes deposition time (Figure 56 (d)), it can be seen that pores in
the AAO template were filled with palladium and a nano-structured palladium layer
was formed.
(a) 40 minutes (b) 50 minutes Figure 57 EDS spectrums of Pd membranes after 40 and 50 minutes sputtering
5.2. 4 Hydrogen permeation test of as-prepared palladium membranes
Two methods can be used for membrane sealing: Al-Pd/AAO membrane glue
sealing and Al-AAO self-sealing. Comparing between this two methods, it can be
concluded that for Al-Pd/AAO glue sealing, special care had to be taken when
applying the ceramic glue. Too much glue may block the membrane surface, while too
little glue may lead to the sealing failure. For the Al-AAO self-sealing membranes, the
O-rings in the cells were a key for the membrane fabrication. Any leakage of
anodization solution could lead to the failure of membrane fabrication.
Hydrogen permeation tests were performed at 150, 200, 250, 300, 350 and 400℃.
The results are shown in Figure 58. It is seen that hydrogen permeation rate linearly
increases with temperature. When temperature reaches a critical point (300℃), a
sudden abnormal increase of hydrogen flux was observed. This phenomenon would be
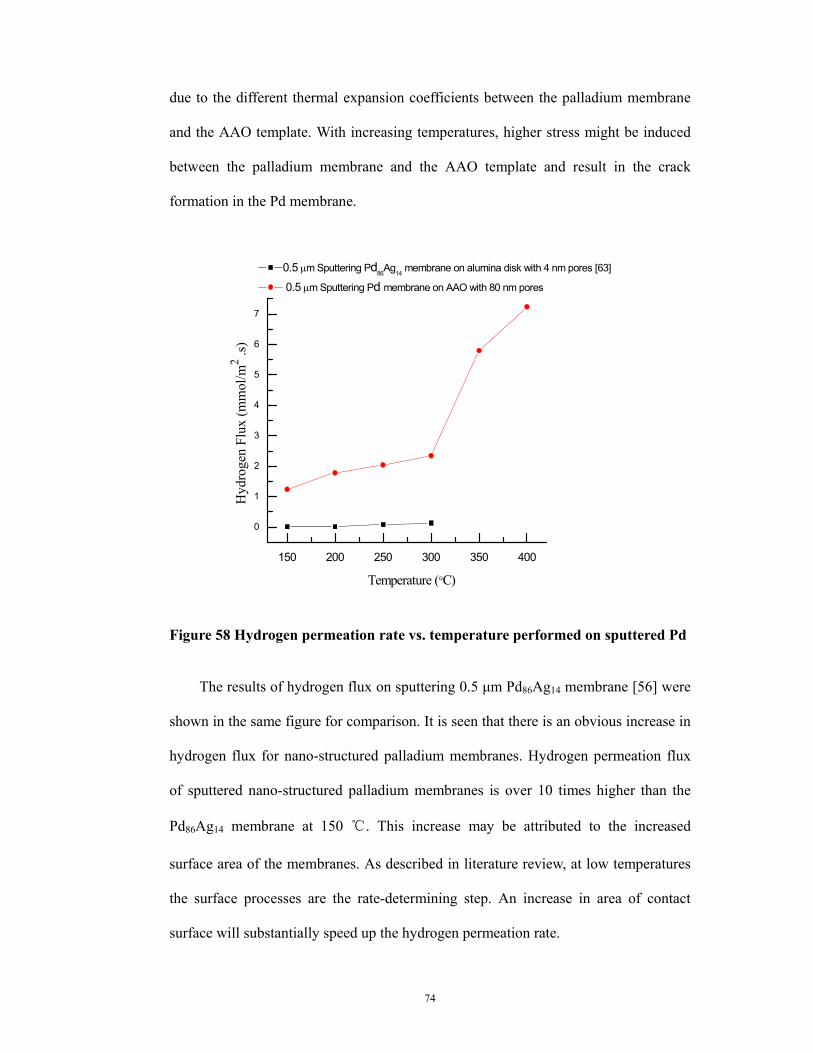
74
due to the different thermal expansion coefficients between the palladium membrane
and the AAO template. With increasing temperatures, higher stress might be induced
between the palladium membrane and the AAO template and result in the crack
formation in the Pd membrane.
150 200 250 300 350 400
0
1
2
3
4
5
6
7
Hyd
roge
n Fl
ux (m
mol
/m2 .s
)
Temperature (°C)
0.5 μm Sputtering Pd86Ag14 membrane on alumina disk with 4 nm pores [63]
0.5 μm Sputtering Pd membrane on AAO with 80 nm pores
Figure 58 Hydrogen permeation rate vs. temperature performed on sputtered Pd
The results of hydrogen flux on sputtering 0.5 μm Pd86Ag14 membrane [56] were
shown in the same figure for comparison. It is seen that there is an obvious increase in
hydrogen flux for nano-structured palladium membranes. Hydrogen permeation flux
of sputtered nano-structured palladium membranes is over 10 times higher than the
Pd86Ag14 membrane at 150 ℃. This increase may be attributed to the increased
surface area of the membranes. As described in literature review, at low temperatures
the surface processes are the rate-determining step. An increase in area of contact
surface will substantially speed up the hydrogen permeation rate.
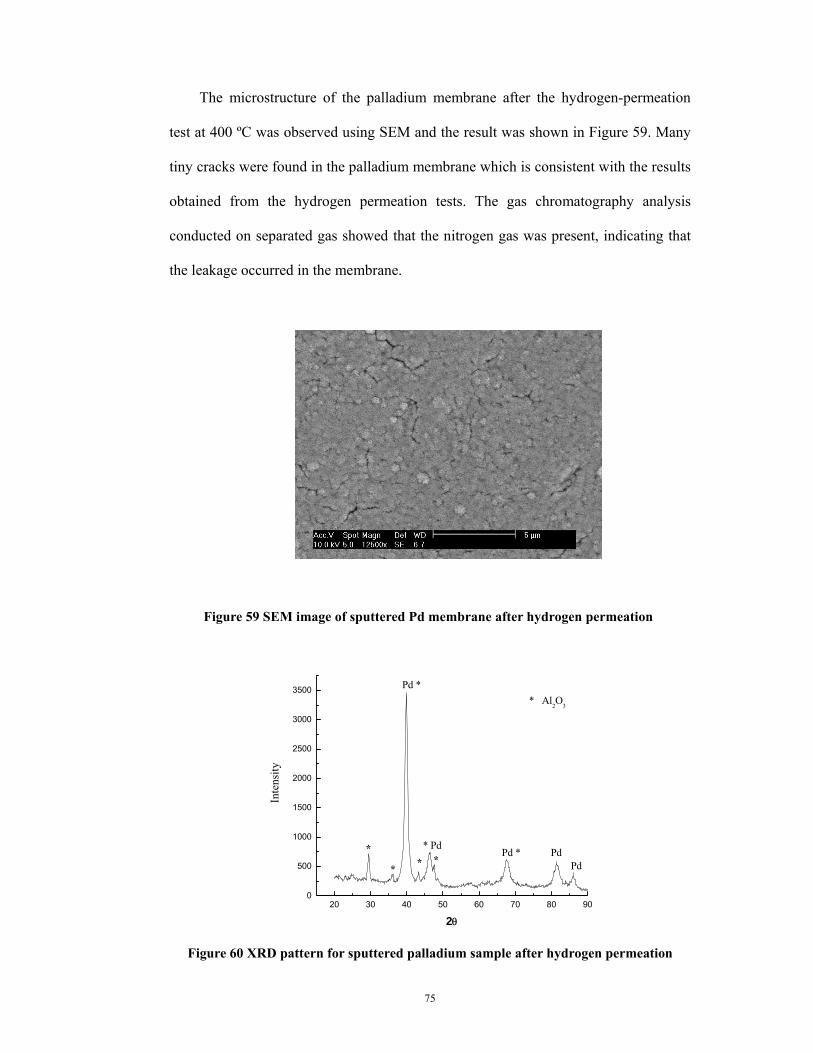
75
The microstructure of the palladium membrane after the hydrogen-permeation
test at 400 ºC was observed using SEM and the result was shown in Figure 59. Many
tiny cracks were found in the palladium membrane which is consistent with the results
obtained from the hydrogen permeation tests. The gas chromatography analysis
conducted on separated gas showed that the nitrogen gas was present, indicating that
the leakage occurred in the membrane.
Figure 59 SEM image of sputtered Pd membrane after hydrogen permeation
20 30 40 50 60 70 80 900
500
1000
1500
2000
2500
3000
3500
* *
Inte
nsity
2θ
* Pd
Pd *
Pd * PdPd
* Al2O3
*
*
Figure 60 XRD pattern for sputtered palladium sample after hydrogen permeation
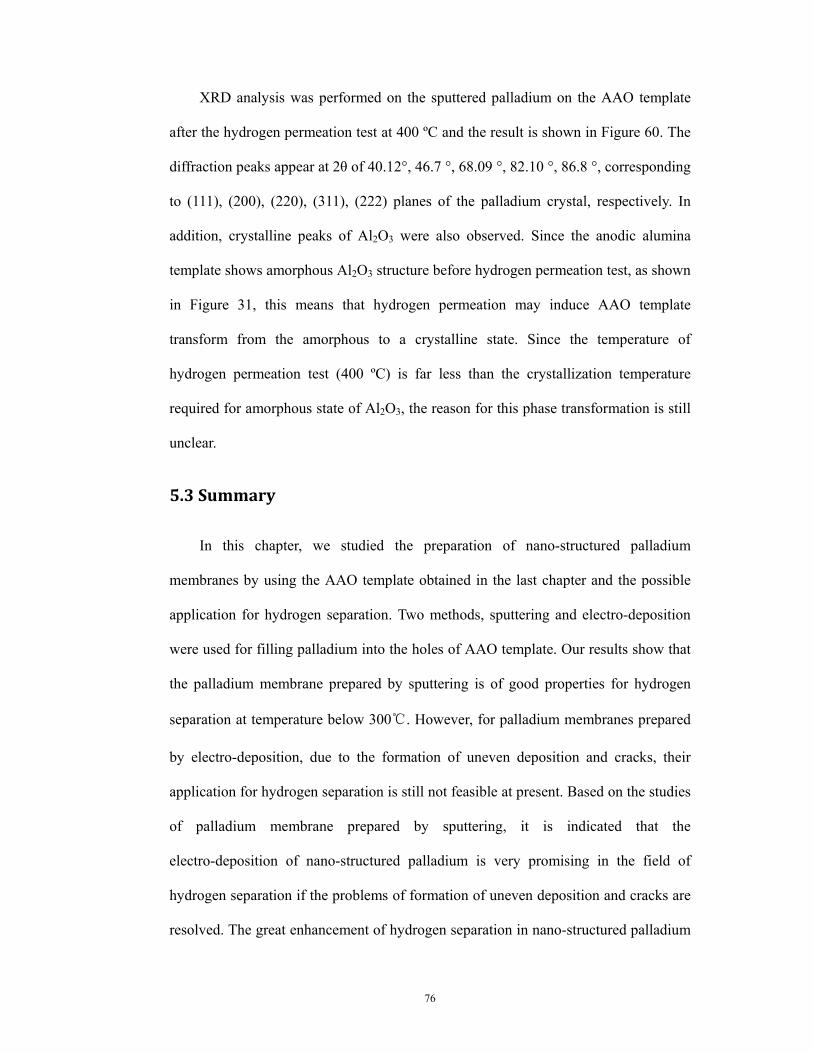
76
XRD analysis was performed on the sputtered palladium on the AAO template
after the hydrogen permeation test at 400 ºC and the result is shown in Figure 60. The
diffraction peaks appear at 2θ of 40.12°, 46.7 °, 68.09 °, 82.10 °, 86.8 °, corresponding
to (111), (200), (220), (311), (222) planes of the palladium crystal, respectively. In
addition, crystalline peaks of Al2O3 were also observed. Since the anodic alumina
template shows amorphous Al2O3 structure before hydrogen permeation test, as shown
in Figure 31, this means that hydrogen permeation may induce AAO template
transform from the amorphous to a crystalline state. Since the temperature of
hydrogen permeation test (400 ºC) is far less than the crystallization temperature
required for amorphous state of Al2O3, the reason for this phase transformation is still
unclear.
5.3 Summary
In this chapter, we studied the preparation of nano-structured palladium
membranes by using the AAO template obtained in the last chapter and the possible
application for hydrogen separation. Two methods, sputtering and electro-deposition
were used for filling palladium into the holes of AAO template. Our results show that
the palladium membrane prepared by sputtering is of good properties for hydrogen
separation at temperature below 300℃. However, for palladium membranes prepared
by electro-deposition, due to the formation of uneven deposition and cracks, their
application for hydrogen separation is still not feasible at present. Based on the studies
of palladium membrane prepared by sputtering, it is indicated that the
electro-deposition of nano-structured palladium is very promising in the field of
hydrogen separation if the problems of formation of uneven deposition and cracks are
resolved. The great enhancement of hydrogen separation in nano-structured palladium

77
membranes is due to substantial increase in the specific surface area of membranes.
78
CHAPTER 6 Conclusions
In this thesis, nano-structured palladium membranes were fabricated using an
AAO-template-assisted method. Templates were obtained by anodizing
electro-deposited aluminum films and aluminum foils. The mainly results are given as
follows:
The AlCl3 and LiAlH4 concentrations have different influences on covering power
of the formation of aluminum film. The AlCl3 concentration may significantly
increase covering power, while this phenomenon is not obvious for LiAlH4
concentration. But the increase of LiAlH4 concentration causes an increase of
particle size in the deposited aluminum. The optimum ratio of AlCl3 to LiAlH4 for
the formation of aluminum film is in the range from 3:1 to 4:1.
Applied potential also has an important influence on the microstructure of
as-prepared aluminum films. The optimum potentials obtained in our experiments
are in the range from -3 V to -4 V.
The as-prepared polycrystalline aluminum film has a very weak (111) texture,
which results from the different surface free energies in different crystalline
planes of aluminum.
The morphology of the as-deposited aluminum sample can greatly affect the
anodization process. In general, an ordered pore arranging in hexagonal structure
form on the smooth surface of aluminum films.
The increase in anodization time allows producing thicker template but the pore
size keeps constant.
The oxalic acid solution concentration can increase the anodizing rate. The
similar effect is also found in applied voltage. Moreover, larger applied
79
voltage produces more ordered AAO template.
An uneven etching was observed after 75 minutes in a 5 wt.% H3PO4 solution
and the removal of the barrier layer on the bottom of as-prepared AAO
templates started after 45 minute.
The as-prepared AAO templates mainly consist of amorphous Al2O3.
The palladium membrane prepared by sputtering shows a good property for
hydrogen separation. This is due to the increase in specific surface area of
nano-structured palladium membranes. But the formation of cracks in the
evaluated temperature will result in the failure of hydrogen separation at the
temperature above 300 °C.
Uneven dissolution of the barrier layer in the AAO template may induce an
uneven deposition of palladium, which will restrict the application of
nano-structured palladium membrane for hydrogen separation. If this problem
is solved in the works in the future, electro-deposited nano-structured
palladium membrane prepared using the porous anodic aluminum oxide
template should be also of good properties for hydrogen separation and
purification.
80
References
1. N. Itoh, W.C.X., Selective hydrogenation of phenol to cyclohexanone using
palladium-based membranes as catalysts. Applied Catalysis A: General, 1993.
107(1): p. 83-100.
2. Collins, J.P. and J.D. Way, Preparation and Characterization of a Composite
Palladium-Ceramic Membrane. Industrial & Engineering Chemistry Research,
1993. 32(12): p. 3006-3013.
3. Uemiya, S., T. Matsuda, and E. Kikuchi, Hydrogen Permeable Palladium
Silver Alloy Membrane Supported on Porous Ceramics. Journal of Membrane
Science, 1991. 56(3): p. 315-325.
4. Uemiya, S., et al., Separation of Hydrogen through Palladium Thin-Film
Supported on a Porous-Glass Tube. Journal of Membrane Science, 1991. 56(3):
p. 303-313.
5. Shi, D., Functional thin films and functional materials : new concepts and
technologies. 2003, New York, Springer. p. 39
6. Mulder, M., Basic Principles of Membrane Technology, ed. s. edition. 1996:
Dordrecht ; Boston : Kluwer Academic. 227.
7. Chik, H. and J.M. Xu, Nanometric superlattices: non-lithographic fabrication,
materials, and prospects. Materials Science & Engineering R-Reports, 2004.
43(4): p. 103-138.
8. Baker, R.W., Membrane thchnology and applications. second edition ed. 2004:
John Wiley & Sons Ltd, The Artrium, Southern Gate, Chichester, West Sussex,
England.
9. Huang, T.C., M.C. Wei, and H.I. Chen, Permeation of hydrogen through
81
palladium/alumina composite membranes. Separation Science and Technology,
2001. 36(2): p. 199-222.
10. Nam, S.E. and K.H. Lee, A study on the palladium/nickel composite membrane
by vacuum electrodeposition. Journal of Membrane Science, 2000. 170(1): p.
91-99.
11. Uemiya, S., Kude Y, Sugino K., Sato, N., A Palladium/Porous-Glass
Composite Membrane for Hydrogen Separation. Chemistry Letters, 1988. 10:
p. 1687-1690.
12. Uemiya, S., Matsuda T., KiKuchi E., Aromatization of Propane Assisted by
Palladium Membrane Reactor. Chemistry Letters, 1990. 8: p. 1335-1338.
13. Itoh, N., et al., Deposition of palladium inside straight mesopores of anodic
alumina tube and its hydrogen permeability. Microporous and Mesoporous
Materials, 2000. 39(1-2): p. 103-111.
14. Govind, R. and D. Atnoor, Development of a Composite Palladium Membrane
for Selective Hydrogen Separation at High-Temperature. Industrial &
Engineering Chemistry Research, 1991. 30(3): p. 591-594.
15. Shu, J., B.P.A. Grandjean, and S. Kaliaguine, Asymmetric Pd-Ag
Stainless-Steel Catalytic Membranes for Methane Steam Reforming. Catalysis
Today, 1995. 25(3-4): p. 327-332.
16. Jemaa, N., et al., Thin palladium film formation on shot peening modified
porous stainless steel substrates. Industrial & Engineering Chemistry Research,
1996. 35(3): p. 973-977.
17. Chae, H.T., et al., Irradiation tests for U3Si-A1 dispersion fuels with aluminum
cladding. Journal of Nuclear Materials, 2008. 373(1-3): p. 9-15.
18. Eckert, J., Electrode kinetics of the aluminium deposition from tetrahydrofuran
82
electrolytes Electrochimica Acta, 1981. 26(8): p. 1169-1175.
19. M. GÁLOVÁ, D.K.L.a.L.L., Basic Parameters of the Electrode Process of
Aluminum Deposition from Tetrehydrofuran Solutions I: exchange current
density. Surface Technology, 1980. 11(5): p. 371-376.
20. Lefebvre, M.C. and B.E. Conway, Al-27 NMR spectroscopy studies on
speciation of Al complex ions in AlCl3+LiAlH4 solutions in tetrahydrofuran
for electroplating of Al. Journal of Electroanalytical Chemistry, 1998. 448(2):
p. 217-227.
21. GÁLOVÁ, M., Electrodeposition of aluminium from organic aprotic solvents.
Surface Technology, 1980. 11(5): p. 357-369.
22. Galova, M., D. Kladekova, and L. Lux, Basic Parameters of the Electrode
Process in Aluminum Deposition from Tetrahydrofuran Solutions .2.
Mechanism of the Electrode-Reaction. Surface Technology, 1981. 13(4): p.
315-324.
23. Badawy, W.A., B.A. Sabrah, and N.H.Y. Hilal, A New Bath for the
Electrodeposition of Aluminum .2. Kinetics and Mechanism of the Deposition
and Dissolution Processes. Journal of Applied Electrochemistry, 1987. 17(2):
p. 357-369.
24. Lefebvre, M.C. and B.E. Conway, Nucleation and morphologies in the process
of electrocrystallization of aluminium on smooth gold and glassy-carbon
substrates. Journal of Electroanalytical Chemistry, 2000. 480(1-2): p. 46-58.
25. S. Fournier-Bidoz , V.K., D. Routkevitch , I. Manners, G. A. Ozin, 2004.
Advance Materials, Highly Ordered Nanosphere Imprinted Nanochannel
Alumina (NINA). 16(23-24): p. 2193-2196.
26. Brace, A.W., The Technology of Anodizing Aluminum. Third ed. 2000: Modena,
83
Italy : Interall S.r.l.
27. O Jessensky, F.M., U Gösele, Self-Organized Formation of Hexagonal Pore
Structures in Anodic Alumina. Journal of The Electrochemical Society, 1998.
145(11): p. 3735-3740.
28. Shershulsky, V.P.P.a.V.I., Theoretical modelling of porous oxide growth on
aluminum. Jounal of physics D: Applied physics 1992. 25(8): p. 1258-1263.
29. Z. Wu, C.R., and L. Menon, A Study of Anodization Process during Pore
Formation in Nanoporous Alumina Templates. Journal of The Electrochemical
Society, 2007. 154(1): p. E8-E12.
30. Huang, Q., W.K. Lye, and M.L. Reed, Mechanism of isolated pore formation
in anodic alumina. Nanotechnology, 2007. 18(40): p. -.
31. Lin, S.W., et al., Fabrication and magnetic properties of nickel nanowires.
Journal of Magnetism and Magnetic Materials, 2004. 282: p. 28-31.
32. Palibroda, E., et al., Aluminum Porous Oxide-Growth - on the
Electric-Conductivity of the Barrier Layer. Thin Solid Films, 1995. 256(1-2): p.
101-105.
33. Yu, W.H., et al., Influence of defects on the ordering degree of nanopores made
from anodic aluminum oxide. Physics Letters A, 2006. 350(5-6): p. 392-395.
34. Das, B., Investigation of nanoporous thin-film alumina templates. Journal of
the Electrochemical Society, 2004. 151(6): p. D46-D50.
35. O. Jessensky, F.M.a.U.G., Self-Organized Formation of Hexagonal Pore
Structures in Anodic Alumina, in Journal of the Electrochemical Society. 1998.
p. 3735-3740.
36. Nielsch, K., et al., Hexagonally ordered 100 nm period nickel nanowire arrays.
Applied Physics Letters, 2001. 79(9): p. 1360-1362.
84
37. Zheng, M., et al., Magnetic properties of Ni nanowires in self-assembled
arrays. Physical Review B, 2000. 62(18): p. 12282-12286.
38. Saito, M., et al., Micropolarizer Made of the Anodized Alumina Film. Applied
Physics Letters, 1989. 55(7): p. 607-609.
39. Preston, C.K. and M. Moskovits, Optical Characterization of Anodic
Aluminum-Oxide Films Containing Electrochemically Deposited Metal
Particles .1. Gold in Phosphoric-Acid Anodic Aluminum-Oxide Films. Journal
of Physical Chemistry, 1993. 97(32): p. 8495-8503.
40. Li, Y., et al., Ordered semiconductor ZnO nanowire arrays and their
photoluminescence properties. Applied Physics Letters, 2000. 76(15): p.
2011-2013.
41. Konno, M., et al., A Composite Palladium and Porous Aluminum-Oxide
Membrane for Hydrogen Gas Separation. Journal of Membrane Science, 1988.
37(2): p. 193-197.
42. Sano, T., et al., Size-exclusion chromatography using self-organized nanopores
in anodic porous alumina. Applied Physics Letters, 2003. 83(21): p.
4438-4440.
43. Mei, X., et al., Molecular-beam epitaxial growth of GaAs and InGaAs/GaAs
nanodot arrays using anodic Al2O3 nanohole array template masks. Applied
Physics Letters, 2002. 81(2): p. 361-363.
44. Liang, J.Y., et al., Two-dimensional lateral superlattices of nanostructures:
Nonlithographic formation by anodic membrane template. Journal of Applied
Physics, 2002. 91(4): p. 2544-2546.
45. Montero-Moreno, J.M., M. Sarret, and C. Muller, Some considerations on the
influence of voltage in potentiostatic two-step anodizing of AA1050. Journal of
85
the Electrochemical Society, 2007. 154(3): p. C169-C174.
46. Fournier-Bidoz, S., et al., Highly ordered nanosphere imprinted nanochannel
alumina (NINA). Advanced Materials, 2004. 16(23-24): p. 2193-+.
47. Masuda, H., et al., Highly ordered nanochannel-array architecture in anodic
alumina. Applied Physics Letters, 1997. 71(19): p. 2770-2772.
48. Tong, J.H., et al., Preparation of a pinhole-free Pd-Ag membrane on a porous
metal support for pure hydrogen separation. Journal of Membrane Science,
2005. 260(1-2): p. 84-89.
49. Shu, J., et al., Simultaneous Deposition of Pd and Ag on Porous Stainless-Steel
by Electroless Plating. Journal of Membrane Science, 1993. 77(2-3): p.
181-195.
50. Cheng, Y.S. and K.L. Yeung, Palladium-silver composite membranes by
electroless plating technique. Journal of Membrane Science, 1999. 158(1-2): p.
127-141.
51. Xomeritakis, G. and Y.S. Lin, Fabrication of a thin palladium membrane
supported in a porous ceramic substrate by chemical vapor deposition. Journal
of Membrane Science, 1996. 120(2): p. 261-272.
52. Lee, C.H., et al., Comparison of amperometric biosensors fabricated by
palladium sputtering, palladium electrodeposition and Nafion/carbon
nanotube casting on screen-printed carbon electrodes. Biosensors &
Bioelectronics, 2007. 22(6): p. 877-884.
53. Kudo, K., K. Kobayakawa, and Y. Sato, Preparation of multilayered Co/Pd
nanostructure films by electroplating and their magnetic properties.
Electrochimica Acta, 2001. 47(1-2): p. 353-357.
54. Chen, S.C., et al., Preparation of palladium membrane by electroplating on
86
AISI 316L porous stainless steel supports and its use for methanol steam
reformer. Journal of Membrane Science, 2008. 314(1-2): p. 5-14.
55. Cheng, F.L., et al., Electrodeposited fabrication of highly ordered Pd nanowire
arrays for alcohol electrooxidation. Electrochemistry Communications, 2008.
10(5): p. 798-801.
56. Xomeritakis, G. and Y.S. Lin, Fabrication of thin metallic membranes by
MOCVD and sputtering. Journal of Membrane Science, 1997. 133(2): p.
217-230.