Embed Size (px)
Citation preview
876
†To whom correspondence should be addressed.
E-mail: [email protected], [email protected]
Korean J. Chem. Eng., 29(7), 876-885 (2012)DOI: 10.1007/s11814-011-0263-6
INVITED REVIEW PAPER
Fabrication of electrolyte-impregnated cathode by dry casting methodfor molten carbonate fuel cells
Min Goo Kang*,**, Shin Ae Song*, Seong-Cheol Jang*,
***, In-Hwan Oh*, Jonghee Han*,†,Sung Pil Yoon*, Sung-Hyun Kim**
,†, and Seong-Geun Oh***
*Fuel Cell Research Center, Korea Institute of Science and Technology,39-1, Hawolgok-dong, Seongbuk-gu, Seoul 136-791, Korea
**Department of Chemical & Biological Engineering, Korea University, 1, Anam-dong, Seongbuk-gu, Seoul 136-701, Korea***Major in Chemical Engineering, Hanyang University, 17, Haengdang-dong, Seongdong-gu, Seoul 133-791, Korea
(Received 8 August 2011 • accepted 11 October 2011)
Abstract−A dry casting method for fabricating a porous Ni plate, which was used as the cathode for molten carbonate
fuel cells, was proposed, and the basic characteristics of the as-prepared cathode were examined and compared with
those of a conventional cathode fabricated by using the tape casting method. Through several investigations, we con-
firmed that the cathode fabricated by using the dry casting method has properties identical to those of the conventional
cathode. Electrolyte-impregnated cathodes were also successfully fabricated by using the dry casting method. Several
characteristics of the as-prepared electrolyte-impregnated cathodes including their electrical performance were investi-
gated by using tests such as the single cell test. The cell performances of a single cell using a 25-wt% electrolyte-im-
pregnated cathode and not the electrolyte-impregnated cathode were 0.867 V and 0.819 V at a current density of 150
mAcm−2 and 650 oC, respectively. The single cell using a 25-wt% electrolyte-impregnated cathode was also operated
stably for 2,000 h. The cell performance was enhanced, and the internal resistance and the charge transfer resistance
were reduced after electrolyte impregnation in the cathode. Moreover, the increase in the surface area of the cathode
and the further lithiation of the NiO cathode after the electrolyte impregnation in the cathode enhance the area of the
three-phase boundary and the electrical conductivity, respectively. However, the cell performance of the single cell
using the 35-wt% electrolyte-impregnated cathode was reduced, and the cell could not be operated for a long time be-
cause of the rapid increase in the N2 crossover caused by the poor formation of a wet seal.
Key words: Molten Carbonate Fuel Cell, Electrolyte-impregnated Cathode, Dry Casting Method
INTRODUCTION
Molten carbonate fuel cells (MCFCs) are high-temperature fuel
cells that operate at around 923 K. The operation at high tempera-
tures leads to high efficiency and produces high-quality waste heat;
further, such operation makes it possible to use less expensive materi-
als as cell components [1-8]. For many years, in-situ lithiated nickel
oxide (NiO) has been commonly used as the cathode for MCFCs
because of its stability in carbonate melts and an oxygen atmo-
sphere and because of its high electrical conductivity [8-10]. In gen-
eral, the Ni green sheet is first fabricated by using a conventional
tape casting method; it is then sintered for the formation of a porous
Ni plate at a high temperature under a reducing atmosphere. The
cell is assembled using this prepared porous Ni plate as a cathode
for the MCFCs. During the pre-treatment process in the cell, the
electrochemical catalytic properties and the appropriate conductiv-
ity are realized through the in-situ oxidation and lithiation reactions
of a porous Ni plate [9].
Tape casting is a well-known process used to produce a large-
area, thin, and flat ceramic sheet that is difficult to fabricate using
other methods such as pressing and extruding [11-16]. The largest
advantage of tape casting is the good thickness control of the large-
area and thin ceramic sheet [12]. A slurry consisting of the ceramic
powder, dispersants, binders, and plasticizers in organic solvents is
casted onto a stationary or moving surface for the fabrication of a
ceramic sheet [13]; the detailed procedure for the tape casting is
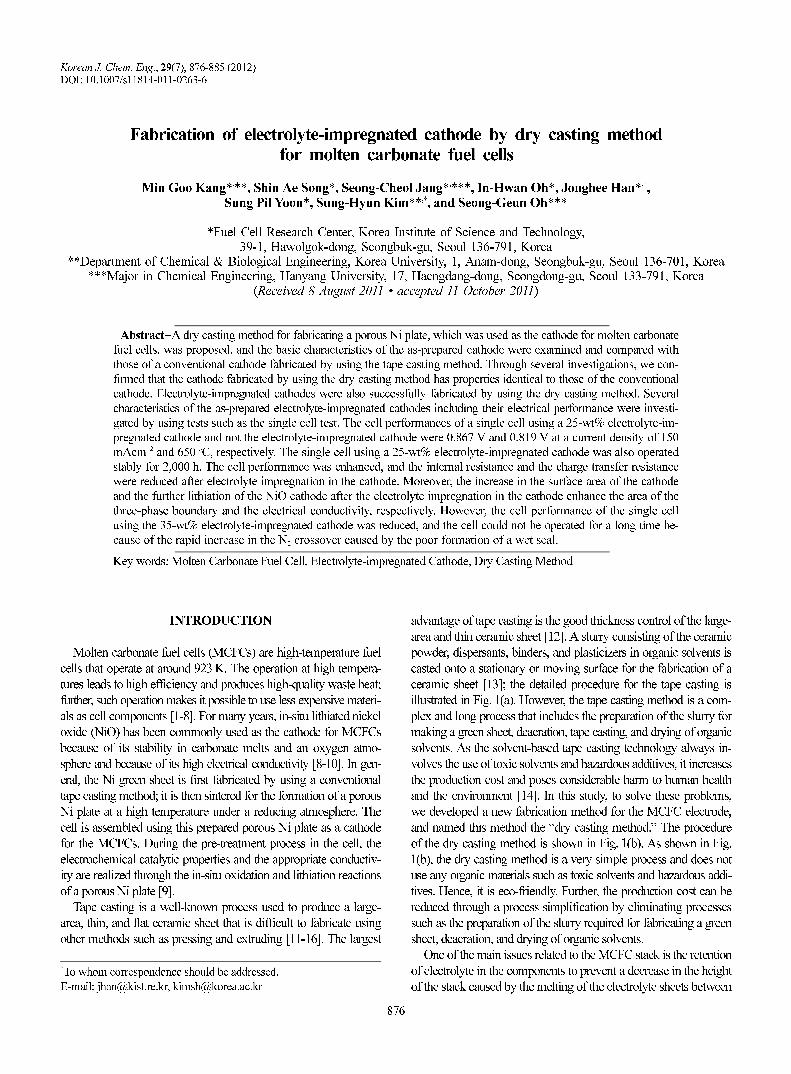
illustrated in Fig. 1(a). However, the tape casting method is a com-
plex and long process that includes the preparation of the slurry for
making a green sheet, deaeration, tape casting, and drying of organic
solvents. As the solvent-based tape casting technology always in-
volves the use of toxic solvents and hazardous additives, it increases
the production cost and poses considerable harm to human health
and the environment [14]. In this study, to solve these problems,
we developed a new fabrication method for the MCFC electrode,
and named this method the “dry casting method.” The procedure
of the dry casting method is shown in Fig. 1(b). As shown in Fig.
1(b), the dry casting method is a very simple process and does not
use any organic materials such as toxic solvents and hazardous addi-
tives. Hence, it is eco-friendly. Further, the production cost can be
reduced through a process simplification by eliminating processes
such as the preparation of the slurry required for fabricating a green
sheet, deaeration, and drying of organic solvents.
One of the main issues related to the MCFC stack is the retention
of electrolyte in the components to prevent a decrease in the height
of the stack caused by the melting of the electrolyte sheets between
Fabrication of electrolyte-impregnated cathode by dry casting method for molten carbonate fuel cells 877
Korean J. Chem. Eng.(Vol. 29, No. 7)
the matrix sheets during the pre-treatment process before the MCFC
stack operation. The decrease in the stack height exerts continuous
stress on the MCFC stack because the joint between the MCFC stack
and the exterior manifold that supplies the reactant gases is not fitted
as the height of the stack may decrease because of the melting of
the electrolyte. This continuously exerted stress inhibits the long-term
operation of the MCFC stack, which is required to have a 40,000-h
operation to be commercially viable. The melting of the electrolyte
sheets between the matrices during the pretreatment period induces
the irregular distribution of the plate pressure and the initial electrolyte
loss [17] and degrades the cell performance. To solve these prob-
lems, a few researchers developed a method for impregnating the
electrolyte into an MCFC component such as the cathode, anode,
or matrix [17-19]. However, there are few reports on the effect of
electrolyte impregnation in the MCFC component.
In this study, we fabricated the MCFC cathode by using the pro-
posed dry casting method and investigated the basic characteristics
of the prepared cathode, such as pore size distribution, porosity, and
electrochemical performance, by performing a single cell test. These
characteristics of the MCFC cathode were compared with those of
a conventional cathode fabricated by using a tape casting method.
The electrolyte-impregnated cathode was also prepared by using
the proposed dry casting method. The influences of the electrolyte
impregnation into the cathode on the porosity, pore size distribu-
tion, and electrochemical performance of the cathode were investi-
gated.
EXPERIMENTAL
1. Fabrication of NiO Cathode
The porous Ni plate that acts as an in-situ lithiated NiO cathode
in the cell during the pretreatment process was fabricated by the
dry casting method using Ni powder (INCO Co., Ltd.). For sup-
pressing the formation of lumps when the Ni powder is filled in
the mold, the Ni powder was dried at 120 oC for 24 h before the
filling process. The dried Ni powder was spread in the stainless steel
mold (thickness: 0.08 cm, size: 18 cm×18 cm) on the graphite plate.
The spread Ni powder was filled evenly with a uniform thickness
in the mold by using another graphite plate that was slid horizon-
tally and slowly on the Ni powder: the “dry casting method.” Then,
the Ni powder in the stainless steel mold on the graphite plate was
heat-treated at 800 oC for 3 h under a reducing atmosphere (N2 : H2=
90 : 10) for the formation of a Ni plate.
2. Fabrication of Electrolyte-impregnated Cathode
An electrolyte-impregnated cathode was also fabricated by using
the dry casting method. The electrolyte composed of Li2/K2CO3 (molar
ratio=62 : 38, Daejung Chemicals and Metals Co. Ltd.) and Ni pow-
der (INCO Co., Ltd.) was used for fabricating the electrolyte-impreg-
nated cathode. The Ni powder and the electrolyte powder were mixed
using a ball mill for 24 h. Before mixing, the Ni and electrolyte pow-
ders were dried completely at 120 oC for 24 h because of the highly
hygroscopic nature of the electrolyte. The electrolyte was mixed
with the Ni powder in amounts of 25 wt%, 35 wt%, and 45 wt%.
The as-prepared mixed powder was spread in the stainless steel mold
on the graphite plate. As mentioned earlier, the mixed powder was
also filled in the mold evenly by using a method identical to the
dry casting method. The filled mixed powder was also heat-treated
at 580 oC for 3 h under a reducing atmosphere (N2 : H2=90 : 10)
for the fabrication of the impregnated cathode.
3. Characterization of Cathode
The particle sizes of the Ni and the electrolyte powders were evalu-
ated by a particle size analyzer (Horiba LA-300). Before and after
the single cell test, the characteristics of the cathodes prepared by
using the dry casting method were analyzed by the following meth-
ods. The porosity was measured by using the Archimedes method
(ASTM C373-88), and the pore size distribution and the median
pore diameter (MPD) were examined by the mercury porosimeter
(Micrometrics Autopore II) analysis. The structures of cathodes pre-
pared by using the dry casting method after cell operation were exam-
ined by X-ray diffraction (XRD, Rigaku RINT-2500) using CuKα
radiation. The morphologies of cathodes prepared by using the dry
casting method before and after cell operation were examined by
environmental scanning electron microscopy (ESEM, Gatan FEI
XL-30 FEG) to observe the microstructure of the electrode.
4. Single Cell Test
The single cells having pure Ni and electrolyte-impregnated cath-
odes fabricated by using the dry casting method had an effective
Fig. 1. Fabrication of MCFC electrode: (a) conventional tape cast-ing method, (b) proposed dry casting method, and (c) mod-ified dry casting method for fabricating electrolyte-impreg-nated cathode for MCFC.
878 M. G. Kang et al.
July, 2012
area of 100 cm2 and were operated at 650 oC to evaluate the per-
formance of the as-prepared cathodes. In all the single cells, the anode
of the Ni-5-wt%Al alloy, α-LiAlO2 matrix, and the Li2/K2CO3 elec-
trolyte sheet prepared by using the tape casting method were used
identically. The detailed operational conditions of the single cells
are listed in Table 1. Under the standard operating conditions, a mix-
ture of air and CO2 was used as the cathode gas, and a mixture of
H2, H2O, and CO2 was used as the fuel gas. The flow rate of the
reaction gas was fixed at 0.4 for the fuel and air utilization of H2
and CO2 in the anode and cathode gases. The H2O in the anode gas
was supplied using a water bubbler set to 50 oC. The cell perfor-
mance was evaluated by measuring the cell voltage at various cur-
rent densities. A DC current was applied to the cell using an electric
loader (ELTO DC Electronics Co., ESL300Z). To analyze the elec-
trode polarization, an electrochemical impedance analysis (EIS)
was carried out in the open circuit condition (OCV) using Solar-
tron S11287 and 1255B. The frequency range of the present EIS
experiment was from 10,000 to 0.01 Hz. To measure the N2 cross-
over, the gas composition of the anode outlet gas was measured by
gas chromatography (GC, Hewlett-Packard 5890 series II).
RESULTS AND DISCUSSION
1. Non-electrolyte-impregnated Cathode
The basic characteristics of a pure Ni plate fabricated by using
the dry casting method (DC cathode), such as SEM, pore size dis-
tribution, MPD, porosity, and plate thickness, were measured and
compared with those of a conventional pure Ni plate fabricated by
using the tape casting method (TC cathode, Twin Energy Co., Ltd.,
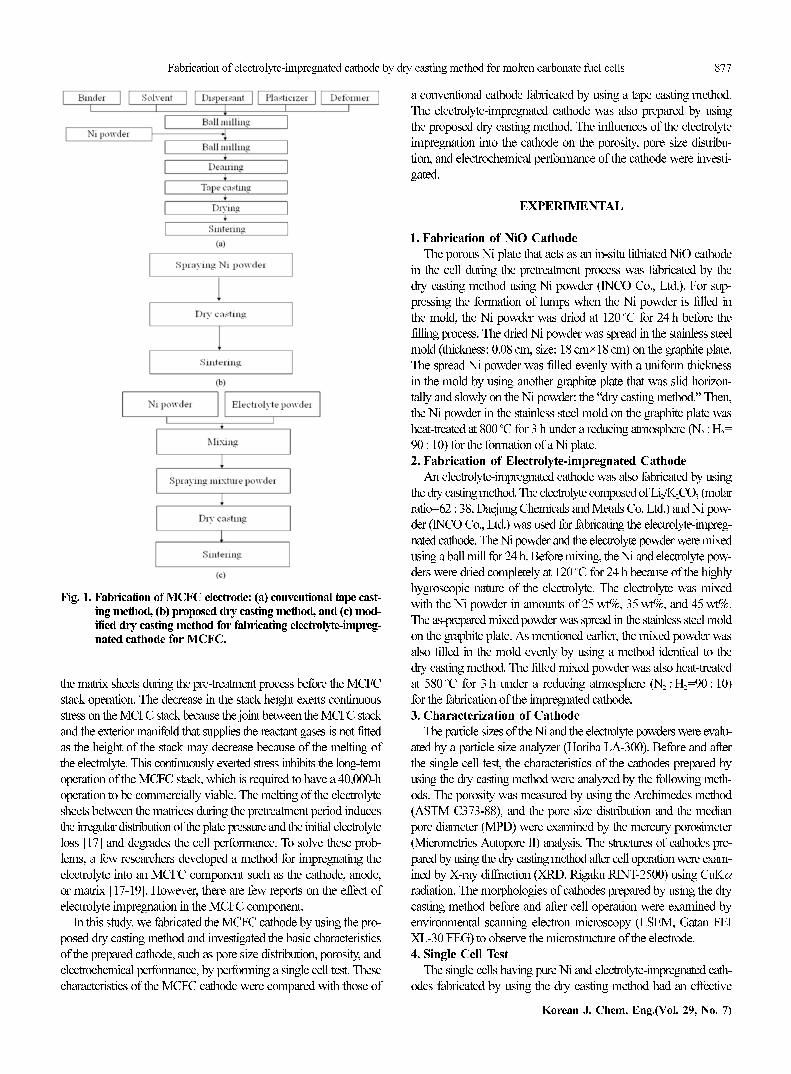
South Korea). Fig. 2 shows the SEM images of the DC cathode
and the TC cathode. A typical morphology having a branched struc-
ture was observed in both samples. The branches were formed by
the neck growth in the Ni powder after the heat treatment of both
samples. The microstructure of the DC cathode was considerably
analogous to that of the TC cathode.
It is generally well known that the optimal MPD and the porosity
of a porous Ni plate used as an MCFC cathode are 8-10µm and
70-80%, respectively [20]. The pore size distributions of the DC
Table 1. Operating conditions of single cells
Unit cell components Values
Anode electrode and current collector
Size (width×length, cm×cm)
Materials (electrode; current collector)
Mole ratio of fuel gas (H2 : CO2 : H2O)
Total flow rate
11×11
Ni-5-wt%Al; Ni
72 : 18 : 10
365 cc min−1
Cathode electrode and current collector
Size (width×length, cm×cm)
Materials (electrode; current collector)
Mole ratio of fuel gas (air : CO2)
Total flow rate
10×10
X-wt%E-DC cathode, DC cathode and TC cathode; SUS316
70 : 30
950 cc min−1
Electrolyte
Li2CO3/K2CO3 mole ratio
Matrix
62 : 38
α-LiAlO2
Fig. 2. SEM images of (a) TC cathode and (b) DC cathode.
Fabrication of electrolyte-impregnated cathode by dry casting method for molten carbonate fuel cells 879
Korean J. Chem. Eng.(Vol. 29, No. 7)
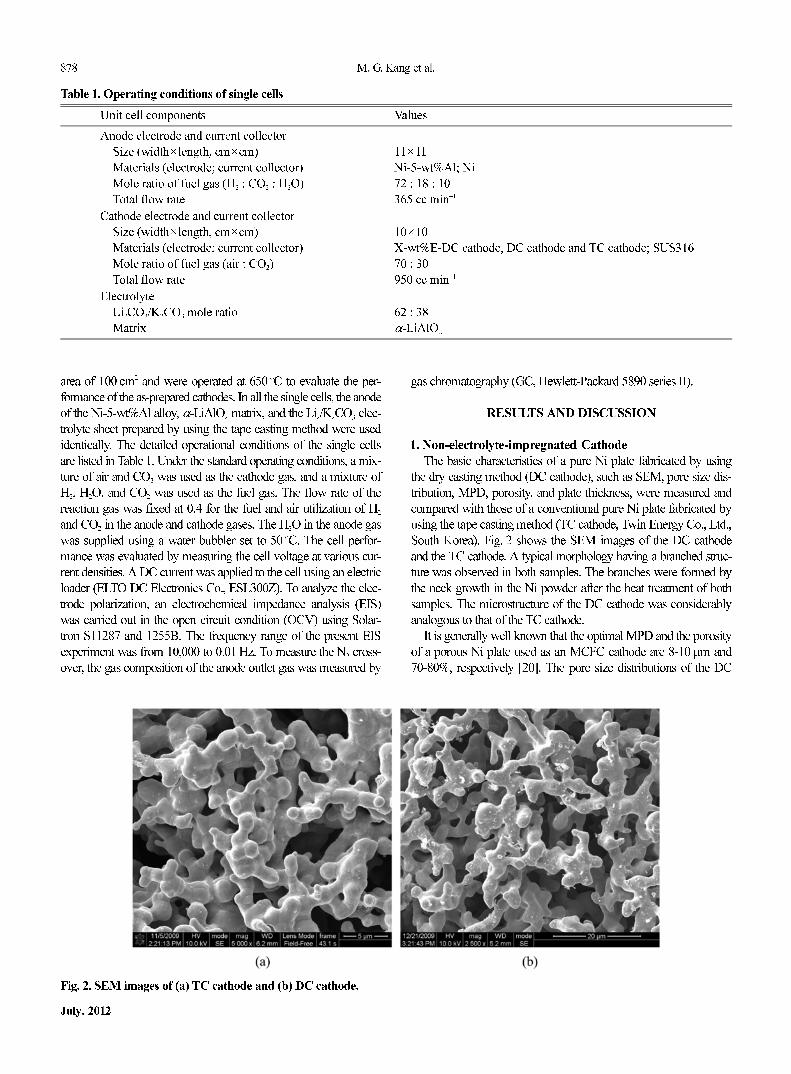
cathode and the TC cathode are shown in Fig. 3. As shown in Fig.
3, the pore size distributions of the DC cathode and the TC cathode
were very similar; these cathodes also had a similar MPD of 7.94µm
and 7.90µm, respectively. These MPD values of the two cathodes
were included in the above-mentioned optimal MPD range of an
MCFC cathode. The porosities of the two cathodes were also com-
pared. The porosities of the DC cathode and the TC cathode were
76.6% and 78.0%, respectively. These porosity values were also
within the optimal range of an MCFC cathode. From the results of
a comparison of the basic characteristics of the two cathodes, we
could confirm that the cathode fabricated by using a very simple
dry casting method had characteristics identical to those of a con-
ventional cathode fabricated by using the tape casting method.
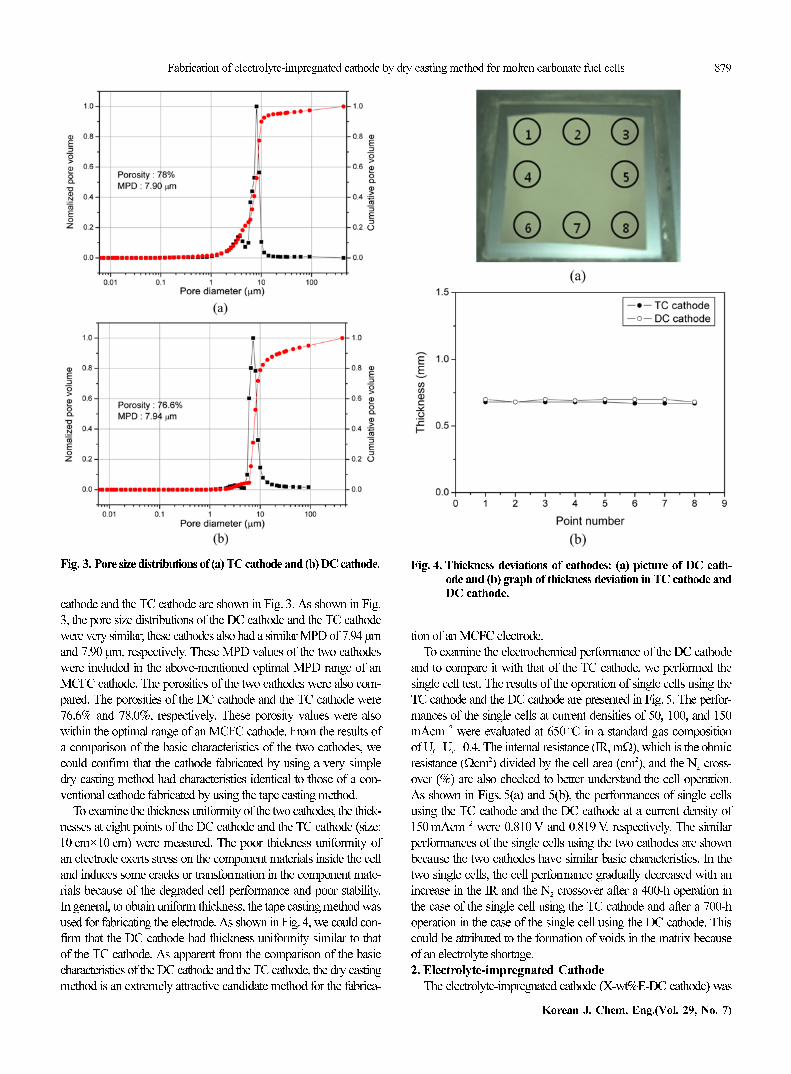
To examine the thickness uniformity of the two cathodes, the thick-
nesses at eight points of the DC cathode and the TC cathode (size:
10 cm×10 cm) were measured. The poor thickness uniformity of
an electrode exerts stress on the component materials inside the cell
and induces some cracks or transformation in the component mate-
rials because of the degraded cell performance and poor stability.
In general, to obtain uniform thickness, the tape casting method was
used for fabricating the electrode. As shown in Fig. 4, we could con-
firm that the DC cathode had thickness uniformity similar to that
of the TC cathode. As apparent from the comparison of the basic
characteristics of the DC cathode and the TC cathode, the dry casting
method is an extremely attractive candidate method for the fabrica-
tion of an MCFC electrode.
To examine the electrochemical performance of the DC cathode
and to compare it with that of the TC cathode, we performed the
single cell test. The results of the operation of single cells using the
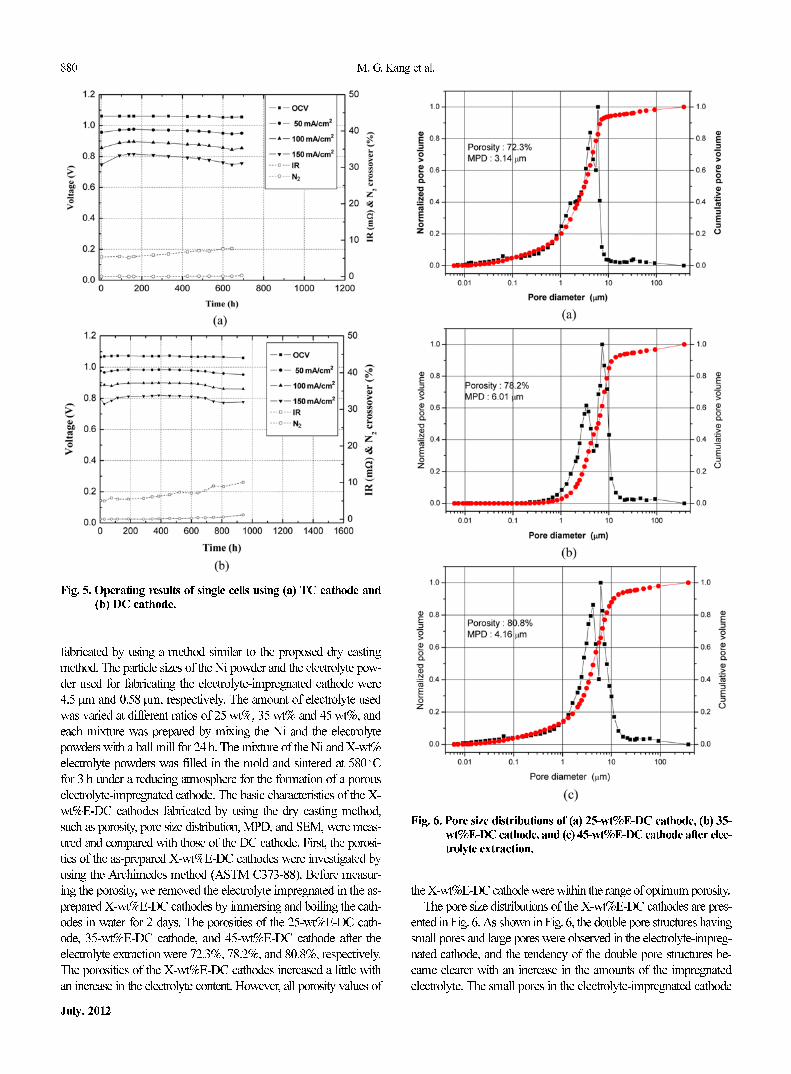
TC cathode and the DC cathode are presented in Fig. 5. The perfor-
mances of the single cells at current densities of 50, 100, and 150
mAcm−2 were evaluated at 650 oC in a standard gas composition
of Uf=Uo=0.4. The internal resistance (IR, mΩ), which is the ohmic
resistance (Ωcm2) divided by the cell area (cm2), and the N2 cross-
over (%) are also checked to better understand the cell operation.
As shown in Figs. 5(a) and 5(b), the performances of single cells
using the TC cathode and the DC cathode at a current density of
150 mAcm−2 were 0.810 V and 0.819 V, respectively. The similar
performances of the single cells using the two cathodes are shown
because the two cathodes have similar basic characteristics. In the
two single cells, the cell performance gradually decreased with an
increase in the IR and the N2 crossover after a 400-h operation in
the case of the single cell using the TC cathode and after a 700-h
operation in the case of the single cell using the DC cathode. This
could be attributed to the formation of voids in the matrix because
of an electrolyte shortage.
2. Electrolyte-impregnated Cathode
The electrolyte-impregnated cathode (X-wt%E-DC cathode) was
Fig. 3. Pore size distributions of (a) TC cathode and (b) DC cathode. Fig. 4. Thickness deviations of cathodes: (a) picture of DC cath-ode and (b) graph of thickness deviation in TC cathode andDC cathode.
880 M. G. Kang et al.
July, 2012
fabricated by using a method similar to the proposed dry casting
method. The particle sizes of the Ni powder and the electrolyte pow-
der used for fabricating the electrolyte-impregnated cathode were
4.5µm and 0.58µm, respectively. The amount of electrolyte used
was varied at different ratios of 25 wt%, 35 wt% and 45 wt%, and
each mixture was prepared by mixing the Ni and the electrolyte
powders with a ball mill for 24 h. The mixture of the Ni and X-wt%
electrolyte powders was filled in the mold and sintered at 580 oC
for 3 h under a reducing atmosphere for the formation of a porous
electrolyte-impregnated cathode. The basic characteristics of the X-
wt%E-DC cathodes fabricated by using the dry casting method,
such as porosity, pore size distribution, MPD, and SEM, were meas-
ured and compared with those of the DC cathode. First, the porosi-
ties of the as-prepared X-wt%E-DC cathodes were investigated by
using the Archimedes method (ASTM C373-88). Before measur-
ing the porosity, we removed the electrolyte impregnated in the as-
prepared X-wt%E-DC cathodes by immersing and boiling the cath-
odes in water for 2 days. The porosities of the 25-wt%E-DC cath-
ode, 35-wt%E-DC cathode, and 45-wt%E-DC cathode after the
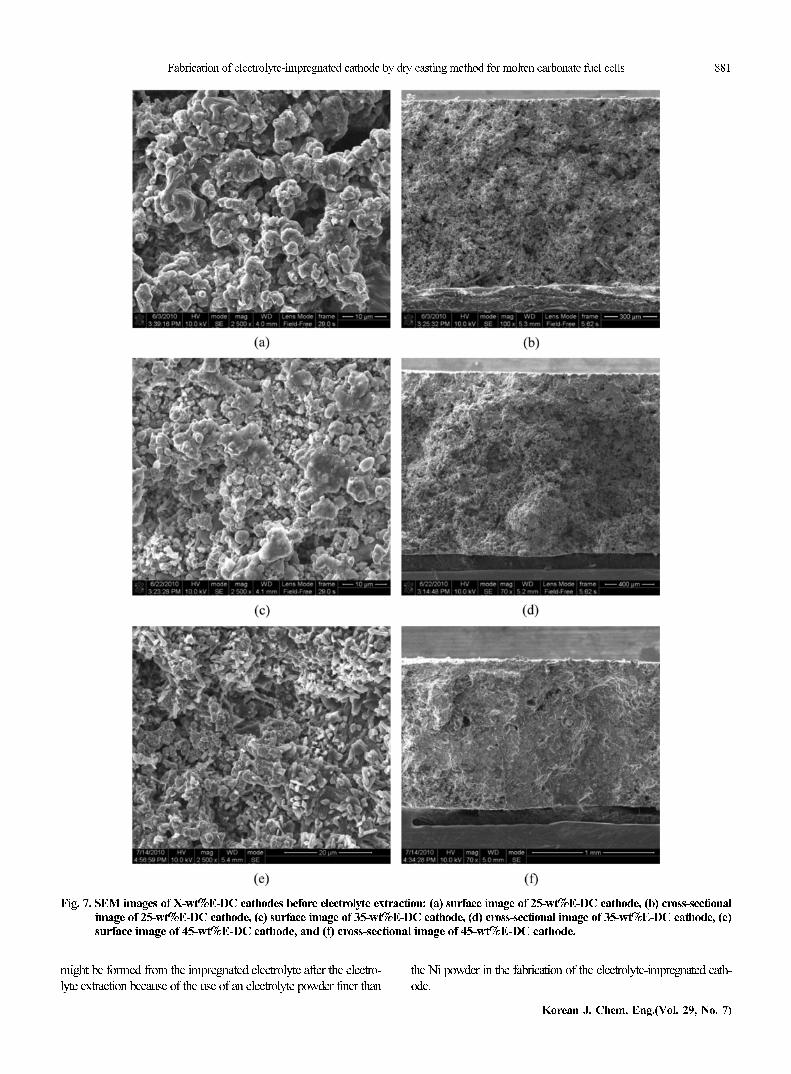
electrolyte extraction were 72.3%, 78.2%, and 80.8%, respectively.
The porosities of the X-wt%E-DC cathodes increased a little with
an increase in the electrolyte content. However, all porosity values of
the X-wt%E-DC cathode were within the range of optimum porosity.
The pore size distributions of the X-wt%E-DC cathodes are pres-
ented in Fig. 6. As shown in Fig. 6, the double pore structures having
small pores and large pores were observed in the electrolyte-impreg-
nated cathode, and the tendency of the double pore structures be-
came clearer with an increase in the amounts of the impregnated
electrolyte. The small pores in the electrolyte-impregnated cathode
Fig. 5. Operating results of single cells using (a) TC cathode and(b) DC cathode.
Fig. 6. Pore size distributions of (a) 25-wt%E-DC cathode, (b) 35-wt%E-DC cathode, and (c) 45-wt%E-DC cathode after elec-trolyte extraction.
Fabrication of electrolyte-impregnated cathode by dry casting method for molten carbonate fuel cells 881
Korean J. Chem. Eng.(Vol. 29, No. 7)
might be formed from the impregnated electrolyte after the electro-
lyte extraction because of the use of an electrolyte powder finer than
the Ni powder in the fabrication of the electrolyte-impregnated cath-
ode.
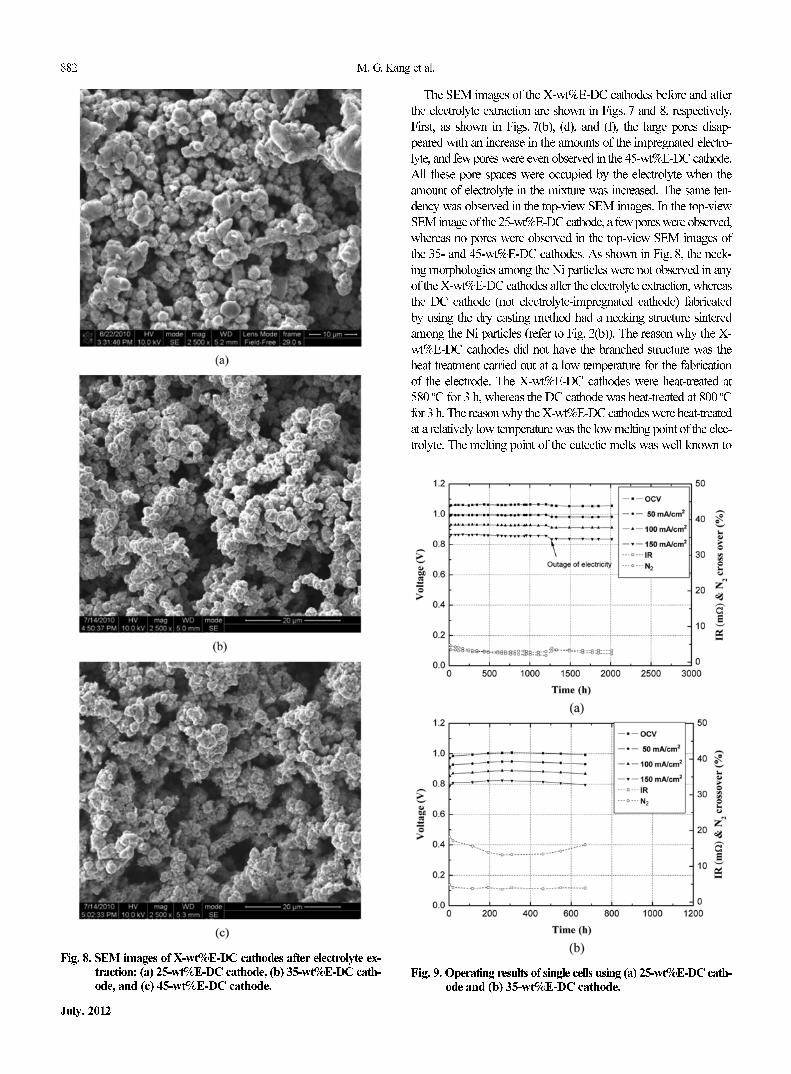
Fig. 7. SEM images of X-wt%E-DC cathodes before electrolyte extraction: (a) surface image of 25-wt%E-DC cathode, (b) cross-sectionalimage of 25-wt%E-DC cathode, (c) surface image of 35-wt%E-DC cathode, (d) cross-sectional image of 35-wt%E-DC cathode, (e)surface image of 45-wt%E-DC cathode, and (f) cross-sectional image of 45-wt%E-DC cathode.
882 M. G. Kang et al.
July, 2012
The SEM images of the X-wt%E-DC cathodes before and after
the electrolyte extraction are shown in Figs. 7 and 8, respectively.
First, as shown in Figs. 7(b), (d), and (f), the large pores disap-
peared with an increase in the amounts of the impregnated electro-
lyte, and few pores were even observed in the 45-wt%E-DC cathode.
All these pore spaces were occupied by the electrolyte when the
amount of electrolyte in the mixture was increased. The same ten-
dency was observed in the top-view SEM images. In the top-view
SEM image of the 25-wt%E-DC cathode, a few pores were observed,
whereas no pores were observed in the top-view SEM images of
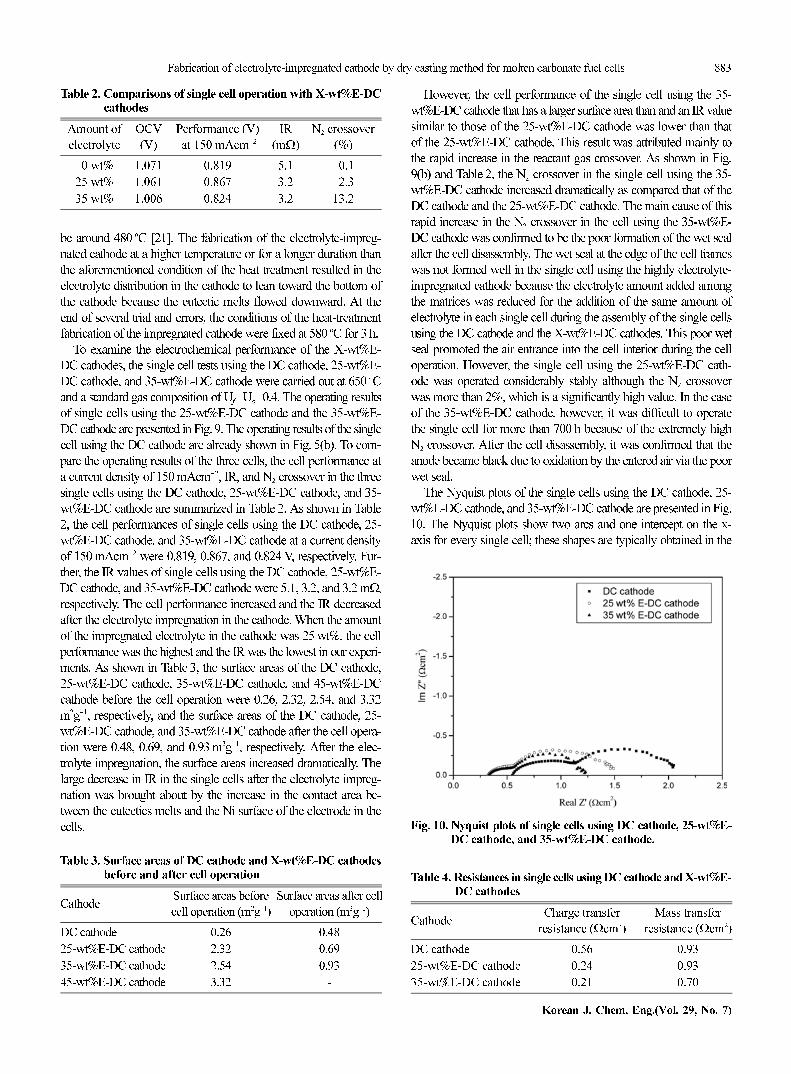
the 35- and 45-wt%E-DC cathodes. As shown in Fig. 8, the neck-
ing morphologies among the Ni particles were not observed in any
of the X-wt%E-DC cathodes after the electrolyte extraction, whereas
the DC cathode (not electrolyte-impregnated cathode) fabricated
by using the dry casting method had a necking structure sintered
among the Ni particles (refer to Fig. 2(b)). The reason why the X-
wt%E-DC cathodes did not have the branched structure was the
heat treatment carried out at a low temperature for the fabrication
of the electrode. The X-wt%E-DC cathodes were heat-treated at
580 oC for 3 h, whereas the DC cathode was heat-treated at 800 oC
for 3 h. The reason why the X-wt%E-DC cathodes were heat-treated
at a relatively low temperature was the low melting point of the elec-
trolyte. The melting point of the eutectic melts was well known to
Fig. 8. SEM images of X-wt%E-DC cathodes after electrolyte ex-traction: (a) 25-wt%E-DC cathode, (b) 35-wt%E-DC cath-ode, and (c) 45-wt%E-DC cathode.
Fig. 9. Operating results of single cells using (a) 25-wt%E-DC cath-ode and (b) 35-wt%E-DC cathode.
Fabrication of electrolyte-impregnated cathode by dry casting method for molten carbonate fuel cells 883
Korean J. Chem. Eng.(Vol. 29, No. 7)
be around 480 oC [21]. The fabrication of the electrolyte-impreg-
nated cathode at a higher temperature or for a longer duration than
the aforementioned condition of the heat treatment resulted in the
electrolyte distribution in the cathode to lean toward the bottom of
the cathode because the eutectic melts flowed downward. At the
end of several trial and errors, the conditions of the heat-treatment
fabrication of the impregnated cathode were fixed at 580 oC for 3 h.
To examine the electrochemical performance of the X-wt%E-
DC cathodes, the single cell tests using the DC cathode, 25-wt%E-
DC cathode, and 35-wt%E-DC cathode were carried out at 650 oC
and a standard gas composition of Uf=Uo=0.4. The operating results
of single cells using the 25-wt%E-DC cathode and the 35-wt%E-
DC cathode are presented in Fig. 9. The operating results of the single
cell using the DC cathode are already shown in Fig. 5(b). To com-
pare the operating results of the three cells, the cell performance at
a current density of 150 mAcm−2, IR, and N2 crossover in the three
single cells using the DC cathode, 25-wt%E-DC cathode, and 35-
wt%E-DC cathode are summarized in Table 2. As shown in Table
2, the cell performances of single cells using the DC cathode, 25-
wt%E-DC cathode, and 35-wt%E-DC cathode at a current density
of 150 mAcm−2 were 0.819, 0.867, and 0.824 V, respectively. Fur-
ther, the IR values of single cells using the DC cathode, 25-wt%E-
DC cathode, and 35-wt%E-DC cathode were 5.1, 3.2, and 3.2 mΩ,
respectively. The cell performance increased and the IR decreased
after the electrolyte impregnation in the cathode. When the amount
of the impregnated electrolyte in the cathode was 25 wt%, the cell
performance was the highest and the IR was the lowest in our experi-
ments. As shown in Table 3, the surface areas of the DC cathode,
25-wt%E-DC cathode, 35-wt%E-DC cathode, and 45-wt%E-DC
cathode before the cell operation were 0.26, 2.32, 2.54, and 3.32
m2g−1, respectively, and the surface areas of the DC cathode, 25-
wt%E-DC cathode, and 35-wt%E-DC cathode after the cell opera-
tion were 0.48, 0.69, and 0.93 m2g−1, respectively. After the elec-
trolyte impregnation, the surface areas increased dramatically. The
large decrease in IR in the single cells after the electrolyte impreg-
nation was brought about by the increase in the contact area be-
tween the eutectics melts and the Ni surface of the electrode in the
cells.
Table 2. Comparisons of single cell operation with X-wt%E-DCcathodes
Amount of
electrolyte
OCV
(V)
Performance (V)
at 150 mAcm−2
IR
(mΩ)
N2 crossover
(%)
00 wt% 1.071 0.819 5.1 00.1
25 wt% 1.061 0.867 3.2 02.3
35 wt% 1.006 0.824 3.2 13.2
Table 3. Surface areas of DC cathode and X-wt%E-DC cathodesbefore and after cell operation
CathodeSurface areas before
cell operation (m2g−1)
Surface areas after cell
operation (m2g−1)
DC cathode 0.26 0.48
25-wt%E-DC cathode 2.32 0.69
35-wt%E-DC cathode 2.54 0.93
45-wt%E-DC cathode 3.32 -
Fig. 10. Nyquist plots of single cells using DC cathode, 25-wt%E-DC cathode, and 35-wt%E-DC cathode.
Table 4. Resistances in single cells using DC cathode and X-wt%E-DC cathodes
CathodeCharge transfer
resistance (Ωcm2)
Mass transfer
resistance (Ωcm2)
DC cathode 0.56 0.93
25-wt%E-DC cathode 0.24 0.93
35-wt%E-DC cathode 0.21 0.70
However, the cell performance of the single cell using the 35-
wt%E-DC cathode that has a larger surface area than and an IR value
similar to those of the 25-wt%E-DC cathode was lower than that
of the 25-wt%E-DC cathode. This result was attributed mainly to
the rapid increase in the reactant gas crossover. As shown in Fig.
9(b) and Table 2, the N2 crossover in the single cell using the 35-
wt%E-DC cathode increased dramatically as compared that of the
DC cathode and the 25-wt%E-DC cathode. The main cause of this
rapid increase in the N2 crossover in the cell using the 35-wt%E-
DC cathode was confirmed to be the poor formation of the wet seal
after the cell disassembly. The wet seal at the edge of the cell frames
was not formed well in the single cell using the highly electrolyte-
impregnated cathode because the electrolyte amount added among
the matrices was reduced for the addition of the same amount of
electrolyte in each single cell during the assembly of the single cells
using the DC cathode and the X-wt%E-DC cathodes. This poor wet
seal promoted the air entrance into the cell interior during the cell
operation. However, the single cell using the 25-wt%E-DC cath-
ode was operated considerably stably although the N2 crossover
was more than 2%, which is a significantly high value. In the case
of the 35-wt%E-DC cathode, however, it was difficult to operate
the single cell for more than 700 h because of the extremely high
N2 crossover. After the cell disassembly, it was confirmed that the
anode became black due to oxidation by the entered air via the poor
wet seal.
The Nyquist plots of the single cells using the DC cathode, 25-
wt%E-DC cathode, and 35-wt%E-DC cathode are presented in Fig.
10. The Nyquist plots show two arcs and one intercept on the x-
axis for every single cell; these shapes are typically obtained in the
884 M. G. Kang et al.
July, 2012
case of the MCFC single cells. It is generally known that the width
of the first arc in a high-frequency region represents the charge-transfer
resistance, the width of the second arc in a low-frequency region
shows the mass-transfer resistance, and the intercept on the x-axis
indicates the ohmic resistance [22]. The charge transfer resistance
and the mass transfer resistance can be separated from the Nyquist
plots and are summarized in Table 4. As shown in this table, the
charge transfer resistance decreased dramatically after the electro-
lyte impregnation, and the mass transfer resistance was similar (in
the case of the 25-wt%E-DC cathode) or decreased (in the case of
the 35-wt%E-DC cathode). A significant decrease in the charge trans-
fer resistance in the X-wt%E-DC cathodes after the electrolyte im-
pregnation could be explained on the basis of the increase in the
surface area of the cathode after the electrolyte impregnation. That
is, the increase in the three-phase boundary (TPB), in which the
cathode reaction occurred, could be attributed to the increase in the
surface area of the X-wt%E-DC cathodes after the electrolyte impreg-
nation improved the charge transfer resistance and enhanced the
cell performance.
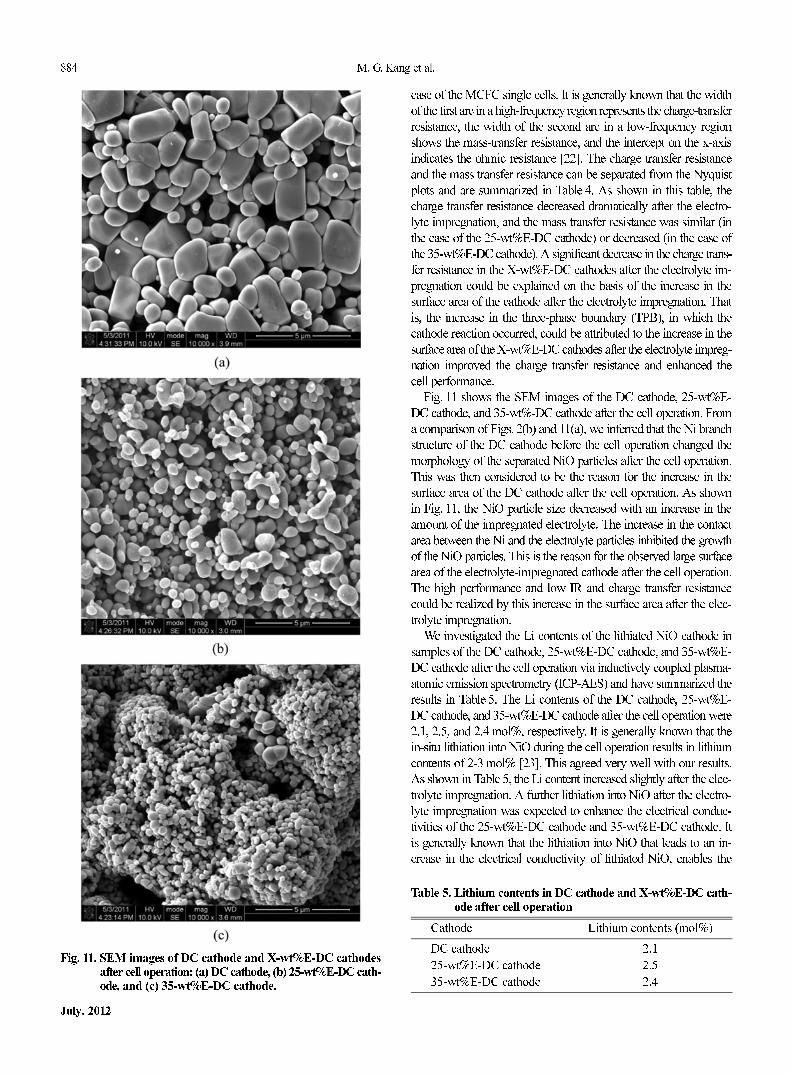
Fig. 11 shows the SEM images of the DC cathode, 25-wt%E-
DC cathode, and 35-wt%-DC cathode after the cell operation. From
a comparison of Figs. 2(b) and 11(a), we inferred that the Ni branch
structure of the DC cathode before the cell operation changed the
morphology of the separated NiO particles after the cell operation.
This was then considered to be the reason for the increase in the
surface area of the DC cathode after the cell operation. As shown
in Fig. 11, the NiO particle size decreased with an increase in the
amount of the impregnated electrolyte. The increase in the contact
area between the Ni and the electrolyte particles inhibited the growth
of the NiO particles. This is the reason for the observed large surface
area of the electrolyte-impregnated cathode after the cell operation.
The high performance and low IR and charge transfer resistance
could be realized by this increase in the surface area after the elec-
trolyte impregnation.
We investigated the Li contents of the lithiated NiO cathode in
samples of the DC cathode, 25-wt%E-DC cathode, and 35-wt%E-
DC cathode after the cell operation via inductively coupled plasma-
atomic emission spectrometry (ICP-AES) and have summarized the
results in Table 5. The Li contents of the DC cathode, 25-wt%E-
DC cathode, and 35-wt%E-DC cathode after the cell operation were
2.1, 2.5, and 2.4 mol%, respectively. It is generally known that the
in-situ lithiation into NiO during the cell operation results in lithium
contents of 2-3 mol% [23]. This agreed very well with our results.
As shown in Table 5, the Li content increased slightly after the elec-
trolyte impregnation. A further lithiation into NiO after the electro-
lyte impregnation was expected to enhance the electrical conduc-
tivities of the 25-wt%E-DC cathode and 35-wt%E-DC cathode. It
is generally known that the lithiation into NiO that leads to an in-
crease in the electrical conductivity of lithiated NiO, enables the
Fig. 11. SEM images of DC cathode and X-wt%E-DC cathodesafter cell operation: (a) DC cathode, (b) 25-wt%E-DC cath-ode, and (c) 35-wt%E-DC cathode.
Table 5. Lithium contents in DC cathode and X-wt%E-DC cath-ode after cell operation
Cathode Lithium contents (mol%)
DC cathode 2.1
25-wt%E-DC cathode 2.5
35-wt%E-DC cathode 2.4
Fabrication of electrolyte-impregnated cathode by dry casting method for molten carbonate fuel cells 885
Korean J. Chem. Eng.(Vol. 29, No. 7)
use of in-situ lithiated NiO as an MCFC cathode despite the fact that
NiO has poor electrical conductivity [4]. According to van Houten’s
results [24], the electrical conductivity increased with an increase
in the lithium content in lithiated NiO. In particular, the electrical
conductivity of lithiated NiO increased rapidly in the range of 0-
4 mol% of Li content. This implied that the further lithiation of NiO
in the samples of electrolyte impregnation took place during cell
operation because of the increase in the contact area between the
electrolyte and the Ni particles after the electrolyte impregnation.
This increase in the electrical conductivity after the electrolyte im-
pregnation led to an improvement in the cell performance and a
decrease in the charge transfer resistance.
CONCLUSION
The MCFC cathode was fabricated successfully by using a sim-
ple dry casting method. The as-prepared cathode had the same basic
characteristics as those of the conventional cathode fabricated by
using the tape casting method and exhibited similar operation results
in the single cell. Therefore, the proposed dry casting method is very
attractive as a manufacturing method of MCFC electrodes because
it is a simplified eco-friendly process.
The electrolyte-impregnated cathodes were also successfully fab-
ricated by using the proposed dry casting method. The high cell
performance and the stable cell operation were obtained in a single
cell using the 25-wt% electrolyte-impregnated cathode. The improve-
ment in the cell performance in this single cell was attributed to the
decrease in the IR and the charge transfer resistance. The decrease
in the IR and the charge transfer resistance was caused by the in-
crease in the contact area between the Ni and the electrolyte parti-
cles after the electrolyte impregnation enlarged the TPB area in which
the cathode reaction occurred. Further, the lithiation into NiO im-
proved the electrical conductivity of the in-situ lithiated NiO cath-
ode. However, a degradation of the cell performance and a decrease
in the cell operation time were observed in the single cell using the
35-wt% electrolyte-impregnated cathode because of the rapid increase
in the N2 crossover caused by the poor formation of a wet seal. Hence,
the optimum amount of the electrolyte to be impregnated into the
cathode that would lead to a high cell performance and long-term
stability was determined.
ACKNOWLEDGEMENT
This work was supported by the New & Renewable Energy of
the Korea Institute of Energy Technology Evaluation and Planning
(KETEP) grant funded by the Korean Government’s Ministry of
Knowledge Economy (Project No. 2007NFC12P0130502009 &
2008NFC12J0431102010).
REFERENCES
1. S. A. Song, J. Han, S. P. Yoon, S. W. Nam, I.-H. Oh and D. K. Choi,
J. Electrochem. Sci. Technol., 1, 102 (2010).
2. J.-H. Lim, G. B. Yi, K. H. Suh, J.-K. Lee, Y. S. Kim and H.-S. Chun,
Korean J. Chem. Eng., 16, 856 (1999).
3. Y.-S. Kim, H.-S. Choo, M.-C. Shin, M.-Z. Hong, J.-H. Lim and H.-S.
Chun, Korean J. Chem. Eng., 17, 497 (1999).
4. A. Dicks, Curr. Opin. Solid State Mater. Sci., 8, 379 (2004).
5. Z. P. Liu, P. Y. Guo and C. L. Zeng, J. Power Sources, 166, 348
(2007).
6. E. Park, M. Hong, H. Lee, M. Kim and K. Kim, J. Power Sources,
143, 84 (2005).
7. S. Y. Lee, H.-C. Lim and G.-Y. Chung, Korean J. Chem. Eng., 27,
487 (2010).
8. S. Randstrom, C. Lagergren and S. Scaccia, Fuel Cells, 7, 218
(2007).
9. B. H. Ryu, I. G. Jang, K. H. Moon, J. Han and T.-H. Lim, J. Fuel
Cell Sci. Technol., 3, 389 (2006).
10. H.-H. Park, C.-I. Jang, H.-S. Shin and K.-T. Lee, Korean J. Chem.
Eng., 13, 35 (1996).
11. X.-J. Luo, B.-L. Zhang, W.-L. Li and H.-R. Zhung, Ceram. Int., 30,
2099 (2004).
12. F. Li, C. Wang and K. Hu, Mater. Res. Bull., 37, 1907 (2002).
13. D. Hotza and P. Greil, Mater. Sci. Eng., A202, 206 (1995).
14. C. Fu, S. H. Chan, Q. Liu, X. Ge and G. Pasciak, Int. J. Hydrog.
Energy, 35, 301 (2010).
15. Z. Lv, T. Zhang, D. Jiang, J. Zhang and Q. Lin, Ceram. Int., 35, 1889
(2009).
16. Y.-P. Zeng, A. Zimmermann, L. Zhou and F. Aldinger, J. Eur. Ceram.
Soc., 24, 253 (2004).
17. B. H. Ryu, Y. S. Kim, C.-S. Jun and M. Y. Shin, US Patent, 160,181
(2008).
18. G. Xu and C. Yuh, US Patent, 257,721 (2006).
19. B. H. Ryu, Y. S. Kim, C.-S. Jun and M. Y. Shin, US Patent, 157,419
(2008).
20. A. Wijayasinghe, B. Bergman and C. Lagergren, Solid State Ionics,
177, 175 (2006).
21. S. Mitsushima, K. Matsuzawa, N. Kamiya and K. Ota, Electrochim.
Acta, 47, 3823 (2002).
22. S. A. Song, M. G. Kang, J. Han, S. P. Yoon, S. W. Nam, I.-H. Oh
and D. K. Choi, J. Electrochem. Soc., 158, B660 (2011).
23. P. A. Lessing, G. R. Miller and H. Yamada, J. Electrochem. Soc.,
133, 1537 (1986).
24. S. van Houten, J. Phys. Chem. Solids, 17, 7 (1960).