Embed Size (px)
Citation preview

ORNL/MDF-TC-2017-120 CRADA/NFE-17-06802
Fabrication and Modeling of Laser Additive Manufactured Materials with
Multi-Beam Adaptive Beam Shaping
Alex Plotkowski August 1, 2018
CRADA FINAL REPORT
NFE-17-06802
Approved for Public Release.
Distribution is Unlimited.

DOCUMENT AVAILABILITY
Reports produced after January 1, 1996, are generally available free via US Department of Energy (DOE) SciTech Connect. Website http://www.osti.gov/scitech/ Reports produced before January 1, 1996, may be purchased by members of the public from the following source: National Technical Information Service 5285 Port Royal Road Springfield, VA 22161 Telephone 703-605-6000 (1-800-553-6847) TDD 703-487-4639 Fax 703-605-6900 E-mail [email protected] Website http://www.ntis.gov/help/ordermethods.aspx Reports are available to DOE employees, DOE contractors, Energy Technology Data Exchange representatives, and International Nuclear Information System representatives from the following source: Office of Scientific and Technical Information PO Box 62 Oak Ridge, TN 37831 Telephone 865-576-8401 Fax 865-576-5728 E-mail [email protected] Website http://www.osti.gov/contact.html
This report was prepared as an account of work sponsored by an agency of the United States Government. Neither the United States Government nor any agency thereof, nor any of their employees, makes any warranty, express or implied, or assumes any legal liability or responsibility for the accuracy, completeness, or usefulness of any information, apparatus, product, or process disclosed, or represents that its use would not infringe privately owned rights. Reference herein to any specific commercial product, process, or service by trade name, trademark, manufacturer, or otherwise, does not necessarily constitute or imply its endorsement, recommendation, or favoring by the United States Government or any agency thereof. The views and opinions of authors expressed herein do not necessarily state or reflect those of the United States Government or any agency thereof.

ORNL/MDF-TC-2017-120
CRADA/NFE-17-06802
Materials Science and Technology Division
Advanced Manufacturing Office
Fabrication and Modeling of Laser Additive Manufactured Materials with Multi-Beam
Adaptive Beam Shaping
Authors
Alex Plotkowski
Date Published:
August 1, 2018
Prepared by
OAK RIDGE NATIONAL LABORATORY
Oak Ridge, Tennessee 37831-6283
managed by
UT-BATTELLE, LLC
for the
US DEPARTMENT OF ENERGY
under contract DE-AC05-00OR22725
Approved For Public Release


v
CONTENTS
Page
CONTENTS ........................................................................................................................................... v LIST OF FIGURES ............................................................................................................................... vi ACKNOWLEDGEMENTS ................................................................................................................. vii abstract.................................................................................................................................................... 1 1. Fabrication and Modeling of Laser Additive Manufactured Materials with Multi-Beam Adaptive
Beam Shaping ......................................................................................................................................... 1 1.1 Background ............................................................................................................................ 1 1.2 TECHNICAL RESULTS ....................................................................................................... 3
1.2.1 Experimental Setup, Sample Fabrication and Characterization ........................................... 3 1.2.2 Analytical Model Formulation and Initial Verification ........................................................ 6 1.2.3 Numerical Model Implementation and Comparison ............................................................. 9 1.2.4 The Columnar-to-Equiaxed Transition ............................................................................... 12
1.3 Impacts ................................................................................................................................. 15 1.4 conclusions ........................................................................................................................... 15 1.5 References ............................................................................................................................ 16
2. Optonicus Background .................................................................................................................... 19

vi
LIST OF FIGURES
Figure 1: The difference in tensile behavior between EBM manufactured IN718 samples, showing
extreme anisotropy in columnar (black) microstructure, and isotropic behavior in equiaxed (blue)
microstructures. ...................................................................................................................................... 2 Figure 2: A schematic of the selection of columnar vs. equiaxed grain structures as a function of
solidification conditions with approximate locations of EBM and SLM processing windows. ............ 2 Figure 3: (a) examples of simple bead-on-plate experiments performed using a multi-beam laser array
and (b) proof-of-concept thing walls and cubes additively manufacturing using the same system. ...... 3 Figure 4: Schematic of the multi-beam system. ..................................................................................... 4 Table 1: List of beam locations for each configuration. ........................................................................ 4 Figure 5: Schematic of the two beam configurations and related processing parameters. .................... 5 Figure 6: Photographs of samples produced using (a) beam configuration C2 and (b) beam
configuration C3. ................................................................................................................................... 5 Figure 7: Inverse pole figure and pole figures indicating the grain structure and texture of samples
build with (a-c) beam configuration C2, and (d-f) beam configuration C3. .......................................... 5 Figure 8: Histograms of grain size by area fraction comparing samples manufactured using each beam
configuration. ......................................................................................................................................... 6 Figure 9: Comparison of the three analytical solutions, at a steady-state, for known parameters used in
electron beam melting of IN718. ........................................................................................................... 8 Figure 10: A quantitative comparison of the centerline temperature profile for the three analytical
models at steady state for a known EBM parameter set. ....................................................................... 8 Figure 11: A comparison of the quasi-static melt pool geometries for beam configurations (a) C2 and
(b) C3, plus a further comparison (c) for beam configuration C3 with the same beam velocity as C2. 9 Figure 12: Comparison of the quasi-static thermal field around the heat source for configuration C2
between the CFD model without latent heat or fluid flow (top) and the analytical model (bottom). .. 11 Figure 13: Comparison of the quasi-static thermal field around the heat source for configuration C3
between the CFD model without latent heat or fluid flow (top) and the analytical model (bottom). .. 11 Figure 14: Comparison of the effect of fluid flow on the melt pool shape for beam configuration C2.
............................................................................................................................................................. 12 Figure 15: Comparison of the effect of fluid flow on the melt pool shape for beam configuration C3.
............................................................................................................................................................. 12 Figure 16: Comparison of solid-liquid interface velocity and thermal gradient data for C2 and C3
beam configurations for quasi-static heat transfer conditions. Insets show predicted cross-sections
(assuming maximum energy absorptance) for each case colored by the thermal gradient distribution.
Case C3s denotes the C3 beam configuration where the beam velocity has been slowed to the same as
the conditions used for C2. .................................................................................................................. 13 Figure 17: Thermal gradient maps of the layer-scale simulations, showing sample C2 in (a) the x-y
plane and (b) as an isometric view of the three-dimensional data cross-sectioned in the y-z plane, and
similarly, C3 in (c) the x-y plane and (d) as an isometric view in the y-z plane cross-section. ........... 14 Figure 18: (a) A comparison of the predicted solidification conditions for samples C2 and C3 for a
complete layer relative to an estimated CET curve for IN718, and (b) calculated probability
distributions of the equiaxed grain fractions within a single layer for each of the beam configurations.
............................................................................................................................................................. 15

vii
ACKNOWLEDGEMENTS
This CRADA NFE-17-06802 was conducted as a Technical Collaboration project within the Oak
Ridge National Laboratory (ORNL) Manufacturing Demonstration Facility (MDF) sponsored by the
US Department of Energy Advanced Manufacturing Office (CPS Agreement Number 24761).
Opportunities for MDF technical collaborations are listed in the announcement “Manufacturing
Demonstration Facility Technology Collaborations for US Manufacturers in Advanced
Manufacturing and Materials Technologies” posted at
http://web.ornl.gov/sci/manufacturing/docs/FBO-ORNL-MDF-2013-2.pdf. The goal of technical
collaborations is to engage industry partners to participate in short-term, collaborative projects within
the Manufacturing Demonstration Facility (MDF) to assess applicability and of new energy efficient
manufacturing technologies. Research sponsored by the U.S. Department of Energy, Office of Energy
Efficiency and Renewable Energy, Advanced Manufacturing Office, under contract DE-AC05-
00OR22725 with UT-Battelle, LLC.

viii

1
ABSTRACT
The objective of this research was to fabricate laser additive manufactured samples using the
multi-beam fiber laser array system developed Optonicus and to test the ability of existing simulation
tools to help understand the influence of various beam configurations on the heat transfer and
solidification conditions that control microstructure development during process. Optonicus produced
IN718 samples with two different beam configurations that exhibited dramatically different
microstructure characteristics. A simplified analytical model was used in conjunction with
microstructure selection theory to relate the differences in beam configuration and process conditions
to the changes in microstructure. The analytical model was verified against standard quasi-static
solutions and a numerical CFD model and the influence of fluid mechanics on the melt pool geometry
was evaluated.
1. FABRICATION AND MODELING OF LASER ADDITIVE MANUFACTURED
MATERIALS WITH MULTI-BEAM ADAPTIVE BEAM SHAPING
This phase 1 technical collaboration project (MDF-TC-2017-120) was begun on August 7, 2017
and was completed on August 1, 2018. The collaboration partner Optonicus is a small business. The
project found that use of a adaptive multi-beam laser system may be effectively utilized to control
grain structure development in additive manufacturing of IN718, and that existing thermal simulation
tools are suitable for understanding the influence of complex heat source distributions on the thermal
conditions and subsequent microstructure development in such systems.
1.1 BACKGROUND
Metals produced with additive manufacturing processes contain columnar microstructures under
standard processing parameters. This type of microstructure results in anisotropic mechanical
properties (Figure 1) which, while appropriate for some applications, are not suitable for complex
stress states [1]. In these cases, an equiaxed microstructure with isotropic properties is preferred.

2
Figure 1: The difference in tensile behavior between EBM manufactured IN718 samples, showing
extreme anisotropy in columnar (black) microstructure, and isotropic behavior in equiaxed (blue)
microstructures.
Recent advances in electron-beam melting technology have allowed for the selection of columnar
or equiaxed microstructure on a site-specific basis through manipulation of scan strategies and
process parameters [2]. However, an analogous approach is not feasible for laser-based processes.
Figure 2 shows a schematic of the influence of solidification parameters (the thermal gradient, 𝐺, and
local solid-liquid interface velocity, 𝑅) on the selection of columnar or equiaxed microstructures.
Laser processes are limited to lower pre-heat temperature (increasing the thermal gradients) and lower
beam velocities (reducing the interface velocity). As a result, it is currently impossible to select
equiaxed microstructures given the limitations of commercially available laser powder-bed processes.
Figure 2: A schematic of the selection of columnar vs. equiaxed grain structures as a function of
solidification conditions with approximate locations of EBM and SLM processing windows.

3
Optonicus seeks to leverage its expertise and production of multi-beam, adaptive fiber laser
arrays to advance the field of laser additive manufacturing (LAM). This technology allows for phase
locked combining of multiple beams as well as individual beam phase and position control. In this
way, the fiber laser array permits precise, multi-beam adaptive beam shaping on demand [3,4].
Optonicus has applied this system to fabricate proof of principle laser additive manufactured samples,
including both evaluation of the effect of different energy profiles for single beads, and to fabricate
thin walls and simple geometries (Figure 3).
The capability to shape the beam has a profound effect on the melt pool geometry and associated
cooling conditions. The purpose of this project is to use these dynamic beam-shaping capabilities to
control the solidification conditions such that the grain structure is locally controlled on a site-specific
basis.
(a) (b)
Figure 3: (a) examples of simple bead-on-plate experiments performed using a multi-beam laser array
and (b) proof-of-concept thing walls and cubes additively manufacturing using the same system.
The purpose of this collaboration was to implement existing models to connect the multi-beam
configuration to the heat transfer and solidification conditions that dictate grain structure
development. Several samples were build and characterized to understand the influence of beam
configuration on microstructure evolution. The existing models were extended to account for the
multi-beam heat source and validated against the experimental evidence to help to understand the
underlying physical phenomena that control grain structure formation and to target future system
development based on an understanding of the process-microstructure linkages. Success in this phase
of the collaboration is defined by the identification of relevant modeling tools for predicting the effect
of beam configuration and verification that these may be used for understanding microstructure
development. This research improves upon current single beam modeling and fabrication, allowing
for additional control of the LAM process for the successful production of controlled microstructure,
eliminating defects in the production of advanced alloys, and improving process throughput.
1.2 TECHNICAL RESULTS
1.2.1 Experimental Setup, Sample Fabrication and Characterization
A schematic for the optics used in the multi-beam LAM system is shown in Figure 4. It consists
of seven adaptive beams that may be shaped into multiple configurations. In this case, two different
beam configuration were used to build IN718 samples. Table 1 describes the relative location of each

4
of the seven beams for configuration 2 (C2) and configuration 3 (C3). These configurations are also
shown schematically in Figure 5 along with the other relevant process parameters used for each. Note
that these process parameters were optimized individually for their respective beam configurations
and that they vary in hatch spacing and beam velocity.
Figure 4: Schematic of the multi-beam system.
Table 1: List of beam locations for each configuration.
Beam C2 C3
𝒙𝒊 (μm) 𝒚𝒊 (μm) 𝒙𝒊 (μm) 𝒚𝒊 (μm)
1 -200 0 -50 50
2 -133 0 0 50
3 -66 0 50 50
4 0 0 0 0
5 66 0 -50 -50
6 133 0 0 -50
7 200 0 50 -50

5
Figure 5: Schematic of the two beam configurations and related processing parameters.
The two beam configurations were used to manufacture 5mm cubes using IN718 powder. Figure
6 shows photographs of the two cubes.
Figure 6: Photographs of samples produced using (a) beam configuration C2 and (b) beam configuration
C3.
The two samples were sectioned and characterized using electron back scatter diffraction (EBSD)
at ORNL. The two samples exhibit dramatically different grain structures. The C2 sample shows a
primarily columnar structure with a sharp fiber texture with a maximum of over 14 multiples of
random. On the other hand, sample C3 shows a comparatively weak texture, with a maximum of 4.7
multiples of random, indicating a nearly equiaxed structure. Further characterization showed that the
type and strength of the texture did not vary as a function of sample height. Figure 8 shows
histograms of the area weighted grain size of each sample, as extracted from the EBSD data, which
will be used to calibrate the columnar-to-equiaxed transition model.
Figure 7: Inverse pole figure and pole figures indicating the grain structure and texture of samples build
with (a-c) beam configuration C2, and (d-f) beam configuration C3.

6
Figure 8: Histograms of grain size by area fraction comparing samples manufactured using each beam
configuration.
1.2.2 Analytical Model Formulation and Initial Verification
The well-known Rosenthal equation [5,6] gives the three-dimensional, steady state
temperature field for a point heat source moving in the x-direction:
𝑇(𝑥, 𝑅) = 𝑇0 +𝑞
2𝜋𝑘(
1
𝑅) exp {−
𝑣
2𝑎(𝑅 + 𝑥)}, (1)
where 𝑇0 is the initial temperature, 𝑞 the absorbed power, 𝑘 thermal conductivity, 𝑣 the beam
velocity, 𝛼 thermal diffusivity, and the distance from the beam location to the point of interest is
𝑅 = √𝑥2 + 𝑦2 + 𝑧2, (2)
where the coordinates are written relative to the position of the energy source such that 𝑥 = 𝑥𝑏 −𝑥𝑝, 𝑦 = 𝑦𝑏 − 𝑦𝑝, and 𝑧 = 𝑧𝑏 − 𝑧𝑝, in which 𝑏 subscripts denote the coordinates of the beam and 𝑝
subscripts the coordinates of the point of interest. ORNL has previously implemented a transient
semi-analytical heat conduction model for additive manufacturing and shown that it is useful for
approximating solidification conditions for complex scan patterns [7]. The model used there was
based on that proposed by Komanduri and Hou for arc and laser welding processes [8–10]. The
method relies on a transient solution for a stationary circular ring heat source [11]. The solution for a
ring active for a differential time period is integrated in time to construct the temperature field for an
arbitrary beam path. The solution at time 𝑡 is
𝑇(𝑥, 𝑦, 𝑧) = 𝑇0 +𝑞
𝑐𝑝𝜌(4𝜋𝛼)3/2∫
1
(𝑡 − 𝑡′)3/2exp (−
𝑟02 + 𝑥2 + 𝑦2 + 𝑧2
4𝛼(𝑡 − 𝑡′))
𝑡
0
∙ 𝐼0 (𝑟0
2𝛼𝜏√𝑥2 + 𝑦2) 𝑑𝑡′,
(3)
Where 𝑥, 𝑦, and 𝑧 are coordinates relative to the position of the moving beam, making them
piece-wise functions of time.

7
Optonicus have implemented a similar model based on the work of Nguyen et al. [12] that
assumes a volumetric Gaussian heat source. The temperature 𝑇 at time 𝑡 and location 𝑥, 𝑦, 𝑧 for a
single volumetric Gaussian beam (denoted 𝑗) may be expressed as
𝑇(𝑥, 𝑦, 𝑧, 𝑡) = 𝑇0 +2𝑞𝑗
𝜌𝑐𝜋3/2∫ Φ𝑗(𝑥, 𝑦, 𝑧, 𝑡, 𝑡′)Ψ𝑗(𝑡, 𝑡′)𝑑𝑡′
𝑡
0
(4)
where 𝑇0 is the initial temperature, 𝑞𝑗 the beam power, 𝜌 density, and 𝑐 specific heat capacity. The
functions within the integrand are defined as
Φ𝑗(𝑥, 𝑦, 𝑧, 𝑡, 𝑡′) = exp [−(𝑥 − 𝑥𝑗(𝑡′))
2
𝜎𝑥𝑗2 + 4𝛼(𝑡 − 𝑡′)
−(𝑦 − 𝑦𝑗(𝑡′))
2
𝜎𝑦𝑗2 + 4𝛼(𝑡 − 𝑡′)
−𝑧2
𝜎𝑧𝑗2 + 4𝛼(𝑡 − 𝑡′)
], (5)
and
Ψ𝑗(𝑡, 𝑡′) =1
√𝜎𝑥𝑗2 + 4𝛼(𝑡 − 𝑡′)√𝜎𝑦𝑗
2 + 4𝛼(𝑡 − 𝑡′)√𝜎𝑧𝑗2 + 4𝛼(𝑡 − 𝑡′)
, (6)
where 𝛼 is the thermal diffusivity, the shape of the beam is defined with width in the 𝑥, 𝑦, and 𝑧
directions (𝜎𝑥𝑗, 𝜎𝑦𝑗, 𝜎𝑧𝑗), and the position of the beam at time 𝑡′ is given by 𝑥𝑗(𝑡′) and 𝑦𝑗(𝑡′), which
accounts for the transient scan path, as well as the beam offset from the center of the scan trajectory.
To calculate the combined effect of 𝐽 number of beams, multiple solutions may simply be
superimposed. This approach is valid for either of the transient model proposed here. As an example,
Equation 6 may be superimposed on itself for various beam locations as:
𝑇(𝑥, 𝑦, 𝑧, 𝑡) = 𝑇0 +2
𝜌𝑐𝜋3/2∑ 𝑞𝑗
𝐽
𝑗=1
∫ Φ𝑗(𝑥, 𝑦, 𝑧, 𝑡, 𝑡′)Ψ𝑗(𝑡, 𝑡′)𝑑𝑡′𝑡
0
(7)
The above transient solutions are analytical, but due to the piece-wise time-varying nature of the
beam path, the time integrals are not simple to evaluate analytically. Instead, numerical integration is
used to calculate the temperature for each location as time progresses through the process. This
approach has been implemented in a C++ code for interpreting scan patterns, determining the melt
pool location, and performing this integration, similar to methods previously described by Plotkowski
et al. [7,13]. A three-dimensional rectilinear grid is constructed, and the temperature is calculated at
each point through time according the scan path of interest.
First, the transient analytical models were verified for a simple case against the established
Rosenthal solution. A sample set of processing parameters for electron beam melting of IN718 were
used (the same parameters were previously used as a test case by Plotkowski et al. [7]) and material
properties given by Raghavan et al. [14] for IN718 were used. To approximate steady state
conditions, the transient models simulated a long scan path in a single direction and a snapshot was
taken after the shape of the melt pool has ceased changing. For both of the transient models where the
heat source has finite dimensions, the size of the heat source was made small compared to the size of
the melt pool to approximate the behavior of the point source Rosenthal solution. The temperature
fields for all three models are shown in Figure 9. The results are also compared quantitatively along
the centerline of the beam path in Figure 10. Clearly, the results in all cases are identical, suggesting
that these formulations of the transient problem are capable of reproducing the expected steady state
conduction behavior. Given that the two analytical models produce similar results, the formulation of
Nguyen et al. [12] was used for all subsequent analyses as it is easier to adopt realistic heat source
shapes.

8
Figure 9: Comparison of the three analytical solutions, at a steady-state, for known parameters used in
electron beam melting of IN718.
Figure 10: A quantitative comparison of the centerline temperature profile for the three analytical
models at steady state for a known EBM parameter set.
Figure 11 shows a comparison of the predicted melt pool shape for the two beam configurations
using the transient analytical model. In addition, the melt pool shape for configuration C3, but with a

9
velocity slowed to that of C2, is also shown in an attempt to decouple the influence of the beam
configuration and the processing parameters. The slower velocity of C2 results in a generally larger
melt pool than C3, and also more elongated given the difference in the configuration. C3 exhibits a
shorter, more teardrop shaped melt pool. When the velocity is slowed, C3 shows a melt pool size
closer to that of C2, but with a significantly different shape, particularly in the angle of the rear
solidification front. These differences in the melt pool shape also have an effect on the solidification
conditions [15], as will be discussed in Section 1.2.4.
Figure 11: A comparison of the quasi-static melt pool geometries for beam configurations (a) C2 and (b)
C3, plus a further comparison (c) for beam configuration C3 with the same beam velocity as C2.
1.2.3 Numerical Model Implementation and Comparison
The transport phenomena occurring in the weld pool is modeled using the following conservation
equations for mass, momentum, and energy:
𝜕𝜌
𝜕𝑡+ ∇ ∙ (𝜌𝑈) = 0, (8)
𝜕𝜌𝑈
𝜕𝑡+ ∇ ∙ (𝜌𝑈𝑈) = −∇𝑝 + ∇ ∙ (𝜇∇𝑈) + 𝑆𝑈, (9)
𝜕𝜌𝑐𝑝𝑇
𝜕𝑡+ ∇ ∙ (𝜌𝑐𝑝𝑈𝑇) = ∇ ∙ (𝑘∇𝑇) + 𝑆𝑇 + ��, (10)
where 𝜌 is the density, 𝑈 the velocity vector, 𝑡 time, 𝑝 pressure, 𝜇 dynamic viscosity, 𝑐𝑝 specific
10
heat, 𝑇 temperature, and 𝑘 thermal conductivity.
The momentum source term 𝑆𝑈 in Eqn. (2) accounts for thermal buoyancy based on the
Boussinesq approximation and drag in the mushy zone based on the Kozeny-Carman [16–18]
expression, given by
𝑆𝑈 = 𝜌ge𝑧𝛽(𝑇 − 𝑇𝑟𝑒𝑓) −𝐶𝑓𝑙
(1 − 𝑓𝑙)3 + 𝑎𝑈, (11)
where 𝑔 is the gravitational acceleration constant, e𝑧 the unit vector in the z direction, and 𝛽 the
coefficient of thermal expansion.
The energy source term 𝑆𝑇 in Eqn. (3) accounts for the evolution of latent heat during phase
change, given by
𝑆𝑇 = − [𝜕𝜌∆𝐻
𝜕𝑡+ ∇ ∙ (𝜌𝑈∆𝐻)] (12)
where ∆𝐻 is the latent heat. The transient term is linearized using the source term based method of
Voller and Swamanathin [19].
The final volumetric energy source term �� accounts for the heat added to the system by the heat
source. The volumetric Gaussian heat source proposed by Goldak et al. [20] is used here, where the a
circular beam in the x-y plane with a finite penetration depth is assumed:
��(𝑥, 𝑦, 𝑧) =2𝜂𝑃
𝑟2𝑑(𝜋/3)3/2exp (
−3(𝑥2 + 𝑦2)
𝑟2+
−3𝑧2
𝑑2 ), (13)
where 𝜂 is the efficiency of energy absorption, 𝑃 the beam power, 𝑟 the beam radius, and 𝑑 the
penetration depth.
A flat, rigid interface is assumed at the top of the domain. The velocity boundary condition
equates the viscous stress to the Marangoni stress:
𝜇𝜕𝑢
𝜕𝑧=
𝜕𝜎
𝜕𝑇
𝜕𝑇
𝜕𝜏, (14)
where 𝜕𝜎 𝜕𝑇⁄ is the surface tension gradient taken to be a constant.
The model equations were implemented into OpenFOAM [21] an open source CFD platform
which uses the finite volume method (FVM) for spatial discretization on a collocated grid.
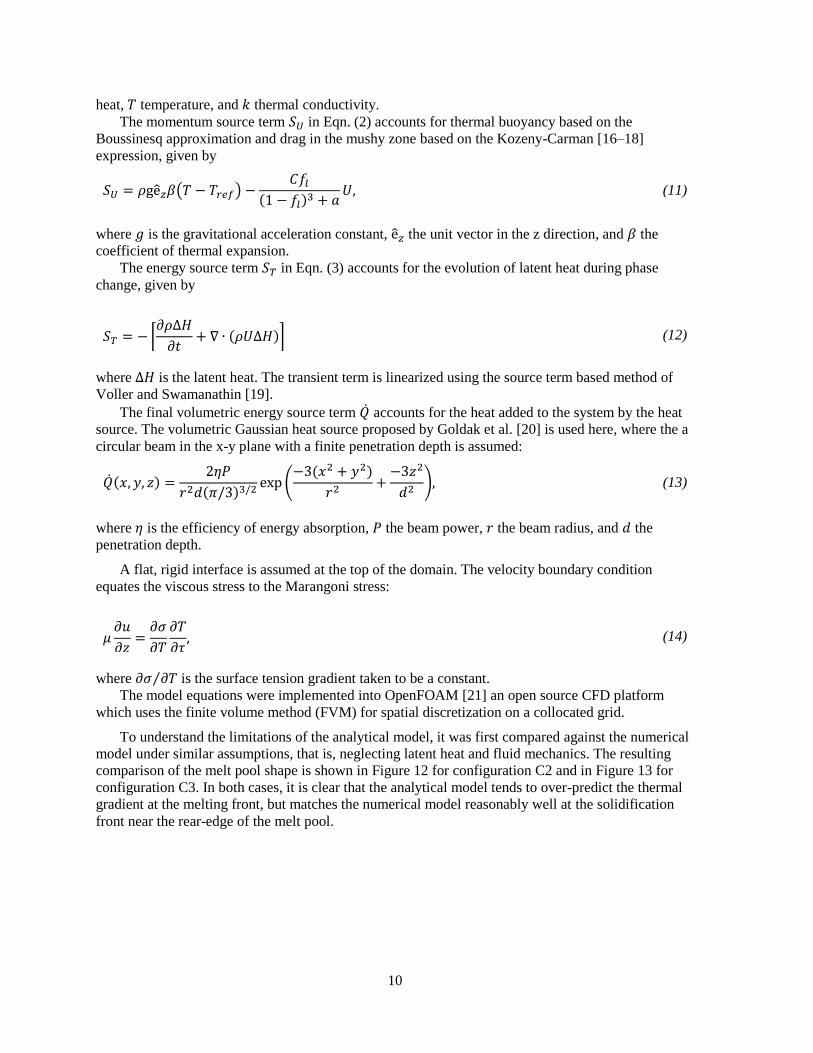
To understand the limitations of the analytical model, it was first compared against the numerical
model under similar assumptions, that is, neglecting latent heat and fluid mechanics. The resulting
comparison of the melt pool shape is shown in Figure 12 for configuration C2 and in Figure 13 for
configuration C3. In both cases, it is clear that the analytical model tends to over-predict the thermal
gradient at the melting front, but matches the numerical model reasonably well at the solidification
front near the rear-edge of the melt pool.

11
Figure 12: Comparison of the quasi-static thermal field around the heat source for configuration C2
between the CFD model without latent heat or fluid flow (top) and the analytical model (bottom).
Figure 13: Comparison of the quasi-static thermal field around the heat source for configuration C3
between the CFD model without latent heat or fluid flow (top) and the analytical model (bottom).
When including the fluid mechanics, the shape of the melt pool is expected to change due to the
redistribution of thermal energy by convective forces driven primarily by the temperature dependence
of the surface tension (the Marangoni effect) [15]. For IN718, the gradient of the surface tension with
temperature is negative, tending to drive hot fluid away from the center of the heat source and
towards the edges of the melt pool. Figure 14 and Figure 15 show a comparison of the melt pool
profile for configurations C2 and C3, respectively, with or without fluid flow. As expected, the fluid
flow tends to create a wider, shallower melt pool in both cases.

12
Figure 14: Comparison of the effect of fluid flow on the melt pool shape for beam configuration C2.
Figure 15: Comparison of the effect of fluid flow on the melt pool shape for beam configuration C3.
1.2.4 The Columnar-to-Equiaxed Transition
To relate the heat transfer conditions to the solidification structure development, additional
relationships for the materials evolution are required. Here, we are primarily concerned with the
ability to produce columnar versus equiaxed grain structures. Analytical relationships for the
columnar-to-equiaxed transition (CET) have been previously developed by Hunt [22] for casting

13
processes, and expanded by Gaumann et al. [23] for welding. These relationships have been
successfully applied to understand grain structure development in IN718 produced using commercial
additive manufacturing equipment [2,7,24]. A detailed description of the CET theory is outside the
scope of the present work, so the reader is directed to the original work for additional details. The
simplified relationship proposed by Gaumann et al. is used here:
𝐺𝑛
𝑉= 𝑎 {(
−4𝜋𝑁0
3𝑙𝑛[1 − 𝜙])
1/3
(1
𝑛 + 1)}
𝑛
, (15)
where 𝐺 is the magnitude of the resultant thermal gradient at the solid liquid interface, 𝑉 is the
solidification front velocity, 𝑁0 the nucleation volume density, and 𝜙 the volume fraction of
equiaxed. The quantities 𝑎 and 𝑛 are material parameters that, given the lack of data for calibration
for the present situation, are admittedly somewhat arbitrary. For the present case, 𝑛 = 2, as used by
Hunt, and 𝑎 = 1.25𝑥106 𝐾2/𝑚𝑠, as used by Gaumann et al., were found to be suitable. To plot
thermal data against the CET curve, a nucleation volume density was calculated. According to the
recommendation of Dantzig and Rappaz [25], 𝑁0 was approximated by using the grain size. Figure 8
was used to approximate the average equiaxed grain area of sample C3 as 500 µm2. This value was
used to calculate an effective grain diameter (𝑑 = 25.2 μm), and the nucleation volume density was
then calculated as 𝑁0 = 1 𝑑3⁄ = 6.23x10¹³m−3. Equation 15 may either be used to plot lines of
constant equiaxed grain fraction in terms of 𝐺 and 𝑉, or to calculate the equiaxed grain fraction based
on a set of solidification conditions.
Solidification conditions were first extracted from the transient analytical model under quasi-
static conditions. The results for each configuration, plus a comparison with configuration C3 with
the velocity of C2, is shown in Figure 16. C3 dips into the mixed region, but C2 shows lower
velocities, keeping it entirely within the columnar region. Interestingly, using a slower beam velocity
with configuration C3 results in solidification conditions much like those of C2, suggesting that the
different between the beam configuration is less related to the local changes in thermal condition, but
rather, due to the different process parameters that may be access given a change in the melt pool
shape.
Figure 16: Comparison of solid-liquid interface velocity and thermal gradient data for C2 and C3 beam
configurations for quasi-static heat transfer conditions. Insets show predicted cross-sections (assuming

14
maximum energy absorptance) for each case colored by the thermal gradient distribution. Case C3s
denotes the C3 beam configuration where the beam velocity has been slowed to the same as the conditions
used for C2.
Overall however, the difference in solidification conditions shown in Figure 16 does not seem to
be large enough to account for the dramatic observed change in the grain structure. One possibility is
that a simple quasi-static simulation does not account for the repeated heating and remelting effects
caused by many subsequent laser passes over an entire layer, including the cumulative effect of the
hatch spacing and laser velocity on cumulative energy input. To account for these effects, the
numerical model is far too computationally expensive to simulate in a reasonable time. The analytical
model however may simulate an entire layer very easily. Figure 17 shows the results for such
simulations for configurations C2 and C3, plotting the distribution of the ratio of thermal gradient to
solid-liquid interface velocity, which roughly scales with the propensity of a material to form a
columnar grain structure.
Figure 17: Thermal gradient maps of the layer-scale simulations, showing sample C2 in (a) the x-y plane
and (b) as an isometric view of the three-dimensional data cross-sectioned in the y-z plane, and similarly,
C3 in (c) the x-y plane and (d) as an isometric view in the y-z plane cross-section.

15
Figure 18: (a) A comparison of the predicted solidification conditions for samples C2 and C3 for a
complete layer relative to an estimated CET curve for IN718, and (b) calculated probability distributions
of the equiaxed grain fractions within a single layer for each of the beam configurations.
1.3 IMPACTS
The purpose of this work is to use Optonicus’ dynamic beam shaping capabilities to control
microstructure in laser based additive manufacturing processes through local control of heating and
cooling rates. The proposed experiments will establish this capability for the current state of the LAM
system at Optonicus while the proposed modeling activities will be used to rationalize these results,
and to model the effects of scaling the system to current industry standard process parameters (i.e.
higher beam power and beam velocity). The unique capability of individual beam position and phase
manipulation permits advances to LAM not currently feasible by commercial systems. The results
produced by the proposed technical collaboration will be used by Optonicus to market their adaptive
beam shaping capabilities to existing laser additive manufacturing suppliers. This approach will
expand the current capabilities of LAM, including a reduction in cracking tendency, improved
microstructure control, and mitigation of defect formation. These advantages will allow for the
expansion of materials selection in LAM by allowing for the successful fabrication of traditionally
non-weldable alloys, as well as improved process control and process time for existing AM alloys,
leading an increase in performance and productivity and decrease in part cost across the industry.
Optonicus is moving forward by fabricating a scaled system that will have production rates
competitive with current commercially available systems, but with significant advancements in
control over energy input. Future work will require modeling of possible beam configurations for
various possible materials, ranging from advanced structural materials (crack-prone Ni-base
superalloys and TiAl for gas turbines), to functional materials (soft magnetic materials for power
transformers and electric motors). Eventually, the dynamic beam shaping capabilities will also be
used to generate advanced scan patterns that include transient heat source manipulation that is not
possible with current single beam systems.
1.4 CONCLUSIONS
This work successfully extended and evaluated existing modeling capabilities for heat transfer,
fluid mechanics, and solidification in additive manufacturing for the purpose of rationalizing
microstructure development in a multi-beam laser system. Continuum scale models at various length

16
scales and levels of complexity were used to understand the melt pool and layer scale effects of the
multi-beam system on solidification dynamics. Transient semi-analytical models are preferred for
predicting these effects as they are easily applied to long length and time scales, but lack the physical
fidelity and extensibility of fully computational models. Here, the influence of fluid mechanics and
limitations of the analytical models was understood by comparing against the full numerical model.
The analytical model was found to have reasonable accuracy and was easily scaled to full layer
simulations for predicting the expected range of solidification conditions. These solidification
predictions were then coupled to a phenomenological model for prediction of the nucleation of
equiaxed grains to understand the process-microstructure linkages that lead to dramatic differences in
grain structure development. The influence of processing parameters and beam configuration were
successfully rationalized based on the results of these models. Future work will require careful
calibration and validation of these models for more detail predictions and application of heat transfer
predictions for design ideal heat source configurations for new materials to help reduce cracking and
other defects and to enable advanced microstructure control not currently possible using existing
commercial laser additive manufacturing systems.
1.5 REFERENCES
[1] M.M. Kirka, Y. Lee, D.A. Greeley, A. Okello, M.J. Goin, M.T. Pearce, R.R. Dehoff, Strategy for Texture
Management in Metals Additive Manufacturing, JOM. 69 (2017) 523–531. doi:10.1007/s11837-017-2297-7.
[2] R.R. Dehoff, M.M. Kirka, W.J. Sames, H. Bilheux, A.S. Tremsin, L.E. Lowe, S.S. Babu, Site specific control of
crystallographic grain orientation through electron beam additive manufacturing, Mater. Sci. Technol. 31 (2015)
931–938. doi:10.1179/1743284714Y.0000000734.
[3] M.A. Vorontsov, Additive Manufacturing in Metals with a Fiber Array laser Source and Adaptive Multi-Beam
Shaping, 15/642884, 2019.
[4] M.A. Vorontsov, Additive Manufacturing in Metals with a Fiber Array laser Source and Adaptive Multi-Beam
Shaping, 15/983866, 2019.
[5] D. Rosenthal, Mathematical Theory of Heat Distribution During Welding and Cutting, Weld. J. 20 (1941) 220–234.
[6] D. Rosenthal, The Theory of Moving Sources of Heat and Its Application to Metal Treatments, Trans. Am. Soc.
Mech. Eng. 68 (1946) 849–866.
[7] A. Plotkowski, M.M. Kirka, S.S. Babu, Verification and Validation of a Rapid Heat Transfer Calculation
Methodology for Transient Melt Pool Solidification Conditions in Powder Bed Metal Additive Manufacturing,
Addit. Manuf. 18 (2017) 256–268. doi:10.1016/j.addma.2017.10.017.
[8] Z. Hou, R. Komanduri, Magnetic Field Assisted Finishing of Ceramics- Part I : Thermal Model, J. Tribol. 120
(1998) 645–651.
[9] R. Komanduri, Z.B. Hou, Thermal Analysis of the Arc Welding Process: Part I. General Solutions, Metall. Mater.
Trans. B. 31 (2000) 1353–1370.
[10] R. Komanduri, Z.B. Hou, Thermal analysis of the laser surface transformation hardening process, Int. J. Heat Mass
Transf. 44 (2001) 2845–2862. doi:10.1016/S0017-9310(00)00316-1.
[11] H.S. Carslaw, J.C. Jaeger, Conduction of Heat in Solids, 2nd ed., Oxford University Press, Oxford, 1959.
[12] N.T. Nguyen, A. Ohta, K. Matsuoka, N. Suzuki, Y. Maeda, Analytical Solutions for Transient Temperature of
Semi-Infinite Body Subjected to 3-D Moving Heat Sources, Weld. Res. Suppl. I (1999) 265–274.
[13] A. Plotkowski, B. Stump, J. Heigel, R.E. Ricker, L. Levine, R.R. Dehoff, Scan Pattern Effects on Solidification
Conditions in Laser Additive Manufacturing, Prep. (2018).
[14] N. Raghavan, R. Dehoff, S. Pannala, S. Simunovic, M. Kirka, J. Turner, N. Carlson, S.S. Babu, Numerical
modeling of heat-transfer and the influence of process parameters on tailoring the grain morphology of IN718 in
electron beam additive manufacturing, Acta Mater. 112 (2016) 303–314. doi:10.1016/j.actamat.2016.03.063.
[15] T. Debroy, S.A. David, Physical processes in fusion welding, Rev. Mod. Phys. 67 (1995) 85–112.
doi:10.1103/RevModPhys.67.85.

17
[16] P.C. Carman, Fluid Flow through Granular Beds, Trans. Inst. Chem. Eng. 15 (1937) 150–167.
[17] P.C. Carman, Permeability of saturated sands, soils and clays, J. Agric. Sci. 29 (1939) 262.
doi:10.1017/S0021859600051789.
[18] J. Kozeny, Ueber kapillare Leitung des Wassers im Boden, Sitzungsber Akad. Wiss., Wien. 136(2a) (1927)
271306.
[19] V.R. Voller, C.R. Swaminathan, General Source-Based Method for Solidification Phase Change, Numer. Heat
Transf. Part B Fundam. 19 (1991) 175–189. doi:10.1080/10407799108944962.
[20] J. Goldak, A. Chakravarti, M. Bibby, A New Finite Element Model for Welding Heat Sources, Metall. Trans. B. 15
(1984) 299–305. doi:10.1007/BF02667333.
[21] H.G. Weller, G. Tabor, H. Jasak, C. Fureby, A tensorial approach to computational continuum mechanics using
object-oriented techniques, Comput. Phys. 12 (1998) 620. doi:10.1063/1.168744.
[22] J.D. Hunt, Steady State Columnar and Equiaxed Growth of Dendrites and Eutectic, Mater. Sci. Eng. 65 (1984) 75–
83.
[23] M. Gäumann, C. Bezençon, P. Canalis, W. Kurz, Single-crystal laser deposition of superalloys: Processing-
microstructure maps, Acta Mater. 49 (2001) 1051–1062. doi:10.1016/S1359-6454(00)00367-0.
[24] N. Raghavan, R. Dehoff, S. Pannala, S. Simunovic, M.M. Kirka, J. Turner, N. Carlson, S.S. Babu, Numerical
modeling of heat-transfer and the influence of process parameters on tailoring the grain morphology of IN718 in
electron beam additive manufacturing, Acta Mater. 112 (2016) 303–314. doi:10.1016/j.actamat.2016.03.063.
[25] J.A. Dantzig, M. Rappaz, Solidification, 2nd ed., CRC Press, Boca Raton, Fl., 2016.

18

19
2. OPTONICUS BACKGROUND
Optonicus is focused on the research, development, and marketing of intelligent optical systems.
Adaptive fiber laser arrays are at the center of our research; with applications in atmospheric imaging,
laser communication, laser target tracking, directed energy, remote sensing, and additive
manufacturing.