Embed Size (px)
Citation preview

Clemson UniversityTigerPrints
All Theses Theses
12-2011
FABRICATION AND CHARACTERIZATIONOF MULTI-FUNCTIONAL NON-SPHERICAL PARTICLESVIAMECHANICALDEFORMATIONVenkata shilpa VarahagiriClemson University, [email protected]
Follow this and additional works at: https://tigerprints.clemson.edu/all_theses
Part of the Mechanical Engineering Commons
This Thesis is brought to you for free and open access by the Theses at TigerPrints. It has been accepted for inclusion in All Theses by an authorizedadministrator of TigerPrints. For more information, please contact [email protected].
Recommended CitationVarahagiri, Venkata shilpa, "FABRICATION AND CHARACTERIZATION OF MULTI-FUNCTIONAL NON-SPHERICALPARTICLES VIA MECHANICAL DEFORMATION" (2011). All Theses. 1275.https://tigerprints.clemson.edu/all_theses/1275

FABRICATION AND CHARACTERIZATION OF MULTI-FUNCTIONAL NON-SPHERICAL PARTICLES VIA MECHANICAL DEFORMATION
A Thesis Presented to
the Graduate School of Clemson University
In Partial Fulfillment of the Requirements for the Degree
Master of Science Mechanical Engineering
by Venkata Shilpa Varahagiri
December 2011
Accepted by: Dr. Jeffrey N. Anker, Committee Chair
Dr. Mica Grujicic Dr. Paul Joseph

ii
ABSTRACT
Nanoparticles bridge the gap between bulk materials and molecules. They possess
exciting but contrasting mechanical, chemical, magnetic and optical properties when
compared to their bulk counterparts due to their shape and size. When the size of noble
metal nanoparticles is reduced to less than the wavelength of light, the particles intensely
absorb and scatter light at wavelengths that depend on the particle size, shape, and local
dielectric environment due to Localized Surface Plasmon Resonance (LSPR)
modes. Recently, plasmonic particles have been used in a wide variety of sensor and
optical device applications including immunoassays and surface enhanced Raman
spectroscopy substrates. Controlling nanoparticle shape and resonance is essential for
tuning these nanoparticles for a given application. Thus, fabrication of particles with
different sizes and morphologies has been under research for a long time. The most
prevalent methods for this purpose have been chemical synthesis and nano lithographic
techniques. Mechanical deformation is an alternative method to control particle shape.
This approach has been largely ignored since Faraday’s pioneering work on converting
gold particles into films by beating. Here we report a simple, but effective technique to
control particle shape and LSPR wavelength via physical deformation of metal
nanoparticles (~50-100nm diameter). Particle size and shape is characterized using both
electron microscopy and atomic force microscopy, while LSPR red-shifts are observed
with dark-field spectroscopy. Controlling the shape and size of deformed particles
requires quantification of force applied. A spring loaded instrument has been designed for
this purpose and force applied on the particles and consequent deformation has been

iii
studied. This deformation method has also been applied to polystyrene, magnetic and
hybrid micro and nano spheres. The processing technique employed here has potential for
rapid and inexpensive tuning of nanoparticle shape and resonance while preserving
particle volume. Thus, we establish a proof-of-principle depicting the validity of
mechanical deformation as a means of fabricating non spherical particles of different
functionalities.

iv
DEDICATION
This work is dedicated to my parents who have always been very supportive,
without whom this would never have been possible. My grand parents have been my role
models and a moral support throughout. I thank them for their unconditional love and
blessings.

v
ACKNOWLEDGEMENTS
I gratefully acknowledge Dr. Jeffrey Anker for his invaluable advices, supervision
and guidance during the entire course of this work. I would like to thank Dr. Paul Joseph,
Dr. Mica Grujicic and Dr. Richard Miller for their useful inputs to this thesis. I extend my
gratitude to Dr. Marian Kennedy for her help with atomic force microscopy studies and
Mr. James Lowe for helping me in using universal testing machine.

vi
TABLE OF CONTENTS
Page
TITLE PAGE ................................................................................................................... i ABSTRACT .................................................................................................................... ii DEDICATION ............................................................................................................... iv ACKNOWLEDGMENTS ................................................................................................ v LIST OF FIGURES ...................................................................................................... viii CHAPTER I. OUTLINE AND INTRODUCTION .............................................................. 1 Outline ...................................................................................................... 1 Introduction to Nanotechnology and Background ................................... 3 Large to Small: Material Properties Perspective ...................................... 4 Nanoparticles and their types ................................................................... 7 Morphology of Nanoparticles ................................................................ 10 Synthesis of Nanoparticles ..................................................................... 10 Characterization ..................................................................................... 11 II. MECHANICAL DEFORMATION OF POLYMERIC PARTICLES ........ 13 Deformation of spherical polystyrene microparticles ............................ 13 Experimental .......................................................................................... 17 Deformation Procedure .......................................................................... 18 Results and Discussion ........................................................................... 21 Conclusion .............................................................................................. 27 Spring loaded instrument design for particle deformation ..................... 27 III. DEFORMATION MECHANISM IN CRYSTALS ..................................... 35 Crystal Structures ................................................................................... 35 Failure mechanism in bulk materials ..................................................... 36 Hall-Petch effect ..................................................................................... 38 Deformation characteristics of nano-crystalline materials ..................... 40

vii
Table of Contents (Continued) Page IV. DEFORMATION OF NOBLE METAL NANOPARTICLES ................... 45
Introduction ............................................................................................ 45 Theory .................................................................................................... 46 Surface Plasmon Resonance................................................................... 47 Mie theory of electromagnetic scattering ............................................... 49 Tuning LSPR wavelengths of gold nanoparticles .................................. 51 Motivation .............................................................................................. 52 Experimental .......................................................................................... 53 Results and Discussion ........................................................................... 55 Introduction to Surface Enhanced Raman Spectroscopy (SERS) .......... 58 Conclusion .............................................................................................. 65 V. CONCLUSIONS AND FUTURE WORK ................................................. 67 Conclusions ............................................................................................ 67 Future Work ........................................................................................... 68 Controlling particle deformation ............................................................ 69 APPENDIX ............................................................................................................ 77 A: Imaging Methods.......................................................................................... 77 REFERENCES ....................................................................................................... 80

viii
LIST OF FIGURES
Figure Page 1.1 Size comparisons of small particles ............................................................... 4
1.2 Mono-dispersed gold nanoparticles of different sizes in water. ..................... 6
1.3 TEM images of gold nanoparticles of different shapes and sizes ................................................................................................................ 10 2.1 Schematic of deformation process using a glass slide to roll spherical particles into rods ................................................................................... 18 2.2 Schematic of deformation process using glass rod to convert spherical
particles into pancakes ........................................................................... 19 2.3 Micro-positioner (W. R. Prior and Co. Ltd., Hertfordshire, England) used as rolling instrument ...................................................................... 20 2.4 4.51 µm polystyrene particles un-deformed (left) deformed (right) by hand using a glass slide to form rolls ..................................................... 22 2.5 7.66 µm polystyrene particles un-deformed (left) and deformed by hand using a glass slide to form rolls (center) and pancakes (right) ............... 22 2.6 7.66 µm polystyrene particles deformed by a glass slide using micro-
positioner ................................................................................................ 23 2.7 SEM micrographs of deformed 7.66 µm polystyrene particles ................... 23 2.8 7.66 µm particles deformed by a glass rod of 5mm diameter using micro-
positioner ................................................................................................ 24 2.9 7.66 µm particles embedded in a polyvinyl alcohol film and stretched in
universal testing machine @ 50 mm/min. .............................................. 26 2.10 Schematic showing parts of the screw with spring inside ............................ 28

ix
List of Figures (Continued) Figure Page
2.11 Spring loaded instrument setup .................................................................... 30
2.12 View showing the rolling pin being held in place by the two screws .......... 30 2.13 7.66 µm polystyrene particles rolled to form pancakes using spring loaded instrument ................................................................................... 31 2.14 5.05 µm polystyrene particles rolled to form 'pancakes' using a spring loaded instrument ................................................................................... 31 2.15 Curve showing spring constants of the two springs ..................................... 32 2.16 Force quantification using spring loaded instrument ................................... 33 2.17 Relation between forces applied using the spring loaded instrument and
diameter of flattened particle .................................................................. 34 3.1 Body centered cubic crystal (left) and face centered cubic crystal (right) ... 36 3.2 Types of grain boundaries in coarse grained poly crystals schematically ... 37 3.3 Representative compression force-deformation curves of a metal coated and uncoated polymer particle ............................................................... 44 4.1 Schematic illustrating a surface plasmon polariton (or propagating plasmon) (top) and a localized surface plasmon (bottom) ..................... 48
4.2 Simulation showing changes in scattering spectrum of gold nano-spheres on deformation ....................................................................................... 50 4.3 Photograph showing the deformation technique employed ......................... 54 4.4 Schematic of the experimental approach to deform the nanoparticles and dark field images .................................................................................... 56 4.5 Reflectance spectrum of 60 nm gold nanoparticles before and after
deformation ............................................................................................ 56

x
List of Figures (Continued) Figure Page
4.6 Contact AFM images of 60 nm Au nanoparticles on silicon substrates ...... 57 4.7 Contact AFM images showing 3D height profile and deflection profile ..... 58 4.8 SERS of 60 nm gold nanoparticles .............................................................. 61 4.9 SERS spectrum for gold nanoparticles showing effect of adding MBA and deformation...................................................................................... 61 4.10 Deviation of intensities from mean for two of the prominent peaks observed in SERS spectrum ................................................................... 62 4.11 Effect of deformation on surface area of a nanoparticle .............................. 64 4.12 100 nm gold nanoparticles rolled using spring loaded instrument and a clear color change from green (left) to red (right) can be seen .............. 65
5.1 Photolithography process flow ..................................................................... 71
5.2 Zoomed in view of controlled deformation of nanoparticles using
photolithography .................................................................................... 72 5.3 Au 60 nm particles in situ deformation ........................................................ 74 5.4 4.93 µm carboxyl ferromagnetic particles before (left) and after (right) rolling using a glass rod .......................................................................... 75 5.5 Images of gold nano-rods rolled with 4.93 µm carboxyl ferromagnetic
particles and 60 nm gold nanoparticles with polystyrene particles ........ 75
5.6 SEM image of 4.8 µm fluorescent ferromagnetic particles. ........................ 76

1
CHAPTER ONE
OUTLINE AND INTRODUCTION
Outline
Nanoparticles exhibit interesting optical, mechanical and electronic properties that differ
largely from their bulk counterparts. Each of these properties is size and shape dependent
and is illustrated on a relevant size scale. Size of grains and grain boundaries affect the
mechanical properties, particle sizes smaller than the wavelength of light incident on
them drive their optical properties and carrier diffusion length dictates the electronic
properties of nano particles. To exploit these properties, nanoparticles of non spherical
and unsymmetrical shapes have been fabricated and studied for quite a long time now.
Chemical synthesis has been by far the simplest way of fabricating particles of varied
sizes and shapes, followed by lithographic methods which provide a high amount of
precision. These methods require chemicals which may be toxic and the procedures
expensive and time taking in case of chemical synthesis; and lithographic techniques tend
to be intricate, require making of molds and templates and are tedious and time
consuming. Above all, tuning the particle shape independent of size is highly challenging
in these cases. In this study, we establish a novel way of fabricating non spherical micro
and nano particles which would be tunable, time efficient, inexpensive, simple and yet
effective.
We hypothesize a rapid deformation method that would help in fabricating nanoparticles
of non spherical shapes and in turn provide a means of tuning particle size and its

2
properties. The goals of this study are to develop a method of applying uniform forces on
single as well as batches of spherical nanoparticles and deform them consistently. Also,
the forces applied are to be quantified and a relation between applied force and resultant
deformation is to be determined.
In order to achieve these goals, firstly, we deformed spherical polystyrene microparticles
by direct manual application of force on them. Next, the same method was applied to
gold nanoparticles and the proof of principle was established. To control the amount of
force applied, a spring loaded instrument was designed which could provide a
quantification of force. Further, the size and shape dependent localized surface plasmon
resonance wavelengths of gold nanoparticles were tuned by means of mechanical
deformation. These deformed particles were used as substrates for surface enhanced
Raman spectroscopy.
As described above, this thesis sets up a proof of principle of mechanical deformation as
a novel way of fabricating non spherical particles. The first chapter deals with an
introduction to nanotechnology and the differences between nanoparticles and their bulk
counterparts. In the second chapter, the mechanical deformation method is illustrated by
deforming spherical polystyrene micro particles into rods and disks. Design of a spring
loaded instrument for applying controlled forces is then described. Third chapter focuses
on crystal structures and deformation mechanism in crystals. Chapter four introduces the
concepts of plasmons and size and shape dependent optical properties of gold
nanoparticles. Experimental details and results of mechanically deforming gold

3
nanoparticles are shown and their application in surface enhanced Raman spectroscopy is
demonstrated. The last chapter deals with conclusions and future directions of this
research.
Introduction to Nanotechnology and Background
Nanotechnology is an emerging field of scientific research and applications which deals
with structures possessing at least one dimension < 100 nanometers where a nanometer is
a billionth of a meter. These structures are an order of magnitude smaller than bacteria.
Nanotechnology has been used by humans unknowingly since a long time. The Roman
‘Lycurgus cup’ is a classic example of the optical properties of nano scale gold where
different colors are seen in reflected and transmitted lights [1]. Finely ground gold
nanoparticles of sizes 10-500 nm were used by Egyptians 5000 years ago for medicinal
purposes. In 1856 Michael Faraday performed a series of elegant experiments with gold
colloidal solution and studied its optical properties. The results of his experimentation led
him to conclude that the colloidal gold is particulate in nature [2]. More recent
advancements in this field have shown that gold nanoparticles can be used as carriers for
drug delivery, labels for immunoassays, substrates for surface enhanced spectroscopy and
DNA detection to list a few. The nano scale materials exhibit essentially different
properties as compared to their bulk counterparts. This causes the nano materials to have
an entirely new range of applications.

4
Figure 1.1: Size comparisons of small particles [3]
Large to Small: Material Properties Perspective
Nanoparticles bridge the gap between bulk materials and atomic structures. As the size of
the particles reach the nano domain, their electronic properties are well understood using
the quantum mechanical principles. Additionally, the mechanical, electrical, optical and
thermal properties in nano systems differ greatly from their bulk counterparts.
Interestingly, most of these properties depend on the size of the nanoparticle. Hence, size
is a very important parameter mainly because the surface to volume ratio is higher for
smaller particles.
Optical Properties
Since the surface to volume ratio in nanoparticles is higher than that of the bulk materials,
these nanoparticles show interesting optical properties depending on several parameters
such as:

5
(a) Size
(b) Shape
(c) Polarization direction
(d) Composition
(e) Interaction with each other and with the environment.
Specifically, in noble metal nanoparticles, this phenomenon can be clearly seen where
colloidal gold solution of size 5 nm scatters a different color of light as compared to a
200 nm particle. This is due to the difference in particle’s interaction with the
environment as a result of its smaller size as well as the difference in the resonances
(dipole for smaller particles and quadrupole or multi-pole resonance for bigger particle
sizes) of particles of different sizes. It is well know that the absorption wavelength of
spherical gold nanoparticle differs from a rod like gold particle which provide evidence
for the shape dependence of optical properties. In addition, the polarization studies
conducted on different semi-conducting and metallic particles showed change in the
absorption wavelength with the polarization of the incident light. Depending on the type
of material and its structure, the observed optical resonance and maximum absorption
wavelength varies over hundreds of nanometers across the visible and into the infrared
region of the spectrum. Single nanoparticles and aggregates show a variation in the
absorption wavelengths due to interaction between the particles, similarly, the effect of

6
dielectric environment surrounding these nanoparticles is also found to be a key factor in
determining the resonance wavelengths.
Figure 1.2: Mono-dispersed gold nanoparticles of different sizes in water. The different
colors are due to different light interactions dependent on particle size.
Mechanical Properties
Mechanical properties of nanoparticles are also size dependent. It has been found that the
ductility of a material increases as its grain size decreases. Most importantly, changes are
observed in the crystal structures of metals in nano scale and their deformation
phenomenon like fatigue, creep and sensitivity to failure largely vary from bulk. There is
experimental evidence of an increase in the strength of single gold and molybdenum
crystals as their size is reduced to 100 nm [4]. Nano-indentation based flat punch tests
have been performed on various nano sized materials and their fracture mechanisms have
been studied. The studies on effect of interaction between metallic and polymeric

7
materials in a nano composite structure helps to understand the deformation phenomenon
and stress strain relations at nano scale [5-7]
Along with these, electronic and thermal properties are also dependent on the size of
nanoparticles. Research findings [8] have shown that the conduction and valence bands in
case of smaller particles would become discreet and a band gap opens as opposed to a
continuous band in bulk materials. This is due to the quantum confinement phenomenon.
Thus, it is obvious that those thermodynamic properties (like thermal conductivity) which
are related to the electronic and phononic properties of a material would also show an
anomalous change on entering the nano domain[9].
Nanoparticles and their types
A particle can be defined as an entity which has its own distinct properties and the
particles of size <100 nm are called “nanoparticles”. Due to the smaller size of these
particles, their properties largely vary from bulk as discussed earlier. Nanoparticles have
very small masses because of which the gravitational forces are negligible in this domain
and charge dependent electromagnetic forces dominate. All these interesting and unique
disparities in properties have been researched on for quite a long time now and various
kinds of nanoparticles have been synthesized for application in a wide range of fields.
1. Plasmonic nanoparticles
2. Quantum Dots
3. Magnetic nanoparticles
4. Polymeric nanoparticles
8
5. Nano-composites (core-shell type particles) and so on.
Noble metal nanoparticles often referred to as plasmonic nanoparticles have been studied
extensively. Metals are known as very good conductors due to the presence of free
electrons. At nano scale as the ratio of surface to core atoms increases due to the size,
these free electron properties become more prominent. This leads to a unique
phenomenon called the localized surface plasmon resonance. When a plasmonic particle
is excited with light, the free electrons oscillate and come into resonance with the
incident light. This feature makes the plasmonic nanoparticles critical for various fields
of applications such as substrates for surface enhanced spectroscopy, as labels for
immunoassays, medical imaging, physical and chemical sensors to list a few [10] [11].
Quantum dots are the nanoparticles of a semiconductor material whose properties are
closely related to the size and shape of an individual crystal. Due to their high extinction
coefficient and size dependent behavior, quantum dots find applications as reporters in
lieu of fluorescent dyes, candidates for solid state quantum computation and labels for
cellular imaging, photo detectors and photovoltaic cells and so on. [12] [13].
Magnetic nanoparticles are a special class of nanoparticles that consist of magnetic
materials like iron, cobalt, nickel and their compounds. These magnetic nanoparticles
have a wide range of applications due to the coupling of the general nanoparticle
properties with another strong property of being able to be controlled by an external
magnetic field. Hyperthermia or cancer treatment using heat generated from magnetic
particles is one of the most critical research fields. Apart from this very important

9
biological application, other walks of science and technology where these magnetic
nanoparticles are used are in magnetic resonance imaging, waste water treatment,
information storage and so on [14-16].
Polymeric nanoparticles such as those of polystyrene (PS), poly methyl methacrylate
(PMMA), melamine etc are useful because of their properties like high mono-dispersity,
solubility in various organic solvents and above all biocompatibility. This feature allows
the usage of polymeric particles in vivo for numerous biological applications. Various
composite particles have also been synthesized having a metallic or a plasmonic core and
polymeric shell in order to combine their properties and expand the realm of application
of each kind [17-19].
Nano-composites are referred to multi phase systems where distinctly dissimilar materials
are combined at a nano level. These may refer to core shell type particles where core and
shell are made up of two distinct materials or in general, they can be a specific type of
nanoparticles embedded in a different type of base film. These kinds of structures have
the advantage of combining the properties of the two materials in use and in many cases,
enhancing the properties like strength, stability, chemical resistance and electrical
conductivity. Depending on the type of materials used to form these composites, the
applications could be innumerable.
Morphology of Nanoparticles
The size of the particles lent them their name “nano”. Shape is another important factor to
be considered. There are various methods to manufacture or synthesize the nanoparticles

10
of desired shapes. On the basis of their morphology and direct appearance, the particles
have been named as nano-spheres, nano rods and nano-cubes etc.
Figure 1.3: TEM images of gold nanoparticles of different shapes and sizes. (A) Nano
spheres (B) Nano cubes (C) Nano Branches (D) (E) (F) Nano rods of different aspect
ratios (G) (H) (I) (J) Nano bipyramids of different aspect ratios.[20]
Synthesis of Nanoparticles
Many techniques have been developed to synthesize the nanoparticles with desired type,
size and morphology. Some of the synthesis techniques are chemical methods,
lithography, plasma synthesis, mechanical forming and simply attrition of larger
particles. These methods range from simple to complex, quick to time taking and
methodical to intricate. Chemical synthesis is by far the easiest way of producing
nanoparticles of desired shape and size as the control is easy, however they can be toxic
and expensive as well depending on the chemicals that are used. Lithographical
techniques are very precise and near perfection, however they require a sequential

11
methodology, take time and also need the manufacture of molds and templates to begin
with. Mechanical forming like attrition or nano indentation methods are quick and good
for mass production, but control on particle size and shape can be challenging. Thus,
there are pros and cons for each technique and according to the applications desired, the
most suitable technique of synthesis is often chosen [21-24].
Characterization
Nanoparticle synthesis and applications necessitate the requirement of an understanding
about the particle shape, size and other characteristics. Various microscopy and
spectroscopy techniques have been developed for this purpose. Scanning Electron
Microscopy (SEM), Transmission Electron Microscopy (TEM), Scanning Tunneling
Microscopy (STM), Atomic Force Microscopy (AFM) are a few techniques to view these
nanometer scale particles and understand their morphology. Spectroscopy helps in
gaining knowledge of physical and chemical properties and composition of the particles
on interaction with light. Ultraviolet-Visible spectroscopy, Infrared spectroscopy, X-Ray
photoelectron spectroscopy, Raman spectroscopy are a few such techniques.
Present work focuses on mechanically deforming spherical micro and nanoparticles into
non spherical shapes. These resultant particles have been characterized by means of some
of the microscopy and spectroscopy techniques listed above. The method of deformation
and results obtained from these characterization tools are discussed in the chapters that
follow.

12
CHAPTER TWO
MECHANICAL DEFORMATION OF POLYMERIC PARTICLES
Nanoparticles have been of great scientific interest because of the drastic difference in
their properties as compared to their bulk counterparts. The physical properties of bulk
materials remain widely constant regardless of their size and shape. But nanoparticles
often depict size dependent properties. This is mainly because as the size of the material
is reduced to nano-scale, the ratio of atoms on the surface to the core increases and hence
they have a larger surface to volume ratio. This results in the presence of greater surface
area of grain boundaries which affects the mechanical properties and deformation
mechanisms of nanoparticles. Similar observations have been made for amorphous
materials where the near surface mechanical properties of amorphous polymers differ
from bulk owing to length scale effects[25].
Deformation of spherical polystyrene microparticles
Motivation
Polymeric particles have been widely used in various applications ranging from medical
imaging and drug delivery in biology to testing of theories of light, X ray and neutron
scattering in polymer and colloidal science[26, 27]. Brownian motion is another
important subject which can be made use of in non spherical particles. For example, by
embedding magnetic particles in a non spherical polymer particle, their motion can be
tracked using an external magnetic field due to shape anisotropy[28]. Polymeric particles

13
can be used as bio materials owing to the fact that several bacteria, macrophages and
human cells have diverse shapes like ellipsoids, rods and spirals. Thus, the non spherical
particles can be used to mimic these entities to help in a detailed study of several
biological processes. Thus, size, shape, surface texture and several mechanical properties
like modulus, viscosity etc. play an important role in defining the applications of these
particles[18, 19]. These applications stated above are an illustration of the applicability of
non-spherical particles and surely, the list is not exhaustive. This is highly motivating and
so we have tried to devise simple, inexpensive but efficient techniques of deforming
spherical polystyrene microspheres into prolate (rod-like or rolls) and oblate (disk-like or
“pancake”) shapes.
Background
Nagy and Keller and Lu et. al. described a method of physically deforming spherical
polymer particles into prolate ellipsoids with predetermined axial ratios. They drew a
Polyvinyl Alcohol (PVA) film with spherical polystyrene (PS) particles suspended in it.
After drying, the film was stretched at a temperature higher than the glass transition
temperature of both PVA and PS, resulting in the formation of elliptical particles within
the stretched films. The particles were retrieved by dissolving the film. Similar
experiments were conducted by Wang et. al. where they also studied the stress strain
relationship of these films at room temperature and concluded that there is more
extensibility in the direction perpendicular to stretching as compared to the parallel
direction. Two dimensional stretching has also been tried at elevated temperatures by

14
some other groups. Champion et. al. claimed to produce a range of particle shapes by
stretching films in a similar fashion and using either high temperature or toluene as a
mode of liquefying the particles.
All the research cited so far describes a common method of embedding the polymeric
particles in another polymer matrix and stretching this matrix to induce deformation in
particles. However, there exist some studies where force has been applied directly on the
particles to deform them. One such example is the work done by Tan et. al. who
employed AFM for performing nano scale compression studies on polystyrene
microspheres and probe its mechanical properties, especially calculating the value for
Young’s modulus of the particles. Polymer spheres were dispersed on a mica substrate
and force applied on each individual particle by an AFM cantilever tip. It was ensured
that the particles are deformed only in their elastic regime and thus, no residual stresses
exist after unloading the particles from uni-axial compression. Hertz theory was used to
model the particle deformation. It is important to note a few assumptions in Hertz theory
here:
1. Strains are small and within the elastic regime.
2. Radius of contact area is small compared to the radius of the sphere.
3. There is no friction between contact surfaces.
In general, according to Hertz theory, when an elastic sphere is subjected to a normal
load F, the deformation h, of the sphere is given by,

15
3/2*1/2 *
34
Fh
R E=
Where, R* is the relative radius of curvature and E* the combined strain modulus of two
bodies in contact.
1 2*
1 2 1 2
2 21 2
*1 2
1 1 1
1 11
R RR R R R R
E E Eν ν
+= + =
− −= +
Where, νi is the Poisson ratio of each material.
By using equations cited above, Tan et. al. estimated the compressive modulus of
polystyrene micro-particles to be around 2 GPa which is slightly lower than the bulk
modulus which lies at 3 GPa. This difference may be because of the presence of surface
charges on particle surface or due to Hertzian assumptions resulting in an under
estimations of modulus values[29, 30].
There is another study where the authors have employed a simpler technique to deform
spherical polymeric particles into rolls and disks by direct application of force on the
particles. Anker et. al. showed that rolling the particles directly using a glass slide or a
rolling pin and applying pressure by hand, rolls and pancakes can be obtained. This
method required no unusual experimental conditions like high temperatures, templates or
molds etc. However, applying force by hand does not ensure uniformity in the resulting
particles [26-28, 31-34].

16
We have thus tried to reproduce and extend this idea of deforming the spherical particles
by direct application of force on them and developing methods to control the force and
consequently the deformation. Initially, we used a micro-positioner (W. R. Prior and Co.
Ltd., Hertfordshire, England) as a rolling instrument enabling us to quantify the force
applied on the particles in a better way. Deformation in films has also been performed by
either stretching the films in Instron Tensile Testing Machine or compressing using
Carver Laboratory press. Eventually, a spring loaded instrument has been designed for
applying varying forces on the particles and study their deformation as a function of
applied force. All these experiments are carried out at room temperature and in no special
conditions and thus prove to be simple, inexpensive and efficient methods.
Experimental
Materials and Methods
The polystyrene microparticles used in these experiments were of sizes between 2 µm
and 15 µm purchased from Spherotech (Lake Forest IL, USA). The glass slides and glass
stirring rods used in these experiments were all thoroughly washed in distilled water and
acetone.
Instrumentation
Dark field images of the particles are obtained using a D90 digital camera with a 100X
oil immersion objective of numerical aperture (N.A) 0.5 - 1.3 stopped down to 0.5 and a
dark field condenser of N.A 0.95-0.8 integrated with a Nikon Eclipse TE 2000-U

17
microscope. All the parameters of the camera were controlled by Camera Control Pro2
software (Nikon Instruments Inc., Melville, NY, USA). Scanning Electron Microscopy
images were taken using a FESEM Hitachi S4800 microscope (Hitachi High-
Technologies Canada, Inc., Toronto, Ontario, Canada). The deformed particles are
retrieved from the glass slides by sonicating them in a VWR tabletop ultrasonic cleaner
(VWR Radnor, PA, USA).
Deformation Procedure
1. Deforming micro particles by hand
1.1 Deformation by glass slides – Rolls
Polymeric micro particles are deposited on a clean glass slide using drop coating
method. The drop is allowed to dry and another clean glass slide is put on top of
this to sandwich the particles in between the two slides. Applying force with
hand, the top glass slide is moved to and fro so as to roll the spherical particles
into rods.
Figure 2.1: Schematic of deformation process using a glass slide to roll spherical particles
into rods.

18
1.2 Deformation by glass rod – Pancakes
Once again the polymeric micro particles are drop coated on a glass slide and
allowed to dry. A clean glass rod of 5 mm diameter is placed on the slide and
rolled across the length of the slide using force with hand. The spherical particles
are flattened by this method and disks or ‘pancakes’ are formed.
Figure 2.2: Schematic of deformation process using glass rod to convert spherical
particles into pancakes.
2. Deforming micro particles using a micro-positioner
A micro positioner (Figure 2.3) is fixed to the optical bench. Same experimental
set up as before is used to coat microparticles on a glass slide. Another glass slide
or a glass rod is placed over the particles to be deformed. Next, the micro-
positioner is placed over this top slide or rod and by using the micrometer screw;
the positioner is moved in lateral motions in order to transform the spheres into
rolls and disks.

19
Figure 2.3: Micro-positioner (W. R. Prior and Co. Ltd., Hertfordshire, England) used as
rolling instrument.
3. Film Preparation and Particle deformation
A known volume of distilled water is taken in a beaker and heated to 850C. 5 -
10% w/v of polyvinyl alcohol (PVA) is added to this beaker and stirred
continuously using magnetic stir bar to completely dissolve the PVA. Now, 2%
w/v of glycerol is added to this solution and stirred well. 0.04% w/v of the
polystyrene microparticles are then added and this solution is covered with a
parafilm and left for 1-2 hrs to get rid of the lather formed due to vigorous stirring
of the solution. Then, the solution is drawn into a film on a flat base using an
applicator which is set to the desired thickness[34].

20
Stretching
These films are clamped and stretched at varying rates in an Instron Universal
Testing Machine to elongate the films and the particles within into ellipsoidal
shapes.
Compression
To perform compression in a Carver Laboratory press, the films are prepared
without particles and the particles are deposited over the dried PVA films. These
particles are allowed to dry and the film with particles on top is covered with an
aluminum foil and pressed between the two jaws of the press at a desired force.
This results in the formation of spherical particles into pancakes.
Results and Discussion
1. Deforming micro-particles by hand
As mentioned before, these experiments are all performed at room temperature
without any controlled conditions. To illustrate the process of deformation, few
optical images of polymeric particles before and after deformation are shown
here. Here, the particles were rolled either using glass rod or a glass slide by just
applying force with hand leading to the formation of pancakes and rolls
respectively. But, the limitations to this method are that the deformation is not
uniform. Also, quantification of force is not possible as it is applied by hand. An
approximate value however, is estimated to be around 3 pounds.

21
Figure 2.4: 4.51 µm polystyrene particles un-deformed (left) deformed (right) by hand
using a glass slide to form rolls.
Figure 2.5: 7.66 µm polystyrene particles un-deformed (left) and deformed by hand using
a glass slide to form rolls (center) and pancakes (right).
2. Deforming micro-particles by a micro-positioner
To circumvent this problem, we tried deformation of particles in a similar way,
but force applied using a micro-positioner instead of hand. In this case, the
advantage is that the result of this process remains the same and we still end up
producing the deformed particles but, knowing the mass of the instrument to be 7
pounds (=3.2 kg) helps in understanding the force applied on the particles. Also,
the concentration of particles and the area over the glass slide where the particles

22
are present are important values that should be known in order to quantify the
forces and determine average force per particle. For 7.66 µm polystyrene
particles, concentration is found to be 2.5* 106 particles/ml. Knowing the volume
of particles deposited on glass slide to be 10 µl diluted in the ratio of 1:1 the force
can be calculated as 2.4*10-4 Newton/particle. Alternatively, calculating the
surface area of the particle, pressure per particle is found to be 1.3 *10-6 N/µm2. It
is apparent from images that the deformation looks more uniform now. Optical
images and SEM images for particles before and after deformation are presented
here under.
Figure 2.6: 7.66 µm polystyrene particles deformed by a glass slide using micro-
positioner. Un-deformed particles on left and deformed particles on right.

23
Figure 2.7: SEM micrographs of deformed 7.66 µm polystyrene particles.
Figure 2.8: 7.66 µm particles deformed by a glass rod of 5mm diameter using micro-
positioner.
3. Film Stretching
PVA films with particles suspended in it are prepared and thickness of the film is
estimated to be around 100 µm when the film was prepared in a petridish and
around 40 µm when prepared using a film applicator. The applicator consists of a
micrometer screw which can be adjusted to obtain the desired thickness.
However, this thickness corresponds to that of wet film and so we have
considered a sixth of the wet film thickness to be the dry film thickness. This film
is cut into small strips of 2 cm by 2 cm dimension and is clamped in between the
two jaws of an Instron universal testing machine and pulled at varying rates of

24
2mm/min, 20 mm/min and 50 mm/min. Depending on the rate of stretching, the
particle deformation varies with maximum deformation obtained when the rate
was highest keeping the gauge length constant. Stress strain relationship is
obtained from Instron and it is observed that there exist three regions in each
curve: Elastic deformation region, Plastic deformation region and region where
the film breaks.
The particles are then retrieved by dissolving them in water at a temperature of
about 600C and then centrifuging it a number of times. For doing any imaging,
this solution of water with deformed particles suspended in it is directly used on
the desired substrate without any further modification. Again, it is observed from
optical images that the particles are not elongated uniformly within the same film
at same rate of elongation. This makes the reproducibility of results challenging.
A few possible explanations for this may be (a) Films may not be of uniform
thickness to begin with. (b) Temperature and humidity conditions while the films
dry and while they are stretched may have an impact on the amount of elongation.
(c) Stretching is done at room temperature which is well below the glass transition
temperature of both PVA and Polystyrene which makes it more difficult for
particles to elongate. (d) Ageing of film may also have effects on particle
elongation.
Below is a load-extension curve obtained for 7.66 µm polystyrene particles
embedded in a PVA film. The film is stretched in universal testing machine at a

25
rate of 50 mm/min. The average data obtained for the five samples from the
machine is:
Elongation: 600%; True stress at maximum load = 33003.57 kgf/cm2; True strain
at maximum load = 1.94. From this, modulus of elasticity can be obtained as 1.67
GPa which is lower than that of bulk polystyrene. However, there is 81.2%
standard deviation in elongation which implies that the values obtained may not
be accurate.
Figure 2.9: 7.66 µm particles embedded in a polyvinyl alcohol film and stretched in
universal testing machine @ 50 mm/min.
Film Compression
PVA films with polystyrene particles on top are compressed in between the jaws
of a Carver laboratory press at forces of 2 and 4 tons. To prevent the

26
contamination of the film and particles by the jaws of the press, aluminum foil is
used to cover the two jaws.
After pressing, the particles are retrieved by the same procedure of dissolving the
films in water at 600C. Some flattening of particles was observed in this case but
uniformity is again challengeable, possible explanations being (a) Non-uniformity
in thickness of films used as substrates. (b) Surface roughness of the two jaws
may be higher than the size of the particles being compressed. (c) Pushing the
particles into polymer matrix before being deformed plastically rendering
particles inaccessible to any direct compressive force. (d) Trade off between
concentrations of particles to be enough that they are easily retrievable from the
polymer film and not as many that they aggregate is a limiting factor.
Conclusion
We were partially successful in developing three different procedures to deform
spherical polymeric particles into rolls and pancakes. All the experiments were
conducted at room temperature, without any specific conditions or requirement of
a special sample preparation thus making these procedures simple, time efficient,
cost efficient and yet effective. Also, in all the cases, the particle volume is
conserved and is accounted for by the initial volume of the spherical particles.
Particle size and shape can be independently controlled and the deformation can
be quantified. It is realized that this procedure can be successfully implemented if
a few considerations of temperature and humidity control are made and force
27
quantification can be more effective if a specific instrument is designed for this
purpose.
Spring loaded instrument design for particle deformation
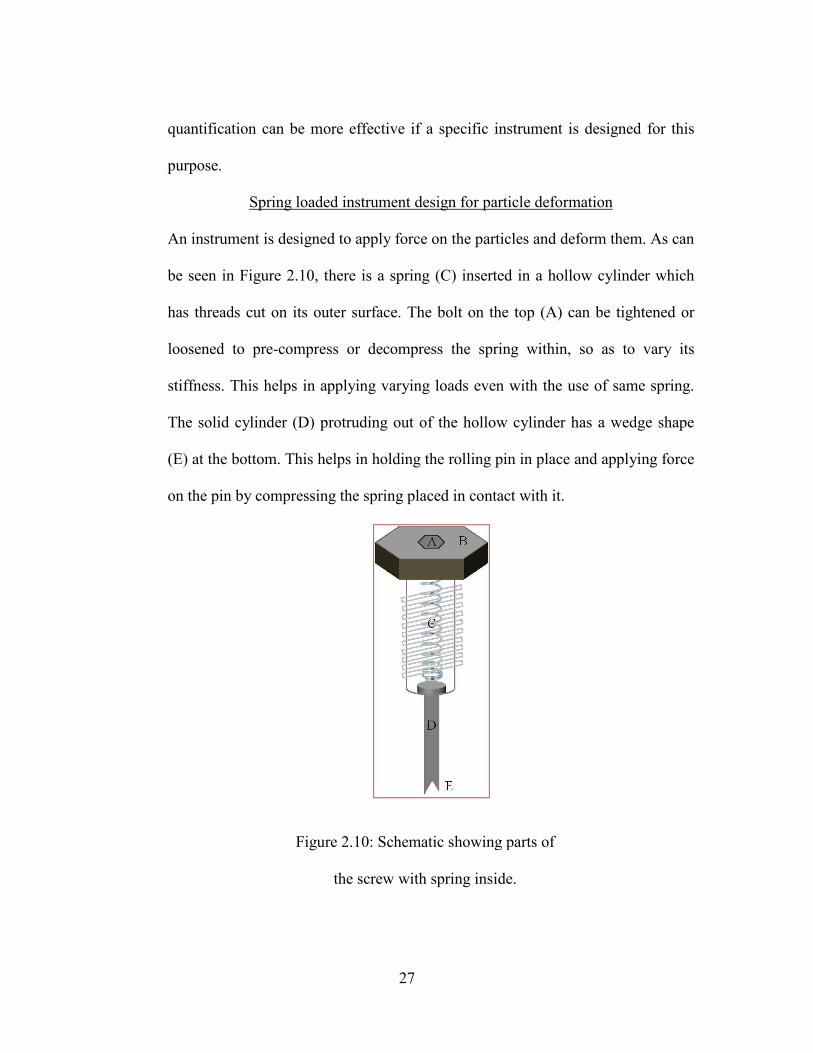
An instrument is designed to apply force on the particles and deform them. As can
be seen in Figure 2.10, there is a spring (C) inserted in a hollow cylinder which
has threads cut on its outer surface. The bolt on the top (A) can be tightened or
loosened to pre-compress or decompress the spring within, so as to vary its
stiffness. This helps in applying varying loads even with the use of same spring.
The solid cylinder (D) protruding out of the hollow cylinder has a wedge shape
(E) at the bottom. This helps in holding the rolling pin in place and applying force
on the pin by compressing the spring placed in contact with it.
Figure 2.10: Schematic showing parts of
the screw with spring inside.

28
Experimental Setup
A moving stage is clamped to the optical bench to hold it in place. The sample of
particles that is to be deformed is drop coated on a clean glass slide and placed
over the moving stage. A rolling pin consisting of a metal rod of 2.68 mm
diameter inserted inside a hollow glass cylinder (outer diameter = 5mm and
thickness = 0.8 mm) is placed over the glass slide and its two metal ends clamped
under the two wedge shaped screw ends. Now, the stage is moved using a
micrometer screw so that the glass slide consisting of particles on top moves
under the rolling pin and particles get deformed. Knowing the spring constant and
amount of spring compression, force applied on the particles can be known. Few
important parameters of the spring and screw used in the instrument are:
Spring
Free length = 27 mm.
Outer diameter = 7.69 mm.
Wire diameter = 0.8 mm.
Pitch = 2.8 mm.
Screw
Pitch = 1mm.
Length = 40 mm.

29
Figure 2.11: Spring loaded instrument setup.
Figure 2.12: View showing the rolling pin being held in place by the two screws.

30
Results
Some preliminary experiments have been done using this instrument and it can be seen
from the following images that the deformation is much more uniform.
Figure 2.13: 7.66 µm polystyrene particles rolled to form pancakes using spring loaded
instrument, un-deformed (left) and deformed (right).
Figure 2.14: 5.05 µm polystyrene particles rolled to form 'pancakes' using a spring loaded
instrument, un-deformed (left), deformed (right).
Determining Spring Constant of the two springs used in the instrument
The two screws were independently tested by applying compressive loads on each and
determining the consequent displacements. The slope of the curve gave the spring
constant of each spring. Since the two springs are in parallel to each other while the

31
deformation is performed, so the net spring constant is taken as the sum of each
individual spring constant value = 3.0357 + 3.5268 = 6.5625 lbf/cm ~ 2.9767 kgf/cm.
Figure 2.15: Curve showing spring constants of the two springs.
Since, the spring constant of the two springs is now known, varying forces can be applied
on the particles using this instrument and a relation between force applied and
deformation can be obtained.

32
Figure 2.16: Force quantification using spring loaded instrument: (A). 7.66 µm un-
deformed polystyrene particles (B) deformed using a force 0.66 lbf ~ 2.93 N (C) 1.31 lbf
~ 5.83 N (D) 1.97 lbf ~ 8.76 N (E) 3.28 lbf ~ 14.59 N
Thus, from the images above, it can be seen that as the force applied increases, the
particles get more and more flattened and this can be more clearly seen from the graph
below.

33
Figure 2.17: Relation between forces applied using the spring loaded instrument and
diameter of flattened particle.
The method of mechanical deformation of amorphous microparticles discussed in this
chapter can also be applied to crystalline materials. However, due to an orderly
arrangement of atoms, the mechanical properties and mechanism of deformation in
crystals vary from that seen in amorphous materials.

34
CHAPTER THREE
DEFORMATION MECHANISM IN CRYSTALS
Crystal Structures
Most solids are crystalline with their atoms arranged in a periodic manner having a long
range order and this regularity extends throughout the crystal. On the contrary,
amorphous materials have a short range order implying that the local environment of
each atom is similar to that of other equivalent atoms; however, this regularity does not
exist over appreciable distances. Liquids display a short range order and gases lack any
such order. A crystal structure is composed of a pattern, a set of atoms arranged in a
particular way upon the points of a lattice. The points can be thought of as forming
identical tiny boxes called unit cells that fill the lattice space. The lengths of the edges of
a unit cell and the angles between them are called lattice parameters. Based on these
lattice parameters, several different types of Bravais lattice structures are defined. The
most common among these being face centered cubic (FCC) and body centered cubic
(BCC) crystals. An FCC Bravais lattice has atoms at its apices and centers of the faces.
Metals like gold, silver, copper and aluminum are face centered cubic crystals[35].

35
Figure 3.1: Body centered cubic crystal (left) and face centered cubic (FCC) crystal
(right)[35].
Failure mechanism in bulk materials
Depending on the shape of the material, the orientations of the crystals vary and grain
boundaries are interfaces where crystals of different orientations meet. Such grain
boundaries can be treated as defects and some properties like the electrical and thermal
conductivity of the material are affected by these grain boundaries.
The high interfacial energies and weak bonding at the boundaries make them the sites
prone to deformation. A perfect crystal is very rigid due to the absence of the grain
boundaries. These grain boundaries play a significant role in the mechanical behavior of
the material[36].

36
Figure 3.2: Types of grain boundaries in coarse grained poly crystals schematically[37].
Cracks: A crack is a region of a material where there is no bonding between the adjacent
atoms of the lattice. When a force is applied on such material, the crack or the
discontinuity in the lattice interrupts the flow of stress. This results in the stress
concentration at the end of the crack. When the stresses are high enough at this point to
overcome the bond strength between the adjacent atoms, the bonds break and cause the
crack to lengthen. The repetition of this process leads to crack propagation and eventual
failure of the material before it undergoes any irreversible elongation.
Brittle to Ductile transition: Another important factor in the crystal structure is
dislocations. Dislocations are deviations in the crystal lattice that extend over a large
number of lattice spacings. In these regions, the bonds between atoms do exist but are
weaker than in normal regions. So, on applying force on such crystal, the bonds break
and reform in the regions of dislocation causing the dislocations to travel through the
length of the crystal. This results in plastic deformation in the material, which is seen by a
deviation in linearity of the stress strain curve. Hence, on removal of the applied force, a

37
part of the stress is retained by the body casing a permanent change in its dimensions.
This permanent change in the size or shape of the material is a result of brittle to ductile
transition which is caused by dislocations.
Crystalline nano materials exhibit different mechanical behavior than their coarse grained
polycrystalline counterparts as they possess relatively large number of grain boundaries.
It is known that grain boundaries disrupt the motion of dislocations through a material, so
reducing the grain size improves strength of the material. Thus, the nano crystalline
materials exhibit very high yield strength and hardness when compared to bulk. This
relationship between decrease in grain size and increase in the strength of a crystal is
explained by “Hall-Petch” effect [35, 36, 38, 39].
Hall – Petch effect
The strengthening of conventional polycrystalline metals with grain refinement is
described by classical Hall-Petch equation.
1/20y kdσ σ −= +
Where, σy is yield stress, d is grain size, σ0 is friction stress resisting the motion of gliding
dislocation and k is H-P slope, which is associated with a measure of resistance of grain
boundary to slip transfer[39].
This strengthening of metal with decreasing grain size is attributed to dislocation pile ups.
The central idea is that dislocations are forced to pile up at grain boundaries either
because there is a barrier to crossing over into the next grain or because a source must be

38
activated in the next grain. The grain boundaries act as pinning points which impede the
dislocation propagation. As the lattice structures of adjacent grains differ in orientation, it
requires more energy for a dislocation to change direction and propagate into the next
grain. Consequently, a repulsive stress field is generated to oppose the continued
dislocation motion. As more dislocations propagate to this grain boundary, they ‘pile up’.
With each dislocation that is propagated, repulsive stress fields keep increasing until
these forces neutralize the energy barrier across the grain boundary. Eventually, the
dislocations diffuse and further material deformation is initiated. So, it is obvious that as
the grain size increases, the dislocations increase along with an increase in stress and
reaches the critical value to cause slip in the adjacent grain. If the grain size is small, it
increases the number of grain boundaries or alternatively, increases the surface area of
grain boundaries and decreases the dislocation pile ups. So, smaller grains increase the
amount of applied stress necessary to move a dislocation across a grain boundary. The
higher the stress applied to move the dislocation, the higher the yield strength of the
material[40]. Hence, for a material at nano-scale, the yield strength is very high compared
to bulk.
However, there is a limit to this strengthening. At a critical grain size of ~20 nm, the size
of dislocations begins to approach the size of grains. This prevents any dislocations from
piling up within a grain. Thus, the stress applied on the material can be resolved within
the lattice only by grain boundary sliding resulting in a decrease in the yield strength of
the material. This phenomenon is termed as ‘Inverse Hall – Petch effect’. Also, the lower
limit to a grain size is a single unit cell of the material. When the grain size equals the
39
size of a unit cell, the material is not crystalline anymore. There is no long range order
and dislocations cannot be defined for ‘amorphous’ materials. Thus, it is evident that a
limitation to the strengthening of materials as a function of grain size exists[41].
Deformation characteristics of nano-crystalline materials
Nano-crystalline materials exhibit different micro structures and mechanical properties
compared to their conventional coarse grained polycrystalline counterparts. This is
attributed to the relatively large number of grain boundaries and smaller grain sizes. Hall-
Petch effect helps to explain the nano crystalline materials of sizes up to a critical value
of ~20 nm having a higher tensile strength and hardness than bulk. These materials are
also known to have a limited tensile ductility, the reason being poor strain hardening
capacity. Beyond this critical size however, dislocation mechanism vanishes and the
deformation is predicted to be due to grain boundary sliding, creep and triple junction
effect etc. Study of deformation mechanism for nanostructures below this critical value is
extremely difficult for various reasons. Firstly, fabrication of such small nano structured
materials free from any processing flaws and impurities is highly challenging. Secondly,
the availability of appropriate experimental routes to characterize the mechanical
properties of nano-crystalline materials below this critical value is very scarce. Third, the
deformation mechanism may vary from material to material and even in the same
material under different loading conditions and stages of deformation. Thus, a general
approach cannot be taken.

40
In-situ TEM observations is one of the tools that have been used with regards to the study
of mechanical properties of nano crystalline materials. In situ TEM observation allows us
to monitor the deformation mechanism and grain-boundary structures of nano materials
in detail and is straight forward. Although it is a great tool to observe the deformation
process, these studies are mainly focused on a single or few particles and hence the
results obtained are not representative of the entire system.
Molecular Dynamic modeling is a powerful tool used to simulate the interfacial structure
and mechanical deformation mechanism of nano-crystalline materials. Simulations
provide the levels of detail which are inaccessible experimentally. For the simulations to
work desirably, an appropriate selection of a mathematical model is necessary. MD
samples are fully dense and free from any flaws and defects. A critical grain size is often
chosen for a specific metal and prediction of inverse Hall-Petch effect is also included in
the simulation. A few drawbacks in MD simulations do exist, one of them being the use
of idealized models under high load and extremely high strain rate conditions to meet the
capacity of computation. This restricts the number and size of grains that can be
simulated causing the properties thus derived to be a representative of a small region and
not the entire material. Secondly, MD simulations are short time scale accessible and
deformation can be initiated in the early stages alone. This implies that prolonged
deformation effects are excluded from the study. Despite these drawbacks, MD
simulations have potential to provide some insights into the deformation mechanism at
atomic levels which is otherwise inaccessible[37-39].

41
This theoretical prediction that the mechanical properties of nano materials are
considerably different from bulk has been well backed by an extensive ongoing research
in this field. Nowak et. al. have examined deformation process and fracture mechanism in
a single silicon nanoparticle. Using a nano indenter held in a transmission electron
microscope for deforming a single nanoparticle helped them in simultaneous imaging and
deformation. They have reported an initial elastic deformation followed by plastic
deformation and fracture of the nanoparticle at last. The fracture is most likely estimated
to begin by nucleating a crack in the oxide layer on the particle at the stress concentration
region of particle-indenter contact edge and propagate further. The displacement, contact
radius and contact area were calculated to reach a value for stress and load applied. It has
also been reported that the fracture resistance decreases with increase in particle size
reaching a plateau for particles of 110 nm diameter[42].
Brinckmann et. al. have reported that the mechanical behavior of nano scale crystals vary
depending on the crystal type. They have shown that FCC crystals (like Au) and BCC
crystals (like Mo) show differences in their deformation mechanism when reduced to
nano size with significant strain hardening present in latter and virtually none in former.
However, both crystals show a power-law trend, i.e., a pronounced size effect with
smaller sized crystals requiring the application of higher stresses. A more recent study
conducted by Lagos et. al. showed that as the size scale reduces, the existence of a free
surface modifies the dislocation dynamics in the nano crystals. These dislocations escape
from the crystal through the free surface which induces a lack of strain hardening. Their
results showed the influence of size and shape of the particles on fault gliding directions

42
which affects the deformation mechanism. Other parameters that come into play for
studying mechanical aspects of a nanometer wide particle are suggested to be surface
energy, particle morphology, defect blocking energy barrier and available thermal
energy. For each kind of defect, material and temperature, a different deformation
mechanism is considered to be active[4, 7].
Similar research has also been done on nano crystalline metals embedded in a polymer
matrix and purely polymeric micro and nano particles as well. To list a few among such
studies, He et. al. studied the fracture of micrometer sized metalized polymeric particles.
Here, the particle consisted of acrylic copolymer coated with Ni and Au layers. A
diamond flat punch was used to compress individual particles with varying loads and the
results compared with uncoated polymeric particles. It is reported that the deformation
occurs in three stages, the first stage being the phase where the stiffness of coated particle
is much higher than uncoated particles and at loads of the order of 1000 µN, the
deformation being completely elastic. Stage 2 showed a sudden increase in the
deformation as a result of displacement burst inducing cracking in the metal and
delamination from polymer core. The crack propagation has been observed to be parallel
to the longitudinal direction of the particles and delamination occurring underneath these
cracks. Stage 3 involved much higher deformations and total rupture of the particle as a
result of another displacement burst. Uncoated particles (or pure polymeric particles)
however, did not undergo a total rupture at the same forces and few possible explanations
suggested are that metal coating might have created possible initiation sites in the
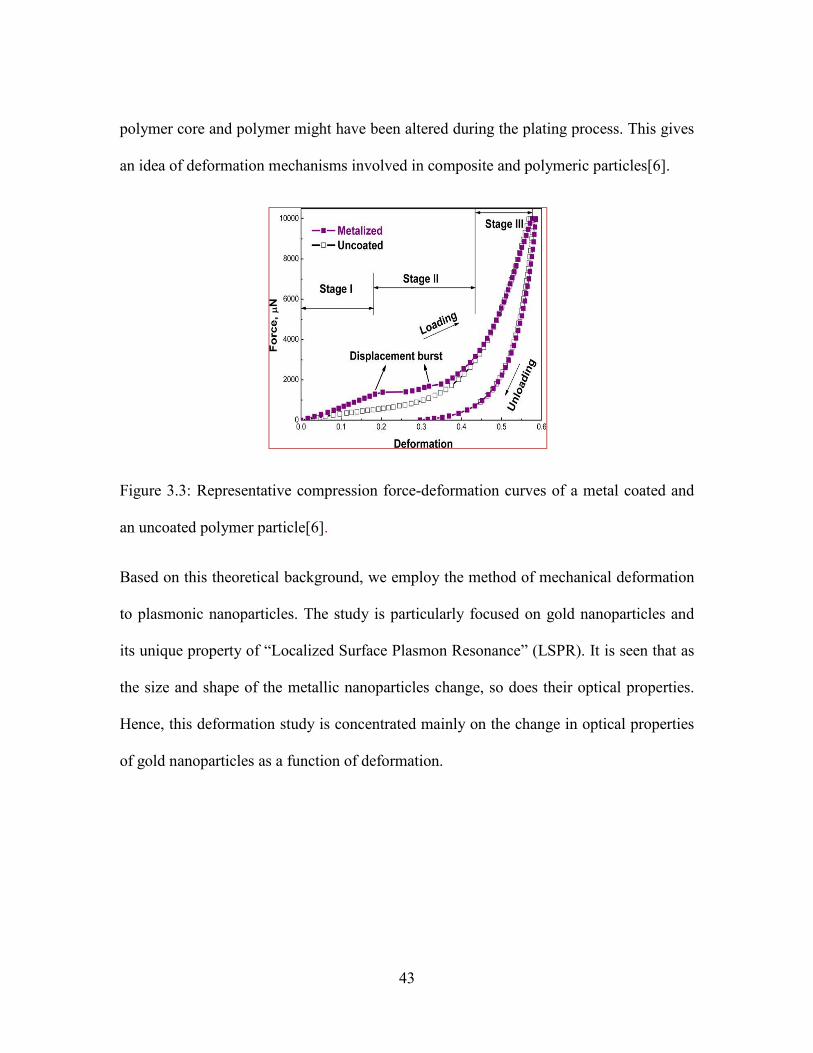
43
polymer core and polymer might have been altered during the plating process. This gives
an idea of deformation mechanisms involved in composite and polymeric particles[6].
Figure 3.3: Representative compression force-deformation curves of a metal coated and
an uncoated polymer particle[6].
Based on this theoretical background, we employ the method of mechanical deformation
to plasmonic nanoparticles. The study is particularly focused on gold nanoparticles and
its unique property of “Localized Surface Plasmon Resonance” (LSPR). It is seen that as
the size and shape of the metallic nanoparticles change, so does their optical properties.
Hence, this deformation study is concentrated mainly on the change in optical properties
of gold nanoparticles as a function of deformation.

44
CHAPTER FOUR
DEFORMATION OF NOBLE METAL NANOPARTICLES
Introduction
Noble metal nanoparticles have long been known for their optical properties. Colloidal
gold, silver and copper have been used in staining glass windows in medieval Europe.
This suggests that ever since then, the striking properties of these metallic nanoparticles
have knowingly or unknowingly been exploited. The metal nanoparticles intensely
absorb and scatter light when their size is reduced to less than the wavelength of light
incident on them. The size and shape of a nanoparticle dictate the resonance wavelength
peak in their extinction spectrum which is unlike their bulk counterparts. This deviation
of properties opens up an entirely new field of study which is focused on understanding
and finding applications for these nanoparticles. For example, the wavelength of light
absorbed by metallic nanoparticles depends on the environment around them which can
be used in sensors. Their property of intensely scattering light can be used to develop
labels for immunoassays, as substrates for surface enhanced spectroscopies and so on.
Even after years of research in this field, noble metal nanoparticles still provide potential
for further technological advancements [10, 43].

45
Theory
Free Electron Model
The free electron model is a simple model showing the behavior of valence electrons in a
crystal structure of a metallic solid. One among such models in Drude model proposed
in1900 by Paul Drude. Few assumptions made in Drude model are:
1. Independent Electron Approximation: The valence electrons in a solid are
assumed to be completely detached from their ions forming an electron cloud. As
in an ideal gas, the electrons do not collide with each other and there is no
Coulomb’s interaction between them.
2. Free Electron Approximation: It is assumed that the positive charge is located on
stationary ion cores and electrons can collide with these immobilized ion cores
which can change their velocity instantaneously. However, in between collisions,
there is no interaction between the electrons and ions as well.
3. The electrons reach a thermal equilibrium with the crystal lattice through
collisions. They travel in straight lines between scattering events and probability
of an electron to have a collision is 1/τ, where τ is relaxation time[35, 44, 45].
Plasmons
As we see form the Drude free electron model that the electrons are assumed to be
detached from the ions and form an electron cloud. Due to minimal interaction of
electrons with ions and other electrons, the entire metal can be thought of as a solid

46
consisting of weakly interacting particles in a free space such that when the electron
collides with the positive ions, its motion is disturbed in a complex way. This result in the
elementary electron to behave like an electron with a slightly different mass called the
electron quasi-particle. Plasmons are collective oscillations of free electron gas density
against the fixed positive ions in a metal. So, if the electrons are displaced away from the
positive ions by applying some external force and then they are released again, the
electrons will get attracted towards the ions and because of their mass, they possess a
momentum. This causes the electrons to oscillate until they are stabilized by losing the
energy they possess. The quantization of this kind of collective oscillations of electrons is
called plasmon[35].
Surface Plasmon Resonance
Surface Plasmon Resonance can be described as the resonant interaction of the
conduction band electrons near the surface of a metal with the incident light. These
conduction band electrons oscillate on the surface of the metal called as the surface
plasmons, and when a light is incident on these plasmons in such a way that the
frequency of light matches the frequency of these plasmons, a resonance occurs. This is
called the propagating surface plasmon resonance. For nanometer sized metallic
nanoparticles where the light interacts with particles much smaller than the incident
wavelength, this phenomenon is called the Localized Surface Plasmon Resonance
(LSPR). The enhanced near field amplitudes generated at the resonant wavelength are
highly localized at the nanoparticle and decays rapidly away from the nanoparticle
47
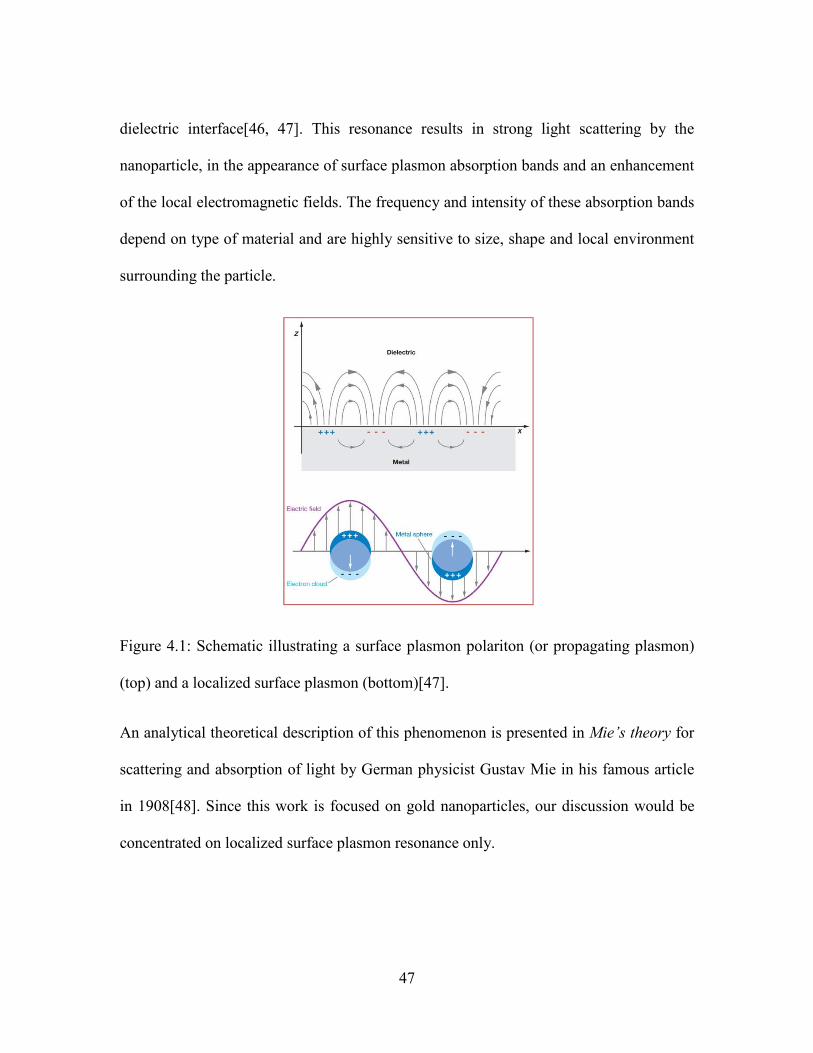
dielectric interface[46, 47]. This resonance results in strong light scattering by the
nanoparticle, in the appearance of surface plasmon absorption bands and an enhancement
of the local electromagnetic fields. The frequency and intensity of these absorption bands
depend on type of material and are highly sensitive to size, shape and local environment
surrounding the particle.
Figure 4.1: Schematic illustrating a surface plasmon polariton (or propagating plasmon)
(top) and a localized surface plasmon (bottom)[47].
An analytical theoretical description of this phenomenon is presented in Mie’s theory for
scattering and absorption of light by German physicist Gustav Mie in his famous article
in 1908[48]. Since this work is focused on gold nanoparticles, our discussion would be
concentrated on localized surface plasmon resonance only.

48
Mie theory of electromagnetic scattering
Gustav Mie in his classical paper in 1908 dealt with solution to Maxwell’s equations
describing the scattering of electromagnetic radiations by homogeneous spherical
particles. The fundamental concept explained by Mie was that a plane electromagnetic
wave propagates in a non absorbing medium without a change in its intensity or
polarization state; however the presence of a particle alters this electromagnetic field
which is called ‘electromagnetic scattering’. Mathematically, the total field in the
presence of a particle is represented as a vector sum of the incident and scattered fields.
Alternatively, the difference between the total field in the presence of a particle and the
original field in the absence of the particle is the field scattered by the particle.
( ) ( ) ( )inc scaE r E r E r= +
Where, r is the position vector[49].
In the above equation, the two parts corresponding to absorption and scattering by a
particle can be elaborated as:
2 2 3/2 5 2 2 2 2 2 2 21 2 3 1 2 3
2 2 4 2 20 0
(1 ) 8 128 (1 ) (( ) )( )
3 ln(10) ( ) 27 ln(10) (( ) )m i m r m i
r m i m r i
Nr r r Nr r rE
χ π ε ε π χ ε ε ε ελ
λ ε χε ε λ χε ε ε + + − +
= + + + + +
Where, E(λ) = Extinction wavelength which is equal to the sum of absorption and
scattering wavelengths, χ is the shape factor of the nanoparticle (2 for sphere and >2 for
spheroid), εm is the dielectric constant of the surrounding medium, εr and εi are the real

49
and imaginary parts of the metal dielectric constant, N is the electron density, λ0 is the
incident wavelength and r1, r2 and r3 are the dimensions of the metallic nanoparticle. This
equation is valid only for nanoparticles of size smaller than the wavelength of light
incident on them.
Figure 4.2: Simulation showing changes in scattering spectrum of gold nano-spheres on
deformation.
This equation clearly shows that the extinction spectrum of a nanoparticle in an external
dielectric medium depends on the nanoparticle dimensions (r1, r2 and r3) which for a non-
spherical nanoparticle are its in-plane diameter, out-of-plane height and shape. In
addition, nanoparticle material (εr and εi), nano environment’s dielectric constant (εm),
inter particle spacing on the substrate surface and substrate dielectric constant are also the
factors that effect the extinction spectrum (or LSPR wavelengths, in this case) of the
metallic nanoparticles[50].

50
Tuning LSPR wavelengths of gold nanoparticles
The LSPR can be tuned by changing the particle shape, for example, if a spherical
particle is flattened, χ increases and causes a red-shift in plasmon resonance wavelength
of the metal nanoparticle for light polarized along that axis (χ = 2 for a sphere, >2 for
ellipsoids with the light polarization oriented along the long axis). Simulation above
clearly indicates how the LSPR spectrum depends upon nanoparticle size and shape
according to Mie theory for small gold ellipsoids. Nanoparticle size influences LSPR
wavelength through quantum size effects for small particles, and excitation of higher
order multi-pole modes in larger particles. Thus, tuning the nanoparticle shape and size
varies their interactions with light and make them useful in a wide range of applications
including substrates for surface enhanced spectroscopy, labels for immunoassays, agents
for photo-thermal therapy, and components in nano-optical switches and waveguides[10,
51, 52]. As discussed in the previous chapters, there exist chemical synthesis techniques
to make particles of varying size and shapes [21, 22, 53]. Nano-lithography[54, 55] and
nano-indentation[5] are alternative ways of fabricating nanoparticles of distinct
morphologies and accordingly tune their LSPR wavelengths desirably.
We have developed another simple technique that alters the morphology of batches of
spherical gold nanoparticles to a pancake shape. This deformation was performed by
mechanically flattening the particles by manually rolling a glass rod over them. This
shape change in turn induced a red-shift in the localized surface plasmon resonance
(LSPR) wavelength of the gold nanoparticles. The flattened particles were characterized

51
by dark field microscopy, atomic force microscopy, and surface enhanced Raman
spectroscopy. The simple technique employed here requires no lithographic templates, no
chemicals and has potential for rapid, inexpensive and scalable tuning of nanoparticle
shape, surface area and resonance while preserving particle volume.
Motivation
Michael Faraday pioneered the method of mechanical deformation of gold nanoparticles
in 1856. Faraday had a long standing interest in the interactions between light and matter.
Gold films fascinated Faraday the most since he discovered that if thin enough, they
manifest a different color by transmitted light than by a reflected light. It was during the
course of this project that he made the first ever metallic ‘colloids’. Colloids are finely
divided particles of a substance held in suspension in a fluid and they differ from a
solution in that solutions consist of ionized particles which are much smaller than the
particles in a colloid. A metal forming such colloids was a breakthrough. He observed a
color change when he ablated a gold film to form gold nanoparticles. This color change
reversed after he beat the particles to flatten them back into a film. This work led Faraday
to make at the time surprising hypothesis that gold colloids, similarly colored to the
ablated gold, were particulate in nature. His experiments showing color changes in
colloids upon aggregation in salt solution and upon drying in gelatin (due to decreased
inter-particle spacing) supported his hypothesis[56, 57]. Faraday did not, however,
observe changes in single gold nanoparticles. This motivated us to look into deformation

52
of gold nanoparticles by direct application of force consequently controlling their surface
area and LSPR wavelengths while keeping the particle volume constant.
Experimental
Materials and Methods: Colloidal Gold solution of mean particle diameter of 60 nm was
purchased from British Bio-cell International (Cardiff, UK) and the as obtained solution
was purified using a Tube O Dialyzer (G-Biosciences, Maryland Heights, MO) to remove
any residual salts. Glass slides, silicon substrates and glass rods were cleaned several
times using Acetone and distilled water. Further, all the substrates used in these studies
were cleaned in a piranha solution (3:1 conc.H2SO4: 30% H2O2) at 900C for 60 min.
(Warning: Piranha solution is hazardous and highly reactive with organic compounds.
Extreme care should be taken while handling it). After cooling, the substrates were
washed in de-ionized water for 5 min and stored in a beaker of de-ionized water. Before
use, they were plasma etched for 15 minutes (Harrick Plasma Cleaner PDC – 32G).
Deformation Procedure: To prepare the sample, 5-10 µl of purified colloidal gold
solution diluted with DI water in 1:1 ratio was drop coated onto the glass slide (or silicon
wafer) and allowed to dry. The slide was then clamped to an optical bench to hold it still.
A glass rod of diameter 5 mm was placed on one end of the slide. By applying force with
hand, the rod was rolled over the length of the glass slide multiple times. The force with
which rolling was done was approximately 3 pounds.

53
Figure 4.3: Photograph showing the deformation technique employed. A glass slide is
drop coated with gold nanoparticles and is placed on a slide holder fixed to the optical
bench to prevent it from moving. A glass stirring rod is used to roll the particles and
deform them.
Instrumentation
Optical Imaging: A Nikon Eclipse TE 2000-U microscope was used to optically image
the gold nanoparticles before and after deformation. Transmitted light dark field images
were acquired with a Nikon D90 digital camera using a 100X oil immersion objective of
numerical aperture (N.A) 0.5 - 1.3 stopped down to 0.5 and a dark field condenser of N.A
0.95-0.8. All parameters of the camera were controlled by Camera Control Pro2 software
(Nikon Instruments Inc., Melville, NY, USA).
Atomic Force Microscopy (AFM): The colloidal gold solution was drop coated on a
silicon wafer and allowed to dry. One half of the sample on wafer was deformed using
the glass rod leaving a region of particles un-deformed. Alteration of the height of

54
particles was measured using a Veeco Nanoscope IV Multi mode atomic force
microscope (Veeco Metrology Group Inc., France) in contact mode.
Dark Field Scattering Spectrum: The nanoparticles were viewed under reflected light
dark field mode on a Leica DMI 5000M microscope (Leica Microsystems, Richmond IL,
USA) using a tungsten halogen lamp as light source. Spectra of gold nanoparticles before
and after deformation were collected using a DeltaNu DNS 300 spectrometer with a 150
lines/mm grating blazed at 500 nm equipped with Andor CCD camera operated by Andor
iDus software (Andor Technology plc. South Windsor, CT, USA). Spectra were
normalized using a white paper.
Results and Discussion
The colloidal gold solution used in this experiment was roughly 60 nm in diameter and
gave a strong absorption peak at around 543 nm. Consequently, these particles are
expected to be green in color. However, the optical images in Figure 4.4 clearly show that
there is a mixture of red and green particles present, and this is also evident in the
scattering spectrum. The 747 nm peak can be attributed to the presence of non-spherical
particles and particle agglomeration upon drying. After deformation, however, every
particle turned red in the optical image and spectrum shifted to ~ 630 nm due to a change
in particle morphology (Figure 4.5).

Figure 4.4: Schematic of the experimental approach to deform the nanoparticles from the
initial spherical shape (a) to the final 'pancake' shape (b). The dark field images are of 60
nm gold nanoparticles on a glass slide before deformation (c) and after deformation (
Figure 4.5: Reflectance spectrum of 60 nm gold nanoparticles before and after
deformation showing LSPR peak shift by 84 nm.
This visual proof is further validated by scanning the un
under an AFM tip. To measure changes i
Atomic Force Microscope (AFM). Particles were deposited on a silicon wafer
55
Schematic of the experimental approach to deform the nanoparticles from the
initial spherical shape (a) to the final 'pancake' shape (b). The dark field images are of 60
nm gold nanoparticles on a glass slide before deformation (c) and after deformation (
spectrum of 60 nm gold nanoparticles before and after
deformation showing LSPR peak shift by 84 nm.
This visual proof is further validated by scanning the un-deformed and deformed samples
To measure changes in particle height, particles were imaged with
Atomic Force Microscope (AFM). Particles were deposited on a silicon wafer
Schematic of the experimental approach to deform the nanoparticles from the
initial spherical shape (a) to the final 'pancake' shape (b). The dark field images are of 60
nm gold nanoparticles on a glass slide before deformation (c) and after deformation (d).
spectrum of 60 nm gold nanoparticles before and after
deformed and deformed samples
n particle height, particles were imaged with
Atomic Force Microscope (AFM). Particles were deposited on a silicon wafer
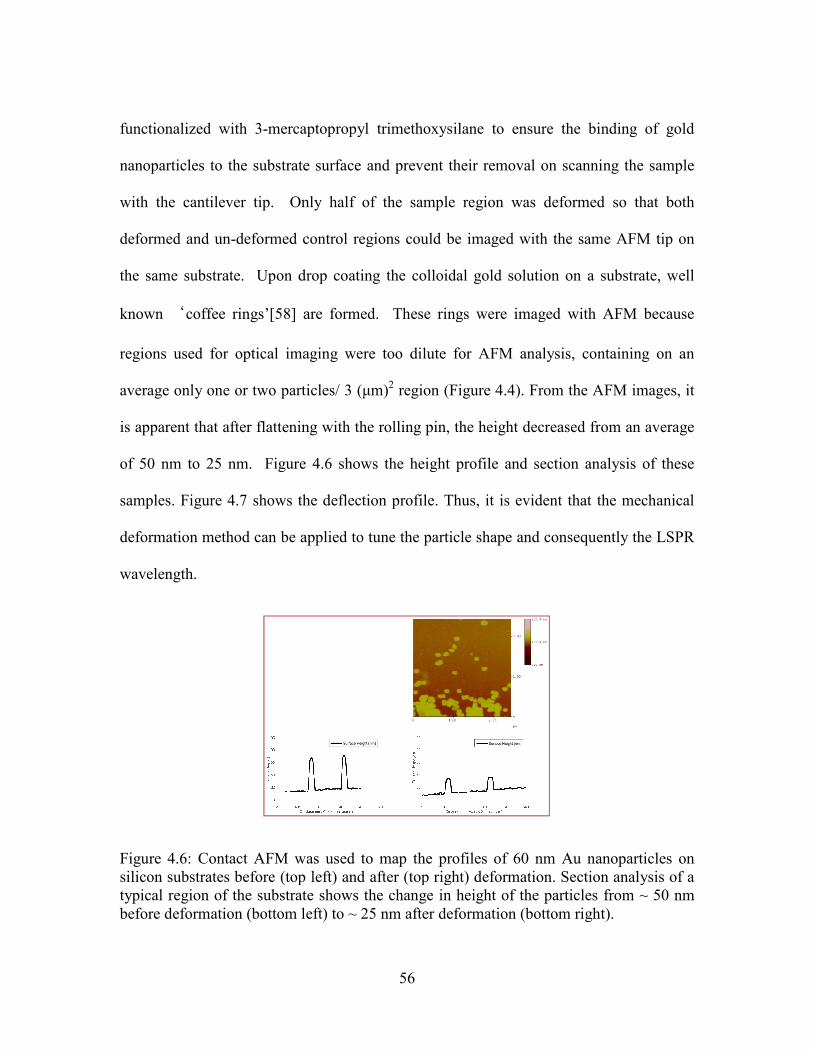
functionalized with 3-mercaptopropyl trimethoxysilane to ensure the binding of gold
nanoparticles to the substrate surface and prevent
with the cantilever tip. Only half of the sample region was deformed so that both
deformed and un-deformed control regions could be imaged with the same AFM tip on
the same substrate. Upon drop coating the colloidal g
known �coffee rings’[58] are formed. These rings were imaged with AFM because
regions used for optical imaging were too dilute for AFM analysis, containing on an
average only one or two particles/ 3 (µm)
is apparent that after flattening with the rolling pin, the height decreased from an average
of 50 nm to 25 nm. Figure
samples. Figure 4.7 shows the deflection profile. Thus, it is evident that the mechanical
deformation method can be applied to tune the particle shape and consequently the LSPR
wavelength.
Figure 4.6: Contact AFM was used to map the profiles of 60 nm Au nanoparticles on silicon substrates before (top left) and after (top right) deformation.typical region of the substrate shows the change in height of the particles from ~ 50 nm before deformation (bottom left) to ~ 25 nm after deformation (bottom right).
56
mercaptopropyl trimethoxysilane to ensure the binding of gold
nanoparticles to the substrate surface and prevent their removal on scanning the sample
with the cantilever tip. Only half of the sample region was deformed so that both
deformed control regions could be imaged with the same AFM tip on
the same substrate. Upon drop coating the colloidal gold solution on a substrate, well
are formed. These rings were imaged with AFM because
regions used for optical imaging were too dilute for AFM analysis, containing on an
verage only one or two particles/ 3 (µm)2 region (Figure 4.4). From the AFM images, it
is apparent that after flattening with the rolling pin, the height decreased from an average
Figure 4.6 shows the height profile and section analysis
shows the deflection profile. Thus, it is evident that the mechanical
deformation method can be applied to tune the particle shape and consequently the LSPR
Contact AFM was used to map the profiles of 60 nm Au nanoparticles on silicon substrates before (top left) and after (top right) deformation. Section analysis of a typical region of the substrate shows the change in height of the particles from ~ 50 nm
fore deformation (bottom left) to ~ 25 nm after deformation (bottom right).
mercaptopropyl trimethoxysilane to ensure the binding of gold
their removal on scanning the sample
with the cantilever tip. Only half of the sample region was deformed so that both
deformed control regions could be imaged with the same AFM tip on
on a substrate, well
are formed. These rings were imaged with AFM because
regions used for optical imaging were too dilute for AFM analysis, containing on an
AFM images, it
is apparent that after flattening with the rolling pin, the height decreased from an average
shows the height profile and section analysis of these
shows the deflection profile. Thus, it is evident that the mechanical
deformation method can be applied to tune the particle shape and consequently the LSPR
Contact AFM was used to map the profiles of 60 nm Au nanoparticles on Section analysis of a
typical region of the substrate shows the change in height of the particles from ~ 50 nm fore deformation (bottom left) to ~ 25 nm after deformation (bottom right).

Figure 4.7: Contact AFM images showing 3D height profile before (a) and after (b)
deformation and deflection profile before (c) and after (d) deformation of 60 nm gold
nanoparticles in a 'coffee ring'.
Introduction to Surface Enhanced Raman Spectroscopy (SERS)
Surface Enhanced Raman Spectroscopy (SERS) is a surface
used to identify and detect molecules on the basis of their Raman signature. The
enhancements in the Raman signal obtained due to surface modification are in an order of
105-108 and up to 1015
agglomeration[10, 51, 52]. There are three ways of increasing the signal in SERS. One is
to increase the amount of analyte bound t
surface to enhance adsorption, or increasing the total surface area available for
adsorption[59]. Second is to control the nanoparticle shape in order to tune the
electromagnetic enhancement arising from the coupling of Raman excitation with the
nanoparticle LSPR modes[60
wavelength to maximize the chemical enhancement which results
57
Contact AFM images showing 3D height profile before (a) and after (b)
deformation and deflection profile before (c) and after (d) deformation of 60 nm gold
nanoparticles in a 'coffee ring'.
Surface Enhanced Raman Spectroscopy (SERS)
Surface Enhanced Raman Spectroscopy (SERS) is a surface-sensitive technique which is
used to identify and detect molecules on the basis of their Raman signature. The
enhancements in the Raman signal obtained due to surface modification are in an order of
for single molecule SERS depending on the particle
There are three ways of increasing the signal in SERS. One is
to increase the amount of analyte bound to the nanoparticles by either modifying the
surface to enhance adsorption, or increasing the total surface area available for
Second is to control the nanoparticle shape in order to tune the
netic enhancement arising from the coupling of Raman excitation with the
60]. Third is to select the analyte, surface, and laser
wavelength to maximize the chemical enhancement which results from the
Contact AFM images showing 3D height profile before (a) and after (b)
deformation and deflection profile before (c) and after (d) deformation of 60 nm gold
Surface Enhanced Raman Spectroscopy (SERS)
sensitive technique which is
used to identify and detect molecules on the basis of their Raman signature. The
enhancements in the Raman signal obtained due to surface modification are in an order of
for single molecule SERS depending on the particle
There are three ways of increasing the signal in SERS. One is
o the nanoparticles by either modifying the
surface to enhance adsorption, or increasing the total surface area available for
Second is to control the nanoparticle shape in order to tune the
netic enhancement arising from the coupling of Raman excitation with the
Third is to select the analyte, surface, and laser
formation of

58
charge transfer states between the chemisorbed species and the metal surface[61]. Our
deformation method affects both the particle surface area and electromagnetic
enhancement but not chemical enhancement.
Application of plasmonic nanoparticles as substrates for Surface Enhanced Raman
Spectroscopy
Instrumentation and Experimental: 20 µl of concentrated 60 nm gold colloidal solution
(British Bio-cell International, Cardiff, UK) was drop coated on a clean glass slide and
allowed to dry. This glass slide was incubated in ethanoic solution of 1 mM 4-
Mercaptobenzoic acid (MBA) for 3 hours. Then, it was washed with ethanol and allowed
to dry before taking spectrum. Then, the un-deformed gold sample was again incubated
in MBA for 30 minutes and spectrum was collected to determine whether the sample was
saturated or if further incubation would increase the SERS intensity. After rinsing again,
the sample was deformed as described in the previous section, and the SERS signal was
acquired for the same region. This gave the effect of deformation on intensity. Next,
more MBA was added and spectrum collected again to observe whether the deformation
increased available surface area for MBA binding. In each case, the glass slide was
removed and put back on to the microscope stage. By taking dark field images each time
and matching them, it was ensured that the same region was focused in all cases. Also,
the spectrum was collected thrice at each of these steps of the experiment to test for the
reproducibility of the position and obtain a mean value of intensity. A Leica DMI 5000M
microscope was used to image the sample and spectra were collected using DeltaNu DNS

59
300 spectrometer with a 5mW and 632.8nm wavelength Helium-Neon laser (REO Inc.
Boulder, CO, USA) as the light source. The dark field images were taken using a
Hamamatsu C 11440 digital camera (Hamamatsu Corp. Bridgewater, NJ, USA).
Results and Discussion
SERS studies were performed on the un-deformed and deformed gold nanoparticle
samples by using 4-mercaptobenzoic acid (MBA) as the Raman reporter and using a
632.8 nm He-Ne laser as the source. As can be seen in Figure 4.8, the un-deformed
particles with MBA showed a SERS spectrum with two prominent peaks at 1068 cm-1and
1595 cm-1 which are attributed to ν12(a1) and ν8a(a1) aromatic ring characteristic
vibrations respectively. The sample was deformed using the same procedure as discussed
earlier. It can be seen from Figure 4.8 that after deformation, an increase in the intensity
of the resulting SERS spectrum was observed. This can be explained by considering the
localized surface plasmon resonance phenomenon. The initial un-deformed particles, as
discussed earlier, had an absorption peak at ~ 543 nm, which after deformation shifted to
~ 630 nm. This red-shift caused the particles’ LSPR wavelength to come into resonance
with the incident laser wavelength (632.8 nm He-Ne), consequently, an increase in
intensity of the spectrum.

60
Figure 4.8: SERS of 60 nm gold nanoparticles showing the spectrum before and after
deformation with /without adding MBA in each case.
Figure 4.9 shows the SERS spectra after subtracting the spectrum of un-deformed gold
nanoparticles from those obtained after adding MBA, deforming them and adding more
MBA. Graphs in Figure 4.10 show the mean intensity and standard deviation from mean
as error bars for two of the prominent peaks of the SERS spectrum. Table1 shows the
values that correspond to the column graphs in Figure 4.10.
Figure 4.9: SERS spectrum for gold nanoparticles showing effect of adding MBA and
deformation.

61
Figure 4.10: Deviation of intensities from mean for two of the prominent peaks observed
in SERS spectrum.
Condition 1068 cm-1 peak
Peak Intensity ±
Standard Deviation
1595 cm-1 peak
Peak Intensity ±
Standard Deviation
1 - Un-deformed 10349 ± 518 12438 ± 470
2 – Un-deformed + MBA 10698 ± 538 13139 ± 573
3 – Deformed 14125 ± 166 16241 ± 202
4 - Deformed + MBA 18174 ± 672 21177 ± 544
Table 1: Mean and standard deviation values for two prominent peaks of SERS spectrum
as shown in figure 4.10.

62
Deformation also affected the surface area of particles. Before deformation, the particles
were saturated with MBA, thus, addition of more MBA to the un-deformed particles
caused negligible changes in spectrum, whereas the intensity increased when MBA was
added to the deformed particles which we attribute to the increased surface area of the
particles after deformation. Calculations below show that if a spherical particle was
deformed to an oblate spheroid with a height of half the initial radius, its surface area
would increase by 22%. This change is similar to the 30% increase in signal observed
upon incubation with MBA. The difference is either because the particles were flattened
to less than half the original height, or because the new surface area occurs primarily in
more enhancing regions especially features with larger radii of curvature.
Surface Area Calculations
It is seen that deformation causes the intensity of the SERS spectrum to rise. This is
attributed to an increase in the exposed surface area of particles on deformation. The
calculations below show how the surface area of particles is expected to change. Graph in
Figure 4.11 gives a relationship between relative change in height of the particles and
their corresponding surface area change as they transform from a sphere to an oblate
spheroid. It can be noticed that as the height of the particle is reduced to half, the surface
area of the particle increases by ~ 22%.

Equation use
Surface area of sphere = 4πr2
Surface area of oblate spheroid =
Where, arccosba
α =
; α is angular
semi-major and semi-minor axis of the spheroid respectively.
r = radius of the sphere.
Considering a sphere to be deformed to an oblate spheroid with height being half of the
initial sphere radius, we get,
2r
b = ; 2a r=
Figure 4.11: Effect of deformation on surface area of
012345
0
Surf
ace
Are
a of
(Sph
eroi
d /
Sphe
re)
Relative change in height of the particle (b/r)
Relation between Height and
63
Equation used for surface area calculations
Surface area of oblate spheroid = 2
2 1 sin2 ln
sin cosb
aα
πα α
+ +
; α is angular eccentricity of the oblate spheroid, a and b are the
minor axis of the spheroid respectively.
Considering a sphere to be deformed to an oblate spheroid with height being half of the
Effect of deformation on surface area of a nanoparticle.
0.1 0.2 0.3 0.4 0.5 0.6 0.7 0.8 0.9 1 1.1Relative change in height of the particle (b/r)
Relation between Height and Surface Area
eccentricity of the oblate spheroid, a and b are the
Considering a sphere to be deformed to an oblate spheroid with height being half of the
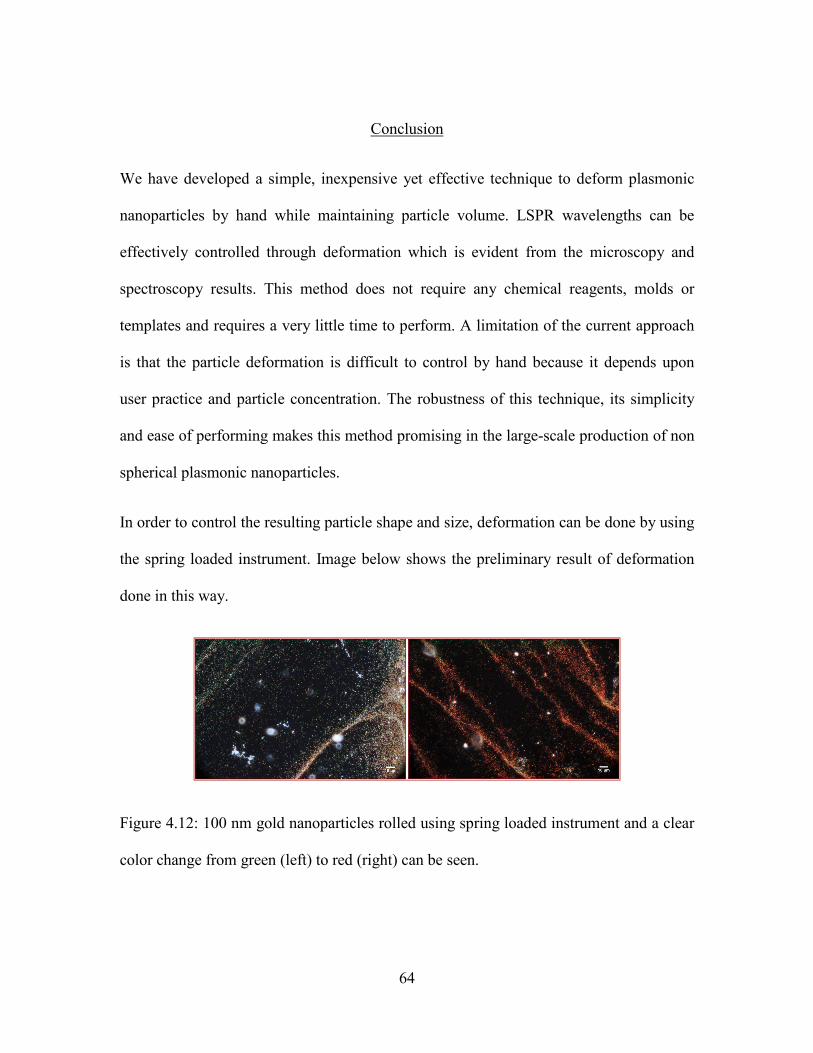
64
Conclusion
We have developed a simple, inexpensive yet effective technique to deform plasmonic
nanoparticles by hand while maintaining particle volume. LSPR wavelengths can be
effectively controlled through deformation which is evident from the microscopy and
spectroscopy results. This method does not require any chemical reagents, molds or
templates and requires a very little time to perform. A limitation of the current approach
is that the particle deformation is difficult to control by hand because it depends upon
user practice and particle concentration. The robustness of this technique, its simplicity
and ease of performing makes this method promising in the large-scale production of non
spherical plasmonic nanoparticles.
In order to control the resulting particle shape and size, deformation can be done by using
the spring loaded instrument. Image below shows the preliminary result of deformation
done in this way.
Figure 4.12: 100 nm gold nanoparticles rolled using spring loaded instrument and a clear
color change from green (left) to red (right) can be seen.

65
This research has shown the potential of mechanical deformation methods in obtaining
non spherical amorphous and metallic nanoparticles. However, the biggest challenge that
needs to be addressed is the control over forces applied and deformation induced in the
particles. The following chapter summarizes the work done so far and proposes the future
directions for addressing the challenges that remain.

66
CHAPTER FIVE
CONCLUSIONS AND FUTURE WORK
Conclusions
A novel method of deforming various types of micro and nano particles has been
developed. It is shown that by application of force on the particles manually, their shape
and size can be altered. Depending on the method of rolling, the resulting particles can be
either rod or disc shaped.
Polystyrene particles have a low young’s modulus (E) of ~3 GPa. Thus, less force is
required to deform them into different shapes when compared to gold nanoparticles (E ~
79 GPa). Along with manual application of force directly on the particles, it is also shown
that the particles can be embedded in a polymer matrix and the films can be stretched or
compressed in order to physically alter the particle size and shape. However, temperature
and humidity play a significant role in defining the amount of deformation.
This principle can be extended to deforming plasmonic nanoparticles like gold. Being a
metal, gold requires application of high forces to deform it as it has a young’s modulus of
~79 GPa. Unlike polymeric particles, noble metal nanoparticles have a unique feature
called “Localized Surface Plasmon Resonance” (LSPR) which is size and shape
dependent. Thus, deformation studies on metal nanoparticles conducted here have been
focused on studying the LSPR wavelengths and tuning them via physical alteration of
particle size and shape. Further, deformation causes the surface area of the particles to

67
increase and also form sharp features that can concentrate the electromagnetic fields and
hence, can be used as substrates for surface enhanced Raman spectroscopy (SERS).
Several microscopy and spectroscopy techniques are adopted to ensure that the particles
are deformed and the corresponding data is clearly represented.
Thus, mechanical deformation of particles tend to be a very simple yet effective method
for fabricating particles of varying sizes and shapes. Once, the spring loaded instrument
designed for this purpose is fully explored, it would prove to be a method capable of
mass production. The previous studies in this field have largely used chemical synthesis
methods and nano lithographic techniques to fabricate particles of different
morphologies. A few mechanical methods have also been applied, but in controlled
environments. The method we suggest proves to be advantageous in this respect as all the
deformation studies were done by us at room temperature, without the use of any molds
or templates and any chemicals. It is time and cost efficient and requires minimal
instrumentation. Even the instrument designed for this purpose is made simple with few
parts and all of them replaceable. This makes the entire approach simplistic and easily
reproducible. Most importantly, tunable particle shapes and sizes is the biggest advantage
of this method.
Future Work
We have got some preliminary results using the spring loaded instrument. We would like
to further characterize the forces applied and other parameters in the instrument to see
how deformation can be affected accordingly. Effect of rolling speed, hardness of

68
substrate and effect of different substrates is another aspect of this study which we are
currently working on. Controlling the deformation process more precisely to obtain
particles of desired aspect ratios is the ultimate goal of this project. As for plasmonic
nanoparticles, we have mainly studied gold, but this study can be extended to other metal
nanoparticles like silver, copper and nickel etc. to see how this process varies from one
metal type to the other. There are several applications for tuning LSPR wavelengths apart
from using these tuned particles as SERS substrates. Some of these applications like
refractive index sensors, optical devices like immunoassays and biological sensing are
few of the future directions where these deformed nanoparticles can be tested and used.
Controlling particle deformation
Photolithography
Photolithography is a process of transferring geometric shapes on a mask to the surface of
a silicon wafer. This process uses light to transfer a geometric pattern from a photo mask
to a light sensitive chemical called “photo resist”. Chemical or plasma etching is then
used to transfer the pattern from the resist to the barrier material on the surface of the
wafer. A typical photolithography process follows the following steps (Figure 5.1):
1. Cleaning the wafers thoroughly.
2. Depositing a barrier layer.
3. Coating the wafer with desired photo resist.
4. Soft bake the wafer at a temperature which is based on the type of resist used. This
is to semi harden the resist.

69
5. A mask is a patterned glass plate which is aligned with the wafer in this step.
6. Mask and wafer are brought in contact and light is focused so as to transfer the
pattern from the resist to the wafer.
7. The wafer is now developed by dipping into a chemical which removes the resist
from regions which are un-patterned.
8. Then, the wafers are hard baked at a high temperature to harden the pattern.
9. The resist is then etched to end up with a patterned wafer surface.
This method is an alternative approach of obtaining precisely controlled sizes and shapes
of particles. Although the initial process is a little tedious, deformation process can be
well controlled in this way. We plan to use this method in future to form spacers on a
wafer between which the particles to be deformed can be deposited. Next, they can be
deformed using the mechanical methods developed to obtain particles of well predicted
morphologies. A flowchart of the planned technique is here under:

70
Figure 5.1: Photolithography process flow.

71
Here, tungsten (W) is coated on a silicon wafer before depositing a photo resist.
Tungsten is used because it has a much higher modulus (~411 GPa) than gold and thus
would not be affected when gold is deposited and deformed. In step 2, a negative resist is
deposited on the tungsten coated wafer. A mask of desired pattern (rectangular arrays
preferably) is brought in contact with the resist and is exposed to light. This causes the
regions unexposed to light to be dissolved in the developer solution and the wafer is left
with a pattern. This patterned wafer is functionalized with 3–mercaptopropyl
trimethoxysilane to ensure the binding of gold to the wafer surface. In the next step, gold
of size bigger than the channel height is deposited and the resist is stripped to leave the
wafer as seen in the image below. Thus, on deforming the gold particles now, it can be
ensured that they would be flattened only up to the level of channel and so the resulting
shape is predictable.
Figure 5.2: Zoomed in view of controlled deformation of nanoparticles using
photolithography.

72
In situ deformation
Another approach to studying the changes in properties of a deformed particle is to study
an individual particle. This can be performed by deforming a single nanoparticle in situ
and also looking at it simultaneously while it undergoes deformation. This can be done
by drop coating a substrate with low concentration of particles which are sparsely spaced.
By placing this substrate over a microscope stage, an individual particle can be focused
and deformed in situ using a glass rod. Immediately, the particle can again be seen to
observe the changes incurred in the particle. Also, spectrum can be recorded for the same
particle before and after deformation.
A few preliminary results have been obtained using this procedure. 60 nm gold
nanoparticles have been deposited on a glass slide and the slide is placed on the
microscope stage. The un-deformed particles are imaged and then a glass rod (5 mm
diameter) is used to deform these particles. An image is taken while the rod is in contact
with the slide. After deforming the particles and retrieving the rod, the same region is
again imaged to see the deformed particles. Following figure illustrates this method.

73
Figure 5.3: Au 60 nm particles before deformation (a), glass rod in contact (b) and after
deformation (c). Encircled are the exact regions of particles which were deformed.
Deformation of magnetic particles and “Breading”
The same deformation procedure can also be applied to magnetic micro and nano
particles. Non spherical magnetic particles have the advantage that they can be controlled
easily using an external magnetic field. This would make their tracking effective and
thus, can be used in several applications like biological imaging, treatment of cancerous
cells by hyperthermia and so on. Also, by rolling different types of particles together,
new composite particles can be prepared which can have wider range of properties
opening up new fields of applications. For example, breading a magnetic nanoparticle
with a polymeric particle would produce composite particles having advantages of both

74
the polymer properties and magnetism associated with them. We have some preliminary
results with these studies and would like to venture deeper in this area.
Figure 5.4: 4.93 µm carboxyl ferromagnetic particles before (left) and after (right) rolling
using a glass rod.
Figure 5.5: Gold nano-rods rolled with 4.93 µm carboxyl ferromagnetic particles (left)
and 60 nm gold nanoparticles rolled with 7.66 µm polystyrene particles (right).

75
Figure 5.6: SEM image of 4.8 µm fluorescent ferromagnetic particles. Inset shows the
chromium dioxide nano rolls present inside these ferromagnetic particles.
It is evident that mechanical deformation can be a novel way of obtaining non spherical
micro and nano particles. Depending on the type of particles and their composition, force
applied requires to be varied in order to obtain desired level of deformation. Proper
control methods make this technique suitable for mass production with relative ease as
compared to other established chemical and lithographic methods. Moreover, this
approach simplifies the fabrication of composite particles with magnetic, plasmonic,
polymeric and fluorescent functionalities by ‘breading’ these particles together. Hence,
mechanical deformation opens up a new and potential field of fabrication of non
spherical nanoparticles.

76
Appendix
Imaging Methods
Transmission Electron Microscopy
TEM is a technique where a beam of electrons coming from an electron gun are
concentrated on the specimen by means of a condenser lens, which then pass through the
specimen and these electrons are focused into an intermediate magnified image by the
objective lens. This image is further magnified by a projector lens and the final image is
focused onto a fluorescent screen or a photographic film. Electron lenses used for this
instrument are lot bulkier than the typical glass lenses and require a separate power
supply to induce current and generate high voltages to accelerate the electrons. Also, the
whole setup is enclosed in a vacuum environment in order to reduce the collision between
electrons and gas atoms to negligible levels and thus increase the mean free path of
electrons. The resolutions obtained from TEM are in the order of a few nanometers.
However, there are a few disadvantages of this microscopy technique. One being the
extensive sample preparation required for making an ultra thin sample which is electron
transparent and the other is that the field of view is small which can make the relevance
of region under analysis being characteristic of the entire sample questionable. Apart
from this, damage to the sample due to electron beam is also a possibility[62].

77
Scanning Electron Microscopy
SEM consists of a very fine probe of electrons at a high energy that are focused on the
surface of the specimen and is ‘raster’ scanned. On electron impact, secondary electrons
with little lower energy are emitted from the surface of the sample combined with the re
emission or reflection of high energy back scattered electrons from the primary beam.
The intensity of emission of both of these electrons largely depends on the angle at which
the electron beam strikes the surface or alternatively, the topography of sample. The
emitted electron current is collected and amplified before it is imaged on a cathode ray
tube. Due to very narrow beam of electrons, the depth of field for SEM micrographs is
very large yielding a three dimensional appearance facilitating a better study of surface
structure of the sample [62].
Atomic Force Microscopy
AFM is a microscopy technique which consists of no lenses. It gives the topographical
information, texture and material characteristics of the specimen under study by ‘feeling’
instead of ‘seeing it. AFM consists of a cantilever with a sharp tip or probe at its end
which scans the sample in x and y directions. The topography of the sample surface
causes the cantilever to deflect as the force between tip and surface of the sample
changes. To maintain constant force between tip and sample, a constant tip-to-sample
distance needs to be maintained. This is done by mounting the sample on a piezo electric
tube, which controls sample in z-direction. The deflection of cantilever is recorded by
means of reflection of a laser spot from the top of the cantilever surface into an array of
78
photodiodes. The x, y and z directions of the piezo scanner are recorded and displayed to
produce an image of the scanned surface. There are different modes of performing AFM
depending on the method of scanning the specimen. Contact mode refers to dragging the
cantilever tip over the specimen surface so as to determine its topography. In this mode,
the force between tip and surface is kept constant by maintaining a constant deflection.
Non contact mode is the one where the cantilever is oscillated at a frequency near its
resonant frequency just above the specimen surface. The oscillation amplitude, frequency
and phase are modified by the tip sample interaction which gives information about the
sample characteristics. Tapping mode is similar to non contact mode with the difference
of using higher amplitudes of oscillation of the cantilever. Also, the cantilever is made to
oscillate up and down near its resonant frequency so that it taps the sample by making
intermittent contacts with its surface. AFM can be used in ambient conditions and does
not require intricate sample preparation. It can also be used in liquid medium and most
importantly, provides a three-dimensional view of the sample. This makes it
advantageous over other microscopy techniques like SEM; however, image scan size and
scanning speed are some limitations it poses [63].

79
REFERENCES
1. Leonhardt, U., Optical metamaterials: Invisibility cup. Nat Photon, 2007. 1(4): p. 207-208.
2. Faraday, M., The Bakerian Lecture: Experimental Relations of Gold (and Other
Metals) to Light. Philosophical Transactions of the Royal Society of London, 1857. 147: p. 145-181.
3. Klabunde, K.J., ed. Nanoscale Materials in Chemistry 1ed. 2001, Wiley-
Interscience: NewYork. 4. Brinckmann, S., Kim, J.Y., and Greer, J. R., Fundamental Differences in
Mechanical Behavior between Two Types of Crystals at the Nanoscale. Physical Review Letters, 2008. 100(15): p. 155502.
5. Zhang, Z.L., Kristiansen, H., and Liu, J., A method for determining elastic
properties of micron-sized polymer particles by using flat punch test. Computational Materials Science, 2007. 39(2): p. 305-314.
6. He, J.Y., Helland, T., Zhang, Z. L., and Kristiansen, H., Fracture of micrometre-
sized Ni/Au coated polymer particles. Journal of Physics D: Applied Physics, 2009. 42(8): p. 085405.
7. Lagos, M.J., Sato, F., Galvao, D. S., and Ugarte, D., Mechanical Deformation of
Nanoscale Metal Rods: When Size and Shape Matter. Physical Review Letters, 2011. 106(5): p. 055501.
8. Kamat, P.V., Photophysical, Photochemical and Photocatalytic Aspects of Metal
Nanoparticles. The Journal of Physical Chemistry B, 2002. 106(32): p. 7729-7744.
9. Timofeeva, E.V., Routbort, J. L., and Singh, D. Particle shape effects on
thermophysical properties of alumina nanofluids. Journal of Applied Physics, 2009. 106(1): p. 014304-10.
10. Anker, J.N., Hall, W. P., Lyanders, O., Shah, N.C., Zhao, J., and Van Duyne, R.
P., Biosensing with plasmonic nanosensors. Nat Mater, 2008. 7(6): p. 442-453. 11. Haes, A. J., Haynes, C. L., McFarland, A. D., Schatz, G. C., Van Duyne, R. P.,
and Zou, S., Plasmonic Materials for Surface-Enhanced Sensing and Spectroscopy. MRS Bulletin, 2005. 30: p. 368.

80
12. Michalet, X., Pinaud, F. F., Bentolila, L. A., Tsay, J. M., Doose, S., Li, J. J., Sundaresan, G., Wu, A. M., Gambhir, S. S., and Weiss, S., Quantum Dots for Live Cells, in Vivo Imaging, and Diagnostics. Science, 2005. 307(5709): p. 538-544.
13. Walling, M. A., Novak, J. A., and Shepard, J. R. E., Quantum Dots for Live Cell
and In Vivo Imaging. International Journal of Molecular Sciences, 2009. 10(2): p. 441-491.
14. Ayyappan, S., Mahadevan, S., Chandramohan, P., Srinivasan, M. P., Philip, J.,
and Raj, B., Influence of Co2+ Ion Concentration on the Size, Magnetic Properties, and Purity of CoFe2O4 Spinel Ferrite Nanoparticles. The Journal of Physical Chemistry C, 2010. 114(14): p. 6334-6341.
15. Rana, S., Philip, J., and Raj, B., Micelle based synthesis of cobalt ferrite
nanoparticles and its characterization using Fourier Transform Infrared Transmission Spectrometry and Thermogravimetry. Materials Chemistry and Physics, 2010. 124(1): p. 264-269.
16. Pankhurst, Q.A., Thanh, N. K. T., Jones, S. K., and Dobson, J., Progress in
applications of magnetic nanoparticles in biomedicine. Journal of Physics D: Applied Physics, 2009. 42(22): p. 224001.
17. Champion, J. A. and Mitragotri, S., Role of target geometry in phagocytosis.
Proceedings of the National Academy of Sciences of the United States of America, 2006. 103(13): p. 4930-4934.
18. Mitragotri, S. and Lahann, J., Physical approaches to biomaterial design. Nat
Mater, 2009. 8(1): p. 15-23. 19. Merkel, T. J., Jones, S. W., Herlihy, K. P., Kersey, F. R., Shields, A. R., Napier,
M., Luft, J. C., Wu, H., Zamboni, W. C., Wang, A. Z., Bear, J. E., and DeSimone, J. M., Using mechanobiological mimicry of red blood cells to extend circulation times of hydrogel microparticles. Proceedings of the National Academy of Sciences, 2011. 108(2): p. 586-591.
20. Chen, H., Kou, X., Yang, Z., Ni, W., and Wang, J., Shape- and Size-Dependent
Refractive Index Sensitivity of Gold Nanoparticles. Langmuir, 2008. 24(10): p. 5233-5237.
21. Yang, Z., Qian, H., Chen, H., and Anker, J. N., One-pot hydrothermal synthesis of
silver nanowires via citrate reduction. Journal of Colloid and Interface Science, 2010. 352(2): p. 285-291.

81
22. Sun, Y. and Xia, Y., Shape-Controlled Synthesis of Gold and Silver Nanoparticles. Science, 2002. 298(5601): p. 2176-2179.
23. Lakshminarayana, P. and Qing-Hua, X., A simple method for large scale
synthesis of highly monodisperse gold nanoparticles at room temperature and their electron relaxation properties. Nanotechnology, 2009. 20(18): p. 185606.
24. Merkel, T. J., Herlihy, K. P., Nunes, J., Orgel, R. M., Rolland, J. P., and
DeSimone, J. M., Scalable, Shape-Specific, Top-Down Fabrication Methods for the Synthesis of Engineered Colloidal Particles. Langmuir, 2009. 26(16): p. 13086-13096.
25. Amer, M. S., Raman Spectroscopy, Fullerenes and Nanotechnology. 1 ed, ed.
H.K. Harold Craighead, Paul O'Brien2010: Royal Society of Chemistry. 26. Nagy, M., and Keller, A., Ellipsoidal polymer particles with predesigned axial
ratio. Polymer communications, 1988. 30(5): p. 3. 27. Wang, S., Xu, P., and Mark, J, E., Method for generating oriented oblate particles
in an elastomer and characterization of the reinforcement they provide. Macromolecules, 1991. 24(22): p. 6037-6039.
28. Anker J. N., Horvath, T. D., and Kopelman, R., Cooking With Nanoparticles: A
Simple Method of Forming Pancake, Roll, and Breaded Polystyrene Microparticles. European Cells and Materials, 2002. 3: p. 3.
29. Tan, S., Sherman, R. L., and Ford, W. T., Nanoscale Compression of Polymer
Microspheres by Atomic Force Microscopy. Langmuir, 2004. 20(17): p. 7015-7020.
30. Johnson, K. L., Contact Mechanics 1987: Cambridge University Press. 31. Wang, S. and Mark, J. E., Generation of glassy ellipsoidal particles within an
elastomer by in situ polymerization, elongation at an elevated temperature, and finally cooling under strain. Macromolecules, 1990. 23(19): p. 4288-4291.
32. Yin, Y. and Xia, Y., Self-Assembly of Monodispersed Spherical Colloids into
Complex Aggregates with Well-Defined Sizes, Shapes, and Structures. Advanced Materials, 2001. 13(4): p. 267-271.
33. Gabrielson, L. and Folkes, M. J., Manufacture of colloidal polymer ellipsoids for
anisotropic conducting nano-composites. Journal of Materials Science, 2001. 36(1): p. 1-6.

82
34. Champion, J.A., Katare, Y. K., and Mitragotri, S., Making polymeric micro- and nanoparticles of complex shapes. Proceedings of the National Academy of Sciences, 2007. 104(29): p. 11901-11904.
35. Kittel, C., Introduction to Solid State Physics. 7 ed1995: Wiley. 36. Gottstein, G., Grain Boundary Migration in Metals: Thermodynamics, Kinetics,
Applications. 1 ed: CRC Press. 37. Koch,C., Ovid'ko, I., Seal, S., and Veprek, S., Structural Nanocrystalline
Materials: Fundamentals and Applications. 1 ed2007: Cambridge University Press.
38. Poole, C. P., and Owens, F. J., Introduction to Nanotechnology. 1 ed2003: Wiley-
Interscience. 39. Tjong, S. C., Nanocrystalline Materials: Their Synthesis-Structure-Property
Relationships and Applications. 1 ed2006: Elsevier Science. 40. Smith, W., and Hashemi, J., Foundations of Material Science and Engineering. 4
ed2005: McGraw Hill. 41. Schiotz, J., Di Tolla, F. D., and Jacobsen, K. W., Softening of nanocrystalline
metals at very small grain sizes. Nature, 1998. 391(6667): p. 561-563. 42. Nowak, D. J., Mook, W. M., Minor, A. M., Gerberich, W. W., and Carter, C. B.,
Fracturing a nanoparticle. Philosophical Magazine, 2007. 87(1): p. 29-37. 43. Kotov, N. A., Nanoparticle Assemblies and Superstructures2006: CRC Press. 44. Hofmann, P., Solid State Physics: An Introduction. 1 ed2008: Wiley-VCH. 45. Mermin, N. D., and Ashcroft, N. W., Solid State Physics. 1 ed1976: Brooks Cole. 46. Hutter, E. and Fendler, J. H., Exploitation of Localized Surface Plasmon
Resonance. Advanced Materials, 2004. 16(19): p. 1685-1706. 47. Willets, K.A. and Van Duyne, R. P., Localized Surface Plasmon Resonance
Spectroscopy and Sensing. Annual Review of Physical Chemistry, 2007. 58(1): p. 267-297.
48. Brongersma, M. L., and Kik, P. G., Surface Plasmon Nanophotonics. 1 ed2007:
Springer.

83
49. Mishchenko, M. I. and Travis, L. D., Gustav Mie and the Evolving Discipline of Electromagnetic Scattering by Particles. Bulletin of the American Meteorological Society, 2008. 89(12): p. 1853-1861.
50. Haynes, C. L. and Van Duyne, R. P., Nanosphere Lithography:G A Versatile
Nanofabrication Tool for Studies of Size-Dependent Nanoparticle Optics. The Journal of Physical Chemistry B, 2001. 105(24): p. 5599-5611.
51. Haes, A. J., Haynes, C. L., McFarland, A. D., Schatz, G. C., van Duyne, R. P.,
and Zou, S., Plasmonic Materials for Surface-Enhanced Sensing and Spectroscopy. MRS Bulletin, 2005. 30(05): p. 368-375.
52. Yonzon, C. R., Stuart, D. A., Zhang, X., McFarland, A. D., Haynes, C. L., and
Van Duyne, R. P., Towards advanced chemical and biological nanosensors—An overview. Talanta, 2005. 67(3): p. 438-448.
53. Nikoobakht, B. and El-Sayed, M. A., Preparation and Growth Mechanism of
Gold Nanorods (NRs) Using Seed-Mediated Growth Method. Chemistry of Materials, 2003. 15(10): p. 1957-1962.
54. Canelas, D. A., Herlihy, K. P., and DeSimone, J. M., Top-down particle
fabrication: control of size and shape for diagnostic imaging and drug delivery. Wiley Interdisciplinary Reviews: Nanomedicine and Nanobiotechnology, 2009. 1(4): p. 391-404.
55. Tan, H., Gilbertson, A., and Chou, S. Y., Roller nanoimprint lithography. 1998.
Chicago, Illinois (USA): AVS. 56. Faraday, M., The Bakerian Lecture: Experimental Relations of Gold (and Other
Metals) to Light. Philosophical Transactions of the Royal Society of London, 1857. 147: p. 145-181.
57. Tweney, R. D., Discovering Discovery: How Faraday Found the First Metallic
Colloid. Perspectives on Science, 2006. 14(1): p. 97-121. 58. Deegan, R. D., Bakajin, O., Dupont, T. F., Huber, G., Nagel, S. R., and Witten, T.
A., Capillary flow as the cause of ring stains from dried liquid drops. Nature, 1997. 389(6653): p. 827-829.
59. Fleischmann, M., Hendra, P. J., and McQuillan, A. J., Raman spectra of pyridine
adsorbed at a silver electrode. Chemical Physics Letters, 1974. 26(2): p. 163-166.

84
60. Jeanmaire, D. L. and Van Duyne, R. P., Surface raman spectroelectrochemistry: Part I. Heterocyclic, aromatic, and aliphatic amines adsorbed on the anodized silver electrode. Journal of Electroanalytical Chemistry and Interfacial Electrochemistry, 1977. 84(1): p. 1-20.
61. Albrecht, M. G. and Creighton, J. A., Anomalously intense Raman spectra of
pyridine at a silver electrode. Journal of the American Chemical Society, 1977. 99(15): p. 5215-5217.
62. Watt, I. M., The Principles and Practice of Electron Microscopy1985, London:
Cambridge University Press. 63. Morris, V. J., Gunning, A. P., and Kirby, A. R., Atomic Force Microscopy for
Biologists1999: World Scientific Publishing Company.