Embed Size (px)
Citation preview

FAA CLEEN ConsortiumOpen Session
GE Aviation8 Nov. 2012
Doug Shafer Prgm Mgr.Rick Stickles TAPS II – Prgm Mgr.Arif Khalid Open Rotor – AeroJohn Wojno Open Rotor – AcousticsJeff Bult FMS/ATMSteve Nolte FMS-Engine Integration

GE CLEEN Technologies
1. TAPS II Combustor (Stickles)
2. Open Rotor (Khalid/Wojno)
3. FMS/ATM Integration (Bult)
4. FMS – Engine Integration (Nolte)

3GE – Aviation
5/12/2011 P. M. Niskode
FAA CLEEN Program Goals
Develop and demonstrate (TRL 6-7) certifiable aircraft technology

4GE – Aviation
5/12/2011 P. M. Niskode
GE CLEEN Program GoalsTimeframe: CY 2010-2015
TAPS II Combustor
• Emissions 60% below CAEP/6
Open Rotor
• 26% fuel burn reduction (relative to CFM56-7B)
• 17 EPNdB noise reduction (relative to stage 4)
FMS & ATM
• 7% fuel burn/CO2 reduction
• 22% landing noise reduction (area of 60 EPNdB footprint)
FMS-Engine Integration
• Up to 2% fuel burn reduction

1CLEEN Consortium November 2012
GE Aviation
CLEEN Consortium
ecomaginationSM
TAPS II Development ResultsNovember 8, 2012
Doug Shafer Program ManagerRick Stickles TAPS II Manager

2CLEEN Consortium November 2012
GE Aviation
GE Aviation Approach:TAPS (Twin annular Premixing Swirler)
Twin annular flames
• Staged combustion within mixer
• Lean-premixed fuel/air mixture in main swirler for reduced NOx at high power
• Central pilot for good operability and low CO/HC at low power
• Greater NOx Reduction at Cruise
FADEC sets optimum fuel splits
• Balance Emissions, Operability Durability, and Dynamics
Premixing flame zone
Pilot flame zone
Air
Fuel injection
Cyclone mixer
Pilot
Nozzle sprays shown without air flow(or cyclone mixer)
Pilot Only Pilot + Main

3CLEEN Consortium November 2012
GE Aviation
NOx Performance vs CLEEN Goal
CLEEN Goal
NOx exceeds CLEEN goal… Significant improvement in all emissions vs baseline CFM56 engine data.
Emissions

4CLEEN Consortium November 2012
GE Aviation
CLEEN TAPS II Accomplishments
• Scaled fuel nozzle & mixer size down to narrow body application
• Developed improved main mixer concept
• Evaluated single and dual circuit pilot nozzle designs
• Completed combustor component & core engine testing
• Developed combustion dynamics rig test & modeling techniques
• Demonstrated significant emissions reduction relative to the CFM56 baseline engine
• Demonstrated average measured NOx levels that exceed the CLEEN goal of 60% margin to CAEP/6

5CLEEN Consortium November 2012
GE Aviation
ApplicationsLean burn TAPS combustion
� TAPS I in service on 747-8 and 787 wide body aircraft
� TAPS II (FAA CLEEN) scaled technology to narrow body aircraft
Application/Engine 1st Engine To Test Entry into Service
COMAC C919/Airbus A320 NEO
– LEAP-1A/-1C Sept 2013 2016
Boeing 737 Max
– LEAP-1B April 2014 2017
737 MAX
CLEEN technology in service by 2016

6CLEEN Consortium November 2012
GE Aviation
Backup

7CLEEN Consortium November 2012
GE Aviation
CLEEN TAPS II Development Program2010 2011 2012 2013
Technology Maturation
System Engineering/Integration
Technology Demonstration
Technology Assessment
Conceptual Design
Flame tube test
Combustion Dynamics Enabling Technology
5 Cup sector test #1
TCA and HTP Test
5 Cup sector test #2
Full annular Test
Test Report
Core Engine TestBaseline Engine Test Data
Test Report
Final Report
Program has completed all testing … team working final reports in 2012

8CLEEN Consortium November 2012
GE Aviation
Single Annular Combustor (SAC)• Rich burning (tech insertion)
• 25% margin to CAEP/6 NOx
CFM56 DAC
GEnx
CFM56 SAC
Double Annular Combustor (DAC)• Lean burning
• 35% margin to CAEP/6 NOx
Twin Annular Premixing Swirler (TAPS I)• Lean burning
• 50% margin to CAEP/6 NOx
TAPS II (FAA CLEEN, NASA N+1)• Lean burning
• 60% margin to CAEP/6 NOx
NASA N+2• Lean burning
• 75% margin to CAEP/6 NOx
Increased mixer airImproved pilot and main mixers
CMC liners (reduced cooling)Active dynamics control
Advanced ignition
NOx
Low-NOx Combustor Evolution
Improved pilot and main mixersScaled to smaller geometry
Evaluate simplified fuel nozzle design


Open Rotor Designs for Low Noise and High Efficiency Technology maturation in partnership with NASA and the FAA
GE Aviation: S. Arif Khalid Andy Breeze-Stringfellow David P. Lurie Trevor Goerig John P. Wojno
GE Global Research:
Trevor H. Wood Kishore Ramakrishnan Umesh Paliath
November 8, 2012
NASA Glenn 8x6 High Speed Wind Tunnel (HSWT)
NASA Glenn 9x15 Low Speed Wind Tunnel (LSWT)

2 Open Rotor Designs for Low Noise and High Efficiency
November 8, 2012
Technology maturation program
Collaboration: • GE: designs, acoustic predictions, test planning/execution
• NASA: rig fabrication, facilities, data acquisition, personnel
• FAA: feedback, reviews, sponsorship
Goals: • 26% fuel burn reduction relative to CFM56-7B powered
narrow body aircraft
• 15-17 EPNdB cumulative margin to Chapter 4

3 Open Rotor Designs for Low Noise and High Efficiency
November 8, 2012
Program chronology
Gen1 design
LSWT Gen1
Gen2 design
HSWT LSWT Gen2
2007-2009 GE IR&D
2009-2010 CLEEN
NASA T.O. 23
2010-2011 CLEEN
2011 CLEEN
NASA ERA
2011-2012 CLEEN
NASA ERA
• Historical background & CFD/CAA Gen1 design guidance
• Acoustic results from 9x15 Low Speed Wind Tunnel (LSWT) for
Gen1 Gen2 design guidance
Phase 1 Phase 2

4 Open Rotor Designs for Low Noise and High Efficiency
November 8, 2012
Computational aero-acoustics (CAA) Prediction process
OR Analyses Demonstrated Effective Low-Noise Design Guidance
Multi-step Acoustic Prediction Process Wakes/Gusts Unsteady R2 Surface Pressure Radiated Acoustics
CFD CAA
5 Open Rotor Designs for Low Noise and High Efficiency
November 8, 2012
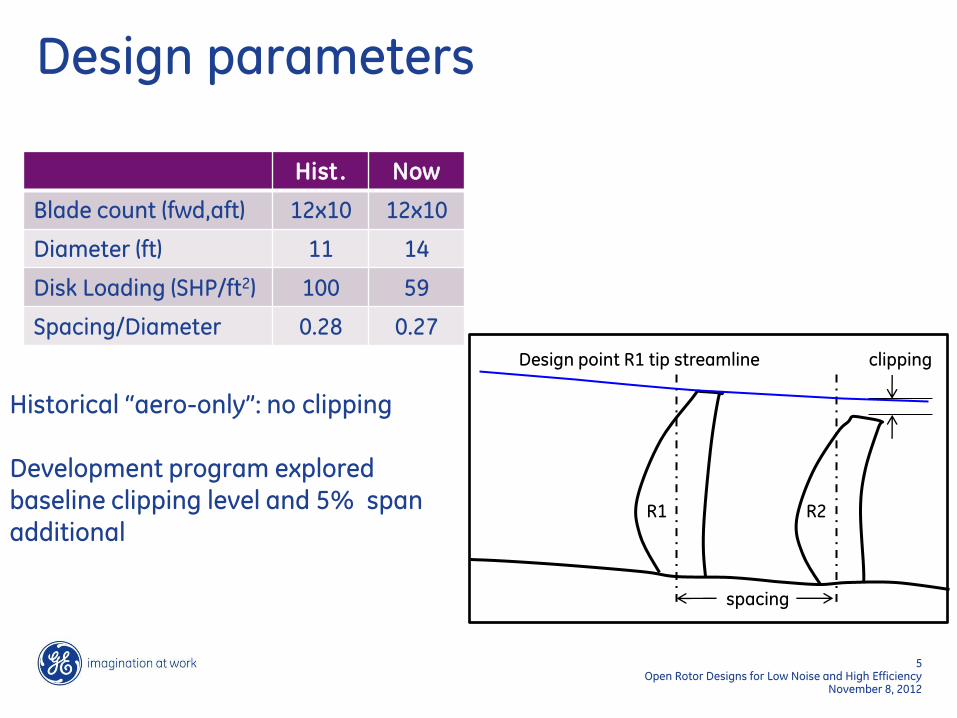
Design parameters
Hist . Now
Blade count (fwd,aft) 12x10 12x10
Diameter (ft) 11 14
Disk Loading (SHP/ft2) 100 59
Spacing/Diameter 0.28 0.27
Historical “aero-only”: no clipping Development program explored baseline clipping level and 5% span additional
clipping
R1 R2
Design point R1 tip streamline
spacing

6 Open Rotor Designs for Low Noise and High Efficiency
November 8, 2012
Tip speed/pitch setting
• Pitch setting can be expressed as tip speed (Ut) for target SHP or thrust and torque ratio
• Designated pitch settings by cycle point and Ut (low, medium,
or high) • Varied pitch/Ut for both high flight speed efficiency and low
flight speed acoustics, regardless of “design” Ut
Mach 0.78 Mach 0.78

7 Open Rotor Designs for Low Noise and High Efficiency
November 8, 2012
Designs
Historical Aero-only design from 1980’s UDF®
Gen1A Lower disk loading & aero-acoustic features
Gen1A+B Additional “+B” technology applied to Gen1A
Gen1C Alternative design to Gen1A
Gen2A All-new design based on lessons from LSWT and additional analysis
Gen2A+B Analytically applied effects of “+B” technology to Gen2A results – Presented in final technology status

8 Open Rotor Designs for Low Noise and High Efficiency
November 8, 2012
Results: tip vortex control
aero-only aero-acoustic
LE vortex
tip vortex
Aero-acoustic R1 design incorporated in Gen1 & 2 reduces tip vortex with estimated less than 0.5 pt efficiency penalty

9 Open Rotor Designs for Low Noise and High Efficiency
November 8, 2012
Results: acoustic trends and validation
Summed interaction tones for R1-R2 1st R1 passing frequency
Subtract first configuration level from both prediction and data
CAA captured experimental trend
Historical to Gen1A Gen1A to Gen1C Baseline to +5% Span

10 Open Rotor Designs for Low Noise and High Efficiency
November 8, 2012
Performance
(Effective Thrust) (Flight Speed) Shaft Power
Overall Propeller Net Efficiency
Accounts for: • profile & shock losses • induced losses: axial velocity, wakes, tip vortices • swirl
=
0
50
100
150
50 100 150 200 250 300 350
Fhubs
Fnacelle
ΔFhubs (blades-on – blades-off) – ΔFnacelle (blades-on – blades-off)
Effective Thrust

11 Open Rotor Designs for Low Noise and High Efficiency
November 8, 2012
Operating Conditions for Assessments
Max Climb Takeoff
Altitude (ft) 35,000 0
Atmosphere ISA+18°F ISA+27°F
Flight Mach 0.78 0.25
Net thrust 4,842 24,003
SHP 7,946 18,509
ηnet 0.860 0.675
Approach Sideline Cutback
Altitude (ft) 389.79 979.21 2038.17
MGTOW (lbs) 140,796 151,135 151,080
TAS (kts) 136.71 177.40 180.23
Net Thrust 11,555 36,170 22,543
Cycle points for 26% fuel burn reduction
relative to CFM56-7B (GE internal fuel burn analysis) -B737-800W, 162 seat - 800 nm mission - engine weight & drag
Acoustic trajectory for NASA V2 modern open rotor aircraft (GE/NASA RTAPS collaboration) - Methodology similar to Guynn,
Berton, Hendricks, Tong, Heller, & Thurman, 2011

12 Open Rotor Designs for Low Noise and High Efficiency
November 8, 2012
Performance Results Pitch angle/tip speed
• Reducing Gen1 design point Ut (increasing pitch) 2.7 point efficiency improvement over Ut examined in net efficiency
• Historical insensitive pitch at design point
0.70
0.72
0.74
0.76
0.78
0.80
0.82
0.84
0.86
0.88
0.90
0.00 0.02 0.04 0.06 0.08 0.10 0.12 0.14 0.16
ETA
EFT
PQAQJ3
DesignPower
MC/H
MC/M
MC/L
Rig
Ne
t E
ffic
ien
cy
Power / r0 V03 A
0.70
0.72
0.74
0.76
0.78
0.80
0.82
0.84
0.86
0.88
0.90
0.04 0.06 0.08 0.10 0.12 0.14 0.16 0.18 0.20
ETA
EFT
PQAQJ3
CurrentDesignPower
Rig
Ne
t E
ffic
ien
cy
Power / r0 V03 A
HistoricalDesignPower
Hist MC/M
Hist MC/L
Gen1A+B MC/MGen1A+B, MC/L
Mach 0.78 Mach 0.78

13 Open Rotor Designs for Low Noise and High Efficiency
November 8, 2012
Performance Results Clipping and spacing
• 5% additional clipping 1.2 point efficiency penalty at design power
• Performance insensitive over spacing/diameter 0.28 – 0.31
0.70
0.72
0.74
0.76
0.78
0.80
0.82
0.84
0.86
0.88
0.90
0.00 0.02 0.04 0.06 0.08 0.10 0.12 0.14 0.16
ETA
EFT
PQAQJ3
DesignPower
Base clip
+5% clip
Rig
Ne
t E
ffic
ien
cy
Power / r0 V03 A
0.70
0.72
0.74
0.76
0.78
0.80
0.82
0.84
0.86
0.88
0.90
0.04 0.06 0.08 0.10 0.12 0.14 0.16 0.18 0.20
ETA
EFT
PQA/J^3
DesignPower
Rig
Ne
t E
ffic
ien
cy
Power / r0 V03 A
7.84 in spacing
7.22 in spacing
Mach 0.78 Mach 0.78

14 Open Rotor Designs for Low Noise and High Efficiency
November 8, 2012
Performance Results “+B” technology
“+B” technology penalty varies with pitch setting:
• ½ to 1 pt for medium Ut pitch,
• no penalty at low Ut pitch
0.70
0.72
0.74
0.76
0.78
0.80
0.82
0.84
0.86
0.88
0.90
0.00 0.02 0.04 0.06 0.08 0.10 0.12 0.14 0.16
ETA
EFT
PQA/J^3
Gen1A, base clip
Gen1A+B, base clip
Gen1A, +5% clipGen1A+B, +5% clip
Rig
Ne
t E
ffic
ien
cy
Power / r0 V03 A
0.70
0.72
0.74
0.76
0.78
0.80
0.82
0.84
0.86
0.88
0.90
0.00 0.02 0.04 0.06 0.08 0.10 0.12 0.14 0.16
ETA
EFT
PQA/J^3
Gen1A
Gen1A+B
Rig
Ne
t E
ffic
ien
cy
Power / r0 V03 A
Mach 0.73 Mach 0.73

15 Open Rotor Designs for Low Noise and High Efficiency
November 8, 2012
Performance Results Gen2 and Mach number trend
Design point net efficiency: Gen2A > Gen1A+B
Gen1A+B net efficiency fairly constant up to Mach 0.8
0.70
0.72
0.74
0.76
0.78
0.80
0.82
0.84
0.86
0.88
0.90
0.00 0.02 0.04 0.06 0.08 0.10 0.12 0.14 0.16
ETA
EFT
PQAQJ3
Gen1A+B, MC/H
Gen1A+B, MC/M
Gen1A+B, MC/LGen2A
Gen2A projected
DesignPower
Rig
Ne
t E
ffic
ien
cy
Power / r0 V03 A
0.70
0.72
0.74
0.76
0.78
0.80
0.82
0.84
0.86
0.88
0.90
0.72 0.74 0.76 0.78 0.80 0.82 0.84 0.86
Full
Sca
le N
et
Effi
cie
ncy
Cruise Mach Number
Fu
ll S
ca
le N
et
Eff
icie
nc
y
Flight Mach Number
Cruise
Max Climb
Mach 0.78 Gen1A+B
Adjusted rig efficiency by +0.8 pt for full scale Re No.
Demonstrated efficiency benefits through Mach 0.8 no need to fly slow

16 Open Rotor Designs for Low Noise and High Efficiency
November 8, 2012
Open Rotor Technology Progress
0.79
0.80
0.81
0.82
0.83
0.84
0.85
0.86
0.87
Historical Aero
GE36 Product (1989)
Gen1A+B +5% Clip, MC-L
Gen2A+B
Full
Sca
le M
ax C
lim
b N
et
Effi
cie
ncy
Goal for 26% fuel burn benefit rel. to CFM56-7B
-10
-5
0
5
10
15
20
Historical Aero
GE36 Product (1989)
Gen1A+B +5% Clip, MC-L
Gen2A+B
Cu
m M
argi
n R
e: C
h4
(EP
Nd
B)
Goal: 15-17 EPNdB
Historical Aero-only
GE36 (1989)
Gen1A+B +5% clip, MC/L
Gen2A+B Historical Aero-only
GE36 (1989)
Gen1A+B +5% clip, TO/M
Gen2A+B*
• Adjusted rig efficiency by +0.8 pt for full scale Re No. • Assessments incl. measured effects of AoA & pylon blowing • Pitch and pylon blowing not necessarily optimized
• Gen2A+B* = measured Gen2A + assessment of “+B” tech (based on measured Gen1A+B vs. Gen1A)
• 1980’s designs were marginally satisfactory for either performance or acoustics • Demonstrated technology essentially meets CLEEN open rotor goals

17 Open Rotor Designs for Low Noise and High Efficiency
November 8, 2012
Conclusions Successful GE/NASA/FAA partnership
• Achieved performance and acoustic goals for future narrow body aircraft
Open rotor technology contributions
• Validated prediction of acoustic trends
− disk loading, design changes, clipping
• Quantified performance effects − clipping, operational pitch/tip speed, and
“+B” interaction noise reduction technology
• Good efficiency through Mach 0.8
Identified additional optimization opportunities with demonstrated technology
0
2
4
6
8
10
12
14
16
0 5 10 15 20 25 30 35
% Fuel Burn Benefit
CU
M M
argi
n, r
e:
CH
4 (
EP
Nd
B)
GE36 Product - 1989
(1 EPNdB, 15% FB)CFM56-7B
Program Goal
(15-17 ENBdB, 26% FB)Gen2A+B
Gen1A+B
Open Rotor Quieter than what’s flying today
No need to fly slow

3. Systems Integration
©GE Aviation Systems LLC, 2012

2GE – Aviation
5/12/2011 P. M. Niskode
Overview
Energy, Emissions & Noise Reduction Objectives
• FMS Efficiency improvements
– Dynamic Quiet Climb
– FMS Wind Input Optimization
• FMS/ATM Integration
– Trajectory Synchronization
– Trajectory Optimization Tasks
• FMS/Engine Integration
– Adaptive Engine Control
– Integrated Vehicle Health Management
– Integrated Flight-Propulsion Control
©GE Aviation Systems LLC, 2012

3GE – Aviation
5/12/2011 P. M. Niskode
2010
GE Aviation Proprietary
CLEEN - Systems Top Level Schedule 10/26/12Rev 04 -04
Contract Year 4
2011 2012 2013 2014 2015
Contract Year 2
JJ A S O N D J F M A M J J A S O N D J F M A M J J A S O N D J F M A M J J A S O N D J F M A M J J A S O N D J F M A M
Contract Year 1 Contract Year 3 Contract Year 5
J
Today
FM
S/A
TM
Inte
gra
tio
n FMS/ATM Integration
Dyn
am
ic Q
uie
t
Cli
mb
Design
Quantification of Results
FM
S W
ind
Inp
ut
Op
tim
izati
on Design
Software Development
Quantification of Results
Software Development
FM
S/E
ng
ine
Inte
gra
tio
n FMS/Engine Integration
©GE Aviation Systems LLC, 2012
4GE – Aviation
5/12/2011 P. M. Niskode
FMS efficiency improvements
Dynamic Quiet Climb• What: Improved noise abatement takeoff trajectory• Why: Tailored thrust profile reduces fuel burn• Status: Complete
FMS Wind Input Optimization• What: Wind selection tailored to trajectory• Why: Reduce thrust and speed brake use in descent, and
improve 4D trajectory prediction in all flight phases• Status: Complete
©GE Aviation Systems LLC, 2012

5GE – Aviation
5/12/2011 P. M. Niskode
Dynamic Quiet Climb
Noise Abatement Area
Max Noise Abatement Altitude
Noise Abatement StartLocation
Noise AbatementEnd Location
Light GW
Heavy GW
Min Noise Abatement Altitude
• Adds location based cutback/restore considerations to current altitude only based procedures
• Improved trajectory predictions accuracy to determine where aircraft will cross the noise restricted volume
• Thrust and configuration changes only where needed
©GE Aviation Systems LLC, 2012
6GE – Aviation
5/12/2011 P. M. Niskode
Dynamic Quiet Climb
Simulation Based Benefits Analysis – B737, John Wayne Airport:
– Average fuel savings per flight using Dynamic Quiet Climb over current altitude based noise procedures:
– 150,000 lbs Gross Weight – 42 lbs/flight
– 90,000 lbs Gross Weight – 37 lbs/flight
– AEDT Calculated Noise at Microphones – All microphones recorded noise well under daytime limits, and very near values for altitude based procedure
©GE Aviation Systems LLC, 2012

7GE – Aviation
5/12/2011 P. M. Niskode
FMS Wind Input Optimization
Trajectory based wind selection• Minimize extra fuel burn required to maintain
vertical path in presence of wind errors• Minimize use of speed brakes due to excess energy• Improved predictions accuracy
Weather Data
Trajectory
Wind Input Optimization Tool
©GE Aviation Systems LLC, 2012

8GE – Aviation
5/12/2011 P. M. Niskode
FWIO System overview
Wx
Aircraft Traj
Optimization
4D Trajectory Generator
Select wind and temperature data that minimize user-
tunable cost function for the unique aircraft trajectory
Provide wind & temp data for uplink to
FMC
Certified weather data provider
©GE Aviation Systems LLC, 2012
9GE – Aviation
5/12/2011 P. M. Niskode
FMS Wind Input OptimizationSimulation Based Benefits Analysis – B737:
– Simulation based benefits analysis suggests that ~20 lbs fuel per flight can be saved due to reduction in corrective maneuvers in descent due to inaccuracies in wind inputs
– $1.3 million annual savings in fuel for a 100 aircraft fleet*
– Tailoring winds for climb and cruise result in 2 to 5x increase in preflight predictions accuracy
*Assumes 4 stages per day, $3/gallon of fuel
©GE Aviation Systems LLC, 2012

10GE – Aviation
5/12/2011 P. M. Niskode
FMS/ATM Integration
En-Route Automation Modernization (ERAM)
ATM
ATC constraints, wind/weather
Conflict Probe
Metering Tools
Trajectory Predictors
FMS
TrajectoryPredictors
Aircraft data,Business optimum trajectory
Trajectory Sync:
- What data to exchange
- When to exchange it
- Improve aircraft predictability
Trajectory Optimization:
- Negotiate new trajectories that
consider user preferences
- Negotiate RTAs to enable optimized
profile descent and reduced controller
workload
Time Based Flow Management (TBFM)
©GE Aviation Systems LLC, 2012

11GE – Aviation
5/12/2011 P. M. Niskode
Trajectory Synchronization
Sync
Phase 1A• Core simulation environment with
integration and communication between aircraft and ERAM
• Incorporate fast-time trajectory predictor for primary aircraft
• Single aircraft position tracking throughout flight
• CPDLC / ADS-C EPP Implementation (Trajectory Downlink continuation)
Phase 1B• Expanded CPDLC / ADS-C
messages• Incorporate simulated FMS (sFMS)
for primary aircraft• Incorporate multiple aircraft
capability using FPPD• Expanded interface to ERAM• Real-world environmental benefits
In collaboration with Lockheed Martin and Embry-Riddle Aeronautical University©GE Aviation Systems LLC, 2012

GE Aviation
FAA CLEEN
Fuel-Burn Reduction (Engine-FMS Integration)
©GE Aviation Systems LLC, 2012

13GE – Aviation
5/12/2011 P. M. Niskode
Fuel Burn Reduction Using FMS-Engine Integration
Engine - FMS Integration Offers Greater Opportunities for Environmental and Operational Benefits
• State-awareness is key aspect of technologies
Three primary focus areas of aircraft-engine integration:
• Adaptive Engine Control, FMS for computation and communication with aircraft and ground systems
• Integrated Vehicle Health Management (IVHM), uses knowledge of engine health
• Integrated Flight-Propulsion Control, synergistic optimization of engine and aircraft
Fuel-burn reduction estimated to be approximately 2%
• Thirteen technologies to be evaluated and matured to TRL6
©GE Aviation Systems LLC, 2012

14GE – Aviation
5/12/2011 P. M. Niskode©GE Aviation Systems LLC, 2012