Embed Size (px)
Citation preview

f/.; N95- 33273
IMS R&D PROGRAM AT CANADA CUSTOMS.
Pierre Pilon, Tony Mungham, Lay-Keow Ng, Andr6 Lawrence.
Revenue Canada, Customs Excise and Taxation,
Laboratory and Scientific Services Directorate,
Research and Development Division,79 Bentley Avenue, Ottawa, Ontario, Canada, K1A 0L5
ABSTRACT
Over the last few years, Revenue Canada, in collaboration with Barringer Instruments Limited,
has been involved in the development of a field-usable ion mobility spectrometer (IMS) for the
detection of drugs of abuse. This work has culminated in the manufacturing and
commercialization by Barringer of the Ionscan 350 instruments, now in use by various lawenforcement agencies worldwide.
Although IMS exhibits a very strong and distinctive response toward some nitrogen containingdrugs, e.g., cocaine, like all separation techniques it has inherent limitations, namely moderate
resolution and low chemical signal to noise ratio which may affect the reliability of IMS-baseddrug detectors. A programme is in place at the Laboratory and Scientific Services Directorate
(LSSD) to investigate the applicability of various digital signal processing (DSP) techniques to
IMS output signals. The application of neural network techniques to overlapping IMS peaks ispresented.
INTRODUC_ON
The Research and Development Division of the Laboratory and Scientific Services Directorate
(LSSD) of Revenue Canada, Customs, Excise and Taxation, has a mandate to perform thefollowing tasks:
identify and develop technology and instrumentation for the detection of drugs to be usedby Customs officers at points of entry into Canada; and
develop new methods for the Customs Laboratory and the Excise Laboratory.
The work described in this paper gives a brief review of the work performed at LSSD on thedevelopment of a drug detection system based on IMS, outlines possible applications of IMS for
the Customs or Excise Laboratories, describes modifications performed on the drug detector forother applications and gives details on digital signal processing which may be useful in all
applications of ion mobility spectrometry.
Drug Detection
Between 1983 and 1991, LSSD was involved in the development and testing of the IONSCAN
series of instruments for the detection of cocaine and heroin in Customs scenarios, in conjunctionwith Barringer Research Limited (BRL) 17. In 1993 and 1994, Revenue Canada purchased four
IONSCAN instruments from BRL, one used for on-going testing in the laboratory and three for
field implementation. Two of the field instruments are presently in use at airports in Toronto and
79
https://ntrs.nasa.gov/search.jsp?R=19950026852 2020-04-28T03:13:45+00:00Z

Montreal;thesehavebeen instrumental in a number of drug seizures.
Customs, Excise Applications
The Customs Laboratory of Revenue Canada is responsible for the analysis of imported goods intoCanada for tariff classification while the Excise Laboratory is involved in the analysis of alcohol
and tobacco products for the determination of excise tax. The R&D Division has worked in
conjunction with these laboratories to develop methods using ion mobility spectrometry. The
samples chosen for analysis by IMS met at least one of the following requirements:
the sample consists of an analyte of interest present in a well known matrix which is
relatively inert to the IMS detector;,
the existing method of analysis for the sample involves a long preparation step; and
no satisfactory analytical techniques are available at our laboratory.
Some preliminary work on a BRL lonscan 250 instrument has indicated that IMS can be used forthe determination of the presence of additives in polymers, and the presence of cocaine and/or
heroin in drug seizures. In addition, IMS can be used to analyze bitrex in denatured alcohol.
RESULTS AND DISCUSSION
Modifications to Ionscan 250.
The lonscan 250 has been developed for the sampling and analysis of solid samples collected in
the field. The instrument uses pumped, purified room air for the drift and carrier gas. An exhaust
pump evacuates the drift and carder gas to avoid the creation of a vacuum or pressurization insidethe drift tube. The software of the Ionscan 250 gives an indication of the presence of a substance
of interest by monitoring a number of windows across the spectrum. In order to use the BRLlonscan 250 instrument for laboratory applications, a number of modifications were required.
These modifications were performed in conjunction with BRL.
The modified instrument uses zero air from a cylinder and does not require pumps for the drift
or carder gas. The exhaust pump from the lonscan 250 is still used. Zero air is also used as a
make-up gas.
For a more reproducible introduction of samples as solutions, the inlet of the Ionscan 250 wasmodified, as shown in Figure 1. When no sample tube is inserted into the inlet, a make-up gasis introduced into the IMS; the rate is adjusted so that 15 to 20 cm3/min of gas come out of the
inlet, thus not allowing unpurified room air to enter the drift tube. The sample is injected into
the glass wool of a glass sample tube, and the tube is brought into the inlet of the instrument,
close to the repeller grid of the drift tube to ensure good transfer of the sample to the reactant
region. The carder gas is set at 200 cm3/min and is pumped out of the drift tube, along with the
drift gas, set at 300 cm3/min, by the exhaust pump. The make-up gas is flushed out of the frontend of the inlet since no tight seal is made between the sample tube and the inlet. The BRL
temperature controls were used for the new inlet.
A data acquisition system was developed to increase the flexibility of the instrument. The
software has a variable acquisition rate (20 to 125 KHz), allows for a maximum of 512 data point
80

perscan,hasa30msecgate firing, a 4 msec delay time for data processing, hand shaking and
data transfer. It has the capability of storing individual raw scans and displaying 128 individual
traces. 4 megabytes of memory are available for data storage. Figure 2 shows a partial displayof 16 traces, chosen from the full display to investigate certain features in the spectrum. From
the partial display, single traces can be plotted, where the drift time and amplitude informationcan be obtained.
Signal Processing
The output signal of the spectrometer is made up peaks embedded in noise, each peak indicating
the presence of a specific component in a mixture. Previous analyses of experimental data 8 haveshown the following:
the peak shapes of IMS signals are Gaussian; and
the noise is band limited, shows no clear repetitive pattern and is Gaussian.
From this information, an IMS signal simulator was developed to artificially generate IMS-like
signals with any desired peak parameters (amplitude and standard deviation (o)), peak separation
and signal to noise ratio (SNR) B. The simulated signals were subsequently used to test thedetection limits and the selectivity of peak detection algorithms. The detection limit of an
algorithm is measured by determining how well a low signal can be detected in the presence of
noise, without false detection. The selectivity is determined by the minimum peak separation that
can be correctly detected by the algorithm. The resolution is a function of the peak separation,the standard deviation of the peak, the relative amplitude and the SNR. A number of packageshave been tested previouslyS'9; the results obtained are summarized below. Finally, recent resultsobtained with neural networks are described.
Derivative Methods
This involves the differentiation of the IMS signal. Any slight variation in the slope of theoriginal signal due to overlapping peaks can be detected using this technique. However, because
of this capability to recognize slight variations, this method is susceptible to noise. It musttherefore be preceded by precise filtering to remove out of band noise. The results obtained onsimulated signals are the following:
in a high signal to noise environment, with a 1:1 signal ratio, a differentiation of peaks
separated by 1.7 a can be achieved using double differentiation;
with an amplitude ratio of 6:1, the minimum separation must be 2.2 c;
single peaks can be detected at 18 dB SNR;
single peaks could be detected at lower SNR at the expense of selectivity; and
the detection of multiple peaks can be achieved at lower separation by using higher order
differentiation (1.4 a using 6th order differentiation, 1.25 o using 10th order
differentiation), at the expense of high false detection probabilities.
81

Cross-Correlagon Method
This method involves cross-correlating two vectors of length n (an LMS signal and a Gaussian
curve) for relative shifts of -n up to +n. When the two vectors are normalized, the cross-correlation function is a maximum when the two signals are identical and is zero when the two
vectors are uncorrelated. This method is very efficient for the detection of single peaks in low
SNR environments and may therefore improve the detection limit of an IMS system. The method
has a negative impact on selectivity since it is a perfect filter, blocking all other noises, including
irregularities due to the presence of other peaks.
Curve Fitting Methods
In this method, the signal is resolved into distinct bands which are fitted to an n-order polynomial
using least squares. The polynomial coefficients are then used to estimate the parameters of the
peak. In IMS, a quadratic equation can be used since the peaks are Gaussian. This kind of
algorithm is very accurate at estimating the position of a peak.
Hopfleld Neural Network
An IMS signal can be thought of in terms of the following equation:
r(t) = x(t) + z(t)
where x(t) is the signal of interest, assumed to be made up of Gaussian pulses and z(t) is a noise
term. The Gaussian pulses can be represented by:
g(t;1,k,m)= a_exp -t-__._2am 2
{at} is a set of discrete amplitudes
{ck} is a set of discrete centers{t_,} is a set of standard deviations
x(t) can then be represented by
x(t) = Z E :E A_,_ g(t;1,k,m)
where A_ is 1 if g(t;1,k,m) is present in the signal and Arm is 0 otherwise.
Our objective is to obtain the values of {A_} from the noisy signal. This is a set of cross-
coupled equations for which it is hard to obtain analytical solutions. Thus, it was decided to usea neural network approach to find the solution iteratively.
This problem can be thought of as a multi-input multi-output process where the input is the N-
dimensional recorded signal and the output is a binary vector. The system structure is very similarto a well known neural network structure called the Hopfield net. The network consists of a
single layer of Q neurons. Each neuron adds up all its inputs and compares the sum to a thresholdvalue. If the sum > threshold, the output of the neuron is 1, if the sum < threshold, the output
is 0.
82

Each neuron output is fed back to the inputs of all neurons except its own. Feedback connectionsare called weights. The neuron also receives signals from an extemal source. The weights are
determined by minimizing an artificial energy function which is a measure of how far the value
of the output vector is from an acceptable solution. The setup of the Hopfield Network is shown
in Figure 3.
In order to test the network's sensitivity to noise and its resolving power, simulation studies were
performed using an input vector consisting of 1024 points, made up of Gaussian pulses with
different amplitudes, centers and sigma, with different SNR. Signals collected on the modifiedIonscan unit described above were 'also used as input into the network. The vector (simulated
signal or actual IMS spectra) was fed into the neural network and compared to a set of 12 basisfunctions, Gaussian functions with varying distances between two consecutive functions and
varying standard deviations (see Figure 4). The network calculates the error between the signaland the basis functions with different parameters and displays the best fit between the input and
the basis functions.
The system's sensitivity to noise was tested by creating one Gaussian pulse using the signalsimulator. The noise level of the signal was increased until the network failed to produce the
correct output. The minimum SNR was found to be -3dB, as shown in Figure 5. At this level,
the noise power is twice the signal power. Reducing SNR below this level resulted in multiple
peaks, as shown in Figure 6 for a blank sample introduced into the modified lonscan.
The network's resolving power was tested by analyzing two pulses which are synchronized to the
positions of their basis Gaussian pulses counterparts. These pulses were delayed by one standarddeviation. At equal amplitudes, two peaks were observed for a signal to noise ratio as low as 3
dB (Figure 7). The amplitude of one pulse was then reduced gradually until the network failed
to produce the correct output. The limit of amplitude ratio was approximately 0.6 with a signalto noise ratio down to 10 dB. The time separation between two peaks was then reduced. A time
resolution of 0.65 c could be obtained, at a SNR of 30 dB, as shown in Figure 8. Tests on
various combinations of delay and amplitude differences indicate _hat the limit is 0.65 t_ at an
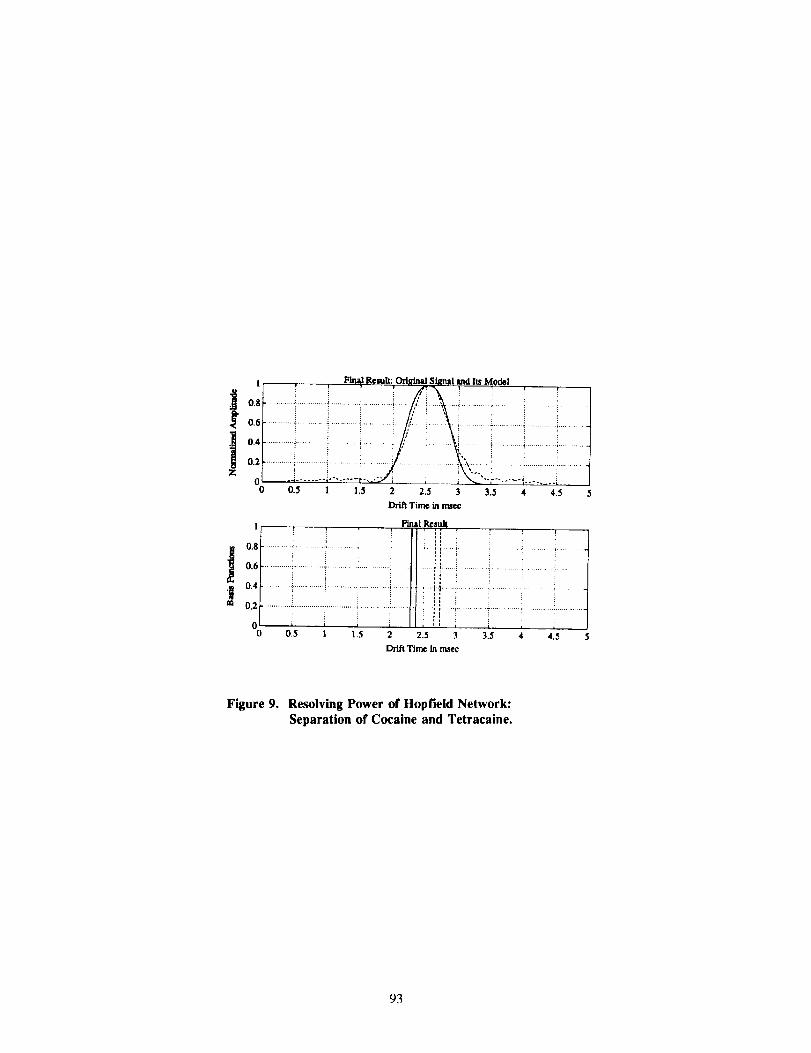
amplitude ratio of 0.8. An example of the output of the Hopfield Network for the separation ofcocaine and tetracaine, injected as a mixture in solution, is shown in Figure 9. These two
substances have amplitude maxima separated by approximately 0.65 o.
We are presently investigating the capabilities of the Hopfield Network in more details, along with
the possibility of using a combination of algorithms to lower the detection limits, and to help in
the peak location and peak resolution capabilities of ion mobility spectrometers.
ACKNOWLEDGMENT
The authors wish to thank Dr. Rafik Goubran of the Department of Systems and Computer
Engineering, Carleton University, Ottawa, for his contribution to the DSP studies.
83

REFERENCES
1. Barringer Research Limited. "A Feasibility Study for the Detection of Heroin and CocaineUsing Ion Mobility Spectrometry (IMS)." D.S.S. File No. 21ST.32032-4-0330M., June, 1985.
2. Barringer Research Limited. "Development of a Prototype Ion Mobility Spectrometer (IMS)
Pre-prototype Narcotic Detector Using Air Sampling and Trace Particulate Analysis Techniques."December, 1986.
3. Barringer Research Limited. "Development of the IMS Prototype Narcotics Detector"., D.S.S.25ST.32032-7-3271., August, 1988.
4. Barringer Research Limited. "Development of an Improved Portable Ion Mobility
Spectrometer Narcotics Detector." D.S.S. 038ST.32032-9-N174EX00PT01., January, 1990.
5. Chauhan, M., Hamois, J., Kov,'u', J., Pilon, P., Trace Analysis of Cocaine and Heroin in
Different Customs Scenarios Using a Custom-Built Ion Mobility Spectrometer. Can. Soc. Forens.Sci. J., 24, No. 1, 43-49 (1991).
6. Hamois, J., Kovar, J.0 Pilon, P., Detection of Cocaine and Heroin Using a Custom-Built IonMobility Spectrometer, Customs Laboratory Bulletin, 4, No. 1, 11-31 (1992).
7. Fytche, L.M., Hup6, M., Kovar, J.B., Pilon, P., Ion Mobility Spectrometry of Drugs of Abusein Customs Scenarios: Concentration and Temperature Study., Journal of Forensic Sciences, 37,No. 6, 1550-1566 (1992).
8. Goubran, R.A., Lawrence, A.H., Experimental Signal Analysis in Ion Mobility Spectrometry.,International Journal of Mass Spectrometry and Ion Processes, 104, 163-178 (1991).
9. Goubmn, R.A., Peak Detection of IMS Signals, NRC Contract No. 990-1266/1045, March,1991.
84

/S-,,_ple gae
V
Make up gas
Figure 1. Modified Ionscan Inlet.
85

Run Name: MDB300-2 Run Folder: TEST-DB
Run Date: sep/23/94
User ID:
42
, 0
3g38
37]6
36
3433
TIMING PARAMETERS
Start Time: 4 msec End Time: 19 nsec Gate Time: 30 msec
DATA PARAMETERS
Data Points: 512 Scans: 8 Traces; 128
Figure 2. Modified Data Acquisition System: Partial D_play
86

InputVectorR
INPUTFUNCTION
(2)
W(k2) : .............
i i i i
l i i i INPUTi_[ FUNCTION(Q)
W(kQ) i ............
Y(2)
I(Q)
Y(Q)
A(I)
A(2)
OutputVector
Figure 3. Setup of a Hopfield Network
87

0.5 1 1.5 2 2.5 3 3.5 4
Figure 4. Example of Basis Function
88

I.s
D
L
3
2
I
0
-1
-28
1
0,8
0.6
0.4
0.2
o8.S
! i
1 I.S
drift _lale lul miili-Ilecouldl
-Simllo Pulse° _M---.=-3dl! w .--
i
4 6 i
Fosltiom of dwtmctod pU|OOB
L_
2 2.S
L
lO 12
Figure 5. Hopfield Network Sensitivity to Noise: Simulated Signal
89

1
OL9
O.8
0.7
0.6
0.5
0.4
0.3
0.2
0.1
00
|
f ,J *i t
J_
F___/
0.5
"l
f
I
*i 1.5 2.5 3
Figure 6. Hopfield Network Result on Blank Signal from Ionscan Instrument
9O

i
o
4
3
Z
1
e
-1
-Z0
1
0.8
0.;-
0.4
0.2
00
| t a• .5 1 1 .S
drif_ tins in milli-second
-Tvo,lruloeu, SHill3 diD, AI,_2, Dolasf= u
i i i i2 4 £ 8 10
position of detected pulses
.5
12
Figure 7. Resolving Power of Hopfield Network:Equal Amplitudes, SNR = 3 dB
91

2i,uq
1.5
&• Ia
0,5
i •
-0 .Sa
1
0.8
0.6
0.4
0.2
08
OIS l!
flS Z
drift time in milli-smcoed
-tvo ru,lies, SlHItz38 dll, _1=_2, DelI_/=,65_
* * i iZ 4 6 8 10
poelilom of 4oiloil4 ruliol
Figure 8. Resolving Power of Hopfield Network:Time Resolution of 0.65 a
Z.S
12
92
X
Jl
l
0.6
0.4 . . .
0,2 ............................................................. , ........
I Final Rcsuk: OrlRlmd Sl__nl!and Its Model
i i i / :,................:................4...............i...........i......:...i...,_...._..............;..................
0.6
0.4 ...............i..............; I " i ,_ _ ..............i...............i...........
0.2...............i................_............i............_...................":_......!............_.............i...........
0 0.5 1 ] .5 2 2.5 3 3.5 4 4.5
Drift Time in maec
Ph ! g, sult! ;; ! ! !
..............J.............: .........!
_ i 'r .............i..............................................., , J : ,
0 0 5 1.5 2 2.5 3 3.5 4.5
Drift Time in msec
Figure 9. Resolving Power of Hopfieid Network:Separation of Cocaine and Tetracaine.
93