Embed Size (px)
Citation preview
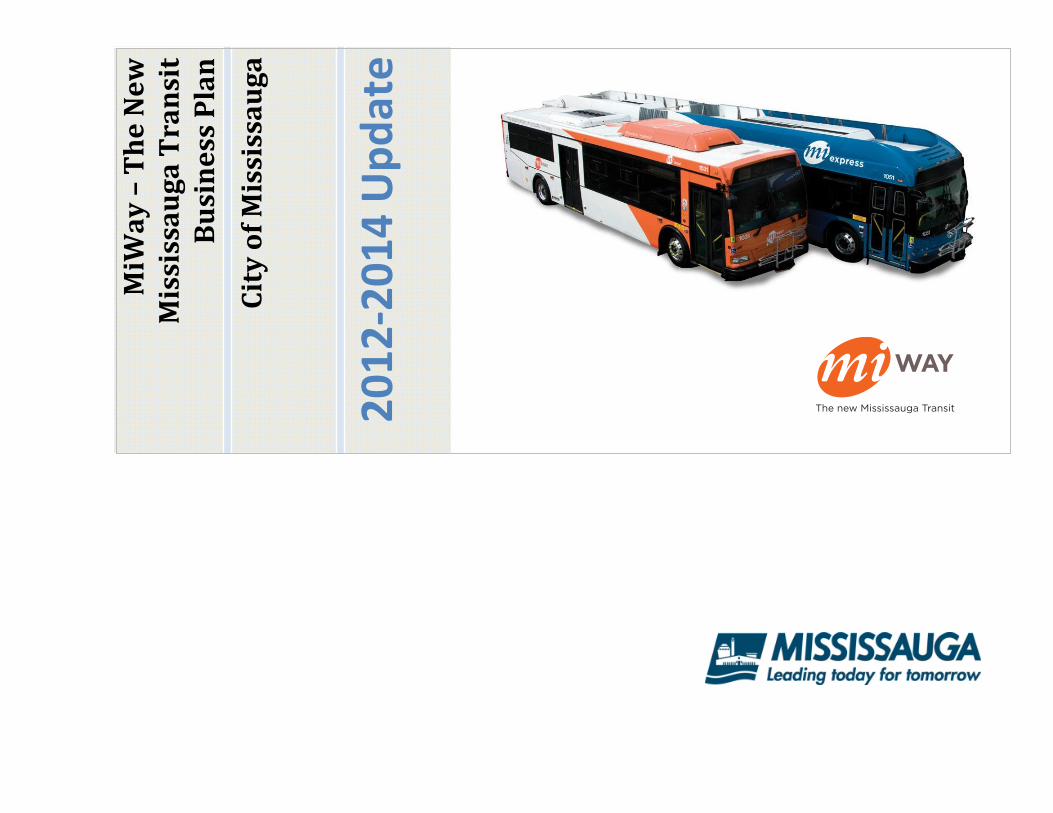
2012
‐2014 Upd
ate
MiWay–TheNew
MississaugaTransit
BusinessPlan
CityofM
ississauga
Last year the City of Mississauga undertook an extensive process to create a four year, 2011 through 2014, detailed Business Plan and Budget. Approved in March 2011, the 2011-2014 Business Plan and Budget outlines how and where the City plans to allocate resources to provide good value for taxpayers. Reviewed and updated annually, the four year plan is based on the City’s five strategic priorities. 2012 marks the second year of Mississauga’s four year Business Plan and Budget. For this “Update Year” staff have focused on primarily updating and presenting exceptions and amendments to the four year approved Service Area Business Plans, while still providing comprehensive financial information and forecasts. The following summary document sets out a brief description of the Service Area, what has changed since writing the 2011-2014 Business Plan and Budget and performance measurements. The complete 2011-2014 Business Plan and Budget can be found on the City’s website.
Business Plan 2012 Update F-1
Table of Contents
1 Existing Core Services ............................................................................................................................................ 2 1.1 Vision and Mission ................................................................................................................................................. 2 1.2 Service Delivery Model ........................................................................................................................................... 3 2 Updates & Accomplishments ................................................................................................................................. 4 2.1 Updates .................................................................................................................................................................. 4 2.2 Accomplishments ................................................................................................................................................... 8 2.3 Awards and Recognition ........................................................................................................................................ 8 3 Proposed Changes ................................................................................................................................................ 10 3.1 Proposed Budget Summary ................................................................................................................................. 10 3.2 Changes to Maintain Current Service Levels ....................................................................................................... 11 3.3 Proposed New Initiatives ...................................................................................................................................... 15 3.4 Capital Plan .......................................................................................................................................................... 17 3.5 Human Resources ................................................................................................................................................ 19 4 Performance Measures ......................................................................................................................................... 21 4.1 Balanced Scorecard ............................................................................................................................................. 21
F-2 Business Plan 2012 Update
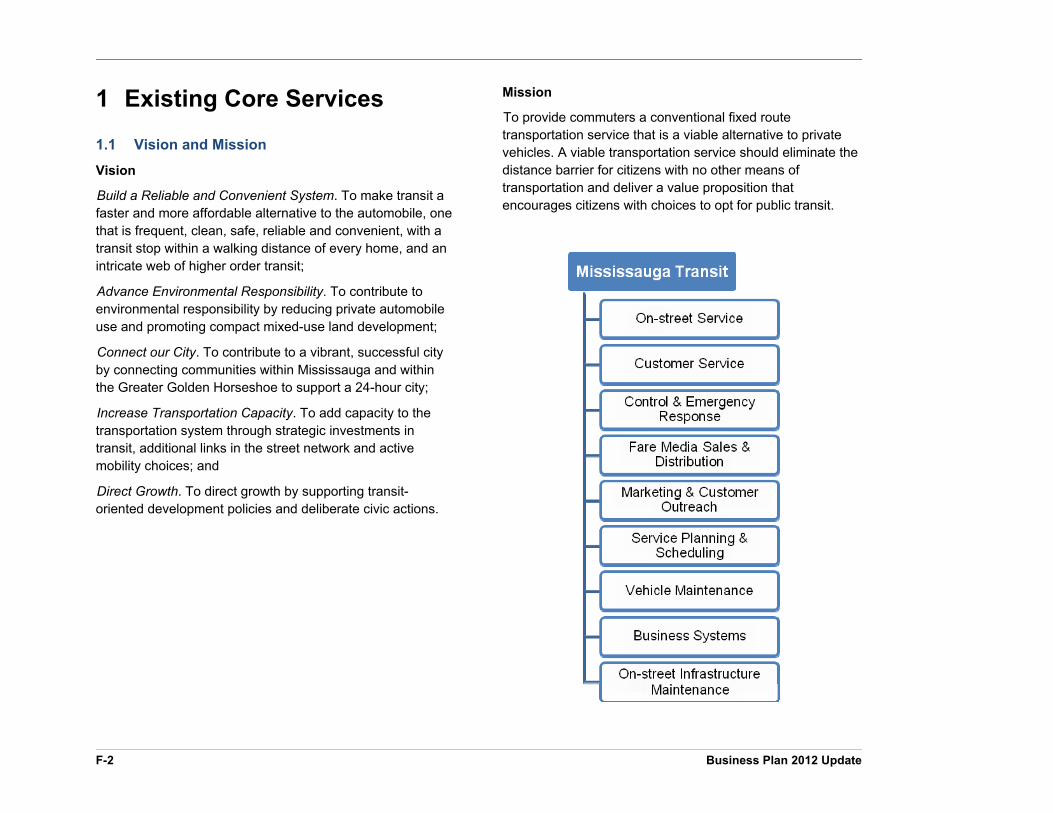
1 Existing Core Services
1.1 Vision and Mission
Vision
Build a Reliable and Convenient System. To make transit a faster and more affordable alternative to the automobile, one that is frequent, clean, safe, reliable and convenient, with a transit stop within a walking distance of every home, and an intricate web of higher order transit;
Advance Environmental Responsibility. To contribute to environmental responsibility by reducing private automobile use and promoting compact mixed-use land development;
Connect our City. To contribute to a vibrant, successful city by connecting communities within Mississauga and within the Greater Golden Horseshoe to support a 24-hour city;
Increase Transportation Capacity. To add capacity to the transportation system through strategic investments in transit, additional links in the street network and active mobility choices; and
Direct Growth. To direct growth by supporting transit-oriented development policies and deliberate civic actions.
Mission
To provide commuters a conventional fixed route transportation service that is a viable alternative to private vehicles. A viable transportation service should eliminate the distance barrier for citizens with no other means of transportation and deliver a value proposition that encourages citizens with choices to opt for public transit.
Business Plan 2012 Update F-3
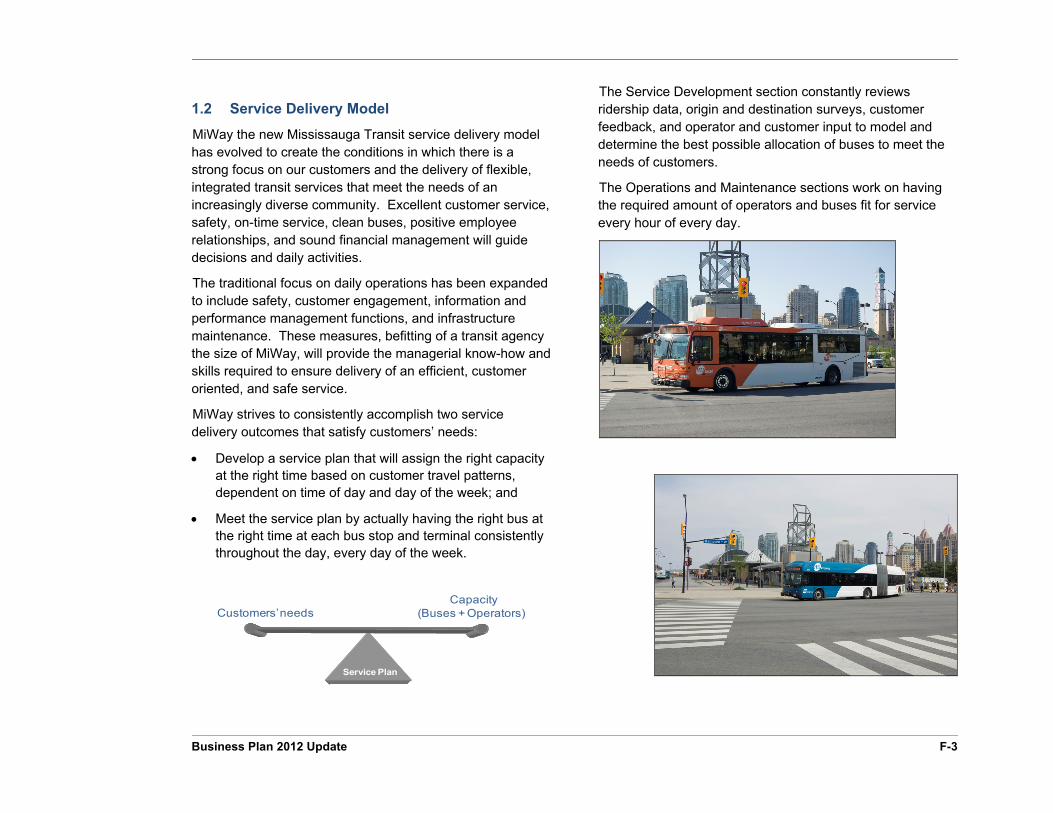
1.2 Service Delivery Model
MiWay the new Mississauga Transit service delivery model has evolved to create the conditions in which there is a strong focus on our customers and the delivery of flexible, integrated transit services that meet the needs of an increasingly diverse community. Excellent customer service, safety, on-time service, clean buses, positive employee relationships, and sound financial management will guide decisions and daily activities.
The traditional focus on daily operations has been expanded to include safety, customer engagement, information and performance management functions, and infrastructure maintenance. These measures, befitting of a transit agency the size of MiWay, will provide the managerial know-how and skills required to ensure delivery of an efficient, customer oriented, and safe service.
MiWay strives to consistently accomplish two service delivery outcomes that satisfy customers’ needs:
Develop a service plan that will assign the right capacity at the right time based on customer travel patterns, dependent on time of day and day of the week; and
Meet the service plan by actually having the right bus at the right time at each bus stop and terminal consistently throughout the day, every day of the week.
Customers’ needs
Balance
Capacity(Buses + Operators)
Service Plan
The Service Development section constantly reviews ridership data, origin and destination surveys, customer feedback, and operator and customer input to model and determine the best possible allocation of buses to meet the needs of customers.
The Operations and Maintenance sections work on having the required amount of operators and buses fit for service every hour of every day.
F-4 Business Plan 2012 Update
This section includes Major Initiatives and Activities that have changed or have been updated since the approval of the 2011-2014 Business Plan & Budget. Updates and accomplishments are listed by Initiative below. Detailed descriptions of these initiatives can be found in the approved Business Plans on the City’s website.
2 Updates & Accomplishments
2.1 Updates
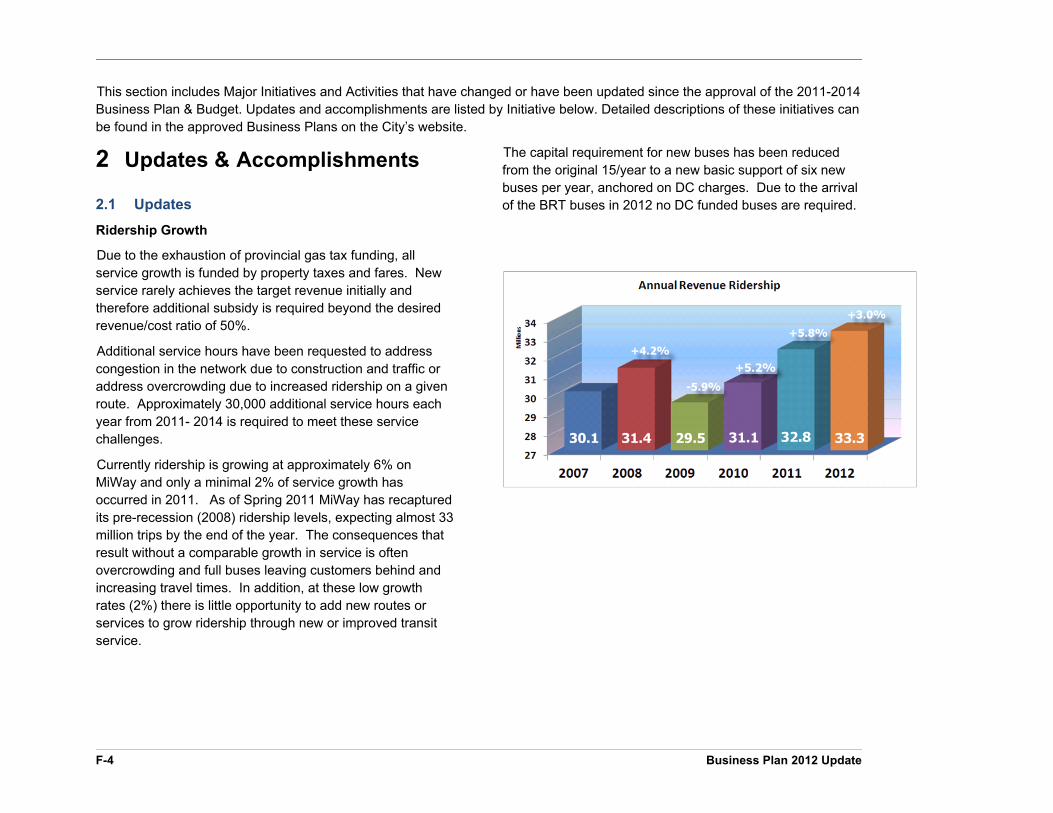
Ridership Growth
Due to the exhaustion of provincial gas tax funding, all service growth is funded by property taxes and fares. New service rarely achieves the target revenue initially and therefore additional subsidy is required beyond the desired revenue/cost ratio of 50%.
Additional service hours have been requested to address congestion in the network due to construction and traffic or address overcrowding due to increased ridership on a given route. Approximately 30,000 additional service hours each year from 2011- 2014 is required to meet these service challenges.
Currently ridership is growing at approximately 6% on MiWay and only a minimal 2% of service growth has occurred in 2011. As of Spring 2011 MiWay has recaptured its pre-recession (2008) ridership levels, expecting almost 33 million trips by the end of the year. The consequences that result without a comparable growth in service is often overcrowding and full buses leaving customers behind and increasing travel times. In addition, at these low growth rates (2%) there is little opportunity to add new routes or services to grow ridership through new or improved transit service.
The capital requirement for new buses has been reduced from the original 15/year to a new basic support of six new buses per year, anchored on DC charges. Due to the arrival of the BRT buses in 2012 no DC funded buses are required.
Business Plan 2012 Update F-5
Hurontario/Main Street Study
In partnership with the City of Brampton, this project will initiate the transformation of Hurontario Street into a 21st Century Main Street with an integrated higher-order system supported by appropriate land use and built form framework.
Building upon the completion of the Hurontario-Main Street Corridor Master Plan (October 2010) and the Metrolinx Benefits Case Assessment (BCA), the next phase involves undertaking the preliminary design for LRT and completing the Environmental Assessment (EA) through the Transit Project Assessment Process (TPAP). Although the TPAP process is shorter than the traditional EA, this requires substantial design work to be completed prior to commencing the 6 month review process. Additional studies will be required on specific issues such as noise, vibration, assessing the various road/transit related alternatives surrounding the Highway 403 interchange crossings, etc.
The consulting assignment for this phase was awarded in late 2011 with a tentative completion anticipated for late 2013.
Marketing Plan
The new MiWay brand represents a customer-focused approach to grow ridership. Its introduction in the market represents the beginning of an ongoing journey to enhance the value of service being delivered to existing customers and to earn the business of new riders.
MiWay represents a promise of ongoing and reliable operational and customer service performance. Marketing the MiWay brand is about sharing that story with Mississauga residents and businesses, and engaging with prospective customers in new ways to encourage them to try MiWay.
Market Research
To build on the successful introduction of the new MiWay brand, a 3 year marketing and communications strategic plan is being developed. The plan will be developed based on stakeholder research to measure and monitor brand awareness and overall perceptions of MiWay. It will assist staff in understanding and addressing the perceived barriers and attractors to greater use of transit. It will also validate MiWay’s Brand essence of ‘Easy & Stress Free’ and develop targeted and effective marketing and communications in order to build support and riders for MiWay.
Customer Satisfaction Research
The first bi-annual customer satisfaction survey, undertaken in November 2011, will measure customer satisfaction levels, key drivers of satisfaction and deliver data on usage patterns and rider demographics. Findings will assist in future planning and assist in identifying future budget needs.
F-6 Business Plan 2012 Update
MiWay Website and Mobile Site
Launched on Sept. 1, 2010, the new MiWay website (miway.ca) delivers an easy and stress-free, “self-serve” online customer service experience to encourage non-riders to try Mississauga’s transit system, and to encourage current riders to use the system more often.
The MiWay site is available 24 hours a day, seven days a week. It allows a web user to plan a trip, view current bus schedules or route maps, and learn about service alerts that may affect their travel plans (e.g. detour bus routing due to road maintenance).
More and more customers are turning to the MiWay website (www.miway.ca) and the award-winning MiWay Mobile Site (m.miway.ca) for their transit information needs.
The MiWay website (www.miway.ca) received 409,118 page views (and 323,352 unique page views)in October 2011, up more than 25% from October 2010, when the website received 320,416 page views (and 256,040 unique page views).
In October 2011, the award-winning MiWay Mobile Site (m.miway.ca) received 413,966 page views and 76,603 visits, up more than 500% from October 2010 (the first month it was available to customers) when the Mobile Site received 67,148 page views and 12,699 visits.
Diesel Fuel Price Increases
For 2012, the diesel fuel budget is being increased to bring it in line with domestic prices paid during 2011 as the events in the Middle East have caused price increases that resulted in a $3 million over expenditure in the fuel budget.The adjustment from $0.84 to $0.94 per litre for 2012 creates a $1.5 million pressure in the operating budget. Similar increases have been forecasted for 2013 and 2014.
Operator Overtime Reduction Plan
Increases in operator absenteeism are creating an excessive amount of open work which must be covered using operators at overtime rates, as operator relief pools are insufficient. Leaving the work uncovered affects system reliability and leads to declining ridership and revenue.
In 2011, 19 additional transit Operators were hired. These additional Operators have been assigned to the relief pools and spareboards. As a result overtime has been reduced by $1 million or 15% and service cancellations due to no Operator availability by 75%.
The Health & Safety Specialist has been hired and is currently developing protocols including return to work plans that will not only reduce both the time away from work but also permit a return to full duties sooner.
Presto – GTA Fare Card
Beginning in June 2011, MiWay began operation of the Presto card for customers. The Presto fare card can now be purchased from the Presto website, at the City Centre Transit Terminal or at any GO Transit train station. This product allows customers to load value onto the card to travel any participating GTA transit system. By November 2011, MiWay has sold 2,200 Presto cards to customers and Presto revenues represent 4% of fares collected. Over the next year, MiWay will expand the Presto card sale locations, introduce a loyalty program for card users and continue to educate customers on how to use Presto.
Information Technology
Technology will continue to play an important role in the effectiveness for both internal and external stakeholders. The Business Systems group continues to build on the iBus project which will add new technological systems. The most recent addition is the automated next stop announcements.
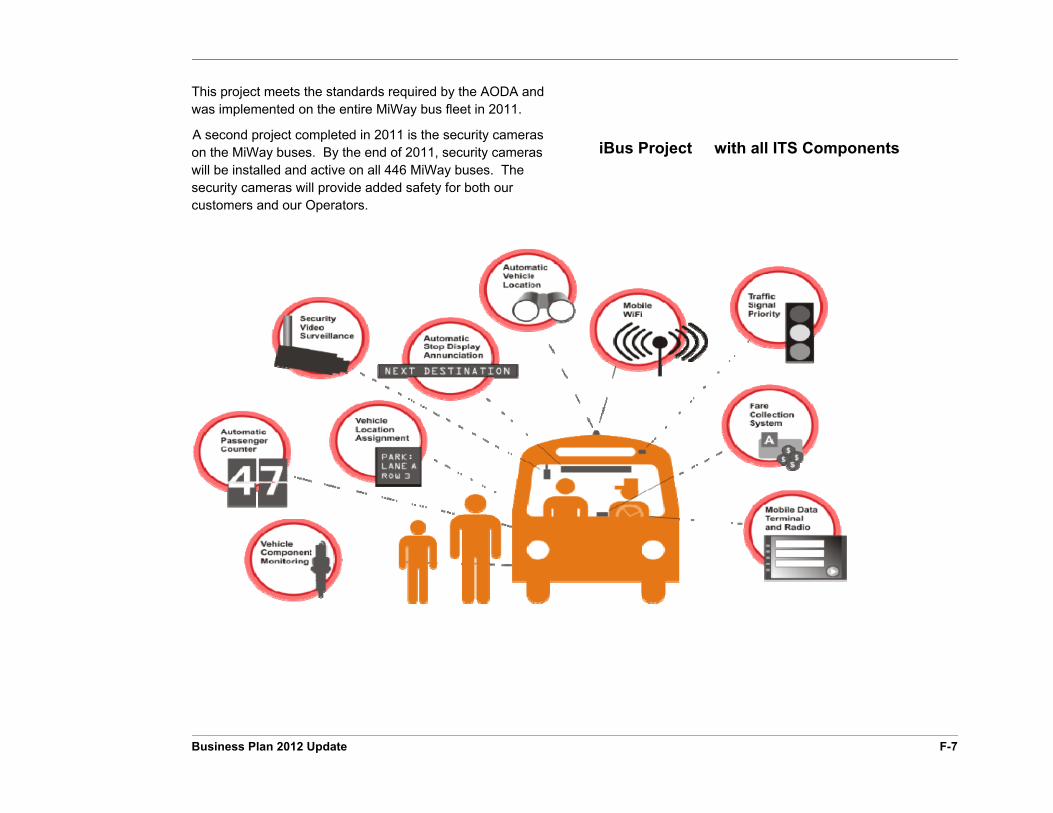
Business Plan 2012 Update F-7
This project meets the standards required by the AODA and was implemented on the entire MiWay bus fleet in 2011.
A second project completed in 2011 is the security cameras on the MiWay buses. By the end of 2011, security cameras will be installed and active on all 446 MiWay buses. The security cameras will provide added safety for both our customers and our Operators.
iBus Project with all ITS Components
F-8 Business Plan 2012 Update
2.2 Accomplishments
As MiWay continues to grow and transition into an urban service provider, a number of significant milestones have been achieved:
Another 43 new buses with the new MiWay colours have been added to the bus fleet;
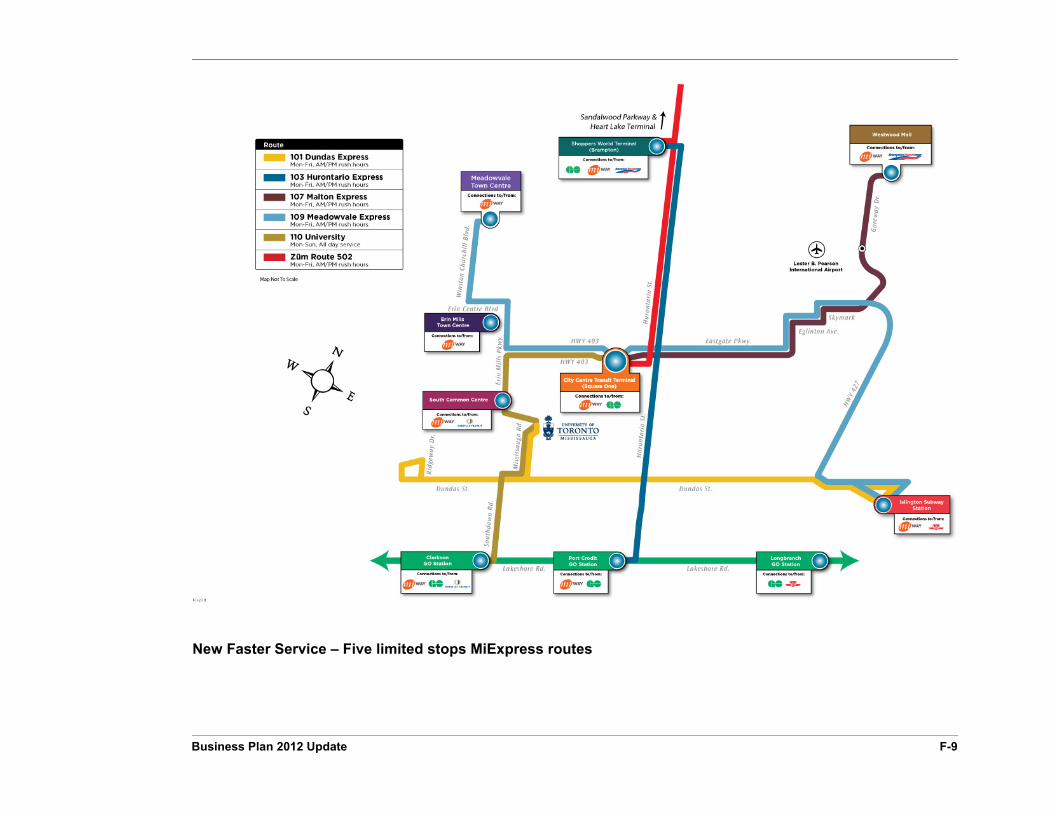
Implemented five new limited-stop pre-BRT routes:
• Route 110 – University, in September 2007;
• Route 109 – Meadowvale, in October 2008;
• Route 101 – Oakville Express, in October 2009;
• Route 107 – Malton Express, in March 2010;
• Route 103 – Hurontario Express, in September 2011;
Awarded contract to introduce ITS (Intelligent Transportation Systems) technologies for transit; which among other benefits delivered automated next stop announcements and bus security cameras on all MiWay buses in 2011;
MiWay has achieved 82% route accessibility and added another 350 accessible stops in 2011. The goal is to achieve full route accessibility in 2012.;
Achieved 100% transit fleet accessibility – All MiWay buses are low floor vehicles;
Added 100,000 service hours between 2009 and 2011;
Successfully partnered with Brampton Transit to implement improved transit service in the Hurontario corridor between Port Credit and Shoppers World in September 2011;
Initiated the construction of the BRT;
Awarded the contract to perform preliminary design and environmental assessment for the Light Rail Transit (LRT) on Hurontario/Main Street in partnership with the City of Brampton;
Successfully launched new brand MiWay The New Mississauga Transit, in August 2010.
Re-designed and enhanced the MiWay website;
Launched an internet microsite for mobile devices and a MiWay Transit App for iphones and ipod touch devices – both are award winning projects.
2.3 Awards and Recognition
MiWay Brand Award:
2010/11 Award for Acceptional Performance & Outstanding Acheivement for the MiWay Brand Implementation from the Canadian Urban Transit (CUTA);
MiWay Mobile Site (m.miway.ca) Awards:
2011 Excellence in Municipal Systems Award from the Municipal Information Systems Association [MISA]
Certificate of Merit as part of the 2011 Willis Award for Innovation from the Canadian Association of Municipal Administrators [CAMA]
2011 Peter J. Marshall Municipal Innovation Award from the Association of Municipalities of Ontario [AMO]
2011 GTEC Distinction Award Honouree for Excellence in Public Service Delivery (Municipal Category) from Canada’s Government Technology Event [GTEC]
The City's Continuous Improvement Award of Excellence (2010) as part of the CAFE Award Program.
Business Plan 2012 Update F-9
New Faster Service – Five limited stops MiExpress routes
F-10 Business Plan 2012 Update
3 Proposed Changes
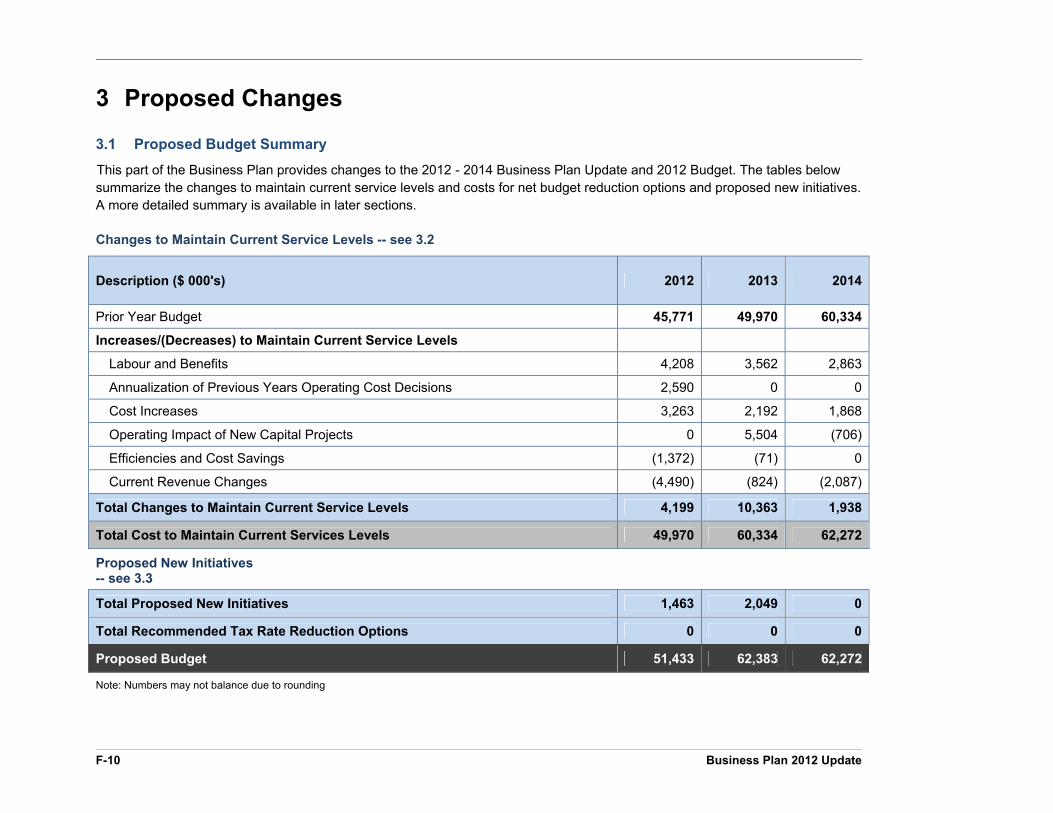
3.1 Proposed Budget Summary
This part of the Business Plan provides changes to the 2012 - 2014 Business Plan Update and 2012 Budget. The tables below summarize the changes to maintain current service levels and costs for net budget reduction options and proposed new initiatives. A more detailed summary is available in later sections.
Changes to Maintain Current Service Levels -- see 3.2
Description ($ 000's) 2012 2013 2014
Prior Year Budget 45,771 49,970 60,334
Increases/(Decreases) to Maintain Current Service Levels
Labour and Benefits 4,208 3,562 2,863
Annualization of Previous Years Operating Cost Decisions 2,590 0 0
Cost Increases 3,263 2,192 1,868
Operating Impact of New Capital Projects 0 5,504 (706)
Efficiencies and Cost Savings (1,372) (71) 0
Current Revenue Changes (4,490) (824) (2,087)
Total Changes to Maintain Current Service Levels 4,199 10,363 1,938
Total Cost to Maintain Current Services Levels 49,970 60,334 62,272
Proposed New Initiatives -- see 3.3
Total Proposed New Initiatives 1,463 2,049 0
Total Recommended Tax Rate Reduction Options 0 0 0
Proposed Budget 51,433 62,383 62,272
Note: Numbers may not balance due to rounding
Business Plan 2012 Update F-11
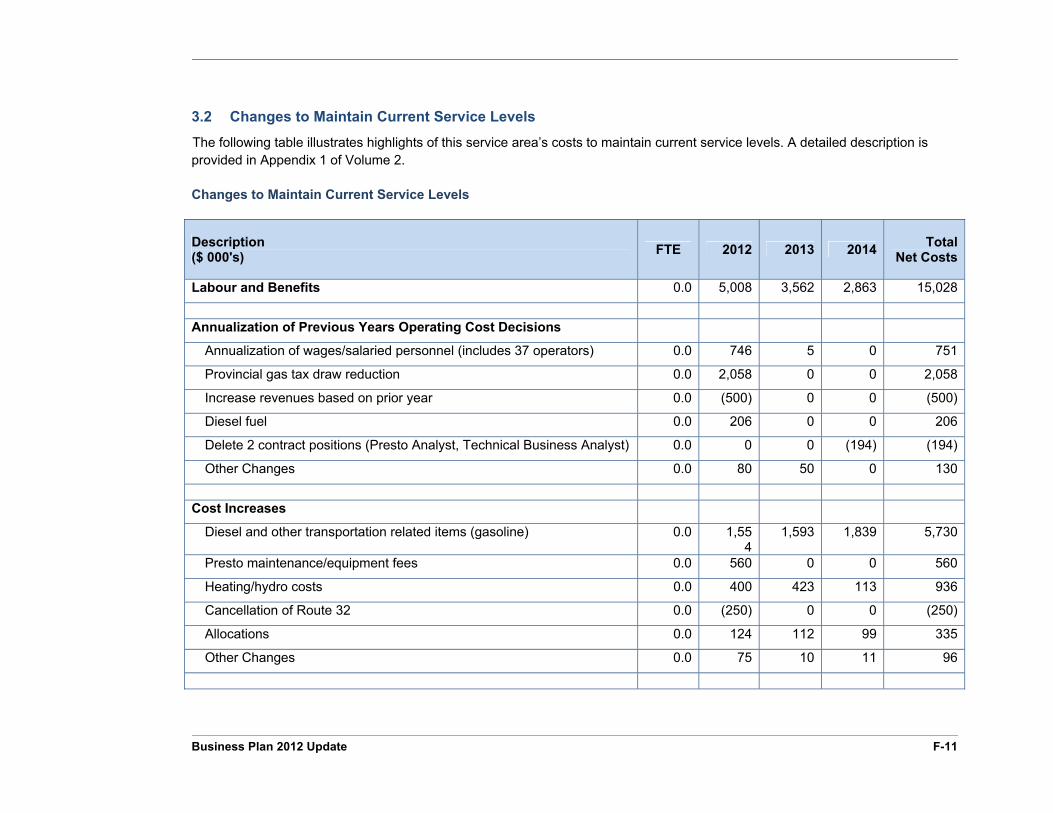
3.2 Changes to Maintain Current Service Levels
The following table illustrates highlights of this service area’s costs to maintain current service levels. A detailed description is provided in Appendix 1 of Volume 2.
Changes to Maintain Current Service Levels
Description ($ 000's) FTE 2012 2013 2014 Total
Net Costs
Labour and Benefits 0.0 5,008 3,562 2,863 15,028
Annualization of Previous Years Operating Cost Decisions
Annualization of wages/salaried personnel (includes 37 operators) 0.0 746 5 0 751
Provincial gas tax draw reduction 0.0 2,058 0 0 2,058
Increase revenues based on prior year 0.0 (500) 0 0 (500)
Diesel fuel 0.0 206 0 0 206
Delete 2 contract positions (Presto Analyst, Technical Business Analyst) 0.0 0 0 (194) (194)
Other Changes 0.0 80 50 0 130
Cost Increases
Diesel and other transportation related items (gasoline) 0.0 1,554
1,593 1,839 5,730
Presto maintenance/equipment fees 0.0 560 0 0 560
Heating/hydro costs 0.0 400 423 113 936
Cancellation of Route 32 0.0 (250) 0 0 (250)
Allocations 0.0 124 112 99 335
Other Changes 0.0 75 10 11 96
F-12 Business Plan 2012 Update
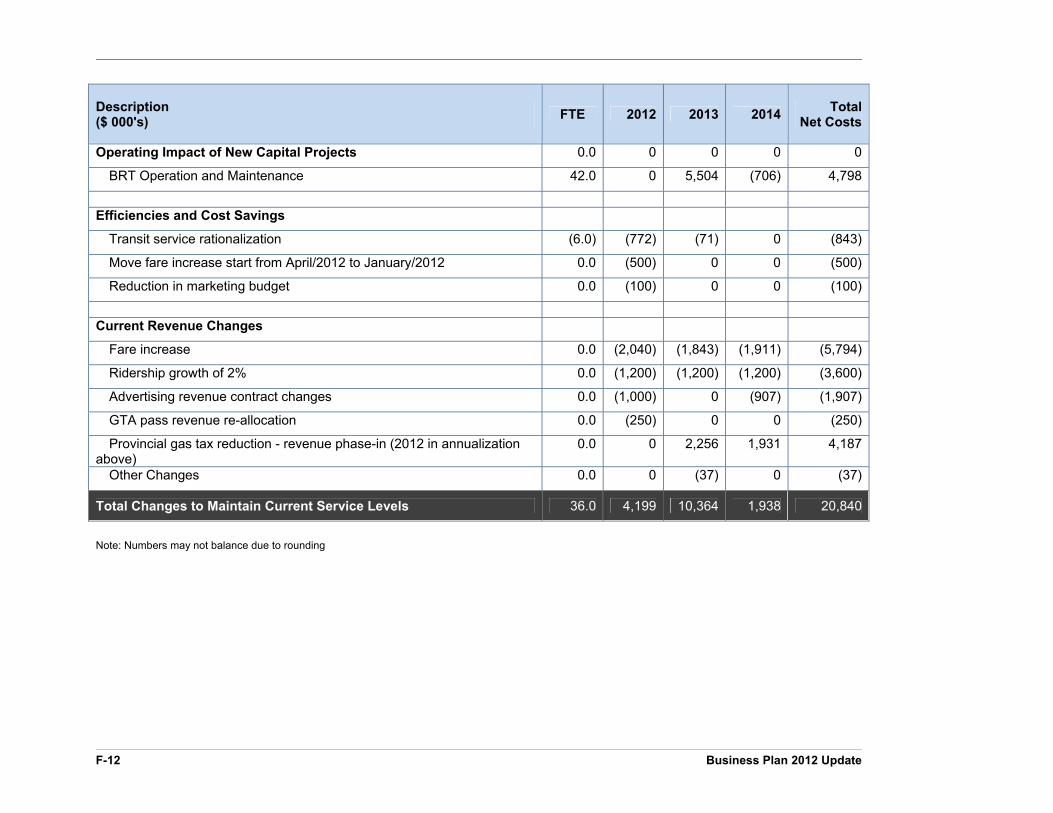
Description ($ 000's) FTE 2012 2013 2014 Total
Net Costs
Operating Impact of New Capital Projects 0.0 0 0 0 0
BRT Operation and Maintenance 42.0 0 5,504 (706) 4,798
Efficiencies and Cost Savings
Transit service rationalization (6.0) (772) (71) 0 (843)
Move fare increase start from April/2012 to January/2012 0.0 (500) 0 0 (500)
Reduction in marketing budget 0.0 (100) 0 0 (100)
Current Revenue Changes
Fare increase 0.0 (2,040) (1,843) (1,911) (5,794)
Ridership growth of 2% 0.0 (1,200) (1,200) (1,200) (3,600)
Advertising revenue contract changes 0.0 (1,000) 0 (907) (1,907)
GTA pass revenue re-allocation 0.0 (250) 0 0 (250)
Provincial gas tax reduction - revenue phase-in (2012 in annualization above)
0.0 0 2,256 1,931 4,187
Other Changes 0.0 0 (37) 0 (37)
Total Changes to Maintain Current Service Levels 36.0 4,199 10,364 1,938 20,840
Note: Numbers may not balance due to rounding
Business Plan 2012 Update F-13
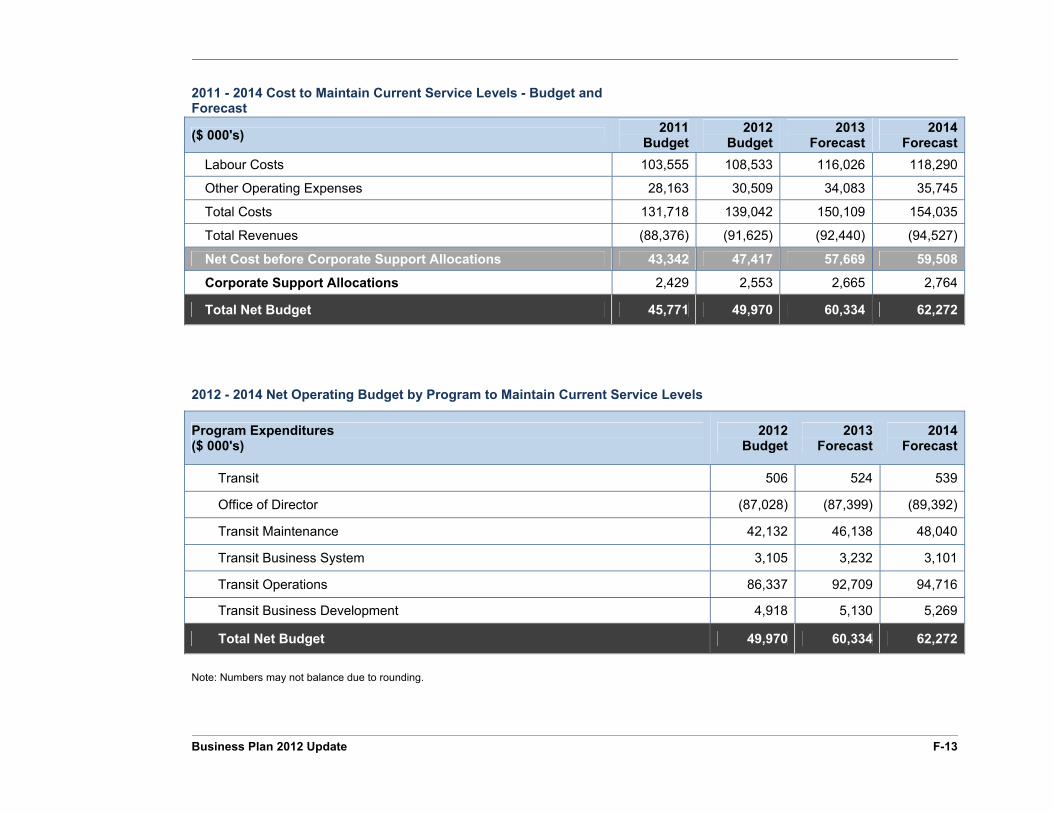
2011 - 2014 Cost to Maintain Current Service Levels - Budget and Forecast
($ 000's) 2011 Budget
2012 Budget
2013 Forecast
2014 Forecast
Labour Costs 103,555 108,533 116,026 118,290
Other Operating Expenses 28,163 30,509 34,083 35,745
Total Costs 131,718 139,042 150,109 154,035
Total Revenues (88,376) (91,625) (92,440) (94,527)
Net Cost before Corporate Support Allocations 43,342 47,417 57,669 59,508
Corporate Support Allocations 2,429 2,553 2,665 2,764
Total Net Budget 45,771 49,970 60,334 62,272
2012 - 2014 Net Operating Budget by Program to Maintain Current Service Levels
Program Expenditures ($ 000's)
2012Budget
2013Forecast
2014Forecast
Transit 506 524 539
Office of Director (87,028) (87,399) (89,392)
Transit Maintenance 42,132 46,138 48,040
Transit Business System 3,105 3,232 3,101
Transit Operations 86,337 92,709 94,716
Transit Business Development 4,918 5,130 5,269
Total Net Budget 49,970 60,334 62,272
Note: Numbers may not balance due to rounding.
F-14 Business Plan 2012 Update
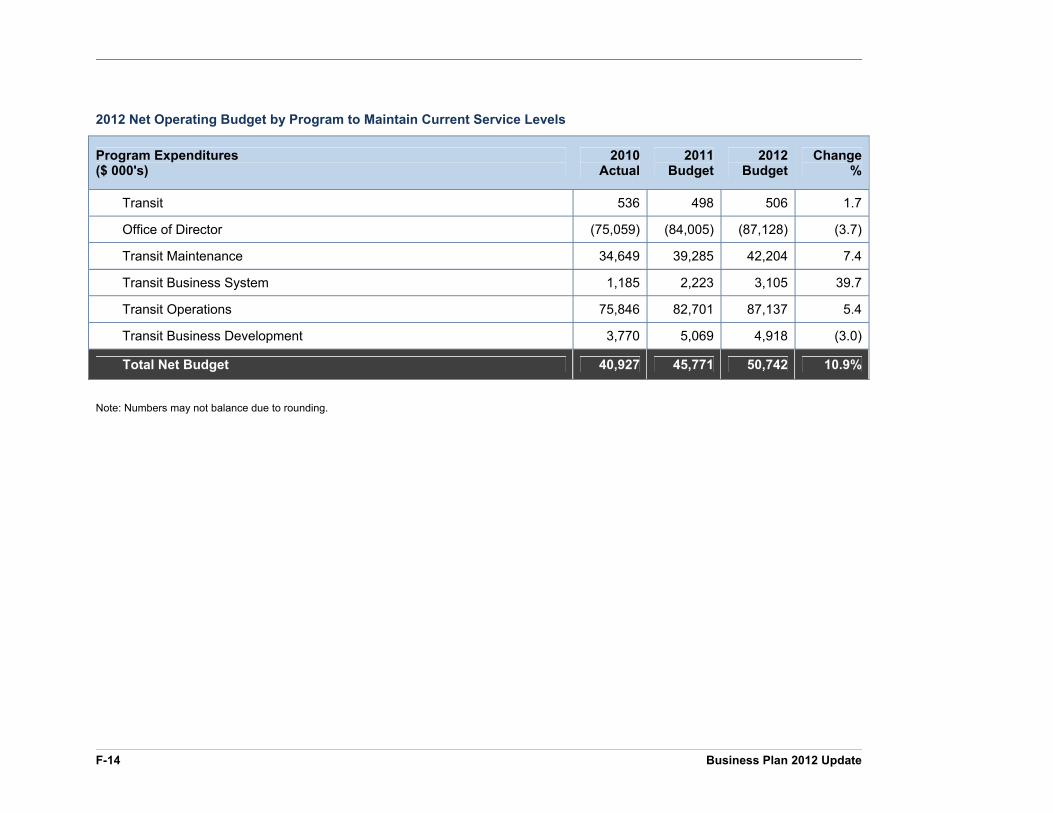
2012 Net Operating Budget by Program to Maintain Current Service Levels
Program Expenditures ($ 000's)
2010 Actual
2011Budget
2012Budget
Change%
Transit 536 498 506 1.7
Office of Director (75,059) (84,005) (87,128) (3.7)
Transit Maintenance 34,649 39,285 42,204 7.4
Transit Business System 1,185 2,223 3,105 39.7
Transit Operations 75,846 82,701 87,137 5.4
Transit Business Development 3,770 5,069 4,918 (3.0)
Total Net Budget 40,927 45,771 50,742 10.9%
Note: Numbers may not balance due to rounding.
Business Plan 2012 Update F-15
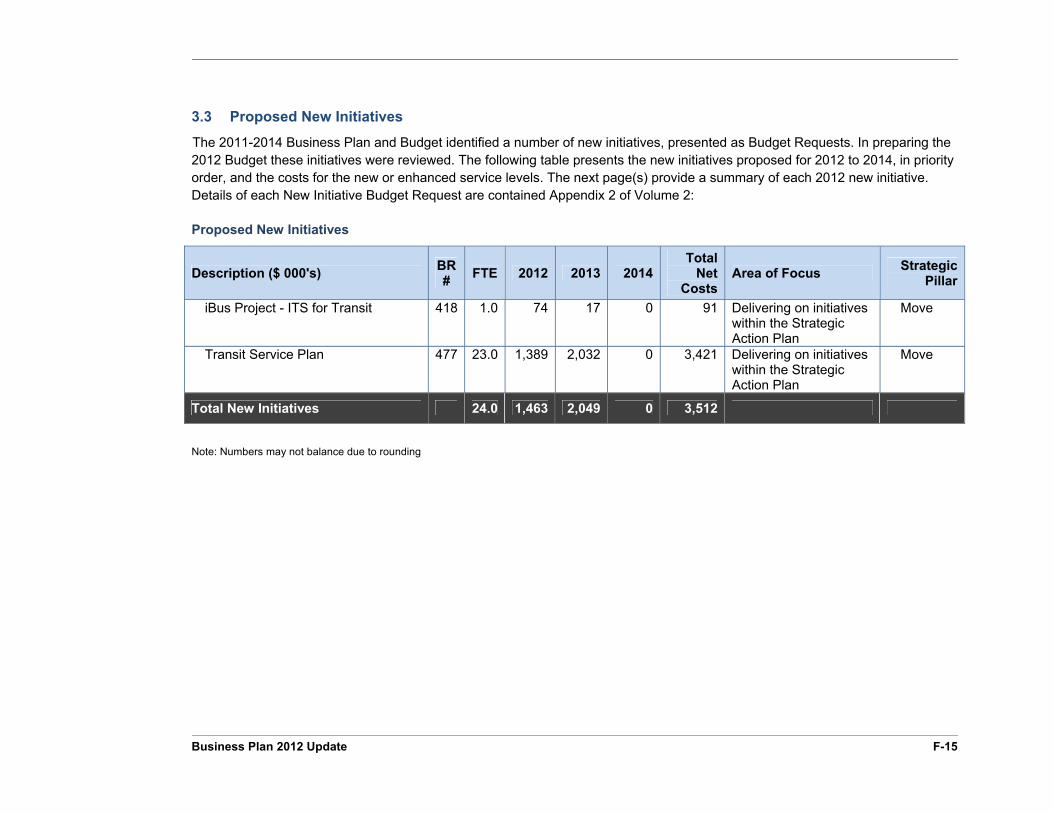
3.3 Proposed New Initiatives
The 2011-2014 Business Plan and Budget identified a number of new initiatives, presented as Budget Requests. In preparing the 2012 Budget these initiatives were reviewed. The following table presents the new initiatives proposed for 2012 to 2014, in priority order, and the costs for the new or enhanced service levels. The next page(s) provide a summary of each 2012 new initiative. Details of each New Initiative Budget Request are contained Appendix 2 of Volume 2:
Proposed New Initiatives
Description ($ 000's) BR # FTE 2012 2013 2014
Total Net
CostsArea of Focus Strategic
Pillar
iBus Project - ITS for Transit 418 1.0 74 17 0 91 Delivering on initiatives within the Strategic Action Plan
Move
Transit Service Plan 477 23.0 1,389 2,032 0 3,421 Delivering on initiatives within the Strategic Action Plan
Move
Total New Initiatives 24.0 1,463 2,049 0 3,512
Note: Numbers may not balance due to rounding
F-16 Business Plan 2012 Update
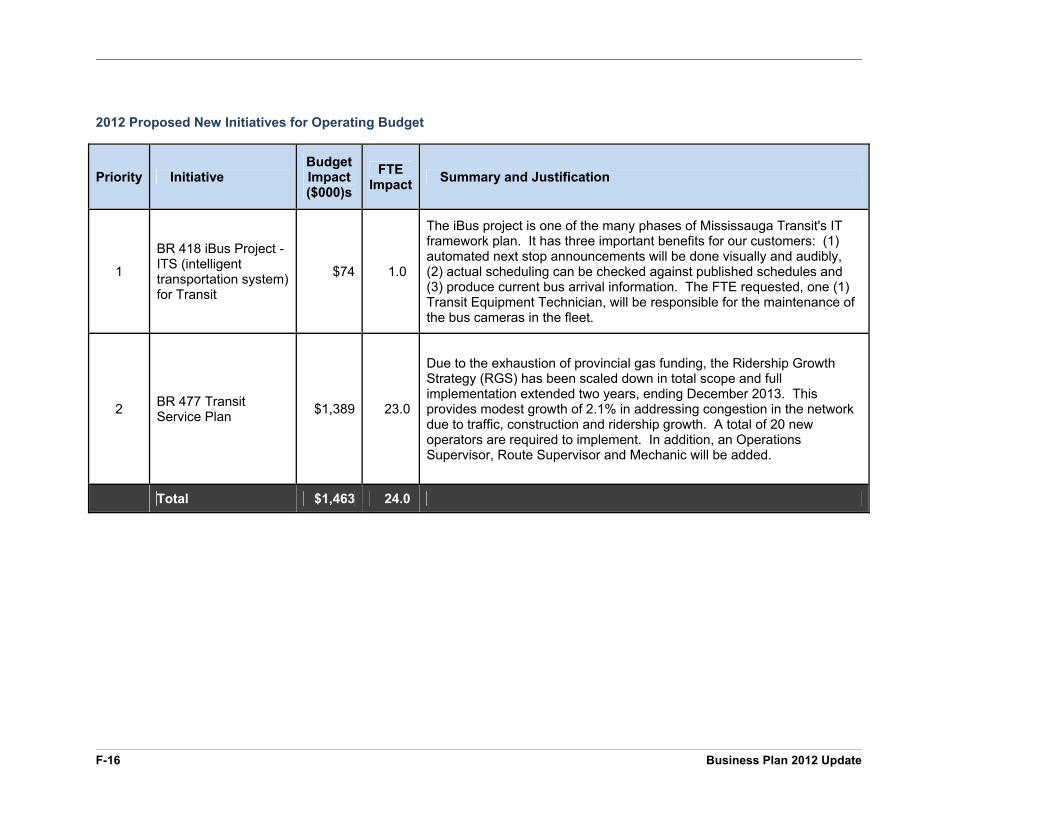
2012 Proposed New Initiatives for Operating Budget
Priority Initiative Budget Impact($000)s
FTE Impact Summary and Justification
1
BR 418 iBus Project - ITS (intelligent transportation system) for Transit
$74 1.0
The iBus project is one of the many phases of Mississauga Transit's IT framework plan. It has three important benefits for our customers: (1) automated next stop announcements will be done visually and audibly, (2) actual scheduling can be checked against published schedules and (3) produce current bus arrival information. The FTE requested, one (1) Transit Equipment Technician, will be responsible for the maintenance of the bus cameras in the fleet.
2 BR 477 Transit Service Plan $1,389 23.0
Due to the exhaustion of provincial gas funding, the Ridership Growth Strategy (RGS) has been scaled down in total scope and full implementation extended two years, ending December 2013. This provides modest growth of 2.1% in addressing congestion in the network due to traffic, construction and ridership growth. A total of 20 new operators are required to implement. In addition, an Operations Supervisor, Route Supervisor and Mechanic will be added.
Total $1,463 24.0
Business Plan 2012 Update F-17
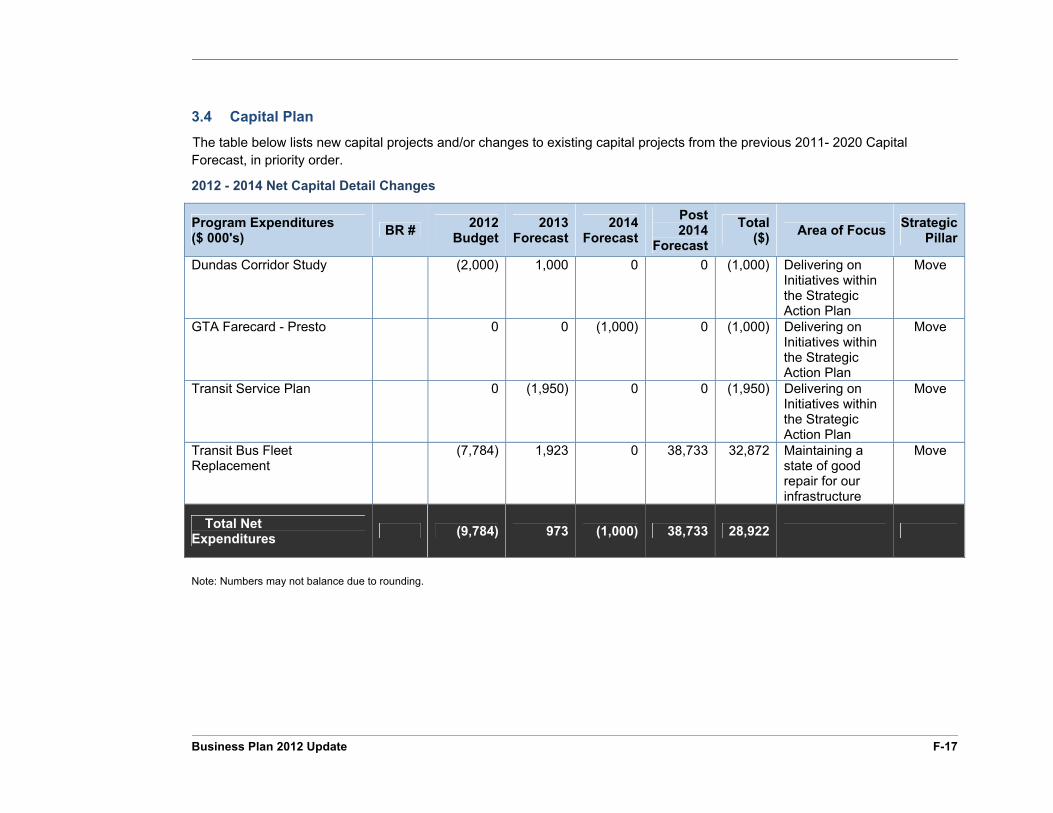
3.4 Capital Plan
The table below lists new capital projects and/or changes to existing capital projects from the previous 2011- 2020 Capital Forecast, in priority order.
2012 - 2014 Net Capital Detail Changes
Program Expenditures ($ 000's) BR # 2012
Budget2013
Forecast2014
Forecast Post 2014
ForecastTotal
($) Area of Focus Strategic Pillar
Dundas Corridor Study (2,000) 1,000 0 0 (1,000) Delivering on Initiatives within the Strategic Action Plan
Move
GTA Farecard - Presto 0 0 (1,000) 0 (1,000) Delivering on Initiatives within the Strategic Action Plan
Move
Transit Service Plan 0 (1,950) 0 0 (1,950) Delivering on Initiatives within the Strategic Action Plan
Move
Transit Bus Fleet Replacement
(7,784) 1,923 0 38,733 32,872 Maintaining a state of good repair for our infrastructure
Move
Total Net Expenditures (9,784) 973 (1,000) 38,733 28,922
Note: Numbers may not balance due to rounding.
F-18 Business Plan 2012 Update
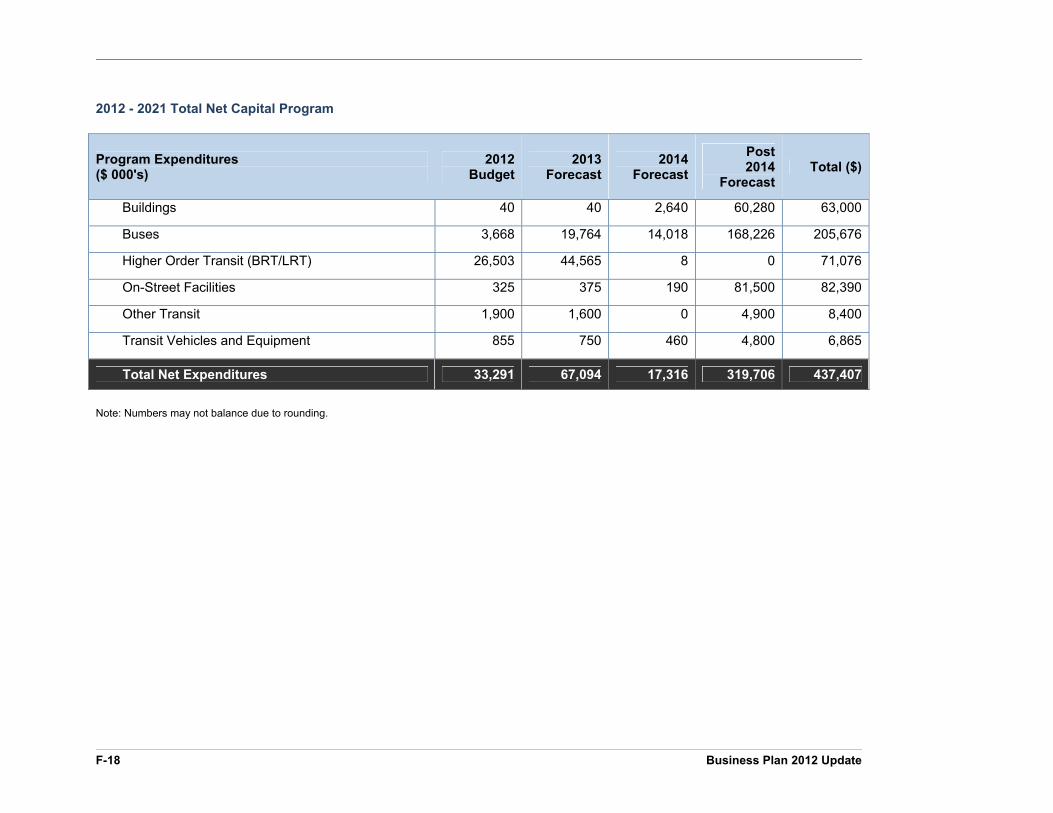
2012 - 2021 Total Net Capital Program
Program Expenditures ($ 000's)
2012Budget
2013Forecast
2014Forecast
Post 2014
ForecastTotal ($)
Buildings 40 40 2,640 60,280 63,000
Buses 3,668 19,764 14,018 168,226 205,676
Higher Order Transit (BRT/LRT) 26,503 44,565 8 0 71,076
On-Street Facilities 325 375 190 81,500 82,390
Other Transit 1,900 1,600 0 4,900 8,400
Transit Vehicles and Equipment 855 750 460 4,800 6,865
Total Net Expenditures 33,291 67,094 17,316 319,706 437,407
Note: Numbers may not balance due to rounding.
Business Plan 2012 Update F-19
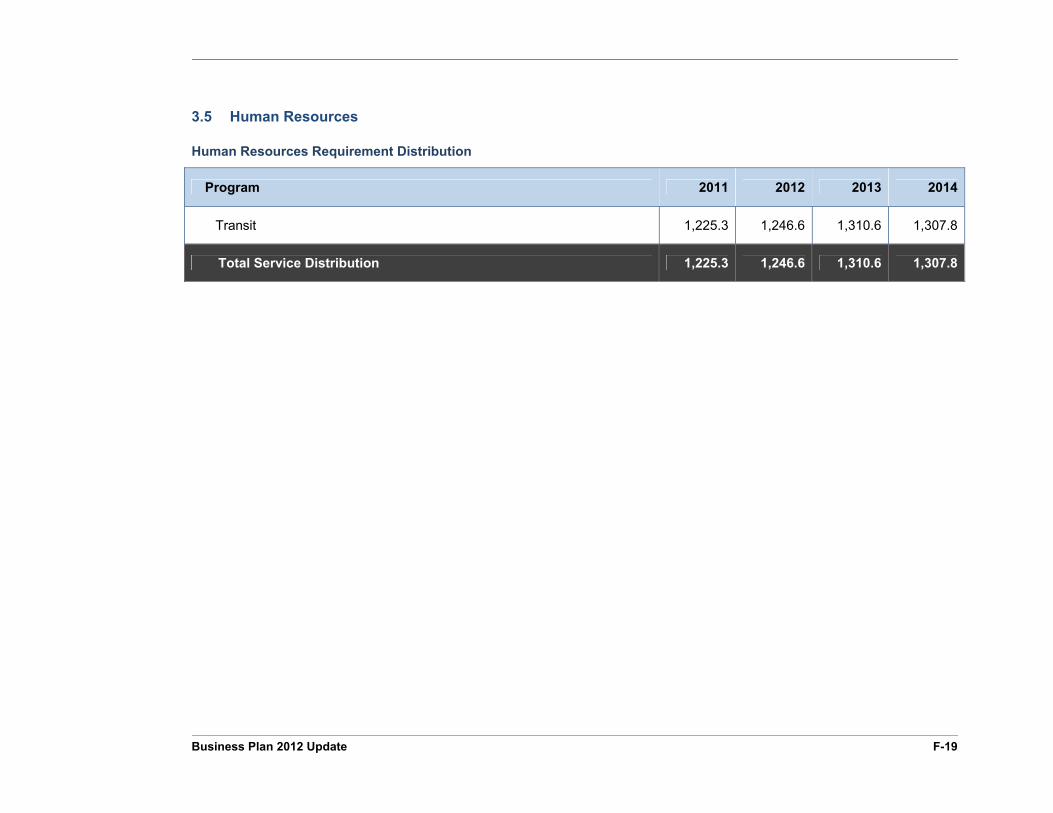
3.5 Human Resources
Human Resources Requirement Distribution
Program 2011 2012 2013 2014
Transit 1,225.3 1,246.6 1,310.6 1,307.8
Total Service Distribution 1,225.3 1,246.6 1,310.6 1,307.8
F-20 Business Plan 2012 Update
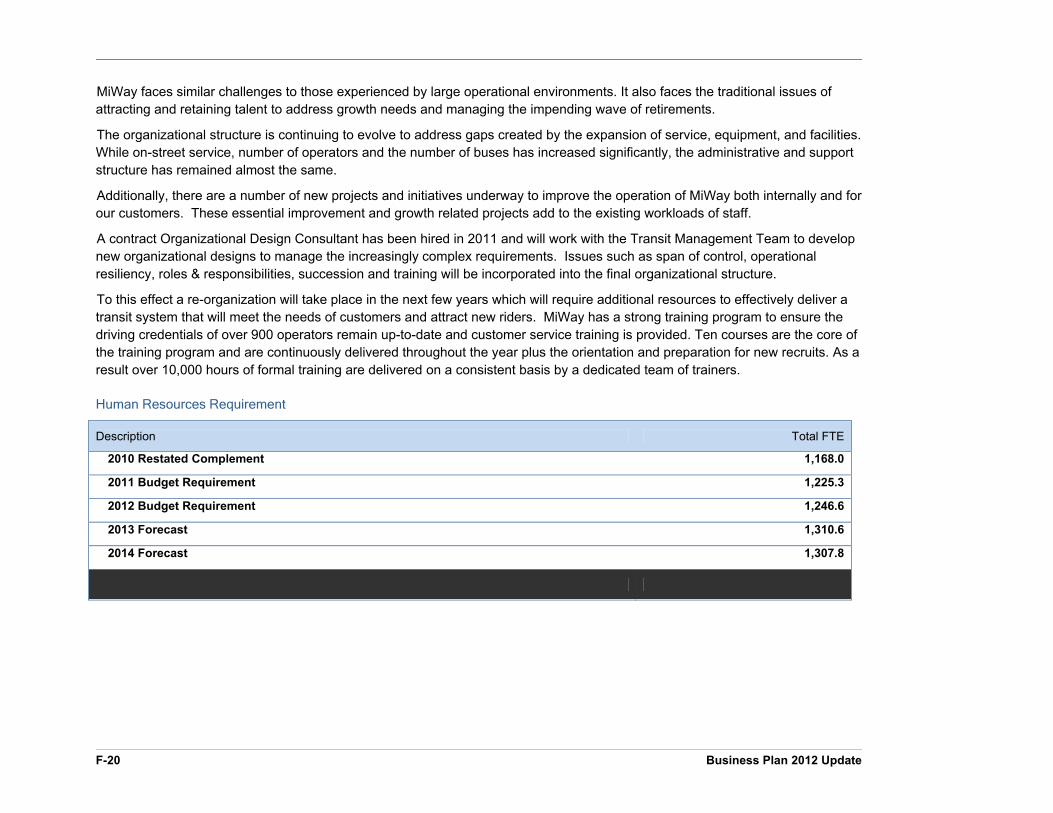
MiWay faces similar challenges to those experienced by large operational environments. It also faces the traditional issues of attracting and retaining talent to address growth needs and managing the impending wave of retirements.
The organizational structure is continuing to evolve to address gaps created by the expansion of service, equipment, and facilities. While on-street service, number of operators and the number of buses has increased significantly, the administrative and support structure has remained almost the same.
Additionally, there are a number of new projects and initiatives underway to improve the operation of MiWay both internally and for our customers. These essential improvement and growth related projects add to the existing workloads of staff.
A contract Organizational Design Consultant has been hired in 2011 and will work with the Transit Management Team to develop new organizational designs to manage the increasingly complex requirements. Issues such as span of control, operational resiliency, roles & responsibilities, succession and training will be incorporated into the final organizational structure.
To this effect a re-organization will take place in the next few years which will require additional resources to effectively deliver a transit system that will meet the needs of customers and attract new riders. MiWay has a strong training program to ensure the driving credentials of over 900 operators remain up-to-date and customer service training is provided. Ten courses are the core of the training program and are continuously delivered throughout the year plus the orientation and preparation for new recruits. As a result over 10,000 hours of formal training are delivered on a consistent basis by a dedicated team of trainers.
Human Resources Requirement
Description Total FTE
2010 Restated Complement 1,168.0
2011 Budget Requirement 1,225.3
2012 Budget Requirement 1,246.6
2013 Forecast 1,310.6
2014 Forecast 1,307.8
Business Plan 2012 Update F-21
4 Performance Measures
4.1 Balanced Scorecard
A Balanced Scorecard identifies and measures four key areas of an organization’s performances; Financial; Customers; Employees; and Business Processes.
By paying attention to all four areas an organization can retain balance to its performance and know that it is moving towards the attainment of its goals.
About the Measures for MiWay
Financial Measures
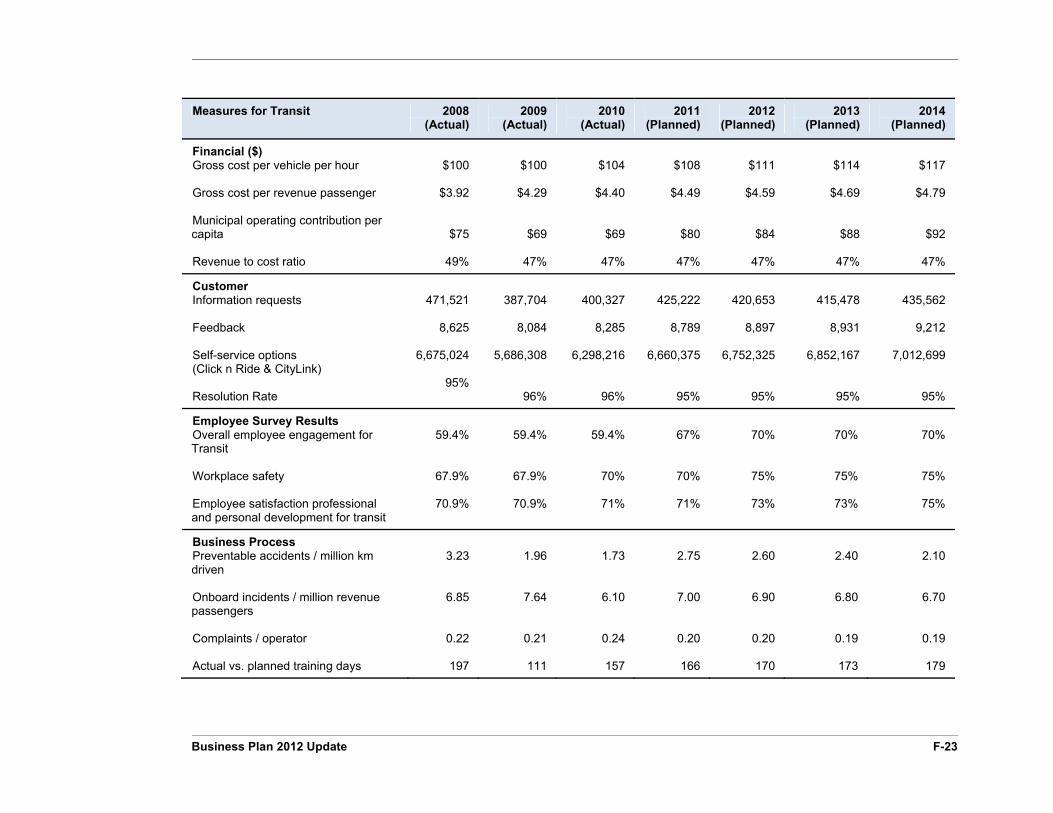
Revenue to cost (R/C) ratio is transit’s key financial metric. At 47 percent we are very close to the preferred industry ratio of 50 percent for a system of our size. To achieve a consistent R/C ratio, fare revenues and the City’s contribution to transit should increase in proportion to the difference between operational costs and fare revenues.
Gross cost per vehicle per hour is what it costs per hour for each bus while it is in service.
Gross cost per revenue passenger measures the cost of servicing a one-passenger trip. In 2009, a passenger would pay on average $1.91; however the city’s actual cost was $4.29.
Municipal operating contribution per capita is the amount that the City contributes to transit per resident.
Customer Measures
MiWay’s customer service team responsibilities are to:
Respond to customer information inquiries; and
Register and address customer compliments and complaints.
Information requests are trip planning requests taken through the MiWay call centre.
Feedback these are customer concerns and complaints received through the MiWay call centre. The lower the call volume the higher the customer satisfaction.
Self-service Options include CityLink which is an interactive phone service that provides next bus information, and Click n’Ride which is an on-line trip planning service. Higher numbers indicate customer migration to self-service options.
Resolution Rate is the percentage of time that customer inquiries received are handled within the standard response time.
Customer Satifaction – The bi-annual customer survey will measure satisfaction levels, key drivers of satisfaction and deliver data on usage patterns an rider demographics. Findings will assist in future planning and assist in identifying future budget needs.
Market Research – To measure and monitor brand awareness and overall perceptions of MiWay. To understand the perceived barriers and attractors to greater use of transit. Validate MiWay’s Brand essence of ‘Easy & Stress Free’ and to develop targeted and effective marketing and communications in order to build support and riders for MiWay.
F-22 Business Plan 2012 Update
Employee Measures
The bi-annual employee engagement survey provides the information to track employees engagement and level of job satisfaction. These measures are relevant as MiWay operates in a 24/7 environment in all climate conditions.
The measures reflect outcomes; a satisfactory result implies that the combination of training programs, labour relations, field and on the job support are perceived by staff as conducive to a productive and safe work environment.
Business Process Measures
Until the full deployment of ITS, MiWay will continue to have a limited ability to monitor on-street system performance, which is fundamental to quality service.
The metrics on the business process table monitor the outcomes of a vast number of activities that Transit operations execute on a daily basis to prevent and react to the daily events of a 24/7 service.
Business Plan 2012 Update F-23
Measures for Transit 2008(Actual)
2009(Actual)
2010 (Actual)
2011(Planned)
2012(Planned)
2013(Planned)
2014(Planned)
Financial ($) Gross cost per vehicle per hour Gross cost per revenue passenger Municipal operating contribution per capita Revenue to cost ratio
$100
$3.92
$75
49%
$100
$4.29
$69
47%
$104
$4.40
$69
47%
$108
$4.49
$80
47%
$111
$4.59
$84
47%
$114
$4.69
$88
47%
$117
$4.79
$92
47%
Customer Information requests Feedback Self-service options (Click n Ride & CityLink) Resolution Rate
471,521
8,625
6,675,024
95%
387,704
8,084
5,686,308
96%
400,327
8,285
6,298,216
96%
425,222
8,789
6,660,375
95%
420,653
8,897
6,752,325
95%
415,478
8,931
6,852,167
95%
435,562
9,212
7,012,699
95%
Employee Survey Results Overall employee engagement for Transit Workplace safety Employee satisfaction professional and personal development for transit
59.4%
67.9%
70.9%
59.4%
67.9%
70.9%
59.4%
70%
71%
67%
70%
71%
70%
75%
73%
70%
75%
73%
70%
75%
75%
Business Process Preventable accidents / million km driven Onboard incidents / million revenue passengers Complaints / operator Actual vs. planned training days
3.23
6.85
0.22
197
1.96
7.64
0.21
111
1.73
6.10
0.24
157
2.75
7.00
0.20
166
2.60
6.90
0.20
170
2.40
6.80
0.19
173
2.10
6.70
0.19
179