Embed Size (px)
Citation preview
p o l l i n a t i o n s e r v i c e s F o r s U s t a i n a B l e a G r i c U l t U r e • F i e l d m a n U a l s
extension oF KnowledGe Base
AdApt ive MAnAgeMent
CApACity building
MAinstreAMing
protocol to detect and ASSESS POLLINATION deFicits in crops: a HandBooK For its Use
As a contribution to the international pollinators initiative, FAO and its partners have
collaborated with inrA (institut national de la recherche Agronomique, a public research
body of the French government) to develop a protocol for assessing and detecting if a
crop production system is suffering a pollination deficit. this document thus presents
a handbook for the application of the protocol, outlining the underlying concepts, the
hypothesis to be tested, and the modification and application of the protocol to a
variety of circumstances in developing countries, such as small fields, home gardens,
and high environmental variability.
Food and Agriculture Organization of the United Nations viale delle terme di Caracalla, 00153 rome, italy
www.fao.org/ag/AGP/default.htme-mail: [email protected]
GLObAL AcTION On POLLINATION SErvIcES FOr SUSTAINAbLE AGrIcULTUrE
i19
29
e/
1/
01
.11
proto
col to
detect a
nd
assess po
llinatio
n d
eFicits in cro
ps: a H
an
dB
oo
K Fo
r its Use
FAO
p o l l i n a t i o n s e r v i c e s F o r s U s t a i n a B l e a G r i c U l t U r e • F i e l d M a n U a l s
PROTOCOL TO DETECT AND ASSESS POLLINATION DEFICITS IN CROPS: A HANDBOOK FOR ITS USE
Bernard E. VaissièreInstitut National de la Recherche Agronomique, Avignon, France
Breno M. Freitas Universidade Federal do Ceará, Fortaleza, Brazil
Barbara Gemmill-Herren Food and Agiculture Organization of the United Nations, Rome, Italy
Food and aGricUltUre orGanization oF the United nations , roMe 2011
desi
gn o
f th
e pu
blic
atio
n se
ries:
pie
tro@
bart
oles
chi.c
om /
Mar
ch 2
008
The field testing and adaptation of the protocol described in this handbook, and the production of the book, was made possible through the support of the International Fund for Agricultural Development (IFAD), Rome, Italy.
This publication provides guidance, as part of the GEF supported Project "Conservation and Management of Pollinators for Sustainable Agriculture, through an Ecosystem Approach" implemented in seven countries - Brazil, Ghana, India, Kenya, Nepal, Pakistan, and South Africa. The project is coordinated by the Food and Agriculture Organization of the United Nations (FAO) with implementation support from the United Nations Environment Programme (UNEP).
the designations employed and the presentation of material in this information product do not imply the expression of any opinion
whatsoever on the part of the Food and agriculture organization of the United nations concerning the legal or development status
of any country, territory, city or area or of its authorities, or concerning the delimitation of its frontiers or boundaries. the mention
of specific companies or products of manufacturers, whether or not these have been patented, does not imply that these have been
endorsed or recommended by the Food and agriculture organization of the United nations in preference to others of a similar nature
that are not mentioned.
the views expressed in this publication are those of the author(s) and do not necessarily reflect the views of the Food and agriculture
organization of the United nations.
all rights reserved. Fao encourages the reproduction and dissemination of material in this information product. non-commercial
uses will be authorized free of charge, upon request. reproduction for resale or other commercial purposes, including educational
purposes, may incur fees.
applications for permission to reproduce or disseminate Fao copyright materials, and all queries concerning rights and licences, should be addressed by e-mail to [email protected] or to the:
Chiefpublishing policy and support Branchoffice of Knowledge exchange, research and extensionFAOViale delle Terme di Caracalla00153 romeItaly
© FAO 2011
vii 1
51113191922262931323841
4343444445475051
5357
iii
p r oto c o l t o d e t e c t a n d a s s e s s p o l l i n at i o n d e F i c i t s i n c r o p s : a h a n d B o o K F o r i t s U s e
PrefaceIntroduction
section 1. DEFINITIONS AND CONCEPTUAL FRAMEwORKsection 2. PROTOCOL OBjECTIVE AND STRUCTUREsection 3. GENERAL CONSIDERATIONS FOR ExPERIMENTAL DESIGN AND STUDy FIELD SELECTIONsection 4. TREATMENTS TO VARy THE LEVEL OF POLLINATION SERVICE 4.A Pollinator (bee) supplementation 4.B Landscape context 4.C Combined treatment – Introduced pollinators and landscape contextsection 5. LAyOUT OF ExPERIMENTAL SITESsection 6. POLLINATOR DEPENDENT VARIABLES AND DATA COLLECTION 6.A Data collection for measuring pollinator density 6.B Data collection for measuring pollinator diversity 6.C Data collection for covariablessection 7. PRODUCTION DEPENDENT VARIABLES AND SAMPLING UNITS 7.A. Agronomic yield
7.a.1 individual plants 7.a.2 recording plot 7.a.3 Whole study field
7.B Economic yieldsection 8. STATISTICAL ANALySESsection 9. GENERAL CONCLUSIONS
Referencesannexes
CONTENTS
vii 1
51113191922262931323841
4343444445475051
5357
iv
Figure 1.1 participants in the FAO-sponsored expert workshop on assessing pollination deficits in crops
Figure 1.2 optimal pollination levels – within the resource allocation pattern of the crop
Figure 1.3 pollination deficit in relation with optimum pollination level
Figure 1.4 optimum pollination of runner beans in Kenya
Figure 1.5 impact of a significant increase in the number of insect visitors to coffee crops in latin america
Figure 1.6 lack of pollen production in strawberry
Figure 1.7 Bouquet of pollenizer flowers in pear orchard
Figure 1.8 crop pollination deficit: strawberries in Kenya
Figure 1.9 crop pollination deficit as defined by market standards
Figure 1.10 crops cultivated less because of poor pollination
Figure 2.1 relationship between pollination level and crop yield
Figure 3.1 hierarchy of location terminology used in this handbook
Figure 3.2 hypothetical placement of study fields with a completely randomized design using two distances
to natural habitat as treatment
Figure 3.3 hypothetical placement of study fields in a factorial design with two levels of two treatments
Figure 3.4 Pollinator fronts
Figure 3.5 locating paired plots in a landscape
Figure 3.6 home garden as study field
Figure 4.1 pollinator supplementation
Figure 4.2 risks of introduction of foreign pollinators
Figure 4.3 landscape context
Figure 4.4 Unmanaged pollinators
Figure 4.5 Using legislated conservation practices as a basis for experimental design
Figure 4.6 combinatorial treatments
Figure 4.7 combining treatments to create a pollinator front
Figure 5.1 location of the experimental site for data collection in a standard field planted with rows
Figure 5.2 layout of the experimental site in relation to the size of the study field
Figure 6.1 sampling layout to measure pollinator abundance and diversity
Figure 6.2 layout of sampling areas to measure pollinator density and diversity in small field
with a broadcast-sown crop (e.g., mustard/rape or buckwheat)
Figure 6.3 sampling layout to measure pollinator abundance & diversity in an orchard without pollenizer trees
Figure 6.4 Methodology for recording pollinator density
Table 6.1 choices of floral unit for measuring pollinator density
Figure 6.5 collecting pollinators with a sweep net
Figure 6.6 insect collecting and labeling
Figure 7.1 layout of yield plots in field planted with row crop
Figure 7.2 layout of yield plots in small field with a broadcast-sown crop (e.g. mustard/rape or buckwheat)
Figure 7.3 layout of yield plots in an orchard without pollenizer tree
Figure 7.4 impact of pollination level on strawberry quality
Figure 7.5 impact of pollination level on market value
LIST OF FIGURES AND TABLE
3
3
5
6
7
7
8
9
9
10
12
13
14
15
16
17
18
20
20
22
23
25
26
27
30
30
33
34
35
36
37
38
40
46
46
48
48
49
575859
6061626364
656667686970
v
p r oto c o l t o d e t e c t a n d a s s e s s p o l l i n at i o n d e F i c i t s i n c r o p s : a h a n d B o o K F o r i t s U s e
575859
6061626364
656667686970
Annex 1 data sheet to record main characteristics of study field
Annex 2 data sheet to record pollinator density on plots of an herbaceaous crop
Annex 3 data sheet to record pollinator density on orchard trees in plots located along a gradient
of distances to pollinator front
Annex 4 data sheet to record pollinator density on plots in an orchard with pollenizer plants
Annex 5 data sheet to record pollinator density in the absence of plots
Annex 6 data sheet to record pollinator diversity in plots of an herbaceous crop
Annex 7 data sheet to record pollinator diversity on plots in an orchard with pollenizer plants
Annex 8 data sheet to record pollinator diversity on orchard trees in plots located along a gradient
of distances to pollinator front
Annex 9 data sheet to record flower density on plots of an herbaceous crop
Annex 10 data sheet to record flowering phenology in an orchard crop with pollenizer tree
Annex 11 data sheet to record yield on plots of an herbaceous crop planted in rows and in monoculture
Annex 12 data sheet to record yield of individual plants of an herbaceous crop on plots with mixed planting
Annex 13 data sheet to record yield on plots of an orchard crop
Annex 14 data sheet to record yield on orchard trees in plots located along a gradient of distances
to pollinator front
LIST OF ANNExES
© n
icol
as M
oris
on/i
nra
vii
p r oto c o l t o d e t e c t a n d a s s e s s p o l l i n at i o n d e F i c i t s i n c r o p s : a h a n d B o o K F o r i t s U s e
in agro-ecosystems, pollinators are essential for orchard, oilseed crop, horticultural and forage
production, as well as the production of seed for many root and fibre crops. pollinators such as
bees, birds and bats affect 35 percent of the world’s crop production, increasing outputs of 87 of
the leading food crops worldwide, plus many plant-derived medicines in the world’s pharmacies.
Just as the agricultural community is taking stock of the contribution of pollination to
crop production, populations of managed pollinators (the Western honey bee Apis mellifera,
the eastern honey bee Apis cerana, and their asian relatives) are experiencing new and poorly
understood threats. Wild pollinators in agricultural landscapes can provide important pollination
services and serve also as a critical form of insurance against the risks of pests and diseases
amongst managed pollinators.
Within the context of its lead role in the implementation of the initiative for the
conservation and sustainable Use of pollinators (also known as the international pollinators
initiative-ipi) of the United nations convention on Biological diversity adopted in 2000 (cop
decision v/5, section ii), Fao has established a “Global action on pollination services for
sustainable agriculture”. Fao has also developed a global project, supported by the Global
environment Facility (GeF) through the United nations environment programme (Unep)
entitled “conservation and management of pollinators for sustainable agriculture, through an
ecosystem approach”. seven countries (Brazil, Ghana, india, Kenya, nepal, pakistan and south
africa) have worked together with Fao to identify and carry out targeted activities that can
address threats to pollinators in agricultural landscapes. the outcomes of the global project
are expected to expand global understanding, capacity and awareness of the conservation and
sustainable use of pollinators for agriculture.
PREFACE
viii
as a contribution to the ipi, Fao and its partners have collaborated with inra (institut
national de la recherche agronomique, a public research body of the French government)
to develop a protocol for assessing and detecting if a crop production system is suffering
a pollination deficit. Field testing and adaptation of the protocol for the variable cropping
systems in different countries was made possible through a grant from the international Fund
for agricultural development (iFad) on the “development of tools and Methods for conservation
and Management of pollination services for sustainable agriculture“, in 2009 and 2010. this
document thus presents a handbook for the application of the protocol, outlining the underlying
concepts, the hypothesis to be tested, and the modification and application of the protocol
to a variety of circumstances in developing countries, such as small fields, home gardens, and
high environmental variability. as the protocol is applied, Fao and its partners will be able to
provide information on the results of detecting and assessing levels of pollination deficit in
crops important for nutrition and food security around the world.
Linda ColletteFAO Focal Point for the IPI
plant production and protection divisionRome, Italy
INTRODUCTION
1
p r oto c o l t o d e t e c t a n d a s s e s s p o l l i n at i o n d e F i c i t s i n c r o p s : a h a n d B o o K F o r i t s U s e
the following describes a protocol to be applied to focal crops at the farm scale level to
(i) detect and assess pollination deficits in field situations in a standard and statistically testable
way; and (ii) draw management conclusions from the proposed experiment for possible action to
eliminate or at least reduce these deficits. it can also be used simply to assess pollinator density
and diversity on a focal crop for comparison purposes among different sites.
pollination is the transfer of pollen from the producing anthers to the receptive stigma and it
is an essential preliminary step for the sexual reproduction of flowering plants. pollination level
can be precisely measured as the number of compatible and viable pollen grains that reach a
stigma during the effective pollination period, and it is therefore directly related to yield for all
crops in which the output is a product of sexual reproduction. indeed, pollination management
should be regarded as a production factor in its own right for all these crops as it can affect
the agronomic yield and its many components such as fruit set and seed set, fruit quality
(e.g. size, aspect, sugar content, flavor and nutritional content), seed quality (e.g. germination
rate, oil content), and other characteristics such as earliness and uniformity of output (e.g. rape
Brassica napus l.: lerin 1982, sabbahi et al. 2006), market value and profitability, and finally
the environmental and societal impacts of a crop (McGregor 1976; Free 1993).
FAO facilitates and coordinates the International Initiative for the Conservation and
sustainable Use of pollinators (ipi: http://www.internationalpollinatorsinitiative.org/), which
was established in 2000 by the Fifth conference of parties of the convention on Biological
diversity. one of the objectives of the ipi is to promote the conservation and the restoration
and sustainable use of pollinator diversity in agriculture and related ecosystems based upon the
four elements of the ipi plan of action: assessment, adaptive management, capacity building,
and mainstreaming. it is in this context that Fao commissioned in 2008 a literature review on
2
the topic of detecting and assessing pollination deficit in crops. this review study then served
as background for an expert workshop to identify methods for detection and assessment of
pollination deficit in crops and develop a practical yet efficient protocol to assess such deficits.
this Fao-sponsored workshop was held on 3-5 april 2008 nearby avignon, France, under the
auspices of inra (institut national de la recherche agronomique) with 13 participants from
around the world (Figure 1.1).
the workshop considered two perspectives that establish the context for a focus on
pollination deficits and human livelihoods: (i) from a pollinator perspective, pollination crises
appear increasingly likely, as evidence of pollinator declines become more and more apparent
in numerous locations; and (ii) from a plant perspective, there are many potential drivers of
increasing pollination deficits such as lack of compatible pollen for self-incompatible and
dioecious species, and reduced pollen production and/or poor pollen quality due to genotype
and its interaction with nutrient status, water deficits or other aspects of growing conditions.
climate change may be contributing to pollination deficit by affecting the phenology of both the
plant and its pollinators in different ways so as to lead to asynchrony, or reducing the durations
of pollinator activity and plant flowering.
the workshop then examined the definitions, concepts and theory of pollination deficits and
pollen limitation in broad terms. the context of ‘optimal pollination’ from a plant perspective
(fitness) is clearly different from that of a farmer’s perspective (agronomic or economic yield),
and also from the perspective of sustainable development (which may be more oriented toward
long-term sustainability and reliability depending on the area ; Figure 1.2). With this background,
the workshop participants agreed on the following definition: Crop pollination deficit refers
to inadequate pollen receipt that limits agricultural output. the review of the methods
used to assess pollination deficit in crops was based on 67 papers. the synthesis of this large
array of case studies was conducted along 3 axes: (i) the dependent variable(s) used to assess
pollination deficit (e.g. number of pollen tubes per style or pollen grains per stigma, fruit set,
seed set, fruit characteristics, or seeds characteristics); (ii) the experimental unit used in the
assay (a sample of flowers, of branches, a whole plant, a plot or a whole field or larger area); and
(iii) the demand of the crop, that is the intrinsic pollination need for optimal field productivity
based upon the sexual reproductive biology and physiology of the crop, the temporal scale of
the demand (duration of flowering: determinate versus undeterminate species), the spatial scale
of the demand (field size and landscape pattern), and the production strategy (e.g. off-season
production of covered crops). the main methodological problems and possible improvements
3
p r oto c o l t o d e t e c t a n d a s s e s s p o l l i n at i o n d e F i c i t s i n c r o p s : a h a n d B o o K F o r i t s U s e
© G
abri
el c
arré
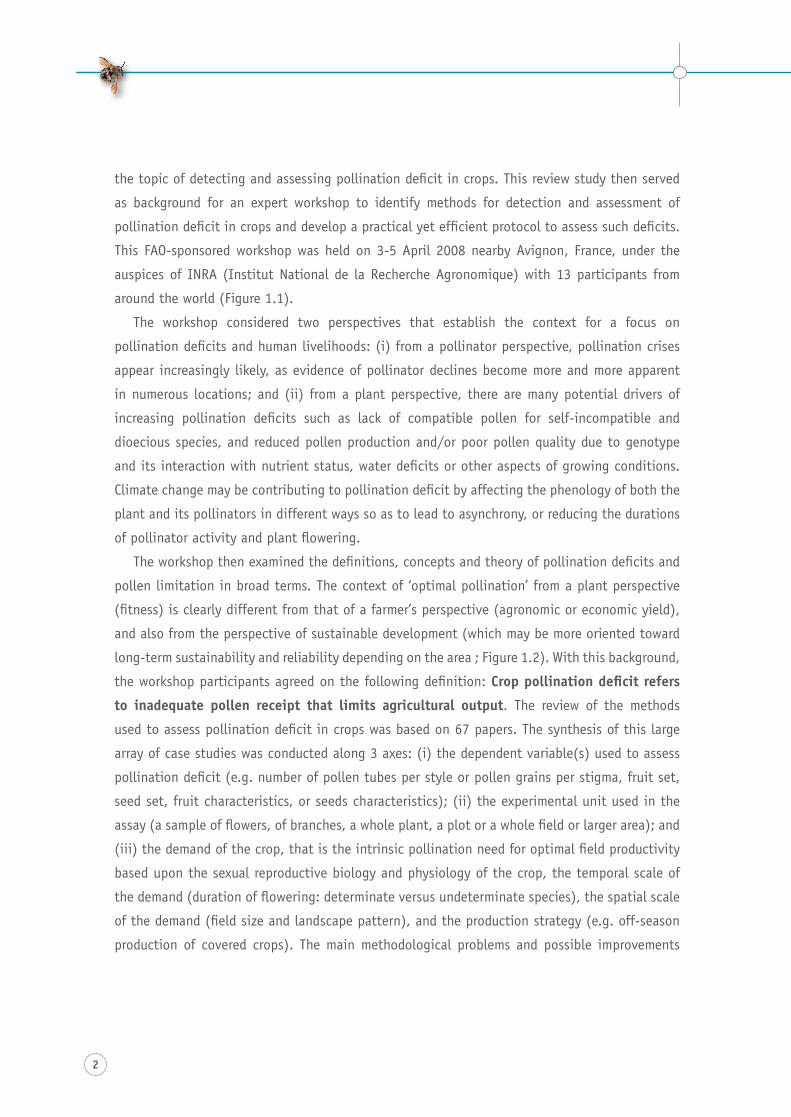
From left to right: jim Cane (USDA, Logan, Utah, USA), Resham Bahadur Thapa (Institute for Agriculture and Animal Sciences, Chitwan, Nepal), Paulo Eugênio Oliveira (Universidade Federal de Uberlândia, Brazil), jérôme Vandame (INRA Avignon, France), wanja Kinuthia (National Museums of Kenya, Nairobi, Kenya), Barbara Gemmill-Herren (FAO Rome, Italy), Simon Potts (University of Reading, UK), Bernard Vaissière (INRA Avignon, France), Linda Collette (FAO Rome, Italy), Ruan Veldtman (South African Biodiversity Institute, Cape Town, South Africa), Breno Freitas (Universidade Federal do Ceará, Fortaleza, Brazil), Natacha Chacoff (Centro Regional de Investigaciones Cientificas y Tecnológicas, Mendoza, Argentina).
Figure 1.1
PARTICIPANTS IN THE FAO-SPONSORED ExPERT wORKSHOP ON ASSESSING POLLINATION DEFICITS IN CROPS
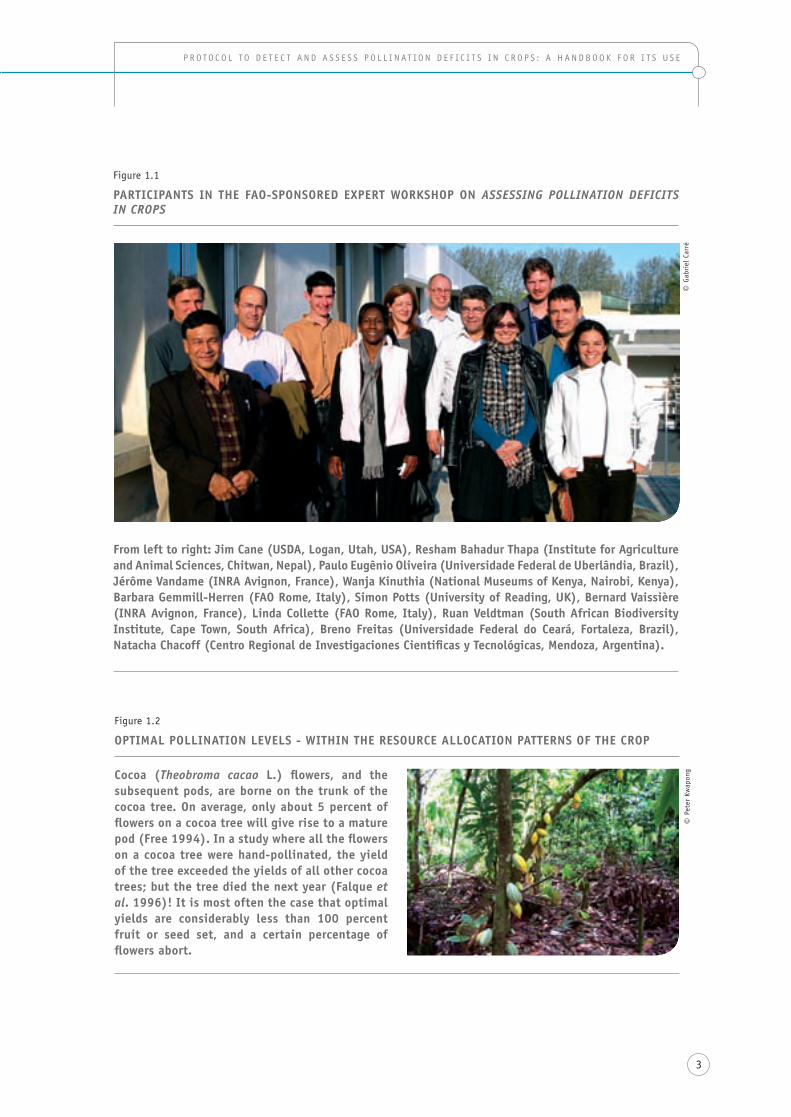
Figure 1.2
OPTIMAL POLLINATION LEVELS - wITHIN THE RESOURCE ALLOCATION PATTERNS OF THE CROP
© pe
ter
Kwap
ongCocoa (Theobroma cacao L.) flowers, and the
subsequent pods, are borne on the trunk of the cocoa tree. On average, only about 5 percent of flowers on a cocoa tree will give rise to a mature pod (Free 1994). In a study where all the flowers on a cocoa tree were hand-pollinated, the yield of the tree exceeded the yields of all other cocoa trees; but the tree died the next year (Falque et al. 1996)! It is most often the case that optimal yields are considerably less than 100 percent fruit or seed set, and a certain percentage of flowers abort.
4
in assessing pollination deficits were then reviewed with the clear goal to develop a practical
ready-to-use protocol that could be readily implemented to detect and assess pollination deficits
for the major crops in the seven countries that are taking part in the GeF/Unep/Fao project
on the “conservation and Management of pollinators for sustainable agriculture through an
ecosystem approach“ (Brazil, Ghana, india, Kenya, nepal, pakistan and south africa). it is
this protocol that has been refined, detailed and improved in concert with stakeholders and
end-users that is presented here.
5
p r oto c o l t o d e t e c t a n d a s s e s s p o l l i n at i o n d e F i c i t s i n c r o p s : a h a n d B o o K F o r i t s U s e
section 1DEFINITIONS AND CONCEPTUAL FRAMEwORK
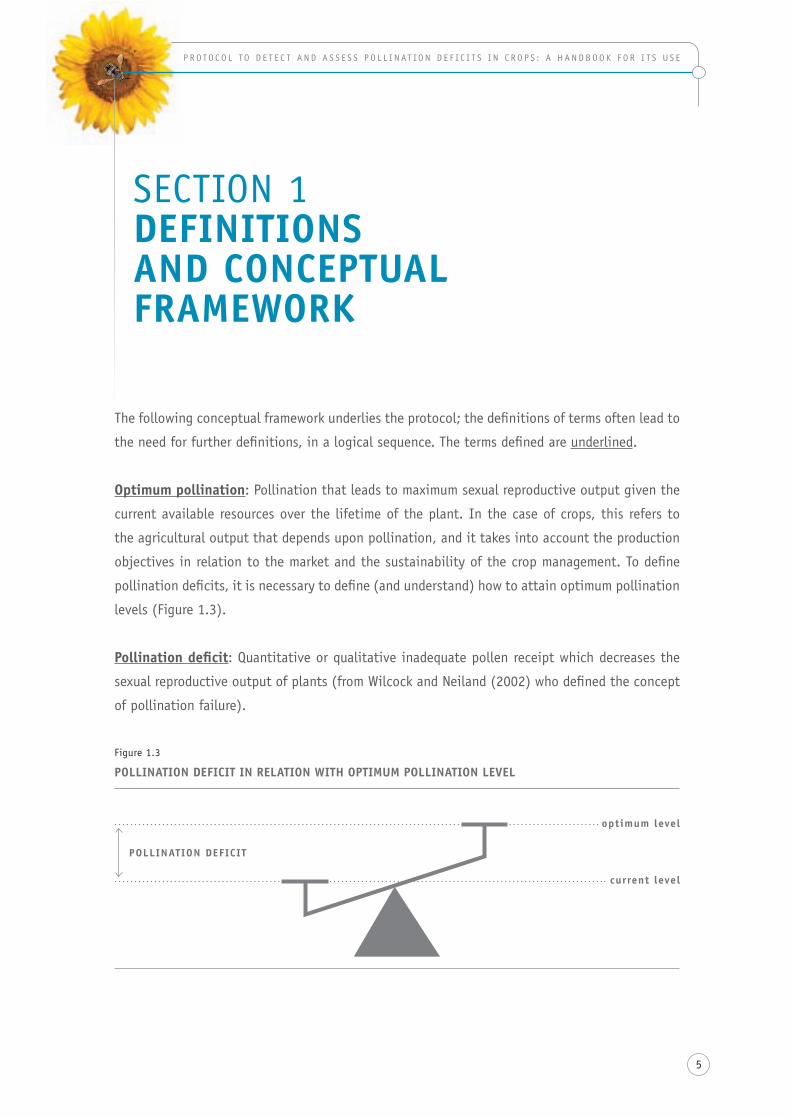
the following conceptual framework underlies the protocol; the definitions of terms often lead to
the need for further definitions, in a logical sequence. the terms defined are underlined.
Optimum pollination: pollination that leads to maximum sexual reproductive output given the
current available resources over the lifetime of the plant. in the case of crops, this refers to
the agricultural output that depends upon pollination, and it takes into account the production
objectives in relation to the market and the sustainability of the crop management. to define
pollination deficits, it is necessary to define (and understand) how to attain optimum pollination
levels (Figure 1.3).
Pollination deficit: Quantitative or qualitative inadequate pollen receipt which decreases the
sexual reproductive output of plants (from Wilcock and neiland (2002) who defined the concept
of pollination failure).
Figure 1.3
POLLINATION DEFICIT IN RELATION wITH OPTIMUM POLLINATION LEVEL
current level
optimum level
POLLINATION DEFICIT
S E C T I O N 1 . D E F I N I T I O N S A N D C O N C E P T U A L F R A M E w O R K
6
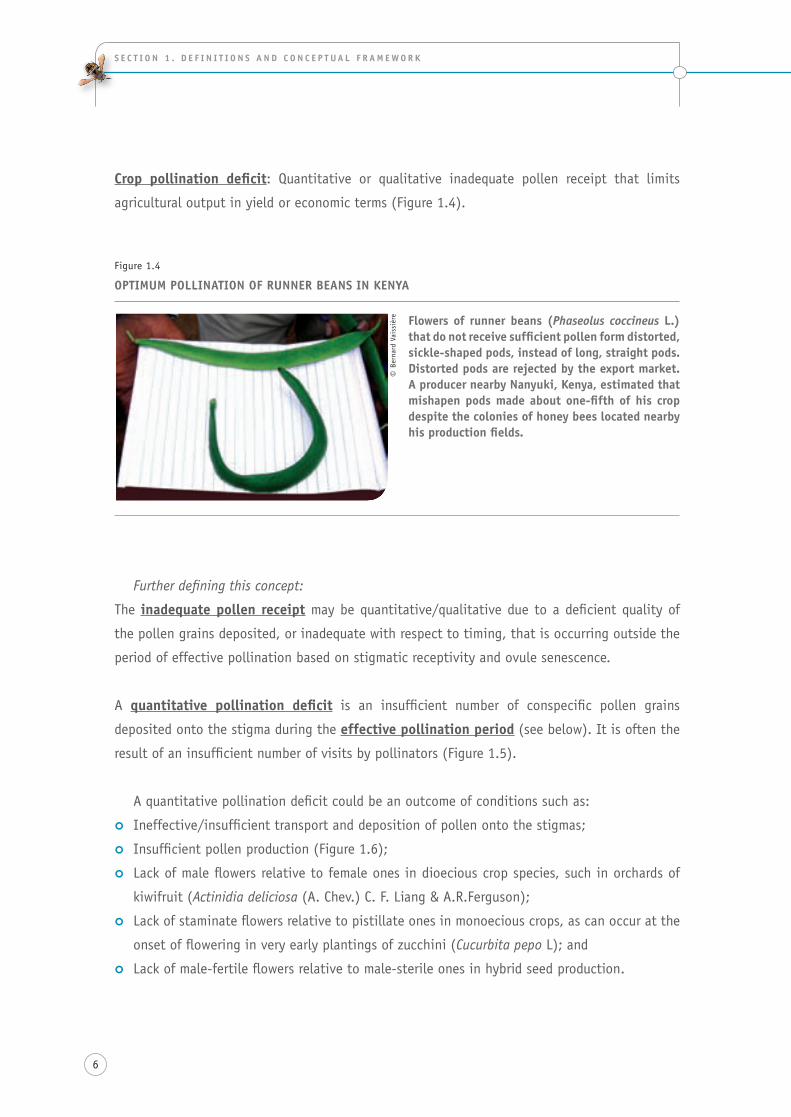
Crop pollination deficit: Quantitative or qualitative inadequate pollen receipt that limits
agricultural output in yield or economic terms (Figure 1.4).
Further defining this concept:
The inadequate pollen receipt may be quantitative/qualitative due to a deficient quality of
the pollen grains deposited, or inadequate with respect to timing, that is occurring outside the
period of effective pollination based on stigmatic receptivity and ovule senescence.
A quantitative pollination deficit is an insufficient number of conspecific pollen grains
deposited onto the stigma during the effective pollination period (see below). it is often the
result of an insufficient number of visits by pollinators (Figure 1.5).
a quantitative pollination deficit could be an outcome of conditions such as:
|| ineffective/insufficient transport and deposition of pollen onto the stigmas;
||insufficient pollen production (Figure 1.6);
lack of male flowers relative to female ones in dioecious crop species, such in orchards of ||
kiwifruit (Actinidia deliciosa (a. chev.) c. F. liang & a.r.Ferguson);
|| lack of staminate flowers relative to pistillate ones in monoecious crops, as can occur at the
onset of flowering in very early plantings of zucchini (Cucurbita pepo l); and
|| lack of male-fertile flowers relative to male-sterile ones in hybrid seed production.
Flowers of runner beans (Phaseolus coccineus L.) that do not receive sufficient pollen form distorted, sickle-shaped pods, instead of long, straight pods. Distorted pods are rejected by the export market. A producer nearby Nanyuki, Kenya, estimated that mishapen pods made about one-fifth of his crop despite the colonies of honey bees located nearby his production fields.
© B
erna
rd V
aiss
ière
Figure 1.4
OPTIMUM POLLINATION OF RUNNER BEANS IN KENyA
7
p r oto c o l t o d e t e c t a n d a s s e s s p o l l i n at i o n d e F i c i t s i n c r o p s : a h a n d B o o K F o r i t s U s e
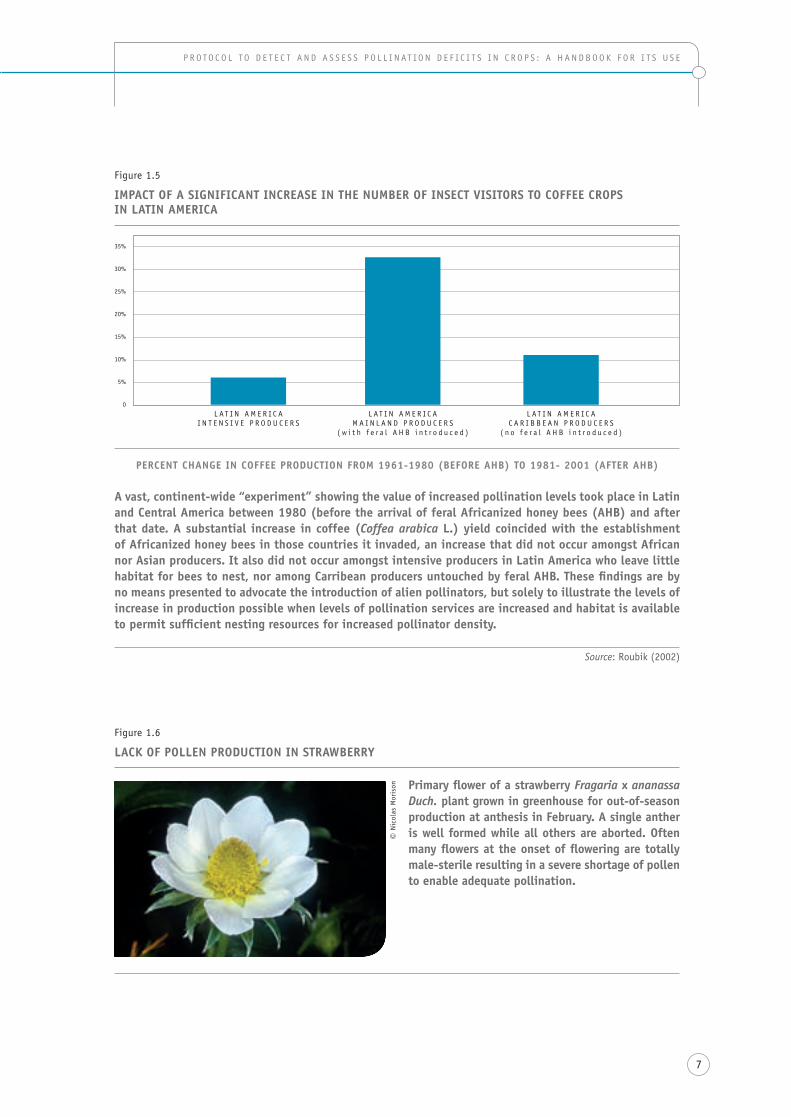
PERCENT CHANGE IN COFFEE PRODUCTION FROM 1961-1980 (BEFORE AHB) TO 1981- 2001 (AFTER AHB)
A vast, continent-wide “experiment” showing the value of increased pollination levels took place in Latin and Central America between 1980 (before the arrival of feral Africanized honey bees (AHB) and after that date. A substantial increase in coffee (Coffea arabica L.) yield coincided with the establishment of Africanized honey bees in those countries it invaded, an increase that did not occur amongst African nor Asian producers. It also did not occur amongst intensive producers in Latin America who leave little habitat for bees to nest, nor among Carribean producers untouched by feral AHB. These findings are by no means presented to advocate the introduction of alien pollinators, but solely to illustrate the levels of increase in production possible when levels of pollination services are increased and habitat is available to permit sufficient nesting resources for increased pollinator density.
Source: roubik (2002)
Figure 1.5
IMPACT OF A SIGNIFICANT INCREASE IN THE NUMBER OF INSECT VISITORS TO COFFEE CROPS IN LATIN AMERICA
35%
30%
25%
20%
15%
10%
5%
0
l at i n a M e r i c ai n t e n s i v e p r o d U c e r s
l at i n a M e r i c aM a i n l a n d p r o d U c e r s
( w i t h f e r a l a h B i n t r o d u c e d )
l at i n a M e r i c ac a r i B B e a n p r o d U c e r s
( n o f e r a l a h B i n t r o d u c e d )
Figure 1.6
LACK OF POLLEN PRODUCTION IN STRAwBERRy
© n
icol
as M
oris
on Primary flower of a strawberry Fragaria x ananassa Duch. plant grown in greenhouse for out-of-season production at anthesis in February. A single anther is well formed while all others are aborted. Often many flowers at the onset of flowering are totally male-sterile resulting in a severe shortage of pollen to enable adequate pollination.
S E C T I O N 1 . D E F I N I T I O N S A N D C O N C E P T U A L F R A M E w O R K
8
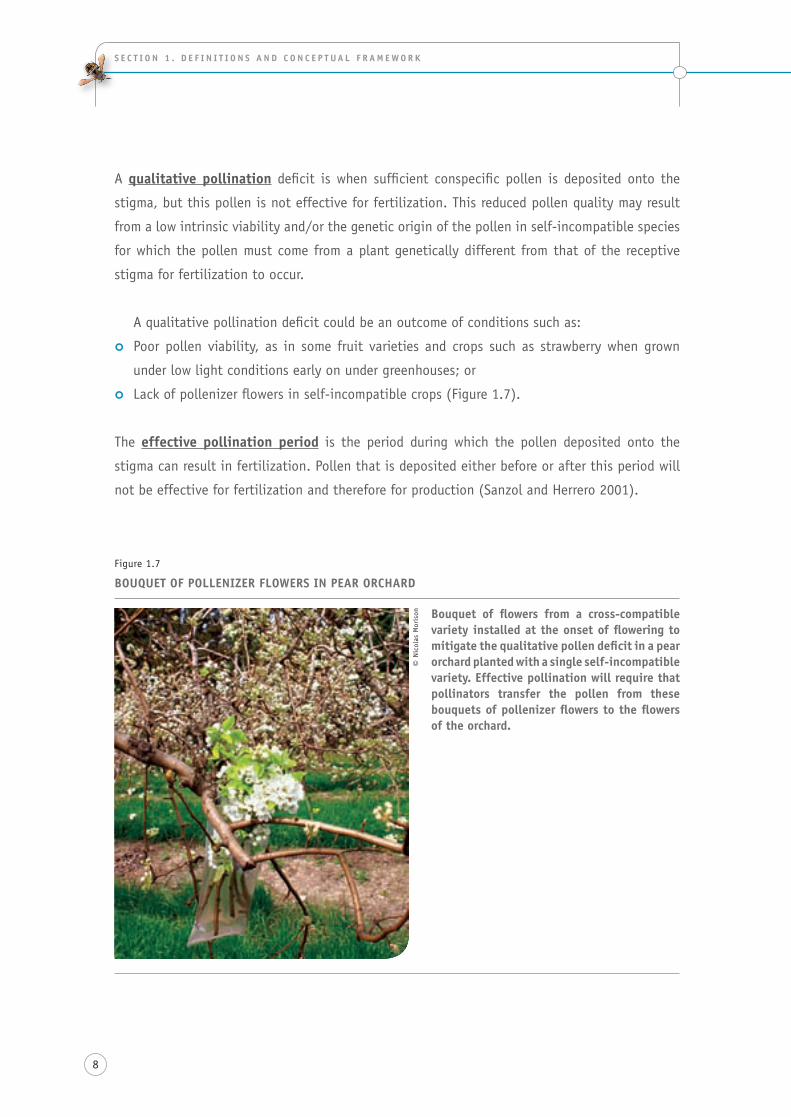
A qualitative pollination deficit is when sufficient conspecific pollen is deposited onto the
stigma, but this pollen is not effective for fertilization. this reduced pollen quality may result
from a low intrinsic viability and/or the genetic origin of the pollen in self-incompatible species
for which the pollen must come from a plant genetically different from that of the receptive
stigma for fertilization to occur.
a qualitative pollination deficit could be an outcome of conditions such as:
|| poor pollen viability, as in some fruit varieties and crops such as strawberry when grown
under low light conditions early on under greenhouses; or
|| lack of pollenizer flowers in self-incompatible crops (Figure 1.7).
The effective pollination period is the period during which the pollen deposited onto the
stigma can result in fertilization. pollen that is deposited either before or after this period will
not be effective for fertilization and therefore for production (sanzol and herrero 2001).
Bouquet of flowers from a cross-compatible variety installed at the onset of flowering to mitigate the qualitative pollen deficit in a pear orchard planted with a single self-incompatible variety. Effective pollination will require that pollinators transfer the pollen from these bouquets of pollenizer flowers to the flowers of the orchard.
© n
icol
as M
oris
on
Figure 1.7
BOUQUET OF POLLENIZER FLOwERS IN PEAR ORCHARD
9
p r oto c o l t o d e t e c t a n d a s s e s s p o l l i n at i o n d e F i c i t s i n c r o p s : a h a n d B o o K F o r i t s U s e
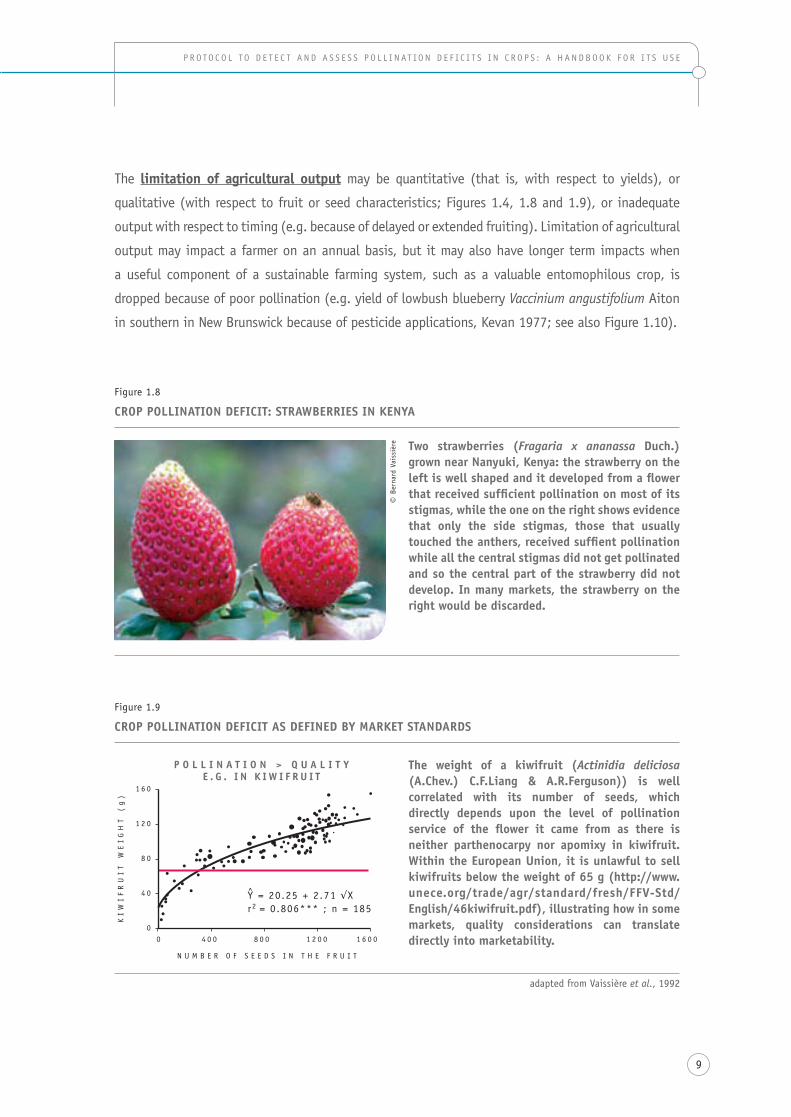
The limitation of agricultural output may be quantitative (that is, with respect to yields), or
qualitative (with respect to fruit or seed characteristics; Figures 1.4, 1.8 and 1.9), or inadequate
output with respect to timing (e.g. because of delayed or extended fruiting). limitation of agricultural
output may impact a farmer on an annual basis, but it may also have longer term impacts when
a useful component of a sustainable farming system, such as a valuable entomophilous crop, is
dropped because of poor pollination (e.g. yield of lowbush blueberry Vaccinium angustifolium Aiton
in southern in new Brunswick because of pesticide applications, Kevan 1977; see also Figure 1.10).
Figure 1.8
CROP POLLINATION DEFICIT: STRAwBERRIES IN KENyA
© B
erna
rd V
aiss
ière
The weight of a kiwifruit (Actinidia deliciosa (A.Chev.) C.F.Liang & A.R.Ferguson)) is well correlated with its number of seeds, which directly depends upon the level of pollination service of the flower it came from as there is neither parthenocarpy nor apomixy in kiwifruit. within the European Union, it is unlawful to sell kiwifruits below the weight of 65 g (http://www.unece.org/trade/agr/standard/fresh/FFV-Std/English/46kiwifruit.pdf), illustrating how in some markets, quality considerations can translate directly into marketability.
Two strawberries (Fragaria x ananassa Duch.) grown near Nanyuki, Kenya: the strawberry on the left is well shaped and it developed from a flower that received sufficient pollination on most of its stigmas, while the one on the right shows evidence that only the side stigmas, those that usually touched the anthers, received suffient pollination while all the central stigmas did not get pollinated and so the central part of the strawberry did not develop. In many markets, the strawberry on the right would be discarded.
adapted from vaissière et al., 1992
Ki
Wi
Fr
Ui
t
We
iG
ht
(
g)
n U M B e r o F s e e d s i n t h e F r U i t
P O L L I N A T I O N > Q U A L I T yE . G . I N K I w I F R U I T
0 4 0 0 8 0 0 1 2 0 0 1 6 0 0
1 6 0
1 2 0
8 0
4 0
0
Y = 20.25 + 2.71 √Xr2 = 0.806*** ; n = 185
Figure 1.9
CROP POLLINATION DEFICIT AS DEFINED By MARKET STANDARDS
S E C T I O N 1 . D E F I N I T I O N S A N D C O N C E P T U A L F R A M E w O R K
10
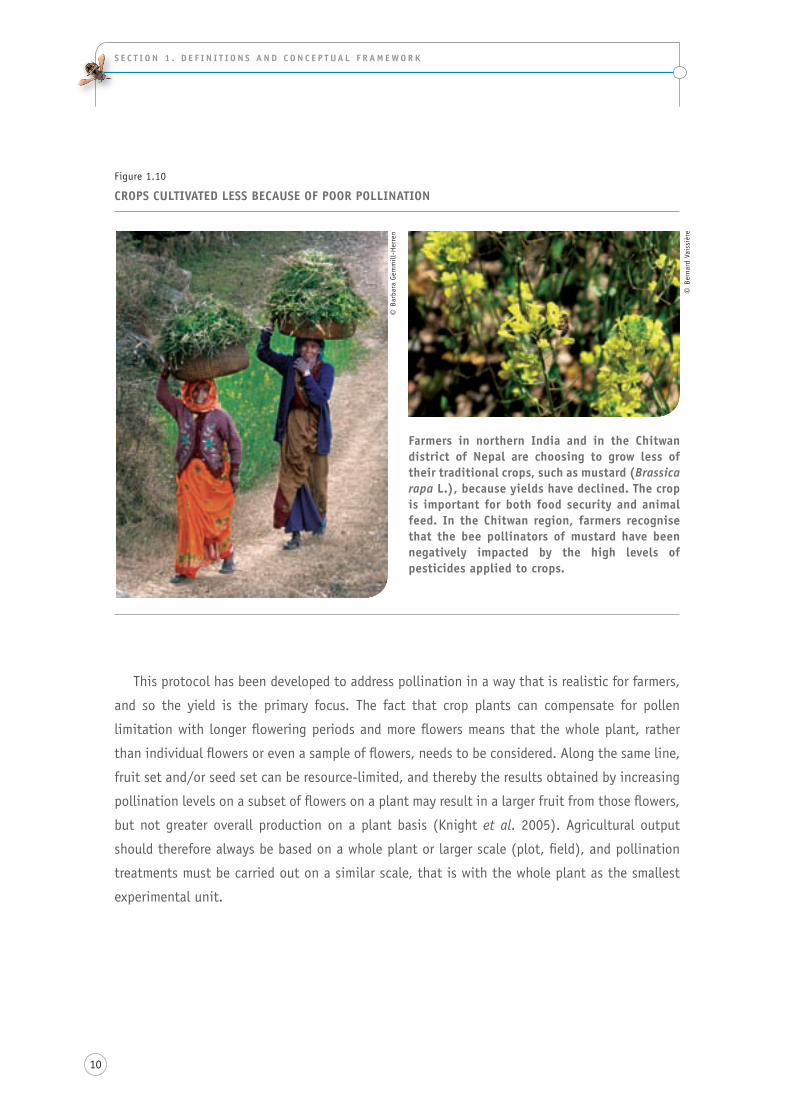
Figure 1.10
CROPS CULTIVATED LESS BECAUSE OF POOR POLLINATION
Farmers in northern India and in the Chitwan district of Nepal are choosing to grow less of their traditional crops, such as mustard (Brassica rapa L.), because yields have declined. The crop is important for both food security and animal feed. In the Chitwan region, farmers recognise that the bee pollinators of mustard have been negatively impacted by the high levels of pesticides applied to crops.
© B
arba
ra G
emm
ill-
her
ren
© B
erna
rd V
aiss
ière
this protocol has been developed to address pollination in a way that is realistic for farmers,
and so the yield is the primary focus. the fact that crop plants can compensate for pollen
limitation with longer flowering periods and more flowers means that the whole plant, rather
than individual flowers or even a sample of flowers, needs to be considered. along the same line,
fruit set and/or seed set can be resource-limited, and thereby the results obtained by increasing
pollination levels on a subset of flowers on a plant may result in a larger fruit from those flowers,
but not greater overall production on a plant basis (Knight et al. 2005). agricultural output
should therefore always be based on a whole plant or larger scale (plot, field), and pollination
treatments must be carried out on a similar scale, that is with the whole plant as the smallest
experimental unit.
11
p r oto c o l t o d e t e c t a n d a s s e s s p o l l i n at i o n d e F i c i t s i n c r o p s : a h a n d B o o K F o r i t s U s e
section 2 PROTOCOL OBjECTIVE AND STRUCTURE
the protocol aims at applying methods following a standard experimental design to assess the degree
to which pollination is a limiting factor in the production of a focal crop at the field scale. comparing
crop responses under pollination levels resulting from current practices with those from enhanced
pollinator abundance or diversity will indicate the presence, and degree, of a pollination deficit.
the protocol is structured as a hypothesis that there is a relationship between the pollination
level X, the independent variable, and a part or the whole of crop yield Y, the dependent variable,
as reflected in the following equation and overview of parameters.
Y = F (X) + a
where:
|| Y is the total crop yield measured in agronomic or economic units;
F(X) is the yield resulting from the level of pollination service X, and is measured in the same ||
unit as Y; and a is the yield resulting from autonomous self-pollination and wind pollination
measured in the same unit as Y (Figure 2.1).
the pollination level is critical for the yield for all crops in which the output is a product of
sexual reproduction. But, unless the precise relationship between the yield and the number and
genetic diversity of pollen grains that reach the stigma during the effective pollination period is
known, it is not possible to quantify directly the optimum level of pollination service needed to
achieve maximum sustainable output. it then becomes necessary to use alternate variables as
proxies to assess this level of pollination. assuming that the main pollinating species are known
among the floral visitors, such proxies include pollinator density (number of pollinators/floral
unit) and pollinator diversity.
S E C T I O N 2 . P R O T O C O L O B j E C T I V E A N D S T R U C T U R E
12
Figure 2.1
RELATIONSHIP BETwEEN POLLINATION LEVEL AND CROP yIELD
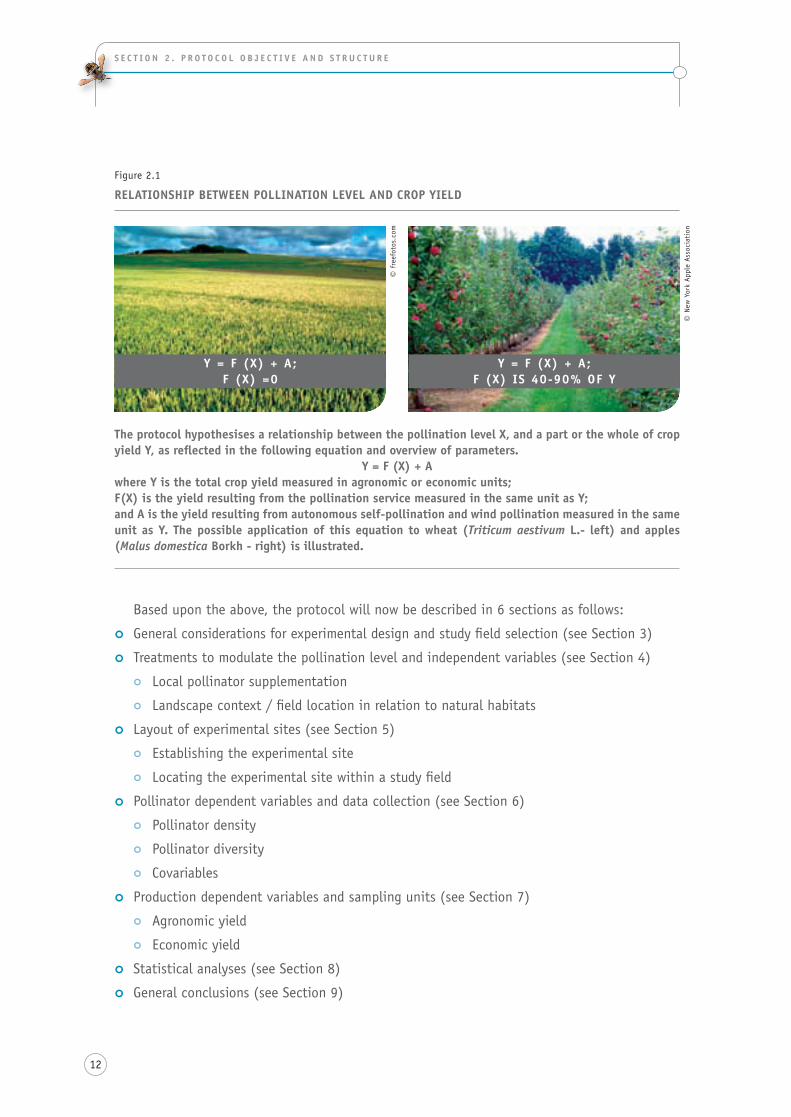
The protocol hypothesises a relationship between the pollination level x, and a part or the whole of crop yield y, as reflected in the following equation and overview of parameters.
y = F (x) + Awhere y is the total crop yield measured in agronomic or economic units;F(x) is the yield resulting from the pollination service measured in the same unit as y; and A is the yield resulting from autonomous self-pollination and wind pollination measured in the same unit as y. The possible application of this equation to wheat (Triticum aestivum L.- left) and apples (Malus domestica Borkh - right) is illustrated.
© fr
eefo
tos.
com
y = F (x) + A;F (x) =0
© n
ew Y
ork
appl
e as
soci
atio
n
y = F (x) + A;F (x) IS 40-90% OF y
Based upon the above, the protocol will now be described in 6 sections as follows:
General considerations for experimental design and study field selection (see section 3)||
treatments to modulate the pollination level and independent variables (see section 4)||
|| local pollinator supplementation
|| landscape context / field location in relation to natural habitats
|| layout of experimental sites (see section 5)
|| establishing the experimental site
|| locating the experimental site within a study field
|| pollinator dependent variables and data collection (see section 6)
|| Pollinator density
|| Pollinator diversity
|| covariables
|| production dependent variables and sampling units (see section 7)
Agronomic yield||
Economic yield||
|| statistical analyses (see section 8)
General conclusions (see section 9)||
13
p r oto c o l t o d e t e c t a n d a s s e s s p o l l i n at i o n d e F i c i t s i n c r o p s : a h a n d B o o K F o r i t s U s e
section 3 GENERAL CONSIDERATIONS FOR ExPERIMENTAL DESIGN & STUDy FIELD SELECTION
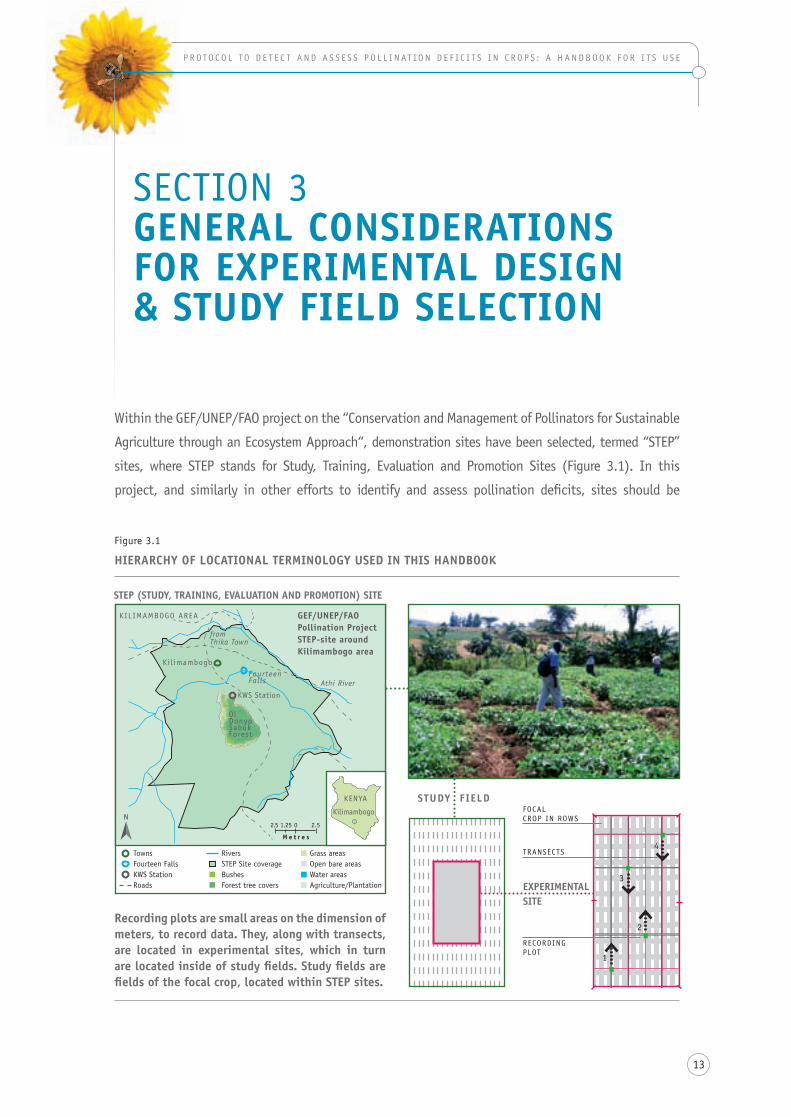
Within the GeF/Unep/Fao project on the “conservation and Management of pollinators for sustainable
agriculture through an ecosystem approach“, demonstration sites have been selected, termed “step”
sites, where step stands for study, training, evaluation and promotion sites (Figure 3.1). in this
project, and similarly in other efforts to identify and assess pollination deficits, sites should be
Figure 3.1
HIERARCHy OF LOCATIONAL TERMINOLOGy USED IN THIS HANDBOOK
Recording plots are small areas on the dimension of meters, to record data. They, along with transects, are located in experimental sites, which in turn are located inside of study fields. Study fields are fields of the focal crop, located within STEP sites.
STEP (STUDy, TRAINING, EVALUATION AND PROMOTION) SITE
STUDy FIELD
ExPERIMENTALSITE
FOCAl crop in roWs
recordinGPlOT
TRANsECTs4
3
2
1
GEF/UNEP/FAO Pollination Project STEP-site around Kilimambogo area
N
TownsFourteen FallsKWs stationRoads
RiverssTEP site coverageBushesForest tree covers
Grass areasopen bare areasWater areasagriculture/plantation
2.5 1.25 0 2.5
M e t r e s
Ol donyosabuk Forest
from Thika Town
Athi RiverFourteen Fal l s
Ki l imambogo
KWs station
Kilimambogo
KiliMaMBoGo area
KenYa
S E C T I O N 3 . G E N E R A L C O N S I D E R AT I O N S F O R E x P E R I M E N TA L D E S I G N & S T U D y F I E L D S E L E C T I O N
14
identified where farmers are growing pollinator-dependent crops under a range of conditions that
lend themselves to making comparisons. such sites can be used to implement a protocol to detect
and assess pollination deficits with the goal that farmers can be involved in the study, and the results
can be useful to raise the awareness about the significance of pollinators in farming communities and
also promote the use of pollinator-friendly practices. thus the protocol has to be straightforward and
address pollination in a way that is realistic to farmers. to this end, the use of dependent variables
such as the number of pollen grains per stigma for self-compatible species or the number of pollen
tubes per style for self-incompatible ones was not considered. rather yield, whether the agronomic
yield or the economic yield, is the primary focus so that, as indicated above, the whole plant is the
smallest experimental unit possible to avoid the confounding effects of plant response and resource
allocation. however, such an experimental unit has its drawbacks and it prevents the use of hand
pollination as a way to achieve maximum pollination because it is practically impossible to hand
pollinate all the flowers of a plant. the pollination treatment to assess deficits will therefore have
to be done indirectly by manipulating the pollinator fauna. the use of screen cages or enclosures in
general is a common way to easily control the number of pollinators onto one or several plants at once
with several replicates possible per treatment (e.g. steffan-dewenter 2003). the use of enclosures,
however, was not considered here either because of their cost and the fact that they modify the
microclimatic conditions, such as humidity, air flow and solar radiation, and therefore photosynthesis
which can lead to the reduction of assimilate availability and lower seed set (Bouwmeester and smig
Figure 3.2
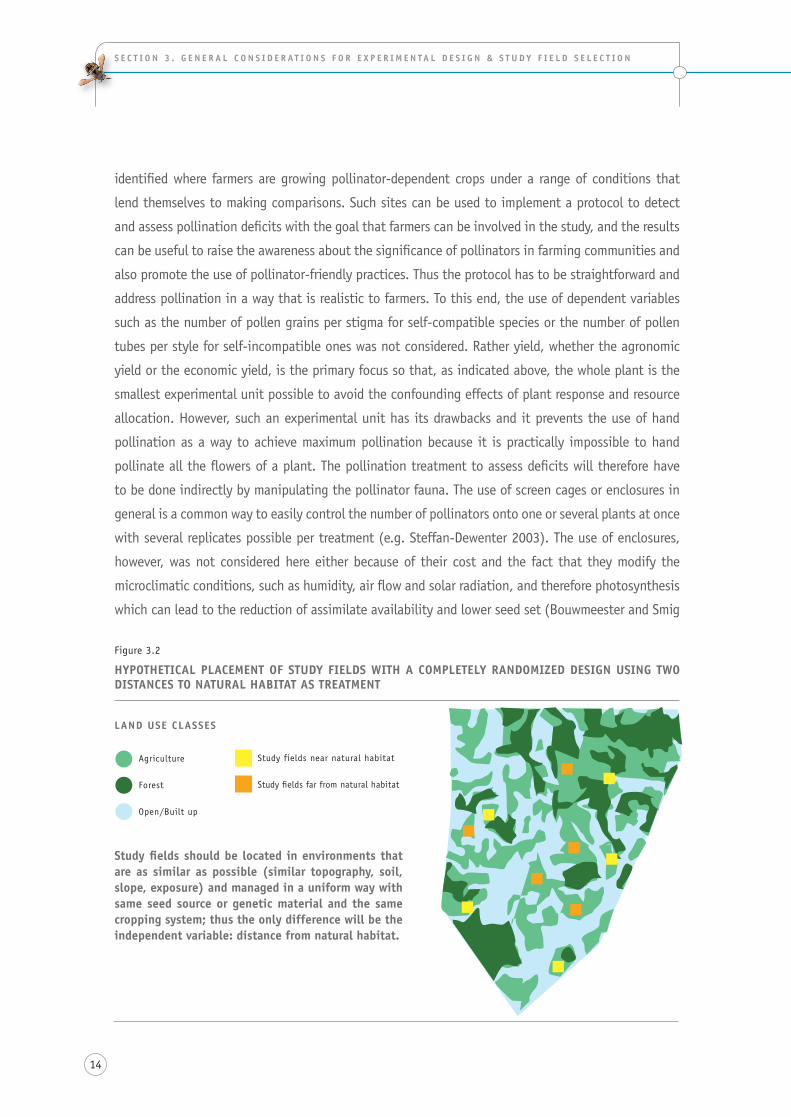
HyPOTHETICAL PLACEMENT OF STUDy FIELDS wITH A COMPLETELy RANDOMIZED DESIGN USING TwO DISTANCES TO NATURAL HABITAT AS TREATMENT
Study fields should be located in environments that are as similar as possible (similar topography, soil, slope, exposure) and managed in a uniform way with same seed source or genetic material and the same cropping system; thus the only difference will be the independent variable: distance from natural habitat.
LAND USE CLASSES
Agriculture
Forest
open/Built up
study fields near natural habitat
study fields far from natural habitat
15
p r oto c o l t o d e t e c t a n d a s s e s s p o l l i n at i o n d e F i c i t s i n c r o p s : a h a n d B o o K F o r i t s U s e
1995). in addition, they also eliminate access to alternate floral sources so that pollinator behavior
is considerably altered compared to their foraging in the open (e.g. honey bees will visit and pollinate
tomato flowers under closed greenhouses, which hardly ever takes place in the open; Banda and
paxton 1991). For this reason, the protocol as presented here is designed to be used in fields in the
open. it relies on free flying pollinating species with the constraint that pollinator treatment will
act at the level of the foraging area of these species, which may commonly extend over at least 1
to 2 km radius, though pollinator density will clearly not be uniform over this range. For this reason,
individual study fields should always be separated from each other by a distance at least equal to
2 km and if possible greater than the maximum modal foraging distance of the managed pollinator
species used (2 to 3 km for social bees such as honey bees and bumble bees – Buchmann and
shipman 1991; steffan-dewenter and tscharntke 2000; osborne et al. 2008). in the case of solitary
bees, the maximum foraging distance can range from 1.2 km for small bees (Beil et al. 2008) up to 6
km for large carpenter bees such as Xylocopa flavorufa (pasquet et al. 2008).
For randomized designs where comparisons will be made between study fields, these should
be located in environments that are as similar as possible (similar topography, soil, slope,
exposure), and also managed in a uniform way (same seed source or same genetic material, same
cropping system) with the exception of the one factor being manipulated between sites, such as
the introduction of pollinators to complement the local fauna or the distance to natural habitat
(Figure 3.2). if two factors are being manipulated, a factorial design is required (Figure 3.3).
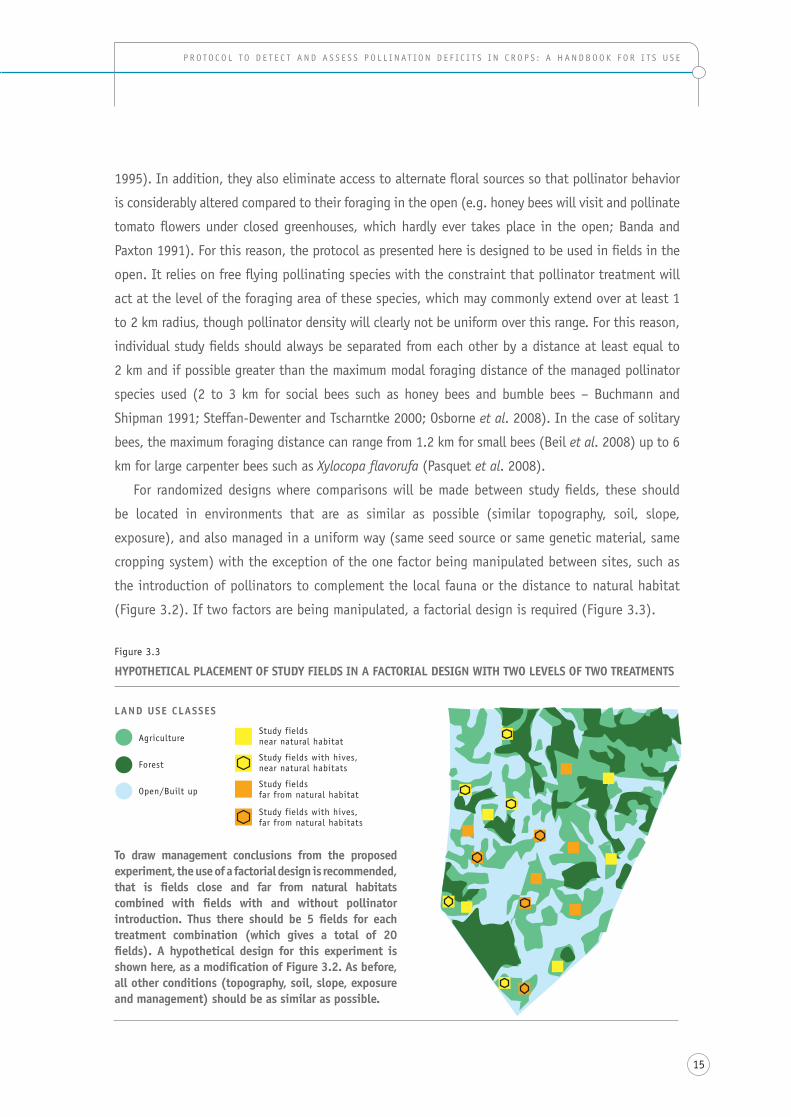
Figure 3.3
HyPOTHETICAL PLACEMENT OF STUDy FIELDS IN A FACTORIAL DESIGN wITH TwO LEVELS OF TwO TREATMENTS
To draw management conclusions from the proposed experiment, the use of a factorial design is recommended, that is fields close and far from natural habitats combined with fields with and without pollinator introduction. Thus there should be 5 fields for each treatment combination (which gives a total of 20 fields). A hypothetical design for this experiment is shown here, as a modification of Figure 3.2. As before, all other conditions (topography, soil, slope, exposure and management) should be as similar as possible.
Agriculture
Forest
open/Built up
LAND USE CLASSES
study fields near natural habitat
study fields with hives,near natural habitats
study fields far from natural habitat
study fields with hives, far from natural habitats
S E C T I O N 3 . G E N E R A L C O N S I D E R AT I O N S F O R E x P E R I M E N TA L D E S I G N & S T U D y F I E L D S E L E C T I O N
16
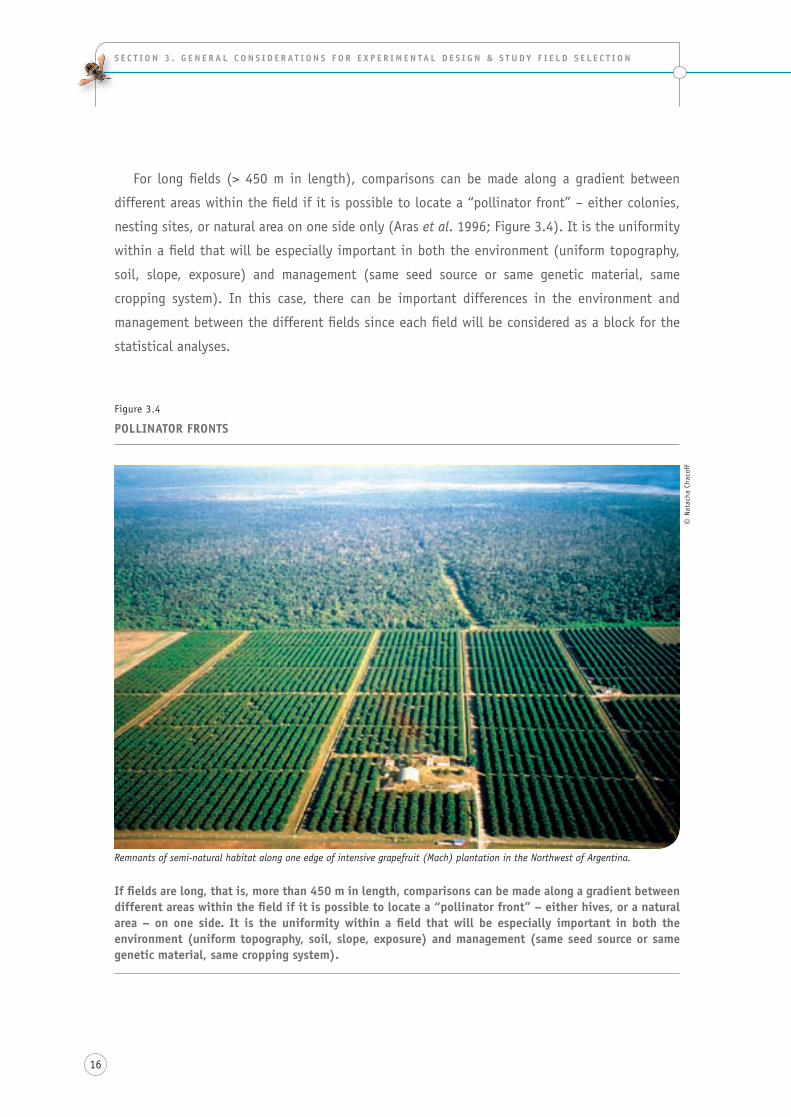
For long fields (> 450 m in length), comparisons can be made along a gradient between
different areas within the field if it is possible to locate a “pollinator front” – either colonies,
nesting sites, or natural area on one side only (aras et al. 1996; Figure 3.4). it is the uniformity
within a field that will be especially important in both the environment (uniform topography,
soil, slope, exposure) and management (same seed source or same genetic material, same
cropping system). in this case, there can be important differences in the environment and
management between the different fields since each field will be considered as a block for the
statistical analyses.
© N
atac
ha C
haco
ff
Figure 3.4
POLLINATOR FRONTS
If fields are long, that is, more than 450 m in length, comparisons can be made along a gradient between different areas within the field if it is possible to locate a “pollinator front” – either hives, or a natural area – on one side. It is the uniformity within a field that will be especially important in both the environment (uniform topography, soil, slope, exposure) and management (same seed source or same genetic material, same cropping system).
Remnants of semi-natural habitat along one edge of intensive grapefruit (Mach) plantation in the Northwest of Argentina.
17
p r oto c o l t o d e t e c t a n d a s s e s s p o l l i n at i o n d e F i c i t s i n c r o p s : a h a n d B o o K F o r i t s U s e
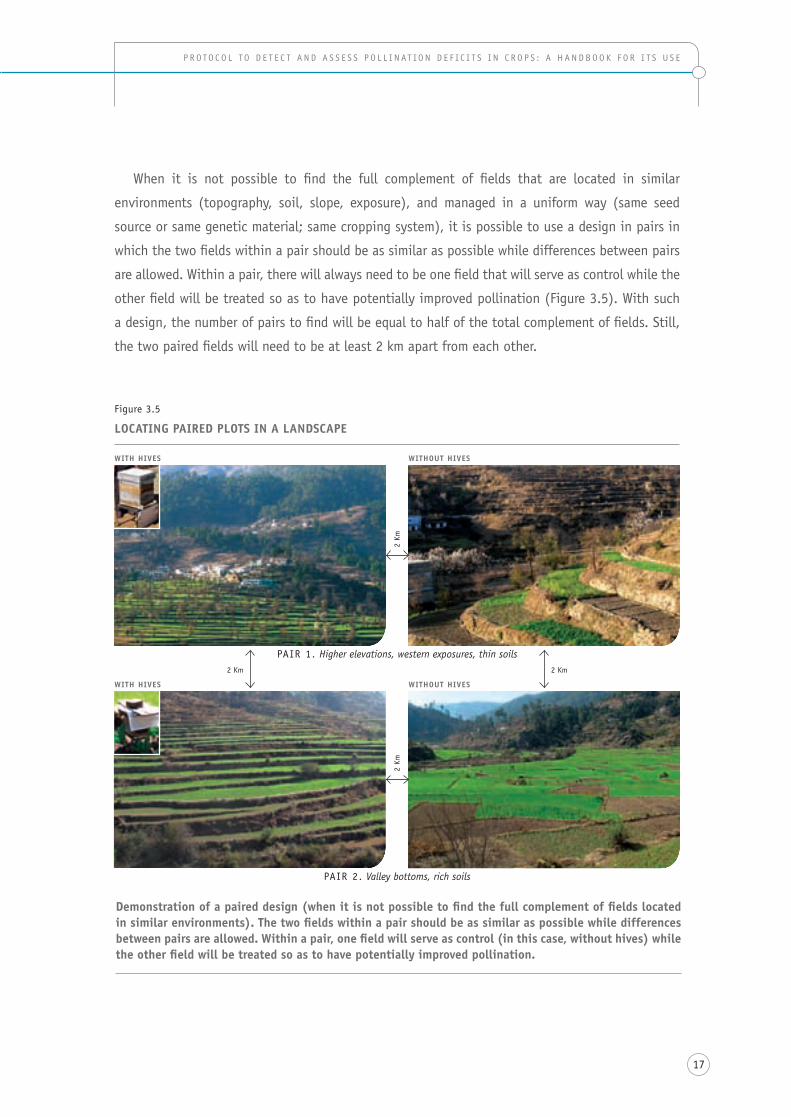
When it is not possible to find the full complement of fields that are located in similar
environments (topography, soil, slope, exposure), and managed in a uniform way (same seed
source or same genetic material; same cropping system), it is possible to use a design in pairs in
which the two fields within a pair should be as similar as possible while differences between pairs
are allowed. Within a pair, there will always need to be one field that will serve as control while the
other field will be treated so as to have potentially improved pollination (Figure 3.5). With such
a design, the number of pairs to find will be equal to half of the total complement of fields. still,
the two paired fields will need to be at least 2 km apart from each other.
Figure 3.5
LOCATING PAIRED PLOTS IN A LANDSCAPE
Demonstration of a paired design (when it is not possible to find the full complement of fields located in similar environments). The two fields within a pair should be as similar as possible while differences between pairs are allowed. within a pair, one field will serve as control (in this case, without hives) while the other field will be treated so as to have potentially improved pollination.
wITH HIVES wITHOUT HIVES
2 Km
pair 1. Higher elevations, western exposures, thin soils2 Km
wITH HIVES wITHOUT HIVES
2 Km
pair 2. Valley bottoms, rich soils
2 Km
S E C T I O N 3 . G E N E R A L C O N S I D E R AT I O N S F O R E x P E R I M E N TA L D E S I G N & S T U D y F I E L D S E L E C T I O N
18
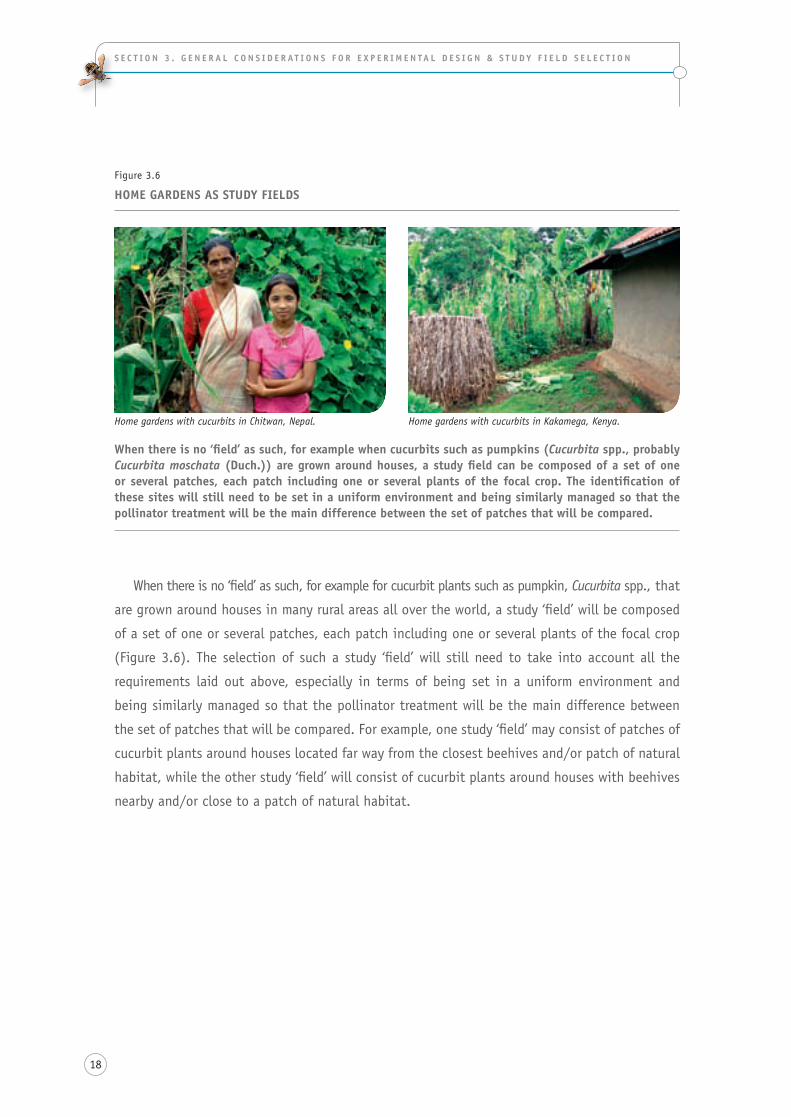
When there is no ‘field’ as such, for example for cucurbit plants such as pumpkin, Cucurbita spp., that
are grown around houses in many rural areas all over the world, a study ‘field’ will be composed
of a set of one or several patches, each patch including one or several plants of the focal crop
(Figure 3.6). the selection of such a study ‘field’ will still need to take into account all the
requirements laid out above, especially in terms of being set in a uniform environment and
being similarly managed so that the pollinator treatment will be the main difference between
the set of patches that will be compared. For example, one study ‘field’ may consist of patches of
cucurbit plants around houses located far way from the closest beehives and/or patch of natural
habitat, while the other study ‘field’ will consist of cucurbit plants around houses with beehives
nearby and/or close to a patch of natural habitat.
Figure 3.6
HOME GARDENS AS STUDy FIELDS
when there is no ‘field’ as such, for example when cucurbits such as pumpkins (Cucurbita spp., probably Cucurbita moschata (Duch.)) are grown around houses, a study field can be composed of a set of one or several patches, each patch including one or several plants of the focal crop. The identification of these sites will still need to be set in a uniform environment and being similarly managed so that the pollinator treatment will be the main difference between the set of patches that will be compared.
Home gardens with cucurbits in Chitwan, Nepal. Home gardens with cucurbits in Kakamega, Kenya.
19
p r oto c o l t o d e t e c t a n d a s s e s s p o l l i n at i o n d e F i c i t s i n c r o p s : a h a n d B o o K F o r i t s U s e
sECTION 4 TREATMENTS TO VARy THE LEVEL OF POLLINATION SERVICE
improved pollination can result from improved pollen transport, deposition and fertilization
effectiveness. hand pollination would be the obvious method to achieve full control of the amount,
viability and origin of the pollen used for pollination. however, for most crops it is essentially
impossible to undertake hand pollination at the whole plant scale. in order to achieve improved
pollination, there are still many other possible approaches. a few of them are considered here
in that they are simple, can be applied over a wide range of situations and are amenable to
manipulation over a short time scale for experimental purposes. For each, the pros and cons,
and the implementation modalities are examined below. those applying the protocol can select
amongst these treatments to attain potentially improved pollination. these treatments are:
4.A POLLINATOR (BEE) SUPPLEMENTATIONMost crops are pollinated by bees, especially honey bees (Klein et al. 2007; rader et al. 2009).
eusocial bees, such as honey bees – whether Western honey bees (Apis mellifera l.) or eastern honey
bees (Apis cerana F.) – as well as bumble bees such as Bombus terrestris, and solitary gregarious
species such as leafcutter bees (Megachile rotundata) and mason bees (Osmia spp.) have been
domesticated and their nests can be moved around for crop pollination (delaplane and Mayer 2000).
it is therefore possible to supplement the local pollinator fauna by introducing colonies, nests or
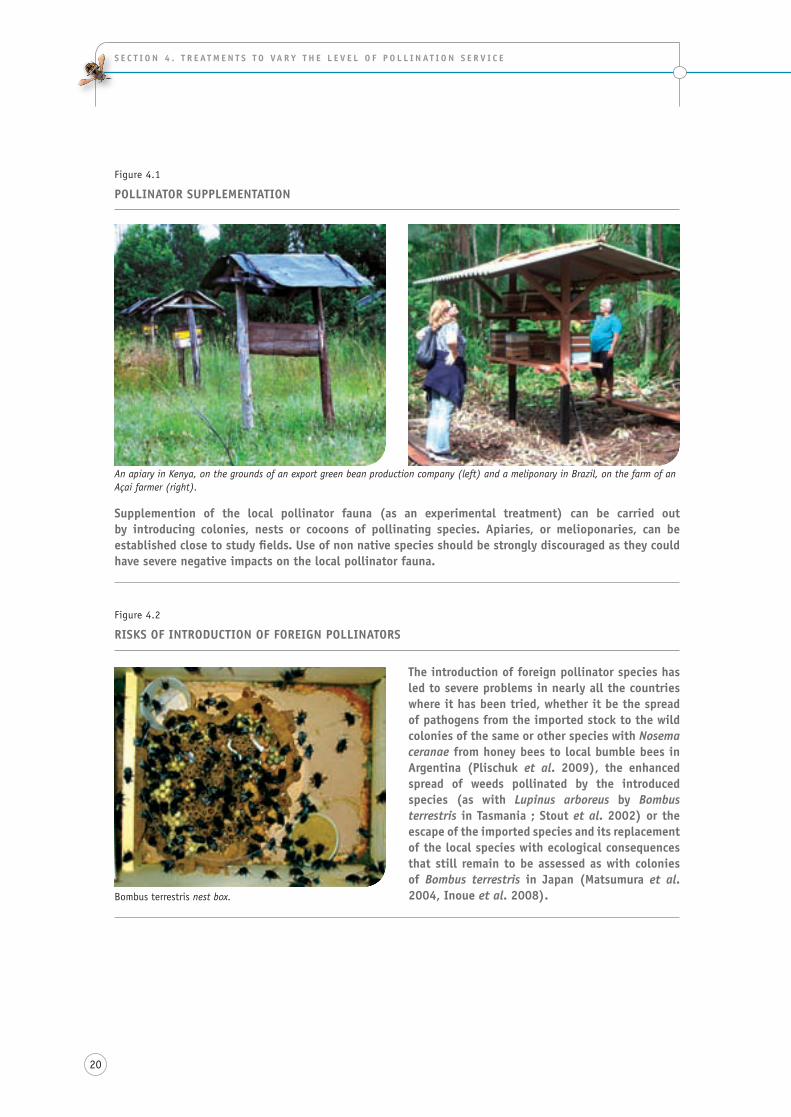
cocoons of these species (Figure 4.1). Use of non native species should be strongly discouraged
as they could have severe negative impacts on the local pollinator fauna and, indeed, whole
ecosystems (hingston and McQuillan 1999, Goulson 2003, Kato and Kawakita 2004; Figure 4.2).
20
S E C T I O N 4 . T R E AT M E N T S T O VA R y T H E L E V E L O F P O L L I N AT I O N S E R V I C E
Figure 4.1
POLLINATOR SUPPLEMENTATION
Supplemention of the local pollinator fauna (as an experimental treatment) can be carried out by introducing colonies, nests or cocoons of pollinating species. Apiaries, or melioponaries, can be established close to study fields. Use of non native species should be strongly discouraged as they could have severe negative impacts on the local pollinator fauna.
An apiary in Kenya, on the grounds of an export green bean production company (left) and a meliponary in Brazil, on the farm of an Açai farmer (right).
Figure 4.2
RISKS OF INTRODUCTION OF FOREIGN POLLINATORS
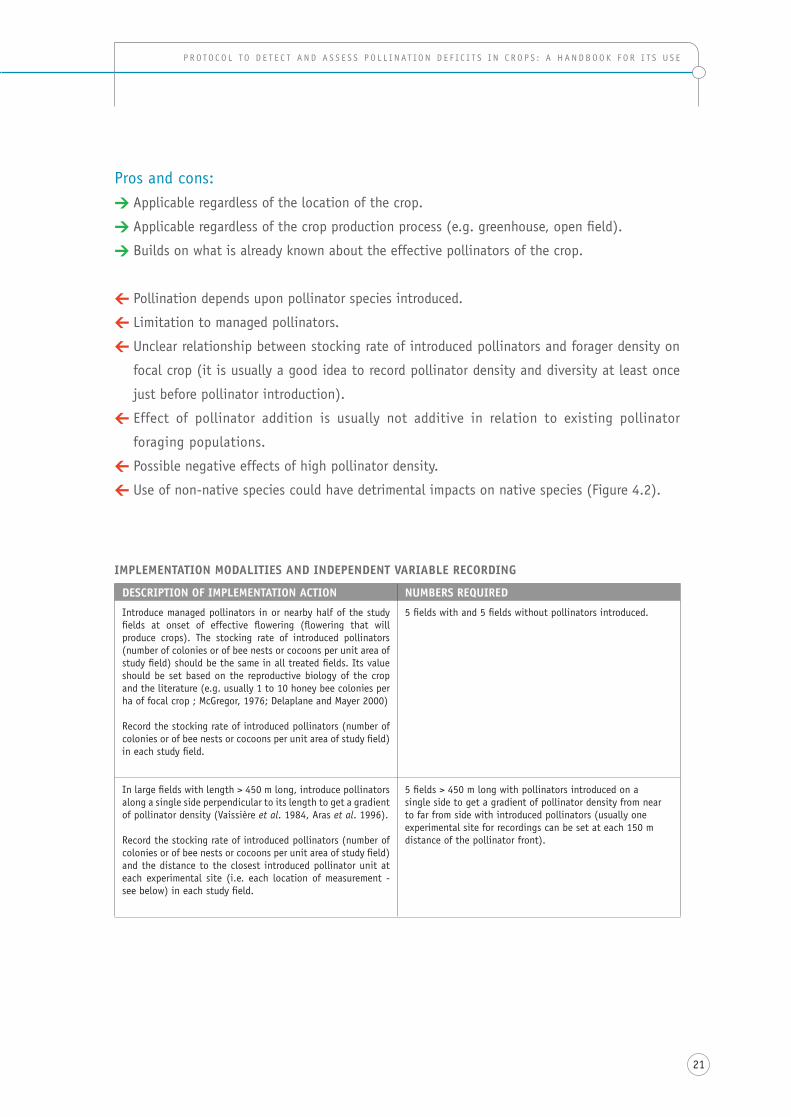
Bombus terrestris nest box.
The introduction of foreign pollinator species has led to severe problems in nearly all the countries where it has been tried, whether it be the spread of pathogens from the imported stock to the wild colonies of the same or other species with Nosema ceranae from honey bees to local bumble bees in Argentina (Plischuk et al. 2009), the enhanced spread of weeds pollinated by the introduced species (as with Lupinus arboreus by Bombus terrestris in Tasmania ; Stout et al. 2002) or the escape of the imported species and its replacement of the local species with ecological consequences that still remain to be assessed as with colonies of Bombus terrestris in japan (Matsumura et al. 2004, Inoue et al. 2008).
21
p r oto c o l t o d e t e c t a n d a s s e s s p o l l i n at i o n d e F i c i t s i n c r o p s : a h a n d B o o K F o r i t s U s e
pros and cons:> applicable regardless of the location of the crop.
>applicable regardless of the crop production process (e.g. greenhouse, open field).
> Builds on what is already known about the effective pollinators of the crop.
<pollination depends upon pollinator species introduced.
< limitation to managed pollinators.
< Unclear relationship between stocking rate of introduced pollinators and forager density on
focal crop (it is usually a good idea to record pollinator density and diversity at least once
just before pollinator introduction).
< effect of pollinator addition is usually not additive in relation to existing pollinator
foraging populations.
< possible negative effects of high pollinator density.
< Use of non-native species could have detrimental impacts on native species (Figure 4.2).
IMPLEMENTATION MODALITIES AND INDEPENDENT VARIABLE RECORDING
DESCRIPTION OF IMPLEMENTATION ACTION NUMBERS REQUIRED
introduce managed pollinators in or nearby half of the study fields at onset of effective flowering (flowering that will produce crops). the stocking rate of introduced pollinators (number of colonies or of bee nests or cocoons per unit area of study field) should be the same in all treated fields. its value should be set based on the reproductive biology of the crop and the literature (e.g. usually 1 to 10 honey bee colonies per ha of focal crop ; McGregor, 1976; delaplane and Mayer 2000)
record the stocking rate of introduced pollinators (number of colonies or of bee nests or cocoons per unit area of study field) in each study field.
5 fields with and 5 fields without pollinators introduced.
in large fields with length > 450 m long, introduce pollinators along a single side perpendicular to its length to get a gradient of pollinator density (vaissière et al. 1984, aras et al. 1996).
record the stocking rate of introduced pollinators (number of colonies or of bee nests or cocoons per unit area of study field) and the distance to the closest introduced pollinator unit at each experimental site (i.e. each location of measurement - see below) in each study field.
5 fields > 450 m long with pollinators introduced on a single side to get a gradient of pollinator density from near to far from side with introduced pollinators (usually one experimental site for recordings can be set at each 150 m distance of the pollinator front).
22
S E C T I O N 4 . T R E AT M E N T S T O VA R y T H E L E V E L O F P O L L I N AT I O N S E R V I C E
© pe
ter
Kwap
ong
Figure 4.3
LANDSCAPE CONTExT
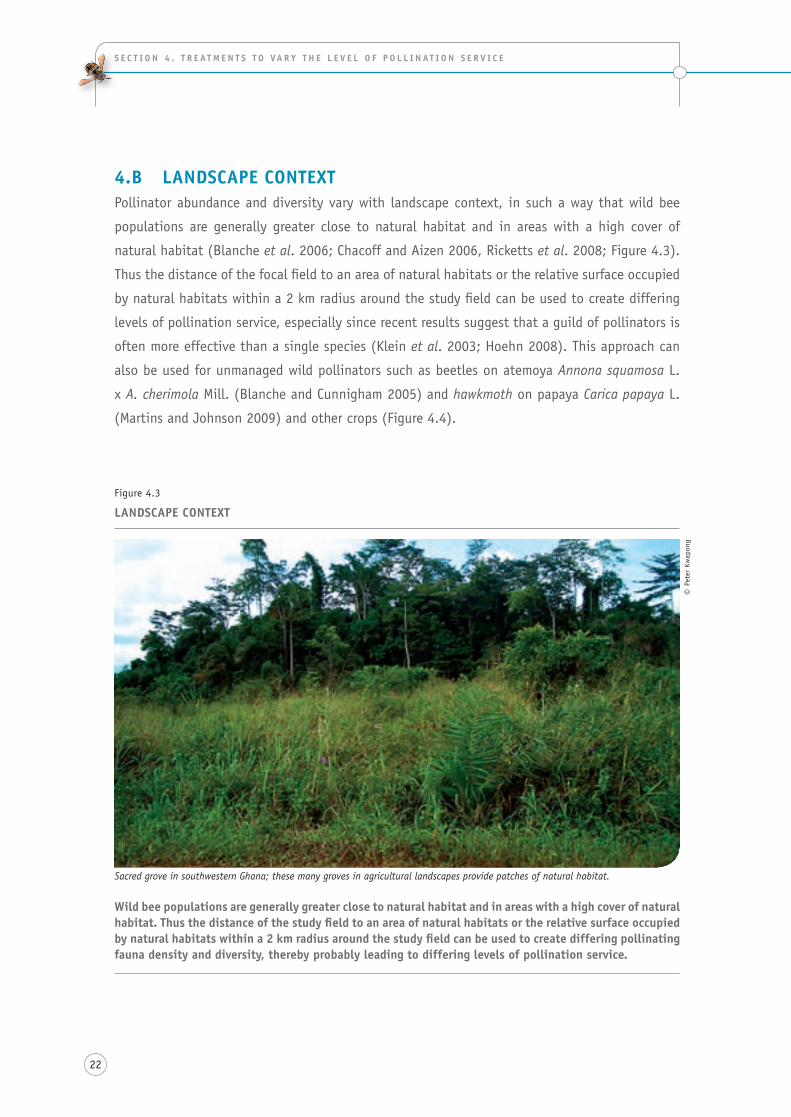
Sacred grove in southwestern Ghana; these many groves in agricultural landscapes provide patches of natural habitat.
4.B LANDSCAPE CONTExT pollinator abundance and diversity vary with landscape context, in such a way that wild bee
populations are generally greater close to natural habitat and in areas with a high cover of
natural habitat (Blanche et al. 2006; chacoff and aizen 2006, ricketts et al. 2008; Figure 4.3).
thus the distance of the focal field to an area of natural habitats or the relative surface occupied
by natural habitats within a 2 km radius around the study field can be used to create differing
levels of pollination service, especially since recent results suggest that a guild of pollinators is
often more effective than a single species (Klein et al. 2003; hoehn 2008). this approach can
also be used for unmanaged wild pollinators such as beetles on atemoya Annona squamosa l.
x A. cherimola Mill. (Blanche and cunnigham 2005) and hawkmoth on papaya Carica papaya l.
(Martins and Johnson 2009) and other crops (Figure 4.4).
wild bee populations are generally greater close to natural habitat and in areas with a high cover of natural habitat. Thus the distance of the study field to an area of natural habitats or the relative surface occupied by natural habitats within a 2 km radius around the study field can be used to create differing pollinating fauna density and diversity, thereby probably leading to differing levels of pollination service.
23
p r oto c o l t o d e t e c t a n d a s s e s s p o l l i n at i o n d e F i c i t s i n c r o p s : a h a n d B o o K F o r i t s U s e
Figure 4.4
UNMANAGED POLLINATORS
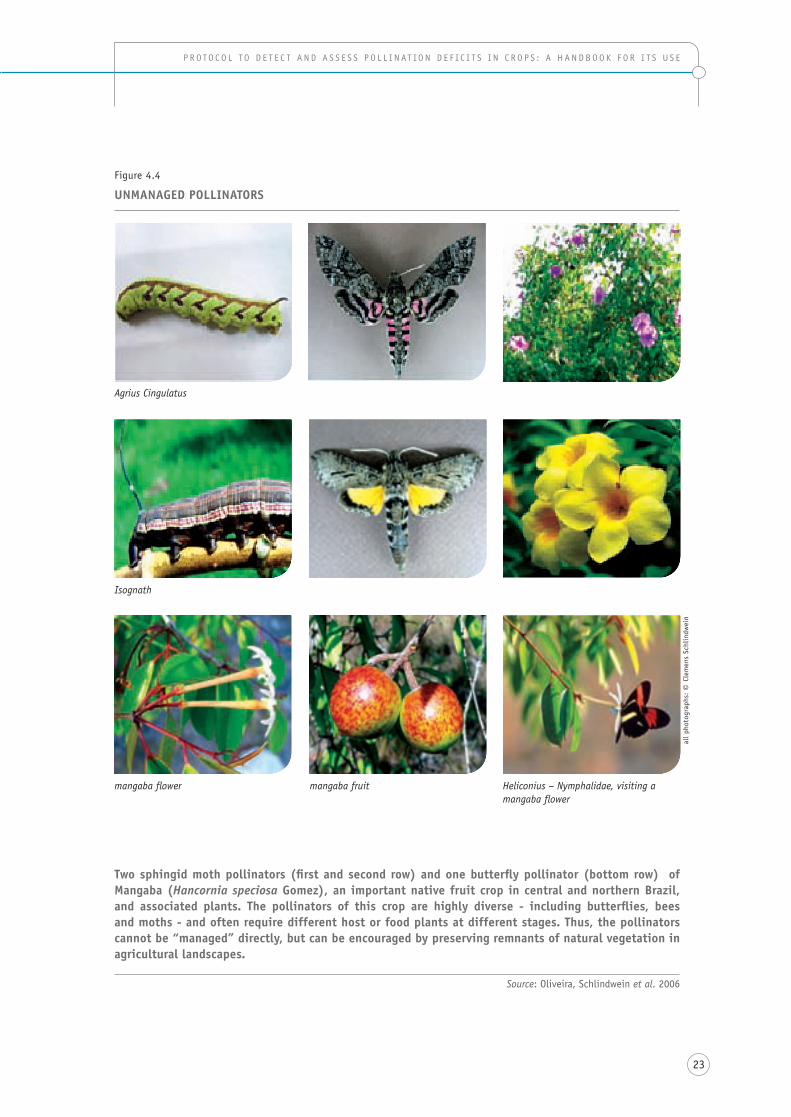
Two sphingid moth pollinators (first and second row) and one butterfly pollinator (bottom row) of Mangaba (Hancornia speciosa Gomez), an important native fruit crop in central and northern Brazil, and associated plants. The pollinators of this crop are highly diverse - including butterflies, bees and moths - and often require different host or food plants at different stages. Thus, the pollinators cannot be “managed” directly, but can be encouraged by preserving remnants of natural vegetation in agricultural landscapes.
Source: oliveira, schlindwein et al. 2006
Agrius Cingulatus
Isognath
all
phot
ogra
phs:
© Cl
emen
s sc
hlin
dwei
n
mangaba flower Heliconius – Nymphalidae, visiting a mangaba flower
mangaba fruit
24
S E C T I O N 4 . T R E AT M E N T S T O VA R y T H E L E V E L O F P O L L I N AT I O N S E R V I C E
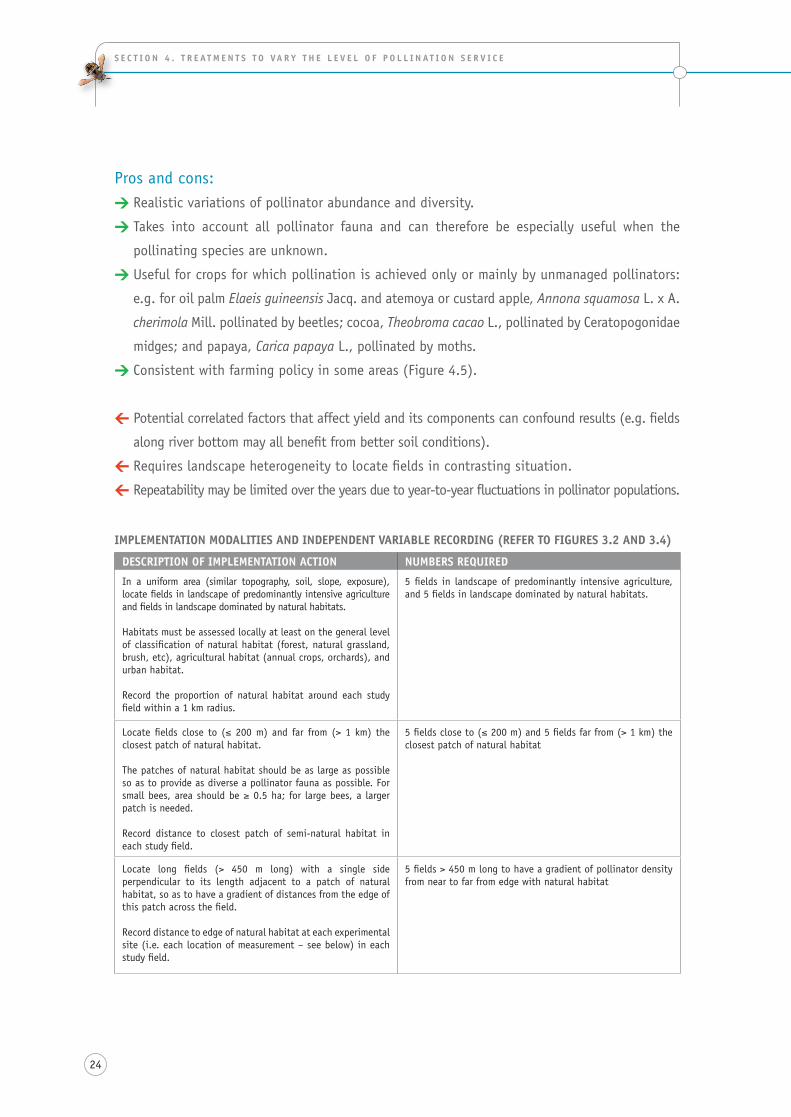
pros and cons:> realistic variations of pollinator abundance and diversity.
> takes into account all pollinator fauna and can therefore be especially useful when the
pollinating species are unknown.
> Useful for crops for which pollination is achieved only or mainly by unmanaged pollinators:
e.g. for oil palm Elaeis guineensis Jacq. and atemoya or custard apple, Annona squamosa l. x a.
cherimola Mill. pollinated by beetles; cocoa, Theobroma cacao l., pollinated by ceratopogonidae
midges; and papaya, Carica papaya l., pollinated by moths.
> consistent with farming policy in some areas (Figure 4.5).
< potential correlated factors that affect yield and its components can confound results (e.g. fields
along river bottom may all benefit from better soil conditions).
< requires landscape heterogeneity to locate fields in contrasting situation.
< repeatability may be limited over the years due to year-to-year fluctuations in pollinator populations.
IMPLEMENTATION MODALITIES AND INDEPENDENT VARIABLE RECORDING (REFER TO FIGURES 3.2 AND 3.4)
DESCRIPTION OF IMPLEMENTATION ACTION NUMBERS REQUIRED
in a uniform area (similar topography, soil, slope, exposure), locate fields in landscape of predominantly intensive agriculture and fields in landscape dominated by natural habitats.
habitats must be assessed locally at least on the general level of classification of natural habitat (forest, natural grassland, brush, etc), agricultural habitat (annual crops, orchards), and urban habitat.
record the proportion of natural habitat around each study field within a 1 km radius.
5 fields in landscape of predominantly intensive agriculture, and 5 fields in landscape dominated by natural habitats.
locate fields close to (≤ 200 m) and far from (> 1 km) the closest patch of natural habitat.
the patches of natural habitat should be as large as possible so as to provide as diverse a pollinator fauna as possible. For small bees, area should be ≥ 0.5 ha; for large bees, a larger patch is needed.
record distance to closest patch of semi-natural habitat in each study field.
5 fields close to (≤ 200 m) and 5 fields far from (> 1 km) the closest patch of natural habitat
locate long fields (> 450 m long) with a single side perpendicular to its length adjacent to a patch of natural habitat, so as to have a gradient of distances from the edge of this patch across the field.
record distance to edge of natural habitat at each experimental site (i.e. each location of measurement – see below) in each study field.
5 fields > 450 m long to have a gradient of pollinator density from near to far from edge with natural habitat
25
p r oto c o l t o d e t e c t a n d a s s e s s p o l l i n at i o n d e F i c i t s i n c r o p s : a h a n d B o o K F o r i t s U s e
© sw
iss
Fede
ral
Offi
ce f
or A
gric
ultu
re
Figure 4.5
USING LEGISLATED CONSERVATION PRACTICES AS A BASIS FOR ExPERIMENTAL DESIGN
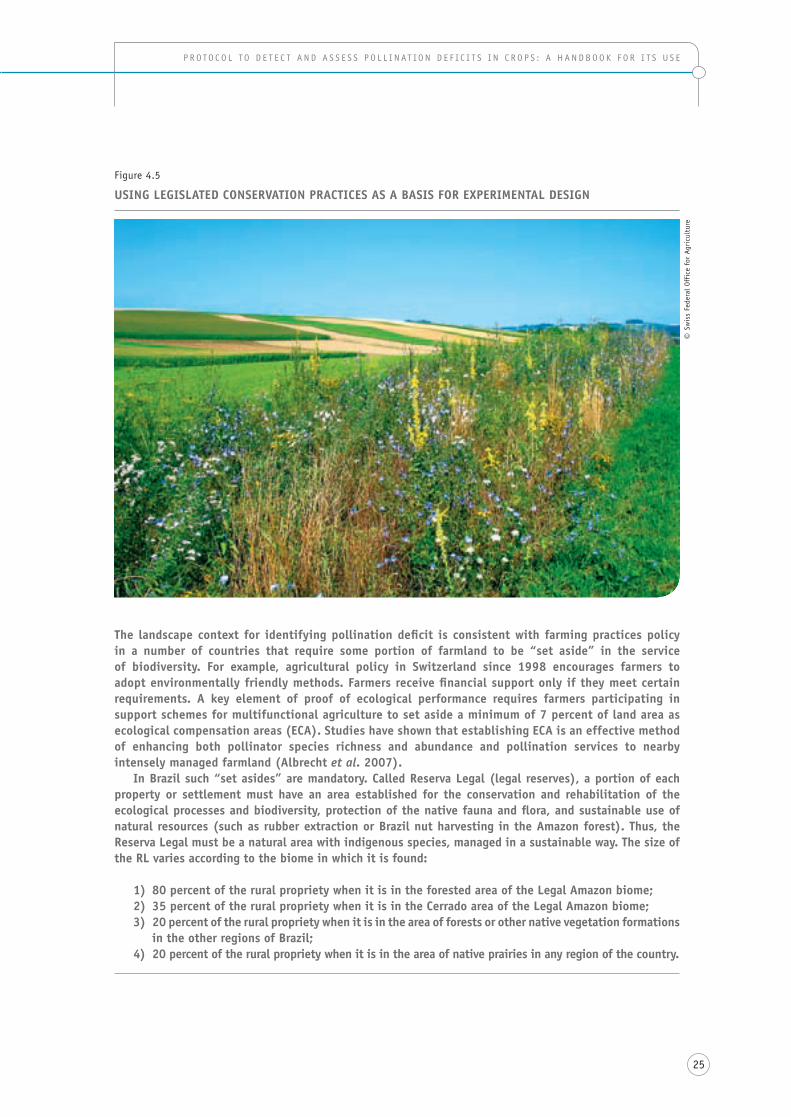
The landscape context for identifying pollination deficit is consistent with farming practices policy in a number of countries that require some portion of farmland to be “set aside” in the service of biodiversity. For example, agricultural policy in Switzerland since 1998 encourages farmers to adopt environmentally friendly methods. Farmers receive financial support only if they meet certain requirements. A key element of proof of ecological performance requires farmers participating in support schemes for multifunctional agriculture to set aside a minimum of 7 percent of land area as ecological compensation areas (ECA). Studies have shown that establishing ECA is an effective method of enhancing both pollinator species richness and abundance and pollination services to nearby intensely managed farmland (Albrecht et al. 2007).
In Brazil such “set asides” are mandatory. Called Reserva Legal (legal reserves), a portion of each property or settlement must have an area established for the conservation and rehabilitation of the ecological processes and biodiversity, protection of the native fauna and flora, and sustainable use of natural resources (such as rubber extraction or Brazil nut harvesting in the Amazon forest). Thus, the Reserva Legal must be a natural area with indigenous species, managed in a sustainable way. The size of the RL varies according to the biome in which it is found:
1) 80 percent of the rural propriety when it is in the forested area of the Legal Amazon biome;2) 35 percent of the rural propriety when it is in the Cerrado area of the Legal Amazon biome;3) 20 percent of the rural propriety when it is in the area of forests or other native vegetation formations
in the other regions of Brazil;4) 20 percent of the rural propriety when it is in the area of native prairies in any region of the country.
26
S E C T I O N 4 . T R E AT M E N T S T O VA R y T H E L E V E L O F P O L L I N AT I O N S E R V I C E
4.C COMBINED TREATMENT – INTRODUCED POLLINATORS AND LANDSCAPE CONTExTthe two treatments listed previously to enhance pollinator populations are only the two main
types used in the literature. But there are a few other means to reach maximum pollination
or increase pollinator populations on some specific crops. For example on kiwifruit, artificial
pollination with machine-harvested pollen is possible and can be used as a reference (Gonzalez
et al. 1998). also, when the most effective pollinator species are known at a given location
along with some elements of its biology, it may be possible to provide adapted nesting sites
or other management tools to enhance their population density. this has been effective, for
example, with artificial nests for carpenter bees (Xylocopa spp.) in orchards of passion fruit
vines Passiflora edulis sims. (Freitas et al. 2003), or Forcipomya spp. midges in cocoa plantations
(Kaufmann 1975).
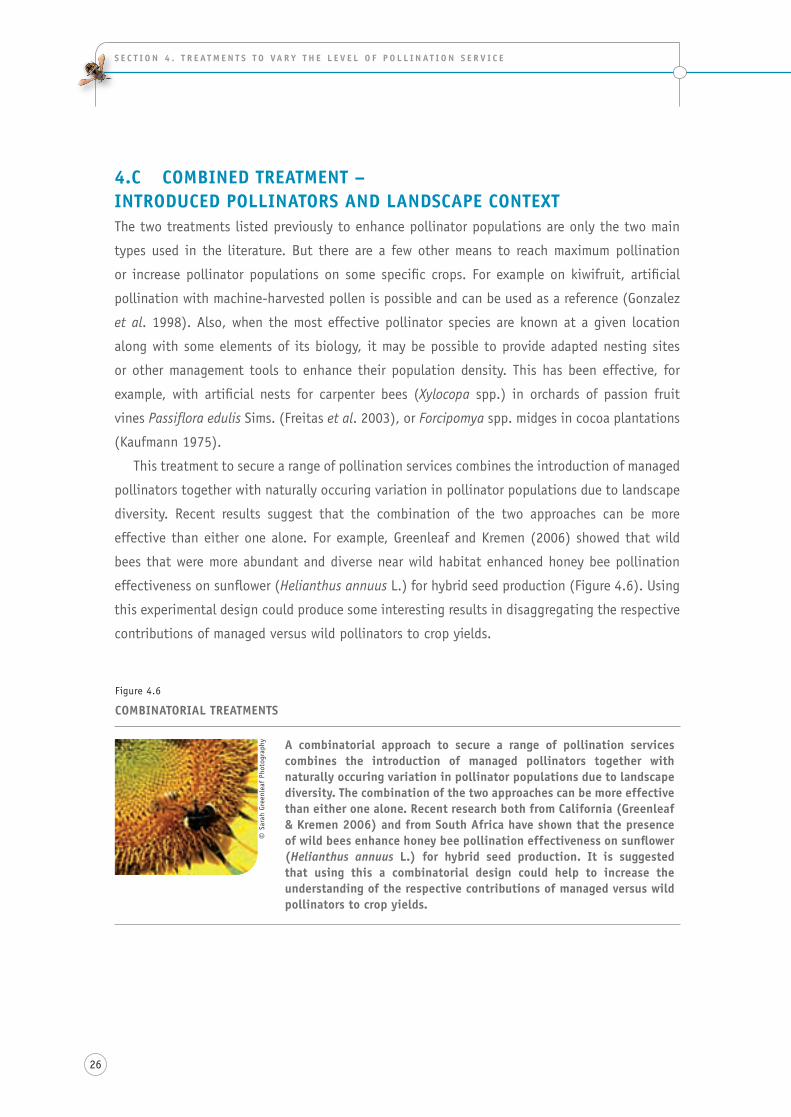
this treatment to secure a range of pollination services combines the introduction of managed
pollinators together with naturally occuring variation in pollinator populations due to landscape
diversity. recent results suggest that the combination of the two approaches can be more
effective than either one alone. For example, Greenleaf and Kremen (2006) showed that wild
bees that were more abundant and diverse near wild habitat enhanced honey bee pollination
effectiveness on sunflower (Helianthus annuus l.) for hybrid seed production (Figure 4.6). Using
this experimental design could produce some interesting results in disaggregating the respective
contributions of managed versus wild pollinators to crop yields.
Figure 4.6
COMBINATORIAL TREATMENTS
© sa
rah
Gree
nlea
f ph
otog
raph
y A combinatorial approach to secure a range of pollination services combines the introduction of managed pollinators together with naturally occuring variation in pollinator populations due to landscape diversity. The combination of the two approaches can be more effective than either one alone. Recent research both from California (Greenleaf & Kremen 2006) and from South Africa have shown that the presence of wild bees enhance honey bee pollination effectiveness on sunflower (Helianthus annuus L.) for hybrid seed production. It is suggested that using this a combinatorial design could help to increase the understanding of the respective contributions of managed versus wild pollinators to crop yields.
27
p r oto c o l t o d e t e c t a n d a s s e s s p o l l i n at i o n d e F i c i t s i n c r o p s : a h a n d B o o K F o r i t s U s e
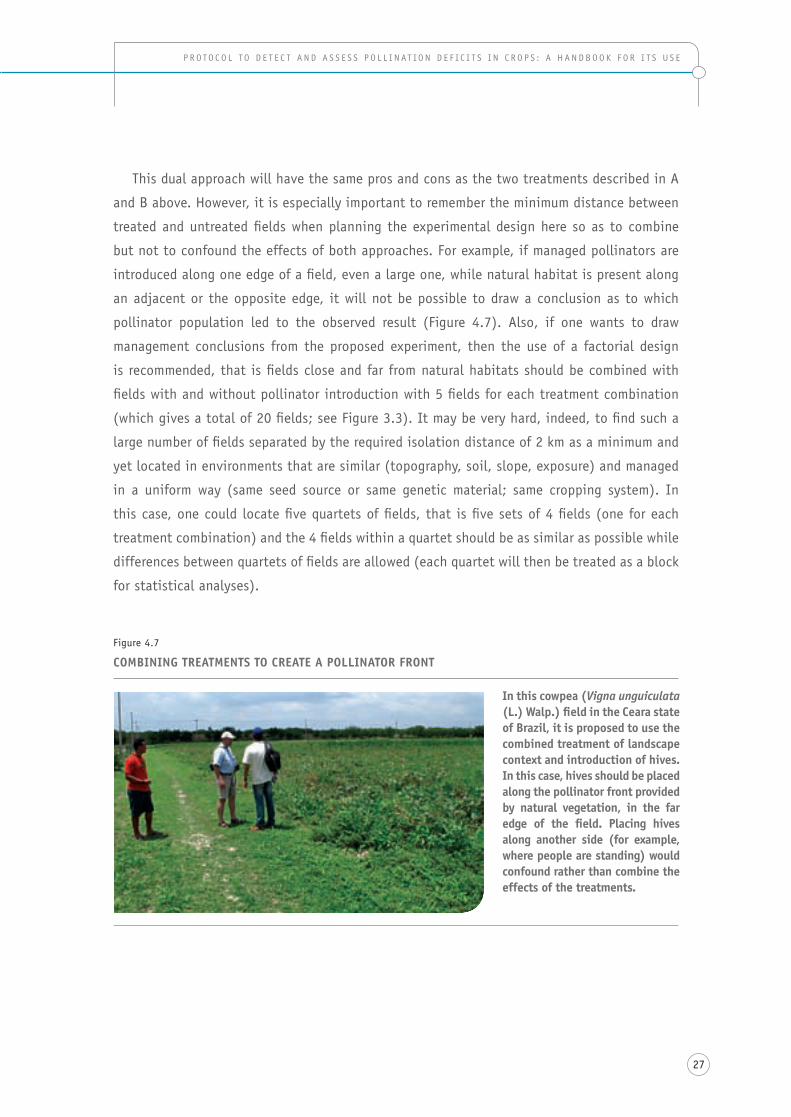
this dual approach will have the same pros and cons as the two treatments described in a
and B above. however, it is especially important to remember the minimum distance between
treated and untreated fields when planning the experimental design here so as to combine
but not to confound the effects of both approaches. For example, if managed pollinators are
introduced along one edge of a field, even a large one, while natural habitat is present along
an adjacent or the opposite edge, it will not be possible to draw a conclusion as to which
pollinator population led to the observed result (Figure 4.7). also, if one wants to draw
management conclusions from the proposed experiment, then the use of a factorial design
is recommended, that is fields close and far from natural habitats should be combined with
fields with and without pollinator introduction with 5 fields for each treatment combination
(which gives a total of 20 fields; see Figure 3.3). it may be very hard, indeed, to find such a
large number of fields separated by the required isolation distance of 2 km as a minimum and
yet located in environments that are similar (topography, soil, slope, exposure) and managed
in a uniform way (same seed source or same genetic material; same cropping system). in
this case, one could locate five quartets of fields, that is five sets of 4 fields (one for each
treatment combination) and the 4 fields within a quartet should be as similar as possible while
differences between quartets of fields are allowed (each quartet will then be treated as a block
for statistical analyses).
Figure 4.7
COMBINING TREATMENTS TO CREATE A POLLINATOR FRONT
In this cowpea (Vigna unguiculata (L.) walp.) field in the Ceara state of Brazil, it is proposed to use the combined treatment of landscape context and introduction of hives. In this case, hives should be placed along the pollinator front provided by natural vegetation, in the far edge of the field. Placing hives along another side (for example, where people are standing) would confound rather than combine the effects of the treatments.
28
S E C T I O N 4 . T R E AT M E N T S T O VA R y T H E L E V E L O F P O L L I N AT I O N S E R V I C E
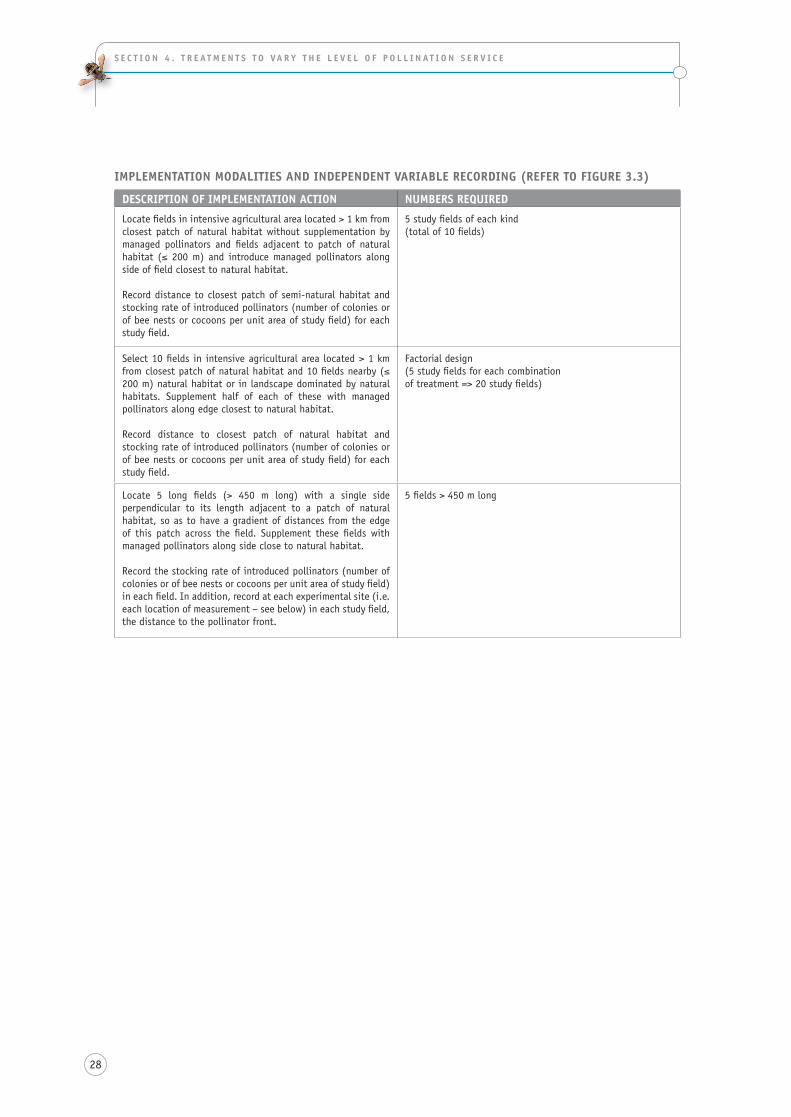
IMPLEMENTATION MODALITIES AND INDEPENDENT VARIABLE RECORDING (REFER TO FIGURE 3.3)
DESCRIPTION OF IMPLEMENTATION ACTION NUMBERS REQUIRED
locate fields in intensive agricultural area located > 1 km from closest patch of natural habitat without supplementation by managed pollinators and fields adjacent to patch of natural habitat (≤ 200 m) and introduce managed pollinators along side of field closest to natural habitat.
record distance to closest patch of semi-natural habitat and stocking rate of introduced pollinators (number of colonies or of bee nests or cocoons per unit area of study field) for each study field.
5 study fields of each kind (total of 10 fields)
select 10 fields in intensive agricultural area located > 1 km from closest patch of natural habitat and 10 fields nearby (≤ 200 m) natural habitat or in landscape dominated by natural habitats. supplement half of each of these with managed pollinators along edge closest to natural habitat.
record distance to closest patch of natural habitat and stocking rate of introduced pollinators (number of colonies or of bee nests or cocoons per unit area of study field) for each study field.
Factorial design (5 study fields for each combination of treatment => 20 study fields)
locate 5 long fields (> 450 m long) with a single side perpendicular to its length adjacent to a patch of natural habitat, so as to have a gradient of distances from the edge of this patch across the field. supplement these fields with managed pollinators along side close to natural habitat.
record the stocking rate of introduced pollinators (number of colonies or of bee nests or cocoons per unit area of study field) in each field. in addition, record at each experimental site (i.e. each location of measurement – see below) in each study field, the distance to the pollinator front.
5 fields > 450 m long
29
p r oto c o l t o d e t e c t a n d a s s e s s p o l l i n at i o n d e F i c i t s i n c r o p s : a h a n d B o o K F o r i t s U s e
section 5 LAyOUT OF ExPERIMENTAL SITES
once the pollination treatment has been selected and the study fields have been located in
agreement with the farmers, an experimental site will be established in each field for data
collection (refer back to Figure 3.1 for terminology of study fields, experimental sites, recording
plots, etc.). in long fields with a gradient of distances to the pollinator front, several sites will
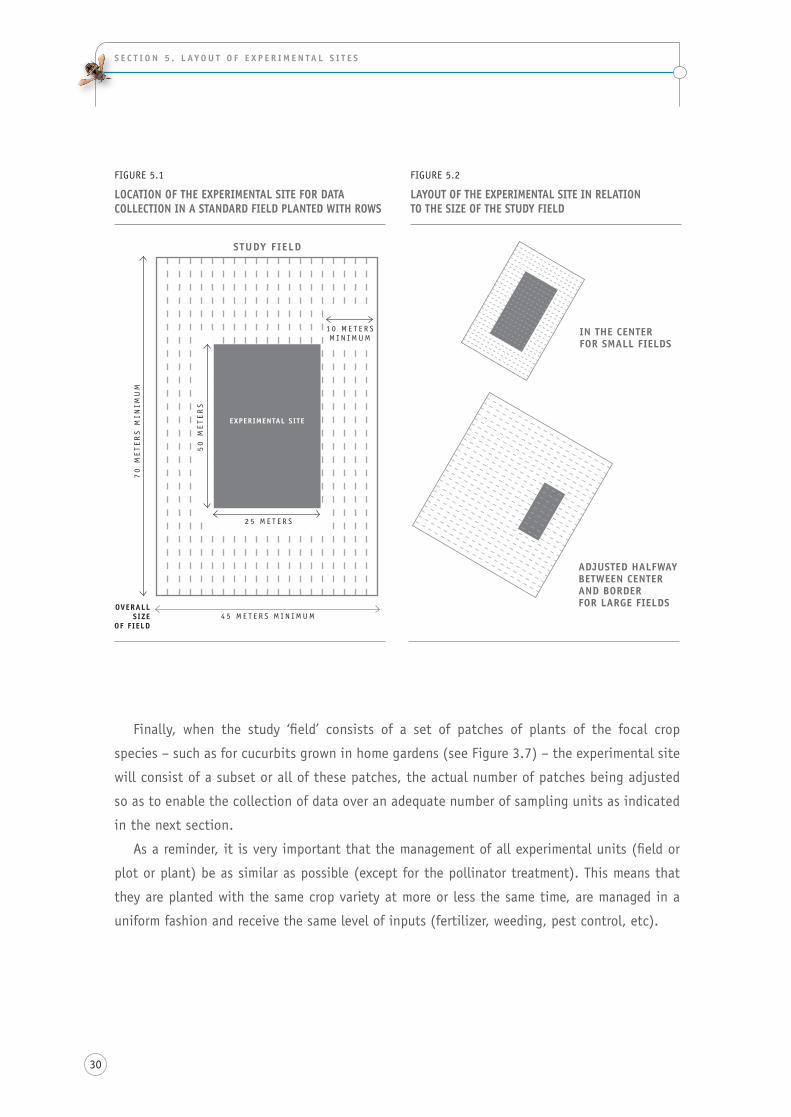
be established in each field. For fields that are large enough and planted with an herbaceous
crop, the experimental site will cover a nominal area of 50 m x 25 m aligned along the rows
and set in a representative area of each field following a basic design (Figures 5.1 and 5.2). For
crops planted in rows, it is best to lay this experimental site along the rows to make it easier to
set the plots for data collection (Figure 5.1). For fields large enough that are broadcast-sown,
the layout of Figure 5.1 can also be used with the long axis of the site aligned with the longest
axis of the field.
For fields > 450 m long for which the goal is to obtain a gradient of pollinator density, the
experimental sites should be set perpendicular to the length of the field and at fixed distances from
the edge with the pollinator front with 150 m increments (e.g. 25, 175 and 325 m from edge).
For fields that are not large enough or when the shape of the field does not allow for the
establishment of such an experimental site – for example in the case of a long field planted on
a terrace along mountain side – then the whole field will be used as an experimental site.
on the other hand, for very large fields, the experimental site should be set halfway between
the geometric center of the field and its edge so as to represent an ‘average’ situation assuming
a linear gradient of pollinators between the edge and the center of the field.
For orchard crops, it is the tree planting pattern that will dictate the size of the experimental
site as an area 50 m x 25 m may be far too small and not encompass but a single tree. By using
the tree as the individual unit, rather than a distance of row or an area, it is possible to lay out an
experimental site that will permit the establishment of plots for data collection (see next page).
30
S E C T I O N 5 . L Ay O U T O F E x P E R I M E N TA L S I T E S
Finally, when the study ‘field’ consists of a set of patches of plants of the focal crop
species – such as for cucurbits grown in home gardens (see Figure 3.7) – the experimental site
will consist of a subset or all of these patches, the actual number of patches being adjusted
so as to enable the collection of data over an adequate number of sampling units as indicated
in the next section.
as a reminder, it is very important that the management of all experimental units (field or
plot or plant) be as similar as possible (except for the pollinator treatment). this means that
they are planted with the same crop variety at more or less the same time, are managed in a
uniform fashion and receive the same level of inputs (fertilizer, weeding, pest control, etc).
FiGUre 5.2
LAyOUT OF THE ExPERIMENTAL SITE IN RELATION TO THE SIZE OF THE STUDy FIELD
FiGUre 5.1
LOCATION OF THE ExPERIMENTAL SITE FOR DATA COLLECTION IN A STANDARD FIELD PLANTED wITH ROwS
OVERALL SIZE
OF FIELD4 5 M e t e r s M i n i M U M
70
Me
te
rs
Min
iMU
M
STUDy FIELD
IN THE CENTER FOR SMALL FIELDS
ADjUSTED HALFwAy BETwEEN CENTER AND BORDER FOR LARGE FIELDS
1 0 M e t e r sM i n i M U M
2 5 M e t e r s
50
Me
te
rs
ExPERIMENTAL SITE

31
p r oto c o l t o d e t e c t a n d a s s e s s p o l l i n at i o n d e F i c i t s i n c r o p s : a h a n d B o o K F o r i t s U s e
section 6 POLLINATOR DEPENDENT VARIABLES AND DATA COLLECTION
in section 4, the kind of data that should be recorded to characterize each study field (namely
the stocking rate of pollinator units, the distance to the closest patch of natural habitat, and/or
the proportion of natural habitat in a 1 km radius around the study field), is indicated for each
treatment. these will provide the values of the independent variables that are used at each site.
For each study field, it will be essential to record all information deemed important to
characterize this field as well as the cropping system used so as be able to justify that all or a
subset of the study fields can validly be compared among themselves: field size, soil type and
preparation, field immediate surrounding (hedge bordering the field or not), fertilizer application,
planting date, genetic material (variety, source of seeds), planting density, planting pattern (for
dioecious and self-incompatible species), list of main weed species in bloom and percent soil
cover of these weeds at the time of crop flowering, main management practices (irrigation,
pesticide applications), and harvesting date (see data recording sheet in annex 1).
even when using well contrasted treatments either based on pollinator supplementation or
landscape context, there is no guarantee that the response on the crop will match the intensity
of the treatment exactly in either pollinator abundance or diversity. For this reason, data will
have to be recorded on a regular basis to assess the impact of the pollinator treatment on the
abundance (pollinator density) and the diversity (species richness or broader categories) of
pollinators in the focal crop throughout its main blooming period. the response of the crop
plants in terms of production output will then have to be recorded to be able to measure the
effects of the pollinator treatment.
IN THE CENTER FOR SMALL FIELDS
32
S E C T I O N 6 . P O L L I N AT O R D E P E N D E N T VA R I A B L E S A N D D ATA C O L L E C T I O N
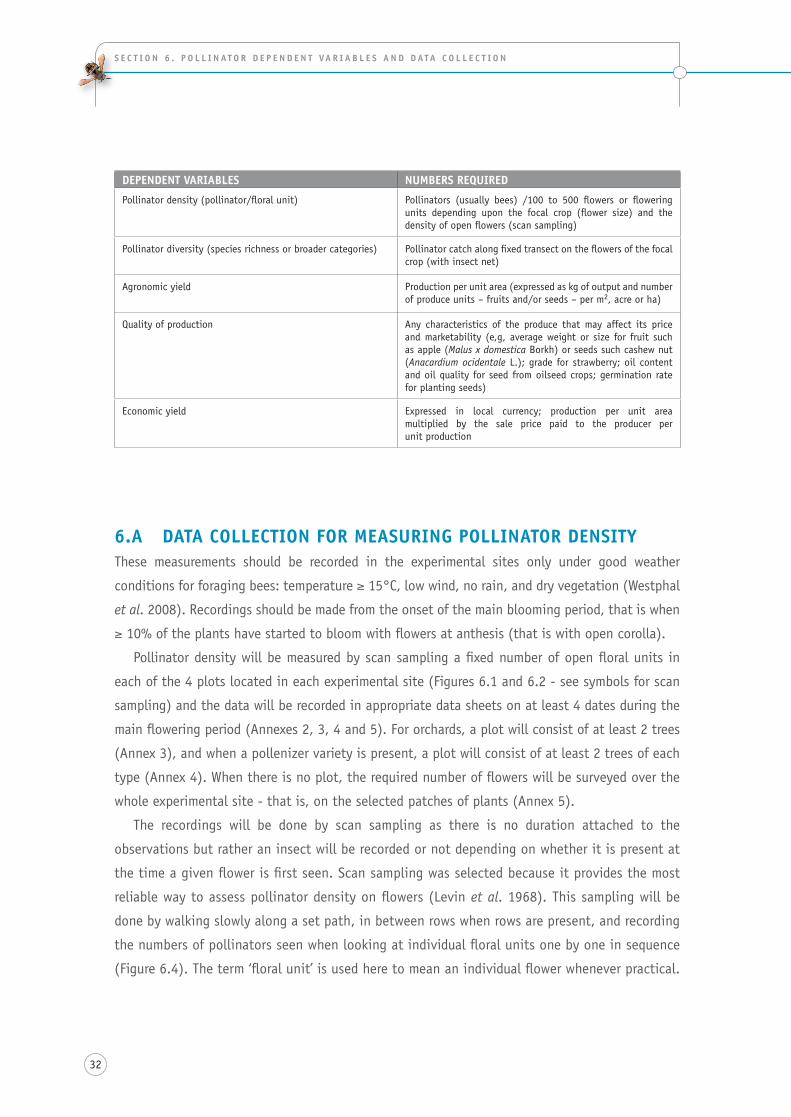
DEPENDENT VARIABLES NUMBERS REQUIRED
pollinator density (pollinator/floral unit) pollinators (usually bees) /100 to 500 flowers or flowering units depending upon the focal crop (flower size) and the density of open flowers (scan sampling)
pollinator diversity (species richness or broader categories) pollinator catch along fixed transect on the flowers of the focal crop (with insect net)
Agronomic yield production per unit area (expressed as kg of output and number of produce units – fruits and/or seeds – per m2, acre or ha)
Quality of production any characteristics of the produce that may affect its price and marketability (e,g, average weight or size for fruit such as apple (Malus x domestica Borkh) or seeds such cashew nut (Anacardium ocidentale l.); grade for strawberry; oil content and oil quality for seed from oilseed crops; germination rate for planting seeds)
Economic yield expressed in local currency; production per unit area multiplied by the sale price paid to the producer per unit production
6.A DATA COLLECTION FOR MEASURING POLLINATOR DENSITythese measurements should be recorded in the experimental sites only under good weather
conditions for foraging bees: temperature ≥ 15°c, low wind, no rain, and dry vegetation (Westphal
et al. 2008). recordings should be made from the onset of the main blooming period, that is when
≥ 10% of the plants have started to bloom with flowers at anthesis (that is with open corolla).
pollinator density will be measured by scan sampling a fixed number of open floral units in
each of the 4 plots located in each experimental site (Figures 6.1 and 6.2 - see symbols for scan
sampling) and the data will be recorded in appropriate data sheets on at least 4 dates during the
main flowering period (annexes 2, 3, 4 and 5). For orchards, a plot will consist of at least 2 trees
(annex 3), and when a pollenizer variety is present, a plot will consist of at least 2 trees of each
type (annex 4). When there is no plot, the required number of flowers will be surveyed over the
whole experimental site - that is, on the selected patches of plants (annex 5).
the recordings will be done by scan sampling as there is no duration attached to the
observations but rather an insect will be recorded or not depending on whether it is present at
the time a given flower is first seen. scan sampling was selected because it provides the most
reliable way to assess pollinator density on flowers (levin et al. 1968). this sampling will be
done by walking slowly along a set path, in between rows when rows are present, and recording
the numbers of pollinators seen when looking at individual floral units one by one in sequence
(Figure 6.4). the term ‘floral unit’ is used here to mean an individual flower whenever practical.
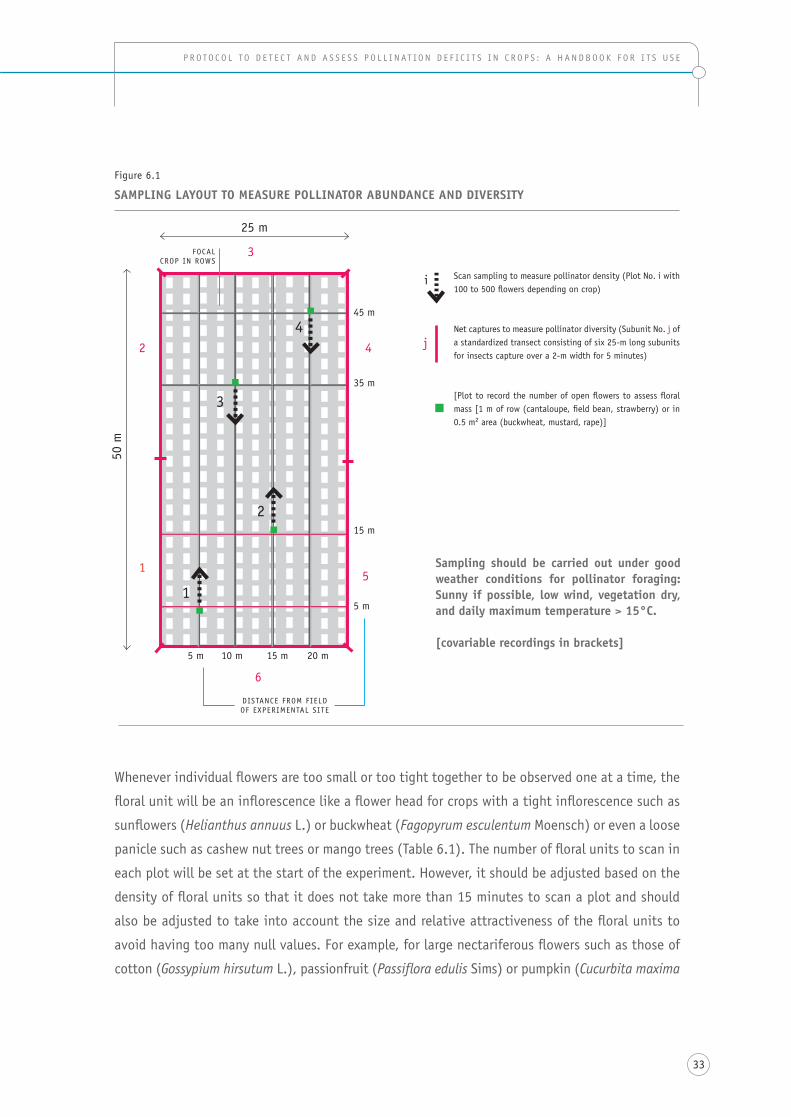
33
p r oto c o l t o d e t e c t a n d a s s e s s p o l l i n at i o n d e F i c i t s i n c r o p s : a h a n d B o o K F o r i t s U s e
Whenever individual flowers are too small or too tight together to be observed one at a time, the
floral unit will be an inflorescence like a flower head for crops with a tight inflorescence such as
sunflowers (Helianthus annuus l.) or buckwheat (Fagopyrum esculentum Moensch) or even a loose
panicle such as cashew nut trees or mango trees (table 6.1). the number of floral units to scan in
each plot will be set at the start of the experiment. however, it should be adjusted based on the
density of floral units so that it does not take more than 15 minutes to scan a plot and should
also be adjusted to take into account the size and relative attractiveness of the floral units to
avoid having too many null values. For example, for large nectariferous flowers such as those of
cotton (Gossypium hirsutum l.), passionfruit (Passiflora edulis sims) or pumpkin (Cucurbita maxima
Figure 6.1
SAMPLING LAyOUT TO MEASURE POLLINATOR ABUNDANCE AND DIVERSITy
Sampling should be carried out under good weather conditions for pollinator foraging: Sunny if possible, low wind, vegetation dry, and daily maximum temperature > 15°C.
[covariable recordings in brackets]
scan sampling to measure pollinator density (plot no. i with 100 to 500 flowers depending on crop)
net captures to measure pollinator diversity (subunit no. j of a standardized transect consisting of six 25-m long subunits for insects capture over a 2-m width for 5 minutes)
[plot to record the number of open flowers to assess floral mass [1 m of row (cantaloupe, field bean, strawberry) or in 0.5 m2 area (buckwheat, mustard, rape)]
50 m
25 m
distance FroM Field oF eXperiMental site
45 m
4
5
6
5 m
35 m
15 m
5 m 10 m 15 m 20 m
1
2
3
4
3
2
1
FOCAl crop in roWs
j
i
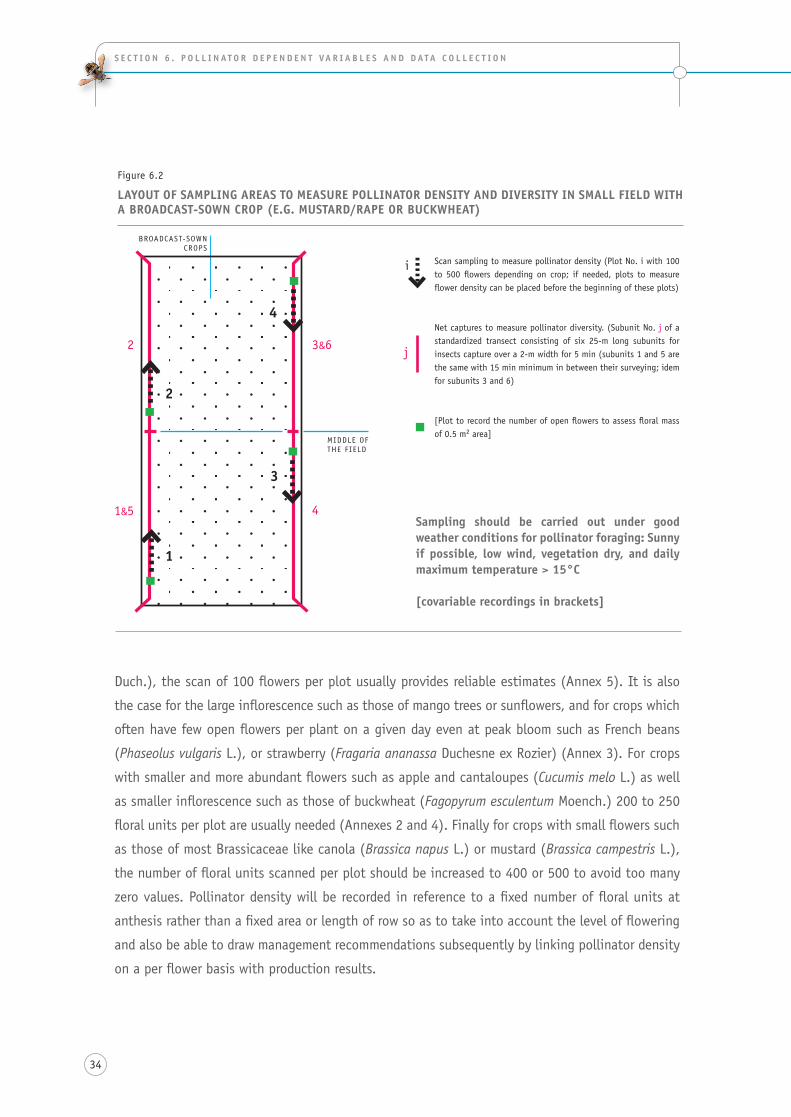
34
S E C T I O N 6 . P O L L I N AT O R D E P E N D E N T VA R I A B L E S A N D D ATA C O L L E C T I O N
duch.), the scan of 100 flowers per plot usually provides reliable estimates (annex 5). it is also
the case for the large inflorescence such as those of mango trees or sunflowers, and for crops which
often have few open flowers per plant on a given day even at peak bloom such as French beans
(Phaseolus vulgaris l.), or strawberry (Fragaria ananassa duchesne ex rozier) (annex 3). For crops
with smaller and more abundant flowers such as apple and cantaloupes (Cucumis melo l.) as well
as smaller inflorescence such as those of buckwheat (Fagopyrum esculentum Moench.) 200 to 250
floral units per plot are usually needed (annexes 2 and 4). Finally for crops with small flowers such
as those of most Brassicaceae like canola (Brassica napus l.) or mustard (Brassica campestris l.),
the number of floral units scanned per plot should be increased to 400 or 500 to avoid too many
zero values. pollinator density will be recorded in reference to a fixed number of floral units at
anthesis rather than a fixed area or length of row so as to take into account the level of flowering
and also be able to draw management recommendations subsequently by linking pollinator density
on a per flower basis with production results.
Figure 6.2
LAyOUT OF SAMPLING AREAS TO MEASURE POLLINATOR DENSITy AND DIVERSITy IN SMALL FIELD wITH A BROADCAST-SOwN CROP (E.G. MUSTARD/RAPE OR BUCKwHEAT)
scan sampling to measure pollinator density (plot no. i with 100 to 500 flowers depending on crop; if needed, plots to measure flower density can be placed before the beginning of these plots)
net captures to measure pollinator diversity. (subunit no. j of a standardized transect consisting of six 25-m long subunits for insects capture over a 2-m width for 5 min (subunits 1 and 5 are the same with 15 min minimum in between their surveying; idem for subunits 3 and 6)
[plot to record the number of open flowers to assess floral mass of 0.5 m2 area]
Sampling should be carried out under good weather conditions for pollinator foraging: Sunny if possible, low wind, vegetation dry, and daily maximum temperature > 15°C
[covariable recordings in brackets]
j
Broadcast-soWn CROPs
Middle oF the Field
2
1&5
3&6
4
4
3
2
1
i
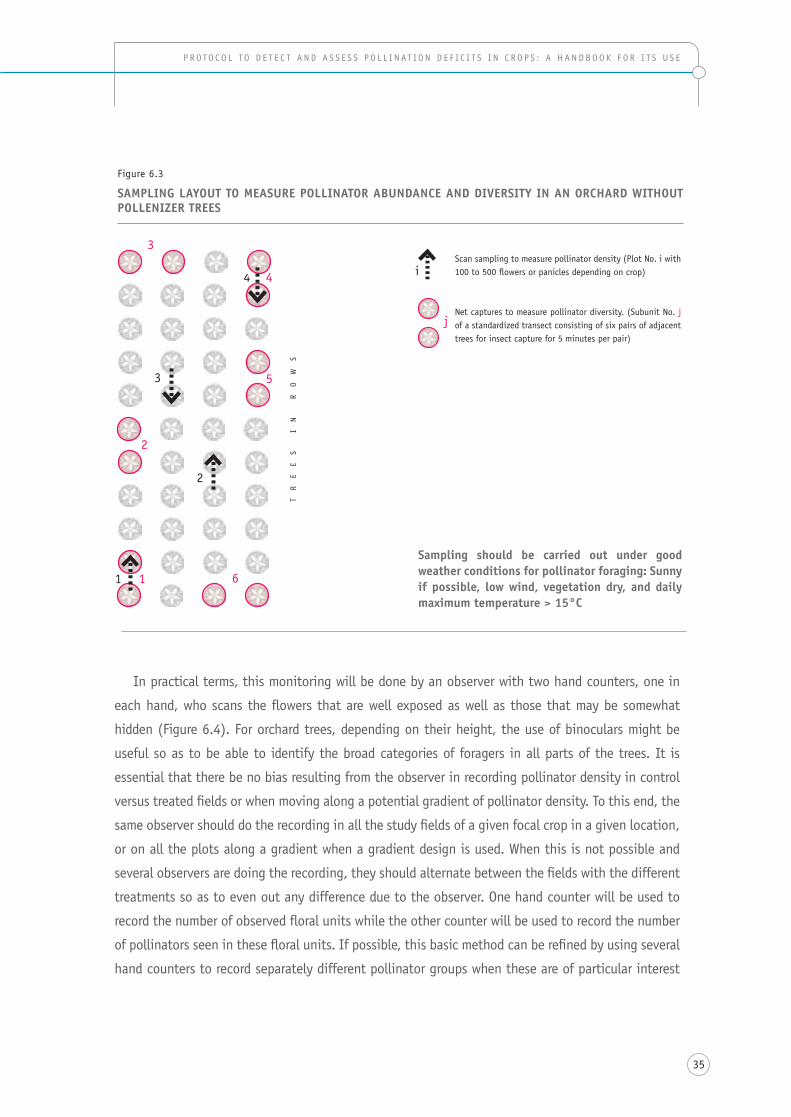
35
p r oto c o l t o d e t e c t a n d a s s e s s p o l l i n at i o n d e F i c i t s i n c r o p s : a h a n d B o o K F o r i t s U s e
Figure 6.3
SAMPLING LAyOUT TO MEASURE POLLINATOR ABUNDANCE AND DIVERSITy IN AN ORCHARD wITHOUT POLLENIZER TREES
in practical terms, this monitoring will be done by an observer with two hand counters, one in
each hand, who scans the flowers that are well exposed as well as those that may be somewhat
hidden (Figure 6.4). For orchard trees, depending on their height, the use of binoculars might be
useful so as to be able to identify the broad categories of foragers in all parts of the trees. it is
essential that there be no bias resulting from the observer in recording pollinator density in control
versus treated fields or when moving along a potential gradient of pollinator density. to this end, the
same observer should do the recording in all the study fields of a given focal crop in a given location,
or on all the plots along a gradient when a gradient design is used. When this is not possible and
several observers are doing the recording, they should alternate between the fields with the different
treatments so as to even out any difference due to the observer. one hand counter will be used to
record the number of observed floral units while the other counter will be used to record the number
of pollinators seen in these floral units. if possible, this basic method can be refined by using several
hand counters to record separately different pollinator groups when these are of particular interest
scan sampling to measure pollinator density (plot no. i with 100 to 500 flowers or panicles depending on crop)
net captures to measure pollinator diversity. (subunit no. j of a standardized transect consisting of six pairs of adjacent trees for insect capture for 5 minutes per pair)
Sampling should be carried out under good weather conditions for pollinator foraging: Sunny if possible, low wind, vegetation dry, and daily maximum temperature > 15°C
j
3
3
2
2
1 61
4
5
tr
ee
s
in
r
oW
s
4 i
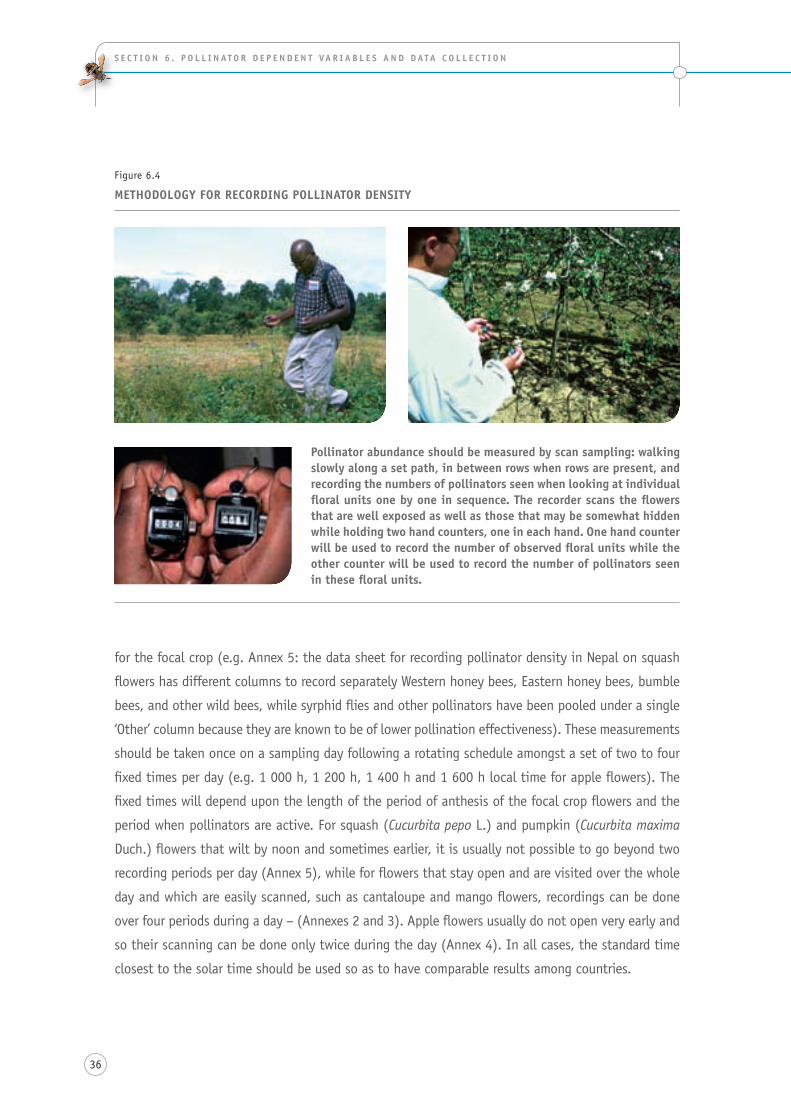
36
S E C T I O N 6 . P O L L I N AT O R D E P E N D E N T VA R I A B L E S A N D D ATA C O L L E C T I O N
Figure 6.4
METHODOLOGy FOR RECORDING POLLINATOR DENSITy
Pollinator abundance should be measured by scan sampling: walking slowly along a set path, in between rows when rows are present, and recording the numbers of pollinators seen when looking at individual floral units one by one in sequence. The recorder scans the flowers that are well exposed as well as those that may be somewhat hidden while holding two hand counters, one in each hand. One hand counter will be used to record the number of observed floral units while the other counter will be used to record the number of pollinators seen in these floral units.
for the focal crop (e.g. annex 5: the data sheet for recording pollinator density in nepal on squash
flowers has different columns to record separately Western honey bees, eastern honey bees, bumble
bees, and other wild bees, while syrphid flies and other pollinators have been pooled under a single
‘other’ column because they are known to be of lower pollination effectiveness). these measurements
should be taken once on a sampling day following a rotating schedule amongst a set of two to four
fixed times per day (e.g. 1 000 h, 1 200 h, 1 400 h and 1 600 h local time for apple flowers). the
fixed times will depend upon the length of the period of anthesis of the focal crop flowers and the
period when pollinators are active. For squash (Cucurbita pepo l.) and pumpkin (Cucurbita maxima
duch.) flowers that wilt by noon and sometimes earlier, it is usually not possible to go beyond two
recording periods per day (annex 5), while for flowers that stay open and are visited over the whole
day and which are easily scanned, such as cantaloupe and mango flowers, recordings can be done
over four periods during a day – (annexes 2 and 3). apple flowers usually do not open very early and
so their scanning can be done only twice during the day (annex 4). in all cases, the standard time
closest to the solar time should be used so as to have comparable results among countries.
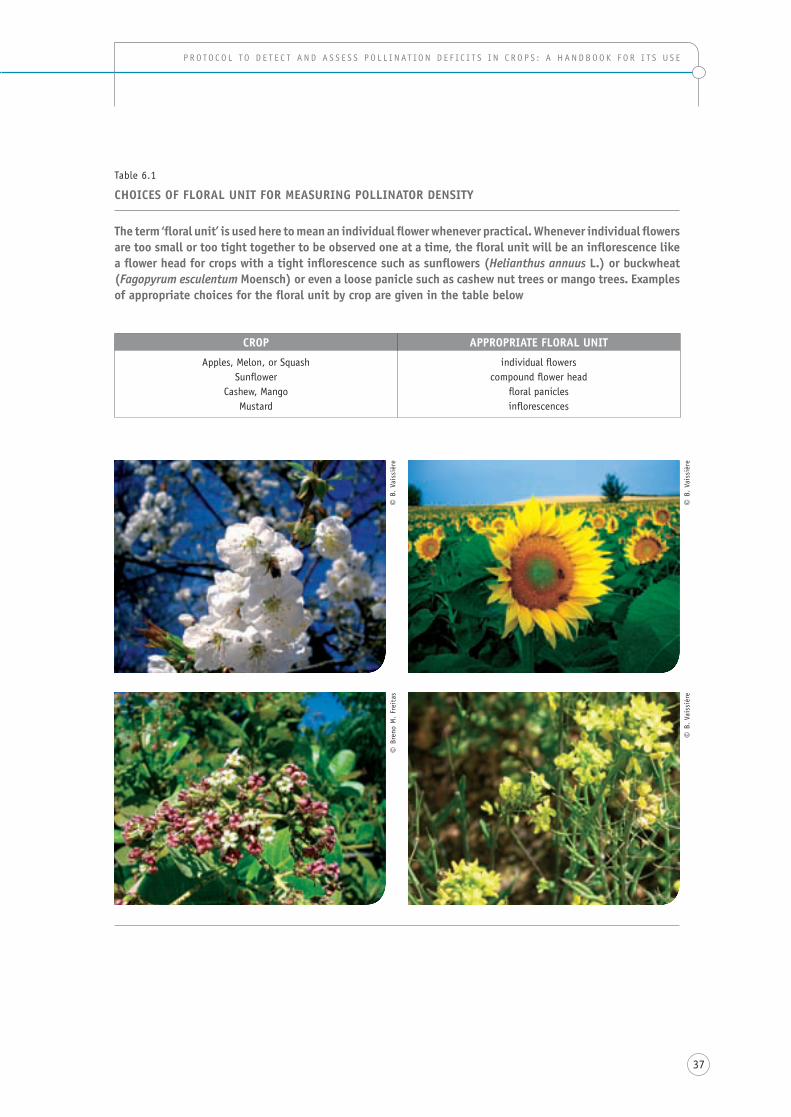
37
p r oto c o l t o d e t e c t a n d a s s e s s p o l l i n at i o n d e F i c i t s i n c r o p s : a h a n d B o o K F o r i t s U s e
table 6.1
CHOICES OF FLORAL UNIT FOR MEASURING POLLINATOR DENSITy
The term ‘floral unit’ is used here to mean an individual flower whenever practical. whenever individual flowers are too small or too tight together to be observed one at a time, the floral unit will be an inflorescence like a flower head for crops with a tight inflorescence such as sunflowers (Helianthus annuus L.) or buckwheat (Fagopyrum esculentum Moensch) or even a loose panicle such as cashew nut trees or mango trees. Examples of appropriate choices for the floral unit by crop are given in the table below
CROP APPROPRIATE FLORAL UNIT
apples, Melon, or squashsunflower
cashew, MangoMustard
individual flowerscompound flower head
floral paniclesinflorescences
© B
reno
M.
Frei
tas
© B.
vai
ssiè
re
© B.
vai
ssiè
re©
B. v
aiss
ière
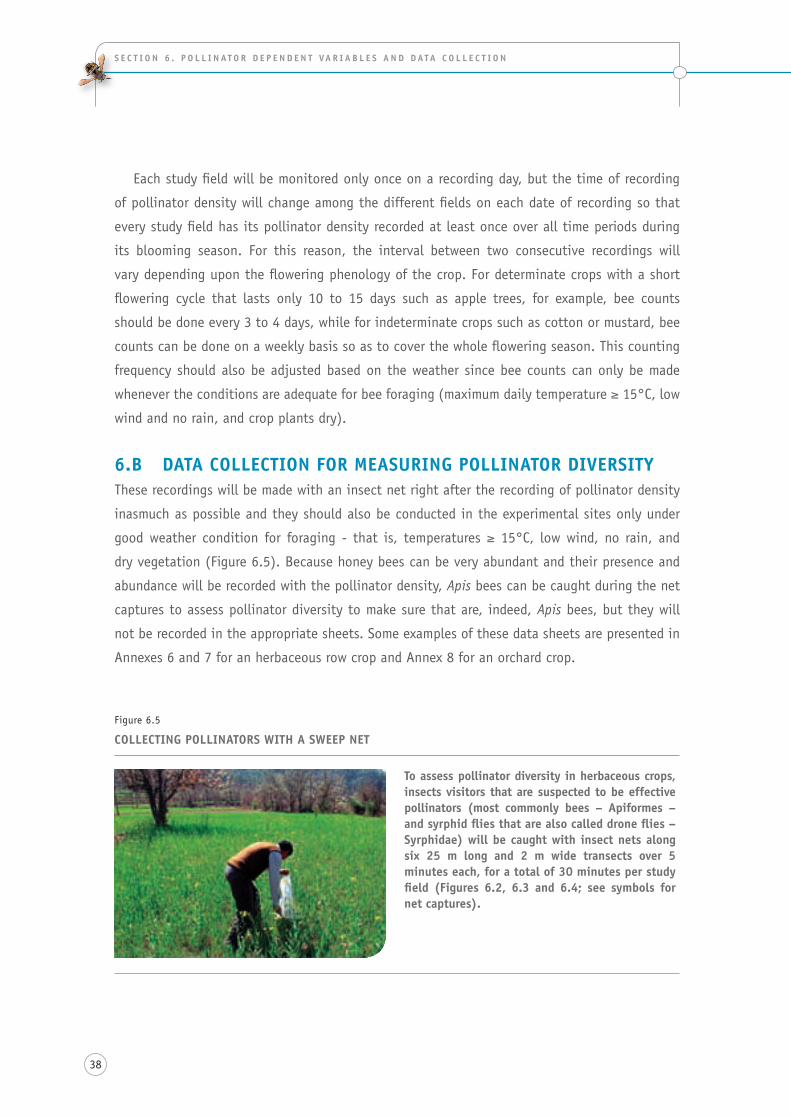
38
S E C T I O N 6 . P O L L I N AT O R D E P E N D E N T VA R I A B L E S A N D D ATA C O L L E C T I O N
each study field will be monitored only once on a recording day, but the time of recording
of pollinator density will change among the different fields on each date of recording so that
every study field has its pollinator density recorded at least once over all time periods during
its blooming season. For this reason, the interval between two consecutive recordings will
vary depending upon the flowering phenology of the crop. For determinate crops with a short
flowering cycle that lasts only 10 to 15 days such as apple trees, for example, bee counts
should be done every 3 to 4 days, while for indeterminate crops such as cotton or mustard, bee
counts can be done on a weekly basis so as to cover the whole flowering season. this counting
frequency should also be adjusted based on the weather since bee counts can only be made
whenever the conditions are adequate for bee foraging (maximum daily temperature ≥ 15°c, low
wind and no rain, and crop plants dry).
6.B DATA COLLECTION FOR MEASURING POLLINATOR DIVERSITythese recordings will be made with an insect net right after the recording of pollinator density
inasmuch as possible and they should also be conducted in the experimental sites only under
good weather condition for foraging - that is, temperatures ≥ 15°c, low wind, no rain, and
dry vegetation (Figure 6.5). Because honey bees can be very abundant and their presence and
abundance will be recorded with the pollinator density, Apis bees can be caught during the net
captures to assess pollinator diversity to make sure that are, indeed, Apis bees, but they will
not be recorded in the appropriate sheets. some examples of these data sheets are presented in
annexes 6 and 7 for an herbaceous row crop and annex 8 for an orchard crop.
Figure 6.5
COLLECTING POLLINATORS wITH A SwEEP NET
To assess pollinator diversity in herbaceous crops, insects visitors that are suspected to be effective pollinators (most commonly bees – Apiformes – and syrphid flies that are also called drone flies – Syrphidae) will be caught with insect nets along six 25 m long and 2 m wide transects over 5 minutes each, for a total of 30 minutes per study field (Figures 6.2, 6.3 and 6.4; see symbols for net captures).
39
p r oto c o l t o d e t e c t a n d a s s e s s p o l l i n at i o n d e F i c i t s i n c r o p s : a h a n d B o o K F o r i t s U s e
to assess pollinator diversity in herbaceous crops, insects visitors that are suspected to be
effective pollinators (most commonly bees – apiformes – and syrphid flies that are also called
drone flies – syrphidae) will be caught with insect nets along six 25 m long and 2 m wide
transects over 5 minutes each, for a total of 30 minutes per study field (Figures 6.1 and 6.2 - see
symbols for net captures). in orchard crops, insects visitors that are suspected to be effective
pollinators, will be caught with insect nets in six plots of a pair of adjacent trees (Figure 6.3).
again, five minutes of surveying will be spent on each plot, for a total of 30 minutes per study
field, and the surveying will be done by walking slowly around each tree. depending on the
height of the tree, the use of a telescopic net or a small ladder in the field might be useful so as
to be able to sample the foragers in all parts of the trees.
the insects will be killed with killing jars using either potassium cyanide and/or ethyl acetate
(the former kills the insects very quickly but is dangerous to use while the second takes more
time, but has the advantage of making the bees pull their tongue prior to death and tongue
length and characteristics are important characters to identify bees; it is also possible to use a
cyanide killing jar with a few drops of ethyl acetate placed on tissue paper inside the jar so as
to have the advantages of both methods). after capture, each specimen will be mounted in the
evening following collection or, if available, placed in a fridge for 24-28 hours to get rid of the
cadaveric stiffness and subsequently mounted. Mounting will be done on pins following usual
entomological procedures and each specimen will receive a tag with the collection date, exact
location of collection, focal crop name and name of collector as follows:
22 February 2010
Kosi Katarmal
Uttarakhand, india
on flowers of Brassica campestris
ranbeer s. raWal
if immediate mounting is not possible, specimens will be pooled by study field and date of
capture and placed in a small jar along with the tag information listed above written in soft
pencil on a small piece of paper. all such jars will then be stored either in a freezer at -20°c or
in 70 percent ethanol until they can be mounted adequately. Freezer storage should be preferred
if at all possible as specimens stored in 70 percent ethanol need a special procedure to dry them
and mount them in a way that they can be identified properly (for further help on this, see the
videos on http://www.youtube.com/swdroege and also the pdF document at http://bio2.elmira.
edu/fieldbio/beemanual.pdf).
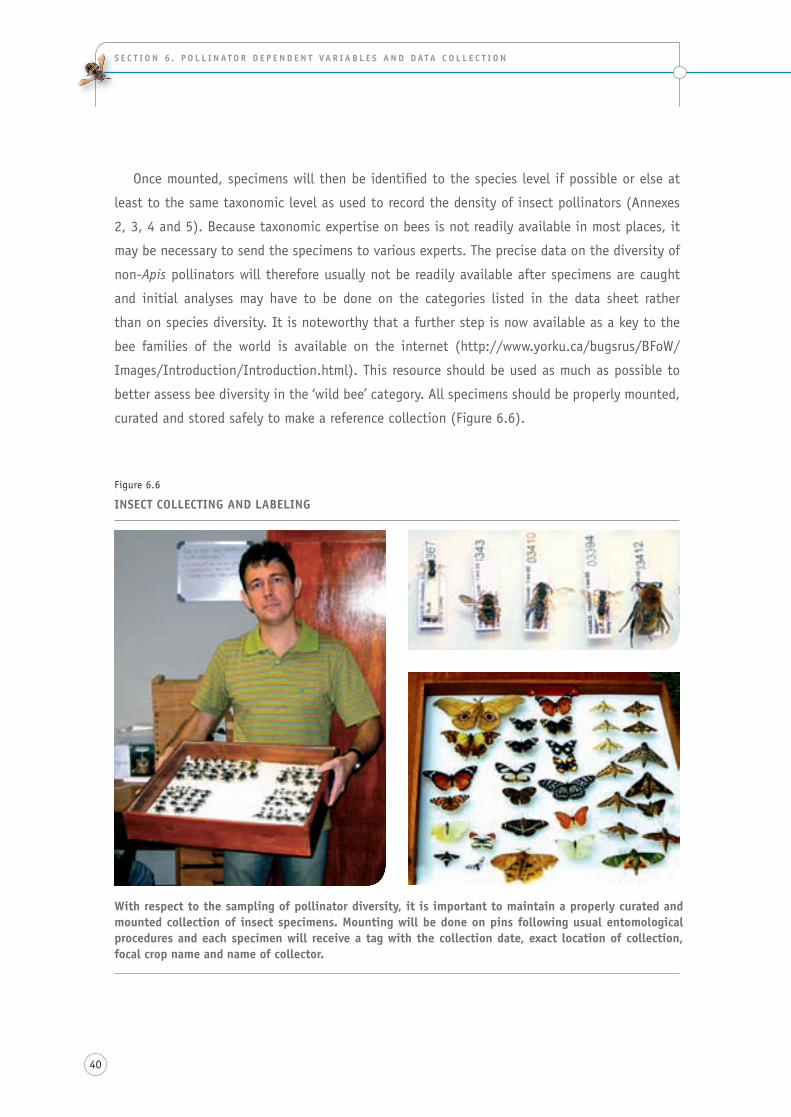
40
S E C T I O N 6 . P O L L I N AT O R D E P E N D E N T VA R I A B L E S A N D D ATA C O L L E C T I O N
once mounted, specimens will then be identified to the species level if possible or else at
least to the same taxonomic level as used to record the density of insect pollinators (annexes
2, 3, 4 and 5). Because taxonomic expertise on bees is not readily available in most places, it
may be necessary to send the specimens to various experts. the precise data on the diversity of
non-Apis pollinators will therefore usually not be readily available after specimens are caught
and initial analyses may have to be done on the categories listed in the data sheet rather
than on species diversity. it is noteworthy that a further step is now available as a key to the
bee families of the world is available on the internet (http://www.yorku.ca/bugsrus/BFoW/
images/introduction/introduction.html). this resource should be used as much as possible to
better assess bee diversity in the ‘wild bee’ category. all specimens should be properly mounted,
curated and stored safely to make a reference collection (Figure 6.6).
Figure 6.6
INSECT COLLECTING AND LABELING
with respect to the sampling of pollinator diversity, it is important to maintain a properly curated and mounted collection of insect specimens. Mounting will be done on pins following usual entomological procedures and each specimen will receive a tag with the collection date, exact location of collection, focal crop name and name of collector.
41
p r oto c o l t o d e t e c t a n d a s s e s s p o l l i n at i o n d e F i c i t s i n c r o p s : a h a n d B o o K F o r i t s U s e
6.C DATA COLLECTION FOR COVARIABLEScovariables are variables that are usually not related to the independent variables, but which
may contribute to explain the values of the dependent variables and also help in the interpretation
and analyses of the results. By collecting information on covariables, the investigator may
gain a more precise picture of the level and key characteristics of the pollination service and
this is why they are also listed below. their recording will depend upon the time available
for the experiment, in particular the flower density may be quite time consuming to assess,
but, together with forager density data, it will provide some independent assessment of the
characteristics of each field in terms of overall plant vigor and yield potential as well as overall
crop attractiveness.
if deemed important, the recording of flower density needs to be done at the same time as
the recording of the pollinator density and diversity so that the three variables can be related to
assess the overall population of pollinating insects in the study field. this measurement is usually
best done after the other two and when the flowers at anthesis can easily be distinguished from
buds as well as wilted flowers. Flowering units are defined here as previously in section 6.a and
a flowering unit is considered at anthesis whenever at least one of its flower is at anthesis. From
that day on, a flowering unit is considered to be at anthesis until all of its constitutive flowers
are wilted and therefore no longer at anthesis. Wilting is often noticeable by the closing of the
corolla (as in cucurbits and liguliflorae asteraceae such as chicory Cichorium intybus l. and lettuce
Lactuca sativa l. or the dropping of the petals (as in almond Prunus dulcis (Mill.) d. a. Webb),
apple Malus domestica Borkh., kiwifruit Actinidia deliciosa (a. chev.) c. F. liang & a. r. Ferguson,
rape Brassica napus var. napus l., and strawberry Fragaria ananassa duchesne ex rozier) though
in some species the stigma can remain receptive after the corolla has dropped (e.g. strawberry,
personal observation). Wilted flowers should not be included in the count. it is noteworthy that
in some species, most noticeably asteraceae such as sunflowers Helianthus annuus l., the wilting
POSSIBLE COVARIABLES DETAILS
Flower density or phenology: the number of floral units at anthesis (with corolla open) per unit area of study field on a given date (annexes 9 and 10)
provides an assessment of the quantity of flowers to be pollinated and also, together with the size of the field and the pollinator density, a mean to assess the total floral mass present, the total amount of resources (nectar and pollen) available to pollinators on the study field, and the total size of the pollinator population foraging in the field
age of trees (or diameter of trunk at given height) assessment of the production potential
Weather conditions (included in the data sheet to record forager density – see annexes 2, 3, 4 and 5)
impact on foraging activity of pollinators
42
S E C T I O N 6 . P O L L I N AT O R D E P E N D E N T VA R I A B L E S A N D D ATA C O L L E C T I O N
of the disc florets is not straightforward to see and one usually considers that the anthesis of
a head is over when all the ray florets have their stigma exposed (asteraceae are protandrous).
For herbaceous crops planted in rows and where rows are well defined throughout the season,
the number of floral units at anthesis is recorded on plots that cover a set length of row. this
length varies with the planting density and the floribundity of the crop, but it is best set so
that at peak bloom the numbers of floral units per plot can be recorded within 15 min at most
by a trained observer. this usually amounts to 1 m of row for crops such as strawberries Fragaria
ananassa duchesne ex rozier and cantaloupes Cucumis melo l., while plots of 3 to 5 m of row can
usually readily be examined in crops like cotton Gossypium hirsutum l. and sunflower Helianthus
annuus l. that have a low floribundity or large inflorescences. When the rows are no longer
identifiable at the flowering stage, it is best to record the number of floral units at anthesis in
the fixed area of a square or circular frame. Just as for the length of row, the size of this area will
depend upon the plant density and the crop - for squash, a frame of 1 or even 2 m2 is usually
necessary to avoid having too many null values. For crops with many smaller flowers such as
buckwheat Fagopyrum esculentum Moench or rape Brassica napus var. napus l., a frame of 0.5 m2
is usually large enough.
orchard trees are a real challenge to assess the floral mass and there is no easy way to solve
it. But for these crops, it is not always necessary to have absolute numbers of floral units per
unit area, and often a relative assessment of the flowering stage is what is really important. the
recording plots are usually made of a single or two trees (a production tree and a pollenizer tree
for self-incompatible species). if branches are easily accessible, the flowering may be followed
over one main branch or two on each tree in the plot. if this is not possible, then a photograph
taken at a fixed spot can be taken on the occasion of each recording of pollinator density to
assess the flowering in rough relative terms.
the layout of the plots or area for quadrat location to measure the flower density is presented in
Figures 6.1 and 6.2. also an example of data sheets to record the flower density of an herbaceous crop
and the flowering phenology of an orchard crop are provided in annexes 9 and 10, respectively.
43
p r oto c o l t o d e t e c t a n d a s s e s s p o l l i n at i o n d e F i c i t s i n c r o p s : a h a n d B o o K F o r i t s U s e
sECTION 7 PRODUCTION DEPENDENT VARIABLES AND SAMPLING UNITS
Many variables have been used to assess the impact of pollination level on crop output. these
include variables related to pistil characteristics (e.g. number of conspecific pollen grains
per stigma, number of pollen tubes per style, and the proportion of fertilized ovules), to the
initiation of fruits (e.g. fruit set and seed set), to agronomic yield expressed in weight or
number of produce per unit area, and economic yield expressed as gross or net return per unit
area in local currency.
7.A. AGRONOMIC yIELDYield variables are usually not available until a long lag time after flowering and many factors
not related to the pollination level during flowering can interfere with the production output
and thereby confound the effects of the pollinator treatment. also yield data are not always easy
to record. in particular, plants with indeterminate flowering may require repeated harvesting
of the marketable produce over the whole production season (e.g. vegetables such as green
bean Phaseolus vulgaris var. vulgaris l., eggplant Solanum melongena l., pepper capsicum
annuum var. annuum l.), tomato Lycopersicon esculentum var. esculentum Mill. and zucchini
Cucurbita pepo l., and also some fruits such as mango Mangifera indica l. and strawberry Fragaria
ananassa duchesne ex rozier). also, for perennial crops, the harvest should be measured over
two seasons to avoid the confounding effect of alternate bearing on different trees and orchards.
nonetheless, because the protocol is aimed at gathering data meaningful for farmers, despite
their shortcomings yield variables will be the only ones considered here.
as indicated previously (section 2), crop plants can compensate for pollen limitation with
longer flowering periods and greater flower production. in addition, fruit set and seed set can be
resource-limited, and thereby the results obtained by increasing pollination levels on a subset of
44
S E C T I O N 7 . P R O D U C T I O N D E P E N D E N T VA R I A B L E S A N D S A M P L I N G U N I T S
flowers on a plant may result in larger fruit and more seeds from those flowers, but not greater
overall production on a plant basis (Knight et al. 2005). as a consequence of these two important
mechanisms, it is essential when considering agricultural output that the whole plant be
used as the smallest sampling unit rather than individual flowers or a sample of flowers
regardless how large. therefore, the proposed yield measurements are based on the whole
plant as smallest sampling unit, that is the yield will be calculated on the basis of a sample of
individual plants, a set of plots or the whole field. For each, the pros and cons are examined
below. those applying the protocol can select the best sampling units for their focal crop and
study fields to measure the agronomic yield and the quality of the output, the only requirement
being that the same sampling units be used in all study fields inasmuch as possible.
7.A.1 Individual plantsPros and cons>natural yield unit from a farmer’s standpoint (especially for trees).
>Biological unit, reflecting an integrated response to the treatment.
>applicable in mixed cropping systems.
>provides intrafield variability (usable with gradient within field).
< needs plant density at harvest to calculate yield.
< does not control for resource allocation between years unless recorded over several years.
< not possible for some crops when plants are highly intermingled at harvest (buckwheat, rape).
< variability among plants often very large.
< Mechanical harvest usually not possible except for some tree crops.
7.A.2 Recording plot (unit length of row or unit area of study field)Pros and cons>Useful when individual plants are too intermingled (buckwheat, rape).
>By recording plot size, result are directly expressed in yield units meaningful for farmers.
>amenable to mechanical harvest.
>provides intrafield variability (usable with gradient within field).
< May require more work than individual plants for harvesting.
< not applicable in mixed cropping systems.
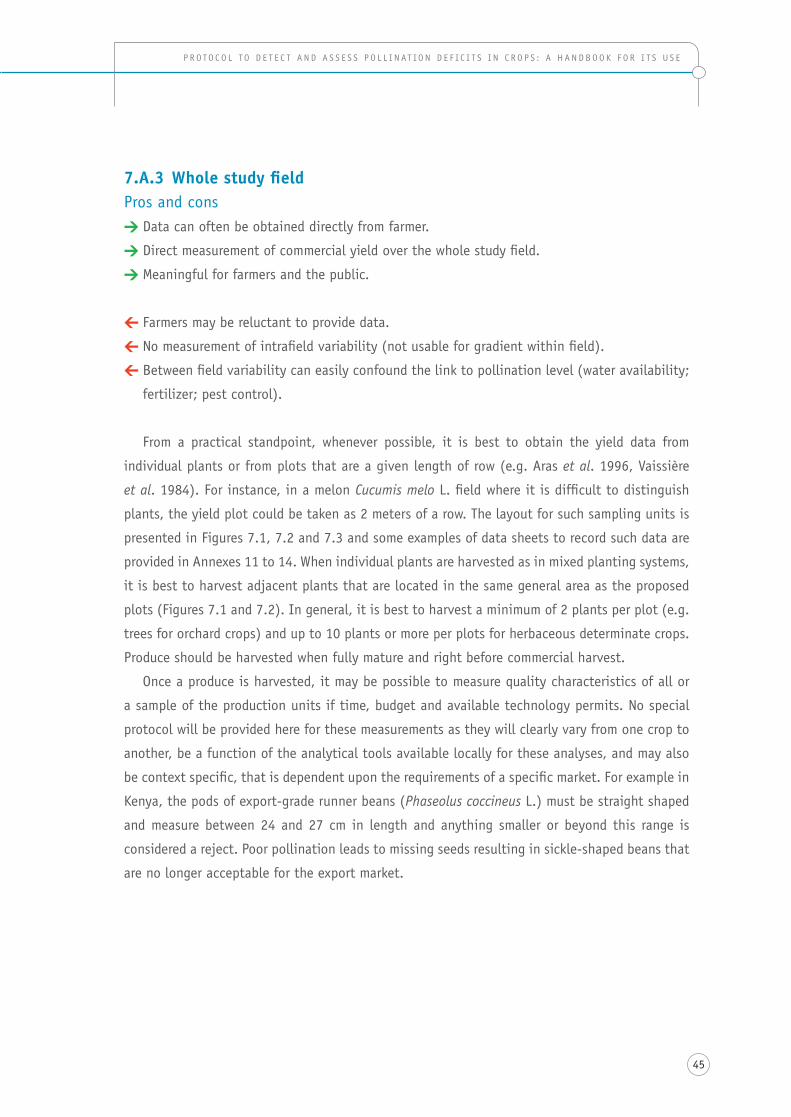
45
p r oto c o l t o d e t e c t a n d a s s e s s p o l l i n at i o n d e F i c i t s i n c r o p s : a h a n d B o o K F o r i t s U s e
7.A.3 whole study fieldPros and cons>data can often be obtained directly from farmer.
>direct measurement of commercial yield over the whole study field.
>Meaningful for farmers and the public.
< Farmers may be reluctant to provide data.
< no measurement of intrafield variability (not usable for gradient within field).
< Between field variability can easily confound the link to pollination level (water availability;
fertilizer; pest control).
From a practical standpoint, whenever possible, it is best to obtain the yield data from
individual plants or from plots that are a given length of row (e.g. aras et al. 1996, vaissière
et al. 1984). For instance, in a melon Cucumis melo l. field where it is difficult to distinguish
plants, the yield plot could be taken as 2 meters of a row. the layout for such sampling units is
presented in Figures 7.1, 7.2 and 7.3 and some examples of data sheets to record such data are
provided in annexes 11 to 14. When individual plants are harvested as in mixed planting systems,
it is best to harvest adjacent plants that are located in the same general area as the proposed
plots (Figures 7.1 and 7.2). in general, it is best to harvest a minimum of 2 plants per plot (e.g.
trees for orchard crops) and up to 10 plants or more per plots for herbaceous determinate crops.
produce should be harvested when fully mature and right before commercial harvest.
once a produce is harvested, it may be possible to measure quality characteristics of all or
a sample of the production units if time, budget and available technology permits. no special
protocol will be provided here for these measurements as they will clearly vary from one crop to
another, be a function of the analytical tools available locally for these analyses, and may also
be context specific, that is dependent upon the requirements of a specific market. For example in
Kenya, the pods of export-grade runner beans (Phaseolus coccineus l.) must be straight shaped
and measure between 24 and 27 cm in length and anything smaller or beyond this range is
considered a reject. poor pollination leads to missing seeds resulting in sickle-shaped beans that
are no longer acceptable for the export market.
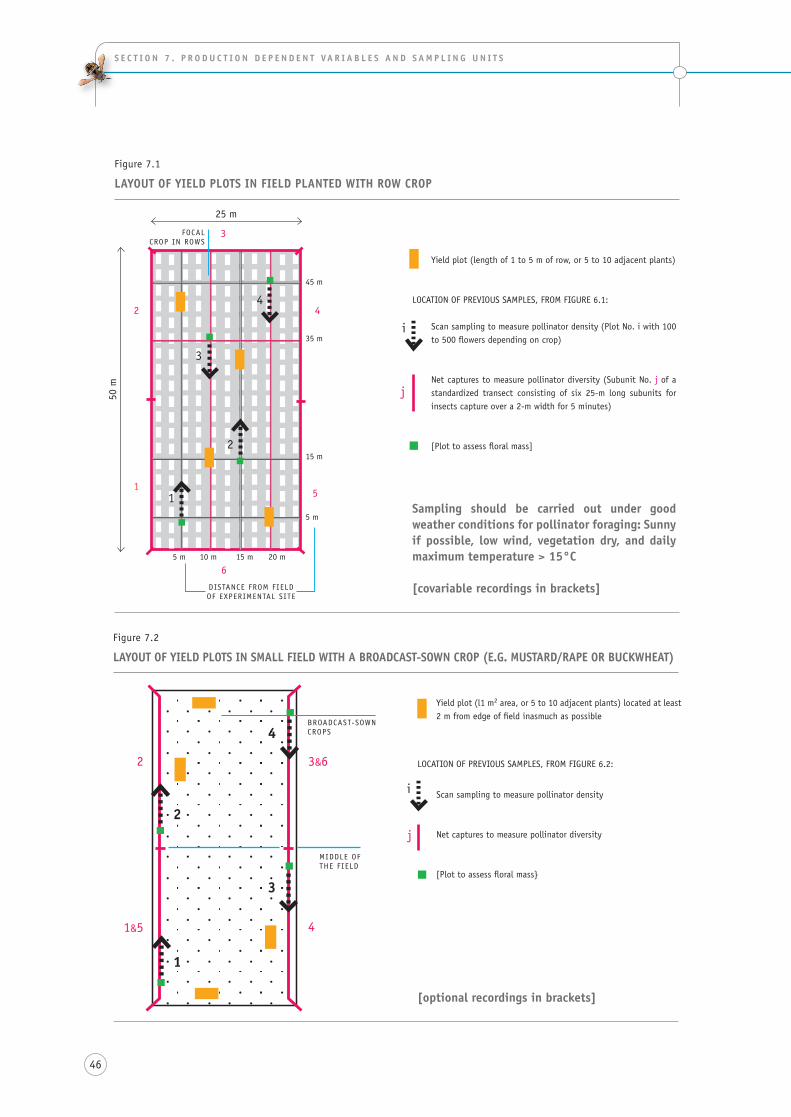
46
S E C T I O N 7 . P R O D U C T I O N D E P E N D E N T VA R I A B L E S A N D S A M P L I N G U N I T S
Figure 7.1
LAyOUT OF yIELD PLOTS IN FIELD PLANTED wITH ROw CROP
Sampling should be carried out under good weather conditions for pollinator foraging: Sunny if possible, low wind, vegetation dry, and daily maximum temperature > 15°C
[covariable recordings in brackets]
Yield plot (length of 1 to 5 m of row, or 5 to 10 adjacent plants)
location oF previoUs saMples, FroM FiGUre 6.1:
scan sampling to measure pollinator density (plot no. i with 100 to 500 flowers depending on crop)
net captures to measure pollinator diversity (subunit no. j of a standardized transect consisting of six 25-m long subunits for insects capture over a 2-m width for 5 minutes)
[plot to assess floral mass]
50 m
25 m
distance FroM Field oF eXperiMental site
45 m
4
5
6
5 m
35 m
15 m
5 m 10 m 15 m 20 m
1
2
3
4
3
2
1
FOCAl crop in roWs
j
i
Figure 7.2
LAyOUT OF yIELD PLOTS IN SMALL FIELD wITH A BROADCAST-SOwN CROP (E.G. MUSTARD/RAPE OR BUCKwHEAT)
[optional recordings in brackets]
Yield plot (l1 m2 area, or 5 to 10 adjacent plants) located at least 2 m from edge of field inasmuch as possible
location oF previoUs saMples, FroM FiGUre 6.2:
scan sampling to measure pollinator density
net captures to measure pollinator diversity
[plot to assess floral mass}
i
j
Broadcast-soWn CROPs
Middle oF the Field
2
1&5
3&6
4
4
3
2
1
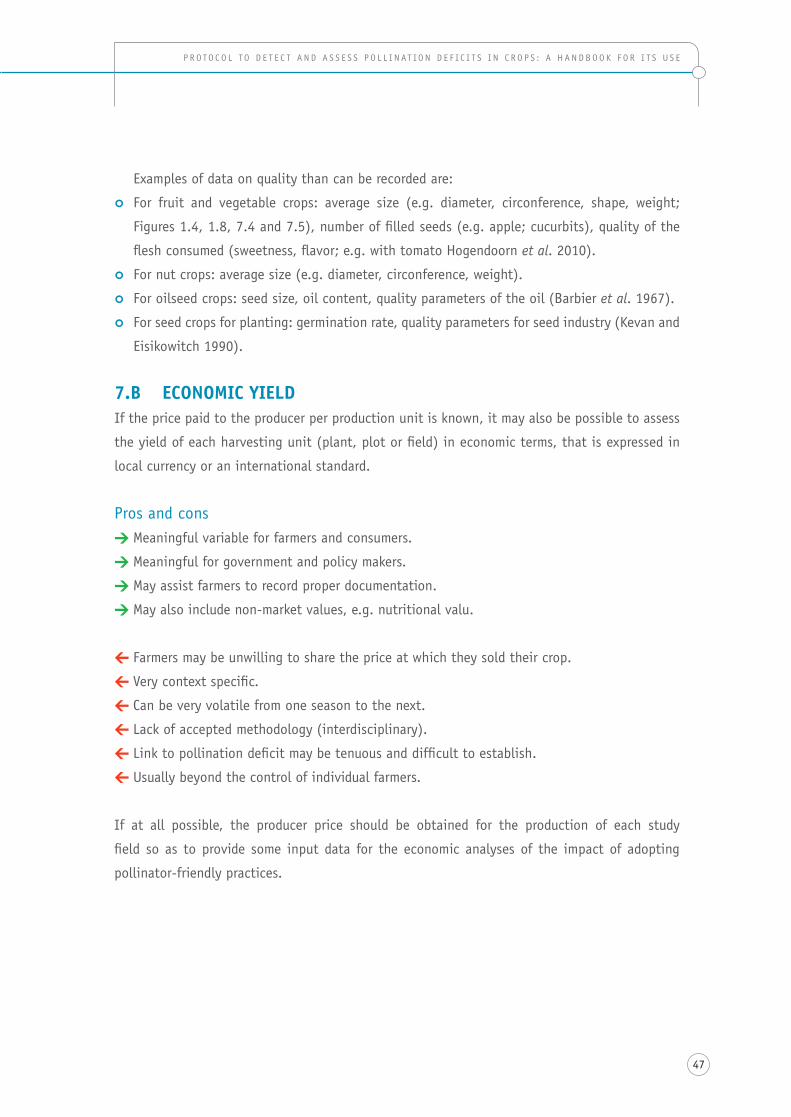
47
p r oto c o l t o d e t e c t a n d a s s e s s p o l l i n at i o n d e F i c i t s i n c r o p s : a h a n d B o o K F o r i t s U s e
examples of data on quality than can be recorded are:
|| For fruit and vegetable crops: average size (e.g. diameter, circonference, shape, weight;
Figures 1.4, 1.8, 7.4 and 7.5), number of filled seeds (e.g. apple; cucurbits), quality of the
flesh consumed (sweetness, flavor; e.g. with tomato hogendoorn et al. 2010).
|| For nut crops: average size (e.g. diameter, circonference, weight).
|| For oilseed crops: seed size, oil content, quality parameters of the oil (Barbier et al. 1967).
|| For seed crops for planting: germination rate, quality parameters for seed industry (Kevan and
eisikowitch 1990).
7.B ECONOMIC yIELDif the price paid to the producer per production unit is known, it may also be possible to assess
the yield of each harvesting unit (plant, plot or field) in economic terms, that is expressed in
local currency or an international standard.
Pros and cons >Meaningful variable for farmers and consumers.
>Meaningful for government and policy makers.
>May assist farmers to record proper documentation.
>May also include non-market values, e.g. nutritional valu.
< Farmers may be unwilling to share the price at which they sold their crop.
< very context specific.
< can be very volatile from one season to the next.
< lack of accepted methodology (interdisciplinary).
< link to pollination deficit may be tenuous and difficult to establish.
< Usually beyond the control of individual farmers.
if at all possible, the producer price should be obtained for the production of each study
field so as to provide some input data for the economic analyses of the impact of adopting
pollinator-friendly practices.
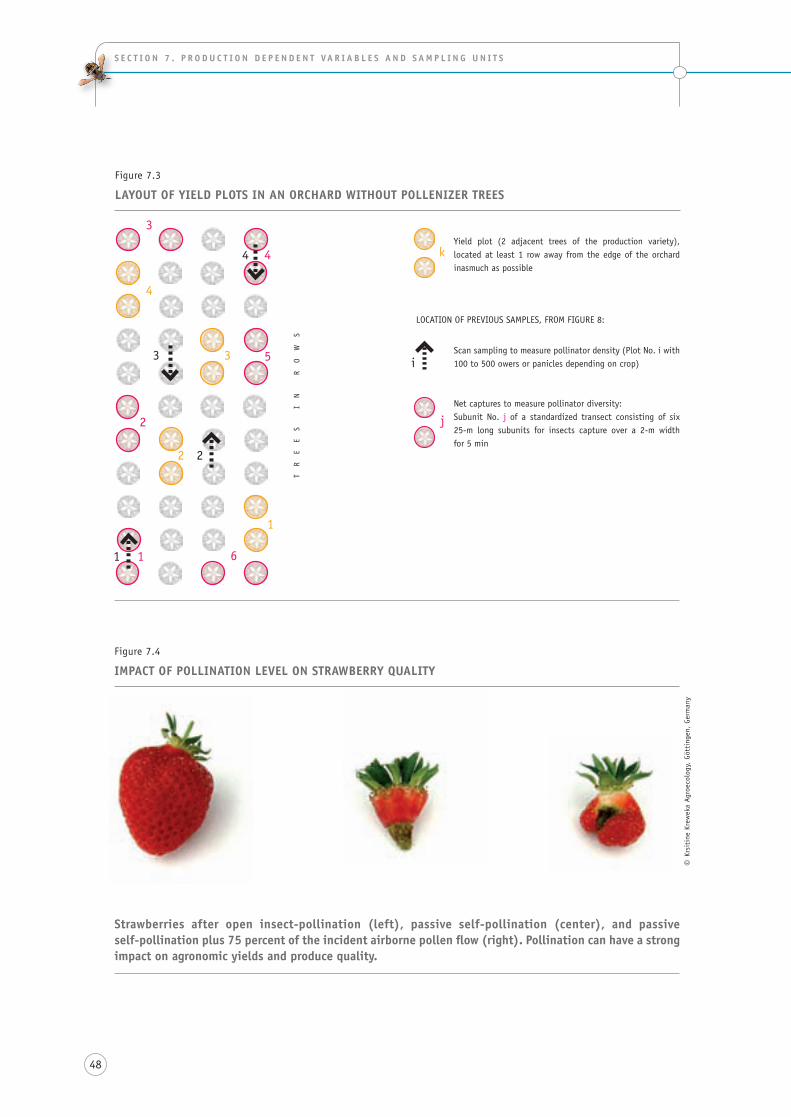
48
S E C T I O N 7 . P R O D U C T I O N D E P E N D E N T VA R I A B L E S A N D S A M P L I N G U N I T S
Figure 7.3
LAyOUT OF yIELD PLOTS IN AN ORCHARD wITHOUT POLLENIZER TREES
© Kr
siti
ne K
rew
eka
agro
ecol
ogy,
Göt
ting
en,
Germ
any
Figure 7.4
IMPACT OF POLLINATION LEVEL ON STRAwBERRy QUALITy
Strawberries after open insect-pollination (left), passive self-pollination (center), and passive self-pollination plus 75 percent of the incident airborne pollen flow (right). Pollination can have a strong impact on agronomic yields and produce quality.
Yield plot (2 adjacent trees of the production variety), located at least 1 row away from the edge of the orchard inasmuch as possible
location oF previoUs saMples, FroM FiGUre 8:
scan sampling to measure pollinator density (plot no. i with 100 to 500 owers or panicles depending on crop)
net captures to measure pollinator diversity:subunit no. j of a standardized transect consisting of six 25-m long subunits for insects capture over a 2-m width for 5 min
i
3
4
3 3
2
22
1 61
4 4
5
1
tr
ee
s
in
r
oW
s
k
j
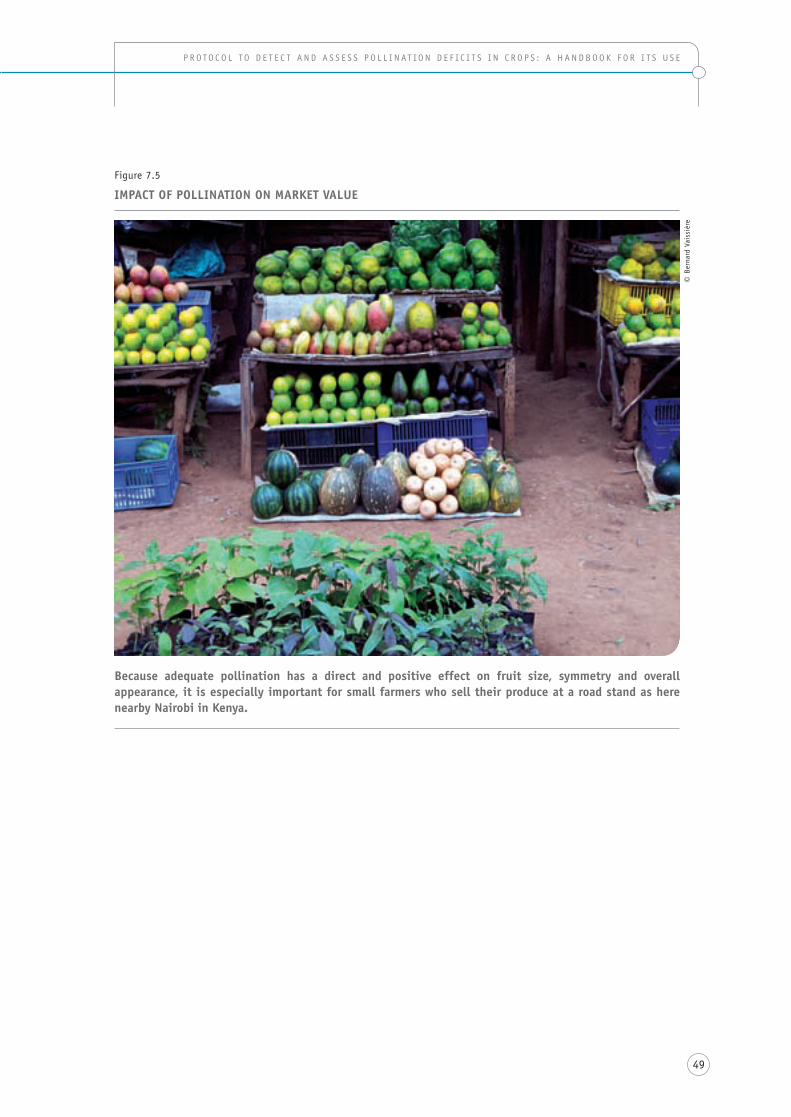
49
p r oto c o l t o d e t e c t a n d a s s e s s p o l l i n at i o n d e F i c i t s i n c r o p s : a h a n d B o o K F o r i t s U s e
© B
erna
rd V
aiss
ière
Figure 7.5
IMPACT OF POLLINATION ON MARKET VALUE
Because adequate pollination has a direct and positive effect on fruit size, symmetry and overall appearance, it is especially important for small farmers who sell their produce at a road stand as here nearby Nairobi in Kenya.
50
section 8 STATISTICAL ANALySES
With a completely randomized design with one factor with two levels (e.g. Figure 3.2), control
sites without introduced pollinators will have a factor value set at 0 while fields with introduced
pollinators using a fixed stocking rate will have a factor value set at 1. the values of the
dependent variables for the two groups will then be easily contrasted using usual one-way anova
procedures. When pairs or blocks of fields are used, similar methods can be used using adapted
anova procedures. When a factorial design is used for a combination of two treatments (e.g.
Figure 3.3), a two-way anova should be used so as to be able to test the effect of interaction
between the two factors.
this will probably not be so with the distance to the closest patch of natural habitat or
the proportion of natural habitat in a 2 km radius around each study field as those values are
continuous and will probably vary from field to field along a gradient so that regression analyses
may be more appropriate to analyze the results of the landscape treatments.
For large fields with a gradient of distances from the pollinator front, anova with contrasts
or regression methods should be used depending on the number of distances set from the
pollinator front.
in all cases, it will also be of interest to look at the correlation between forager density
and diversity on one hand and the yield variables on the other, as in hoehn et al. (2008). this
will be especially important in drawing appropriate management conclusions from the studies
conducted using the proposed protocol.
51
p r oto c o l t o d e t e c t a n d a s s e s s p o l l i n at i o n d e F i c i t s i n c r o p s : a h a n d B o o K F o r i t s U s e
section 9 GENERAL CONCLUSIONS
the present protocol was developed for use by the seven countries in the GeF/Unep/Fao project
on the “conservation and Management of pollinators for sustainable agriculture through an
ecosystem approach“: Brazil, Ghana, india, Kenya, nepal, pakistan, and south africa. it is by
no means meant to be restricted to these countries. indeed, this protocol has been developed
so as to encompass the largest array of crops and situations possible. it is anticipated that it
can be used over a wide range of crops and in many countries so that it becomes possible to
better document the pollination situation for as many animal-pollinated crops as possible on a
worldwide basis. it is therefore hoped that many people will find this protocol useful and will
adopt it and share their experience with it in return and provide feedback so as to improve it.
this protocol can be downloaded for free on the web site at
http://www.internationalpollinatorsinitiative.org/jsp/documents/documents.jsp;
a discussion forum on the use of this protocol is available at
http://www.fao.org/agriculture/crops/core-themes/theme/spi/gppp/gppp-home/en.
Finally, it should be stressed that this protocol is aimed to address pollination as a production
factor at the farm scale level. as such, one should always remember that, as a production factor
in its own right, pollination management needs to be fully integrated into the overall farm
management system to optimize production in a holistic and sustainable way.

53
p r oto c o l t o d e t e c t a n d a s s e s s p o l l i n at i o n d e F i c i t s i n c r o p s : a h a n d B o o K F o r i t s U s e
REFERENCES
Albrecht M., Duelli P., Müller C., Kleijn D., Schmid B. 2007. the swiss agri-environment scheme enhances pollinator diversity and plant reproductive success in nearby intensively managed farmland. J. appl. ecol. 44:813-822.
Aras P. D., De Oliveira P., Savoie L. 1996. effect of a honey bee (hymenoptera: apidae) gradient on the pollination and yield of lowbush blueberry. J. econ. entomol. 89:1080-1083.
Banda H.j., Paxton R. j. 1991. pollination of greenhouse tomatoes by bees. acta hort. 288:194-198.
Barbier E., Berrada A., Straub j.M. 1967. effets de butinage des abeilles sur la teneur en matières grasses des graines de tournesol (Helianthus annuus l.). el awamia 22:1-12.
Beil M,, Horn H., Schwabe A. 2008. analysis of pollen loads in a wild bee community (hymenoptera: apidae), a method for elucidating habitat use and foraging distances. apidologie 39:456-467.
Blanche R., Cunningham S.A. 2005. rain forest provides pollinating beetles for atemoya crops. J. econ. entomol. 98:1193-1201.
Blanche K.R., Ludwig j.A., Cunningham S.A. 2006. proximity to rainforest enhances pollination and fruit set in orchards. J. appl. ecol. 43:1182-1187.
Bouwmeester H.j., Smid H.G., Loman E. 1995. seed yield in caraway (Carum carvi). 2. role of assimilate availability. J. agric. sci. 124:245-251.
Buchmann S.L., Shipman C.w. 1991. Foraging distances flown by honey bee colonies: analyses using Mathematica software. am. Bee J. 131:771.
Chacoff N.P, Aizen M.A. 2006. edge effects on flower-visiting insects in grapefruit plantations bording premontane subtropical forest. J. appl. ecol. 43:18-27.
Delaplane K.S., Mayer D.F. 2000. crop pollination by bees. caBi publishing, new York, Usa. 332 pp.
Falque, M. 1994. Fécondation et développement des fruits et des graines chez le cacaoyer (Theobroma cacao l.) influence de l’irradiation du pollen et de l’intensité de la pollinisation.thèse. inst. nat. polytech. toulouse, F.
Free, j.B. 1993. insect pollination of crops. 2nd. ed. academic press, london. 684 pp.
Freitas B.M., Oliveira Filho j.H. de. 2003. ninhos racionais para mamangava (Xylocopa frontalis) na polinização do maracujá-amarelo (Passiflora edulis). ciéncia rural 33:1135 1139.
Gonzalez M.V., Coque M., Herrero M. 1998. influence of pollination systems on fruit set and fruit quality in kiwifruit (Actinidia deliciosa). ann. appl. Biol. 132:349-355.
54
Goulson D. 2003. effects of introduced bees on native ecosystems. ann. rev. ecol. evol. syst. 34:1-26.
Greenleaf S.S., Kremen C. 2006. Wild bees enhance honey bees’ pollination of hybrid sunflower. proc. nat. acad. sci. Usa 103:13890-13895.
Hingston A.B., McQuillan P.B. 1999. displacement of tasmanian native megachilid bees by the recently introduced bumblebee Bombus terrestris (linnaeus, 1758) (hymenoptera : apidae) aust. J. zool. 47:59-65.
Hoehn P., Tscharntke T., Tylianakis j. M., Steffan-Dewenter I. 2008. Functional group diversity of bee pollinators increases crop yield. proc. r. soc. B. 275:2283-2291.
Hogendoorn K., Bartholomaeus F., Keller M.A. 2010. chemical and sensory comparison of tomatoes pollinated by bees and by a pollination wand. J. econ. entomol. 103:1286-1292.
Inoue M.N., yokoyama j., washitani I. 2008. displacement of Japanese native bumblebees by the recently introduced Bombus terrestris (l.) (hymenoptera: apidae). J. insect conserv. 12:135-146.
Kato M., Kawakita A. 2004. plant-pollinator interactions in new caledonia influenced by introduced honey bees. am. J. Bot. 91:1814-1827.
Kaufmann T. 1975. Biology and behaviour of cocoa pollinating ceratopogonidae in Ghana. environ. entomol. 4:347-351.
Kevan P.G. 1977. Blueberry crops in nova scotia and new Brunswick: pesticides and crop reductions. canad. J. agric. econ. 25:61-64.
Kevan P.G, Eisikowitch D. 1990. the effects of insect pollination on canola (Brassica napus l. cv. o.a.c. triton) seed germination. euphytica 45:39-41.
Klein A.M., Steffan-Dewenter I., Tscharntke T. 2003. Fruit set of highland coffee increases with the diversity of pollinating bees. proc. roy. soc. london (B) 270:955-961.
Klein A.M., Vaissière B.E., Cane j.H., Steffan-Dewenter I., Cunningham S.A., Kremen C., Tscharntke T. 2007. importance of pollinators in changing landscapes for world crops. proc. roy. soc. B. 274:303-313.
Knight T.M., Steets j.A., Vamosi j.C., Mazer S.j., Burd M., Campbell D.R., Dudash M.R., johnston M.O., Mitchell R.j., Ashman T.L. 2005. pollen limitation of plant reproduction: pattern and processes. ann. rev. ecol. evol. syst. 36:467-497.
Lerin j. 1982. effets de la pollinisation entomophile sur le colza dans une expérience en cage. agronomie 2:249-256.
Levin M.D., Kuehl R.O., Carr R.V. 1968. comparison of three sampling methods for estimating honeybee visitation to flowers of cucumbers. J. econ. entomol. 61:1487-1489.
McGregor, S.E. 1976. insect pollination of cultivated crop plants. agric. handb. 496. U.s. dept. agric. U.s. Govt. print. off., Washington, d.c. 411 pp.
Martins D.j., johnson S.D. 2009. distance and quality of natural habitat influence hawkmoth pollination of cultivated papaya. int. J. trop. insect sci. 29:114-123.
Matsumura C., yokoyama j., washitani I. 2004. invasion status and potential ecological impacts of an invasive alien bumblebee, Bombus terrestris l. (hymenoptera: apidae) naturalized in southern hokkaido, Japan. Global environ. res. 8:51-66.
55
p r oto c o l t o d e t e c t a n d a s s e s s p o l l i n at i o n d e F i c i t s i n c r o p s : a h a n d B o o K F o r i t s U s e
Oliveira R., Schlindwein C., Martins C.F., Zanella, F. 2006. producçåo natural de mangabas. probio, Brazil.
Osborne j.L, Martin A.P., Carreck N.L., Swain j.L., Knight M.E., Goulson D., Hale R.j., Sanderson R.A. 2008. Bumblebee flight distances in relation to the forage landscape. J. anim. ecol. 77:406-415.
Pasquet R.S, Peltier A., Hufford M.B., Oudin E., Saulnier j., Paul L, Knudsen j.T., Herren H.R., Gepts P. 2008. long-distance pollen flow assessment through evaluation of pollinator foraging range suggests transgene escape distances. proc. nat. acad. sci. Usa 105:13456-13461.
Plischuk S., Martín-Hernandéz R., Prieto L,. Lucía M., Botías C., Meana A., Abrahamovich A.H., Lange C, Higes M. 2009. south american native bumblebees (hymenoptera: apidae) infected by Nosema ceranae (Microsporidia), an emerging pathogen of honeybees (Apis mellifera). env. Microbiol. reports 1:131-135.
Rader R., Howlett B.G., Cunningham S.A., westcott D.A., Newstrom-Lloyd L.E., walker M.K., Teulon D.A.j., Edwards w. 2009. alternative pollinator taxa are equally efficient but not as effective as the honeybee in a mass flowering crop. J. appl. ecol. 46:1080-1087.
Ricketts T.H., Regetz j., Steffan-Dewenter I., Cunningham S.A., Kremen C., Bogdanski A., Gemmill-Herren B., Greenleaf S.S., Klein A.M., Mayfield M.M., Morandin L.A., Ochieng A., Viana B.F. 2008. landscape effects on crop pollination services: are there general patterns? ecol. lett. 11:499-515.
Roubik D.w. 2002. the value of bees to the coffee harvest. nature 417:708.
Sabbahi R., De Oliveira D., Marceau j. 2006. does the honeybee (hymenoptera: apidae) reduce the blooming period of canola? J. agron. crop sci. 192:233-237.
Sanzol j., Herrero M. 2001. the “effective pollination period” in fruit trees. sci. hort. 90:1-17.
Steffan-Dewenter I. 2003. seed set of male-sterile and male-fertile oilseed rape (Brassica napus) in relation to pollinator density. apidol. 34:227-235.
Steffan-Dewenter I., Tscharntke T. 2000. resource overlap and possible competition between honey bees and wild bees in central europe. oecologia 122:288-296.
Stout j.C., Kells A.R., Goulson D. 2002. pollination of the invasive exotic shrub Lupinus arboreus (Fabaceae) by introduced bees in tasmania. Biol. conserv. 106:425-434.
Vaissière, B.E., Moffett j.O., Loper G.M. 1984. honey bees as pollinators for hybrid cotton seed production on the texas high plains. agron. J. 76:1005-1010.
Vaissière B., Torre Grossa j.P., Rodet G., Malaboeuf F. 1992. la pollinisation du kiwi, Actinidia deliciosa var. deliciosa chev. (actinidiaceae). arboriculture Fruitière 456:16-22
westphal C., Bommarco R., Carré G., Lamborn L., Morison N., Petanidou T., Potts S.G., Roberts S.P.M., Szentgyörgyi H., Tscheulin T., Vaissière B.E., woyciechowski M., Biesmeijer j.C., Kunin w.E., Settele j, Steffan-Dewenter I. 2008. Measuring bee biodiversity in different european habitats and biogeographical regions. ecological Monographs 78:653-671.
wilcock C.C., Neiland M.RM. 2002. pollination failure in plants: why it happens and when it matters. trends plant sci. 7:271-277.

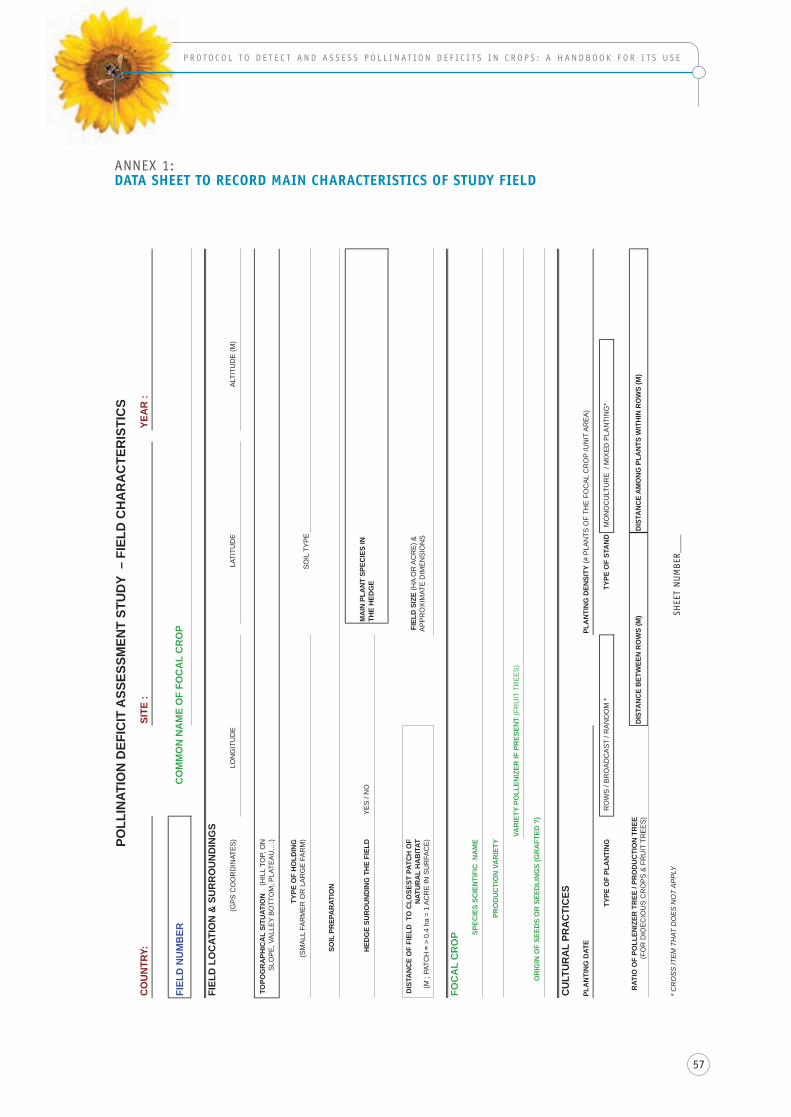
57
p r oto c o l t o d e t e c t a n d a s s e s s p o l l i n at i o n d e F i c i t s i n c r o p s : a h a n d B o o K F o r i t s U s e
anneX 1: DATA SHEET TO RECORD MAIN CHARACTERISTICS OF STUDy FIELD
ANN
EX 1
: D
ATA
SHEE
T TO
REC
ORD
MAI
N CH
ARAC
TERI
STIC
S O
F ST
UD
Y FI
ELD
SHEE
T NU
MBE
R __
_
POLL
INAT
ION
DEF
ICIT
ASS
ESSM
ENT
STU
DY
– F
IELD
CH
AR
AC
TER
ISTI
CS
CO
UN
TRY:
SITE
:YE
AR
:
FIEL
D N
UM
BER
CO
MM
ON
NA
ME
OF
FOC
AL
CR
OP
FIEL
D L
OC
ATIO
N &
SU
RR
OU
ND
ING
S
(GPS
CO
OR
DIN
ATES
)LO
NG
ITU
DE
LATI
TUD
EAL
TITU
DE
(M)
TOPO
GR
APH
ICA
L SI
TUAT
ION
(H
ILL
TOP,
ON
SL
OPE
, VAL
LEY
BOTT
OM
, PLA
TEAU
,…)
TYPE
OF
HO
LDIN
G
(SM
ALL
FAR
MER
OR
LAR
GE
FAR
M)
SOIL
TYP
E
SOIL
PR
EPA
RAT
ION
HED
GE
SUR
OU
ND
ING
TH
E FI
ELD
YES
/ NO
DIS
TAN
CE
OF
FIEL
D T
O C
LOSE
ST P
ATC
H O
F N
ATU
RA
L H
AB
ITAT
(M
; PA
TCH
>
0.4
ha
= 1
ACR
E IN
SU
RFA
CE)
FOC
AL
CR
OP SP
ECIE
S SC
IEN
TIFI
C N
AM
E
PRO
DU
CTI
ON
VA
RIE
TY VA
RIE
TY P
OLL
ENIZ
ER IF
PR
ESEN
T (F
RU
IT T
REE
S)
CU
LTU
RA
L PR
AC
TIC
ES
PLA
NTI
NG
DAT
EPL
AN
TIN
G D
ENSI
TY (#
PLA
NTS
OF
THE
FOC
AL C
RO
P /U
NIT
AR
EA)
TYPE
OF
PLA
NTI
NG
RO
WS
/ BR
OAD
CAS
T / R
AND
OM
*TY
PE O
F ST
AN
D M
ON
OC
ULT
UR
E /
MIX
ED P
LAN
TIN
G*
DIS
TAN
CE
BET
WEE
N R
OW
S (M
)D
ISTA
NC
E A
MO
NG
PLA
NTS
WIT
HIN
RO
WS
(M)
* CR
OSS
ITEM
TH
AT D
OES
NO
T AP
PLY
MA
IN P
LAN
T SP
ECIE
S IN
TH
E H
EDG
E
FIEL
D S
IZE
(HA
OR
AC
RE)
&
APPR
OXI
MAT
E D
IMEN
SIO
NS
RAT
IO O
F PO
LLEN
IZER
TR
EE /
PRO
DU
CTI
ON
TR
EE
(FO
R D
IOEC
IOU
S C
RO
PS &
FR
UIT
TR
EES)
OR
IGIN
OF
SEED
S O
R S
EED
LIN
GS
(GR
AFT
ED ?
)
shee
t n
UM
Ber
____
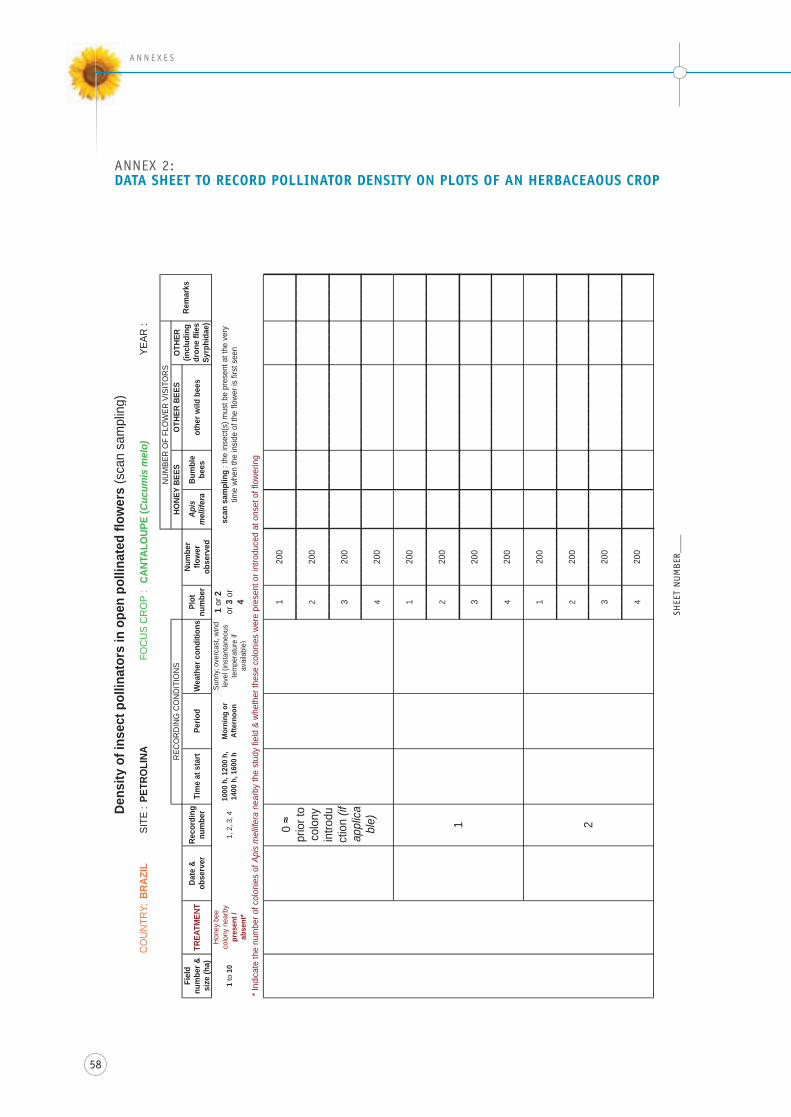
58
A N N E X E s
anneX 2: DATA SHEET TO RECORD POLLINATOR DENSITy ON PLOTS OF AN HERBACEAOUS CROP
ANNE
X 2:
DAT
A SH
EET
TO R
ECO
RD P
OLL
INAT
OR
DEN
SITY
ON
PLO
TS O
F AN
HER
BACE
AOU
S CR
OP
SHEE
T NU
MBE
R __
_
Dens
ity o
f ins
ect p
ollin
ator
s in
ope
n po
llina
ted
flow
ers
(sca
n sa
mpl
ing)
CO
UN
TRY:
BRAZ
ILSI
TE :
PETR
OLI
NAFO
CU
S C
RO
P :
CANT
ALO
UPE
(Cuc
umis
mel
o)YE
AR :
NU
MBE
R O
F FL
OW
ER V
ISIT
OR
SR
ECO
RD
ING
CO
ND
ITIO
NS
HONE
Y BE
ESO
THER
BEE
SFi
eld
num
ber &
si
ze (h
a)TR
EATM
ENT
Date
&
obse
rver
Reco
rdin
g nu
mbe
rTi
me
at s
tart
Perio
dW
eath
er c
ondi
tions
Plot
nu
mbe
r
Num
ber
flow
er
obse
rved
Apis
m
ellif
era
Bum
ble
bees
othe
r wild
bee
s
1 to
10
Hon
ey b
ee
colo
ny n
earb
y pr
esen
t /
abse
nt*
1, 2
, 3, 4
1000
h, 1
200
h,
1400
h, 1
600
hM
orni
ng o
r Af
tern
oon
Sunn
y, ov
erca
st, w
ind
leve
l (in
stan
tane
ous
tem
pera
ture
if
avai
labl
e)
1 or
2
or 3
or
4
scan
sam
plin
g : t
he in
sect
(s) m
ust b
e pr
esen
t at t
he v
ery
time
whe
n th
e in
side
of t
he fl
ower
is fi
rst s
een
* Ind
icat
e th
e nu
mbe
r of c
olon
ies
of A
pis
mel
lifer
a ne
arby
the
stud
y fie
ld &
whe
ther
thes
e co
loni
es w
ere
pres
ent o
r int
rodu
ced
at o
nset
of f
low
erin
g
120
0
220
0
320
0
420
0
120
0
220
0
320
0
420
0
120
0
220
0
320
0
420
0
OTH
ER
(incl
udin
g dr
one
flies
Sy
rphi
dae)
Rem
arks
0
prio
r to
colo
ny
intro
duct
ion
(if
appl
ica
ble) 1 2
shee
t n
UM
Ber
____
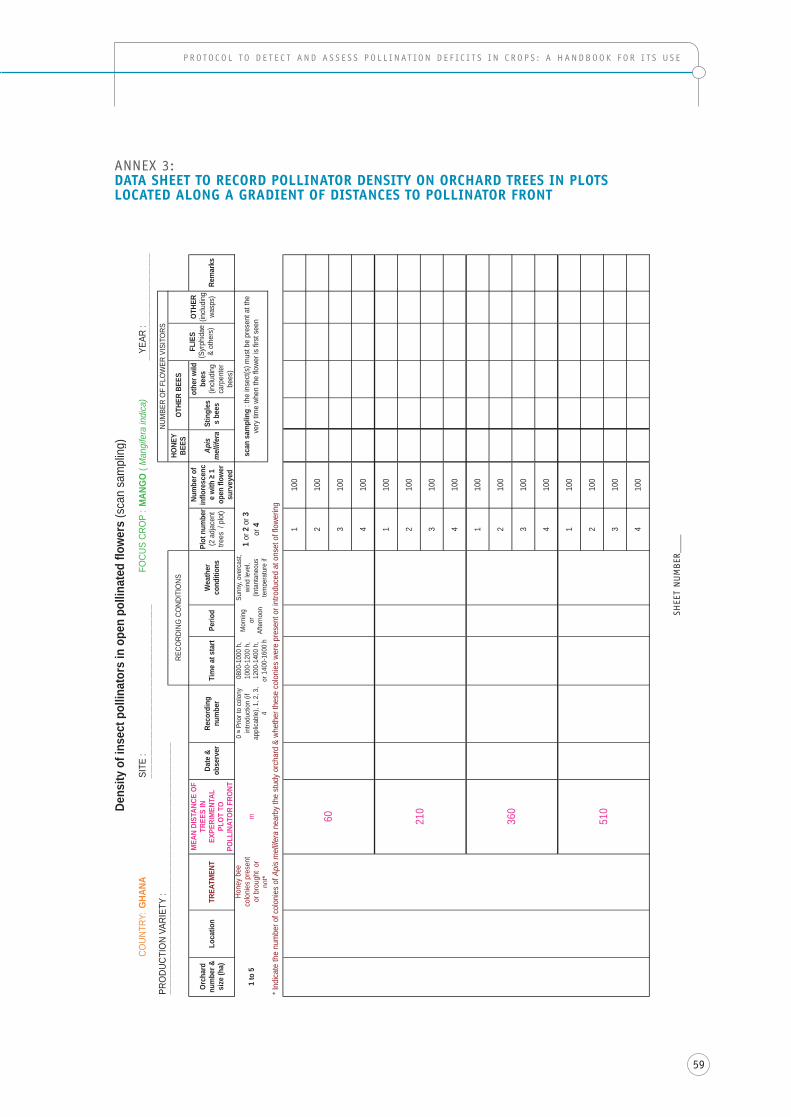
59
p r oto c o l t o d e t e c t a n d a s s e s s p o l l i n at i o n d e F i c i t s i n c r o p s : a h a n d B o o K F o r i t s U s e
anneX 3: DATA SHEET TO RECORD POLLINATOR DENSITy ON ORCHARD TREES IN PLOTS LOCATED ALONG A GRADIENT OF DISTANCES TO POLLINATOR FRONT
ANNE
X 3:
DAT
A SH
EET
TO R
ECOR
D PO
LLIN
ATOR
DEN
SITY
ON
ORCH
ARD
TREE
S IN
PLO
TS L
OCAT
ED A
LONG
A G
RADI
ENT
OF D
ISTA
NCES
TO
POLL
INAT
OR F
RONT
SHEE
T NU
MBE
R __
_
Dens
ity o
f ins
ect p
ollin
ator
s in
ope
n po
llina
ted
flowe
rs (s
can
sam
plin
g)
COUN
TRY:
GHAN
ASI
TE :
FOCU
S CR
OP
:YE
AR :
PRO
DUCT
ION
VARI
ETY
:NU
MBE
R O
F FL
OW
ER V
ISIT
ORS
HONE
Y BE
ES
Orch
ard
num
ber &
si
ze (h
a)Lo
catio
nTR
EATM
ENT
MEA
N DI
STAN
CE O
F TR
EES
IN
EXPE
RIM
ENTA
L PL
OT T
O PO
LLIN
ATOR
FRO
NT
Date
&
obse
rver
Reco
rdin
g nu
mbe
rTi
me
at s
tart
Perio
dW
eath
er
cond
ition
s
Plot
num
ber
(2 a
djac
ent
trees
/ p
lot)
Num
ber o
f in
flore
scen
ce
with
1
op
en fl
ower
su
rvey
ed
Apis
m
ellif
era
Stin
gles
s be
es
othe
r wild
be
es
(inclu
ding
ca
rpen
ter
bees
)
OTHE
R (in
cludi
ng
wasp
s)Re
mar
ks
1 to
5
Hone
y be
e co
loni
es p
rese
nt
or b
roug
ht o
r no
t*
m
0 P
rior t
o co
lony
in
trodu
ctio
n (if
ap
plica
ble)
, 1, 2
, 3,
4
0800
-100
0 h,
10
00-1
200
h,
1200
-140
0 h,
or 1
400-
1600
h
Mor
ning
or
Af
tern
oon
Sunn
y, ov
erca
st,
wind
leve
l, (in
tant
aneo
us
tem
pera
ture
if
1 or
2 o
r 3
or 4
scan
sam
plin
g : t
he in
sect
(s) m
ust b
e pr
esen
t at t
he
very
tim
e wh
en th
e flo
wer i
s fir
st s
een
* Ind
icate
the
num
ber o
f col
onie
s of
Api
s m
ellife
ra n
earb
y th
e st
udy
orch
ard
& wh
ethe
r the
se c
olon
ies
were
pre
sent
or i
ntro
duce
d at
ons
et o
f flo
werin
g
110
0
210
0
310
0
410
0
110
0
210
0
310
0
410
0
110
0
210
0
310
0
410
0
110
0
210
0
310
0
410
0
MAN
GO (
Man
gife
ra in
dica
)
RECO
RDIN
G C
OND
ITIO
NSOT
HER
BEES
FLIE
S (S
yrph
idae
&
othe
rs)
60 210
360
510
shee
t n
UM
Ber
____
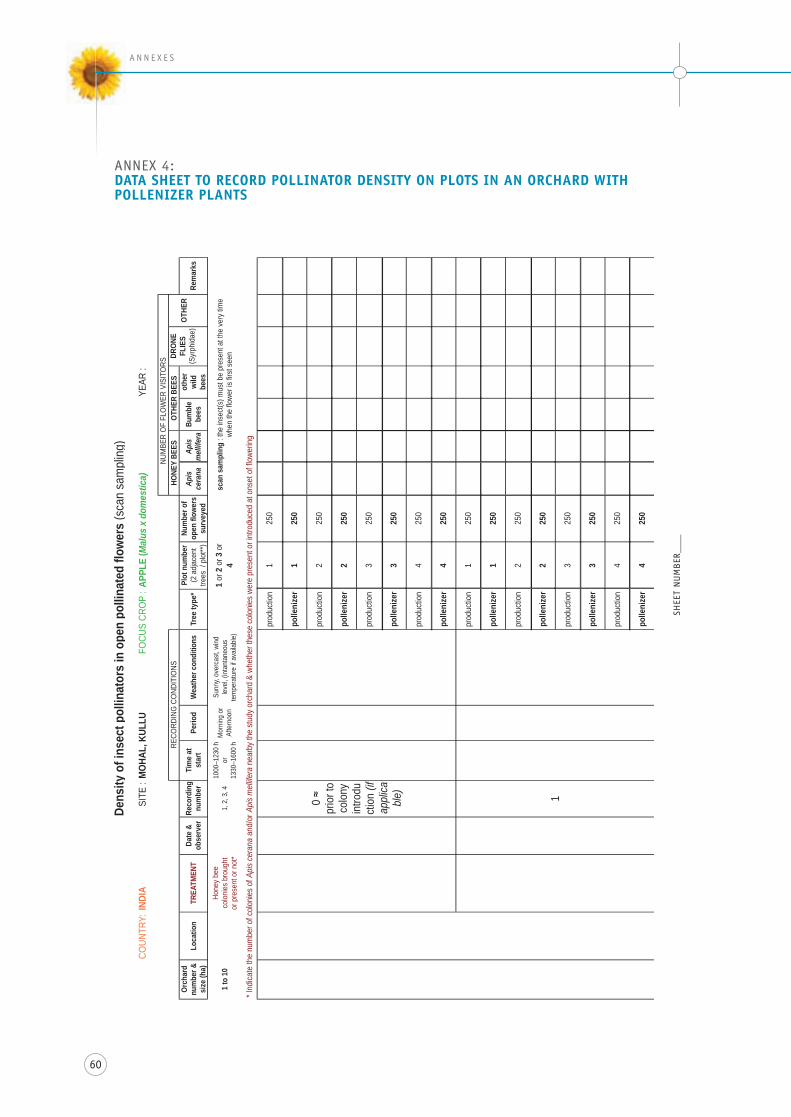
60
A N N E X E s
anneX 4: DATA SHEET TO RECORD POLLINATOR DENSITy ON PLOTS IN AN ORCHARD wITH POLLENIZER PLANTS
ANNE
X 4:
DAT
A SH
EET
TO R
ECOR
D PO
LLIN
ATOR
DEN
SITY
ON
PLOT
S IN
AN O
RCHA
RD W
ITH
POLL
ENIZ
ER P
LANT
S
SHEE
T NU
MBER
___
COUN
TRY:
INDI
ASI
TE :
FOCU
S CR
OP
:YE
AR :
Orch
ard
num
ber &
si
ze (h
a)Lo
catio
nTR
EATM
ENT
Date
&
obse
rver
Reco
rdin
g nu
mbe
rTi
me
at
star
tPe
riod
Wea
ther
con
ditio
nsTr
ee ty
pe*
Plot
num
ber
(2 a
djac
ent
trees
/ p
lot**
)
Num
ber o
f op
en fl
ower
s su
rvey
ed
Apis
ce
rana
Apis
m
ellif
era
Bum
ble
bees
othe
r wi
ld
bees
OTHE
RRe
mar
ks
1 to
10
Hone
y be
e co
loni
es b
roug
ht
or p
rese
nt o
r not
*1,
2, 3
, 410
00–1
230
h or
13
30–1
600
h
Mor
ning
or
Afte
rnoo
n
Sunn
y, ov
erca
st, w
ind
leve
l, (in
tant
aneo
us
tem
pera
ture
if a
vaila
ble)
1 or
2 o
r 3 o
r 4
* Ind
icate
the
num
ber o
f col
onie
s of
Api
s ce
rana
and
/or A
pis
mel
lifera
nea
rby
the
stud
y or
char
d &
whet
her t
hese
col
onie
s we
re p
rese
nt o
r int
rodu
ced
at o
nset
of f
lowe
ring
scan
sam
plin
g : t
he in
sect
(s) m
ust b
e pr
esen
t at t
he v
ery
time
when
the
flowe
r is
first
see
nDRON
E FL
IES
(Syr
phid
ae)
Dens
ity o
f ins
ect p
ollin
ator
s in
ope
n po
llina
ted
flowe
rs (s
can
sam
plin
g)
MOH
AL, K
ULLU
APPL
E (M
alus
x d
omes
tica)
NUM
BER
OF
FLO
WER
VIS
ITO
RSRE
CORD
ING
CO
NDIT
IONS
HONE
Y BE
ESOT
HER
BEES
prod
uctio
n1
250
polle
nize
r1
250
prod
uctio
n2
250
polle
nize
r2
250
prod
uctio
n3
250
polle
nize
r3
250
prod
uctio
n4
250
polle
nize
r4
250
prod
uctio
n1
250
polle
nize
r1
250
prod
uctio
n2
250
polle
nize
r2
250
prod
uctio
n3
250
polle
nize
r3
250
prod
uctio
n4
250
polle
nize
r4
250
0
prio
r to
colo
ny
intro
duct
ion
(i f
appl
icabl
e) 1
shee
t n
UM
Ber
____
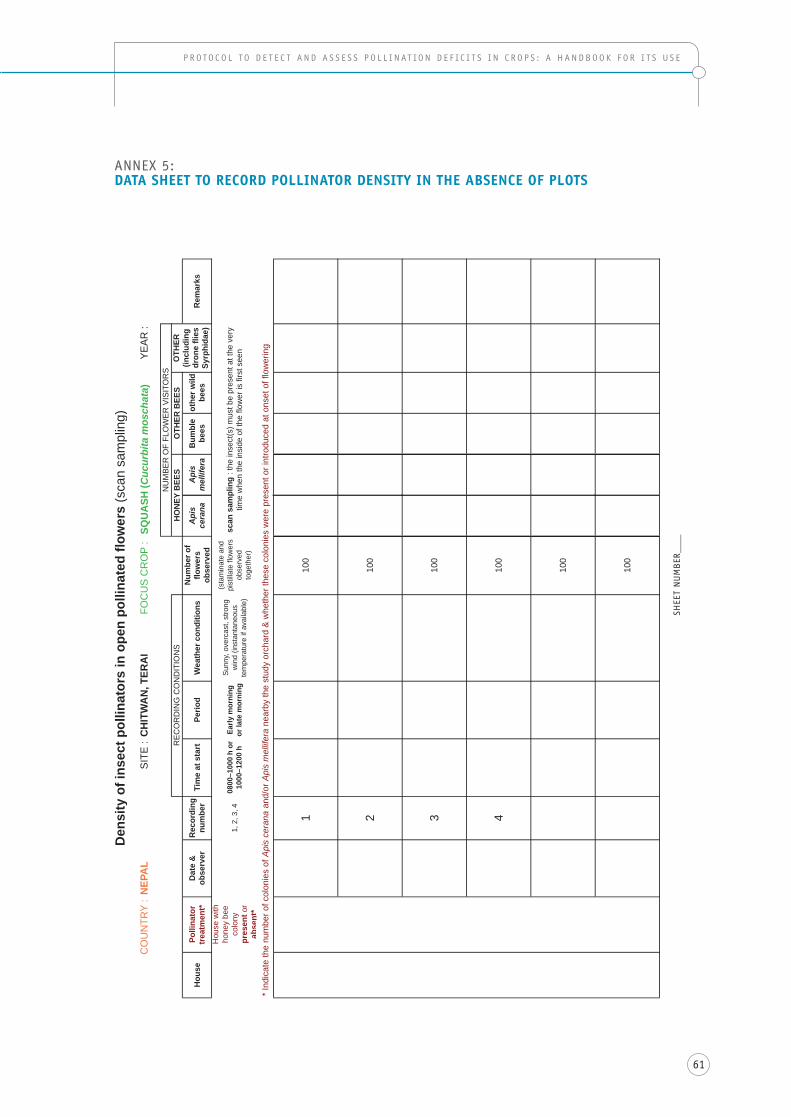
61
p r oto c o l t o d e t e c t a n d a s s e s s p o l l i n at i o n d e F i c i t s i n c r o p s : a h a n d B o o K F o r i t s U s e
anneX 5: DATA SHEET TO RECORD POLLINATOR DENSITy IN THE ABSENCE OF PLOTS
ANN
EX 5
: DAT
A SH
EET
TO R
ECO
RD P
OLL
INAT
OR
DEN
SITY
IN T
HE
ABS
ENCE
OF
PLO
TS
SHEE
T NU
MBE
R __
_
Den
sity
of i
nsec
t pol
linat
ors
in o
pen
polli
nate
d flo
wer
s (s
can
sam
plin
g)
CO
UN
TRY
:N
EPA
LSI
TE :
CH
ITW
AN
, TER
AI
FOC
US
CR
OP
: SQ
UA
SH (C
ucur
bita
mos
chat
a)YE
AR :
NU
MBE
R O
F FL
OW
ER V
ISIT
OR
SR
ECO
RD
ING
CO
ND
ITIO
NS
HO
NEY
BEE
SO
THER
BEE
S
Hou
sePo
llina
tor
trea
tmen
t*D
ate
&
obse
rver
Rec
ordi
ng
num
ber
Tim
e at
sta
rtPe
riod
Wea
ther
con
ditio
nsN
umbe
r of
flow
ers
obse
rved
Api
s ce
rana
Api
s m
ellif
era
Bum
ble
bees
othe
r wild
be
esR
emar
ks
Hou
se w
ith
hone
y be
e co
lony
pr
esen
t or
abse
nt*
1, 2
, 3, 4
0800
–100
0 h
or
1000
–120
0 h
Early
mor
ning
or
late
mor
ning
Sunn
y, o
verc
ast,
stro
ng
win
d (in
stan
tane
ous
tem
pera
ture
if a
vaila
ble)
(sta
min
ate
and
pist
illate
flow
ers
obse
rved
to
geth
er)
scan
sam
plin
g : t
he in
sect
(s) m
ust b
e pr
esen
t at t
he v
ery
time
whe
n th
e in
side
of t
he fl
ower
is fi
rst s
een
* Ind
icat
e th
e nu
mbe
r of c
olon
ies
of A
pis
cera
na a
nd/o
r Api
s m
ellif
era
near
by th
e st
udy
orch
ard
& w
heth
er th
ese
colo
nies
wer
e pr
esen
t or i
ntro
duce
d at
ons
et o
f flo
wer
ing
110
0
210
0
310
0
410
0
100
100
OTH
ER
(incl
udin
g dr
one
flies
Sy
rphi
dae)
shee
t n
UM
Ber
____
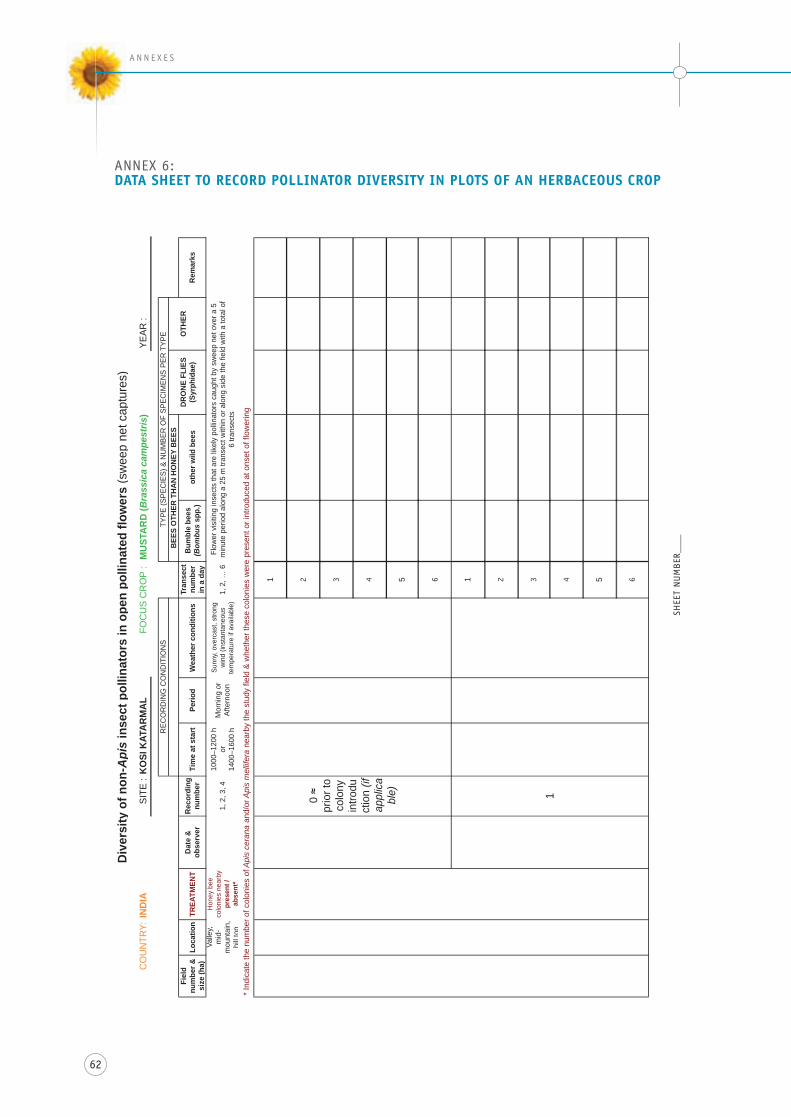
62
A N N E X E s
anneX 6: DATA SHEET TO RECORD POLLINATOR DIVERSITy IN PLOTS OF AN HERBACEOUS CROP
ANN
EX 6
: DAT
A SH
EET
TO R
ECO
RD P
OLL
INAT
OR
DIV
ERSI
TY IN
PLO
TS O
F AN
HER
BACE
OU
S CR
OP
SHEE
T NU
MBE
R __
_
Div
ersi
ty o
f non
-Api
s in
sect
pol
linat
ors
in o
pen
polli
nate
d flo
wer
s (s
wee
p ne
t cap
ture
s)C
OU
NTR
Y:IN
DIA
SITE
:K
OSI
KAT
AR
MA
LFO
CU
S C
RO
P :
MU
STA
RD
(Bra
ssic
a ca
mpe
stris
)YE
AR :
REC
OR
DIN
G C
ON
DIT
ION
STY
PE (S
PEC
IES)
& N
UM
BER
OF
SPEC
IMEN
S PE
R T
YPE
BEE
S O
THER
TH
AN
HO
NEY
BEE
SFi
eld
num
ber &
si
ze (h
a)Lo
catio
nTR
EATM
ENT
Dat
e &
ob
serv
erR
ecor
ding
nu
mbe
rTi
me
at s
tart
Perio
dW
eath
er c
ondi
tions
Tran
sect
nu
mbe
r in
a d
ay
Bum
ble
bees
(B
ombu
s sp
p.)
othe
r wild
bee
sD
RO
NE
FLIE
S (S
yrph
idae
)O
THER
Rem
arks
Valle
y,
mid
-m
ount
ain,
hi
llto
p
Hon
ey b
ee
colo
nies
nea
rby
pres
ent /
ab
sent
*
1, 2
, 3, 4
1000
–120
0 h
or
1400
–160
0 h
Mor
ning
or
Afte
rnoo
n
Sunn
y, o
verc
ast,
stro
ng
win
d (in
stan
tane
ous
tem
pera
ture
if a
vaila
ble)
1, 2
, … 6
Flow
er v
isiti
ng in
sect
s th
at a
re li
kely
pol
linat
ors
caug
ht b
y sw
eep
net o
ver a
5
min
ute
perio
d al
ong
a 25
m tr
anse
ct w
ithin
or a
long
sid
e th
e fie
ld w
ith a
tota
l of
6 tra
nsec
ts
* Ind
icat
e th
e nu
mbe
r of c
olon
ies
of A
pis
cera
na a
nd/o
r Api
s m
ellif
era
near
by th
e st
udy
field
& w
heth
er th
ese
colo
nies
wer
e pr
esen
t or i
ntro
duce
d at
ons
et o
f flo
wer
ing
1 2 3 4 5 6 1 2 3 4 5 6
10
prio
r to
colo
ny
intro
duct
ion
(if
appl
ica
ble)
shee
t n
UM
Ber
____
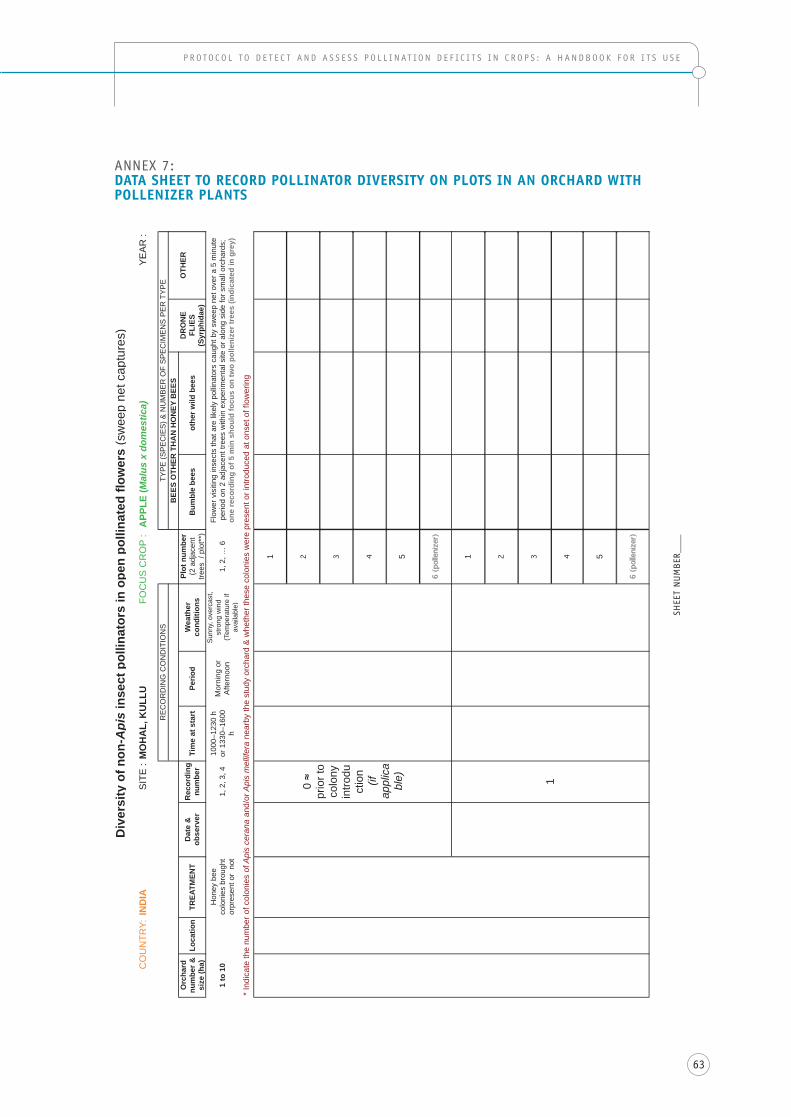
63
p r oto c o l t o d e t e c t a n d a s s e s s p o l l i n at i o n d e F i c i t s i n c r o p s : a h a n d B o o K F o r i t s U s e
anneX 7: DATA SHEET TO RECORD POLLINATOR DIVERSITy ON PLOTS IN AN ORCHARD wITH POLLENIZER PLANTS
ANN
EX 7
: DAT
A SH
EET
TO R
ECO
RD P
OLL
INAT
OR
DIV
ERSI
TY O
N P
LOTS
IN A
N O
RCH
ARD
WIT
H P
OLL
ENIZ
ER P
LAN
TS
SHEE
T N
UMBE
R __
_
Div
ersi
ty o
f non
-Api
s in
sect
pol
linat
ors
in o
pen
polli
nate
d flo
wer
s (s
wee
p ne
t cap
ture
s)
CO
UN
TRY:
IND
IAS
ITE
:M
OH
AL,
KU
LLU
FOC
US
CR
OP
: A
PPLE
(Mal
us x
dom
estic
a)Y
EA
R :
RE
CO
RD
ING
CO
ND
ITIO
NS
TYP
E (S
PE
CIE
S) &
NU
MB
ER
OF
SP
EC
IME
NS
PE
R T
YP
EB
EES
OTH
ER T
HA
N H
ON
EY B
EES
Orc
hard
nu
mbe
r &
size
(ha)
Loca
tion
TREA
TMEN
TD
ate
&
obse
rver
Rec
ordi
ng
num
ber
Tim
e at
sta
rtPe
riod
Wea
ther
co
nditi
ons
Plot
num
ber
(2 a
djac
ent
trees
/ p
lot*
*)B
umbl
e be
esot
her w
ild b
ees
DR
ON
E FL
IES
(Syr
phid
ae)
OTH
ERR
emar
ks
1 to
10
Hon
ey b
ee
colo
nies
bro
ught
or
pres
ent o
r no
t1,
2, 3
, 410
00–1
230
h or
133
0–16
00
h
Mor
ning
or
Afte
rnoo
n
Sun
ny, o
verc
ast,
stro
ng w
ind
(Tem
pera
ture
if
avai
labl
e)
1, 2
, … 6
Flow
er v
isiti
ng in
sect
s th
at a
re li
kely
pol
linat
ors
caug
ht b
y sw
eep
net o
ver a
5 m
inut
e pe
riod
on 2
adj
acen
t tre
es w
ithin
exp
erim
enta
l site
or a
long
sid
e fo
r sm
all o
rcha
rds;
on
e re
cord
ing
of 5
min
sho
uld
focu
s on
two
polle
nize
r tre
es (i
ndic
ated
in g
rey)
* In
dica
te th
e nu
mbe
r of c
olon
ies
of A
pis
cera
na a
nd/o
r Api
s m
ellif
era
near
by th
e st
udy
orch
ard
& w
heth
er th
ese
colo
nies
wer
e pr
esen
t or i
ntro
duce
d at
ons
et o
f flo
wer
ing
1 2 3 4 5
6 (p
olle
nize
r)
1 2 3 4 5
6 (p
olle
nize
r)
0
prio
r to
colo
ny
intro
duct
ion
(if
ap
plic
abl
e) 1
shee
t n
UM
Ber
____
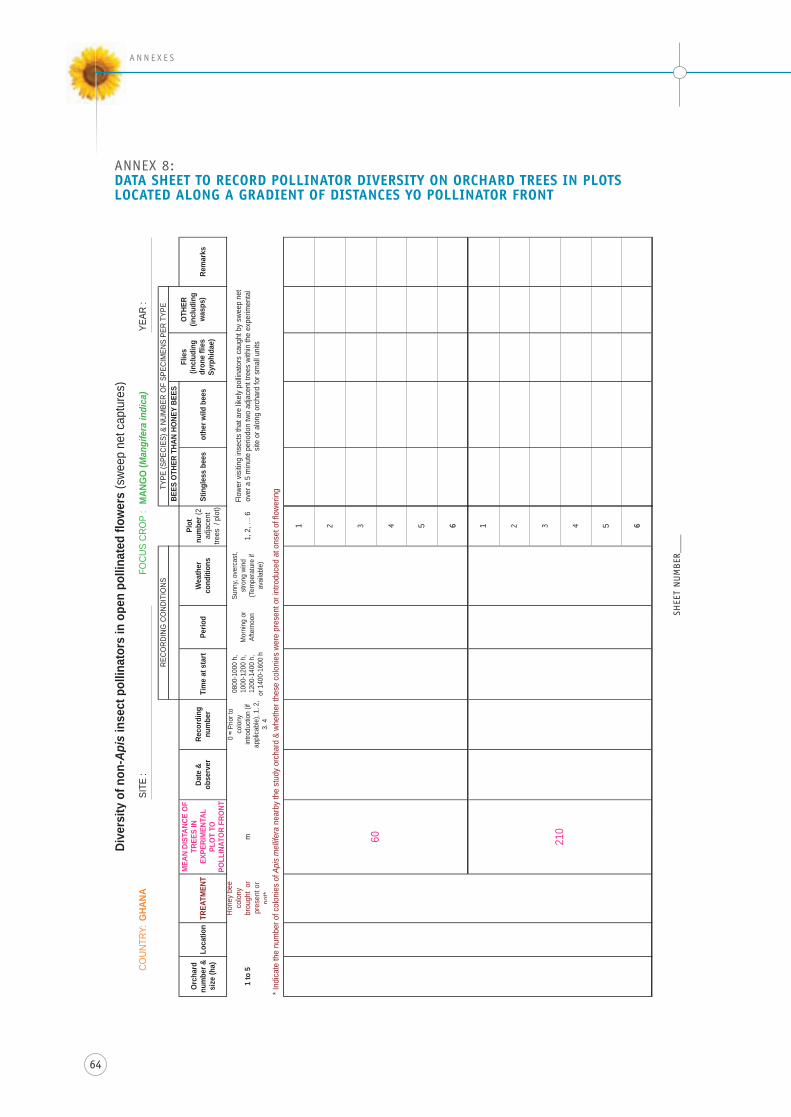
64
A N N E X E s
anneX 8: DATA SHEET TO RECORD POLLINATOR DIVERSITy ON ORCHARD TREES IN PLOTS LOCATED ALONG A GRADIENT OF DISTANCES yO POLLINATOR FRONT
ANNE
X 8:
DAT
A SH
EET
TO R
ECOR
D PO
LLIN
ATOR
DIV
ERSI
TY O
N OR
CHAR
D TR
EES
IN P
LOTS
LOC
ATED
ALO
NG A
GRA
DIEN
T OF
DIS
TANC
ES Y
O PO
LLIN
ATOR
FRO
NT
SHEE
T NU
MBE
R __
_
Dive
rsity
of n
on-A
pis
inse
ct p
ollin
ator
s in
ope
n po
llina
ted
flow
ers
(swe
ep n
et c
aptu
res)
COUN
TRY:
GHA
NASI
TE :
FOCU
S CR
OP
: M
ANG
O (M
angi
fera
indi
ca)
YEAR
:
RECO
RDIN
G C
OND
ITIO
NSTY
PE (S
PECI
ES) &
NUM
BER
OF
SPEC
IMEN
S PE
R TY
PEBE
ES O
THER
THA
N HO
NEY
BEES
Orc
hard
nu
mbe
r &
size
(ha)
Loca
tion
TREA
TMEN
T
MEA
N DI
STAN
CE O
F TR
EES
IN
EXPE
RIM
ENTA
L PL
OT
TO
POLL
INAT
OR
FRO
NT
Date
&
obse
rver
Reco
rdin
g nu
mbe
rTi
me
at s
tart
Perio
dW
eath
er
cond
ition
s
Plot
nu
mbe
r (2
adja
cent
tre
es /
plo
t)
Stin
gles
s be
esot
her w
ild b
ees
Flie
s (in
clud
ing
dron
e fli
es
Syrp
hida
e)
OTH
ER
(incl
udin
g w
asps
)Re
mar
ks
1 to
5
Hone
y be
e co
lony
br
ough
t or
pr
esen
t or
not*
m
0 P
rior t
o co
lony
in
trodu
ctio
n (if
ap
plica
ble)
, 1, 2
, 3,
4
0800
-100
0 h,
10
00-1
200
h,
1200
-140
0 h,
or 1
400-
1600
h
Mor
ning
or
Afte
rnoo
n
Sunn
y, ov
erca
st,
stro
ng w
ind
(Tem
pera
ture
if
avai
labl
e)
1, 2
, … 6
Flow
er v
isitin
g in
sect
s th
at a
re lik
ely
pollin
ator
s ca
ught
by
swee
p ne
t ov
er a
5 m
inut
e pe
riodo
n tw
o ad
jace
nt tr
ees
with
in th
e ex
perim
enta
l sit
e or
alo
ng o
rcha
rd fo
r sm
all u
nits
* Ind
icate
the
num
ber o
f col
onie
s of
Api
s m
ellife
ra n
earb
y th
e st
udy
orch
ard
& wh
ethe
r the
se c
olon
ies
were
pre
sent
or i
ntro
duce
d at
ons
et o
f flo
werin
g
1 2 3 4 5 6 1 2 3 4 5 6
60 210
shee
t n
UM
Ber
____
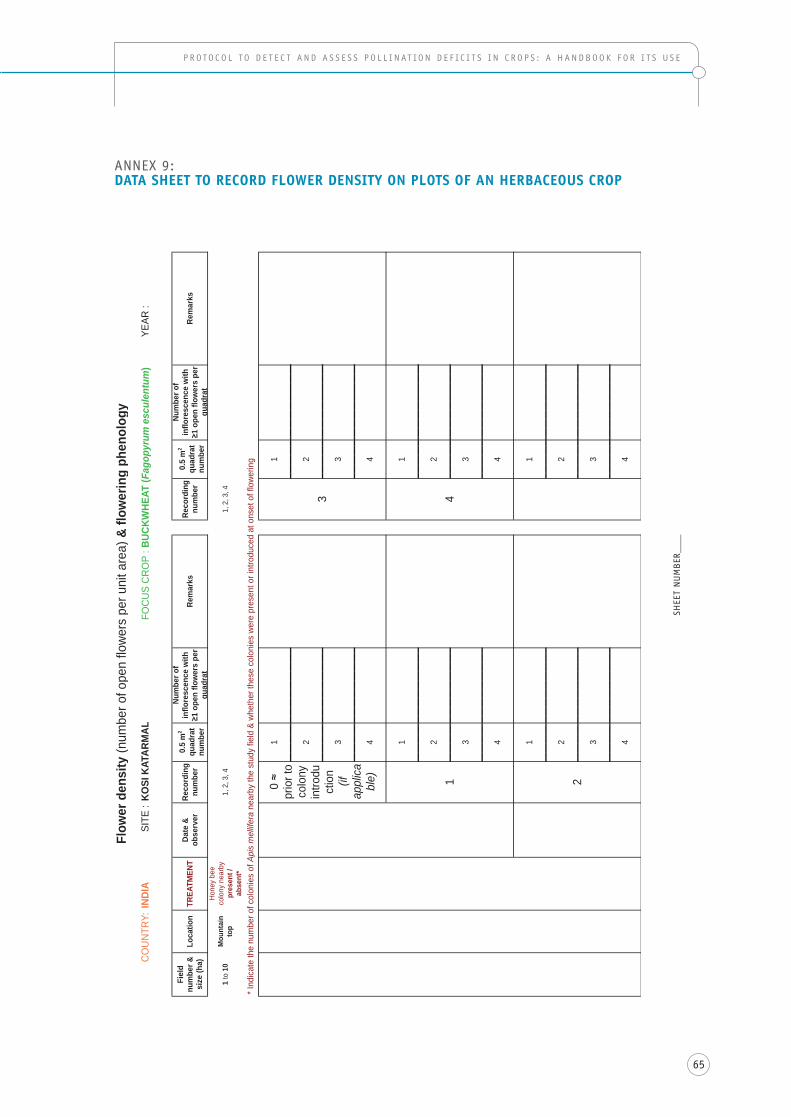
65
p r oto c o l t o d e t e c t a n d a s s e s s p o l l i n at i o n d e F i c i t s i n c r o p s : a h a n d B o o K F o r i t s U s e
anneX 9: DATA SHEET TO RECORD FLOwER DENSITy ON PLOTS OF AN HERBACEOUS CROP
ANNE
X 9:
DAT
A SH
EET
TO R
ECO
RD F
LOW
ER D
ENSI
TY O
N PL
OTS
OF
AN H
ERBA
CEO
US
CRO
P
SHEE
T NU
MBE
R __
_
Flow
er d
ensi
ty (n
umbe
r of o
pen
flow
ers
per u
nit a
rea)
& fl
ower
ing
phen
olog
yC
OU
NTR
Y:IN
DIA
SITE
:KO
SI K
ATAR
MAL
FOC
US
CR
OP
: BUC
KWHE
AT (F
agop
yrum
esc
ulen
tum
)YE
AR :
Fiel
d nu
mbe
r &
size
(ha)
Loca
tion
TREA
TMEN
TDa
te &
ob
serv
erRe
cord
ing
num
ber
0.5
m2
quad
rat
num
ber
Num
ber o
f in
flore
scen
ce w
ith
1 op
en fl
ower
s pe
r qu
adra
t
Reco
rdin
g nu
mbe
r0.
5 m
2 qu
adra
t nu
mbe
r
Num
ber o
f in
flore
scen
ce w
ith
1 op
en fl
ower
s pe
r qu
adra
t
1 to
10
Mou
ntai
n to
p
Hon
ey b
ee
colo
ny n
earb
y pr
esen
t /
abse
nt*
1, 2
, 3, 4
1, 2
, 3, 4
* Ind
icat
e th
e nu
mbe
r of c
olon
ies
of A
pis
mel
lifer
a ne
arby
the
stud
y fie
ld &
whe
ther
thes
e co
loni
es w
ere
pres
ent o
r int
rodu
ced
at o
nset
of f
low
erin
g
11
22
33
44
11
22
33
44
11
22
33
44
Rem
arks
3 4
0
prio
r to
colo
ny
intro
duct
ion
(if
ap
plic
abl
e)
Rem
arks
21
shee
t n
UM
Ber
____
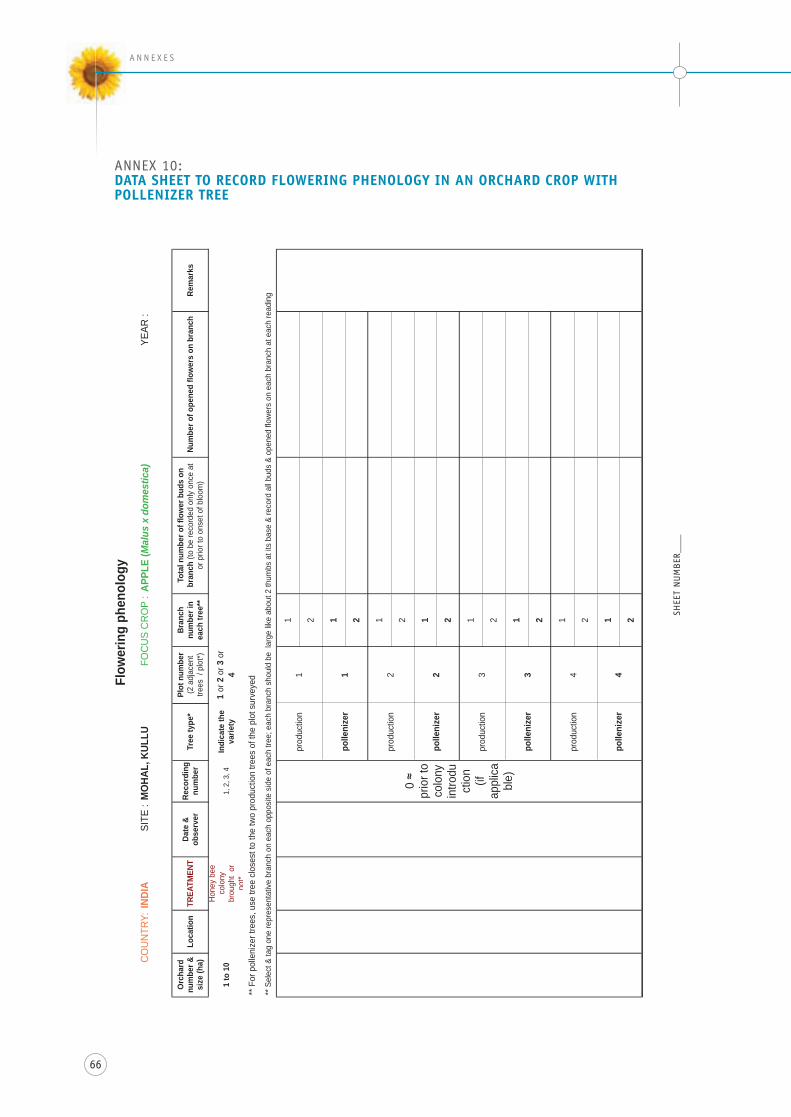
66
A N N E X E s
anneX 10: DATA SHEET TO RECORD FLOwERING PHENOLOGy IN AN ORCHARD CROP wITH POLLENIZER TREE
ANNE
X 10
: DAT
A SH
EET
TO R
ECO
RD F
LOW
ERIN
G P
HEN
OLO
GY
IN A
N O
RCH
ARD
CRO
P W
ITH
PO
LLEN
IZER
SHEE
T NU
MBE
R __
_
Flow
erin
g ph
enol
ogy
CO
UN
TRY:
INDI
ASI
TE :
MO
HAL,
KUL
LUFO
CU
S C
RO
P : A
PPLE
(Mal
us x
dom
estic
a)YE
AR :
Orc
hard
nu
mbe
r &
size
(ha)
Loca
tion
TREA
TMEN
TDa
te &
ob
serv
erRe
cord
ing
num
ber
Tree
type
*Pl
ot n
umbe
r (2
adj
acen
t tre
es /
plo
t*)
Bran
ch
num
ber i
n ea
ch tr
ee**
Tota
l num
ber o
f flo
wer
bud
s on
br
anch
(to
be re
cord
ed o
nly
once
at
or p
rior t
o on
set o
f blo
om)
Num
ber o
f ope
ned
flow
ers
on b
ranc
hRe
mar
ks
1 to
10
Hon
ey b
ee
colo
ny
brou
ght
or
not*
1, 2
, 3, 4
Indi
cate
the
va
riety
1 or
2 o
r 3 o
r 4
** F
or p
olle
nize
r tre
es, u
se tr
ee c
lose
st to
the
two
prod
uctio
n tre
es o
f the
plo
t sur
veye
d
** S
elec
t & ta
g on
e re
pres
enta
tive
bran
ch o
n ea
ch o
ppos
ite s
ide
of e
ach
tree;
eac
h br
anch
sho
uld
be l
arge
like
abo
ut 2
thum
bs a
t its
bas
e &
reco
rd a
ll bu
ds &
ope
ned
flow
ers
on e
ach
bran
ch a
t eac
h re
adin
g
1 2 1 2 1 2 1 2 1 2 1 2 1 2 1 2
0
prio
r to
colo
ny
intro
duct
ion
(if
ap
plic
abl
e)
1
prod
uctio
n4
prod
uctio
n
polle
nize
r
prod
uctio
n2
polle
nize
r
polle
nize
r
prod
uctio
n31 2 4
polle
nize
r3
shee
t n
UM
Ber
____
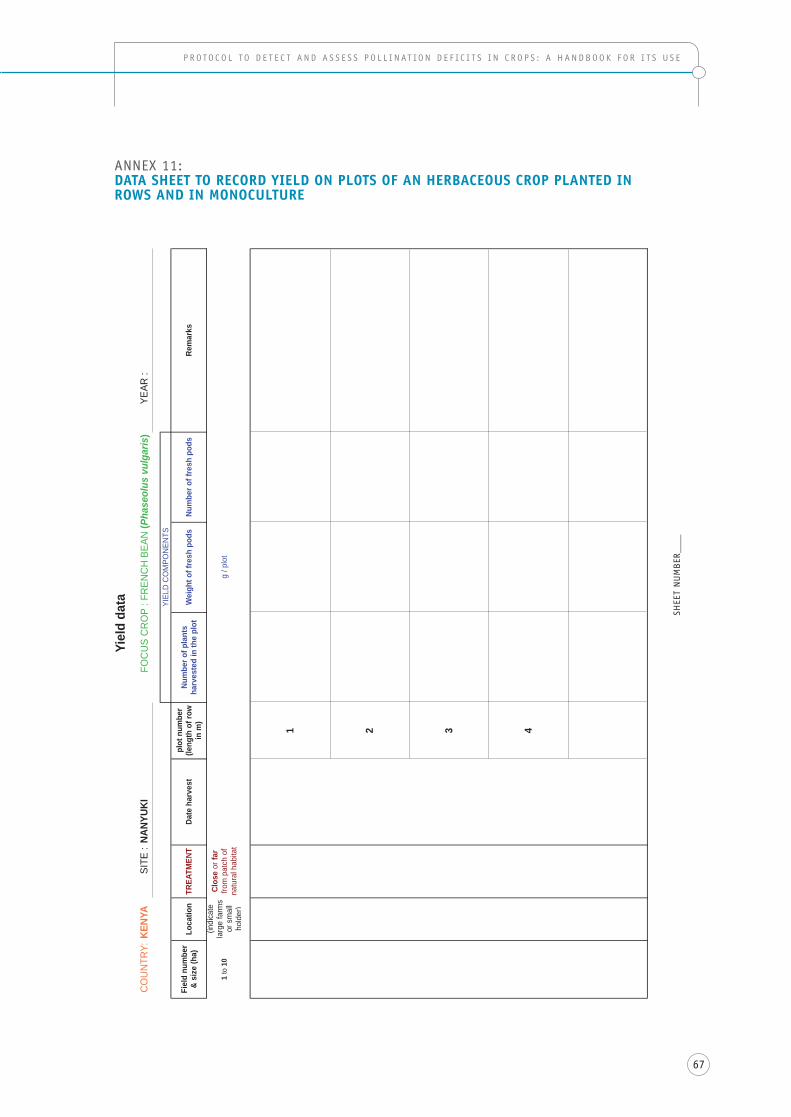
67
p r oto c o l t o d e t e c t a n d a s s e s s p o l l i n at i o n d e F i c i t s i n c r o p s : a h a n d B o o K F o r i t s U s e
anneX 11: DATA SHEET TO RECORD yIELD ON PLOTS OF AN HERBACEOUS CROP PLANTED IN ROwS AND IN MONOCULTURE
ANNE
X 11
: D
ATA
SHEE
T TO
REC
ORD
YIE
LD O
N PL
OTS
OF
AN H
ERBA
CEO
US
CRO
P PL
ANTE
D IN
RO
WS
AND
IN M
ONO
CULT
URE
SHEE
T NU
MBE
R __
_
Yiel
d da
taC
OU
NTR
Y:KE
NYA
SITE
:NA
NYUK
IFO
CU
S C
RO
P : F
REN
CH
BEA
N (P
hase
olus
vul
garis
)YE
AR :
YIEL
D C
OM
PON
ENTS
Fiel
d nu
mbe
r &
size
(ha)
Loca
tion
TREA
TMEN
TDa
te h
arve
stpl
ot n
umbe
r (le
ngth
of r
ow
in m
)
Num
ber o
f pla
nts
harv
este
d in
the
plot
Wei
ght o
f fre
sh p
ods
Num
ber o
f fre
sh p
ods
1 to
10
(indi
cate
la
rge
farm
s or
sm
all
hold
er)
Clos
e or
far
from
pat
ch o
f na
tura
l hab
itat
g / p
lot
1 2 3 4
Rem
arks
shee
t n
UM
Ber
____
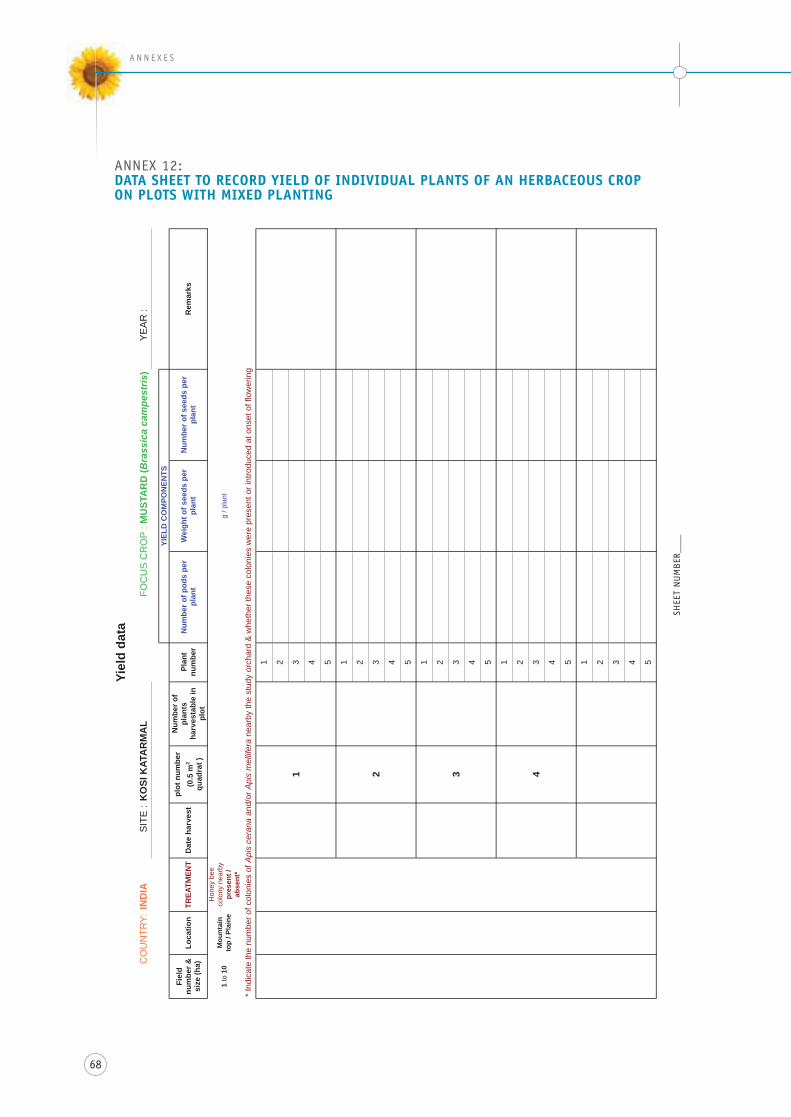
68
A N N E X E s
anneX 12:DATA SHEET TO RECORD yIELD OF INDIVIDUAL PLANTS OF AN HERBACEOUS CROP ON PLOTS wITH MIxED PLANTING
ANN
EX 1
2: D
ATA
SHEE
T TO
REC
ORD
YIE
LD O
F IN
DIV
IDU
AL P
LAN
TS O
F AN
HER
BAC
EOU
S C
ROP
ON
PLO
TS W
ITH
MIX
ED P
LAN
TIN
G
SHEE
T N
UMBE
R __
_
Yiel
d da
taC
OU
NTR
Y:IN
DIA
SIT
E :
KO
SI K
ATA
RM
AL
FOC
US
CR
OP
: MU
STA
RD
(Bra
ssic
a ca
mpe
stris
)Y
EA
R :
YIEL
D C
OM
PON
ENTS
Fiel
d nu
mbe
r &
size
(ha)
Loca
tion
TREA
TMEN
TD
ate
harv
est
plot
num
ber
(0.5
m2
quad
rat )
Num
ber o
f pl
ants
ha
rves
tabl
e in
pl
ot
Plan
t nu
mbe
rN
umbe
r of p
ods
per
plan
tW
eigh
t of s
eeds
per
pl
ant
Num
ber o
f see
ds p
er
plan
t
1 to
10
Mou
ntai
n to
p / P
lain
e
Hon
ey b
ee
colo
ny n
earb
y pr
esen
t /
abse
nt*
g / p
lant
* In
dica
te th
e nu
mbe
r of c
olon
ies
of A
pis
cera
na a
nd/o
r Api
s m
ellif
era
near
by th
e st
udy
orch
ard
& w
heth
er th
ese
colo
nies
wer
e pr
esen
t or i
ntro
duce
d at
ons
et o
f flo
wer
ing
1 2 3 4 5 1 2 3 4 5 1 2 3 4 5 1 2 3 4 5 1 2 3 4 5
Rem
arks
1 2 3 4
shee
t n
UM
Ber
____
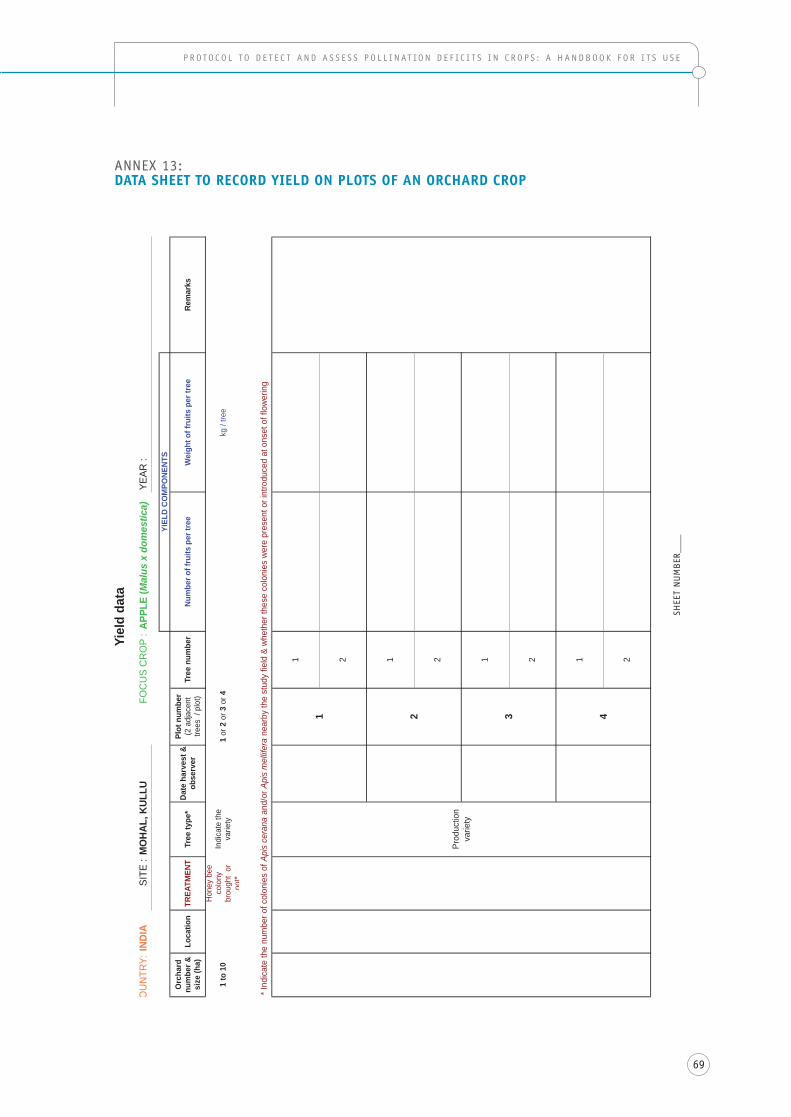
69
p r oto c o l t o d e t e c t a n d a s s e s s p o l l i n at i o n d e F i c i t s i n c r o p s : a h a n d B o o K F o r i t s U s e
anneX 13: DATA SHEET TO RECORD yIELD ON PLOTS OF AN ORCHARD CROP
ANN
EX 1
3: D
ATA
SHEE
T TO
REC
ORD
YIE
LD O
N PL
OTS
OF
AN O
RCH
ARD
CRO
P
SHEE
T NU
MBE
R __
_
Yiel
d da
taO
UN
TRY:
INDI
ASI
TE :
MO
HAL,
KUL
LUFO
CU
S C
RO
P :
APPL
E (M
alus
x d
omes
tica)
YEAR
:
YIEL
D CO
MPO
NENT
SO
rcha
rd
num
ber &
si
ze (h
a)Lo
catio
nTR
EATM
ENT
Tree
type
*Da
te h
arve
st &
ob
serv
er
Plot
num
ber
(2 a
djac
ent
trees
/ p
lot)
Tree
num
ber
Num
ber o
f fru
its p
er tr
eeW
eigh
t of f
ruits
per
tree
Rem
arks
1 to
10
Hon
ey b
ee
colo
ny
brou
ght
or
not*
Indi
cate
the
va
riety
1 or
2 o
r 3 o
r 4kg
/ tre
e
* Ind
icat
e th
e nu
mbe
r of c
olon
ies
of A
pis
cera
na a
nd/o
r Api
s m
ellif
era
near
by th
e st
udy
field
& w
heth
er th
ese
colo
nies
wer
e pr
esen
t or i
ntro
duce
d at
ons
et o
f flo
wer
ing
1 2 1 2 1 2 1 2
1 2 3 4
Prod
uctio
n va
riety
shee
t n
UM
Ber
____
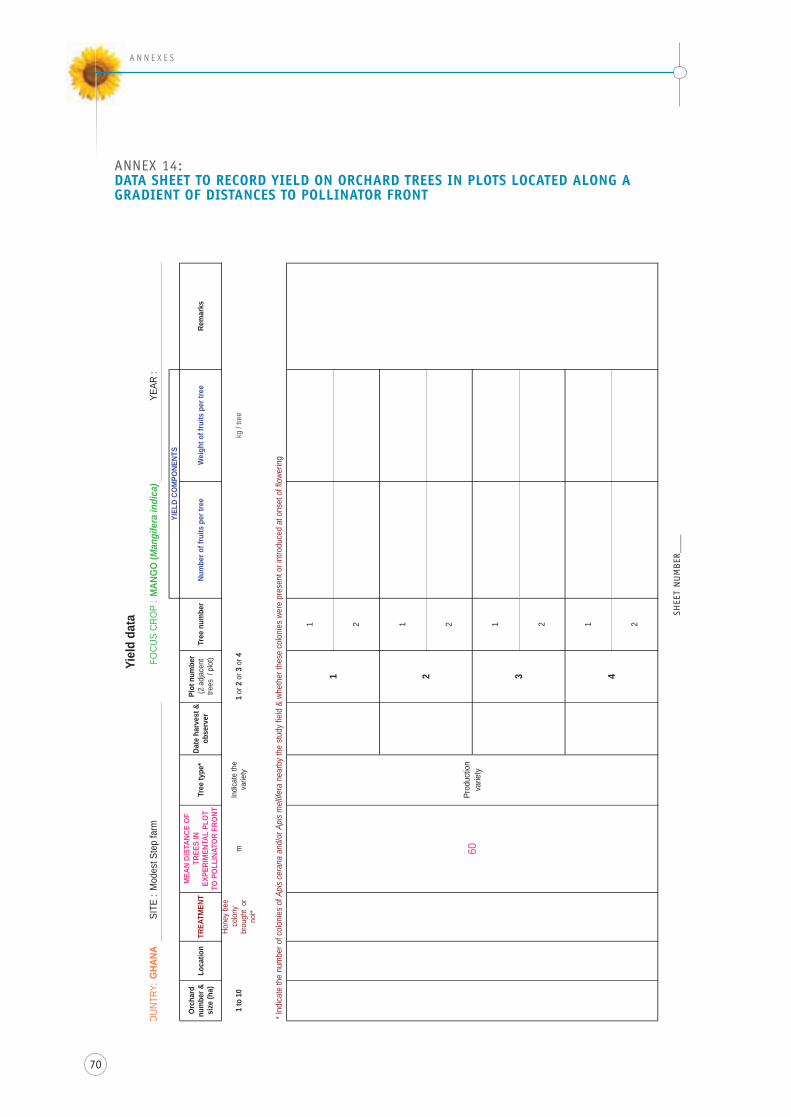
70
A N N E X E s
anneX 14: DATA SHEET TO RECORD yIELD ON ORCHARD TREES IN PLOTS LOCATED ALONG A GRADIENT OF DISTANCES TO POLLINATOR FRONT
ANNE
X 14
: DA
TA S
HEET
TO
RECO
RD Y
IELD
ON
ORCH
ARD
TREE
S IN
PLO
TS L
OCAT
ED A
LONG
A G
RADI
ENT
OF D
ISTA
NCES
TO
POLL
INAT
OR F
RONT
SHEE
T NU
MBE
R __
_
Yiel
d da
taO
UNTR
Y:G
HANA
SITE
:M
odes
t Ste
p fa
rmFO
CUS
CRO
P : M
ANG
O (M
angi
fera
indi
ca)
YEAR
:
YIEL
D CO
MPO
NENT
S
Orc
hard
nu
mbe
r &
size
(ha)
Loca
tion
TREA
TMEN
T
MEA
N DI
STAN
CE O
F TR
EES
IN
EXPE
RIM
ENTA
L PL
OT
TO P
OLL
INAT
OR
FRO
NT
Tree
type
*Da
te h
arve
st &
ob
serv
er
Plot
num
ber
(2 a
djac
ent
trees
/ p
lot)
Tree
num
ber
Num
ber o
f fru
its p
er tr
eeW
eigh
t of f
ruits
per
tree
Rem
arks
1 to
10
Hone
y be
e co
lony
br
ough
t or
no
t*
mIn
dica
te th
e
varie
ty1
or 2
or 3
or 4
kg /
tree
* Ind
icate
the
num
ber o
f col
onie
s of
Api
s ce
rana
and
/or A
pis
mel
lifera
nea
rby
the
stud
y fie
ld &
whe
ther
thes
e co
loni
es w
ere
pres
ent o
r int
rodu
ced
at o
nset
of f
lowe
ring
1 2 1 2 1 2 1 2
Prod
uctio
n va
riety
1 2 3 4
60
shee
t n
UM
Ber
____

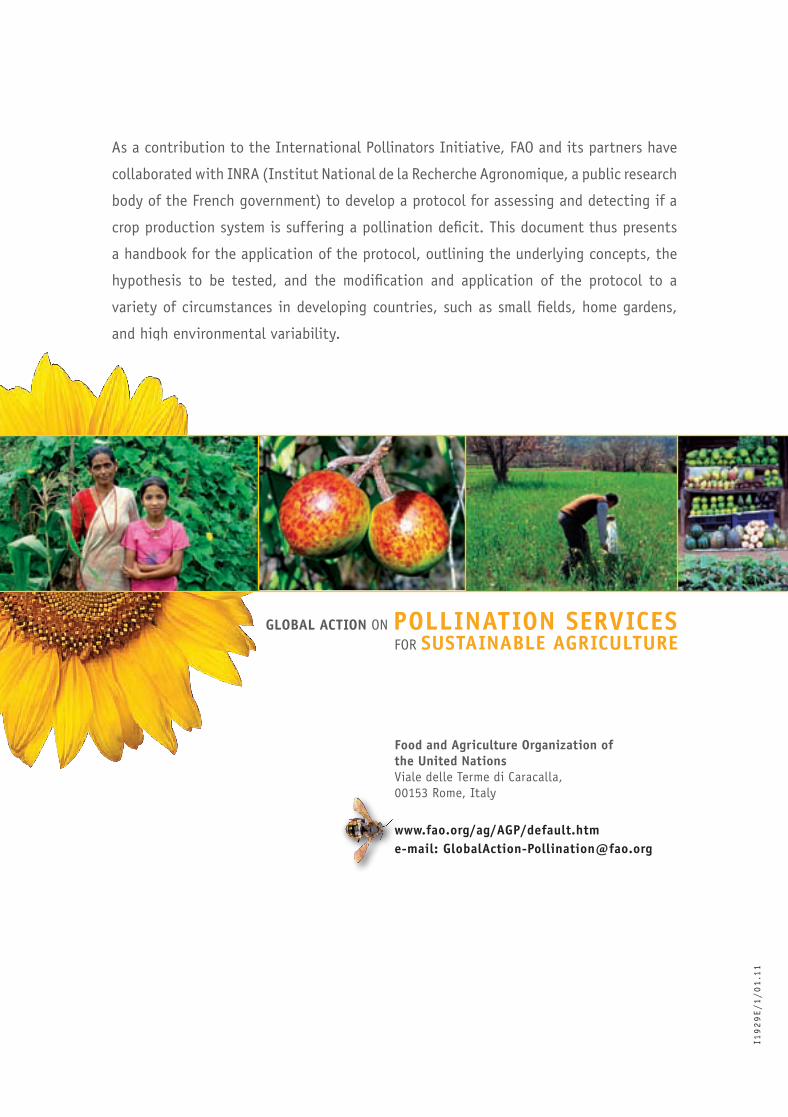
p o l l i n a t i o n s e r v i c e s F o r s U s t a i n a B l e a G r i c U l t U r e • F i e l d m a n U a l s
extension oF KnowledGe Base
AdApt ive MAnAgeMent
CApACity building
MAinstreAMing
protocol to detect and ASSESS POLLINATION deFicits in crops: a HandBooK For its Use
As a contribution to the international pollinators initiative, FAO and its partners have
collaborated with inrA (institut national de la recherche Agronomique, a public research
body of the French government) to develop a protocol for assessing and detecting if a
crop production system is suffering a pollination deficit. this document thus presents
a handbook for the application of the protocol, outlining the underlying concepts, the
hypothesis to be tested, and the modification and application of the protocol to a
variety of circumstances in developing countries, such as small fields, home gardens,
and high environmental variability.
Food and Agriculture Organization of the United Nations viale delle terme di Caracalla, 00153 rome, italy
www.fao.org/ag/AGP/default.htme-mail: [email protected]
GLObAL AcTION On POLLINATION SErvIcES FOr SUSTAINAbLE AGrIcULTUrE
i19
29
e/
1/
01
.11
proto
col to
detect a
nd
assess po
llinatio
n d
eFicits in cro
ps: a H
an
dB
oo
K Fo
r its Use
FAO