Embed Size (px)
Citation preview
F E B R U A R Y 2 0 1 2
CHINA ECONOMIC AND POLICY OUTLOOK
- Economy tracks moderating growth trend; Monetary policy on hold amid global uncertainty
CHINA TRADE AND RMB INTERNATIONALIZATION
Grace NgSenior China Economist J.P. Morgan Chase Bank+852 2800 7002 [email protected]
2
Source: J.P. Morgan Economics
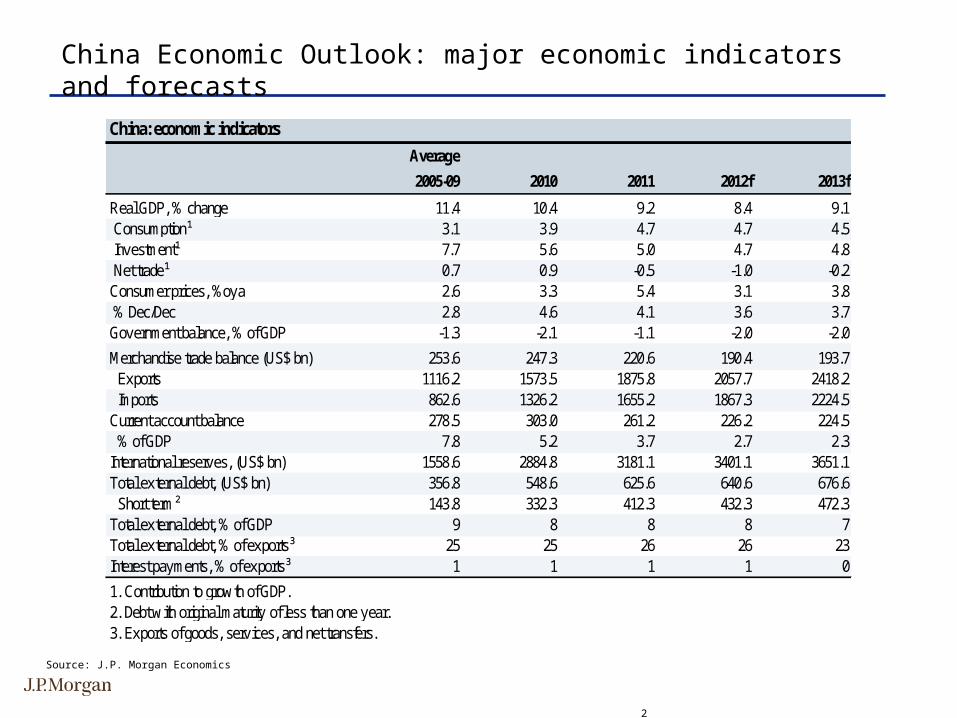
China Economic Outlook: major economic indicators and forecasts
China: economic indicators
Average
2005-09 2010 2011 2012f 2013f
Real GDP, % change 11.4 10.4 9.2 8.4 9.1 Consumption¹ 3.1 3.9 4.7 4.7 4.5 Inv estment¹ 7.7 5.6 5.0 4.7 4.8 Net trade¹ 0.7 0.9 -0.5 -1.0 -0.2Consumer prices, %oy a 2.6 3.3 5.4 3.1 3.8 % Dec/Dec 2.8 4.6 4.1 3.6 3.7Gov ernment balance, % of GDP -1.3 -2.1 -1.1 -2.0 -2.0
Merchandise trade balance (US$ bn) 253.6 247.3 220.6 190.4 193.7 Ex ports 1116.2 1573.5 1875.8 2057.7 2418.2 Imports 862.6 1326.2 1655.2 1867.3 2224.5Current account balance 278.5 303.0 261.2 226.2 224.5 % of GDP 7.8 5.2 3.7 2.7 2.3International reserv es, (US$ bn) 1558.6 2884.8 3181.1 3401.1 3651.1Total ex ternal debt, (US$ bn) 356.8 548.6 625.6 640.6 676.6 Short term² 143.8 332.3 412.3 432.3 472.3Total ex ternal debt, % of GDP 9 8 8 8 7Total ex ternal debt, % of ex ports³ 25 25 26 26 23Interest pay ments, % of ex ports³ 1 1 1 1 0
1. Contribution to grow th of GDP.2. Debt w ith original maturity of less than one y ear.3. Ex ports of goods, serv ices, and net transfers.

3
The China economy: steady, moderate economic growth
Growth momentum moderated in 2011Growth momentum moderated in 2011 but remain solidbut remain solid
Growth broadening out and better balancedGrowth broadening out and better balanced
6
8
10
12
14
16
%oya
98 00 02 04 06 08 10 12
Real GDP growth
Government's growth target
China: real GDP growth vs. government's growth target
-4
-2
0
2
4
6
8
10
2005 2006 2007 2008 2009 2010 2011 2012F
%-pt contribution to headline %oya growth
Total consumption expenditure
Gross fixed capital formation
Net export
China: contribution to headline GDP growth
0
5
10
15
20
6
8
10
12
14
16
%oyaChina: real GDP growth
%q/q, saar
04 05 06 07 08 09 10 11
%oya
%q/q, saar
Source: CEIC and J.P. Morgan estimatesSource: CEIC and J.P. Morgan estimates

4
Upgrading of manufacturing sectorUpgrading of manufacturing sector
Political cycle plays a rolePolitical cycle plays a role
The likelihood of a FAI collapse in 2012 is small
0
2
4
6
8
10
12
2008 2009 2010 2011
Units millionAffordable housing starts
Housing startstarget
Actual housing starts
Public housing to gather momentumPublic housing to gather momentum
Moderate, but solid FAI growth in 2012Moderate, but solid FAI growth in 2012
Nominal fixed asset investment 2009 2010 2011 2012f
%share %oya %oya %oya %oyaTotal 100.0 30.5 24.5 23.8 18.0Primary industry 2.3 49.9 18.2 25.0 20.0Tex tile and related 2.3 16.5 28.5 34.5 15.0Metal and commodities 12.0 25.0 21.9 27.9 15.0Machinery & electronic equipment 9.3 32.9 34.9 37.2 25.0Transportation equipment 2.8 31.3 31.7 27.2 15.0Electricity , gas, and w ater production 4.8 28.5 7.3 3.8 15.0Housing 25.3 19.9 33.5 29.7 10.0Transport infrastructure & construction 9.9 48.9 21.3 5.0 22.0Water conserv ation, env ironment manag.8.1 45.1 24.5 14.2 35.0Healthcare, social security , 3.6 45.4 17.4 22.2 25.0
-40
-20
0
20
40
60
% changeFAI in machinery and electrical equipment vs. exports
FAI in machinery and electrical equipment, %oya, ytd
Merchandise exports, %oya, 3mma
2006 2007 2008 2009 2010 2011
0
5
10
15
20
25
30
Year 1 Year 2 Year 3 Year 4 Year 5
%oya, five year average
China: FAI growth during five year plan
5
12th 5-year plan: macro policy targets
Real GDP growth averaging at 7% for the next five years, focusing on enhancing the quality and efficiency of economic growth. (This is modestly lower than the 7.5% growth target set during the 11th five-year plan over 2006-2010.)
Focus on economic restructuring. Regarding industrial structure, in addition to pushing for industrial upgrading and the support for strategic new industries (including the sectors of new energy, energy-saving and environment protection, bio-medical, information and technology as well as high-tech manufacturing), the government highlights the need to support the service sector. In particular, the government aims to raise the service sector’s share of GDP by 4% over the next five years. Besides, the government aims to lift the urbanization rate from 47.5% to 51.5% during the 12th five-year plan.
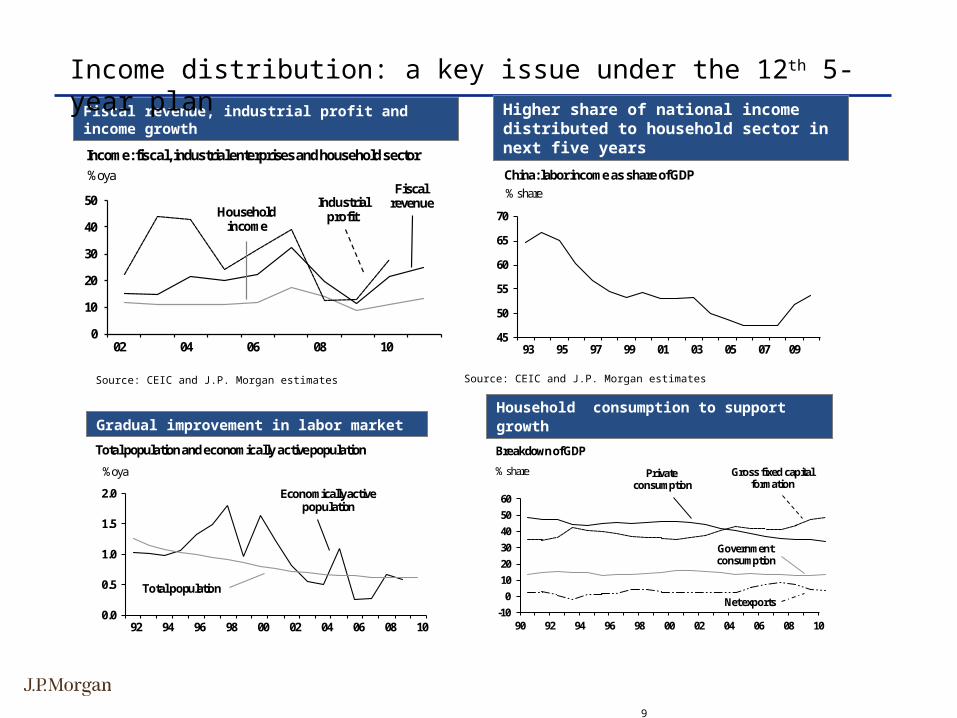
In order to facilitate the shift of the growth engine towards domestic demand, the government highlights that household and employment income should at least grow at the same pace of overall economic growth and labor productivity. As such, the aim is to lift the share of household income in the overall economy, with urban and rural real per capita income rising at above 7% annual pace, and with the target of total urban new job creation at 45 million for the next five years. Besides, the coverage ratio of urban affording housing should reach 20% during this five-year plan.
6
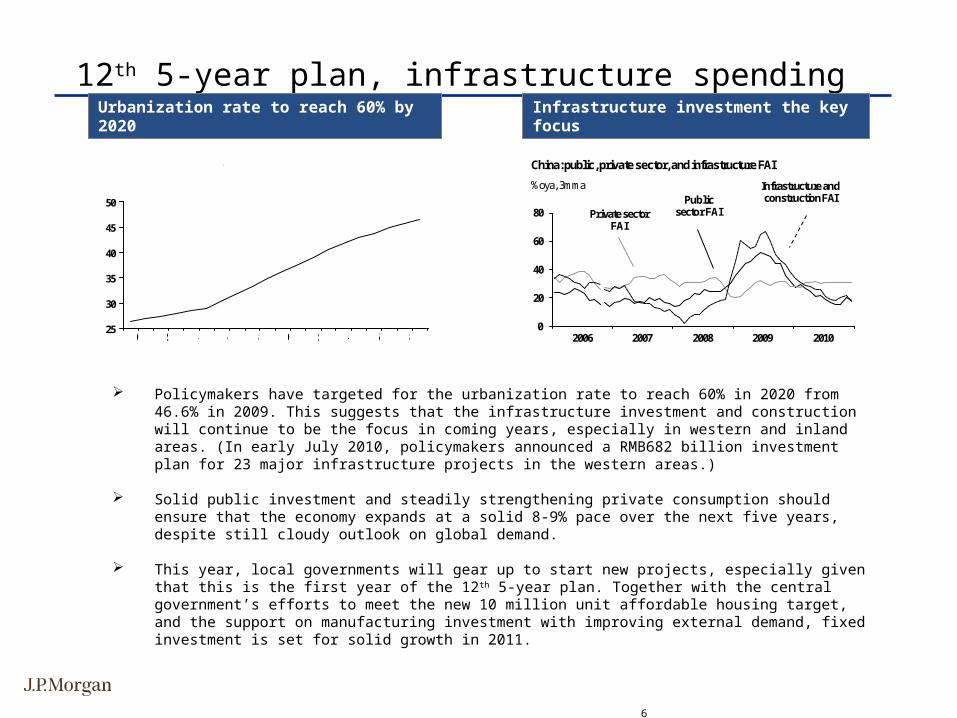
12th 5-year plan, infrastructure spending
Infrastructure investment the key focusInfrastructure investment the key focusUrbanization rate to reach 60% by 2020Urbanization rate to reach 60% by 2020
25
30
35
40
45
50
%
China: urbanization rate
90 92 94 96 98 00 02 04 06 08
Policymakers have targeted for the urbanization rate to reach 60% in 2020 from 46.6% in 2009. This suggests that the infrastructure investment and construction will continue to be the focus in coming years, especially in western and inland areas. (In early July 2010, policymakers announced a RMB682 billion investment plan for 23 major infrastructure projects in the western areas.)
Solid public investment and steadily strengthening private consumption should ensure that the economy expands at a solid 8-9% pace over the next five years, despite still cloudy outlook on global demand.
This year, local governments will gear up to start new projects, especially given that this is the first year of the 12th 5-year plan. Together with the central government’s efforts to meet the new 10 million unit affordable housing target, and the support on manufacturing investment with improving external demand, fixed investment is set for solid growth in 2011.
0
20
40
60
80
%oya, 3mma
China: public, private sector, and infrastructure FAI
2006 2007 2008 2009 2010
Private sector FAI
Public sector FAI
Infrastructure and construction FAI
7
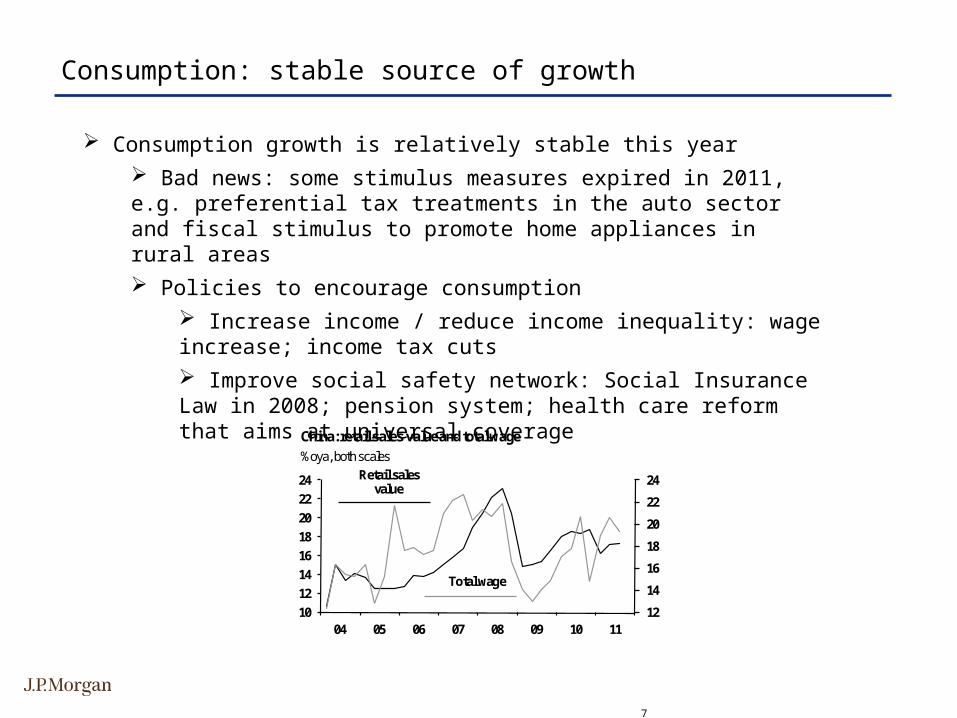
Consumption: stable source of growth
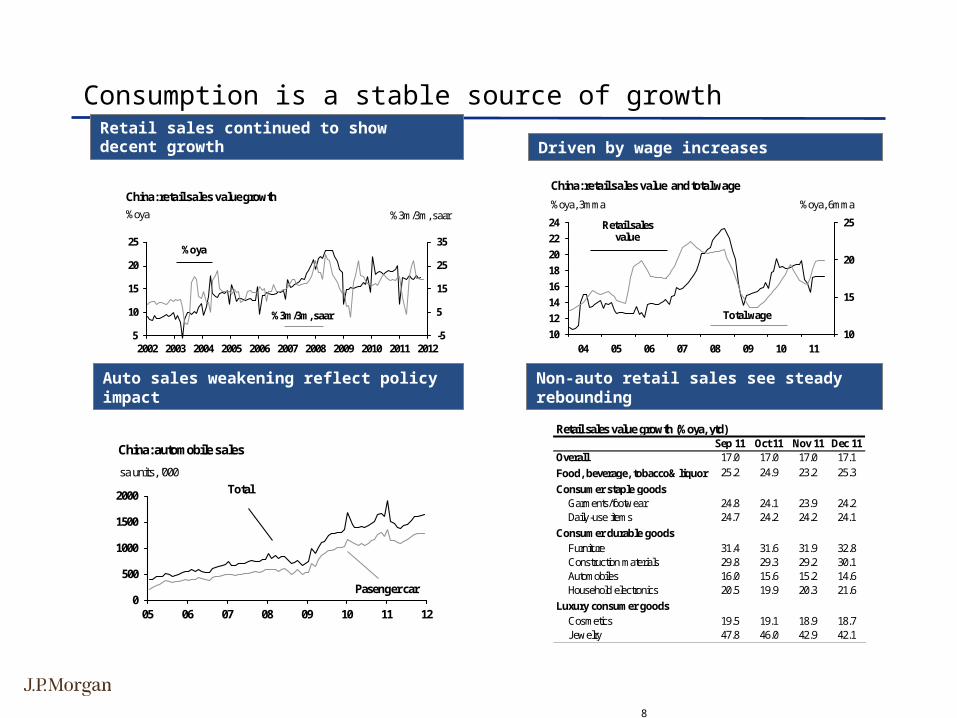
Consumption growth is relatively stable this year Bad news: some stimulus measures expired in 2011, e.g. preferential tax treatments in the auto sector and fiscal stimulus to promote home appliances in rural areas Policies to encourage consumption
Increase income / reduce income inequality: wage increase; income tax cuts Improve social safety network: Social Insurance Law in 2008; pension system; health care reform that aims at universal coverage
12
14
16
18
20
22
24
10
12
14
16
18
20
22
24
%oya, both scalesChina: retail sales value and total wage
04 05 06 07 08 09 10 11
Retail sales value
Total wage
8
Consumption is a stable source of growth
Retail sales continued to show decent growthRetail sales continued to show decent growth
Auto sales weakening reflect policy impactAuto sales weakening reflect policy impact Non-auto retail sales see steady reboundingNon-auto retail sales see steady rebounding
Driven by wage increasesDriven by wage increases
-5
5
15
25
35
5
10
15
20
25
2002 2003 2004 2005 2006 2007 2008 2009 2010 2011 2012
%oya
China: retail sales value growth
%oya
%3m/3m, saar
%3m/3m, saar
0
500
1000
1500
2000
05 06 07 08 09 10 11 12
sa units, '000
China: automobile sales
Total
Pasenger car
10
15
20
25
10
12
14
16
18
20
22
24
%oya, 3mma
China: retail sales value and total wage
%oya, 6mma
04 05 06 07 08 09 10 11
Retail sales value
Total wage
Retail sales value growth (%oya, ytd)Sep 11 Oct 11 Nov 11 Dec 11
Overall 17.0 17.0 17.0 17.1Food, beverage, tobacco& liquor 25.2 24.9 23.2 25.3
Consumer staple goodsGarments/footw ear 24.8 24.1 23.9 24.2Daily -use items 24.7 24.2 24.2 24.1
Furniture 31.4 31.6 31.9 32.8Construction materials 29.8 29.3 29.2 30.1Automobiles 16.0 15.6 15.2 14.6Household electronics 20.5 19.9 20.3 21.6
Cosmetics 19.5 19.1 18.9 18.7Jew elry 47.8 46.0 42.9 42.1
Consumer durable goods
Luxury consumer goods
9
Fiscal revenue, industrial profit and income growthFiscal revenue, industrial profit and income growth
Household consumption to support growth Household consumption to support growth
Source: CEIC and J.P. Morgan estimates Source: CEIC and J.P. Morgan estimates
Income distribution: a key issue under the 12th 5-year plan
Higher share of national income distributed to household sector in next five years
Higher share of national income distributed to household sector in next five years
Gradual improvement in labor marketGradual improvement in labor market
45
50
55
60
65
70
% shareChina: labor income as share of GDP
93 95 97 99 01 03 05 07 09
0.0
0.5
1.0
1.5
2.0
%oya
92 94 96 98 00 02 04 06 08 10
Total population and economically active population
Economically active population
Total population
-10
0
10
20
30
40
50
60
90 92 94 96 98 00 02 04 06 08 10
% share
Breakdown of GDP
Private consumption
Gross fixed capital formation
Government consumption
Net exports
0
10
20
30
40
50
%oyaIncome: fiscal, industrial enterprises and household sector
02 04 06 08 10
Fiscal revenue
Household income
Industrial profit

10
We expect: Export growth slows down from 20.4% in 2011 to 10% in 2012 Trade balance deficits in a few months in 1H12 Net exports drag 1.0 percentage points from growth
Weak global demand could persist for a while due to fiscal tightening and weak recovery in the DM world
Challenge to move away from export-driven growth model
External headwind continues to carry through in 2012

11
Global headwinds drag on external demand
Trade sector weakened since Q2 Trade sector weakened since Q2 Trade surplus narrowedTrade surplus narrowed
Exports likely to remain soft in near termExports likely to remain soft in near term Export orders on the soft sideExport orders on the soft side
-40
-20
0
20
40
60
-20
-15
-10
-5
0
5
10
15
%oya, both scales JPMorganforecast
2006 2007 2008 2009 2010 2011 2012
Global IP
China's exports
China: merchandise exports and global IP
253035404550556065
-30-20-10
01020304050
06 07 08 09 10 11 12
%oya
China: PMI export orders and merchandise exports
Index, saMerchandise exports
Markit PMI export orders
-100
-50
0
50
100
150
200
%3m/3m, saar
2006 2007 2008 2009 2010 2011
ExportsImports
China: merchandise trade growth - sequential trend
-10
0
10
20
30
40
50
06 07 08 09 10 11 12
US$ billion
China: merchandise trade balance
sansa
12
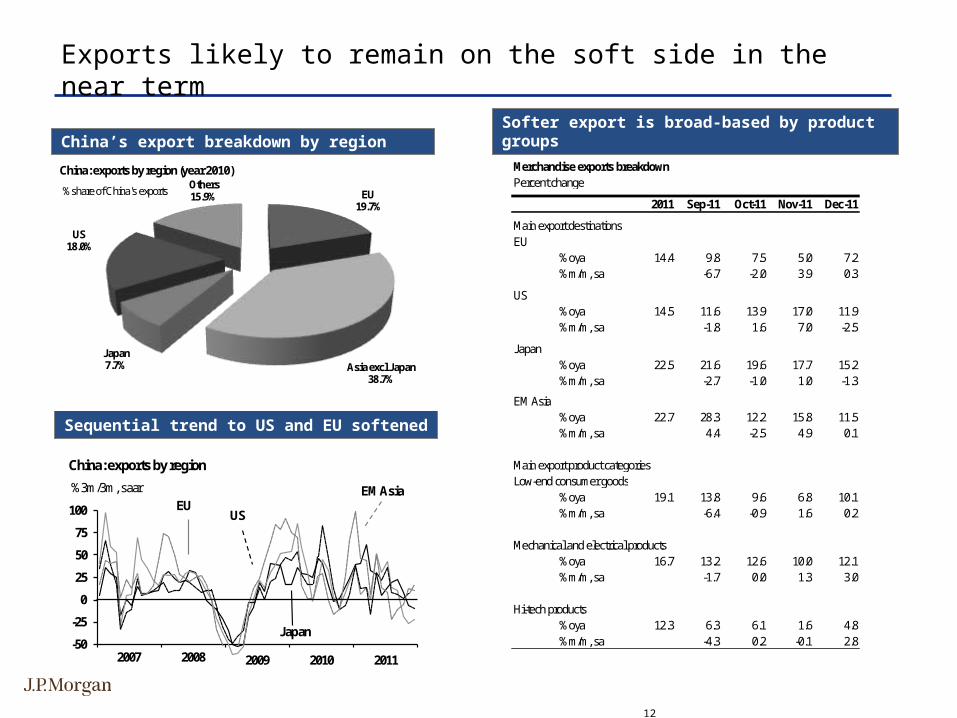
China’s export breakdown by region China’s export breakdown by region
Sequential trend to US and EU softenedSequential trend to US and EU softened
Softer export is broad-based by product groupsSofter export is broad-based by product groups
%share of China's exports
China: exports by region (year 2010)
EU19.7%
Asia excl Japan38.7%
Japan7.7%
US18.0%
Others15.9%
Exports likely to remain on the soft side in the near term
Merchandise exports breakdownPercent change
2011 Sep-11 Oct-11 Nov-11 Dec-11
Main export destinationsEU
%oya 14.4 9.8 7.5 5.0 7.2%m/m, sa -6.7 -2.0 3.9 0.3
US%oya 14.5 11.6 13.9 17.0 11.9%m/m, sa -1.8 1.6 7.0 -2.5
Japan%oya 22.5 21.6 19.6 17.7 15.2%m/m, sa -2.7 -1.0 1.0 -1.3
EM Asia%oya 22.7 28.3 12.2 15.8 11.5%m/m, sa 4.4 -2.5 4.9 0.1
Main export product categoriesLow-end consumer goods
%oya 19.1 13.8 9.6 6.8 10.1%m/m, sa -6.4 -0.9 1.6 0.2
Mechanical and electrical products%oya 16.7 13.2 12.6 10.0 12.1%m/m, sa -1.7 0.0 1.3 3.0
Hi-tech products%oya 12.3 6.3 6.1 1.6 4.8%m/m, sa -4.3 0.2 -0.1 2.8
-50
-25
0
25
50
75
100
%3m/3m, saar
2007 2008 2009 2010 2011
Japan
EUEM Asia
US
China: exports by region

13
Impact of rising wages on export sector
Labor productivity is rising on capital deepeningLabor productivity is rising on capital deepening
5
10
15
20
25
1991 1993 1995 1997 1999 2001 2003 2005 2007 2009
0
5
10
15
20
25
Growth of fixed capital, labor force, and capital-labor ratio
Capital-labor ratioLabor force
Yuan mn per worker % oya
Real capital stock
China's export share in world trade: selected commodities% share 1990 2001 2003 2005 2008 2009Textiles 4.8 14.4 20.9 25.9 25.8 28.3Clothing 8.9 18.9 22.4 26.9 33.0 34.0Iron and steel 1.2 2.4 2.6 6.1 12.0 7.3Chemicals 1.3 2.2 2.4 3.2 4.7 4.3Machinery & transport equip. 0.9 3.8 6.4 9.2 12.6 14.0Office & telecom equip. 1.1 6.2 12.3 17.7 24.3 26.2 Telecom equip. na 8.8 14.6 20.4 26.9 29.4Source: World Trade Organization
China’s share of global market still elevatedChina’s share of global market still elevated
Exporters’ profit margin on the rise despite rising wage concern
Exporters’ profit margin on the rise despite rising wage concern Export sector moving up the value-added chainExport sector moving up the value-added chain
6
8
10
12
14
16
18
20
98 00 02 04 06 08 10 12
% share, 12-month moving average
Share of US import market
ChinaEM Asia (ex-
China)
Mexico
Japan
2
3
4
5
6
7
03 04 05 06 07 08 09 10 11
Export-related industrial enterprises
Overall industrial enterprises% of sales revenue, 3mma
Industrial enterprise profit margin

14
Import prices surged at a faster paceImport prices surged at a faster pace
Notable widening of China’s trade deficit with major trading partners
Notable widening of China’s trade deficit with major trading partners
Volume growth in exports and importsVolume growth in exports and imports
Narrowing of trade surplus to continue
Earlier easing in commodity imports has stabilized
Earlier easing in commodity imports has stabilized
-20
-10
0
10
20
05 06 07 08 09 10 11 12
US$ bn, 3mma, sa
China's trade balance with different regions
US
EU
Commodity producers
Japan
EM Asia
-100
-50
0
50
100
2006 2007 2008 2009 2010 2011 2012
%3m/3m, saar
China: export and import volume
Import volume
Export volume 90
100
110
120
130
140
150
06 07 08 09 10 11 12
Index, Jan 2004=100, sa
China: exports and imports price indices
Import prices Export prices
50
100
150
200
08 09 10 11 12
Index, 2007=100, sa
Crude and refined oil
Iron ore
Copper
China: commodity import volume

15
China’s trade balance with major trade partnersChina’s trade balance with major trade partners
REER and exportsREER and exports
FX policy outlook – CNY/USD to reach 6.1 by end 2012
CNY/USD 1-year NDF rateCNY/USD 1-year NDF rate
Global rebalancing gradually sets offGlobal rebalancing gradually sets off
-10
-5
0
5
10
15
% of GDPCurrent account balances
00 02 04 06 08 10 12
JP Morganforecasts
China
US-20
-10
0
10
20
05 06 07 08 09 10 11 12
US$ bn, 3mma, sa
China's trade balance with different regions
US
EU
Commodity producers
Japan
EM Asia
6.3
6.4
6.5
6.6
6.7
Sep 10 Dec 10 Mar 11 Jun 11 Sep 11 Dec 11
CNY/USD
Spot exchange rate
1-year NDF
CNY/USD 1-year forward and spot exchange rate
-10
-5
0
5
10
15
20-40
-20
0
20
40
60
%oya, 3mma %oya
2005 2006 2007 2008 2009 2010 2011
Merchandise exports
Real effective exchange rate
Appreciation
China: REER and merchandise exports
16
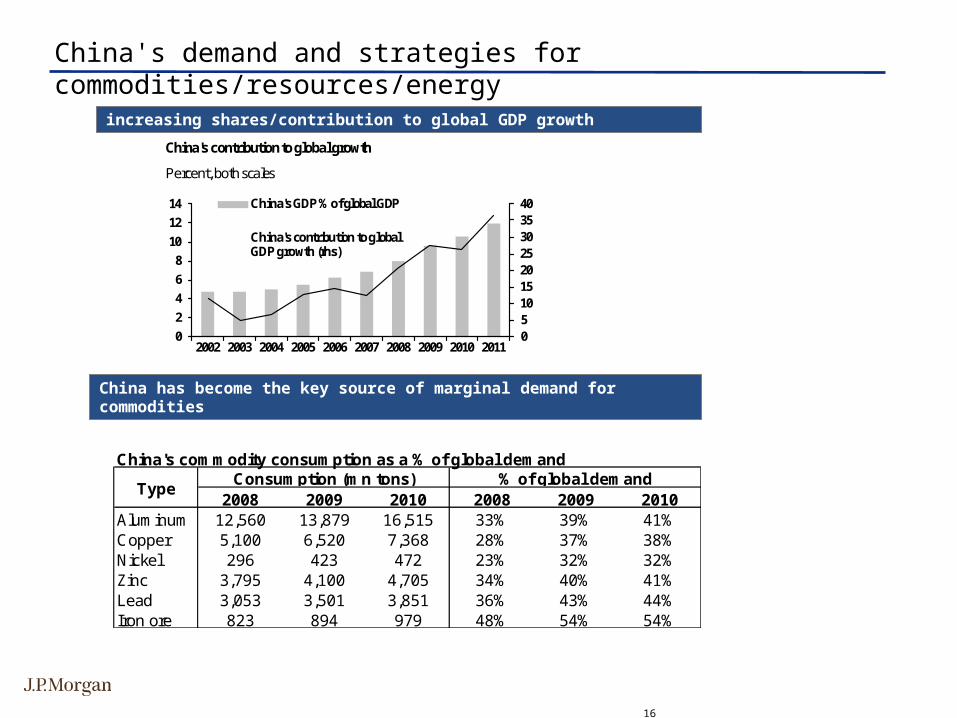
China's demand and strategies for commodities/resources/energy
increasing shares/contribution to global GDP growth increasing shares/contribution to global GDP growth
China's commodity consumption as a % of global demand
2008 2009 2010 2008 2009 2010Aluminum 12,560 13,879 16,515 33% 39% 41%Copper 5,100 6,520 7,368 28% 37% 38%Nickel 296 423 472 23% 32% 32%Zinc 3,795 4,100 4,705 34% 40% 41%Lead 3,053 3,501 3,851 36% 43% 44%Iron ore 823 894 979 48% 54% 54%
TypeConsumption (mn tons) % of global demand
China has become the key source of marginal demand for commoditiesChina has become the key source of marginal demand for commodities
0510152025303540
0
2
4
6
8
10
12
14
2002 2003 2004 2005 2006 2007 2008 2009 2010 2011
China's GDP % of global GDP
China's contribution to global GDP growth (rhs)
Percent, both scales
China's contribution to global growth

17
China's demand and strategies for commodities/resources/energy
Commodity import closely related to fixed investment
Commodity import closely related to fixed investment
But the impact is quite different across groups of commodities
But the impact is quite different across groups of commodities
Energy import carries its own trendEnergy import carries its own trend
China’s growth cycle closely related to commodity demand
China’s growth cycle closely related to commodity demand
-60
-40
-20
0
20
40
60
-10
0
10
20
30
%oya, both scales
China IP growth
2005 2006 2007 2008 2009 2010 2011
JPMorgan commodity curve index
China IP growth and global commodity price index
-10
0
10
20
30
40
50
15
20
25
30
35
40
45
%oya, 3mma, both scales
China: fixed investment and commodity imports
2005 2006 2007 2008 2009 2010 2011
Real fixed investment (deflated by PPI)
Commodity import volume
0
600
1200
1800
2400
3000
20
100
180
260
340
2002 2003 2004 2005 2006 2007 2008 2009 2010 2011 2012
Jan1994=100, volume, JPMorgan proxy
China: imports of raw and refined commodites volume and FAI
Raw minerals
Refined metals
Fixed asset investment
Yuan bn, sa, 3mma
0
600
1200
1800
2400
3000
0
100
200
300
400
2002 2003 2004 2005 2006 2007 2008 2009 2010 2011 2012
Jan1994=100, volume, JPMorgan proxy
China: imports of energy (oil and refined petroleum) volume and FAI
Fixed asset investment
Yuan bn, sa, 3mma
Energy

18
Half of bank deposits in HK are in foreign currencies Half of bank deposits in HK are in foreign currencies
Prospects for RMB internationalization
China maintained twin surpluses in external accountsChina maintained twin surpluses in external accountsMainland traveler’s spending increased steadilyMainland traveler’s spending increased steadily
RMB deposit in Hong Kong jumped significantlyRMB deposit in Hong Kong jumped significantly
1500
2000
2500
3000
3500
4000
04 05 06 07 08 09 10 11 12
HK$ bnHong Kong banking sector deposits
HK$ deposits
Non HK$ deposits
4000
4500
5000
5500
6000
6500
7000
7500
20
30
40
50
60
70
80
90
02 03 04 04 06 07 08 08 10 11
HK$ bn
Mainland visitor spending in Hong Kong
HK$
Total Mainland visitor spending
Mainland visitor spending per capita
0
2
4
6
8
10
12
04 05 06 07 08 09 10
% of GDP
China: BoP current account, capital and financial account surpluses
Current account surplus
Capital and financial account surplus
0
100
200
300
400
500
600
700
RMB bn
2005 2006 2007 2008 2009 2010 2011
Hong Kong: total RMB deposit

19
Significant scope of expanding the size of merchandise trade
Significant scope of expanding the size of merchandise trade
Prospects for RMB internationalization
JPY as a benchmark for potential trade settlement scope
JPY as a benchmark for potential trade settlement scope
China’s sustained trade surplusChina’s sustained trade surplus
20
40
60
80
100
120
140
160
04 05 06 07 08 09 10 11 12
US$ bn, 12mma
China: merchandise trade
Exports
Imports
0
100
200
300
400
RMB bnRMB cross border trade settlement
2010 2011
Japan: breakdown of currency used for trade settlement
% share
Exports from Japan USD JPY EUR AUD CAD Others
Total ex ports 48.6 41.0 6.3 1.3 0.7 2.1To US 85.9 14.1 0.1 0.0 0.0 0.0To EU 49.9 30.1 15.3 4.2 0.2 0.3To Asia 49.9 48.1 0.6 0.4 0.2 0.8
Imports to Japan USD JPY EUR CHF GBP OthersTotal imports 71.7 23.6 3.2 0.4 0.3 0.8From US 78.1 21.4 0.2 0.2 0.0 0.1From EU 58.0 28.0 11.0 2.1 0.3 0.6From Asia 71.7 26.8 0.4 0.3 0.2 0.6
Outlook of RMB deposits in HK:
Scenario 1: 10% of import and 3% of export to be settled in RMB; 10% annual growth 2.6 trillion by 2015
Scenario 2: 20% of import from EMEs, 10% of import from ROW, 3% of export to be settled in RMB; 10% annual growth 3.5 trillion by 2015
20
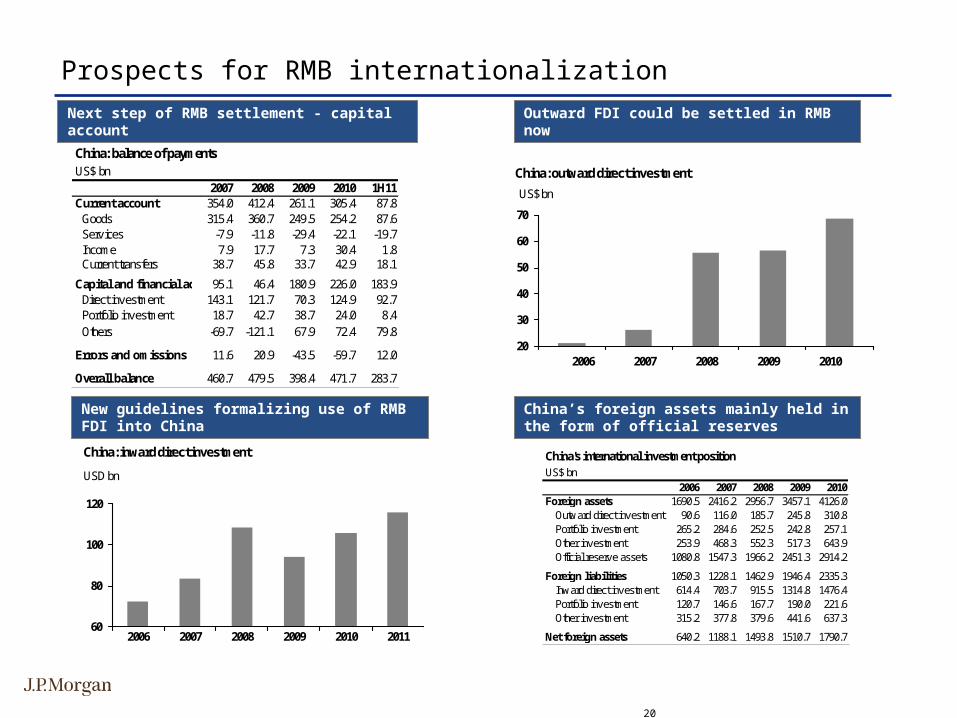
Outward FDI could be settled in RMB nowOutward FDI could be settled in RMB now
Prospects for RMB internationalization
China’s foreign assets mainly held in the form of official reserves
China’s foreign assets mainly held in the form of official reserves
New guidelines formalizing use of RMB FDI into China
New guidelines formalizing use of RMB FDI into China
Next step of RMB settlement - capital account Next step of RMB settlement - capital account China: balance of paymentsUS$ bn
2007 2008 2009 2010 1H11Current account 354.0 412.4 261.1 305.4 87.8 Goods 315.4 360.7 249.5 254.2 87.6 Serv ices -7.9 -11.8 -29.4 -22.1 -19.7 Income 7.9 17.7 7.3 30.4 1.8 Current transfers 38.7 45.8 33.7 42.9 18.1 Capital and financial account95.1 46.4 180.9 226.0 183.9 Direct inv estment 143.1 121.7 70.3 124.9 92.7 Portfolio inv estment 18.7 42.7 38.7 24.0 8.4 Others -69.7 -121.1 67.9 72.4 79.8
Errors and omissions 11.6 20.9 -43.5 -59.7 12.0
Overall balance 460.7 479.5 398.4 471.7 283.7
20
30
40
50
60
70
US$ bn
2006 2007 2008 2009 2010
China: outward direct investment
China's international investment positionUS$ bn
2006 2007 2008 2009 2010Foreign assets 1690.5 2416.2 2956.7 3457.1 4126.0
Outw ard direct inv estment 90.6 116.0 185.7 245.8 310.8Portfolio inv estment 265.2 284.6 252.5 242.8 257.1Other inv estment 253.9 468.3 552.3 517.3 643.9Official reserv e assets 1080.8 1547.3 1966.2 2451.3 2914.2
Foreign liabilities 1050.3 1228.1 1462.9 1946.4 2335.3Inw ard direct inv estment 614.4 703.7 915.5 1314.8 1476.4Portfolio inv estment 120.7 146.6 167.7 190.0 221.6Other inv estment 315.2 377.8 379.6 441.6 637.3
Net foreign assets 640.2 1188.1 1493.8 1510.7 1790.760
80
100
120
2006 2007 2008 2009 2010 2011
USD bn
China: inward direct investment
21
• Analysts’ Compensation: The research analysts responsible for the preparation of this report receive compensation based upon various factors, including the quality and accuracy of research, client feedback, competitive factors and overall firm revenues. The firm’s overall revenues include revenues from its investment banking and fixed income business units. Principal Trading: JPMorgan and/or its affiliates normally make a market and trade as principal in fixed income securities discussed in this report. Legal Entities: JPMorgan is the marketing name for JPMorgan Chase & Co. and its subsidiaries and affiliates worldwide. J.P. Morgan Securities Inc. is a member of NYSE and SIPC. JPMorgan Chase Bank, N.A. is a member of FDIC and is authorized and regulated in the UK by the Financial Services Authority. J.P. Morgan Futures Inc., is a member of the NFA. J.P. Morgan Securities Ltd. (JPMSL) is a member of the London Stock Exchange and is authorized and regulated by the Financial Services Authority. J.P. Morgan Equities Limited is a member of the Johannesburg Securities Exchange and is regulated by the FSB. J.P. Morgan Securities (Asia Pacific) Limited (CE number AAJ321) is regulated by the Hong Kong Monetary Authority. JPMorgan Chase Bank, Singapore branch is regulated by the Monetary Authority of Singapore. J.P. Morgan Securities Asia Private Limited is regulated by the MAS and the Financial Services Agency in Japan. J.P. Morgan Australia Limited (ABN 52 002 888 011/AFS Licence No: 238188) (JPMSAL) is a licensed securities dealer General: Information has been obtained from sources believed to be reliable but JPMorgan does not warrant its completeness or accuracy except with respect to any disclosures relative to JPMSI and/or its affiliates and the analyst’s involvement with the issuer. Opinions and estimates constitute our judgment as at the date of this material and are subject to change without notice. Past performance is not indicative of future results. The investments and strategies discussed here may not be suitable for all investors; if you have any doubts you should consult your investment advisor. The investments discussed may fluctuate in price or value. Changes in rates of exchange may have an adverse effect on the value of investments. This material is not intended as an offer or solicitation for the purchase or sale of any financial instrument. JPMorgan and/or its affiliates and employees may act as placement agent, advisor or lender with respect to securities or issuers referenced in this report.. Clients should contact analysts at and execute transactions through a JPMorgan entity in their home jurisdiction unless governing law permits otherwise. This report should not be distributed to others or replicated in any form without prior consent of JPMorgan. U.K. and European Economic Area (EEA): Investment research issued by JPMSL has been prepared in accordance with JPMSL’s Policies for Managing Conflicts of Interest in Connection with Investment Research. This report has been issued in the U.K. only to persons of a kind described in Article 19 (5), 38, 47 and 49 of the Financial Services and Markets Act 2000 (Financial Promotion) Order 2001 (all such persons being referred to as “relevant persons”). This document must not be acted on or relied on by persons who are not relevant persons. Any investment or investment activity to which this document relates is only available to relevant persons and will be engaged in only with relevant persons. In other EEA countries, the report has been issued to persons regarded as professional investors (or equivalent) in their home jurisdiction. Australia: This material is issued and distributed by JPMSAL in Australia to “wholesale clients” only. JPMSAL does not issue or distribute this material to “retail clients.” The recipient of this material must not distribute it to any third party or outside Australia without the prior written consent of JPMSAL. For the purposes of this paragraph the terms “wholesale client” and “retail client” have the meanings given to them in section 761G of the Corporations Act 2001. Korea: This report may have been edited or contributed to from time to time by affiliates of J.P. Morgan Securities (Far East) Ltd, Seoul branch. Revised November 12, 2004. Copyright 2008 JPMorgan Chase & Co. All rights reserved. Additional information available upon request.