Embed Size (px)
Citation preview

CDM-MR-FORM
Version 05.1 Page 1 of 49
Monitoring report form
(Version 05.1)
Complete this form in accordance with the Attachment “Instructions for filling out the monitoring report form” at the end of this form.
MONITORING REPORT
Title of the project activity BRT Metrobus Insurgentes, Mexico
UNFCCC reference number of the project activity 4945
Version number of the monitoring report 3
Completion date of the monitoring report 14/10/2015
Monitoring period number and duration of this monitoring period 2
nd Monitoring Period. From 01/11/2013 to 31/10/2014
Project participant(s) Mexico: Metrobús
Spain: International Bank for Reconstruction and Development (IBRD) as Trustee of the Spanish Carbon Fund (SCF); Kingdom of Spain - Ministry of Agriculture, Food and Environment and Ministry of Economy and Competitiveness; Azuliber 1, S.L; Cementos Portland Valderrivas, S.A.; Comercial de Materiales de Construccion S.L. (COMAC); Compania Espanola de Petroleo, S.A. (CEPSA); E.ON Generacion S.L.; Endesa Generacion, S.A.; Gas Natural SDG, S.A; Hidroelectrica del Cantabrico, S.A.; Iberdrola Generacion, S.A.U.; Repsol YPF, S.A.; Zeroemissions Carbon Trust, S.A.
Host Party Mexico
Sectoral scope(s) Sectoral scope 7: Transport
Selected methodology(ies) ACM0016 ver. 2 - Baseline Methodology for Mass Rapid Transit Projects
Selected standardized baseline(s) NA
Estimated amount of GHG emission reductions or net GHG removals by sinks for this monitoring period in the registered PDD
46,810 tCO2eq = (47,087/365)*61 tCO2eq in 2013 +
(46,755/365)*304 tCO2eq in 2014
Total amount of GHG emission reductions or net GHG removals by sinks achieved in this monitoring period
GHG emission reductions or net GHG removals by sinks reported up to 31 December 2012
GHG emission reductions or net GHG removals by sinks reported from 1 January 2013 onwards
NA 37,517 tCO2eq

CDM-MR-FORM
Version 05.1 Page 2 of 49
SECTION A. Description of project activity
A.1. Purpose and general description of project activity
>> The objective of the BRT (Bus Rapid Transit) Metrobus Insurgentes in the Zona Metropolitana del Valle de México (Mexico City Metropolitan Area - MCMA) is to establish an efficient, safe, rapid, convenient, comfortable and effective modern mass transit system based on a BRT system. The MCMA has nearly 20 million inhabitants. The Project includes the BRT line Insurgentes. The project transports annually around 80 million passengers. The geographical boundary of the project is the greater metropolitan area of the city of Mexico known as MCMA. Emission reductions are achieved through reducing GHG (Greenhouse Gases) emissions per passenger/kilometer comparing conventional modes of transport with the BRT. The BRT system has as main environmental aspect that the resource efficiency of transporting passengers in Mexico City is improved i.e. emissions per passenger kilometer are reduced compared to the situation without project. Gases included are CO2 and CH4.
Relevant Dates of the project activity1
2004 Construction of the Metrobus Insurgentes Corridor (from Indios Verdes terminal in the North to Doctor Galvez station in the South)
2005 Operation of Metrobus Insurgentes Corridor started on 19 June 2005
Core aspects of the project are:
Infrastructure. The project includes 19.6 km of exclusive separated bus lanes including new bus-stations. Each station has a modular design to ensure uniformity of the corridor’s image with obstacle-free waiting areas and elevated level-access to articulated buses with a high platform. All stations have access ramps for mobility-impaired passengers. Picture 1 below shows a typical station on a BRT route.
High capacity buses: Buses used on Metrobus are articulated with 160 and 240 passengers, with EURO III, EURO IV and EURO V environmental certification. Toll and access control. In Metrobus, the toll system and access control is based on the prepaid card without contact, which can be purchased and recharged at all stations through vending machines. This system allows to know the values associated with passengers in the system with geographical and temporal references, and allows users in terms of speed step and make the entrance to the BRT stations in seconds.
Centralized fleet. Metrobus has a central control system from which the fleet operational controls and compliance with the schedule of services is verified by the operating companies, this tool provides the miles in operation offered by Metrobus fleet.
The total GHG emission reductions achieved in this monitoring period are 37,469 tCO2.
A.2. Location of project activity
>> The project activity is developed in Mexico, in the Federal District, in Mexico City. The spatial extent of the project is the larger metropolitan area of Mexico City known as MCMA. The spatial
1 In 2008 the corridor was extended from Doctor Galvez station to El Caminero station. Expansion of the
Metrobus Insurgentes Corridor is not included as part of this project activity, only the stations located between Indios Verdes and Doctor Galvez (both included) are considered.

CDM-MR-FORM
Version 05.1 Page 3 of 49
area includes the trip origins and destinations of passengers using Metrobus BRT. While the BRT lines of the project are located in the Federal District, the project boundary encompasses the entire trip of passengers using the project MRTS i.e. from trip origin to trip destination. Latter can be everywhere in the MCMA as passengers use partially the system e.g. to get downtown in the DF (Distrito Federal) from their home located e.g. in Estado de Mexico. The Metrobus Insurgentes Corridor began operations in June 2005 along 19.6 kilometers of Insurgentes Avenue, connecting the north of the city (adjacent to the State of Mexico) to the south, where University City is located. Due to the success and public demand, it was expanded 10 kilometers South, to the start of the road heading to the State of Morelos. This expansion began operations in March 2008. The project activity only includes the Insurgentes Corridor, which begins at Indios Verdes terminal in the North, and ends at the Doctor Gálvez station in the South (Fig. 1).
Figure 1. Localization of the Insurgentes Corridor.
A.3. Parties and project participant(s)
Party involved ((host) indicates a host Party)
Private and/or public entity(ies) project participants (as applicable)
Indicate whether the Party involved wishes to be considered as project participant (yes/no)
Mexico (host) Metrobus No
Spain
International Bank for Reconstruction and Development (IBRD) as Trustee of the Spanish Carbon Fund (SCF); Kingdom of Spain - Ministry of Agriculture, Food and Environment and Ministry of Economy and Competitiveness; Azuliber 1, S.L; Cementos Portland Valderrivas, S.A.; Comercial de Materiales de Construccion S.L. (COMAC); Compania Espanola de Petroleo, S.A. (CEPSA); E.ON Generacion S.L.; Endesa Generacion, S.A.; Gas Natural SDG, S.A; Hidroelectrica del Cantabrico, S.A.; Iberdrola Generacion, S.A.U.; Repsol YPF, S.A.; Zeroemissions Carbon Trust, S.A.
Yes

CDM-MR-FORM
Version 05.1 Page 4 of 49

CDM-MR-FORM
Version 05.1 Page 5 of 49
A.4. Reference of applied methodology and standardized baseline
>> ACM0016: Baseline Methodology for Mass Rapid Transit Projects; Version 2.02 This methodology also refers to the latest approved version of the following tools3: • “Tool for the demonstration and assessment of additionality”, Version 05.2 • “Tool to calculate baseline, project and/or leakage emissions from electricity consumption”, Version 01
A.5. Crediting period of project activity
>> The starting date of the crediting period is 10/08/2012 and runs for 7 years until 9/08/2019, which can be renewed.
A.6. Contact information of responsible persons/entities
>> This monitoring report has been developed by Julio Ivan Martinez Cortijo ([email protected]) from Metrobus (Project Participant), in collaboration with the International Bank for Reconstruction and Development, as Trustee of the Spanish Carbon Fund ([email protected], Project Participant).
SECTION B. Implementation of project activity
B.1. Description of implemented registered project activity
>> The pre-project scenario is the usage of LPG (Liquefied Petroleum Gas), diesel, gasoline and electric trolleybuses, taxis, passenger cars, motorcycles, metro, suburban train and NMT (Non-Motorized Transit) for transit purposes. All of these transit modes are partially substituted by the project. The baseline situation is that in absence of the project activity these modes of transit would continue to operate being renovated under BAU (Business As Usual). This is reflected in the technology improvement factor applied to baseline emission factors per mode of transport. Features of the BRT system include exclusive right-of-way lanes, rapid boarding and alighting, pre-board fare collection and fare verification, enclosed stations, clear route maps, real-time information displays, automatic vehicle location technology to manage vehicle movements, clean vehicle technologies and excellence in marketing and customer service. The technology deployed has 4 main components: Infrastructure, buses, transit management and fare system.
Infraestructure. The project includes 19.6 km of exclusive separated bus lanes including new bus-stations. Each station has a modular design to ensure uniformity of the corridor’s image with obstacle-free waiting areas and elevated level-access to articulated buses with a high platform. All stations have access ramps for mobility-impaired passengers. Picture 1 shows a typical station on a BRT route.
o Exclusive lane: It is the main feature and this is one of the features that generates the main benefits, because it allows to have homogeneous speeds higher than the speeds in mixed flow, control cycle times, programming services on the line, higher than in mixed flow control cycle times, programming and vial ordering, as well as discourage the transport un private vehicles.
o Stations: The distance between stations can maintain higher speeds and times to a particular vehicle, and contribute to the urban image of the city, creating safe public spaces on public roads. The stations are a key element as far as accessibility is
2 https://cdm.unfccc.int/methodologies/DB/FXQBDV16UML49NJN03U1QQTEY9J90E
3 http://cdm.unfccc.int/methodologies/PAmethodologies/approved
CDM-MR-FORM
Version 05.1 Page 6 of 49
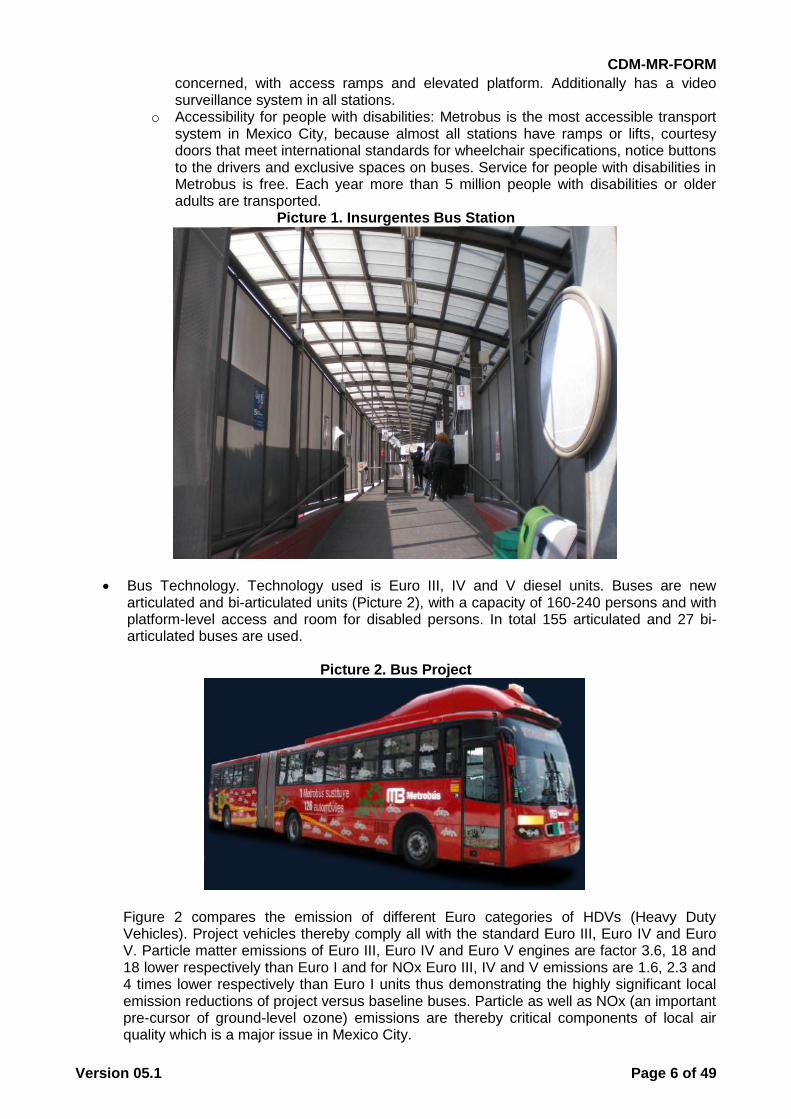
concerned, with access ramps and elevated platform. Additionally has a video surveillance system in all stations.
o Accessibility for people with disabilities: Metrobus is the most accessible transport system in Mexico City, because almost all stations have ramps or lifts, courtesy doors that meet international standards for wheelchair specifications, notice buttons to the drivers and exclusive spaces on buses. Service for people with disabilities in Metrobus is free. Each year more than 5 million people with disabilities or older adults are transported.
Picture 1. Insurgentes Bus Station
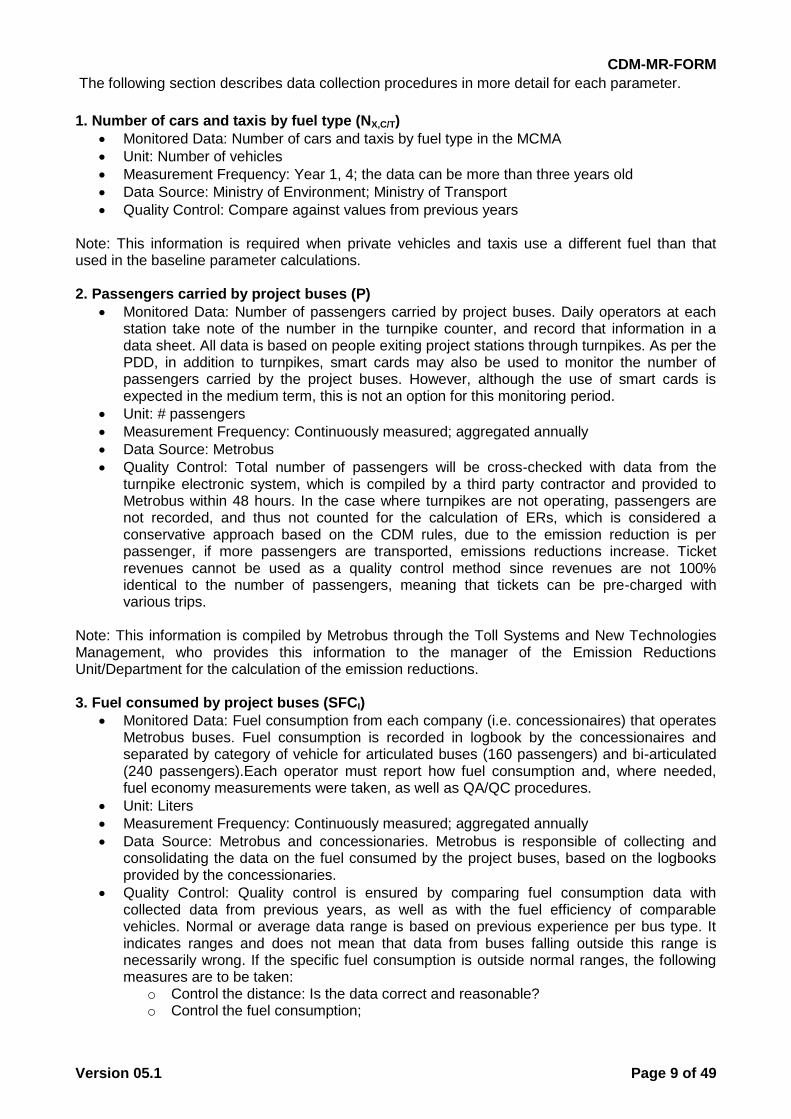
Bus Technology. Technology used is Euro III, IV and V diesel units. Buses are new articulated and bi-articulated units (Picture 2), with a capacity of 160-240 persons and with platform-level access and room for disabled persons. In total 155 articulated and 27 bi-articulated buses are used.
Picture 2. Bus Project
Figure 2 compares the emission of different Euro categories of HDVs (Heavy Duty Vehicles). Project vehicles thereby comply all with the standard Euro III, Euro IV and Euro V. Particle matter emissions of Euro III, Euro IV and Euro V engines are factor 3.6, 18 and 18 lower respectively than Euro I and for NOx Euro III, IV and V emissions are 1.6, 2.3 and 4 times lower respectively than Euro I units thus demonstrating the highly significant local emission reductions of project versus baseline buses. Particle as well as NOx (an important pre-cursor of ground-level ozone) emissions are thereby critical components of local air quality which is a major issue in Mexico City.

CDM-MR-FORM
Version 05.1 Page 7 of 49
Figure 2. Emissions of Particle Matter and NOx (indexed).
Source: Regulations 88/77/EEC for Euro 0; 91/542/EEC for Euro I and II; 1999/96/EC for Euro III, IV and V.
Transit Management. The operational fleet centre manages trunk bus dispatch, informs passengers, produces reports and maintains records. Buses are equipped with GPS (Global Positioning System) or comparable to identify their position and track distance driven. This is linked to the operation centre. The novelty of the operational fleet centre is that an efficient management of bus fleets and bus dispatch can take place optimizing load factors through coordinated scheduling of service. Also passengers have real-time information about the next available bus, and are informed of potential transit problems. The transit system operates on concessions eliminating competition at bus-to-bus level.
Fare System. The system is based on pre-board ticketing using magnetic ticketing, which can be purchased and recharged at all stations through vending machines. Validation turnstiles at the entrance of each station detect each electronic ticket and deduct the corresponding fare. This streamlines the boarding process, allows drivers to concentrate on bus operation and plays a key role in optimizing operations. This system allows to know the values associated with passengers in the system with geographical and temporal references, and allows users in terms of speed step, make the entrance to the BRT stations in seconds. Fare collection is centralized and managed through a trust fund.
B.2. Post-registration changes
B.2.1. Temporary deviations from registered monitoring plan, applied methodology or applied standardized baseline
>> A temporary deviation from the registered monitoring plan was approved for this project prior to this verification. Please refer to: PRC-4945-001 Approved on July 2, 2014
B.2.2. Corrections
>> NA
0
20
40
60
80
100
120
Euro 0 Euro I Euro II Euro III Euro IV Euro V
Ind
exe
d
Particle Matter NOx

CDM-MR-FORM
Version 05.1 Page 8 of 49
B.2.3. Changes to start date of crediting period
>> The start date of the crediting period was changed from August 10, 2011 to August 10, 2012. Please refer to: PRC-4945-001 Approved on July 2, 2014.
B.2.4. Inclusion of a monitoring plan to the registered PDD that was not included at registration
>> NA
B.2.5. Permanent changes from registered monitoring plan, applied methodology or applied standardized baseline
>> Permanent changes from the registered monitoring plan were approved for this project prior to this verification. Please refer to: PRC-4945-001 Approved on July 2, 2014
B.2.6. Changes to project design of registered project activity
>> NA
B.2.7. Types of changes specific to afforestation or reforestation project activity
>> NA
SECTION C. Description of monitoring system
>> Below is a summary of all data that must be collected:
Index Indicator Gathering frequency
Data Source
1 Fuel types used by cars, taxis, buses incl. bio-fuel usage
Annual Department of Transport, Environmental Secretariat
2 Passenger transported Monthly Metrobus
3 Fuel consumption BRT units Annual Metrobus and concessionaires
4 Distance driven BRT units Annual Metrobus and concessionaires
5 Passenger survey for indirect project and baseline emission per passenger and mode share baseline
Year 1, 4 Survey realized by an external company (RP&A Creatividad mercadológica)
6 Number of buses and taxis Year 1, 4, 7 and 10
Department of Transport, Environmental Secretariat
7 Occupation rate of buses and taxis Year 1, 4, 7 and 10
Metrobus for occupation rate of buses; and a third party for occupation rate of taxis
8 Net Calorific Value Annual IPCC
9 Emission factors of fuels Annual IPCC
CDM-MR-FORM
Version 05.1 Page 9 of 49
The following section describes data collection procedures in more detail for each parameter.
1. Number of cars and taxis by fuel type (NX,C/T)
Monitored Data: Number of cars and taxis by fuel type in the MCMA
Unit: Number of vehicles
Measurement Frequency: Year 1, 4; the data can be more than three years old
Data Source: Ministry of Environment; Ministry of Transport
Quality Control: Compare against values from previous years Note: This information is required when private vehicles and taxis use a different fuel than that used in the baseline parameter calculations. 2. Passengers carried by project buses (P)
Monitored Data: Number of passengers carried by project buses. Daily operators at each station take note of the number in the turnpike counter, and record that information in a data sheet. All data is based on people exiting project stations through turnpikes. As per the PDD, in addition to turnpikes, smart cards may also be used to monitor the number of passengers carried by the project buses. However, although the use of smart cards is expected in the medium term, this is not an option for this monitoring period.
Unit: # passengers
Measurement Frequency: Continuously measured; aggregated annually
Data Source: Metrobus
Quality Control: Total number of passengers will be cross-checked with data from the turnpike electronic system, which is compiled by a third party contractor and provided to Metrobus within 48 hours. In the case where turnpikes are not operating, passengers are not recorded, and thus not counted for the calculation of ERs, which is considered a conservative approach based on the CDM rules, due to the emission reduction is per passenger, if more passengers are transported, emissions reductions increase. Ticket revenues cannot be used as a quality control method since revenues are not 100% identical to the number of passengers, meaning that tickets can be pre-charged with various trips.
Note: This information is compiled by Metrobus through the Toll Systems and New Technologies Management, who provides this information to the manager of the Emission Reductions Unit/Department for the calculation of the emission reductions. 3. Fuel consumed by project buses (SFCI)
Monitored Data: Fuel consumption from each company (i.e. concessionaires) that operates Metrobus buses. Fuel consumption is recorded in logbook by the concessionaires and separated by category of vehicle for articulated buses (160 passengers) and bi-articulated (240 passengers).Each operator must report how fuel consumption and, where needed, fuel economy measurements were taken, as well as QA/QC procedures.
Unit: Liters
Measurement Frequency: Continuously measured; aggregated annually
Data Source: Metrobus and concessionaries. Metrobus is responsible of collecting and consolidating the data on the fuel consumed by the project buses, based on the logbooks provided by the concessionaries.
Quality Control: Quality control is ensured by comparing fuel consumption data with collected data from previous years, as well as with the fuel efficiency of comparable vehicles. Normal or average data range is based on previous experience per bus type. It indicates ranges and does not mean that data from buses falling outside this range is necessarily wrong. If the specific fuel consumption is outside normal ranges, the following measures are to be taken:
o Control the distance: Is the data correct and reasonable? o Control the fuel consumption;

CDM-MR-FORM
Version 05.1 Page 10 of 49
o Is the specific consumption too high or too low: Compare the data with the previous months. Have any previous values fallen outside the range?
If differences cannot be explained then:
o Check documentary filling controls (data transmission and storage); o Check distance measurement controls (data transmission and storage)
Note: This information is compiled by Metrobús through the manager of the Bus Fleet Unit/Department, who provides this information to the manager of the Emission Reductions Unit/Department for the calculation of the emission reductions. 4. Distance traveled by project buses (DDP,J)
Monitored Data: Distance traveled by project buses. The distance traveled is provided by the concessionaries.
Unit: km
Measurement Frequency: Continuously measured; aggregated annually
Data Source: Metrobus and concessionaries. Metrobus is responsible of collecting and consolidating the data on the distance travelled by the project buses, based on the logbooks provided by the concessionaries.
Quality Control: Quality control is ensured by comparing the information provided by the concessionaire with the logbooks from Metrobus with information on kms driven taken every 15 days. This data is also used to monitor project bus fuel efficiency. In case of discrepancy between the two sources, the total distance is discussed and agreed between the concessionaires and Metrobus,
Note: Information from the logbooks provided by the concessionaires is compiled by Metrobús through the manager of the Bus Fleet Unit/Department, which provides this information to the manager of the Emission Reductions Unit/Department in order to make the corresponding calculations.
5. Passenger surveys (MSI, BTDP,I, IPTDP,I, PSPER, FEXP)
Parameters o MSi Distribution of project passengers by mode o BTDp,i Distance traveled in baseline, by mode o IPTDp,I Complete distance traveled from origin to destination o PSPER Number of surveyed passengers o FEXp Expansion factor
Monitored Data: The passenger survey is used to collect the data required to determine baseline and project emissions stemming from modal shift and induced travel. The survey determines the baseline emissions per passenger respondent, as well as “indirect” project emissions, which refers to the emissions generated getting to and from the BRT stations, before and after riding the BRT.
Unit: o MSi % o BTDp,i km o IPTDp,i km o PSPER # passengers
Measurement Frequency: Years 1, 4 (survey conducted over a 7-day period)
Data Source: CDM Annual Passenger Survey conducted by an external company- RP&A Creatividad Mercadológica. The first test was realized in November 2012, and the second survey was realized in June 2013.
Quality Control: See PDD Appendix 4 Section A.7. for complete survey design including survey to be used
Note: The emissions are calculated on a per passenger basis and are “expanded” to represent the survey population using an expansion factor calculated for each respondent. Interviews are

CDM-MR-FORM
Version 05.1 Page 11 of 49
conducted through the hiring of an independent third party that provides all information to the manager of Metrobus Emission Reductions Unit/Department, so that it uses that information to make the corresponding calculations. In the first year, in addition to the initial survey, a second measurement is carried out in a later period, with a sample size of less than half of the initial survey (as specified in the methodology). 6. Number of conventional operating buses and taxis (NB,T)
Monitored Data: Number of buses and taxis registered in MCMA
Unit: # vehicles
Measurement Frequency: Years 1, 4, 7 and 10 of the crediting period
Data Source: Ministry of Environment; Ministry of Transport
Quality Control: n/a Note: These parameters are only recorded in cases where the occupancy rate of buses and taxis is lower than in the baseline (in the case of buses, if the occupancy rate is reduced by 10 percentage points higher than the rate of occupation of the baseline, and in the case of taxis if less than baseline occupancy rate). See PDD Appendix 4 Section A.3 for further details regarding occupancy level calculation for conditions under which this parameter is required. In summary, this parameter is only required when: bus occupancy rate is less than 7% and/or taxi occupancy rate is less than 0.66 passengers per vehicle (taxi occupancy rates do not include the driver). 7. Average occupancy level of conventional operating buses and taxis (OCB,T)
Monitored Data: Occupancy of conventional, non-project buses and taxis still operating in the MCMA. The methodology to determine the occupancy rate is detailed in PDD Appendix 4 Section A.5 and A.6.2.
Unit: % for buses and average number of passengers per vehicle for taxis
Measurement Frequency: Years 1, 4
Data Source: For the occupancy rate of taxis studies from an independent third party are used. For the occupancy rate of buses, calculations were conducted by Metrobus based on official data from the Secretary of Environment.
Quality Control: For the occupancy rate of taxis, coverage of the occupation counts should be higher than 95% of the number of taxis that cross the checkpoint.
Note: With the information from the Secretary of Environment, the manager of Metrobus Emission Reductions Unit/Department calculates the average occupancy level of conventional buses. In the case of taxis, an independent third party accounts the passengers on established points, and Metrobus Emission Reductions Unit/Department calculates the average occupancy level of conventional taxis.
8. Net calorific value of gasoline, diesel, and lpg (NVCG/D/LPG)
Monitored Data: Net calorific value of gasoline, Diesel and LPG
Unit: MJ / kg
Measurement Frequency: Annually
Data Source: IPCC Guidelines
Note: The manager of Metrobus Emission Reductions Unit/Department is in charge of compiling this information for the calculation of the emission reductions. 9. Carbon emissions factor for gasoline, diesel, and lpg (EFCO2, G/D/LPG)
Monitored Data: CO2e emissions factor for gasoline, Diesel, and LPG
Unit: grams CO2e / MJ
Measurement Frequency: Annually
Data Source: IPCC Guidelines

CDM-MR-FORM
Version 05.1 Page 12 of 49
Note: The manager of Metrobus Emission Reductions Unit/Department is in charge of compiling the information for the calculation of the emission reductions.
Figure 3 shows Metrobus Organigram. Staff involved in providing information for the report is shown in blue color, while those in charge of compiling, storing and processing all the information to do the necessary calculations for the monitoring report are shown in green color.
Figure 3. Metrobus Organigram
General Management
Technical Operational
Management
Planning, Assessment & Systems
Management
Toll Systems & New Technologies
Management
Emission Reduction Unit /
Department
New Technologies & Emission Reductions
Management Office
Bus Fleet Unit
/Department
Technical Management

CDM-MR-FORM
Version 05.1 Page 13 of 49
SECTION D. Data and parameters
D.1. Data and parameters fixed ex ante or at renewal of crediting period
Data/parameter: SFCC,x,
Unit Grams of fuel / km
Description Specific fuel consumed of passenger cars using fuel type x where C stands for vehicle category passenger cars
Source of data IPCC, reference manual 1996, Table 1-27 and 1-36
Value(s) applied) 60.0
Choice of data or measurement methods and procedures
Lowest value of all IPCC values for passenger cars reported. Values reported IPCC range from 11.8 l/100km to 22.2 l/100km for US vehicles (Table 1.27) and from 8.1 l/100km to 11.2 l/100km for European vehicles (Table 1.36)
Purpose of data Calculation of baseline emissions
Additional comments The value recorded by the IPCC is in liters per 100km. The lowest value taken here is 8.1l/100km. To transform from liters to grams the specific weight of gasoline was taken based on IEA 2005, Table A.3.8. (File 58) The share of gasoline cars is 100% (File 1). IPCC 2006 does not report fuel consumptions, thus the newest default value available is 1996. The last local study was performed 2006 and is thus elder than 3 years. No national study was available. Studies from other cities are not necessarily comparable as vehicle population and structure is different, thus IPCC default values have been taken. The IPCC default value taken (8.1 l/100km) is lower than the value measured 2006 in the study in Mexico City (10.1 l/100km; Senes, File 3) and is thus surely conservative.
Data/parameter: SFCT,x,
Unit Grams of fuel / km
Description Specific fuel consumed of taxis using fuel type x where T stands for vehicle category passenger taxis
Source of data DTP, 2009 lower 95% confidence interval
Value(s) applied) 57.0
Choice of data or measurement methods and procedures
Data is based on measurements realized of vehicles (not a survey). The lower 95% confidence interval of the sample is taken. The plausibility of the data is assessed below based on recent values reported by other cities.
Table 1: Comparison SFCT Mexico with Other Data Sources (l/100km)
México Taxis in other cities (Barranquilla and Quito)
IPCC default
7.7 9 US: 11.8-22.2 European: 8.1-11.2
The monitored value for taxis is lower than reported in other cities and at the lower end of IPCC default values although Mexico is located at 2,310 m.s.l. which leads to increased fuel consumption of vehicles.
Purpose of data Calculation of baseline emissions
Additional comments The value measured is in liters. To transform from liters to grams the specific weight of gasoline was taken based on IEA 2005, Table A.3.8. The share of gasoline taxis is 100%

CDM-MR-FORM
Version 05.1 Page 14 of 49
Data/parameter: SFCM,x,
Unit Grams of fuel / km
Description Specific fuel consumed of motorcycles using fuel type x where M stands for vehicle category motorcycles
Source of data DPT 2009
Value(s) applied) 20.7
Choice of data or measurement methods and procedures
Data is based on measurements realized on vehicles (not survey). The lower 95% confidence interval of the sample is taken. The plausibility of the data is assessed below based on recent values reported by other cities.
Table 1: Comparison SFCT Mexico with Other Data Sources (l/100km)
México Motorcycles in other cities (Barranquilla and Quito)
IPCC default
2.8 3-4 US: 9.3 – 11.2 European: 2.4-5.1
The monitored value for motorcycles is lower than reported in other cities and at the lower end of IPCC default values although Mexico is located at 2,310 m.s.l. which leads to increased fuel consumption of vehicles.
Purpose of data Calculation of baseline emissions
Additional comments The value measured is in liters. To transform from liters to grams the specific weight of gasoline was taken based on IEA 2005, Table A.3.8. The share of gasoline motorcycles is 100%
Data/parameter: SFCB,L,D,
Unit Grams of fuel / km
Description Specific fuel consumed of large diesel buses where B stands for vehicle category Bus and L for sub-category Large and D for fuel type diesel
Source of data DTP, 2010 (File 11b)
Value(s) applied) 690
Choice of data or measurement methods and procedures
Data is based on measurements realized of vehicles (not a survey). The lower 95% confidence interval of the sample is taken. The Standard Deviation of the sample is very small. A previous study realized by Senes along corridor Insurgentes shows a comparable value however with a smaller sample. Nearly 50% of diesel vehicles are elder than 1993. The sample has an average age of 1994 and thus reflects the vehicle average. Other factors which lead to a high fuel consumption are the slow moving speed (Baseline speed of buses is 15-19 km/h with peak hour speed of only 10km/h), the congestion in Mexico leading to stop-and-go traffic and the altitude. Mexico is located at 2,310 m.s.l. which leads to increased fuel consumption of vehicles
Purpose of data Calculation of baseline emissions
Additional comments The value measured is in liters. To transform from liters to grams the specific weight of diesel was taken based on IEA 2005, Table A.3.8.

CDM-MR-FORM
Version 05.1 Page 15 of 49
Data/parameter: SFCB,L,G,
Unit Grams of fuel / km
Description Specific fuel consumed of large gasoline buses where B stands for vehicle category Bus and L for sub-category Large and G for fuel type gasoline
Source of data IPCC, 1996
Value(s) applied) 322
Choice of data or measurement methods and procedures
Table 1-29 for HDV gasoline lowest value applied. This is conservative as HDVs not only refer to buses but also trucks which have overall lower fuel consumption as they operate in less stop-and-go conditions.
Purpose of data Calculation of baseline emissions
Additional comments The value measured is in liters. To transform from liters to grams the specific weight of gasoline was taken based on IEA 2005, Table A.3.8.
Data/parameter: SFCB,L,EL
Unit kWh/km
Description Specific electricity consumed of large electric trolleybuses where B stands for vehicle category Bus and L for sub-category Large and EL for fuel type electric trolleybus
Source of data Plan de Accion para el Uso Eficiente de la Energia en el Distrito Federal, GDF 2009
Value(s) applied) 2.48
Choice of data or measurement methods and procedures
Based on vehicle statistics (not sample). Official government report. Quito has comparable values (2.2 kWh/km)
Purpose of data Calculation of baseline emissions
Additional comments -
Data/parameter: SFCB,M,G,
Unit Grams of fuel / km
Description Specific fuel consumed of medium gasoline buses where B stands for vehicle category Bus and M for sub-category Medium and G for fuel type gasoline
Source of data DTP, 2010 (File 11c)
Value(s) applied) 293
Choice of data or measurement methods and procedures
Data is based on measurements realized of vehicles (not a survey). The lower 95% confidence interval of the sample is taken. Gasoline buses of this size (50 passengers) are seldom used in other cities. A comparable study realized by Senes 2006 showed slightly higher values (51 l/100km instead of 40 l/100km). The monitored value is thus plausible. Other factors which lead to a high fuel consumption are the slow moving speed (Baseline speed of buses is 15-19 km/h with peak hour speed of only 10km/h101), the congestion in Mexico leading to stop-and-go traffic and the altitude. Mexico is located at 2,310 m.s.l. which leads to increased fuel consumption of vehicles.
Purpose of data Calculation of baseline emissions
Additional comments The value measured is in liters. To transform from liters to grams the specific weight of gasoline was taken based on IEA 2005, Table A.3.8.

CDM-MR-FORM
Version 05.1 Page 16 of 49
Data/parameter: SFCB,M,LPG
Unit Grams of fuel / km
Description Specific fuel consumed of medium LPG buses where B stands for vehicle category Bus and M for sub-category Medium and LPG for fuel type LPG
Source of data DTP, 2010
Value(s) applied) 316
Choice of data or measurement methods and procedures
Data is based on measurements realized of vehicles (not a survey). The lower 95% confidence interval of the sample is taken. LPG buses of this size (50 passengers) are seldom used in other cities. A comparable study realized by Senes 2006 showed slightly higher values (73 l/100km instead of 61 l/100km). The monitored value is thus plausible. Other factors which lead to a high fuel consumption are the slow moving speed (Baseline speed of buses is 15-19 km/h with peak hour speed of only 10km/h), the congestion in Mexico leading to stop-and-go traffic and the altitude. Mexico is located at 2,310 m.s.l. which leads to increased fuel consumption of vehicles.
Purpose of data Calculation of baseline emissions
Additional comments The value measured is in liters. To transform from liters to grams the specific weight of LPG was taken based on IEA 2005, Table A.3.8.
Data/parameter: SFCB,S,G,
Unit Grams of fuel / km
Description Specific fuel consumed of small gasoline buses where B stands for vehicle category Bus and S for sub-category Small and G for fuel type gasoline
Source of data DTP, 2010
Value(s) applied) 105
Choice of data or measurement methods and procedures
Data is based on measurements realized of vehicles (not a survey). The lower 95% confidence interval of the sample is taken. A comparable study realized by Senes 2006 showed identical values. The monitored value is thus plausible.
Purpose of data Calculation of baseline emissions
Additional comments The value measured is in liters. To transform from liters to grams the specific weight of gasoline was taken based on IEA 2005, Table A.3.8.
Data/parameter: EFGrid
Unit kgCO2 / kWh
Description Emission factor for the grid
Source of data Tool to calculate baseline, project and/or leakage emissions from electricity consumption version 01 (UNFCCC)
Value(s) applied) 0.4
Choice of data or measurement methods and procedures
Default value as provided in “Tool to calculate baseline, project and/or leakage emissions from electricity consumption” (Version 01)
Purpose of data Calculation of baseline emissions
Additional comments Electricity is only used in the baseline and hydropower plants constitute in the average of the last 5 years less than 50% of total grid generation (option A2 of referenced tool)

CDM-MR-FORM
Version 05.1 Page 17 of 49
Data/parameter: TDL
Unit %
Description Average technical transmission and distribution losses for providing electricity
Source of data Tool to calculate baseline, project and/or leakage emissions from electricity consumption version 01 (UNFCCC)
Value(s) applied) 3%
Choice of data or measurement methods and procedures
Default value of tool based on usage of electricity for baseline only
Purpose of data Calculation of baseline emissions
Additional comments -
Data/parameter: EFKM,B,CH4
Unit gCO2eq / km
Description CH4 emission factor of LPG buses
Source of data IPCC 2006, table 3.2.4
Value(s) applied) 1.7
Choice of data or measurement methods and procedures
IPCC value as no national measurements exist.
Purpose of data Calculation of baseline emissions
Additional comments The methodology requires that CH4 emissions of vehicles using gaseous fuels are included. 0.067 gCH4 of IPCC is multiplied with the GWP of 25 for CH4 to calculate CO2eq
Data/parameter: OCC
Unit Passengers
Description Average occupation rate of passenger cars
Source of data DTP, 2009
Value(s) applied) 1.48
Choice of data or measurement methods and procedures
Survey realized using upper 95% confidence interval. The sample size required for a 95% confidence level and a 5% maximum error bound of a point estimation of simple random sample is 359 while the actual sample size taken was 117,094 units.
Purpose of data Calculation of leakage emissions
Additional comments -
Data/parameter: OCT
Unit Passengers
Description Average occupation rate of taxis
Source of data DTP, 2009
Value(s) applied) 0.66 Excluding Driver
Choice of data or measurement methods and procedures
Survey realized using upper 95% confidence interval. The sample size required for a 95% confidence level and a 5% maximum error bound of a point estimation of simple random sample is 2,504 while the actual sample size taken was 52,302 units.
Purpose of data Calculation of leakage emissions
Additional comments Is monitored also for determination of leakage occupation rate.
CDM-MR-FORM
Version 05.1 Page 18 of 49
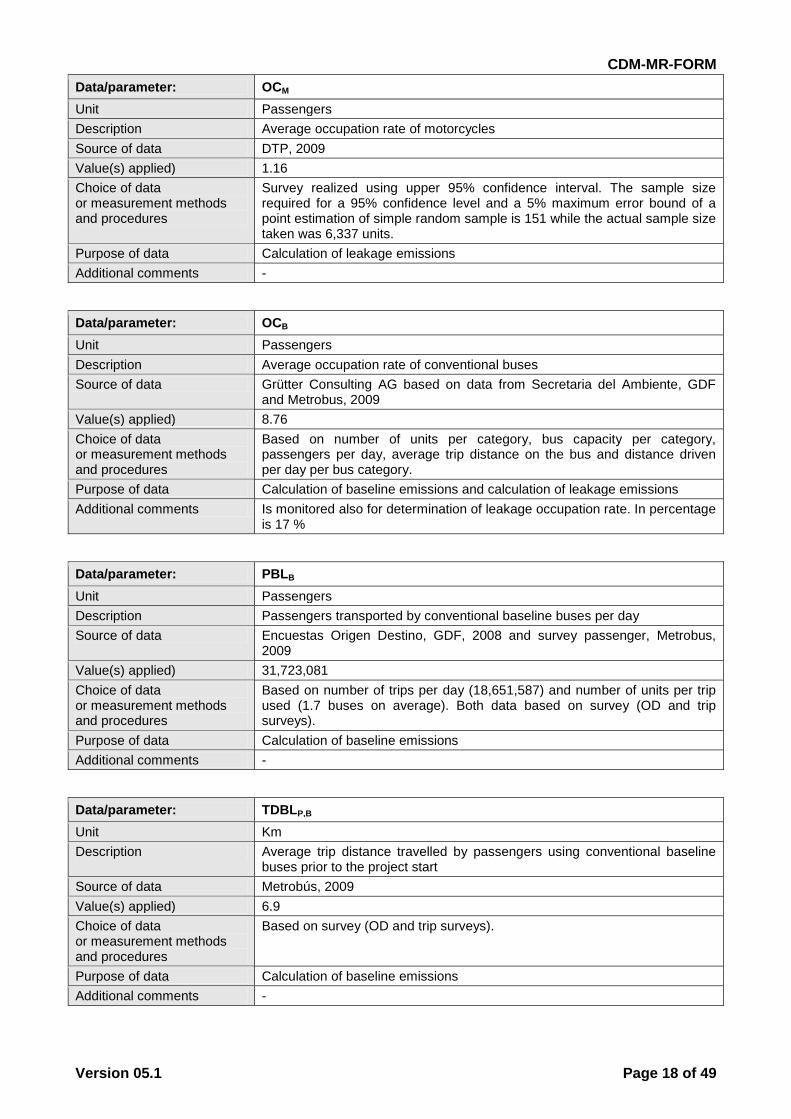
Data/parameter: OCM
Unit Passengers
Description Average occupation rate of motorcycles
Source of data DTP, 2009
Value(s) applied) 1.16
Choice of data or measurement methods and procedures
Survey realized using upper 95% confidence interval. The sample size required for a 95% confidence level and a 5% maximum error bound of a point estimation of simple random sample is 151 while the actual sample size taken was 6,337 units.
Purpose of data Calculation of leakage emissions
Additional comments -
Data/parameter: OCB
Unit Passengers
Description Average occupation rate of conventional buses
Source of data Grütter Consulting AG based on data from Secretaria del Ambiente, GDF and Metrobus, 2009
Value(s) applied) 8.76
Choice of data or measurement methods and procedures
Based on number of units per category, bus capacity per category, passengers per day, average trip distance on the bus and distance driven per day per bus category.
Purpose of data Calculation of baseline emissions and calculation of leakage emissions
Additional comments Is monitored also for determination of leakage occupation rate. In percentage is 17 %
Data/parameter: PBLB
Unit Passengers
Description Passengers transported by conventional baseline buses per day
Source of data Encuestas Origen Destino, GDF, 2008 and survey passenger, Metrobus, 2009
Value(s) applied) 31,723,081
Choice of data or measurement methods and procedures
Based on number of trips per day (18,651,587) and number of units per trip used (1.7 buses on average). Both data based on survey (OD and trip surveys).
Purpose of data Calculation of baseline emissions
Additional comments -
Data/parameter: TDBLP,B
Unit Km
Description Average trip distance travelled by passengers using conventional baseline buses prior to the project start
Source of data Metrobús, 2009
Value(s) applied) 6.9
Choice of data or measurement methods and procedures
Based on survey (OD and trip surveys).
Purpose of data Calculation of baseline emissions
Additional comments -

CDM-MR-FORM
Version 05.1 Page 19 of 49
Data/parameter: DDB
Unit Km
Description Total distance driven by all buses
Source of data Secretaría del Medio Ambiente del GDF, 2008
Value(s) applied) 9,116 million
Choice of data or measurement methods and procedures
Based on number of large buses and average daily distance driven per unit and 365 days per annum.
Purpose of data Calculation of baseline emissions
Additional comments Average distance per day driven of conventional baseline buses is: 24,994,338 Km/day.
Data/parameter: DDL
Unit Km
Description Total distance driven by large baseline buses (per annum)
Source of data Secretaría del Medio Ambiente del GDF, 2008, Table 4.3.10 p.106
Value(s) applied) 3,582 million
Choice of data or measurement methods and procedures
Based on number of large buses and average daily distance driven per unit and 365 days per annum.
Purpose of data Calculation of baseline emissions
Additional comments Average daily distance of 226 km per bus is based on: - 223 km per day on Sundays - 241 km/day on other days Number of large buses: 43,513
Data/parameter: DDM
Unit Km
Description Total distance driven of medium baseline buses (per annum)
Source of data Secretaría del Medio Ambiente del GDF, 2008, Table 4.3.10 p.106
Value(s) applied) 2,632 million
Choice of data or measurement methods and procedures
Based on number of medium buses and average daily distance driven per unit and 365 days per annum.
Purpose of data Calculation of baseline emissions
Additional comments Average daily distance are 200 km Number of medium buses: 36,056
Data/parameter: DDS
Unit Km
Description Total distance driven of small baseline buses (per annum)
Source of data Secretaría del Medio Ambiente del GDF, 2008, Table 4.3.10 p.106
Value(s) applied) 2,901 million
Choice of data or measurement methods and procedures
Based on number of medium buses and average daily distance driven per unit and 365 days per annum.
Purpose of data Calculation of baseline emissions
Additional comments Average daily distance are 200 km Number of small buses: 39,746

CDM-MR-FORM
Version 05.1 Page 20 of 49
Data/parameter: ADB
Unit Km / bus
Description Average annual distance driven of baseline buses
Source of data Secretaría del Medio Ambiente del GDF, 2008
Value(s) applied) 76,403
Choice of data or measurement methods and procedures
Based on average daily distance per sub-category of bus and number of units per sub-category and 365 days per annum.
Purpose of data Calculation of leakage emissions
Additional comments -
Data/parameter: ADT
Unit Km / taxi
Description Total distance driven of taxis
Source of data Secretaría del Medio Ambiente del GDF, 2008
Value(s) applied) 73,000
Choice of data or measurement methods and procedures
Data from Secretaría del Medio Ambiente represent the most reliable information available.
Purpose of data Calculation of leakage emissions
Additional comments Used for leakage load factor change taxis if calculation is required
Data/parameter: NIZC/T,BL
Unit Vehicles
Description Number of cars/taxis on roads affected per annum in the baseline
Source of data Metrobús and Planeación y Vías Terrestres S.A. de C.V., 2007
Value(s) applied) Number of vehicles Baseline on Affected Roads (per annum, tsd)
Affected Roads Number of cars Number of taxis
Insurgentes 11,912,908 2,463,704
Guerrero 11,977,320 3,201,214
Coyoacán 5,880,527 1,430,183
Av. Revolución 5,979,802 1,511,153
Choice of data or measurement methods and procedures
Visual counting on the identified roads. Exact locations of monitoring are defined for each affected road. Based on expansion factor of 330 days per year.
Purpose of data Calculation of leakage emissions
Additional comments -

CDM-MR-FORM
Version 05.1 Page 21 of 49
Data/parameter: VB
Unit Km / h
Description Average total speed and average speed under circulation is measured
Source of data Metrobus and Planeación y Vías Terrestres S.A. de C.V., 2007
Value(s) applied)
Average total speed of vehicles baseline on affected roads (km/h)
Affected Roads Speed
Insurgentes 23
Guerrero 27
Coyoacán 20
Av. Revolución 23
Moving speed of vehicles baseline on affected roads (km/h)
Affected Roads Speed
Insurgentes 32
Guerrero 38
Coyoacán 33
Av. Revolución 36
Choice of data or measurement methods and procedures
On-board measurements determining the average speed when circulating.
Purpose of data Calculation of leakage emissions
Additional comments The average total speed (time/distance) is measured. If the baseline average total speed is higher than the project total speed no rebound effect is calculated based on ACM0016 p. 17. The average moving speed is
measured as this is required for vehicle speed change.
Data/parameter: Ni
Unit Vehicles
Description Number of vehicles of category i
Source of data Secretaría del Medio Ambiente del GDF, 2008
Value(s) applied)
Vehicle Type Gasoline Diesel LPG CNG Electric
Passenger cars
3,389,697 1,879 4,209 15
100% 0% 0% 0%
Taxis 154,953 144 29
100% 0% 0% 0%
Motorcycles 180,701
100%
Small buses 39,128 62 553 3
99% 0% 1% 0%
Medium buses 19,902 118 15,678 358
56% 0% 43% 1%
Large buses 2,196 40,791 121 0 405
5% 94% 0% 0% 1%
Choice of data or measurement methods and procedures
Data from Secretaría del Medio Ambiente represent the most reliable information available.
Purpose of data Calculation of baseline emissions
Additional comments Official statistics

CDM-MR-FORM
Version 05.1 Page 22 of 49
Data/parameter: RSBL, RSPJ
Unit Km
Description Total distance driven of medium baseline buses (per annum)
Source of data Secretaría del Medio Ambiente del GDF, 2008, Table 4.3.10 p.106
Value(s) applied) 76.4 km – 4 lanes of 19.1 each one. The road space available in the baseline and the project is the same
Choice of data or measurement methods and procedures
Data from Secretaría del Medio Ambiente represent the most reliable information available.
Purpose of data Calculation of leakage emissions
Additional comments The baseline has 6 lanes (three lanes in each direction), of which 2 lanes were used as parking space. The project has 6 lanes (three lanes in each direction), of which 2 lanes are being used for the project’s buses. More specifically, in the project scenario the two parking lanes have been replaced by metrobus’ lanes.
Data/parameter: TDB, TDT, TDC
Unit Km
Description Total distance driven by buses (B), taxis (T) and personal cars (C) in the baseline
Source of data TDB and TDC – File 3a – SENES “Medidas de Linea Base para el Corredor de Insurgentes”, Ciudad de Mexico, 2006. TDT – File 1a – Secretaria de Medio Ambiente del GDF: Inventario de Emisiones 2006-2008
Value(s) applied) TDB = 215 km TDT = 200 km TDC = 40 km
Choice of data or measurement methods and procedures
Data from Secretaría del Medio Ambiente represent the most reliable information available.
Purpose of data Calculation of leakage emissions
Additional comments

CDM-MR-FORM
Version 05.1 Page 23 of 49
D.2. Data and parameters monitored
Data/parameter: NCVx,y
Unit J/kg in year y
Description Net calorific value of fuel x being specifically gasoline (G), diesel (D) and LPG (LPG)
Measured/calculated/default Default
Source of data IPCC 2006, table 1.2
Value(s) of monitored parameter
Gasoline Diesel LPG
NCV (J/kg) 42,500,000 41,400,000 44,800,000
Monitoring equipment -
Measuring/reading/recording frequency:
Annual
Calculation method (if applicable):
No national value; IPCC default value lower 95% confidence interval
QA/QC procedures: Any future revision of the IPCC Guidelines will be taken into account.
Purpose of data: Calculation of baseline and project emissions
Additional comments: -
Data/parameter: EFCO2,x,y
Unit gCO2/J
Description CO2 emission factor for fuel type x in the year y being specifically gasoline (G), diesel (D) and LPG (LPG)
Measured/calculated/default Default
Source of data IPCC 2006, table 1.4
Value(s) of monitored parameter
Gasoline Diesel LPG
EFCO2,x,y (gCO2/J) 67,500,000 72,600,000 61,600,000
Monitoring equipment -
Measuring/reading/recording frequency:
Annual
Calculation method (if applicable):
Any future revision of the IPCC Guidelines is taken into account.
QA/QC procedures: Any future revision of the IPCC Guidelines will be taken into account.
Purpose of data: Calculation of baseline and project emissions
Additional comments: -

CDM-MR-FORM
Version 05.1 Page 24 of 49
Data/parameter: PY
Unit Passengers
Description Total passengers transported by the project activity transport system
Measured/calculated/default Measured
Source of data Metrobús (Reparto Ingresos)
Value(s) of monitored parameter
103,520,136
Monitoring equipment -
Measuring/reading/recording frequency:
Continuously, aggregated at least annually, the measured period is from 1/11/2013 to 31/10/2014
Calculation method (if applicable):
Turnpike controls at stations. Daily operators at each station take note of the number in the turnpike counter. These numbers are recorded in a data sheet. Only those customers who exit Metrobus in those stations which belong to the project activity (i.e. Insurgentes) are taking into account for the calculation of the total passengers transported by the project activity.
QA/QC procedures: Total number of passengers will be cross-checked with data from the turnpike electronic system. This electronic system is the method of charging the ride fare to the users (i.e.: the ticket revenue). This information is compiled by a third party contractor and provided to Metrobus within 48 hours.
Purpose of data: Calculation of baseline and project emissions
Additional comments: -

CDM-MR-FORM
Version 05.1 Page 25 of 49
Data/parameter: FCPJ,x
Unit Liters
Description Total fuel of type x consumed by the project transport units
Measured/calculated/default Measured
Source of data Metrobus and concessionaries. Metrobus is responsible of collecting and consolidating the data on the fuel consumed by the project buses, based on the logbooks provided by the concessionaries.
Value(s) of monitored parameter
9,584,527
Monitoring equipment -
Measuring/reading/recording frequency:
Continuously, aggregated at least annually The measured period is from 1/11/2013 to 31/10/2014
Calculation method (if applicable):
Logbooks provided by the concessionaires
QA/QC procedures: Control with previous years as well as with SFC of comparable buses (articulated and bi-articulated diesel buses). “Normal” or average data range is based on previous experience per bus type. It indicates ranges and does not mean that data from buses falling outside this range is necessarily wrong. If the specific fuel consumption is outside normal ranges, the
following measures are to be taken:
Control the distance: Is the data correct and reasonable?
Control the fuel consumption;
Is the specific consumption too high or too low: Compare the data with the previous months. Have any previous values fallen outside the range? The SFC values were initially estimated for articulated buses between 64 and 78 l/100km, and for bi-articulated buses between 72 and 88 l/100km. As per the PDD (see page 134), if fuel efficiency (l/100 km) falls outside of this initial range and is 10% greater or less than fuel efficiency from the previously reported year, then at least one of the following comparisons may be made: (a) Comparison of fuel consumption against fuel purchase invoices; or (b) Evaluation of vehicle-kilometres traveled data.
These comparisons were not required for this monitoring period, since all values were within the normal range. If differences cannot be explained then:
o Check documentary filling controls (data transmission and storage);
o Check distance measurement controls (data transmission and storage)
These comparisons were not required for this monitoring period, since all values were within the normal range.
Purpose of data: Calculation of project emissions
Additional comments: The SFC for the articulated buses is higher than for the bi-articulated because biarticulated buses are newer, bigger in size and also because drivers of biarticulated buses have been trained to drive more efficiently, so less fuel is consumed.

CDM-MR-FORM
Version 05.1 Page 26 of 49
Data/parameter: DDPJ,x, y
Unit Km
Description Distance driven by project units using fuel type x in year y
Measured/calculated/default Measured
Source of data Metrobus and concessionaires. Metrobus is responsible of collecting and consolidating the data on the fuel consumed by the project buses, based on the logbooks provided by the concessionaries..
Value(s) of monitored parameter
9,307,847 for articulated buses and 1,851,685.40 for biarticulated buses. The measured period is from 1/11/2013 to 31/10/201.
Monitoring equipment -
Measuring/reading/recording frequency:
Continuously, aggregated at least annually The measured period is from 1/11/2013 to 31/10/2014
Calculation method (if applicable):
Based on number of turnovers per day and trip distance
QA/QC procedures: Control with logbooks with information on kms driven taken by Metrobus every 15 days.. Used for QA of fuel consumption through SFC.
Purpose of data: Calculation of project emissions
Additional comments: -
Data/parameter: SFCi,x,y
Unit l / 100 km
Description Specific fuel consumption of vehicle category I (BRT buses) using fuel x in the year y
Measured/calculated/default Calculated
Source of data Metrobús
Value(s) of monitored parameter
Articulated units: 86.92 Bi-articulated Units: 88.95 All Diesel Units It should be noted that, as the bus fleet evolved, Metrobus periodically update these SFCi,x,y values based on actual data. As per the PDD the SFC range for articulated buses is 64-78 l/100km, while for bi-articulated is 72-88 l/100km. For this MR the SFC values has been updated to 88.33 l/100 km y 77.81 l/100 km respectively
Monitoring equipment -
Measuring/reading/recording frequency:
Continuously, aggregated at least annually The measured period is 1/11/2013 to 31/10/2014
Calculation method (if applicable):
Total fuel / total kilometres * 100
QA/QC procedures: SFC is not based on samples but on total data. Control with previous payment made to operators based on distance driven. Check with annual distance driven. Used for QA of fuel consumption through SFC. See parameter FCPJ,x for more information on QA controls. The SFC values were initially estimated for articulated buses between 64 and 78 l/100km, and for bi-articulated buses between 72 and 88 l/100km. As per the PDD (see page 134), if fuel efficiency (l/100 km) falls outside of this initial range and is 10% greater or less than fuel efficiency from the previously reported year, then at least one of the following comparisons may be made: (a) Comparison of fuel consumption against fuel purchase invoices; or (b) Evaluation of vehicle-kilometers traveled data.
Purpose of data: Data not required for ER calculations
Additional comments: Data not required for ER calculations as FC is available.

CDM-MR-FORM
Version 05.1 Page 27 of 49
Data/parameter: MSi,y
Unit Percentage
Description Net share of passengers using the BRT which would have used baseline mode i (%) in the year y
Measured/calculated/default Calculated
Source of data Survey realized by external survey company (RP&A Creatividad mercadológica) in June 2013.
Value(s) of monitored parameter
Data is based on a survey realized on Metrobus BRT lines (see CER spreadsheet). For projections the same value has been taken:
Passenger car: 5%
Taxi: 30%
Motorcycle: 0.5%
Bus: 138%
NMT: 123%
Rail based system: 8%
Other including BRT lanes: 0% The total is more than 100% as passengers can use various modes in the baseline from their trip origin to their trip destination and can also use more than 1 bus.
Monitoring equipment -
Measuring/reading/recording frequency:
Monitoring of this parameter is not required by ACM0016 version 3, since the project does not lead to a reduction of road capacity available for individual motorized transport modes.
Calculation method (if applicable):
Survey
QA/QC procedures: N/A
Purpose of data: Data not required for ER calculations
Additional comments: Data not required for ER calculations

CDM-MR-FORM
Version 05.1 Page 28 of 49
Data/parameter: NB/T,y
Unit Buses, taxis
Description Number of buses and taxis
Measured/calculated/default Default
Source of data Secretary of Environment, 2010
Value(s) of monitored parameter
124,435 buses 200,769 taxis
Monitoring equipment -
Measuring/reading/recording frequency:
Years 1, 4, 7 and 10 of the crediting period
Calculation method (if applicable):
None as no change in occupation rate of taxis and buses is previewed. This assumption is based on practical experience in Transmilenio Bogota which had no change of occupation rates of baseline buses or taxis. See verification report TransMilenio 2009 (published on www.unfccc.int).
QA/QC procedures: -
Purpose of data: Calculation of leakage emissions, only if a change of occupation rate is registered.
Additional comments: The data is only required for calculations of leakage if a change of occupation rate is registered. This parameter is only recorded in cases where the occupancy rate of buses and taxis is lower than in the baseline (in the case of buses, if the occupancy rate is reduced by 10 percentage points higher than the rate of occupation of the baseline, and in the case of taxis if less than baseline occupancy rate). See PDD Appendix 4 Section A.3 for further details regarding occupancy level calculation for conditions under which this parameter is required. In summary, this parameter is only required when: bus occupancy rate is less than 6.6% (occupancy rate for the baseline is 17%) and/or taxi occupancy rate is less than 0.66 passengers per vehicle (taxi occupancy rates do not include the driver).
Data/parameter: OCB/T,y
Unit % for Buses Passengers for taxis
Description Average occupancy rate of buses and taxis in the year y
Measured/calculated/default Occupancy rate of taxis: Measured
Occupancy rate of buses: Calculated
Source of data Occupancy rate of taxis: Study realized by a third party.
Occupancy rate of buses: Calculations conducted by metrobus based on official data from the Secretary of Environment.
Value(s) of monitored parameter
12.03% for buses and 0.78 for taxis
Monitoring equipment -
Measuring/reading/recording frequency:
Years 1, 4, 7 and 10 of the crediting period
Calculation method (if applicable):
Occupancy rate of taxis: Visual studies based on Annex 3 of the methodology and PDD Appendix 4 Section A.5.1
Occupancy rate of buses: Calculated based on official data from the Secretary of Environment following the guidelines provided in Annex 2 of the methodology. Also, as per the PDD Appendix 4 Section A.6.2.
o
QA/QC procedures: For the occupancy rate of taxis, coverage of the occupation counts should be higher than 95% of the number of taxis that cross the checkpoint.
Purpose of data: Calculation of leakage emissions
Additional comments: -

CDM-MR-FORM
Version 05.1 Page 29 of 49
Data/parameter: NIZC/T, y
Unit Vehicles
Description Number of cars/taxis using affected roads
Measured/calculated/default Measured
Source of data Survey realized by a third party
Value(s) of monitored parameter
-
Monitoring equipment -
Measuring/reading/recording frequency:
Monitoring of this parameter is not required by ACM0016 version 3, since the project does not lead to a reduction of road capacity available for individual motorized transport modes.
Calculation method (if applicable):
No projections as no change of total average speed is expected, thus monitoring of this parameter is not required.
QA/QC procedures: N/A
Purpose of data: Data not required for ER calculations
Additional comments: Data not required for ER calculations
Data/parameter: TDIZi,y
Unit Km
Description Distance driven by vehicle category i in the year y which refers to taxis (T) and passenger cars (C) on affected roads
Measured/calculated/default Measured
Source of data Survey realized by a third party
Value(s) of monitored parameter
-
Monitoring equipment -
Measuring/reading/recording frequency:
Monitoring of this parameter is not required by ACM0016 version 3, since the project does not lead to a reduction of road capacity available for individual motorized transport modes.
Calculation method (if applicable):
No projections as no moving speed change is expected, thus monitoring of this parameter is not required.
QA/QC procedures: N/A
Purpose of data: Data not required for ER calculations
Additional comments: Data not required for ER calculations

CDM-MR-FORM
Version 05.1 Page 30 of 49
Data/parameter: VP, y
Unit Km/h
Description Average speed of cars and taxis on affected roads including total average speed and average moving speed
Measured/calculated/default Measured
Source of data Survey realized by a third party
Value(s) of monitored parameter
-
Monitoring equipment -
Measuring/reading/recording frequency:
Monitoring of this parameter is not required by ACM0016 version 3, since the project does not lead to a reduction of road capacity available for individual motorised transport modes.
Calculation method (if applicable):
Same moving as well as average speed as under baseline is expected, thus monitoring of this parameter is not required.
QA/QC procedures: N/A
Purpose of data: Data not required for ER calculations
Additional comments: Data not required for ER calculations
Data/parameter: BTDp,i, y
Unit Km
Description Baseline trip distance of the cluster p of surveyed passengers using mode i in the year y
Measured/calculated/default Measured
Source of data Survey realized by a third party
Value(s) of monitored parameter
See ER spreadsheet
Monitoring equipment N/A
Measuring/reading/recording frequency:
The survey is realized in the years 1 and 4 of the crediting period. The change in the monitoring frequency of this parameter, from annually to years 1 and 4 of the crediting period, has been done in accordance to version 3 of ACM0016, and approved in the latest version of the PDD, dated 31/05/2014.
Calculation method (if applicable):
Emissions are calculated per passenger and then expanded to the total passengers transported based on the expansion factor per passenger
QA/QC procedures: See Section D.3 of this report for more information regarding the design of the survey sample.
Purpose of data: Calculation of baseline emissions
Additional comments: -

CDM-MR-FORM
Version 05.1 Page 31 of 49
Data/parameter: IPTDp,i, y
Unit Km
Description Indirect project trip distance of the surveyed passenger using mode i in the year y
Measured/calculated/default Measured
Source of data Survey realized by a third party. Based on the survey asking the modes of transit used and the trip distances from trip origin to entry station of the BRT and from exit station of the BRT to trip destination.
Value(s) of monitored parameter
See ER spreadsheet
Monitoring equipment N/A
Measuring/reading/recording frequency:
The survey is realized in the years 1 and 4 of the crediting period.
Calculation method (if applicable):
Emissions are calculated per passenger and then expanded to the total passengers transported based on the expansion factor per passenger.
QA/QC procedures: See Section D.3 of this report for more information regarding the design of the survey sample.
Purpose of data: Calculation of project emissions
Additional comments: The change in the monitoring frequency of this parameter, from annually to years 1 and 4 of the crediting period, has been done in accordance to version 3 of ACM0016, and approved in version 5 of the PDD, dated 31/05/2014.
D.3. Implementation of sampling plan
>> For the estimation of the indirect project emissions and baseline emissions, a passenger survey was conducted by a third party (i.e. RP&A) in November 2012 (first semester of the first reporting year). A re-test survey was performed in June 2013 (second semester of the first reporting year) in order to identify if there is seasonability. Survey results have been provided to the DOE. The general characteristics of the survey are shown in the following table:
Parameter Main parameters:
Baseline emissions;
Indirect project emissions. Secondary parameters and inputs:
Proportion of passengers proportion using each mode of transport, with the project and in absence of the project;
The average distance travelled by these modes with the project and in absence of the project.
Target Population Passengers over 12 years using the BRT
Sample Frame Passenger flow in all the stations of the BRT
Sample design Two staged probabilistic design:
First Stage: stratified – simple random sampling (SRS)
Second stage: systematic sampling based on passengers flow per station
Stratum: Stations Sub stratum: Days in the week and hours
Relative error For the survey a global desired level of precision (relative standard

CDM-MR-FORM
Version 05.1 Page 32 of 49
level (CV) error or coefficient of variation – CV) between 5% and 10% for the parameters of interest, which implies at the same time having precision levels of 90/10 is targeted. Results obtained are based on a 95% confidence level using the more conservative boundary.
Coverage Urban area where the BRT operates that are 36 stations of the Insurgentes Corridor
Size of Universe In total there are an average of 335,649 passengers daily throughout the Insurgentes corridor (the daily passengers as per the PDD is 300,000, however this figure has been updated to 335,640 to reflect the actual value).
Sample Size In general, the determination of the sample size is made by simulating, following the Särndal methodology (1992) in which a CV is fixed and the size of the sample is found by solving the formula of the variance estimator according to the design used in each case. The specific sample of each station is shown below, considering the representativeness of each season based on their influx of passengers:
* The project involves a total of 36 stations. Please note that Buenavista I and II are considered one station, but have been divided in two for Metrobus internal reporting reasons.
This stratified random sampling was performed with proportional allocation according to the number of passengers per day. For sample, as suggested in the PDD (6000 passengers interviewed), the result of average daily passengers by station was divided between the average daily passengers carried for the period, and then multiplied by the 6000 suggested passengers interviewed, as shown

CDM-MR-FORM
Version 05.1 Page 33 of 49
below:
N=6000 (suggested sample) Indios verdes= (27,411/335,649)*6000 =490 The 335,649 daily passengers in Insurgentes corridor are divided by the sample size, which is 6000. The result is 56, and this number means that every 56th passenger will be interviewed on average.
Where: n = population N = Sample k = # interviewed passengers The number of passengers interviewed per station were distributed proportionally by day based on passenger flow according to the day of the week counting from Monday to Sunday, and according to the following percentages:
Sample per day Monday Tuesday Wednesday Thursday Friday Saturday Sunday
17% 17% 17% 17% 18% 9% 5%
The sample was distributed for each day according to the average passenger flow per hour, considering peak hours and low influx hours:

CDM-MR-FORM
Version 05.1 Page 34 of 49
Hour % Passengers
05:00 1.31%
06:00 4.13%
07:00 6.98%
08:00 8.28%
09:00 6.17%
10:00 5.12%
11:00 4.99%
12:00 5.24%
13:00 5.99%
14:00 6.56%
15:00 6.68%
16:00 5.74%
17:00 6.12%
18:00 7.92%
19:00 6.72%
20:00 5.11%
21:00 3.96%
22:00 2.11%
23:00 0.85%
Total 100%* *The total % of passengers sum up 99.98% instead of 100%. The 0.02% difference is mainly due to rounding of the figures.
Pilot Test The 1st test was realized in November 2012 (first semester of the first reporting year) during one week on a continuous base. The sample size was 6000 users of the BRT Line Insurgentes. The sample was distributed in accordance with the daily passenger flow per station. The 2nd test was realized in June 2013 (second semester of the first reporting year) during one week on a continuous base. The sample size was 2,722 users of the BRT Line Insurgentes (less than half of the initial survey as required by methodology, Annex 4, Section 7). The sample was distributed in accordance with the daily passenger flow per station. Fisher method was used for the statistical analysis of the sample size for the two surveys. The method confirmed that the sample size meet the 95% confidence level and 5% maximum error.
Sample frequency Once in years 1 and 4 of the crediting period during an entire week plus a re-test survey realize in the year 1 only.
Method of information collection
Face to face interviews with users older than 12 years were conducted in 36 of the 47 stations of the Insurgentes Corridor, in the span of a week. In these terminals the interviewer applied the survey to a passenger with an average time of 5 minutes. The information was gathered between 05:00 hours and 23:30 hours, in order to cover the times of this transport. Interviewers conducted the surveys right before passengers board into the buses. Thus the origin station of the passenger was determined, and well as the various means to get to the station.
As per the methodology ACM0016 v2, the following criteria for identifying if there has been or not seasonality has been applied:

CDM-MR-FORM
Version 05.1 Page 35 of 49
1. A test of mean comparison between the data reported on the flow of passenger for the two surveys
Travel distance in Metrobus
Survey 1 Survey 2
Sample size (n) 6,000 2,722
∑X 36,547.69 15,689.91
∑X2 346,508.00 141,406.73
Media 6.09 5.76
S 4.5443 4.3280
S2 20.6511 18.7315
SC 123,885.6690 50,968.3991
a) Fisher method is applied to compare the sample variances between both surveys.
S2 Major (Fcal) =
18.73149543 = 0.90704794
S2 minor 20.65105335
Freedom degrees major = 5999 F table = 1.055576754 Freedom degrees minor = 2721 α =
0.05
If Fcal < F table, Ho is acepted
If P > 0.05 Ho is acepted
Ho: sample variances are equal
Ho: S2survey 1= S2survey 2
0.907047942 <= 1.0556
Then, Ho is accepted, sample variances are equal in both surveys
b) T student method is applied to compare the variance on the trip travel distance.
= 20.05
= 3.161618772
α = 0.05
Freedom degrees = 8720
t table= = 1.960236071
If t cal < t table Ho is accepted
Ho: The average trip travel distance is equal in both surveys

CDM-MR-FORM
Version 05.1 Page 36 of 49
3.161618772 > 1.9602 Then, Ho is rejected
The average trip travel distance is different in both surveys
2. A test consisting in the application of a times series model SARIMA, where it is estimated if
there is any seasonality degree in the passenger flows.
fe = (marginal row) (marginal column)
(total number of subjects)
x2 = Σ
( fo - fe )2 = 2007.91
fe
freedom degrees
= (rows-1) (columns -1) = 6
Ho = There are not significant difference in both surveys If calculated Xi2< table Xi2, Ho is accepted
In tables Xi 2, with α =.05 and 6 freedom degrees is 12.592
Survey 1 Survey 2
Pax would have used car 548 134
Pax would have used taxi 1,172 812
Pax would have used bus 4,044 3,751
Pax would have used motorcycle 43 13
Pax would have gone by foot 8,010 3,343
Pax would not have made trip 192 81
Pax would have used rail 3,064 225
Total 17,073 8,359
Survey 1 Survey 2
Pax would have used car 458 224
Pax would have used taxi 1,332 652
Pax would have used bus 5,233 2,562
Pax would have used motorcycle 38 18
Pax would have gone by foot 7,621 3,732
Pax would not have made trip 183 90
Pax would have used rail 2,208 1,081
Survey 1 Survey 2
Pax would have used car 17.75 36
Pax would have used taxi 19 39
Pax would have used bus 270 552
Pax would have used motorcycle 1 2
Pax would have gone by foot 20 40
Pax would not have made trip 0 1
Pax would have used rail 332 678
Xi2 Survey number
Use
rs t
hat
use
eac
h
mo
de
of
tran
spo
rtObserved Data (fo)
Expected Data (fe)Survey number
Use
rs t
hat
use
eac
h
mo
de
of
tran
spo
rt
Survey NumberU
sers
th
at u
se e
ach
mo
de
of
tran
spo
rt

CDM-MR-FORM
Version 05.1 Page 37 of 49
As calculated Xi2 2007.91 > table Xi 2 (12.592) - Ho is rejected
There is seasonality between both surveys. As per methodology ACM0016 v2, Annex 4 Section 7, if there is evidence of seasonality, within each period where there are apparent differences (i.e. November and June), independent surveys are performed and at the end, the results are compared regarding the emissions difference and the parameters on the use of modes of transport and the average travel distance. Given that model SARIMA has probe that there is seasonability, results from the survey conducted in the first year and the re-test were compared, and the project participant found out that there were apparent differences in the emissions reductions achieved. Therefore, and in order to be conservative, results from the second survey were used for the estimation of the ERs achieved during this period. Also, as per methodology ACM0016 v2, Annex 4 Section 7, if there are significant differences between the analysis periods, the measurements of later years (i.e. year 4) will be carried out in the periods in which seasonality is identified (i.e. November and June). Therefore, in year 4 two surveys should be conducted.
SECTION E. Calculation of emission reductions or GHG removals by sinks
E.1. Calculation of baseline emissions or baseline net GHG removals by sinks
>> Baseline emissions are calculated per passenger surveyed. For each passenger surveyed the individual baseline emissions are calculated and multiplied with the individual expansion factor thus getting the baseline emissions of all passengers of the specific week surveyed. These are multiplied with the total of the passengers of the period to arrive at baseline emissions. The steps that were taken into account were:
1. A survey was conducted, following the procedures presented in the PDD Annex 3, in which for each surveyed passenger, the trip distance per transport mode that would have taken place in the baseline is determined.
2. The individual baseline emissions were calculated for each surveyed passenger. 3. An individual expansion factor was applied to each surveyed passenger in accordance with
the survey sample design (as defined in Annex 3), and summarize these to get the total baseline emissions of the period (week) surveyed. To get the annual (or monitoring period) baseline emissions the baseline emissions of the surveyed period (week) are calculated per passenger of the period (week) and multiplied with the total passengers transported per year (or monitoring period).
4. Was taken the lower limit of the 95% confidence interval as total baseline emissions. PROCEDURE
Parameter Description
BEy Baseline emissions in the year y (t CO2)
BEp,y Baseline emissions per surveyed passenger p in the year y (g CO2)
FEXp,y Expansion factor for each surveyed passenger p surveyed in the year y (each

CDM-MR-FORM
Version 05.1 Page 38 of 49
surveyed passenger has a different expansion factor)
Py Total number of passengers in the year y
PSPER Number of passengers in the time period of the survey (1 week)
p Surveyed passenger
y Year of the crediting period
The baseline emission per surveyed passenger is calculated based on the mode used, the trip distance per mode and the emission factor per mode:
Parameter Description
BEp,y Baseline emissions per surveyed passenger p in the year y (t CO2)
BTDp,i,y Baseline trip distance p per surveyed passenger using mode i in the year y (PKM)
EFPKM,i,y Emission factor per passenger-kilometer of mode i in the year y (g CO2/PKM)
i Relevant vehicle category
p Surveyed passenger (each individual)
y Year of the crediting period
The baseline is a continuation of the current transport system consisting of various transport modes between which the population chooses:
NMT (Non-Motorized Traffic) with bikes and per foot;
Private passenger car;
Taxis;
Motorcycles;
Buses differentiating between the sub-categories of large, medium and small buses.
Metro and LTR are not included as their baseline emissions are taken as 0 (conservative approach).
DETERMINATION OF THE EMISSION FACTOR PER PASSENGER-KILOMETER (EFPKM,i,y) Passenger-kilometer (PKM) is defined as the average passenger trip distance multiplied by the number of passengers. The emission factors per PKM are determined ex ante for each vehicle category. Any change in the occupancy rate of taxis and buses influencing the corresponding emission factors is monitored as leakage. For electricity-based vehicle categories, the following equation should be used:
Parameter Description
EFPKM,i,y Emission factor per passenger-kilometer of mode i in the year y (g CO2/PKM)
TEEL,i,y Total emissions from the electricity-based vehicle category i for year y (tCO2)
PEL,i,y Total passengers transported per year by the electricity-based vehicle category i for year y (passengers)
TDEL,i Average trip distance travelled by passengers using the electricity-based vehicle category i prior to project start (km)
The total emissions from the electricity-based vehicle category i, TEEL,i,y, should be calculated, for each vehicle category i, using the .Tool to calculate baseline, project and/or leakage emissions from electricity consumption.. When applying the tool, the parameter ECBL,k,y in the tool should be

CDM-MR-FORM
Version 05.1 Page 39 of 49
taken as the amount of electricity used by the electricity-based vehicle category i for year y, consistent with the transportation of PEL,i,y passengers along the average distance TDEL,i. For electric trolleybuses of the baseline the following formula is taken:
Parameter Description
TEEL,TB,y Baseline emissions from electricity consumption of trolleybuses in the year y (tCO2)
ECBL,TB,y Quantity of electricity consumed by baseline trolleybuses in the year y (MWh)
EFEL,y Emission factor for electricity generation in the grid in the year y (tCO2/MWh)
TDLY Average technical transmission and distribution losses for providing electricity in year y
The emission factor per PKM for fuel-based transport systems (e.g. road-based vehicles) for fuel-based vehicle categories, should be calculated as:
Parameter Description
EFPKM,i,y Emission factor per passenger-kilometer of vehicle category i in the year y (g CO2/PKM)
EFKM,i,y Emission factor per kilometer of vehicle category i in the year y (g CO2/km)
OCi Average occupation rate of vehicle category i prior project start (passengers)
i Relevant vehicle category
y Year of the crediting period
The average occupation rate of vehicle category i (OCi) is determined based on visual occupation studies. In the case of taxis, the driver is not included. For buses, as an alternative, the occupation rate can be determinate using the following equation:
Parameter Description
OCB Average occupation rate of buses prior project start (passengers)
PBLB Passengers transported by baseline buses prior project (passengers)
TDBLP,B Average trip distance of passengers using baseline bus (kilometer)
DDB Distance driven by all baseline buses (kilometer)
Relevant fuel types, for each vehicle category, have to be identified. The emission factor per kilometer is re-calculated annually based on the recorded share of fuels per category. In case bio-fuel blends are used the bio-fuel share of the blend is accounted for with zero emission factor (EFCO2,x,y). If various sub-categories of buses exist (e.g. small, medium, large units) the emission factor is calculated for each bus sub-category, and after aggregated as explained further below. The emission factor per kilometer is not constant but annually updated. Two options can be used to calculate EFKM,i,y. For each vehicle category the project can choose which option to take. During the crediting period the project cannot change between one and the other option, i.e. the decision is fixed for the crediting period. The project chooses for all vehicles an annual technology improvement factor as given by the methodology due to the difficulty in obtaining specific fuel

CDM-MR-FORM
Version 05.1 Page 40 of 49
consumption values (option 2 of the methodology). Formula (6) of the methodology is thus not used. For option (2) i.e. all vehicle categories the following formula applies:
Parameter Description
EFKM,i,y Emission factor per kilometer of vehicle category i in the year y (g CO2/km)
SFCx,i Specific fuel consumption of vehicle category i using fuel type x prior project start (g/km)
NCVx,y Net calorific value of fuel x in the year y (J/g)
EFCO2,x,y Carbon emission factor for fuel type x in the year y (g CO2/J)
Nx,i Number of vehicles of category i using fuel type x prior to project start (units)
Ni Number of vehicles of category i prior to project start (units)
IRit+y Technology improvement factor for the vehicle of category i per year t+y (ratio)
i Relevant vehicle category
x Fuel type
t Years of annual improvement (dependent on age of data per vehicle category)
y Year of crediting period
The technology improvement factor (IR) is taken from the methodology and is the same 0.99, for all the vehicles types: buses, passenger cars, taxis and motorcycles. As various sub-categories of buses exist (small, medium, and large units), the emission factor for each sub-category (EFKM,L,y EFKM,M,y EFKMS,y) is calculated using the equation:
Parameter Description
EFKM,B,y Emission factor per kilometer of buses (g CO2/km)
EFKM,L/M/S,y Emission factor per kilometer of buses sub – category L (large buses), M (medium buses) and S (small buses)(gCO2/km)
DDL/M/S Total distance driven of buses sub-category L (large buses), M (medium sized buses) and S (small buses) prior project start (kilometer)
Y Year of crediting period
RESULTS As presented in the first verification report, the values of emission factor per kilometre for each of the modes for year 1 (November 2012 to October 2013) was: EFKM,Passanger car,1 = 163.39 gCO2eq/KM EFKM,Taxi,1 = 216.50 gCO2eq/KM EFKM,Motorcycle,1 = 58.32 gCO2eq/KM EFKM,Conventional Bus,1 = 1,109.18 gCO2eq/KM In order to obtain the values for year 2 (November 2013 to October 2014), following option 2 of the methodology, we directly apply the annual technology improvement of 0.99. EFKM,Passanger car,2 = 0.99 x 163.39 gCO2eq/KM = 162.05 gCO2eq/KM EFKM,Taxi,2 = 0.99 x 216.50 gCO2eq/KM = 214.33 gCO2eq/KM EFKM,Motorcycle,2 = 0.99 x 58.32 gCO2eq/KM = 57.73 gCO2eq/KM EFKM,Conventional Bus,2 = 0.99 x 1,109.18 gCO2eq/KM = 1,098.09 gCO2eq/KM

CDM-MR-FORM
Version 05.1 Page 41 of 49
The emission factors were divided between the average occupation rate of each vehicle category to obtain the emission factors per passenger-kilometer per vehicle category: EFPKM,Passanger car,2 = 163.39 gCO2eq/KM / 1.48 Passengers = 109.49 gCO2eq/PKM EFPKM,Taxi,2 = 216.50 gCO2eq/KM / 0.66 Passengers = 324.75 gCO2eq/PKM EFPKM,Motorcycle,2 = 58.32 gCO2eq/KM / 1.16 Passengers = 49.77 gCO2eq/PKM EFPKM,Conventional Bus,2 = 1,109.18 gCO2eq/KM/ 9.00 Passengers = 125.38 gCO2eq/PKM This emission factors per passenger-kilometer per vehicle category, were multiplied by the baseline trip distance (p) per surveyed passenger using mode i in the year y, obtained through the passenger survey. As per the registered PDD, survey data for year 1 is also used for year 2 for these baseline calculations. The data obtained was the baseline emissions per surveyed passenger, which was multiplied by their respective expansion factor, yielding an average emission factor (grCO2/passenger). Finally, just multiply this final data by the number of passengers who were in the period to obtain the total baseline emissions:
Parameter Value
Number of passengers in the period (passengers) 103,520,136
Average baseline emission factor (grCO2/passenger) 1,153
Total baseline emissions tCO2 119,314
E.2. Calculation of project emissions or actual net GHG removals by sinks
>> Project emissions are based on the fuel consumed by the BRT buses (direct project emissions) plus emissions caused by project passengers from their trip origin to the entry station of the BRT and from the exit station of the BRT to their final destination (indirect project emissions). Project emissions are calculated as follows:
Parameter Description
PEy Project emissions in the year y (tCO2)
DPEy Direct emissions in the year y (tCO2)
IPEy Indirect Project emissions in the year y (tCO2)
For the determination of the direct project emissions the project involves fossil fuel usage, and the following formula is used, in line with the “Tool to calculate project or leakage CO2 emissions from fossil fuel combustion”:
Parameter Description
PEFCj,y Are the CO2 emission from fossil fuel combustion in process j during the year y (tCO2/yr)
FCi,j,y Quantity of fuel type i combusted in process j during the year y (mass or volume unit/yr)
COEFi,y CO2 emission coefficient of fuel type i in year y (tCO2/mass or volume unit)
I fuel types combusted in process j during the year y
As per the guidance from the methodology, parameter PEFC,j,y in the tool corresponds to the direct project emissions from the project transport system that uses fossil fuels in year y (DPEy); and element process j corresponds to the combustion of fuel type x in the project vehicles.
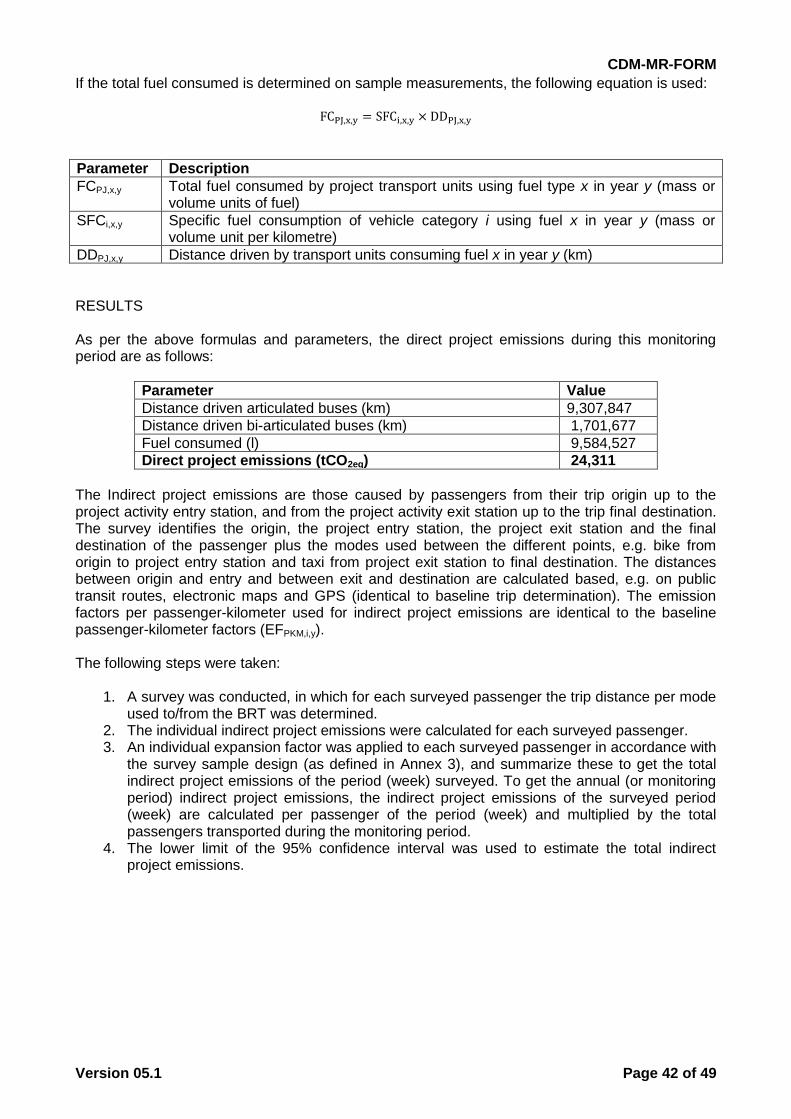
CDM-MR-FORM
Version 05.1 Page 42 of 49
If the total fuel consumed is determined on sample measurements, the following equation is used:
Parameter Description
FCPJ,x,y Total fuel consumed by project transport units using fuel type x in year y (mass or volume units of fuel)
SFCi,x,y Specific fuel consumption of vehicle category i using fuel x in year y (mass or volume unit per kilometre)
DDPJ,x,y Distance driven by transport units consuming fuel x in year y (km)
RESULTS As per the above formulas and parameters, the direct project emissions during this monitoring period are as follows:
Parameter Value
Distance driven articulated buses (km) 9,307,847
Distance driven bi-articulated buses (km) 1,701,677
Fuel consumed (l) 9,584,527
Direct project emissions (tCO2eq) 24,311
The Indirect project emissions are those caused by passengers from their trip origin up to the project activity entry station, and from the project activity exit station up to the trip final destination. The survey identifies the origin, the project entry station, the project exit station and the final destination of the passenger plus the modes used between the different points, e.g. bike from origin to project entry station and taxi from project exit station to final destination. The distances between origin and entry and between exit and destination are calculated based, e.g. on public transit routes, electronic maps and GPS (identical to baseline trip determination). The emission factors per passenger-kilometer used for indirect project emissions are identical to the baseline passenger-kilometer factors (EFPKM,i,y). The following steps were taken:
1. A survey was conducted, in which for each surveyed passenger the trip distance per mode used to/from the BRT was determined.
2. The individual indirect project emissions were calculated for each surveyed passenger. 3. An individual expansion factor was applied to each surveyed passenger in accordance with
the survey sample design (as defined in Annex 3), and summarize these to get the total indirect project emissions of the period (week) surveyed. To get the annual (or monitoring period) indirect project emissions, the indirect project emissions of the surveyed period (week) are calculated per passenger of the period (week) and multiplied by the total passengers transported during the monitoring period.
4. The lower limit of the 95% confidence interval was used to estimate the total indirect project emissions.

CDM-MR-FORM
Version 05.1 Page 43 of 49
PROCEDURE
Parameter Description
IPEy: Indirect project emissions in the year y (tCO2)
IPEp,y Indirect project emissions per surveyed passenger p in the year y (g CO2)
FEXp,y Expansion factor for each surveyed passenger p surveyed in the year y (each surveyed passenger has a different expansion factor)
Py Total number of passengers in the year y
PSPER Number of passengers in the time period of the survey (1 week)
p Surveyed passenger
y Year of the crediting period
The indirect project emission per surveyed passenger is calculated based on the mode used, the trip distance per mode and the emission factor per mode:
Parameter Description
IPEp,y Indirect project emissions per surveyed passenger p in the year y (g CO2)
IPTDp,i,y Indirect project trip distance p per surveyed passenger using mode i in the year y (PKM)
EFPKM,i,y Emission factor per passenger-kilometer of mode i in the year y (gCO2/PKM)
I Relevant vehicle category
P Surveyed passenger
THE RESULTS Based on the surveyed passenger and the survey design, the corresponding expansion factors are applied to calculate total indirect project emissions. Total indirect project emissions are determined based on the upper limit of the 95% confidence interval as results are based on a sample/survey. The same method of expansion factors is used as outlined in the baseline section. Indirect project emissions are only included for the project passengers. Passengers transported are based on passengers entering BRT stations. As per the formulas and parameters above, the following emission factors per kilometre were obtained:
Transport Mode EFKM,i,y (g CO2/km)
Passenger car 162.05
Taxi 214.33
Motorcycle 57.33
Conventional Bus 1,098.09
The emission factors were divided between the average occupation rate of vehicle category to obtain the emission factors per passenger-kilometer per vehicle category:
Transport Mode EFKM,i,y (g CO2/PKM)
Passenger car 109.49
Taxi 324.75
Motorcycle 49.77
Conventional Bus 125.38

CDM-MR-FORM
Version 05.1 Page 44 of 49
This emission factors per passenger-kilometer and vehicle category, were multiplied by the indirect project trip distance (p) per surveyed passenger using mode i in the year y, obtained through the passenger survey. The data obtained was the indirect project emissions per surveyed passenger, which was multiplied by their respective expansion factor, yielding an average emission factor (grCO2/passenger). Finally, just multiply this final data by the number of passengers in the reporting period to obtain the total indirect project emissions:
Parameter Value
Number of passengers in the period (passengers) 103,520,136
Average indirect project emissions per passenger (grCO2/passenger)
555
Total indirect project emissions tCO2 57,486
E.3. Calculation of leakage
>> Leakage emissions include the following sources:
Emissions due to changes of the load factor of taxis and buses of the baseline transport system due to the project (LELFB,y and LELFT,y)
Emissions due to reduced congestion on affected roads, provoking higher average vehicle speed, plus a rebound effect (LECON,y)
Upstream Emissions of Gaseous Fuels (LEUP,y) Leakage emissions are calculated as follows:
Parameter Description
LEy: Leakage emissions in the year y (tCO2)
LELFB,y Leakage emissions due to change of load factor buses in the year y (tCO2)
LELFT,y Leakage emissions due to change of load factor taxis in the year y (tCO2)
LECON,y Leakage emissions due to reduced congestion in the year y (tCO2).
LEUP,y Leakage emission due to upstream emission of gaseous fuel in year y (tCO2)
If LEy < 0, then leakage is not included If LEy > 0, then leakage is included The project could have a negative impact on the load factor of the conventional bus fleet. Load factor changes are monitored for the entire city as the potential impact is not necessarily in the proximity of the project BRT (buses can be used in other parts of the city). The load factor of buses is monitored in the years 1, 4 and 7 of the crediting period. Leakage from load factor change of buses is only included if the load factor of buses has decreased by more than 10 percentage points comparing the monitored value with the baseline value, and are calculated as:
Parameter Description
LELFB,y Leakage emissions due to change of load factor of buses in the year y (tCO2)
NB,y: Number of baseline buses in the year y (buses)
ADB Average annual distance driven by baseline buses (km/bus)
EFKM,B,y Emission factor per kilometer for baseline buses in the year y (gCO2/km)
OCB,y Average occupancy rate of baseline buses in the year y (passengers)
OCB Average occupancy rate of baseline buses prior to the project start (passengers)

CDM-MR-FORM
Version 05.1 Page 45 of 49
The project could have a negative impact on the load factor of taxis. Load factor changes are monitored for the entire city as taxis operate all over the city and are not confined to deliver their services in certain areas. The load factor of taxis is monitored in the years 1, and 4 of the crediting period. This leakage is calculated as follows:
Parameter Description
LELFT,y Leakage emissions due to change of load factor of taxis in the year y (tCO2)
NT,y: Number of taxis in the year y (taxis)
ADT Average annual distance driven per taxi (km/taxi)
EFKM,T,y Emission factor per kilometer of taxis in the year y (gCO2/km)
OCT,y Average occupancy rate of taxis in year y (passengers)
OCT Average occupancy rate of taxis prior to the project start (passengers)
The maximum load factor change attributed to taxis is the emission reductions due to passengers switching from taxis to the project (calculated by the emission factor per passenger-kilometer for taxis, the trip distance and the number of passengers transported by the project, which would have used taxis in absence of the project). This maximum condition is established as load factors might worsen citywide also due to factors external to the project and leakage from a load factor change taxis due to the project can at maximum be according to the number of passengers transported by the project which in absence of latter would have taken a taxi. The occupancy rate of taxis is monitored through visual occupation studies counting the number of passengers (see PDD Annex 3). The parameter emission factor per kilometer of baseline taxis in the year y (EFKM,T,y) is calculated using the equation for EFKM,i,y presented in the baseline emissions section, substituting i for T (taxis). For the determination of emissions due reduced congestion (LECON,y), no moving speed change is expected since the project does not lead to a reduction of road capacity available for individual motorised transport modes, thus monitoring of this parameter is not required, Upstream of gaseous fuels (LEUP,y) shall be only included if the project vehicles consume more gaseous fuels than baseline vehicles. Since the project vehicles consume diesel, which a liquid fuel, upstream emissions from gaseous fuels are not considered. RESULTS Following the formulas and parameters the following values of leakage emissions were calculated: The resulting average occupancy rate of baseline buses in the monitoring period is 17% and the average occupancy rate of baseline buses prior to the project start is 12.03%. Since this rate does not decrease more than 10 percent, leakage emissions due to changing load factor baseline buses are not calculated.
Parameter Value
Leakage emissions due to changing load factor baseline buses 0
Leakage emissions due to changing load factor taxis -566,224
Leakage emissions (tCO2eq) 0

CDM-MR-FORM
Version 05.1 Page 46 of 49
E.4. Summary of calculation of emission reductions or net GHG removals by sinks
Item
Baseline emissions
or baseline net GHG removals by sinks (t CO2e)
Project emissions or actual net GHG removals by sinks (t CO2e)
Leakage (t CO2e)
GHG emission reductions or net GHG removals by sinks
(t CO2e) achieved in the monitoring period
Up to 31/12/2012
From 01/01/2013
Total amount
Total 119,314 81,797 0 0 37,517 37,517
E.5. Comparison of actual emission reductions or net GHG removals by sinks with estimates in registered PDD
Item Values estimated in ex ante calculation
of registered PDD Actual values achieved during this
monitoring period
Emission reductions or GHG removals by sinks (t CO2e)
46,810* 37,517
*46,810 tCO2eq = (47,087/365)*61 tCO2eq in 2013 + (46,755/365)*304 tCO2eq in 2014
E.6. Remarks on difference from estimated value in registered PDD
>> Not applicable as the actual value is below the PDD value.

CDM-MR-FORM
Version 05.1 Page 47 of 49
Appendix 1. Contact information of project participants and responsible persons/entities
Project participant and/or responsible person/ entity
Project participant
Person/entity responsible for completing the CDM-MR-FORM
Organization name Metrobús
Street/P.O. Box Av. Cuauhtémoc N. 16, 5 piso, Col. Doctores, Deleg. Cuauhtémoc
Building
City Mexico
State/region Distrito Federal
Postcode 06720
Country Mexico
Telephone (5255)-57-61-69-38
Fax
E-mail [email protected]
Website www.metrobus.df.gob.mx
Contact person Guillermo Calderón Aguilera
Title General Director
Salutation Mr.
Last name Calderón Aguilera
Middle name
First name Guillermo
Department Dirección General
Mobile (5255)5530431674
Direct fax (5255)-5761-69-38
Direct tel. (5255)-5761-69-38
Personal e-mail [email protected]
CDM-MR-FORM
Version 05.1 Page 48 of 49
Project participant and/or responsible person/ entity
Project participant
Person/entity responsible for completing the CDM-MR-FORM
Organization name International Bank for Reconstruction and Development (IBRD) as Trustee of the Spanish Carbon Fund (SCF)
Street/P.O. Box 1818 H Street, NW
Building
City Washington
State/region District of Columbia
Postcode 20433
Country United States of America
Telephone +1 202 458 1873
Fax +1 202 522 7432
E-mail [email protected]
Website www.carbonfinance.org
Contact person Jose Andreu
Title Mr
Salutation
Last name Andreu
Middle name
First name Jose
Department Climate and Carbon Finance Unit
Mobile
Direct fax
Direct tel.
Personal e-mail

CDM-MR-FORM
Version 05.1 Page 49 of 49
- - - - -
Document information
Version Date Description
05.1 4 May 2015 Editorial revision to correct version numbering.
05.0 1 April 2015 Revisions to:
Include provisions related to delayed submission of a monitoring plan;
Provisions related to the Host Party;
Remove reference to programme of activities;
Overall editorial improvement.
04.0 25 June 2014 Revisions to:
Include the Attachment: Instructions for filling out the monitoring report form (these instructions supersede the "Guideline: Completing the monitoring report form" (Version 04.0));
Include provisions related to standardized baselines;
Add contact information on a responsible person(s)/ entity(ies) for completing the CDM-MR-FORM in A.6 and Appendix 1;
Change the reference number from F-CDM-MR to CDM-MR-
FORM;
Editorial improvement.
03.2 5 November 2013 Editorial revision to correct table in page 1.
03.1 2 January 2013 Editorial revision to correct table in section E.5.
03.0 3 December 2012 Revision required to introduce a provision on reporting actual emission reductions or net GHG removals by sinks for the period up to 31 December 2012 and the period from 1 January 2013 onwards (EB70, Annex 11).
02.0 13 March 2012 Revision required to ensure consistency with the "Guidelines for completing the monitoring report form" (EB 66, Annex 20).
01 28 May 2010 EB 54, Annex 34. Initial adoption.
Decision Class: Regulatory Document Type: Form Business Function: Issuance Keywords: monitoring report