Embed Size (px)
Citation preview

EY Pay Perspective2015 Executive and Board Remuneration Report

1 EY Pay Perspective 2015 Executive and Board Remuneration Report |
EY is pleased to present the EY Pay Perspective: 2015 Executive and Board Remuneration Report, now in its 12th edition.
During 2014, executives and non-executive directors spoke with us about the key challenges affecting their companies. Three common themes emerged:
• ►Drivingcompanyperformanceinachallenging market environment
• ►Optimisingoperationalefficiency
• ►Embeddingriskmanagementincompany culture
During the year we worked collaboratively with our clients, shaping remuneration programs to support the business in addressing these challenges. Ourreportdiscusseshowweseeeachofthese challenges impact executive remuneration practices. While we have not seen large-scale changes from traditional approaches to executive remuneration, subtle deviations are emergingascompaniesrefinetheirremuneration strategies to suit their business.
In the short term, we see the following opportunities for companies around executive remuneration:
• ►Analysingthedistributionofshort-term incentive (STI) payments to executives and considering whether thedistributioncouldbetterreflecteach individuals’ contribution to performance
• ►ReviewingwhattheSTIprogramisintended to achieve and how this interacts with the performance management approach
• ►Aligningthetimewhenexecutivescanreceive incentive payments (i.e. cash or vested equity) to the company’s business timelines
• ►Managingremunerationandensuringthe best return on investment for the remuneration spend
• ►Differentandinnovativeapproaches to reward which, while different to traditional models, may be better aligned to the company’s needs
Ouranalysiscontinuestobesupported by EY’s Board and Executive RemunerationDatabase—themostcomprehensive and reliable tool of its typeinAustralia.1
Wetrustthatyouwillfindthereportinsightful and look forward to working with you in 2015.
1 The data in this report is based on the remuneration quantum and policy released on 31 December 2014 for the 100 largest listed companiesinAustraliaasat1December2014.
Executive summary

2 | EY Pay Perspective 2015 Executive and Board Remuneration Report
Remunerationenvironment 3
Future executive remuneration opportunities 6
2014 executive remuneration practices and challenges 9
Non-executive director fees 18
Contents

3 EY Pay Perspective 2015 Executive and Board Remuneration Report |
Remuneration environment
33 EY Pay Perspective 2015 Executive and Board Remuneration Report |
4 | EY Pay Perspective 2015 Executive and Board Remuneration Report
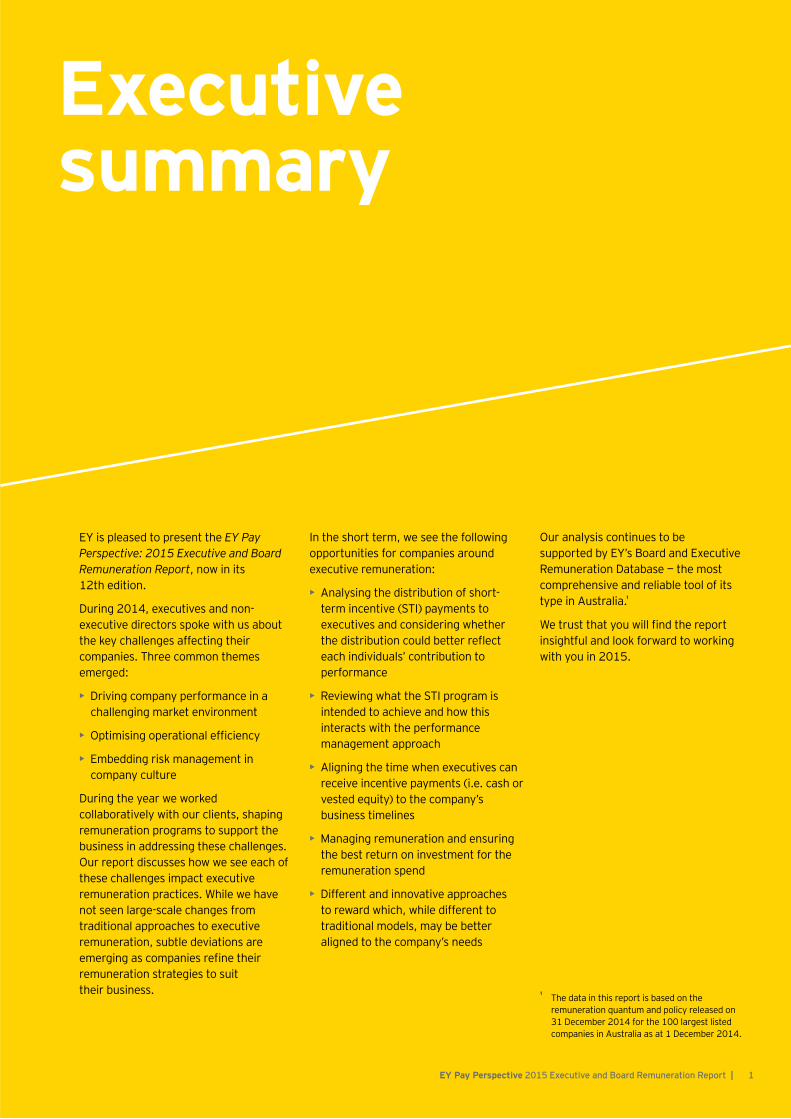
Effective executive remuneration design requires companies and individuals to navigate a complex field of economic, regulatory, organisational, talent and shareholder influences. Those with most impact recently, which we expect will continue, were the challenging economic environment and strength of shareholder influence.
Optimising company performance andproductivity in a challenging market
Market confidence increasingaround mergers and acquisitions
Executiveremuneration
Regulatory environmentremains relevant
Shareholder and proxy advisor group influence remains strong
Talent
With cost constraint now the status quo, focus on revenue growth, efficiency and productivity gains are back on the agenda for many companies. We expect this focus to continue in 2015, with companies reviewing their remuneration strategy to ensure alignment to changing business strategy.
Infrastructure announcements and asset sales are being impacted by political uncertainty.Global interest in Australian listed companies may escalate if local share prices fall and if investors consider that companies are trading below their potential value. Companies likely to be the subject of takeover speculation are reviewing their existing entitlements and retention arrangements.
Financial services reform continues with focus on appropriate risk management, particularly effective risk culture. Risk management practices in remuneration continue to flow through to multiple industries.Proposed changes to the taxation of employee share schemes are not expected to significantly change plan design in large organisations.
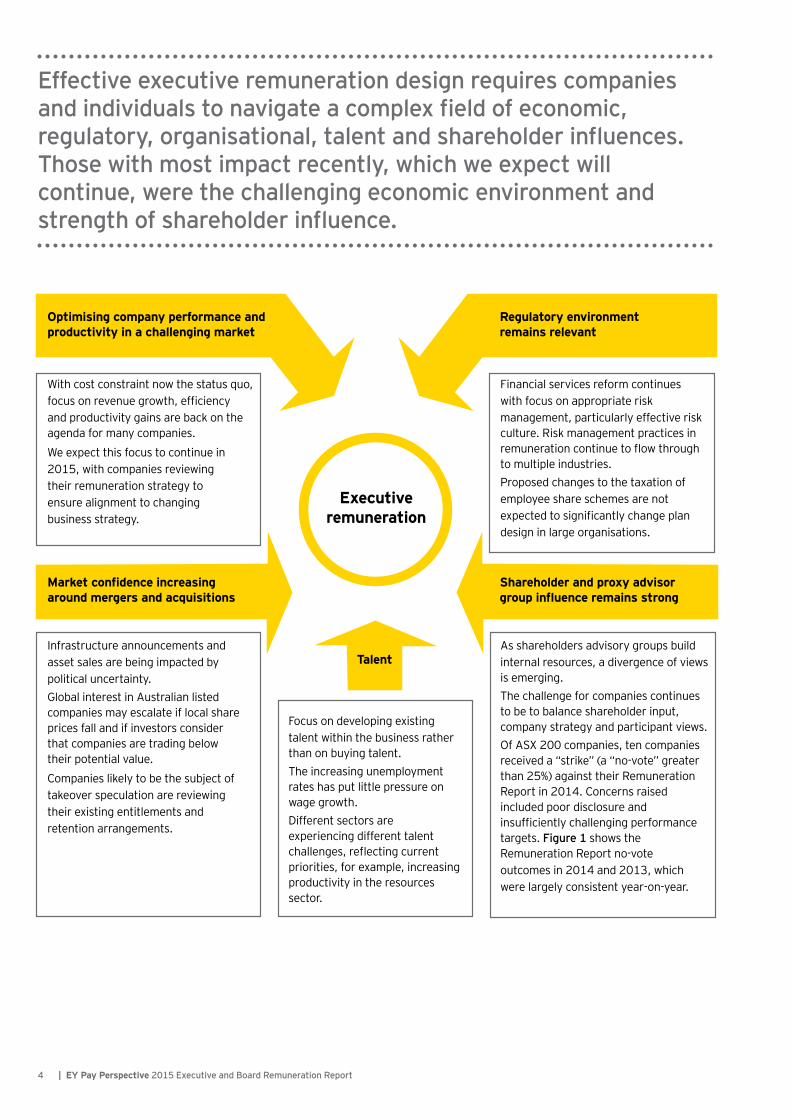
As shareholders advisory groups build internal resources, a divergence of views is emerging. The challenge for companies continues to be to balance shareholder input, company strategy and participant views. Of ASX 200 companies, ten companies received a “strike” (a “no-vote” greater than 25%) against their Remuneration Report in 2014. Concerns raised included poor disclosure and insufficiently challenging performance targets. Figure 1 shows the Remuneration Report no-vote outcomes in 2014 and 2013, which were largely consistent year-on-year.
Focus on developing existing talent within the business rather than on buying talent.The increasing unemployment rates has put little pressure on wage growth. Different sectors are experiencing different talent challenges, reflecting current priorities, for example, increasing productivity in the resources sector.
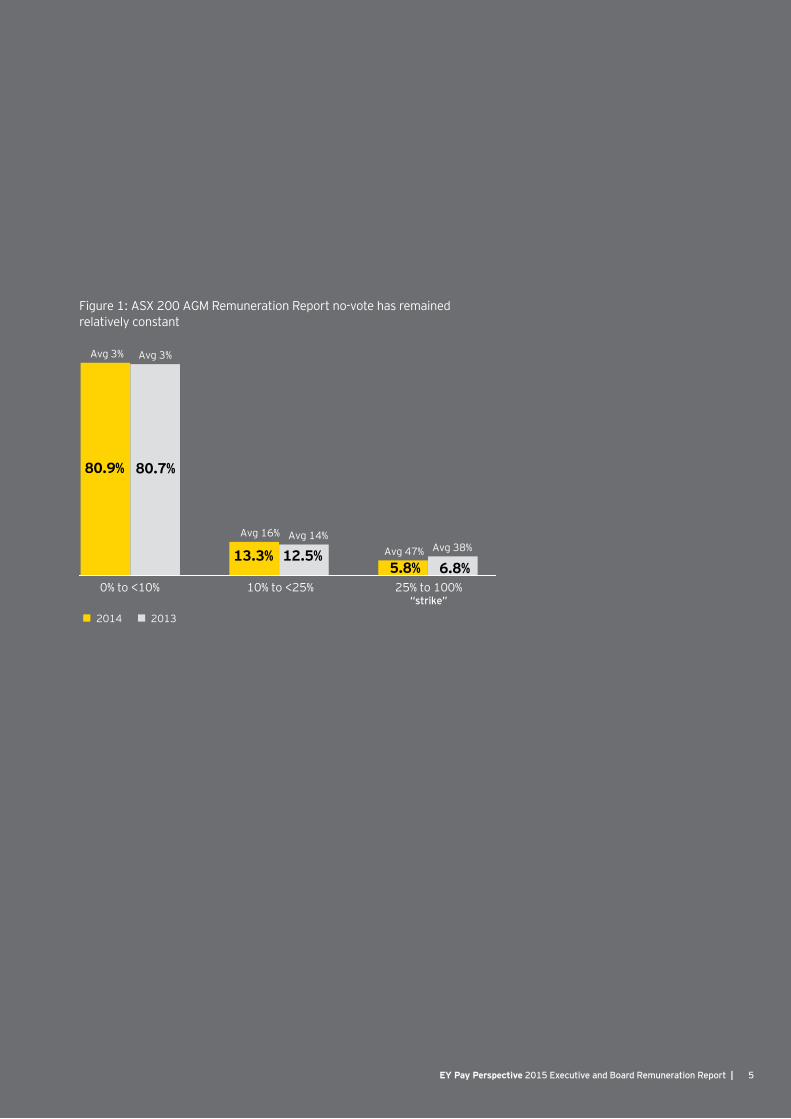
Figure1:ASX200AGMRemunerationReportno-votehasremained relatively constant
80.9%
13.3% 12.5%5.8%
80.7%
6.8%0% to <10% 10% to <25% 25% to 100%
“strike”
2014 2013
Avg 3% Avg 3%
Avg 16% Avg 14%Avg 47% Avg 38%
5 EY Pay Perspective 2015 Executive and Board Remuneration Report |

6 | EY Pay Perspective 2015 Executive and Board Remuneration Report
Future executive remuneration opportunities
Companies will continue to refine remuneration strategies as they consider alternative approaches to incentive structures, compete for talent and manage risks.
7 EY Pay Perspective 2015 Executive and Board Remuneration Report |
We see executive remuneration opportunities in 2015 and beyond to be:
• STI structures: In our view, there are two key opportunities for companies torefinetheirSTIprograms:
• Analysingthedistributionofexecutive STI payments and considering whether the distribution couldreflectbettereachindividuals’contribution to performance.
• Reviewingwhatperformanceandbehaviours the STI is meant to achieve and how it interacts with the performance management process. In some companies, the number of measures within STI scorecards has increased, meaning that each measure has less impact on payments. STIs are more effective where there is a clear understanding of both the key performance requiredtofulfilaspecificroleandthe performance required to generate payments.
• Reward timing: SincetheGlobalFinancial Crisis, executives have had to wait longer to receive reward payments. This time reduced in 2014 and we expect it will continue to shorten2. Key changes driving this movement are:
• Companies will continue to review the alignment between payments andtheirbusinesstimelines.Asthishappens, we expect to see more companies shortening the period from the award to the measurement, and payment of incentives.
• In previous years, a small number ofcompaniesmovedtofiveyearincentiveprograms.Outsidetheresources industry, companies have now moved away from this timeline. Inourview,thefiveyearprogramswere not valued by executives working in rapidly changing businesses where they may not beintheirroleforfiveyears.Equally,companies are struggling to set realistic targets for this longer period.
2 We have been tracking the weighted average time ittakesforremunerationtobereceivedbyCEOsintheTop100companies.Forexample,ifaCEOreceivesatargetpackageconsistingof30%fixedremuneration, 30% cash STI and 40% LTI vesting after 4 years, the weighted average reward timing is: Fixed remuneration (30% x 0.5 years) + STI (30% x 1.0 years) + LTI (40% x 4.0 years) = 2.05 years.
• Performance and reward outcomes: The market continues to focus on disclosure of STI structures and the payments being made under them. Ourrecentresearchshowedapositivecorrelation between the amount of STI paid to executives and companies’ one yeartotalshareholderreturn(TSR)over three consecutive years.
AsSTIpaymentsarealmostalwaysdrivenbyprofitandnotTSR,thiscorrelation appears to be simply coincidental.
The opportunity for companies is to demonstrate the link between performance and payments effectively to key stakeholders.
Executive remuneration presents risks and opportunities for business leaders in 2015 and beyond.
8 | EY Pay Perspective 2015 Executive and Board Remuneration Report
• Long-term incentive (LTI) allocation methodology: The pressure from the market for companies to move from fair value to face value allocation methodswillcontinue.Giventhenumber and depth of discussions between companies and shareholders over recent years, it should be easier for those companies moving to a face value approach to explain how this will result in a higher perceived LTI without any change to grant practices. For those wishing to retain a fair value approach, discussions with shareholders will become harder as they will be in the minority group.
• Increasing return on investment: With the economy remaining subdued, companies need to ensure that they encourage behaviours that help maximise productivity, but in ways that maintain or even reduce cost. There remains a real need for companies to get a better return from their remuneration investment by taking a broader view of reward design and remuneration“worth”.Analyticdrivenapproaches can maximise perceived value as measured by the employees for the same or lower cost to the company.
We expect more companies to consider whether different and innovative models may help to achieve their objectives and reflect their business strategy more effectively
• Remuneration structures — evolution vs revolution: The traditional executive remunerationmodel(fixedremuneration with both short and long-term incentives) continues to be used by the majority (over 90%) of companies. Within this model, we will continue to see many companies making important adjustments to reflecttheneedsofthebusinessi.e.changes in performance measurement or reward delivery timelines, what performance is measured or how payments are delivered. We expect more companies to consider whether different and more innovative remuneration models may be more effective in achieving their objectives andreflectingthebusinessstrategy.

9 EY Pay Perspective 2015 Executive and Board Remuneration Report |
2014 executive remuneration practices and challenges
9 EY Pay Perspective 2015 Executive and Board Remuneration Report |
10 | EY Pay Perspective 2015 Executive and Board Remuneration Report
During 2014, executives and non-executive directors spoke with us about their key challenges. Three common themes emerged:
• Driving company performance in a challenging market environment
• Optimisingoperationalefficiency
• Embedding risk management in company culture
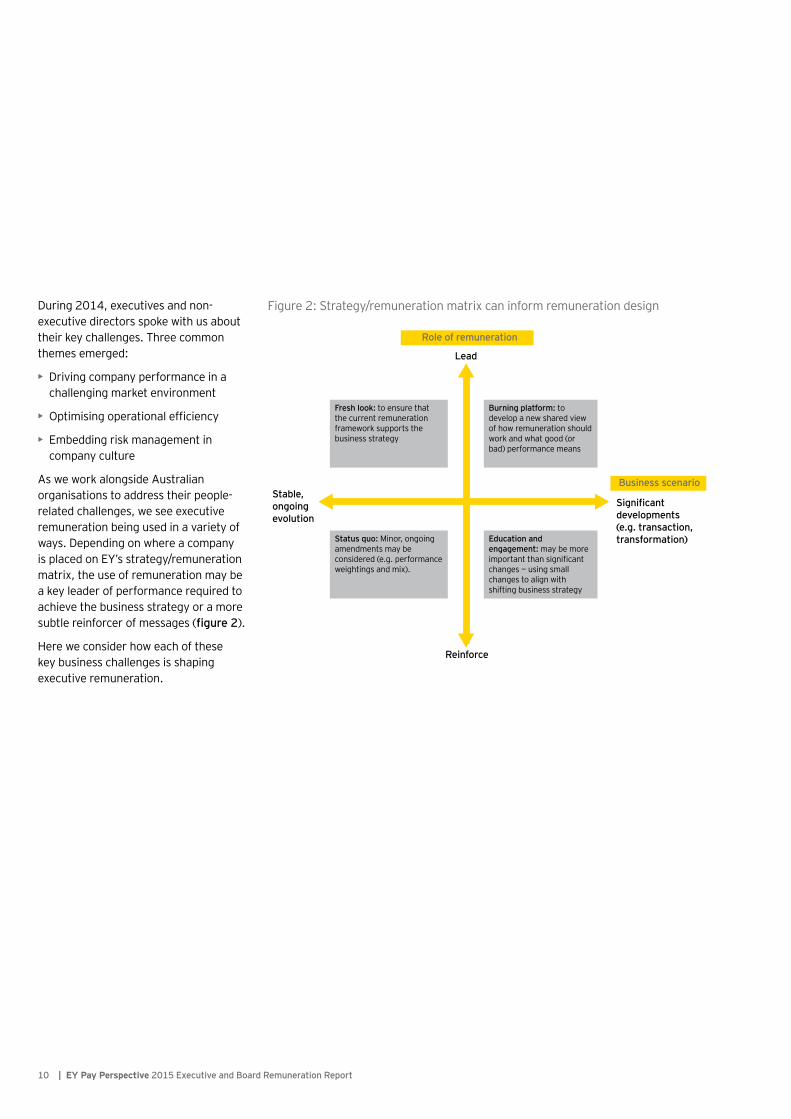
AsweworkalongsideAustralianorganisations to address their people-related challenges, we see executive remuneration being used in a variety of ways. Depending on where a company is placed on EY’s strategy/remuneration matrix, the use of remuneration may be a key leader of performance required to achieve the business strategy or a more subtle reinforcer of messages (figure 2).
Here we consider how each of these key business challenges is shaping executive remuneration.
Figure 2: Strategy/remuneration matrix can inform remuneration design
Role of remuneration
Business scenario
Lead
Significant developments(e.g. transaction,transformation)
Reinforce
Stable, ongoing evolution
Status quo: Minor, ongoing amendments may be considered (e.g. performance weightings and mix).
Education and engagement: may be more important than significant changes — using small changes to align with shifting business strategy
Fresh look: to ensure that the current remuneration framework supports the business strategy
Burning platform: to develop a new shared view of how remuneration should work and what good (or bad) performance means
11 EY Pay Perspective 2015 Executive and Board Remuneration Report |
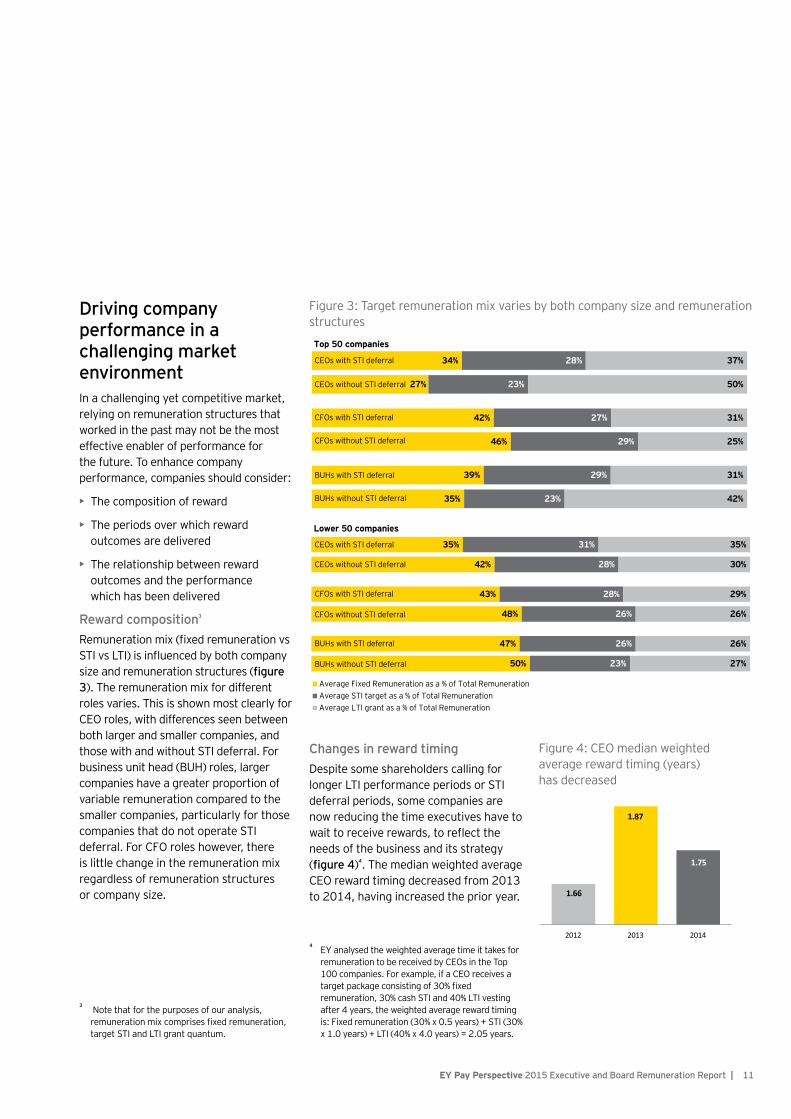
Changes in reward timing Despite some shareholders calling for longer LTI performance periods or STI deferral periods, some companies are now reducing the time executives have to waittoreceiverewards,toreflecttheneeds of the business and its strategy (figure 4)4. The median weighted average CEOrewardtimingdecreasedfrom2013to 2014, having increased the prior year.
4 EY analysed the weighted average time it takes for remunerationtobereceivedbyCEOsintheTop100companies.Forexample,ifaCEOreceivesatargetpackageconsistingof30%fixedremuneration, 30% cash STI and 40% LTI vesting after 4 years, the weighted average reward timing is: Fixed remuneration (30% x 0.5 years) + STI (30% x 1.0 years) + LTI (40% x 4.0 years) = 2.05 years.
Driving company performance in a challenging market environment In a challenging yet competitive market, relying on remuneration structures that worked in the past may not be the most effective enabler of performance for the future. To enhance company performance, companies should consider:
• The composition of reward
• The periods over which reward outcomes are delivered
• The relationship between reward outcomes and the performance which has been delivered
Reward composition3 Remunerationmix(fixedremunerationvsSTIvsLTI)isinfluencedbybothcompanysize and remuneration structures (figure 3). The remuneration mix for different roles varies. This is shown most clearly for CEOroles,withdifferencesseenbetweenboth larger and smaller companies, and those with and without STI deferral. For business unit head (BUH) roles, larger companies have a greater proportion of variable remuneration compared to the smaller companies, particularly for those companies that do not operate STI deferral.ForCFOroleshowever,there is little change in the remuneration mix regardless of remuneration structures or company size.
3 Note that for the purposes of our analysis, remunerationmixcomprisesfixedremuneration,target STI and LTI grant quantum.
Figure 3: Target remuneration mix varies by both company size and remuneration structures
Figure4:CEOmedianweightedaverage reward timing (years) has decreased
34%
27%
42%
46%
39%
35%
28%
23%
27%
29%
29%
23%
37%
50%
31%
25%
31%
42%
Top 50 companies
35%
42%
43%
48%
47%
50%
31%
28%
28%
26%
26%
23%
35%
30%
29%
26%
26%
27%
Lower 50 companies
Average Fixed Remuneration as a % of Total RemunerationAverage STI target as a % of Total RemunerationAverage LTI grant as a % of Total Remuneration
CEOs with STI deferral
CEOs without STI deferral
CFOs with STI deferral
CFOs without STI deferral
BUHs with STI deferral
BUHs without STI deferral
CEOs with STI deferral
CEOs without STI deferral
CFOs with STI deferral
CFOs without STI deferral
BUHs with STI deferral
BUHs without STI deferral
1.66
1.87
1.75
2012 2013 2014
12 | EY Pay Perspective 2015 Executive and Board Remuneration Report
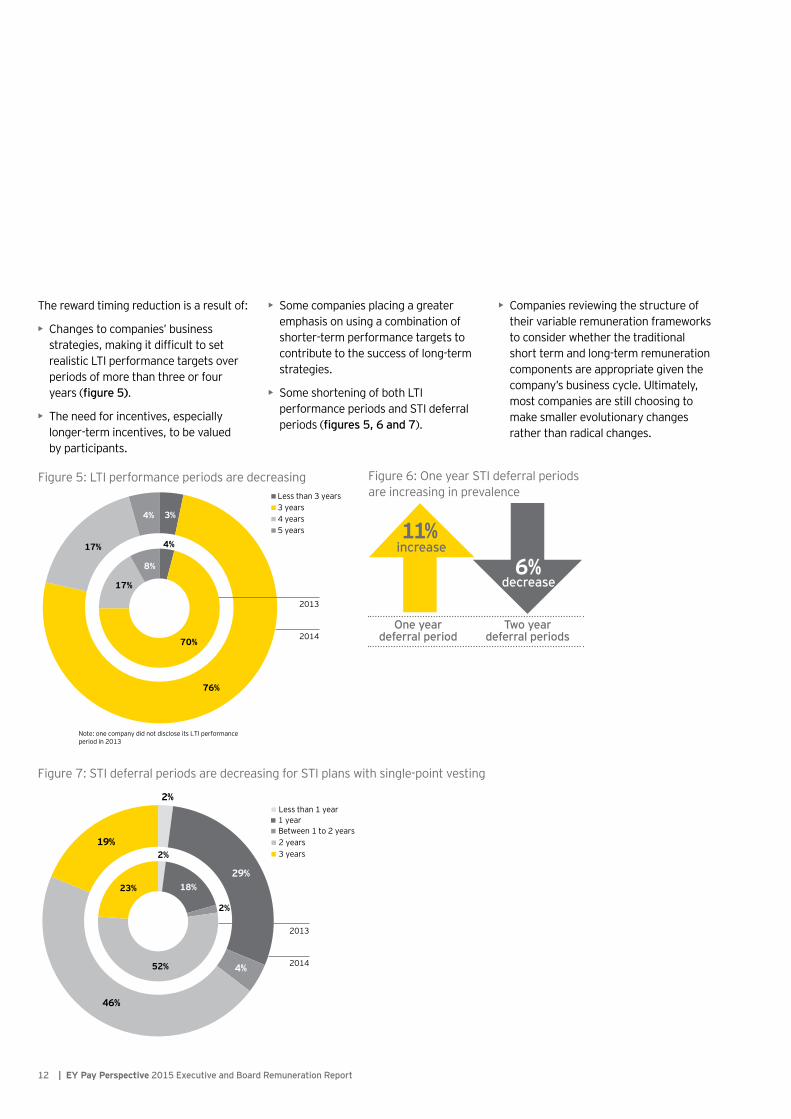
The reward timing reduction is a result of:
• Changes to companies’ business strategies,makingitdifficulttosetrealistic LTI performance targets over periods of more than three or four years (figure 5).
• The need for incentives, especially longer-term incentives, to be valued by participants.
• Some companies placing a greater emphasis on using a combination of shorter-term performance targets to contribute to the success of long-term strategies.
• Some shortening of both LTI performance periods and STI deferral periods (figures 5, 6 and 7).
• Companies reviewing the structure of their variable remuneration frameworks to consider whether the traditional short term and long-term remuneration components are appropriate given the company’s business cycle. Ultimately, most companies are still choosing to make smaller evolutionary changes rather than radical changes.
Figure 5: LTI performance periods are decreasing
Figure 7: STI deferral periods are decreasing for STI plans with single-point vesting
Less than 3 years3 years4 years5 years
2014
2013
Note: one company did not disclose its LTI performance period in 2013
3%
76%
17%
4%
4%
70%
17%
8%
2%
29%
4%
46%
19%
Less than 1 year1 yearBetween 1 to 2 years2 years3 years2%
18%
2%
52%
23%
2014
2013
Figure6:OneyearSTIdeferralperiods are increasing in prevalence
increase
decrease
One year deferral period
Two year deferral periods
13 EY Pay Perspective 2015 Executive and Board Remuneration Report |
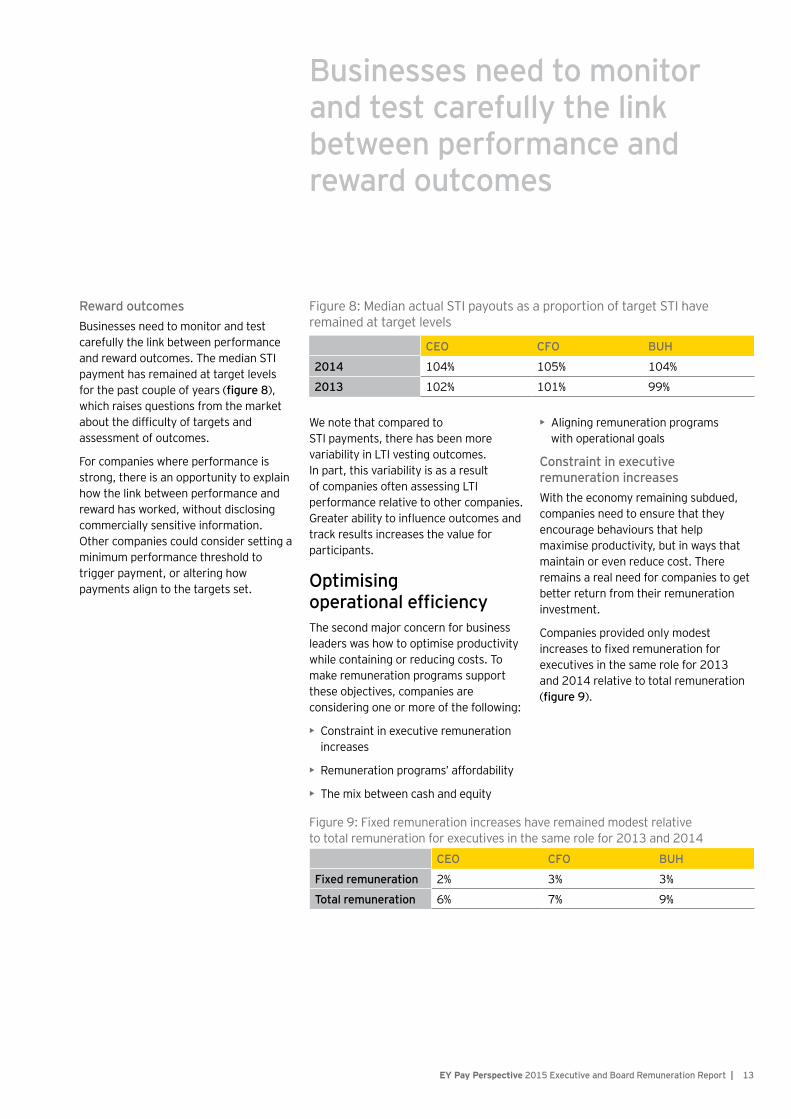
Figure8:MedianactualSTIpayoutsasaproportionoftargetSTIhaveremained at target levels
CEO CFO BUH
2014 104% 105% 104%
2013 102% 101% 99%
We note that compared to STI payments, there has been more variability in LTI vesting outcomes. In part, this variability is as a result of companies often assessing LTI performance relative to other companies. Greaterabilitytoinfluenceoutcomesandtrack results increases the value for participants.
Optimising operational efficiencyThe second major concern for business leaders was how to optimise productivity while containing or reducing costs. To make remuneration programs support these objectives, companies are considering one or more of the following:
• Constraint in executive remuneration increases
• Remunerationprograms’affordability
• The mix between cash and equity
• Aligningremunerationprograms with operational goals
Constraint in executive remuneration increasesWith the economy remaining subdued, companies need to ensure that they encourage behaviours that help maximise productivity, but in ways that maintain or even reduce cost. There remains a real need for companies to get better return from their remuneration investment.
Companies provided only modest increasestofixedremunerationforexecutives in the same role for 2013 and 2014 relative to total remuneration (figure 9).
Reward outcomes Businesses need to monitor and test carefully the link between performance and reward outcomes. The median STI payment has remained at target levels for the past couple of years (figure 8), which raises questions from the market aboutthedifficultyoftargetsandassessment of outcomes.
For companies where performance is strong, there is an opportunity to explain how the link between performance and reward has worked, without disclosing commercially sensitive information. Othercompaniescouldconsidersettingaminimum performance threshold to trigger payment, or altering how payments align to the targets set.
Figure 9: Fixed remuneration increases have remained modest relative to total remuneration for executives in the same role for 2013 and 2014
CEO CFO BUH
Fixed remuneration 2% 3% 3%
Total remuneration 6% 7% 9%
Businesses need to monitor and test carefully the link between performance and reward outcomes
Remuneration program affordabilityWe are also seeing the following approaches to support affordability of executive remuneration:
• Morecompaniesareconsideringincludingafinancialgatewayovereither part or all of their STI before payments can be made. However, a relatively small number of companies (22%)disclosedafinancialgateway in 2014.
• Companies are looking more broadly at whether and how to optimise their totalrewardoffer.Asolutionistoprovide reward components that are valued highly by employees, but which have lower delivery cost than their perceived value. For example, executives may be willing to offset a higher bonus opportunity with better leadership development delivered at a lower cost.
• Further analysis of STI payments relative to performance allows companies to determine whether STI paymentsreflect“goodvalue”fortheperformance generated. Based on this analysis, companies are also able to determine whether STI payments are distributed to those delivering the performance (whether at business unit level or more granularly).
• While they can be a cost effective delivery mechanism, we note that the prevalence of share options has continued to decline (figure 13, opposite page). In our view, the Federal Government’sproposedchangestothetaxation of options will not result in a widespread return to options for mature companies but will lead to an increase in the use of options for high growth and middle market companies.
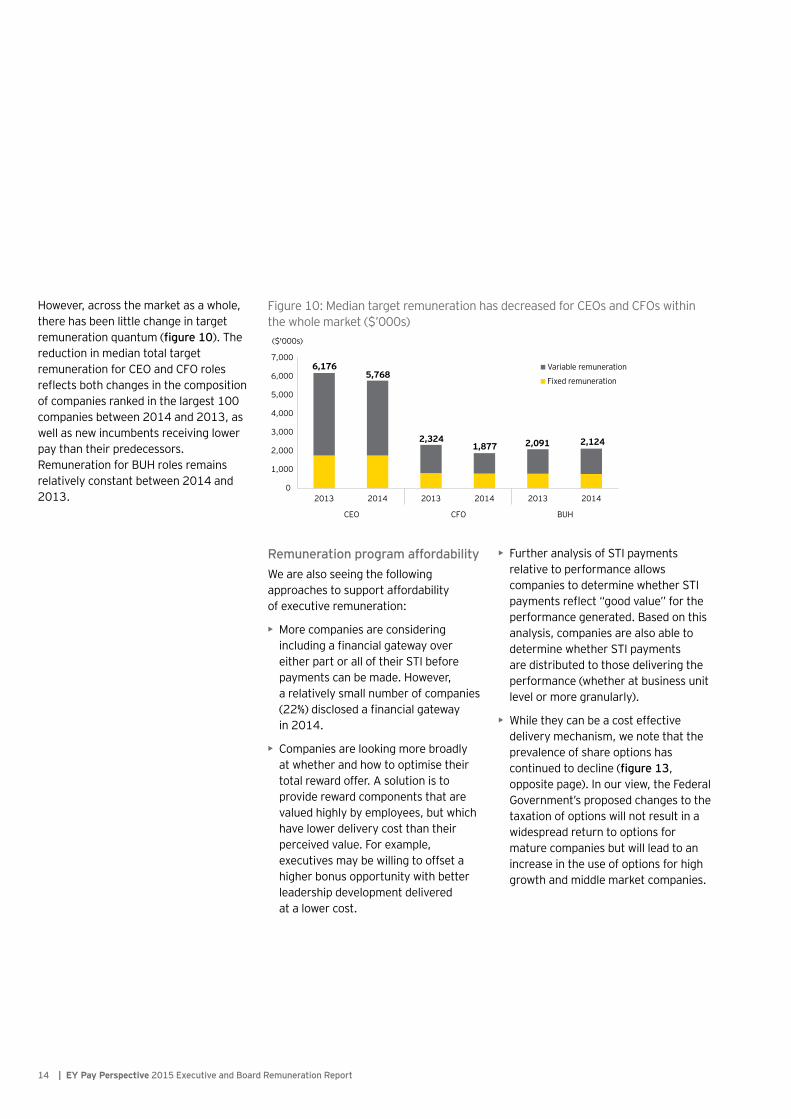
However, across the market as a whole, there has been little change in target remuneration quantum (figure 10). The reduction in median total target remunerationforCEOandCFOrolesreflectsbothchangesinthecompositionof companies ranked in the largest 100 companies between 2014 and 2013, as well as new incumbents receiving lower pay than their predecessors. RemunerationforBUHrolesremainsrelatively constant between 2014 and 2013.
Figure10:MediantargetremunerationhasdecreasedforCEOsandCFOswithinthe whole market ($’000s)
6,1765,768
2,3241,877 2,091 2,124
0
1,000
2,000
3,000
4,000
5,000
6,000
7,000
2013 2014 2013 2014 2013 2014
CEO CFO BUH
($'000s)
Variable remuneration
Fixed remuneration
14 | EY Pay Perspective 2015 Executive and Board Remuneration Report
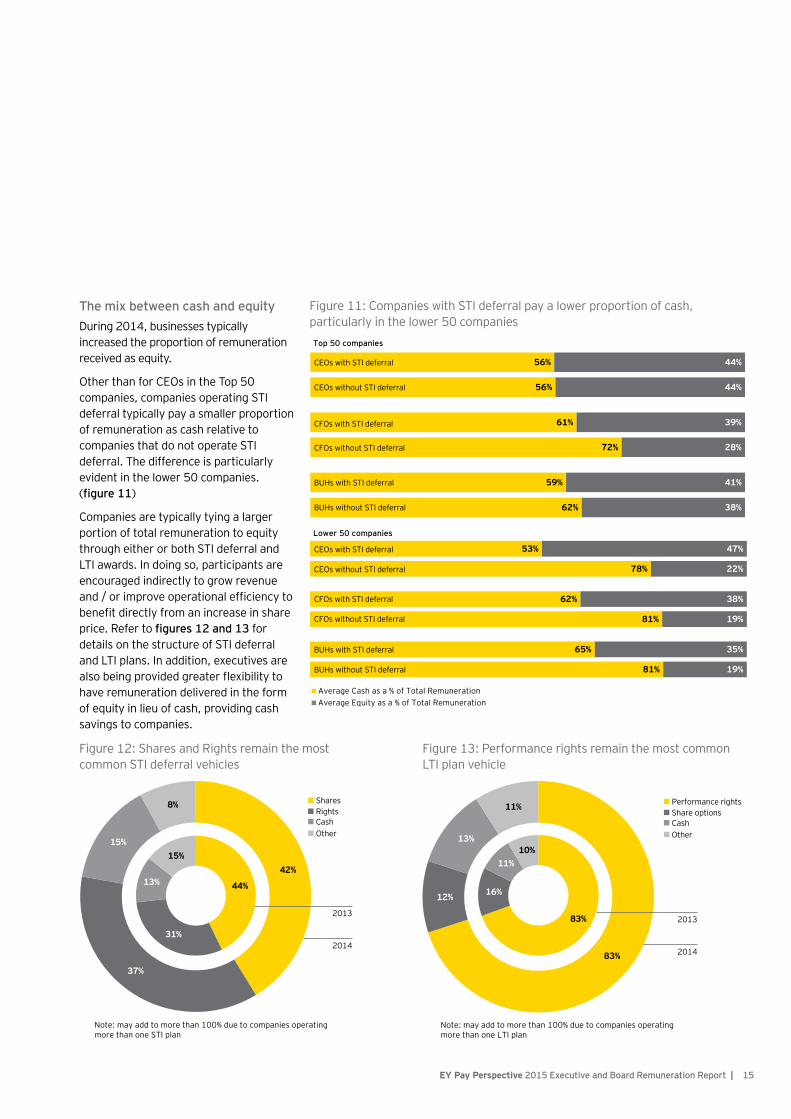
The mix between cash and equity During 2014, businesses typically increased the proportion of remuneration received as equity.
OtherthanforCEOsintheTop50companies, companies operating STI deferral typically pay a smaller proportion of remuneration as cash relative to companies that do not operate STI deferral. The difference is particularly evident in the lower 50 companies. (figure 11)
Companies are typically tying a larger portion of total remuneration to equity through either or both STI deferral and LTI awards. In doing so, participants are encouraged indirectly to grow revenue and/orimproveoperationalefficiencytobenefitdirectlyfromanincreaseinshareprice.Refertofigures 12 and 13 for details on the structure of STI deferral and LTI plans. In addition, executives are alsobeingprovidedgreaterflexibilitytohave remuneration delivered in the form of equity in lieu of cash, providing cash savings to companies.
Figure 11: Companies with STI deferral pay a lower proportion of cash, particularly in the lower 50 companies
56%
56%
61%
72%
59%
62%
44%
44%
39%
28%
41%
38%
Average Cash as a % of Total RemunerationAverage Equity as a % of Total Remuneration
53%
78%
62%
81%
65%
81%
47%
22%
38%
19%
35%
19%
Lower 50 companies
Top 50 companies
CEOs with STI deferral
CEOs without STI deferral
CFOs with STI deferral
CFOs without STI deferral
BUHs with STI deferral
BUHs without STI deferral
CEOs with STI deferral
CEOs without STI deferral
CFOs with STI deferral
CFOs without STI deferral
BUHs with STI deferral
BUHs without STI deferral
Figure12:SharesandRightsremainthemostcommon STI deferral vehicles
Figure 13: Performance rights remain the most common LTI plan vehicle
SharesRightsCashOther
42%
37%
15%
8%
Note: may add to more than 100% due to companies operating more than one STI plan
44%
31%
13%
15%
2014
2013
2014
2013
83%
12%
13%
11% Performance rightsShare optionsCashOther
83%
16%
11%10%
Note: may add to more than 100% due to companies operating more than one LTI plan
15 EY Pay Perspective 2015 Executive and Board Remuneration Report |
16 | EY Pay Perspective 2015 Executive and Board Remuneration Report
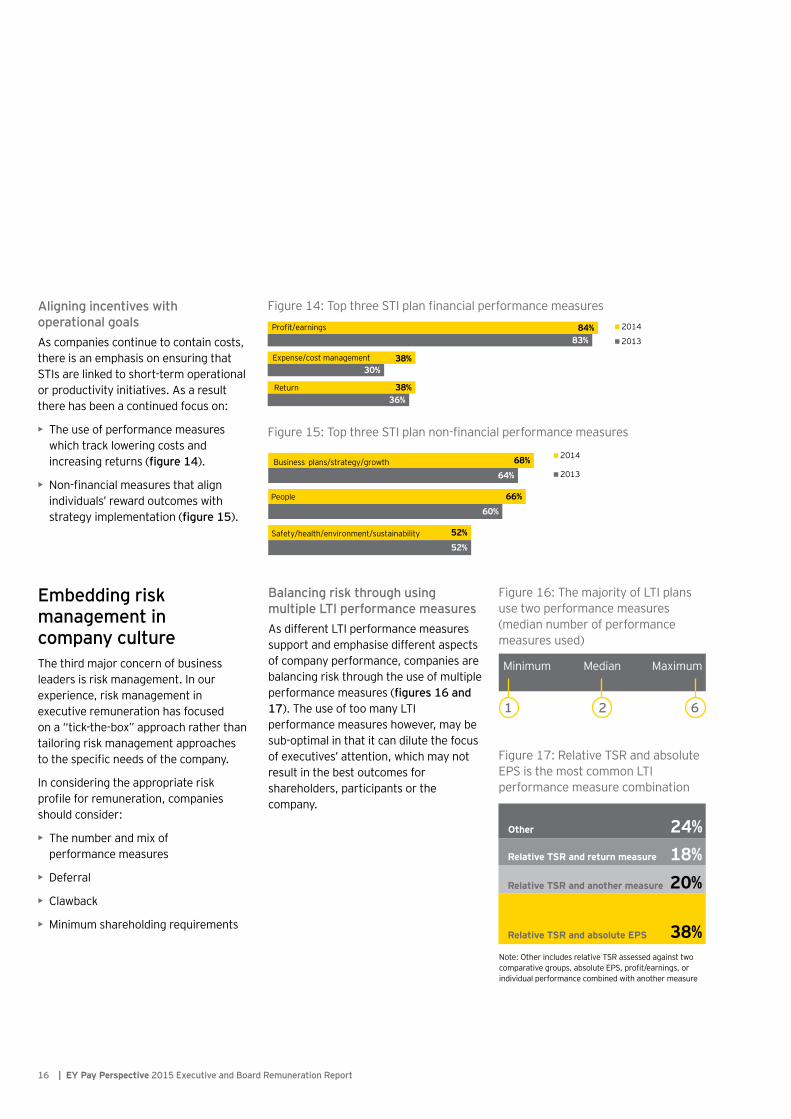
Aligning incentives with operational goalsAscompaniescontinuetocontaincosts,there is an emphasis on ensuring that STIs are linked to short-term operational orproductivityinitiatives.Asaresultthere has been a continued focus on:
• The use of performance measures which track lowering costs and increasing returns (figure 14).
• Non-financialmeasuresthatalignindividuals’ reward outcomes with strategy implementation (figure 15).
Figure14:TopthreeSTIplanfinancialperformancemeasures
Figure15:TopthreeSTIplannon-financialperformancemeasures
84%
38%
38%
83%
30%
36%
2014
2013
Profit/earnings
Return
Expense/cost management
68%
66%
52%
64%
60%
52%
2014
2013
Safety/health/environment/sustainability
Business plans/strategy/growth
People
Embedding risk management in company cultureThe third major concern of business leaders is risk management. In our experience, risk management in executive remuneration has focused on a “tick-the-box” approach rather than tailoring risk management approaches tothespecificneedsofthecompany.
In considering the appropriate risk profileforremuneration,companiesshould consider:
• The number and mix of performance measures
• Deferral
• Clawback
• Minimumshareholdingrequirements
Balancing risk through using multiple LTI performance measuresAsdifferentLTIperformancemeasuressupport and emphasise different aspects of company performance, companies are balancing risk through the use of multiple performance measures (figures 16 and 17). The use of too many LTI performance measures however, may be sub-optimal in that it can dilute the focus of executives’ attention, which may not result in the best outcomes for shareholders, participants or the company.
Figure 16: The majority of LTI plans use two performance measures (median number of performance measures used)
Minimum Median Maximum
Figure17:RelativeTSRandabsoluteEPS is the most common LTI performance measure combination
Note:OtherincludesrelativeTSRassessedagainsttwocomparativegroups,absoluteEPS,profit/earnings,orindividual performance combined with another measure
Relative TSR and absolute EPS
Relative TSR and another measure
Other
Relative TSR and return measure
38%
20%18%24%
Deferring remuneration to manage riskThe use of STI deferral continues to be high, used by approximately three-quarters of companies (including those outside the Financial Services sector, where deferral is encouraged by regulation).
The continued use of deferral has been to:
• Addressproxyadvisorand/orshareholder advisory group concerns
• Support the longer-term focus of the company
• Increase the alignment of executive and shareholder interests by providing greater exposure to equity
• Allowa“clawback”policy
While the use of deferral can be an effective mechanism in managing risk, theprimaryfactorinfluencingtheintroduction of deferral for companies shouldbethefitwithbusinessandremuneration strategies, rather than market practice. If companies have a well-articulated rationale and a strong risk management framework, the “need” for STI deferral is reduced.
In our experience, deferral is less prevalent in organisations where lead times between product/service delivery and revenue recognition is shorter (e.g. retail). For these companies, the use of a minimum shareholding requirement combined with a wide-ranging clawback policy may be a better way to achieve the goals outlined above.
We expect the increased use of executive minimum shareholding requirements will continue, particularly for the lower 50 companies
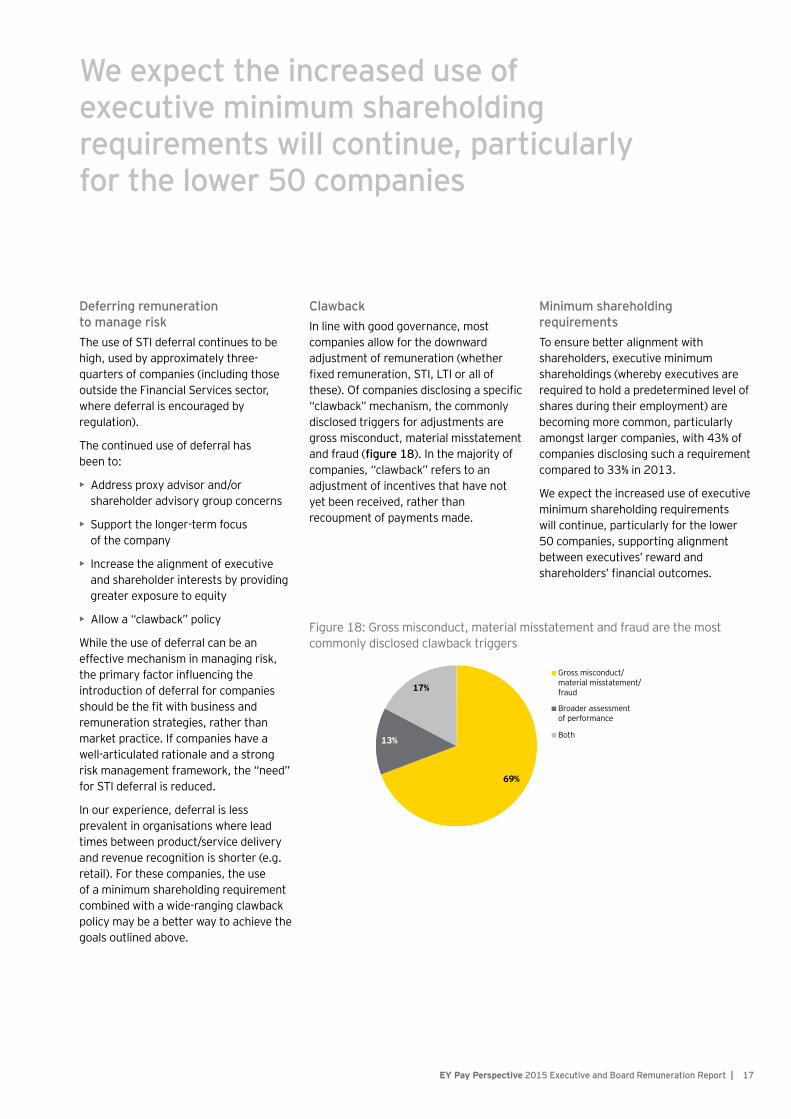
Clawback In line with good governance, most companies allow for the downward adjustment of remuneration (whether fixedremuneration,STI,LTIorallofthese).Ofcompaniesdisclosingaspecific“clawback” mechanism, the commonly disclosed triggers for adjustments are gross misconduct, material misstatement and fraud (figure 18). In the majority of companies, “clawback” refers to an adjustment of incentives that have not yet been received, rather than recoupment of payments made.
Minimum shareholding requirements To ensure better alignment with shareholders, executive minimum shareholdings (whereby executives are required to hold a predetermined level of shares during their employment) are becoming more common, particularly amongst larger companies, with 43% of companies disclosing such a requirement compared to 33% in 2013.
We expect the increased use of executive minimum shareholding requirements will continue, particularly for the lower 50 companies, supporting alignment between executives’ reward and shareholders’financialoutcomes.
Figure18:Grossmisconduct,materialmisstatementandfraudarethemostcommonly disclosed clawback triggers
69%
13%
17%
Gross misconduct/material misstatement/fraud
Broader assessment of performance
Both
17 EY Pay Perspective 2015 Executive and Board Remuneration Report |

18 | EY Pay Perspective 2015 Executive and Board Remuneration Report
Non-executive director fees
Attracting the best non-executive directors (NEDs) is beginning to emerge as a key source of competitive edge. However, we have seen little movement in relation to NED fee arrangements — both quantum and structure.
18 | EY Pay Perspective 2015 Executive and Board Remuneration Report
19 EY Pay Perspective 2015 Executive and Board Remuneration Report |
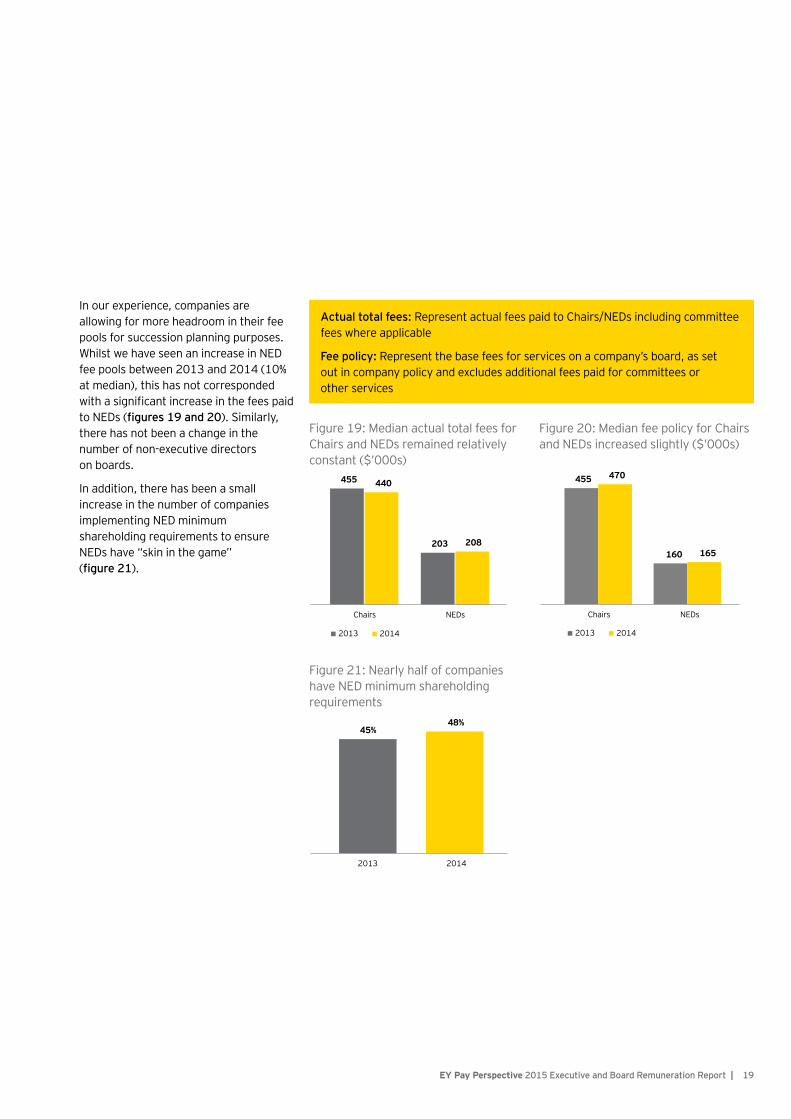
In our experience, companies are allowing for more headroom in their fee pools for succession planning purposes. Whilst we have seen an increase in NED fee pools between 2013 and 2014 (10% at median), this has not corresponded withasignificantincreaseinthefeespaidto NEDs (figures 19 and 20). Similarly, there has not been a change in the number of non-executive directors on boards.
In addition, there has been a small increase in the number of companies implementing NED minimum shareholding requirements to ensure NEDs have “skin in the game” (figure 21).
Actual total fees: RepresentactualfeespaidtoChairs/NEDsincludingcommitteefees where applicable
Fee policy: Representthebasefeesforservicesonacompany’sboard,assetout in company policy and excludes additional fees paid for committees or other services
Figure19:MedianactualtotalfeesforChairs and NEDs remained relatively constant ($’000s)
Figure20:MedianfeepolicyforChairsand NEDs increased slightly ($’000s)
455
203
440
208
Chairs NEDs
2013 2014
455
160
470
165
Chairs NEDs
2013 2014
Figure 21: Nearly half of companies have NED minimum shareholding requirements
45%48%
2013 2014

| EY Pay Perspective 2015 Executive and Board Remuneration Report 20
Our overall perspectiveExecutiveremunerationcontinuestoevolve.Asthisreportshows,choosing and implementing an optimal remuneration strategy is notamatterof“setandforget”.Rather,tomaintaineffectiveness,remuneration programs should be reviewed to ensure they support the business strategy, reward the “right” outcomes and behaviours and are valued by participants. Whilst this may be informed by market practice, it should be led by the company’s business and strategy.
20 | EY Pay Perspective 2015 Executive and Board Remuneration Report

21 EY Pay Perspective 2015 Executive and Board Remuneration Report |
Adelaide
Craig Whiteman Tel: +61 8 8417 1770 [email protected]
Brisbane
Shannon James Tel: + 61 7 3011 3182 [email protected]
Chris Nicholls Tel: +61 7 3011 3123 [email protected]
Melbourne
Joanne Avasti Tel: +61 3 9288 8212 [email protected]
Bruno Cecchini Tel: +61 3 9288 8423 [email protected]
Hillel Nagel Tel: +61 3 8650 7227 [email protected]
Mark Phillips Tel: +61 3 9288 8007 [email protected]
Perth
Warren Land Tel: +61 8 9217 1208 [email protected]
Tanya Ross-Jones Tel: +61 8 9429 2249 [email protected]
Sydney
Rohan Connors Tel: +61 2 9248 4318 [email protected]
Chris Galway Tel: +61 2 8295 6476 [email protected]
Mike Hogan Tel: +61 2 8295 6853 [email protected]
Richard Kantor Tel: +61 2 9276 9052 [email protected]
David Werner Tel: 61 2 8295 6721 [email protected]
21 EY Pay Perspective 2015 Executive and Board Remuneration Report |
EY | Assurance | Tax | Transactions | Advisory
About EYEY is a global leader in assurance, tax, transaction and advisory services. The insights and quality services we deliver help build trust and confidence in the capital markets and in economies the world over. We develop outstanding leaders who team to deliver on our promises to all of our stakeholders. In so doing, we play a critical role in building a better working world for our people, for our clients and for our communities.
EY refers to the global organisation, and may refer to one or more, ofthememberfirmsofErnst&YoungGlobalLimited,eachofwhich isaseparatelegalentity.Ernst&YoungGlobalLimited,aUKcompanylimited by guarantee, does not provide services to clients. For more information about our organisation, please visit ey.com.
©2015Ernst&Young,Australia. AllRightsReserved.
APACno.AUNZ00000506 M1527485 ED None
This communication provides general information which is current at the time of production. The information contained in this communication does not constitute advice and should not be relied on as such. Professional advice should be sought prior to any action being taken in reliance on any of the information. Ernst & Young disclaims all responsibility and liability (including, without limitation, for any direct or indirect or consequential costs, loss or damage or loss of profits) arising from anything done or omitted to be done by any party in reliance, whetherwhollyorpartially,onanyoftheinformation.Anypartythatreliesontheinformationdoes so at its own risk. Liability limited by a scheme approved under Professional Standards Legislation.
ey.com