Embed Size (px)
Citation preview
BVCA annual report on the performance of portfolio companies, VIII

1 BVCA annual report on the performance of portfolio companies, VIII
This is the eighth annual report on the performance of portfolio companies, a group of large, private equity-owned UK businesses that met defined criteria at the time of acquisition. Its publication is one of the steps adopted by the private equity industry to improve transparency and disclosure, under the oversight of the Private Equity Reporting Group (PERG, formerly the Walker Guidelines Monitoring Group).
This year’s report sees the number of portfolio companies decline to 62 as at 31 December 2014 (2013:71), after a record number of exits in 2014. The report is based on information provided on the portfolio companies by the private equity firms that own them. This year, data was received covering 57 portfolio companies, a compliance rate of 92%, a decline from last year of 96%.
With a large number of portfolio companies, and eight years of information, this report provides a comprehensive and detailed insight into the effect of private equity ownership on large, UK businesses.
Contrary to the general improvement in the economic outlook in 2014, on many measures the aggregate portfolio company performance in 2014 was behind that of 2013. As a result, the outperformance vs. UK economy and public company benchmarks that has been evident in prior years’ reports narrowed. However, against the test of absolute performance, and under the high financial leverage that is common in private equity-owned businesses, the portfolio companies, in the period under private equity ownership, continued to deliver positive growth in employment, investment, revenue, profits, productivity and returns to investors.
EY, as advisors to the BVCA, has worked with them to conduct this research and jointly publish its findings. Both parties welcome comments and suggestions on this report to the contact details at the end of this report.
Yours faithfully,
BVCA, EY
Foreword

2BVCA annual report on the performance of portfolio companies, VIII
Summary 3
Population and compliance 4
Returns attribution 5
Employment 6
Employment cost and pensions 7
Investing 9
Productivity 10
Trading performance 11
Financial leverage 12
Appendices
Appendix A: List of portfolio companies 13
Appendix B: Movement in the number of portfolio companies, 2007–14 15
Appendix C: Report objectives and definitions 16
Appendix D: Methodology 17
Contents
3 BVCA annual report on the performance of portfolio companies, VIII
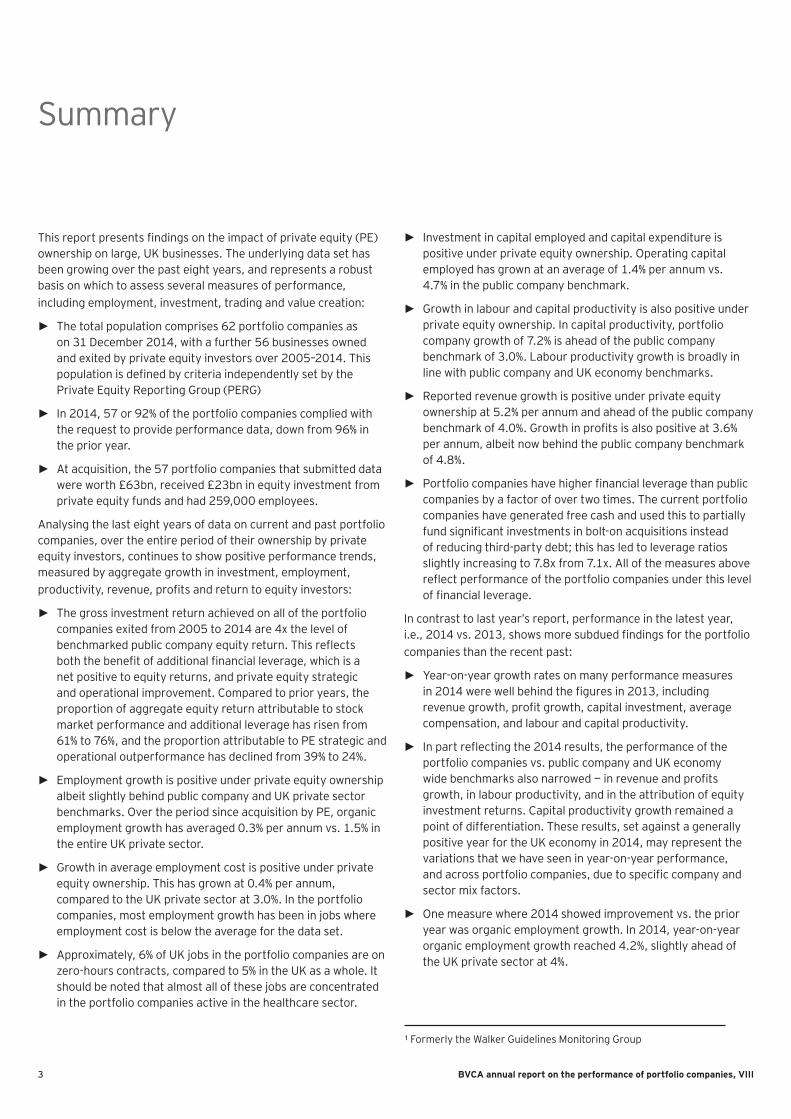
This report presents findings on the impact of private equity (PE) ownership on large, UK businesses. The underlying data set has been growing over the past eight years, and represents a robust basis on which to assess several measures of performance, including employment, investment, trading and value creation:
► The total population comprises 62 portfolio companies as on 31 December 2014, with a further 56 businesses owned and exited by private equity investors over 2005–2014. This population is defined by criteria independently set by the Private Equity Reporting Group (PERG)
► In 2014, 57 or 92% of the portfolio companies complied with the request to provide performance data, down from 96% in the prior year.
► At acquisition, the 57 portfolio companies that submitted data were worth £63bn, received £23bn in equity investment from private equity funds and had 259,000 employees.
Analysing the last eight years of data on current and past portfolio companies, over the entire period of their ownership by private equity investors, continues to show positive performance trends, measured by aggregate growth in investment, employment, productivity, revenue, profits and return to equity investors:
► The gross investment return achieved on all of the portfolio companies exited from 2005 to 2014 are 4x the level of benchmarked public company equity return. This reflects both the benefit of additional financial leverage, which is a net positive to equity returns, and private equity strategic and operational improvement. Compared to prior years, the proportion of aggregate equity return attributable to stock market performance and additional leverage has risen from 61% to 76%, and the proportion attributable to PE strategic and operational outperformance has declined from 39% to 24%.
► Employment growth is positive under private equity ownership albeit slightly behind public company and UK private sector benchmarks. Over the period since acquisition by PE, organic employment growth has averaged 0.3% per annum vs. 1.5% in the entire UK private sector.
► Growth in average employment cost is positive under private equity ownership. This has grown at 0.4% per annum, compared to the UK private sector at 3.0%. In the portfolio companies, most employment growth has been in jobs where employment cost is below the average for the data set.
► Approximately, 6% of UK jobs in the portfolio companies are on zero-hours contracts, compared to 5% in the UK as a whole. It should be noted that almost all of these jobs are concentrated in the portfolio companies active in the healthcare sector.
► Investment in capital employed and capital expenditure is positive under private equity ownership. Operating capital employed has grown at an average of 1.4% per annum vs. 4.7% in the public company benchmark.
► Growth in labour and capital productivity is also positive under private equity ownership. In capital productivity, portfolio company growth of 7.2% is ahead of the public company benchmark of 3.0%. Labour productivity growth is broadly in line with public company and UK economy benchmarks.
► Reported revenue growth is positive under private equity ownership at 5.2% per annum and ahead of the public company benchmark of 4.0%. Growth in profits is also positive at 3.6% per annum, albeit now behind the public company benchmark of 4.8%.
► Portfolio companies have higher financial leverage than public companies by a factor of over two times. The current portfolio companies have generated free cash and used this to partially fund significant investments in bolt-on acquisitions instead of reducing third-party debt; this has led to leverage ratios slightly increasing to 7.8x from 7.1x. All of the measures above reflect performance of the portfolio companies under this level of financial leverage.
In contrast to last year’s report, performance in the latest year, i.e., 2014 vs. 2013, shows more subdued findings for the portfolio companies than the recent past:
► Year-on-year growth rates on many performance measures in 2014 were well behind the figures in 2013, including revenue growth, profit growth, capital investment, average compensation, and labour and capital productivity.
► In part reflecting the 2014 results, the performance of the portfolio companies vs. public company and UK economy wide benchmarks also narrowed — in revenue and profits growth, in labour productivity, and in the attribution of equity investment returns. Capital productivity growth remained a point of differentiation. These results, set against a generally positive year for the UK economy in 2014, may represent the variations that we have seen in year-on-year performance, and across portfolio companies, due to specific company and sector mix factors.
► One measure where 2014 showed improvement vs. the prior year was organic employment growth. In 2014, year-on-year organic employment growth reached 4.2%, slightly ahead of the UK private sector at 4%.
Summary
¹ Formerly the Walker Guidelines Monitoring Group
4BVCA annual report on the performance of portfolio companies, VIII
Population and compliance
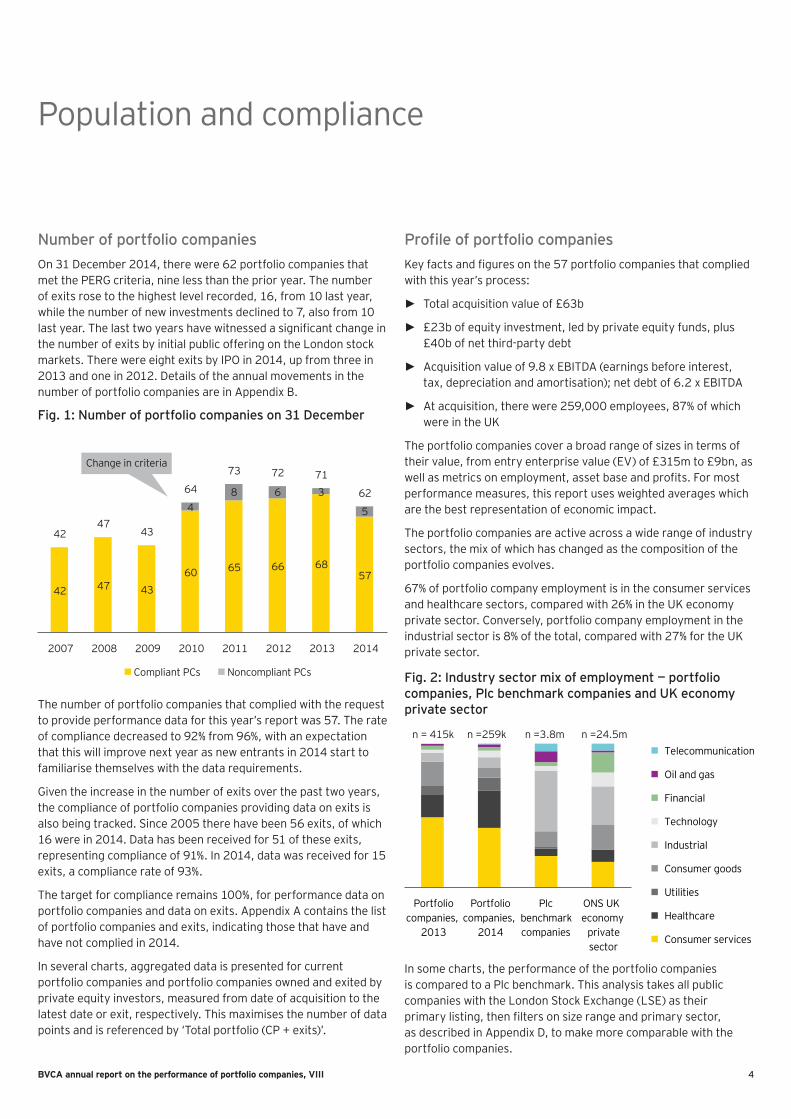
Number of portfolio companies On 31 December 2014, there were 62 portfolio companies that met the PERG criteria, nine less than the prior year. The number of exits rose to the highest level recorded, 16, from 10 last year, while the number of new investments declined to 7, also from 10 last year. The last two years have witnessed a significant change in the number of exits by initial public offering on the London stock markets. There were eight exits by IPO in 2014, up from three in 2013 and one in 2012. Details of the annual movements in the number of portfolio companies are in Appendix B.
Fig. 1: Number of portfolio companies on 31 December
42 47 4360 65 66 68
57
48 6 3
5
4247
43
64
73 72 71
62
2007 2008 2009 2010 2011 2012 2013 2014
Compliant PCs Noncompliant PCs
Change in criteria
The number of portfolio companies that complied with the request to provide performance data for this year’s report was 57. The rate of compliance decreased to 92% from 96%, with an expectation that this will improve next year as new entrants in 2014 start to familiarise themselves with the data requirements.
Given the increase in the number of exits over the past two years, the compliance of portfolio companies providing data on exits is also being tracked. Since 2005 there have been 56 exits, of which 16 were in 2014. Data has been received for 51 of these exits, representing compliance of 91%. In 2014, data was received for 15 exits, a compliance rate of 93%.
The target for compliance remains 100%, for performance data on portfolio companies and data on exits. Appendix A contains the list of portfolio companies and exits, indicating those that have and have not complied in 2014.
In several charts, aggregated data is presented for current portfolio companies and portfolio companies owned and exited by private equity investors, measured from date of acquisition to the latest date or exit, respectively. This maximises the number of data points and is referenced by ‘Total portfolio (CP + exits)’.
Profile of portfolio companiesKey facts and figures on the 57 portfolio companies that complied with this year’s process:
► Total acquisition value of £63b
► £23b of equity investment, led by private equity funds, plus £40b of net third-party debt
► Acquisition value of 9.8 x EBITDA (earnings before interest, tax, depreciation and amortisation); net debt of 6.2 x EBITDA
► At acquisition, there were 259,000 employees, 87% of which were in the UK
The portfolio companies cover a broad range of sizes in terms of their value, from entry enterprise value (EV) of £315m to £9bn, as well as metrics on employment, asset base and profits. For most performance measures, this report uses weighted averages which are the best representation of economic impact.
The portfolio companies are active across a wide range of industry sectors, the mix of which has changed as the composition of the portfolio companies evolves.
67% of portfolio company employment is in the consumer services and healthcare sectors, compared with 26% in the UK economy private sector. Conversely, portfolio company employment in the industrial sector is 8% of the total, compared with 27% for the UK private sector.
Fig. 2: Industry sector mix of employment — portfolio companies, Plc benchmark companies and UK economy private sector
Portfoliocompanies,
2013
Portfoliocompanies,
2014
Plcbenchmarkcompanies
ONS UKeconomy
privatesector
Telecommunication
Oil and gas
Financial
Technology
Industrial
Consumer goods
Utilities
Healthcare
Consumer services
n = 415k n =259k n =3.8m n =24.5m
In some charts, the performance of the portfolio companies is compared to a Plc benchmark. This analysis takes all public companies with the London Stock Exchange (LSE) as their primary listing, then filters on size range and primary sector, as described in Appendix D, to make more comparable with the portfolio companies.
5 BVCA annual report on the performance of portfolio companies, VIII
Returns attribution
Private equity vs. public equity returnThe objective of this report is to evaluate the impact of private equity ownership on the portfolio companies, covering a range of key metrics and perspectives.
The first metric on returns attribution seeks to assess whether the equity investment return achieved by private equity investors is higher than the benefit derived from additional debt (or leverage), and higher than the performance of public companies in the same sector and time frame; that is, do private equity-owned companies deliver better equity investment returns, adjusted for leverage, than comparable public companies. The time frame of this measure starts when the portfolio company is acquired, and ends when it is exited; for the 51 exits, this averages just over five and a half years.
This year we have refined the methodology used, as described in Appendix D, as well as incorporated the additional exits in 2014. The three key findings remain consistent with prior years, albeit the absolute numbers have moved:
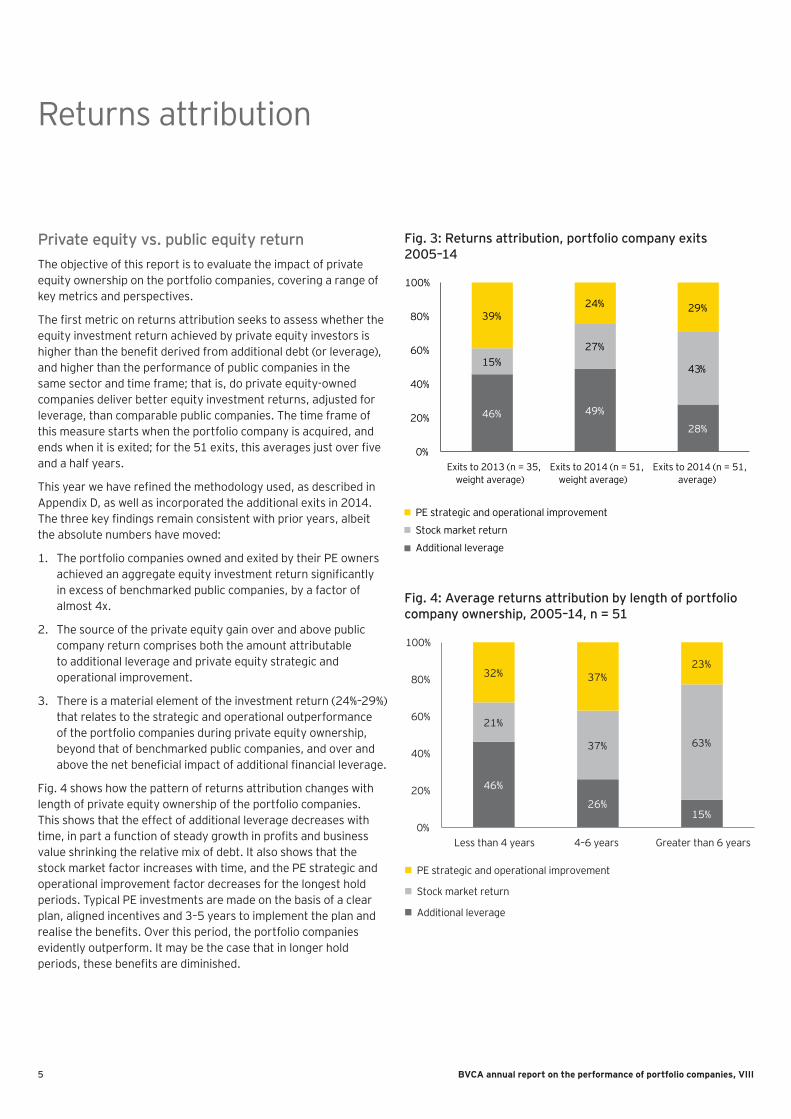
1. The portfolio companies owned and exited by their PE owners achieved an aggregate equity investment return significantly in excess of benchmarked public companies, by a factor of almost 4x.
2. The source of the private equity gain over and above public company return comprises both the amount attributable to additional leverage and private equity strategic and operational improvement.
3. There is a material element of the investment return (24%–29%) that relates to the strategic and operational outperformance of the portfolio companies during private equity ownership, beyond that of benchmarked public companies, and over and above the net beneficial impact of additional financial leverage.
Fig. 4 shows how the pattern of returns attribution changes with length of private equity ownership of the portfolio companies. This shows that the effect of additional leverage decreases with time, in part a function of steady growth in profits and business value shrinking the relative mix of debt. It also shows that the stock market factor increases with time, and the PE strategic and operational improvement factor decreases for the longest hold periods. Typical PE investments are made on the basis of a clear plan, aligned incentives and 3–5 years to implement the plan and realise the benefits. Over this period, the portfolio companies evidently outperform. It may be the case that in longer hold periods, these benefits are diminished.
Fig. 3: Returns attribution, portfolio company exits 2005–14
Fig. 4: Average returns attribution by length of portfolio company ownership, 2005–14, n = 51
46% 49%
28%
15%27%
43%
39%24% 29%
0%
20%
40%
60%
80%
100%
Exits to 2013 (n = 35,weight average)
Exits to 2014 (n = 51,weight average)
Exits to 2014 (n = 51,average)
PE strategic and operational improvement
Stock market return
Additional leverage
46%
26%15%
21%
37% 63%
32% 37%23%
0%
20%
40%
60%
80%
100%
Less than 4 years 4–6 years Greater than 6 years
PE strategic and operational improvement
Stock market return
Additional leverage
6BVCA annual report on the performance of portfolio companies, VIII
Employment
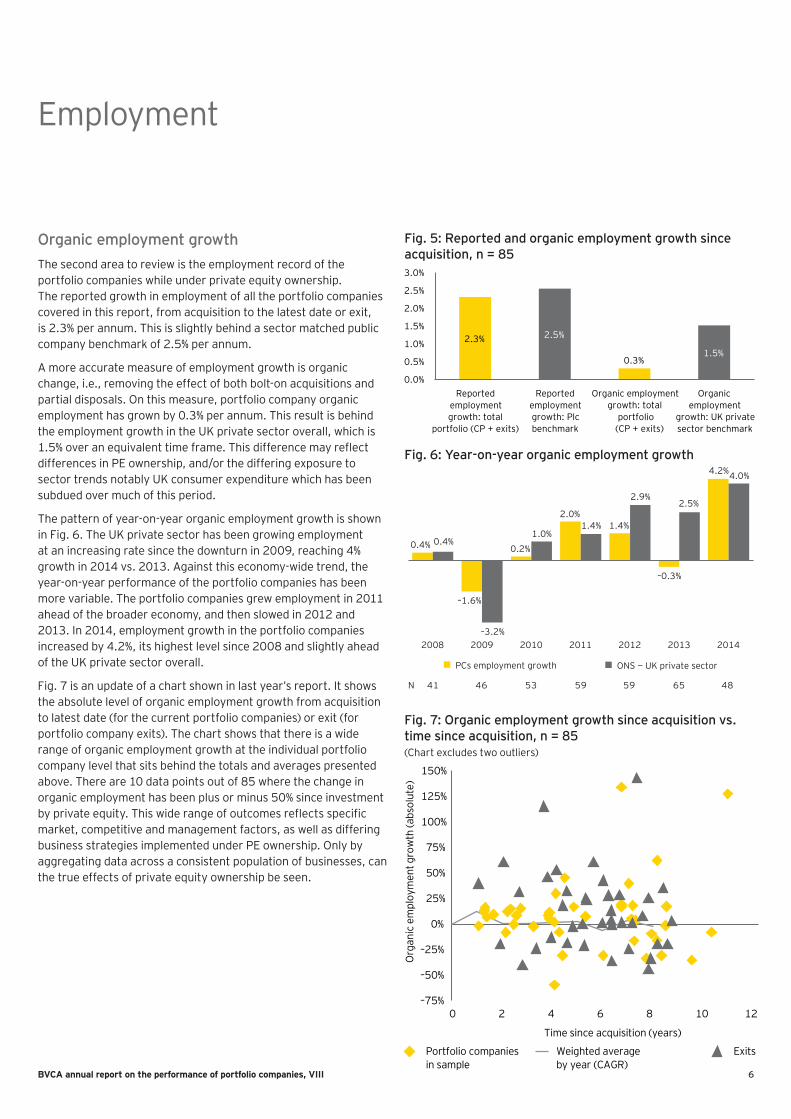
Organic employment growthThe second area to review is the employment record of the portfolio companies while under private equity ownership. The reported growth in employment of all the portfolio companies covered in this report, from acquisition to the latest date or exit, is 2.3% per annum. This is slightly behind a sector matched public company benchmark of 2.5% per annum.
A more accurate measure of employment growth is organic change, i.e., removing the effect of both bolt-on acquisitions and partial disposals. On this measure, portfolio company organic employment has grown by 0.3% per annum. This result is behind the employment growth in the UK private sector overall, which is 1.5% over an equivalent time frame. This difference may reflect differences in PE ownership, and/or the differing exposure to sector trends notably UK consumer expenditure which has been subdued over much of this period.
The pattern of year-on-year organic employment growth is shown in Fig. 6. The UK private sector has been growing employment at an increasing rate since the downturn in 2009, reaching 4% growth in 2014 vs. 2013. Against this economy-wide trend, the year-on-year performance of the portfolio companies has been more variable. The portfolio companies grew employment in 2011 ahead of the broader economy, and then slowed in 2012 and 2013. In 2014, employment growth in the portfolio companies increased by 4.2%, its highest level since 2008 and slightly ahead of the UK private sector overall.
Fig. 7 is an update of a chart shown in last year’s report. It shows the absolute level of organic employment growth from acquisition to latest date (for the current portfolio companies) or exit (for portfolio company exits). The chart shows that there is a wide range of organic employment growth at the individual portfolio company level that sits behind the totals and averages presented above. There are 10 data points out of 85 where the change in organic employment has been plus or minus 50% since investment by private equity. This wide range of outcomes reflects specific market, competitive and management factors, as well as differing business strategies implemented under PE ownership. Only by aggregating data across a consistent population of businesses, can the true effects of private equity ownership be seen.
Fig. 5: Reported and organic employment growth since acquisition, n = 85
Fig. 6: Year-on-year organic employment growth
Fig. 7: Organic employment growth since acquisition vs. time since acquisition, n = 85
2.3% 2.5%
0.3%1.5%
0.0%
0.5%
1.0%
1.5%
2.0%
2.5%
3.0%
Reportedemploymentgrowth: total
portfolio (CP + exits)
Reportedemploymentgrowth: Plcbenchmark
Organic employmentgrowth: total
portfolio (CP + exits)
Organicemployment
growth: UK privatesector benchmark
0.4%
–1.6%
0.2%
2.0%1.4%
–0.3%
4.2%
0.4%
–3.2%
1.0%1.4%
2.9%2.5%
4.0%
2008 2009 2010 2011 2012 2013 2014
PCs employment growth ONS — UK private sector
N 41 46 53 59 59 65 48
–75%
–50%
–25%
0%
25%
50%
75%
100%
125%
150%
0 2 4 6 8 10 12
Org
anic
em
ploy
men
t gro
wth
(abs
olut
e)
Time since acquisition (years)
Portfolio companies in sample
Weighted average by year (CAGR)
Exits
(Chart excludes two outliers)
7 BVCA annual report on the performance of portfolio companies, VIII
Employment costs and pensions
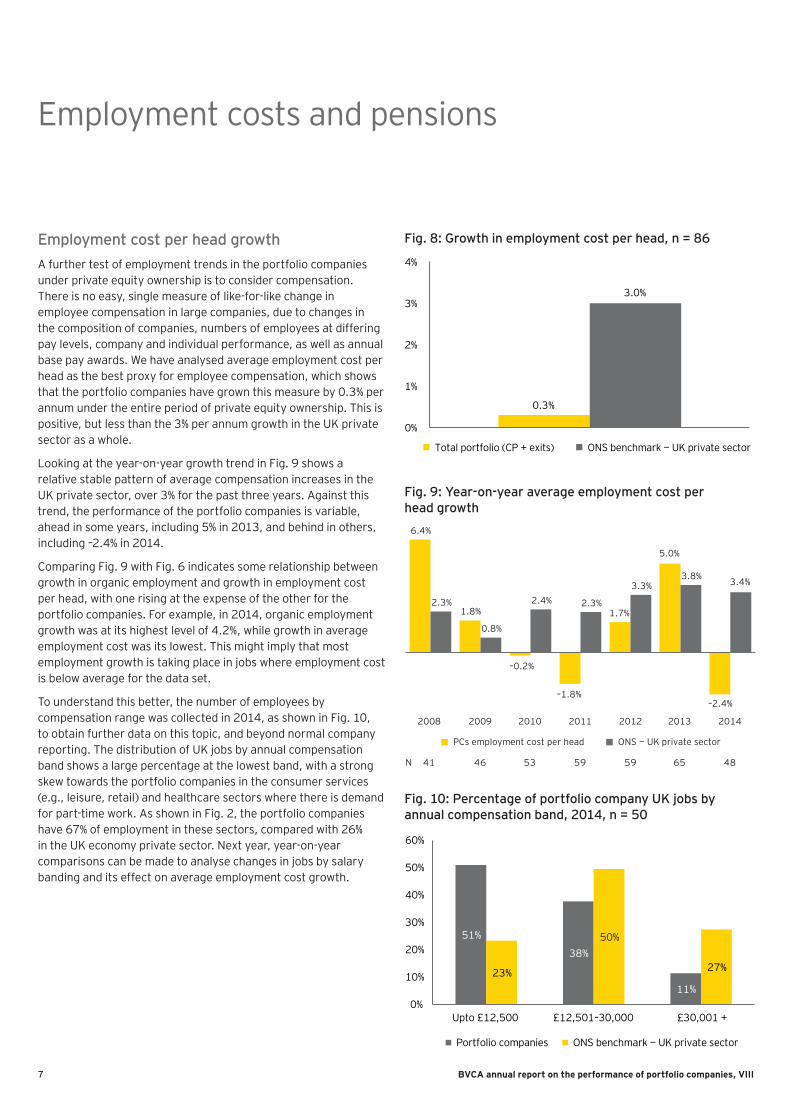
Employment cost per head growthA further test of employment trends in the portfolio companies under private equity ownership is to consider compensation. There is no easy, single measure of like-for-like change in employee compensation in large companies, due to changes in the composition of companies, numbers of employees at differing pay levels, company and individual performance, as well as annual base pay awards. We have analysed average employment cost per head as the best proxy for employee compensation, which shows that the portfolio companies have grown this measure by 0.3% per annum under the entire period of private equity ownership. This is positive, but less than the 3% per annum growth in the UK private sector as a whole.
Looking at the year-on-year growth trend in Fig. 9 shows a relative stable pattern of average compensation increases in the UK private sector, over 3% for the past three years. Against this trend, the performance of the portfolio companies is variable, ahead in some years, including 5% in 2013, and behind in others, including –2.4% in 2014.
Comparing Fig. 9 with Fig. 6 indicates some relationship between growth in organic employment and growth in employment cost per head, with one rising at the expense of the other for the portfolio companies. For example, in 2014, organic employment growth was at its highest level of 4.2%, while growth in average employment cost was its lowest. This might imply that most employment growth is taking place in jobs where employment cost is below average for the data set.
To understand this better, the number of employees by compensation range was collected in 2014, as shown in Fig. 10, to obtain further data on this topic, and beyond normal company reporting. The distribution of UK jobs by annual compensation band shows a large percentage at the lowest band, with a strong skew towards the portfolio companies in the consumer services (e.g., leisure, retail) and healthcare sectors where there is demand for part-time work. As shown in Fig. 2, the portfolio companies have 67% of employment in these sectors, compared with 26% in the UK economy private sector. Next year, year-on-year comparisons can be made to analyse changes in jobs by salary banding and its effect on average employment cost growth.
Fig. 8: Growth in employment cost per head, n = 86
Fig. 9: Year-on-year average employment cost per head growth
Fig. 10: Percentage of portfolio company UK jobs by annual compensation band, 2014, n = 50
0.3%
3.0%
0%
1%
2%
3%
4%
Total portfolio (CP + exits) ONS benchmark — UK private sector
2008 2009 2010 2011 2012 2013 2014
PCs employment cost per head ONS — UK private sector
N 41 46 53 59 59 65 48
6.4%
1.8%
–0.2%
–1.8%
1.7%
5.0%
–2.4%
2.3%
0.8%
2.4% 2.3%
3.3%3.8% 3.4%
51%
38%
11%23%
50%
27%
0%
10%
20%
30%
40%
50%
60%
Upto £12,500 £12,501–30,000 £30,001 +
Portfolio companies ONS benchmark — UK private sector
8BVCA annual report on the performance of portfolio companies, VIII
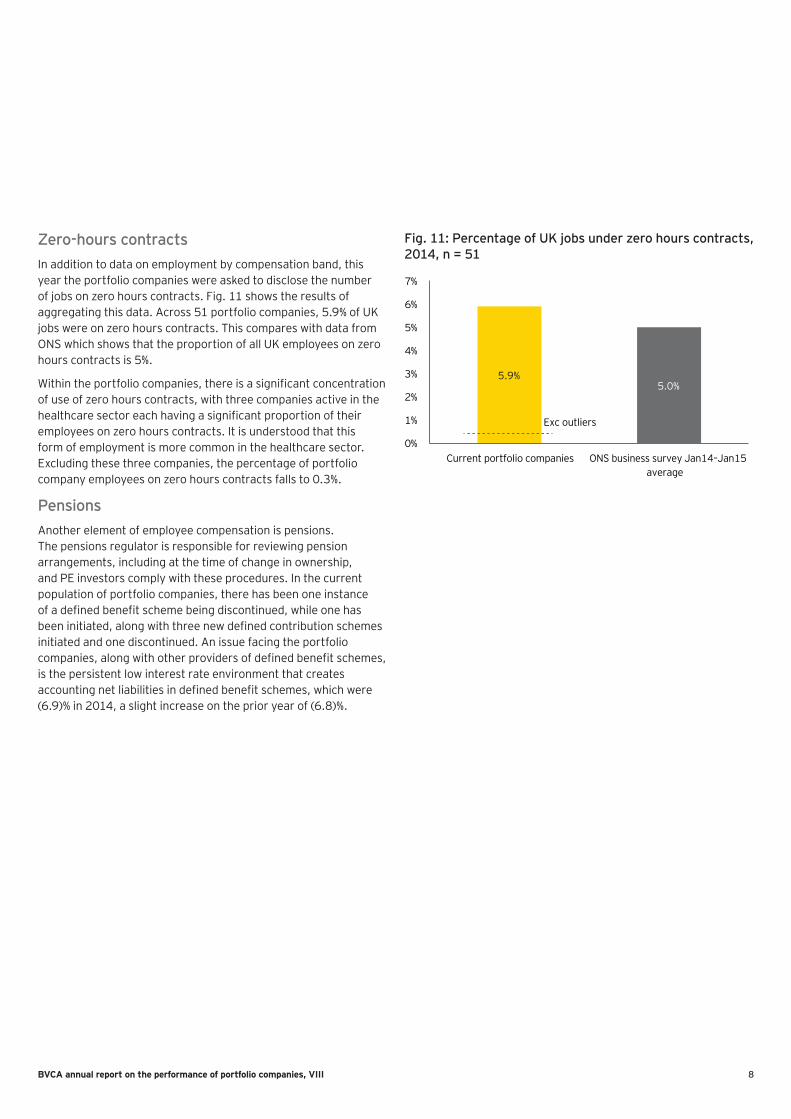
Zero-hours contractsIn addition to data on employment by compensation band, this year the portfolio companies were asked to disclose the number of jobs on zero hours contracts. Fig. 11 shows the results of aggregating this data. Across 51 portfolio companies, 5.9% of UK jobs were on zero hours contracts. This compares with data from ONS which shows that the proportion of all UK employees on zero hours contracts is 5%.
Within the portfolio companies, there is a significant concentration of use of zero hours contracts, with three companies active in the healthcare sector each having a significant proportion of their employees on zero hours contracts. It is understood that this form of employment is more common in the healthcare sector. Excluding these three companies, the percentage of portfolio company employees on zero hours contracts falls to 0.3%.
PensionsAnother element of employee compensation is pensions. The pensions regulator is responsible for reviewing pension arrangements, including at the time of change in ownership, and PE investors comply with these procedures. In the current population of portfolio companies, there has been one instance of a defined benefit scheme being discontinued, while one has been initiated, along with three new defined contribution schemes initiated and one discontinued. An issue facing the portfolio companies, along with other providers of defined benefit schemes, is the persistent low interest rate environment that creates accounting net liabilities in defined benefit schemes, which were (6.9)% in 2014, a slight increase on the prior year of (6.8)%.
Fig. 11: Percentage of UK jobs under zero hours contracts, 2014, n = 51
5.9%5.0%
0%
1%
2%
3%
4%
5%
6%
7%
Current portfolio companies
Exc outliers
ONS business survey Jan14–Jan15average
9 BVCA annual report on the performance of portfolio companies, VIII
Investing
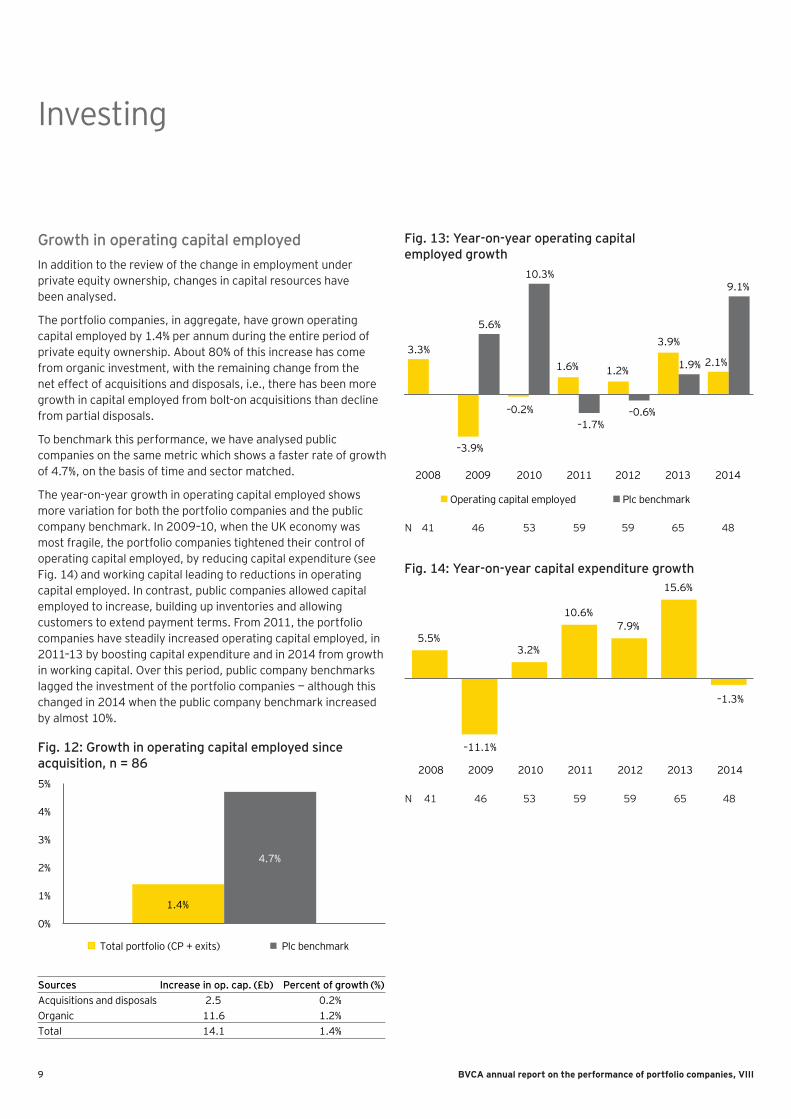
Growth in operating capital employedIn addition to the review of the change in employment under private equity ownership, changes in capital resources have been analysed.
The portfolio companies, in aggregate, have grown operating capital employed by 1.4% per annum during the entire period of private equity ownership. About 80% of this increase has come from organic investment, with the remaining change from the net effect of acquisitions and disposals, i.e., there has been more growth in capital employed from bolt-on acquisitions than decline from partial disposals.
To benchmark this performance, we have analysed public companies on the same metric which shows a faster rate of growth of 4.7%, on the basis of time and sector matched.
The year-on-year growth in operating capital employed shows more variation for both the portfolio companies and the public company benchmark. In 2009–10, when the UK economy was most fragile, the portfolio companies tightened their control of operating capital employed, by reducing capital expenditure (see Fig. 14) and working capital leading to reductions in operating capital employed. In contrast, public companies allowed capital employed to increase, building up inventories and allowing customers to extend payment terms. From 2011, the portfolio companies have steadily increased operating capital employed, in 2011–13 by boosting capital expenditure and in 2014 from growth in working capital. Over this period, public company benchmarks lagged the investment of the portfolio companies — although this changed in 2014 when the public company benchmark increased by almost 10%.
Fig. 12: Growth in operating capital employed since acquisition, n = 86
Fig. 13: Year-on-year operating capital employed growth
Fig. 14: Year-on-year capital expenditure growth
1.4%
4.7%
0%
1%
2%
3%
4%
5%
Total portfolio (CP + exits) Plc benchmark
SourcesAcquisitions and disposals 2.5 0.2%Organic 11.6 1.2%Total 14.1 1.4%
Increase in op. cap. (£b) Percent of growth (%)
N 41 46 53 59 59 65 48
3.3%
–3.9%
–0.2%
1.6% 1.2%
3.9%
2.1%
5.6%
10.3%
–1.7%–0.6%
1.9%
9.1%
2008 2009 2010 2011 2012 2013 2014
Operating capital employed Plc benchmark
N 41 46 53 59 59 65 48
5.5%
–11.1%
3.2%
10.6%7.9%
15.6%
–1.3%
2008 2009 2010 2011 2012 2013 2014
10BVCA annual report on the performance of portfolio companies, VIII
Productivity
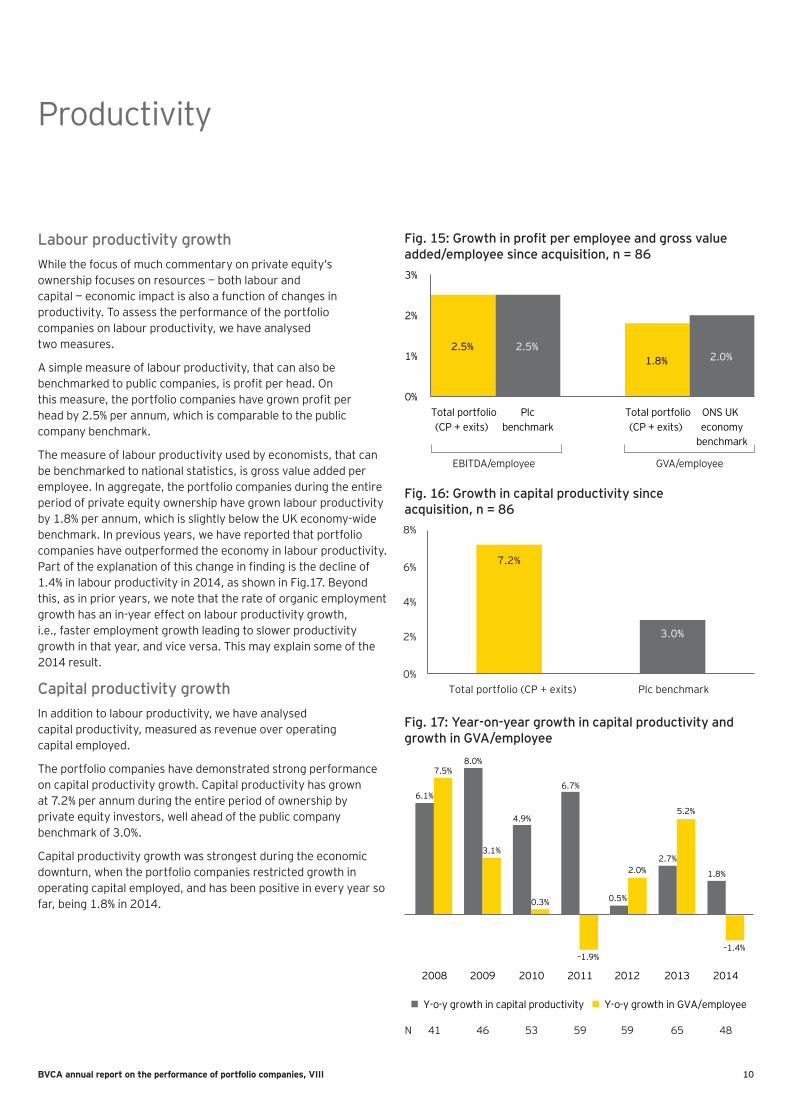
Labour productivity growthWhile the focus of much commentary on private equity’s ownership focuses on resources — both labour and capital — economic impact is also a function of changes in productivity. To assess the performance of the portfolio companies on labour productivity, we have analysed two measures.
A simple measure of labour productivity, that can also be benchmarked to public companies, is profit per head. On this measure, the portfolio companies have grown profit per head by 2.5% per annum, which is comparable to the public company benchmark.
The measure of labour productivity used by economists, that can be benchmarked to national statistics, is gross value added per employee. In aggregate, the portfolio companies during the entire period of private equity ownership have grown labour productivity by 1.8% per annum, which is slightly below the UK economy-wide benchmark. In previous years, we have reported that portfolio companies have outperformed the economy in labour productivity. Part of the explanation of this change in finding is the decline of 1.4% in labour productivity in 2014, as shown in Fig.17. Beyond this, as in prior years, we note that the rate of organic employment growth has an in-year effect on labour productivity growth, i.e., faster employment growth leading to slower productivity growth in that year, and vice versa. This may explain some of the 2014 result.
Capital productivity growthIn addition to labour productivity, we have analysed capital productivity, measured as revenue over operating capital employed.
The portfolio companies have demonstrated strong performance on capital productivity growth. Capital productivity has grown at 7.2% per annum during the entire period of ownership by private equity investors, well ahead of the public company benchmark of 3.0%.
Capital productivity growth was strongest during the economic downturn, when the portfolio companies restricted growth in operating capital employed, and has been positive in every year so far, being 1.8% in 2014.
Fig. 15: Growth in profit per employee and gross value added/employee since acquisition, n = 86
Fig. 16: Growth in capital productivity since acquisition, n = 86
Fig. 17: Year-on-year growth in capital productivity and growth in GVA/employee
2.5% 2.5%1.8% 2.0%
0%
1%
2%
3%
Total portfolio(CP + exits)
Plcbenchmark
Total portfolio(CP + exits)
ONS UKeconomy
benchmark
EBITDA/employee GVA/employee
7.2%
3.0%
0%
2%
4%
6%
8%
Total portfolio (CP + exits) Plc benchmark
6.1%
8.0%
4.9%
6.7%
0.5%
2.7%
1.8%
7.5%
3.1%
0.3%
–1.9%
2.0%
5.2%
–1.4%
2008 2009 2010 2011 2012 2013 2014
Y-o-y growth in capital productivity Y-o-y growth in GVA/employee
N 41 46 53 59 59 65 48
11 BVCA annual report on the performance of portfolio companies, VIII
Trading performance
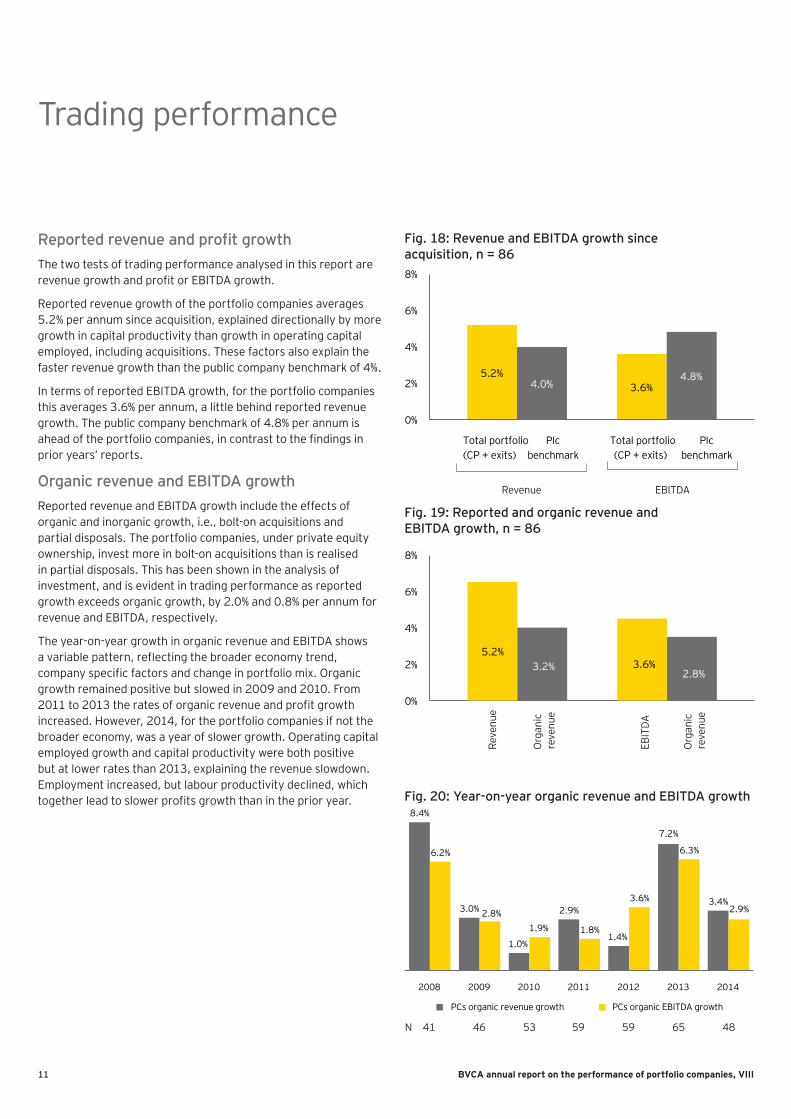
Reported revenue and profit growthThe two tests of trading performance analysed in this report are revenue growth and profit or EBITDA growth.
Reported revenue growth of the portfolio companies averages 5.2% per annum since acquisition, explained directionally by more growth in capital productivity than growth in operating capital employed, including acquisitions. These factors also explain the faster revenue growth than the public company benchmark of 4%.
In terms of reported EBITDA growth, for the portfolio companies this averages 3.6% per annum, a little behind reported revenue growth. The public company benchmark of 4.8% per annum is ahead of the portfolio companies, in contrast to the findings in prior years’ reports.
Organic revenue and EBITDA growthReported revenue and EBITDA growth include the effects of organic and inorganic growth, i.e., bolt-on acquisitions and partial disposals. The portfolio companies, under private equity ownership, invest more in bolt-on acquisitions than is realised in partial disposals. This has been shown in the analysis of investment, and is evident in trading performance as reported growth exceeds organic growth, by 2.0% and 0.8% per annum for revenue and EBITDA, respectively.
The year-on-year growth in organic revenue and EBITDA shows a variable pattern, reflecting the broader economy trend, company specific factors and change in portfolio mix. Organic growth remained positive but slowed in 2009 and 2010. From 2011 to 2013 the rates of organic revenue and profit growth increased. However, 2014, for the portfolio companies if not the broader economy, was a year of slower growth. Operating capital employed growth and capital productivity were both positive but at lower rates than 2013, explaining the revenue slowdown. Employment increased, but labour productivity declined, which together lead to slower profits growth than in the prior year.
Fig. 18: Revenue and EBITDA growth since acquisition, n = 86
Fig. 19: Reported and organic revenue and EBITDA growth, n = 86
Fig. 20: Year-on-year organic revenue and EBITDA growth
0%
2%
4%
6%
8%
Reve
nue
Org
anic
re
venu
e
Org
anic
re
venu
e
EBIT
DA5.2%
3.2% 3.6%2.8%
8.4%
3.0%
1.0%
2.9%
1.4%
7.2%
3.4%
6.2%
2.8%1.9% 1.8%
3.6%
6.3%
2.9%
2008 2009 2010 2011 2012 2013 2014
PCs organic revenue growth PCs organic EBITDA growth
N 41 46 53 59 59 65 48
5.2%4.0% 3.6%
4.8%
0%
2%
4%
6%
8%
Revenue EBITDA
Total portfolio(CP + exits)
Plcbenchmark
Total portfolio(CP + exits)
Plcbenchmark
12BVCA annual report on the performance of portfolio companies, VIII
Financial leverage
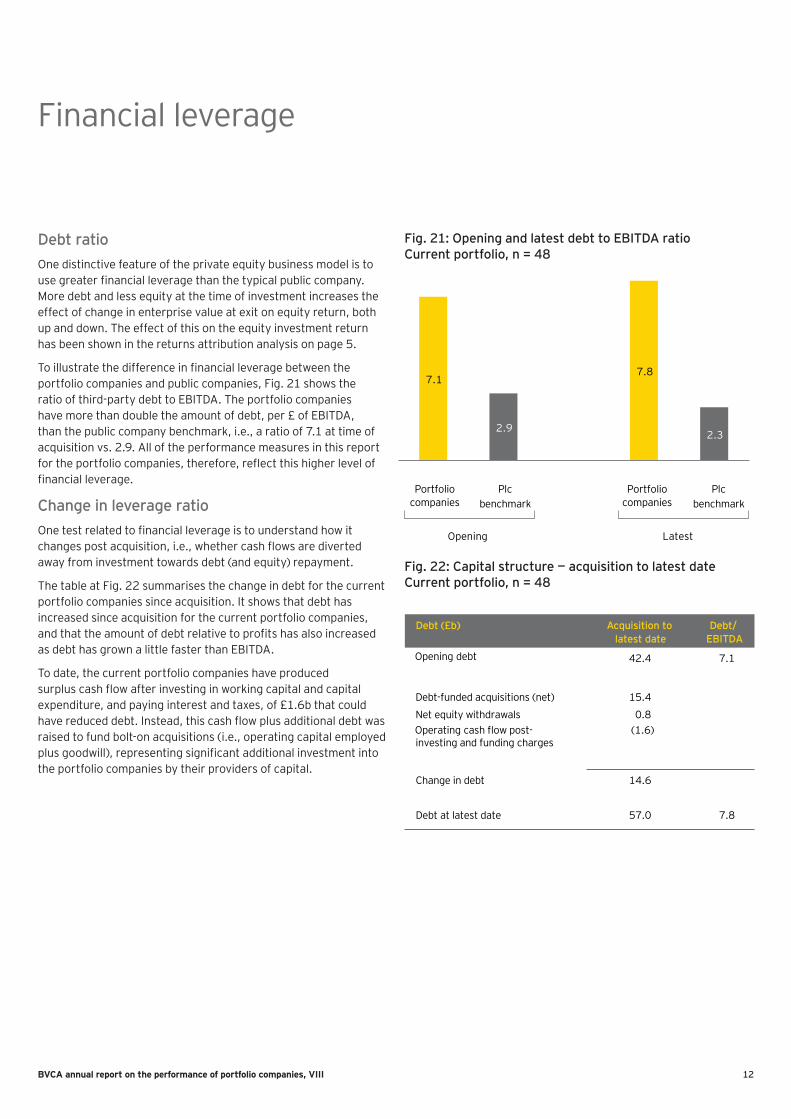
Debt ratioOne distinctive feature of the private equity business model is to use greater financial leverage than the typical public company. More debt and less equity at the time of investment increases the effect of change in enterprise value at exit on equity return, both up and down. The effect of this on the equity investment return has been shown in the returns attribution analysis on page 5.
To illustrate the difference in financial leverage between the portfolio companies and public companies, Fig. 21 shows the ratio of third-party debt to EBITDA. The portfolio companies have more than double the amount of debt, per £ of EBITDA, than the public company benchmark, i.e., a ratio of 7.1 at time of acquisition vs. 2.9. All of the performance measures in this report for the portfolio companies, therefore, reflect this higher level of financial leverage.
Change in leverage ratioOne test related to financial leverage is to understand how it changes post acquisition, i.e., whether cash flows are diverted away from investment towards debt (and equity) repayment.
The table at Fig. 22 summarises the change in debt for the current portfolio companies since acquisition. It shows that debt has increased since acquisition for the current portfolio companies, and that the amount of debt relative to profits has also increased as debt has grown a little faster than EBITDA.
To date, the current portfolio companies have produced surplus cash flow after investing in working capital and capital expenditure, and paying interest and taxes, of £1.6b that could have reduced debt. Instead, this cash flow plus additional debt was raised to fund bolt-on acquisitions (i.e., operating capital employed plus goodwill), representing significant additional investment into the portfolio companies by their providers of capital.
Fig. 21: Opening and latest debt to EBITDA ratio Current portfolio, n = 48
Fig. 22: Capital structure — acquisition to latest date Current portfolio, n = 48
7.1
2.9
7.8
2.3
Opening Latest
Portfoliocompanies
Portfoliocompanies
Plcbenchmark
Plcbenchmark
Acquisition to latest date
Debt/ EBITDA
Opening debt 7.1
15.4
42.4
0.8(1.6)Operating cash flow post-
14.6
57.0 7.8
Debt-funded acquisitions (net)
Net equity withdrawals
investing and funding charges
Change in debt
Debt at latest date
Debt (£b)

13 BVCA annual report on the performance of portfolio companies, VIII
Appendix A List of portfolio companies
Portfolio companies (on 31 December 2014)
Portfolio company GP(s)
Affinity Water Morgan Stanley, Infracapital
Airwave Solutions Macquarie
Ambassador Theatre Group Providence Equity, Exponent
Amdipharm Mercury (AMCo) Cinven
Annington Homes Terra Firma
Associated British Ports GS Capital, Infracapital, Borealis, GIC
Biffa Sankaty Advisors, Babson Capital Europe, Angelo Gordon, Avenue Capital
Birds Eye Iglo Permira
Brakes Group Bain Capital
British Car Auction Clayton Dubilier & Rice
Callcredit Information Group1 GTCR
Camelot Ontario Teachers’ Private Capital
Care UK Bridgepoint
CenterParcs Blackstone
Civica OMERS PE
D&G group CVC
David Lloyd Leisure TDR Capital
DFS Advent International
Edinburgh Airport Global Infrastructure Partners
Enserve Cinven
Equiniti Advent International
Eversholt Rail 3i, Morgan Stanley, STAR Capital
Expro Goldman Sachs
Fat Face Bridgepoint
Findus Group Lion Capital, Highbridge Capital, JP Morgan Chase
Fitness First Oaktree Capital, Marathon Capital
Four Seasons Health Care Terra Firma
Gala Coral Apollo, Cerberus, Park Square, York Capital Management
Gatwick Airport Global Infrastructure Partners
HC-One1 Safanad, Formation Capital
Portfolio company GP(s)
Host Europe Group Cinven
Integrated Dental Holdings Carlyle
John Laing Henderson
Keepmoat1 TDR Capital, Sun Capital
London City Airport Global Infrastructure Partners, Highstar Capital
Moto Macquarie
National Car Parks Macquarie
New Day Varde Partners
New Look Permira, Apax
Northgate Information Solutions KKR
Northgate Public Services1 Cinven
Odeon & UCI Cinemas Terra Firma
Osprey (AWG) 3i, Colonial First State Global Asset Management, Canadian Pension Plan Investment Board, Industry Funds Management
Pizza Express1 Hony Capital
Pret a Manger Bridgepoint
Priory Group Advent International
R&R Ice Cream PAI Partners
RAC Carlyle
South Staffordshire Water KKR
Stonegate Pub Company TDR Capital
TES Global (previously TSL Education)
TPG
Thames Water Macquarie
The Vita Group TPG
Top Right Group Apax
Trader Media Apax
Travelodge Goldman Sachs, Golden Tree Asset Management, Avenue Capital Group
Virgin Active CVC
Viridian Group Arcapita
Voyage Healthcare1 Partners Group, Duke Street, Tikehau
Vue Cinemas OMERS PE
World Pay Advent International, Bain Capital
Village Urban Resorts1 KSL Capital
14BVCA annual report on the performance of portfolio companies, VIII
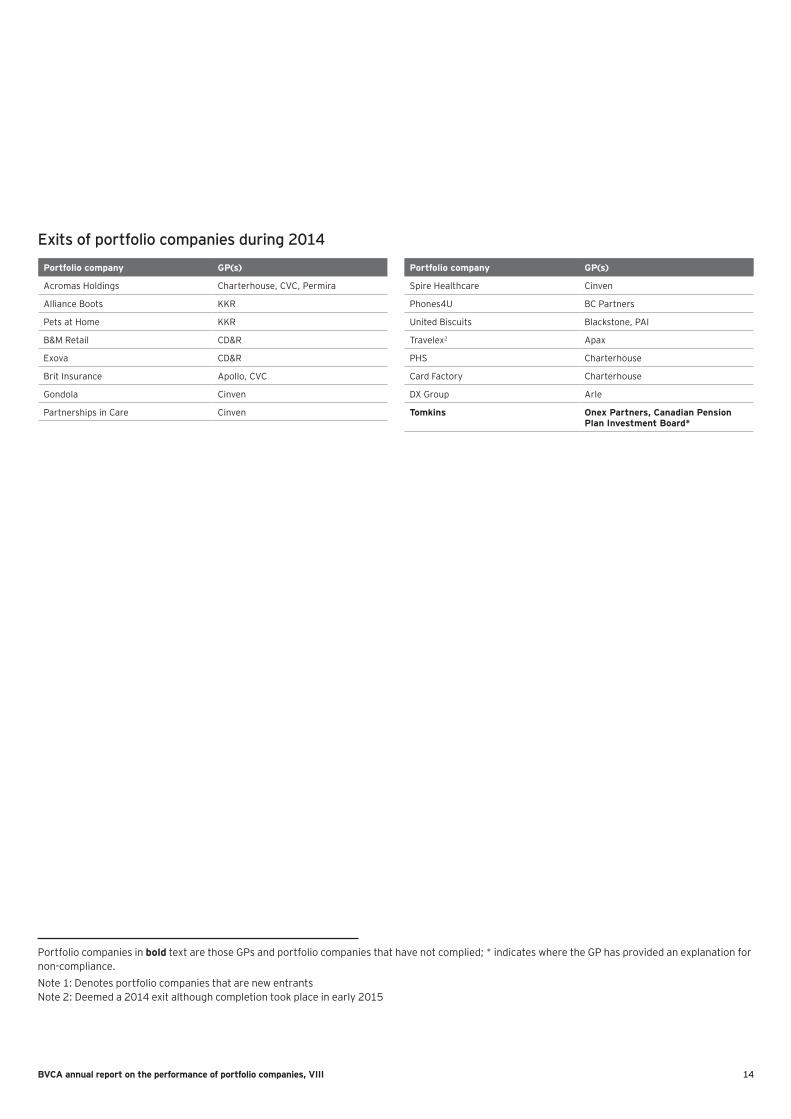
Exits of portfolio companies during 2014
Portfolio company GP(s)
Acromas Holdings Charterhouse, CVC, Permira
Alliance Boots KKR
Pets at Home KKR
B&M Retail CD&R
Exova CD&R
Brit Insurance Apollo, CVC
Gondola Cinven
Partnerships in Care Cinven
Portfolio companies in bold text are those GPs and portfolio companies that have not complied; * indicates where the GP has provided an explanation for non-compliance.Note 1: Denotes portfolio companies that are new entrants Note 2: Deemed a 2014 exit although completion took place in early 2015
Portfolio company GP(s)
Spire Healthcare Cinven
Phones4U BC Partners
United Biscuits Blackstone, PAI
Travelex2 Apax
PHS Charterhouse
Card Factory Charterhouse
DX Group Arle
Tomkins Onex Partners, Canadian Pension Plan Investment Board*
15 BVCA annual report on the performance of portfolio companies, VIII
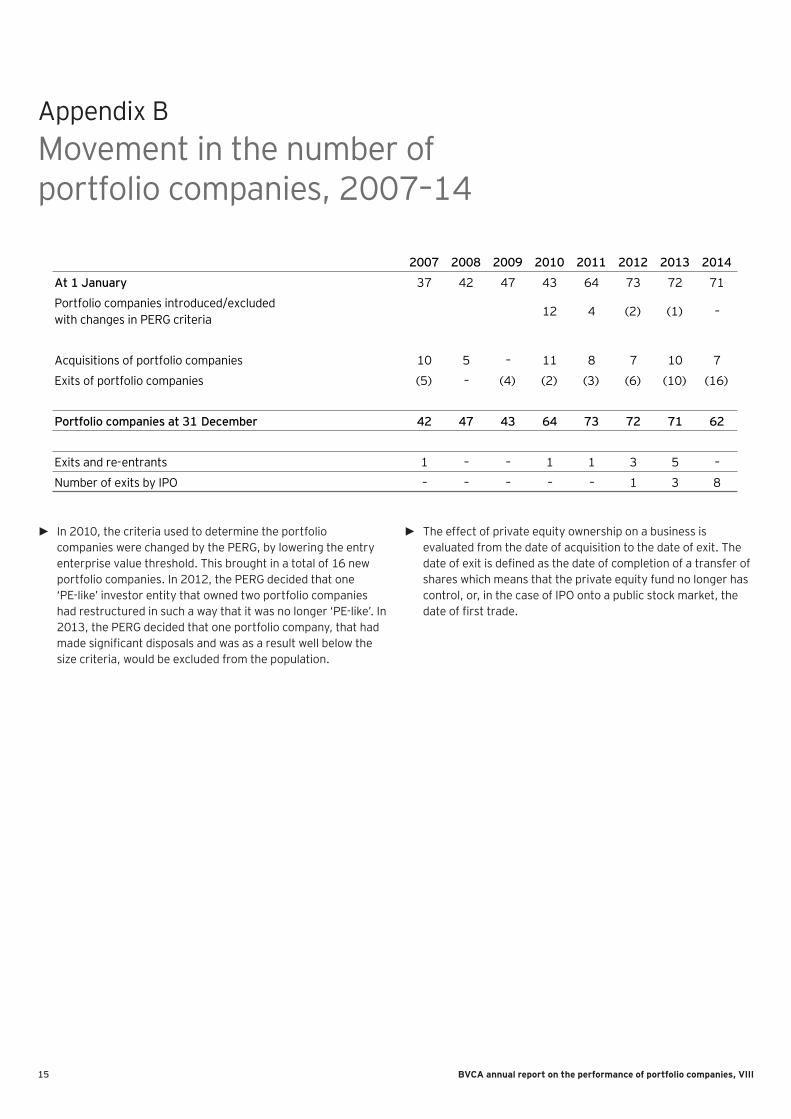
Appendix B Movement in the number of portfolio companies, 2007–14
► In 2010, the criteria used to determine the portfolio companies were changed by the PERG, by lowering the entry enterprise value threshold. This brought in a total of 16 new portfolio companies. In 2012, the PERG decided that one ‘PE-like’ investor entity that owned two portfolio companies had restructured in such a way that it was no longer ‘PE-like’. In 2013, the PERG decided that one portfolio company, that had made significant disposals and was as a result well below the size criteria, would be excluded from the population.
► The effect of private equity ownership on a business is evaluated from the date of acquisition to the date of exit. The date of exit is defined as the date of completion of a transfer of shares which means that the private equity fund no longer has control, or, in the case of IPO onto a public stock market, the date of first trade.
2007 2008 2009 2010 2011 2012 2013 2014
At 1 January 37 42 47 43 64 73 72 71
Portfolio companies introduced/excludedwith changes in PERG criteria
12 4 (2) (1) –
Acquisitions of portfolio companies 10 5 – 11 8 7 10 7
Exits of portfolio companies (5) – (4) (2) (3) (6) (10) (16)
Portfolio companies at 31 December 42 47 43 64 73 72 71 62
Exits and re-entrants 1 – – 1 1 3 5 –
Number of exits by IPO – – – – – 1 3 8
16BVCA annual report on the performance of portfolio companies, VIII
Appendix C Report objectives and definitions
Report objectivesThis study by the BVCA, and its appointed advisor EY, reports on the performance of the large, UK businesses owned by private equity firms that meet the criteria determined by the PERG (formerly the Guidelines Monitoring Group) — the portfolio companies. It forms part of the actions implemented by the private equity industry to enhance transparency and disclosure.
The objective of this annual report is to present independently prepared information on the performance of portfolio companies during their period of ownership by private equity investors. By aggregating information on the businesses that meet a defined set of criteria at the time of their acquisition, there is no selectivity or performance bias in the resulting data set. This is the most accurate way of understanding what happens to businesses under private equity ownership. For example:
► What growth rates are achieved by private equity-owned businesses?
► How does private equity ownership affect employment, particularly in the UK?
► How do private equity-owned businesses perform on employment cost, pensions and productivity?
► Do businesses owned by private equity investors invest in capital expenditure?
► Is there evidence of acquisitions and/or asset disposals under private equity ownership? How do such acquisitions and disposals affect overall performance in trading, employment and investing?
The findings of this report are a unique source of information to inform the broader business, regulatory and public debate on the impact of private equity ownership, by evidencing if and how its distinctive features (including investment selection, governance, incentives and financial leverage) affect the performance of large, UK businesses.
Definition of portfolio companiesA portfolio company, as defined for this report, meets the criteria set out by the PERG. A portfolio company, at the time of its acquisition, was:
► ‘ Acquired by one or more private equity firms in a public to private transaction where the market capitalisation together with the premium for acquisition of control was in excess of £210m, and either more than 50% of revenues were generated in the UK or UK employees totalled in excess of 1,000 full-time equivalents’; or
► ‘ Acquired by one or more private equity firms in a secondary or other non-market transaction where enterprise value at the time of the transaction is in excess of £350m, and either more than 50% of revenues were generated in the UK or UK employees totalled in excess of 1,000 full-time equivalents’; and where
► Private equity firms are those authorised by the FSA that manage or advise funds that own or control portfolio companies, or are deemed after consultation on individual cases by the GMG to be ‘private equity like’ in terms of their remit and operations
The companies, and their investors, that meet the criteria were determined by the BVCA, and approved by the PERG. As in prior years, the investee companies that volunteered to comply with the guidelines, but did not meet all of the criteria at acquisition, are excluded from this report.
Private equity firms were requested to complete a data template, specified by the BVCA and EY, for each of their portfolio companies, for the purposes of preparing this report. This year the data template was extended to capture additional data on employment, including employment by salary band and the use of zero-hours contracts.
17 BVCA annual report on the performance of portfolio companies, VIII
Appendix D Methodology
ProcessThe approach to producing the ‘annual report on the performance of portfolio companies’ has been debated and agreed with the BVCA and the PERG.
EY contacted the private equity firms in July 2015 and requested a standard data template to be completed for each portfolio company. For exits, the same data template was updated for the final year of private equity ownership, as well as data required to complete the returns attribution analysis. Completion of the data template drew on information available in company accounts, and further information that was prepared from portfolio company and private equity firm sources. This data further enabled analysis, inter alia, of the impact of acquisitions and disposals, and movements in pension liabilities and assets.
The data returned to EY was checked for completeness, and iterated with the private equity firms as required. EY undertook independent checks on a sample of the returns against published company accounts. This found no material discrepancies. Data gathering was completed in November 2015.
Measuring performanceThe data set is built up from the individual companies under their period of ownership by private equity investors. In total, there are 62 current portfolio companies and a further 56 portfolio companies that have been exited since 2005:
The maximum number of data points that can be drawn from the data set depends on the type of performance measure.
► Change in the value of trading and other measures, including revenue, profit, organic employment, capital expenditure and cash flow, require full year comparison with full prior year (to avoid the error inherent in annualising partial year figures), and the provision of additional data beyond annual accounts. These measures can be determined for 86 of portfolio companies, comprising 48 current portfolio companies (62 less 7 non-compliers, less 7 for whom year-on-year performance is not available — 8 in the case of organic employment), and 38 exits (56 in total less five non-compliers, less 12 exits 2005–7 for whom this detailed information was not requested, less one in 2014 who did not provide all the data requested).
► Year-on-year growth figures include, in each year, all current portfolio companies for whom the information is available, and also the results of portfolio companies that exited in that year if the majority of their trading was under PE ownership.
► Data to calculate returns attribution has been provided for 51 of the 56 portfolio companies that were exited over the period 2005–14.
Publicly listed benchmarksThe public company benchmarks are drawn from the 646 primary listed companies on the LSE to 31 December 2014, from which 363 companies are excluded for the purposes of this report:
► 292 equity investment trusts, OEICs and other financial or non-comparable sector entities (e.g., real estate investment and services, real estate investment trusts, banks, equity and non-equity investment instruments).
► 42 companies were excluded because their market capitalisation was less than £210m, the size threshold for take-privates in the GMG criteria.
► 27 companies were excluded because their market capitalisation was greater than £11b (the market capitalisation of the largest portfolio company over the period of this study).
This results in 283 public companies in the benchmark group.
For the sector-weighted public benchmark, public company data is aggregated at an industry group level — as defined by the Global Industry Classification Standard — and then matched to individual portfolio companies. The aggregate result is then weighted by the sector mix of the portfolio companies.
Changes in benchmarking methodologyThis year, we have reviewed many aspects of the approach, in particular with regards to the selection and calculation of benchmarks. This has led to a number of changes compared to prior years’ reports that are summarised below:
► Public company benchmarks are now based on primary listings on the LSE. This removed a large number of businesses with secondary listings, many of whom trade outside the UK.
► Certain ONS figures for employment and compensation were altered to present the UK private sector, vs. the UK economy as a whole.
As in prior years, we note that there are limitations in the selection of appropriate benchmarks. These include, but are not limited to:
► Reported figures include the effect of acquisitions and disposals, which for public companies in aggregate, it is not possible to separately analyse.
► The mapping of companies to Global Industry Classification Standard groups is important to take account of differential trends at the sector level. However, the mapping is high level

18BVCA annual report on the performance of portfolio companies, VIII
Returns attributionThe ‘returns attribution’ calculation analyses the gross equity multiple (equity realised divided by equity invested, before all fees and charges), into three components:
1. Additional leverage: The effect on equity multiple of the additional leverage PE firms place on a company above the average public company sector levels:
► Adjusted deal returns are calculated by adjusting the capital structure to match average leverage levels of LSE sector benchmarks. The adjusted capital structure takes into account interest savings over the holding period as well as the changes in net debt that took place during ownership.
► In addition, any leveraged dividends received by equity investors are moved to the date of exit, and the exit capital structure adjusted for dividends.
► The difference between original deal equity multiple and the adjusted equity multiple is the benefit of additional leverage.
and may be inaccurate for any individual portfolio company. By contrast, more specific sector mapping reduces the size of the benchmark group.
► For some figures, e.g., employment, the definitions captured in the LSE company databases may not be wholly consistent with the definitions adopted in our data gathering.
2. Public stock market return: The total shareholder return (TSR) earned in the LSE sector over the same time frame as the private equity investment:
► The TSR is calculated using public stock market indices. TSR captures the effects of sector earnings growth, multiple changes and dividend payments.
► The public stock market return is converted into an equivalent equity multiple figure and applied to a deal return that has equivalent capital structure after the adjustment for additional leverage.
3. PE strategic and operational improvement: The component of equity multiple that relates to above benchmark performance:
► The component of the equity multiple for PE strategic and operational improvement is calculated by subtracting the public stock market return from the equity multiple adjusted for additional leverage.
ContactsBVCAJoe Steer Tel: + 44 20 7492 0416
Gurpreet Manku Tel: + 44 20 7492 0454
EYHarry Nicholson Tel: + 44 20 7951 5707
Theo Wieder Tel: + 44 20 7951 1646
EY contacts

EY | Assurance | Tax | Transactions | Advisory
About EYEY is a global leader in assurance, tax, transaction and advisory services. The insights and quality services we deliver help build trust and confidence in the capital markets and in economies the world over. We develop outstanding leaders who team to deliver on our promises to all of our stakeholders. In so doing, we play a critical role in building a better working world for our people, for our clients and for our communities. EY refers to the global organization, and may refer to one or more, of the member firms of Ernst & Young Global Limited, each of which is a separate legal entity. Ernst & Young Global Limited, a UK company limited by guarantee, does not provide services to clients. For more information about our organization, please visit ey.com.
How EY’s Global Private Equity Sector can help your business Value creation goes beyond the private equity investment cycle to portfolio company and fund advice. EY’s Global Private Equity Sector offers a tailored approach to the unique needs of private equity funds, their transaction processes, investment stewardship and portfolio companies’ performance. We focus on the market, sector and regulatory issues. If you lead a private equity business, we can help you meet your evolving requirements and those of your portfolio companies, from acquisition to exit, through a Global Private Equity network of 5,000 professionals around the world. Working together, we can help you meet your goals and compete more effectively.
© 2016 EYGM Limited. All Rights Reserved.
EYG No. FR0174
45145.indd (UK) 01/16. Artwork by Creative Services Group Design.
ED None
In line with EY’s commitment to minimize its impact on the environment, this document has been printed on paper with a high recycled content.
This material has been prepared for general informational purposes only and is not intended to be relied upon as accounting, tax, or other professional advice. Please refer to your advisors for specific advice.
ey.com