Embed Size (px)
Citation preview

A s c h a n g e a c c e l e r a t e s , h o w c a n m e d t e c h s m o v e a h e a d a n d s t a y t h e r e ?P u l s e o f t h e i n d u s t r y 2 0 1 7e y . c o m / v i t a l s i g n s

2 EY | Pulse of the industry
As the pace of change accelerates, how can medtechs move ahead and stay there? Answering this question is a strategic imperative for medical technology companies no matter their size. In 2017, the velocity and scope of technological innovation are blurring the lines between medicine and technology, redefining traditional medtech and fundamentally altering business models.
Decision-making power continues to shift away from device companies to other stakeholders even as technology companies and digital entrants encroach on traditional medtech territory. As a result, the supply and demand sides of medtech businesses are being disrupted. To remain competitive in this new health care economy, device makers must embrace customer-centric, data-driven strategies. Platforms that combine individual medtech products and services into holistic care solutions underpin this transformation, which EY terms the Life Sciences 4.0 business model.
In EY’s 11th annual Pulse of the industry report, we document the dynamic and competitive medtech playing field and discuss the strategies that companies can employ as they seek an inside track to growth. The good news is medical technology companies appear well-placed to play a central role in the digital, customer-focused health care ecosystem that is emerging.
Emphasis in prior years on capital efficiency, therapeutic focus and delivering better health outcomes means many of the industry’s commercial leaders are now delivering strong top-line and bottom-line growth. Meanwhile, smaller companies, and their increasingly savvy investors, have enjoyed several years of robust public and private financing. As a result, they have — for now — sufficient funds to develop tomorrow’s new medtech innovations. Importantly, the globalization of capital means new sources of financing are emerging, particularly in Asia, which medtechs can also tap for future needs.
For continued success, medtechs will need to forge partnerships with a range of stakeholders, including payers and providers. Device companies will also need to invest in new technologies such as additive manufacturing and artificial intelligence, as well as new capabilities such as behavioral science and data analytics. But if they make the right technological investments and strike the right partnerships, medtechs will find new ways to build sustainable businesses that create value for themselves and other members of the health care ecosystem.
Identifying strategies to move forward — and stay there — is never easy. As medtechs continue to adapt their business strategies, EY continues to track the pulse of the industry. Connect with us at our digital home, Vital Signs (ey.com/VitalSigns) and via social media through our Twitter feed (@EY_LifeSciences).
Connect with us!
@EY_LifeSciences
ey.com/vitalsigns
Pamela SpenceGlobal Life Sciences Industry LeaderErnst & Young Global Limited
John BabittLife Sciences Transaction Advisory Services Partner Ernst & Young LLP
Lucien De BusscherLife Sciences Advisory Partner Ernst & Young Special Business Services CVBA
James WelchLife Sciences Advisory PartnerErnst & Young LLP
Pulse of the industryMedical technology report 2017

3EY | Pulse of the industry
04 Year in review
16 Creating a framework for future medtech innovation
20 How the genius of technology is transforming health care
22 Investing in China for the long term
24 Medtech innovation for an aging world
26 The operating room of the future
28 How MDR and IVDR are reshaping Europe’s medtech industry
30 Europe’s medical device regulation: looking beyond compliance
32 Securing the future for medical devices
34 Financial performance
52 Financing
72 Building value through creative deal structures
74 Mergers & acquisitions
86 Looking beyond China to create a global IVD company
88 Appendix
Contents

4 EY | Pulse of the industry
M e d t e c h s s e e k t h e i n s i d e t r a c k
Year in review
I n o u r 2 0 1 6 Pulse of the industry r e p o r t , w e h i g h l i g h t e d a m e d t e c h i n d u s t r y i n t r a n s i t i o n . I n 2 0 1 7 , t h e i n d u s t r y d e m o n s t r a t e s r e s i l i e n c e a n d a g i l i t y e v e n a s t h e p a c e o f c h a n g e a c c e l e r a t e s o n t e c h n o l o g i c a l , r e i m b u r s e m e n t a n d r e g u l a t o r y f r o n t s a n d n e w d i g i t a l l y b a s e d o p e r a t i n g m o d e l s s h i f t p o w e r t o c o n s u m e r s .
A s K la us S c hw a b , F ounder a nd E x ec utiv e C ha irm a n of the W orld E c onom ic F orum , desc rib es in the b ook The Fourth Industrial Revolution, the v eloc ity a nd sc op e of innov a tion is “ b lurring the lines b etw een the p hysic a l, dig ita l a nd b iolog ic a l sp heres. ”
F or m edtec h c om p a nies, this c onv erg enc e funda m enta lly a lters b usiness m odels, a s dec ision- m a k ing p ow er shifts a w a y from m a nufa c turers to other hea lth c a re sta k eholders. T o rem a in c om p etitiv e w hen b oth the sup p ly a nd dem a nd sides of their b usinesses
a re b eing disrup ted, dev ic e m a k ers need to ev olv e from b eing p roduc t-c entric to c ustom er- c entric , w ith a n em p ha sis on the sea m less c a p ture a nd c om m unic a tion of rea l- w orld da ta . Pla tform s tha t c om b ine indiv idua l m edtec h p roduc ts a nd serv ic es into holistic c a re solutions underp in this tra nsform a tion, w hic h E Y term s the L ife S c ienc es 4 . 0 b usiness m odel.
A s w e w rite in this yea r’ s rep ort, the shift to p la tform s a nd L ife S c ienc es 4 . 0 is a lrea dy underw a y. M a ny m edtec hs ha v e a lrea dy em b ra c ed dig ita l
stra teg ies a nd a re in the p roc ess of a lig ning their c om m erc ia l org a niz a tions to deliv er m ea ning ful outc om es a nd system im p rov em ents to end users.
I n the c om ing p a g es, w e a lso rev iew the medical device industry’s financial p erform a nc e in 2 0 1 6 – 1 7 . I n our a na lysis, w e hig hlig ht the top trends and issues and put the financial metrics in c ontex t a s tra ditiona l m edtec h innov a tion a nd b usiness m odels c ontinue their tra nsform a tions.

5EY | Pulse of the industry
S t r o n g r e s u l t s The medtech industry delivered strong results even as it continued to adapt to rapid technological change, rising reimbursement, regulatory and legislative uncertainty, and increasing customer expectations.
S h i f t i n g m o d e l s Business models continue to shift, as product-centric innovations and services are combined to create holistic platforms that increase shareholder value by enhancing the customer experience.
C o l l a b o r a t i o n m a n d a t e To access the necessary skills to create relevant care platforms, medtechs must collaborate with a range of stakeholders, including digital entrants, technology companies, payers and providers.

6 EY | Pulse of the industry
Year in review
I t’ s too soon to sa y if these da ta p oints sug g est a la sting turna round or a re sim p ly a one- yea r a nom a ly. R eg a rdless, the p ositiv e results sug g est tha t the m edtec h industry’ s long - term g row th strategies are finally starting to deliver results — a t lea st for som e c om p a nies.
I m p orta ntly, the 2 0 1 6 up tic k in rev enue g row th w a s driv en a lm ost entirely b y a c q uisitions desig ned to p rov ide thera p eutic foc us a s w ell a s c om m erc ia l sc a le. F or the p a st sev era l
yea rs, dev ic e m a k ers ha v e b een under p ressure to dep loy c a p ita l m ore efficiently. That pressure continued in 2 0 1 6 – 1 7 , a s m edtec hs c ontinued to seek new solutions to a ddress their p roduc tiv ity c ha lleng es a nd a tig htening reim b ursem ent c lim a te. I n the nea r term , this foc us ha s tra nsla ted into inc rea sed inorg a nic a c tiv ity a s m edtec hs rec og niz e tha t a c q uisitions tha t b uild end- to- end c a p a b ilities in a p a rtic ula r thera p eutic a rea or ex p a nd the c om p a ny’ s g eog ra p hic or tec hnolog ic a l rea c h a re one of the fa stest p a ths to g row th.
N ota b ly, 8 of the industry’ s 6 1 p ure p la y c om m erc ia l lea ders ea c h b olstered its top line b y m ore tha n U S $ 5 0 0 m illion, a nd 6 of those 8 did so v ia M & A . A b sent those dea ls, rev enue g row th a t m a ny of these top c om p a nies w ould ha v e b een in the p edestria n sing le dig its. T ha t’ s not to sa y org a nic g row th didn’ t c ontrib ute to m edtec h rev enue g row th. S tryk er, Boston Scientific, Medtronic and E dw a rds L ifesc ienc es w ere a m ong the
c om p a nies dem onstra ting tha t foc used R & D inv estm ent c ould not only ex tend p roduc t fra nc hises b ut a lso result in positive financial metrics.
A fter a p rolong ed p eriod of m edtec h dea lm a k ing , w e a lso see a c ontinued em p ha sis on p ortfolio op tim iz a tion. D iv estitures a nd sp in- outs a llow m edtec hs to c a p ture a dditiona l v a lue b y improving capital efficiency, reducing op era tiona l c om p lex ity a nd rea lloc a ting c a p ita l to hig her- g row th b usinesses a s the industry inv ests m ore R & D dolla rs in the dev elop m ent of innov a tiv e p roduc ts tha t dem onstra te v a lue in a n era of p ric e p ressures.
I ndeed, A b b ott’ s sa le of its op htha lm ic b usiness to J ohnson & J ohnson, M edtronic ’ s sa le of its m edic a l sup p lies b usiness to C a rdina l H ea lth a nd J ohnson & J ohnson’ s div estiture of C odm a n N eurosurg ery to I nteg ra LifeSciences suggest capital efficiency a nd p ortfolio op tim iz a tion w ill b e a n ong oing trend in 2 0 1 8 .
U n d e r s t a n d i n g the key financial i n d i c a t o r sW h a t s t r a t e g i e s s h o u l d m e d t e c h s a d o p t f o r p e a k p e r f o r m a n c e a s t h e p a c e o f c h a n g e a c c e l e r a t e s ?
A f t e r a d i s a p p o i n t i n g 2 0 1 5 , w h e n r e v e n u e c o n t r a c t e d 3 % a n d n e t i n c o m e d r o p p e d 1 5 % , t h e o v e r a l l m e d t e c h i n d u s t r y g e n e r a t e d U S $ 3 6 4 . 4 b i l l i o n i n r e v e n u e a n d i t s b e s t y e a r - o n - y e a r g r o w t h s i n c e t h e global financial crisis of 2008. In aggregate, medtechs in the US and Europe expanded their top line 5 % i n 2 0 1 6 a n d g r e w t h e i r t o t a l b o t t o m l i n e 1 7 % .
T he p ositiv e results sug g est tha t the m edtec h industry’ s long - term g row th stra teg ies a re finally starting to deliver results — a t lea st for som e c om p a nies.

7EY | Pulse of the industry
Year in review
H a v e s a n d h a v e n o t sT he m edtec h industry c ontinues to b e a n industry of “ ha v es” a nd “ ha v e nots, ” esp ec ia lly in term s of a c c ess to c a p ita l. I n b oth the U S a nd E urop e, the num b er of p ub lic m edtec hs w ith less tha n tw o yea rs of c a sh c ontinues to sw ell. M ea nw hile, the m a rk et for initia l p ub lic offering s w a sn’ t ex a c tly rob ust. E x c luding C onv a T ec ’ s m a ssiv e deb ut, medtech IPO financing in 2016–17 was m uc h m ore lik e the p re- b oom yea rs of 2 0 0 9 – 1 2 tha n the rec ent 2 0 1 3 – 1 5 heyda y. W hile it’ s still p ossib le for m edtec hs to g o p ub lic , g enera l inv estor
p a rtic ip a tion now req uires strong m a na g em ent tea m s a nd p roduc ts tha t a re not only on the m a rk et b ut dem onstra ting rev enue g row th. That’s a difficult bar to clear. It remains to b e seen w hether these inv estors w ill low er their ex p ec ta tions, c rea ting a n op p ortunity for I PO s to rea c h the heig hts a c hiev ed in rec ent yea rs.
T he unev en c a p ita l distrib ution a lso p la yed out on the p riv a te side. Priv a tely held m edtec hs ra ised nea rly U S $ 8 b illion in v enture c a p ita l in 2 0 1 6 – 1 7 , a new
rec ord a nd a n im p orta nt c a ta lyst for future innov a tion. H ow ev er, m ore tha n 2 5 % of tha t tota l w ent to j ust three m edtec hs: G ra il; G ua rda nt H ea lth; a nd V erily L ife S c ienc es, the life sc ienc es- a nd hea lth- foc used A lp ha b et sub sidia ry. M ov ing forw a rd, if the p ub lic m a rk ets g row ev en toug her a nd U S a nd E urop ea n v enture c a p ita lists ( V C s) b ec om e m ore c onserv a tiv e in their b ets, m a ny m ore ea rly- sta g e m edtec hs m a y b e c om p eting to a c c ess the sa m e p ool of c a p ita l.
T he g ood new s is tha t this c a p ita l p ool is ex p a nding g lob a lly. A s noted in “Medtech financing clears new heig hts” on p a g e 5 2 , c a p ita l c ontinues to flow from East to West as Asia-based investors look to finance US a nd E urop ea n m edtec hs, a s w ell a s innov a tiv e c om p a nies in their hom e m a rk ets. A rec ent dec ision b y the C hinese g ov ernm ent to p reserv e liq uidity in C hina m a y restric t c a p ita l outflow in the future. For now, however, these b a c k ers rep resent a n im p orta nt sourc e of a dditiona l funding for m edtec hs reg a rdless of w here they a re hea dq ua rtered. T he c a p ita l they p rov ide a llow s m edtec hs to a dv a nc e stra teg ic p riorities, esp ec ia lly a t a tim e w hen the public markets are more difficult to tap.
I n som e w a ys, 2 0 1 6 – 1 7 w a s b usiness a s usua l for the m edtec h industry. C ong lom era tes a nd p ure p la y c om p a nies na v ig a ted a g row ing a rra y of reg ula tory, reim b ursem ent a nd g eop olitic a l unc erta inties using their usua l c a p ita l a lloc a tion lev ers: dea lm a k ing , R & D inv estm ent a nd c a sh returned to sha reholders. M edtec hs a re fa c ed w ith the q uestion of w ha t step s to ta k e now to rea c h, or m a inta in, p ea k financial performance.
Capital raised by leading regions excluding debt, July 2016–June 2017
0 . 0
2 . 0
1 . 0
3 . 0
4 . 0
5 . 0
0 . 0 0 . 5 1 . 0 2 . 01 . 5 2 . 5 3 . 0 4 . 03 . 5
Venture capital raised (US$b)
Tota
l equ
ity
capi
tal r
aise
d (U
S$b)
B ub b le siz e show s rela tiv e num b er of fina nc ing s p er reg ion.
Source: EY, BMO Capital Markets, Dow Jones VentureSource and Capital IQ.
U S — N ew J ersey
U S — N orthern C a lifornia U KU S — S outhern C a lifornia
C hina U S — M a ssa c husettsI sra elF ra nc e
8 EY | Pulse of the industry
Year in review
Enabling i n n o v a t i o nA s t e c h n o l o g y t r a n s f o r m s m e d t e c h , w h i c h i n n o v a t i o n s p r o v i d e a l a s t i n g e d g e ?
0 4 03 02 01 0 5 0
PMA approvals for medical devices, 2004–17
* T hroug h 3 1 J uly 2 0 1 7
Source: FDA website, includes only originals.
Number of approvals
2 0 0 4
2 0 0 5
2 0 0 6
2 0 0 7
2 0 0 8
2 0 0 9
2 0 1 0
2 0 1 1
2 0 1 2
2 0 1 3
2 0 1 4
2 0 1 5
2 0 1 6
2 0 1 7 *
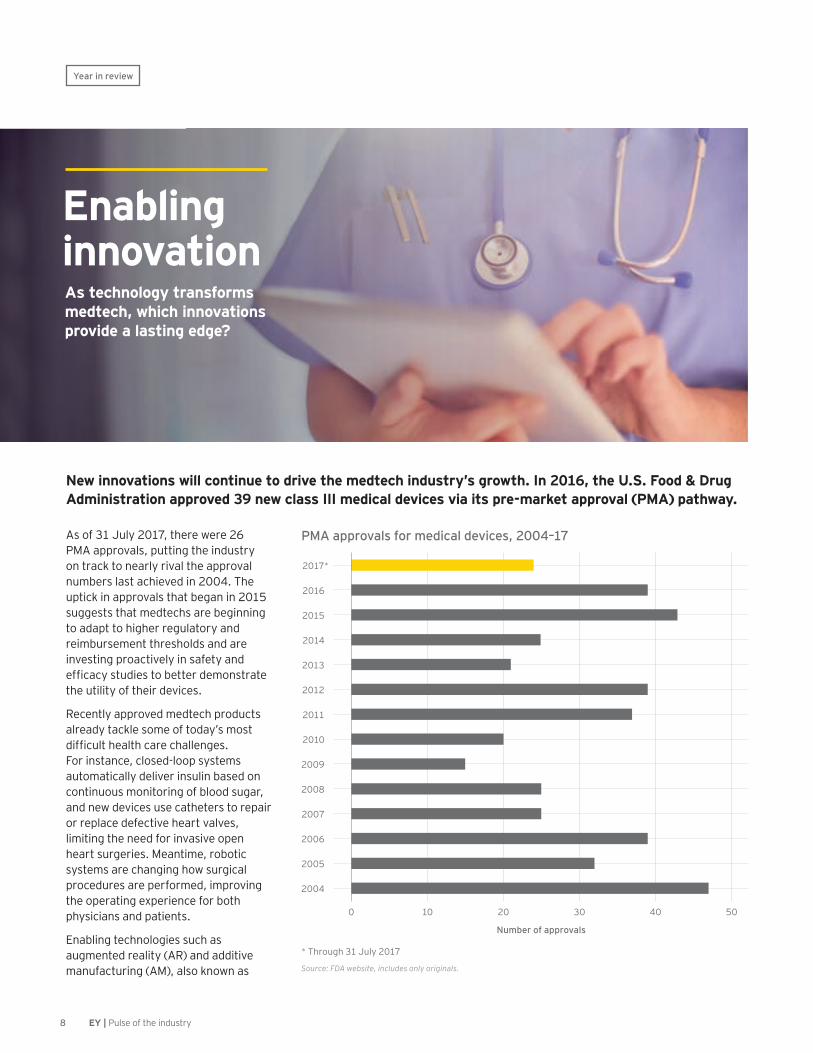
N e w i n n o v a t i o n s w i l l c o n t i n u e t o d r i v e t h e m e d t e c h i n d u s t r y ’ s g r o w t h . I n 2 0 1 6 , t h e U . S . F o o d & D r u g A d m i n i s t r a t i o n a p p r o v e d 3 9 n e w c l a s s I I I m e d i c a l d e v i c e s v i a i t s p r e - m a r k e t a p p r o v a l ( P M A ) p a t h w a y .
A s of 3 1 J uly 2 0 1 7 , there w ere 2 6 PM A a p p rov a ls, p utting the industry on tra c k to nea rly riv a l the a p p rov a l num b ers la st a c hiev ed in 2 0 0 4 . T he up tic k in a p p rov a ls tha t b eg a n in 2 0 1 5 sug g ests tha t m edtec hs a re b eg inning to a da p t to hig her reg ula tory a nd reim b ursem ent thresholds a nd a re inv esting p roa c tiv ely in sa fety a nd efficacy studies to better demonstrate the utility of their dev ic es.
R ec ently a p p rov ed m edtec h p roduc ts a lrea dy ta c k le som e of toda y’ s m ost difficult health care challenges. F or insta nc e, c losed- loop system s a utom a tic a lly deliv er insulin b a sed on c ontinuous m onitoring of b lood sug a r, a nd new dev ic es use c a theters to rep a ir or rep la c e defec tiv e hea rt v a lv es, lim iting the need for inv a siv e op en hea rt surg eries. M ea ntim e, rob otic system s a re c ha ng ing how surg ic a l p roc edures a re p erform ed, im p rov ing the op era ting ex p erienc e for b oth p hysic ia ns a nd p a tients.
E na b ling tec hnolog ies suc h a s a ug m ented rea lity ( A R ) a nd a dditiv e m a nufa c turing ( A M ) , a lso k now n a s

9EY | Pulse of the industry
Year in review
3 - D p rinting , a re further ex p a nding the a rt of the p ossib le. A M , for insta nc e, ha s a n im p orta nt role to play in the development of specific a na tom ic a l m odels tha t a llow surg eons to p ra c tic e c om p lic a ted p roc edures p rior to op era ting on p a tients. A nd the tec hnolog y is a lrea dy b eing used to m a k e m ore c om p lex orthop edic dev ic es tha t offer som e deg ree of c ustom iz a tion for p a tient a na tom y. A m ong tra ditiona l m edtec hs, S tryk er ha s inv ested hea v ily in A M , b uilding a dedic a ted fa c ility in I rela nd to c rea te c om p onents for sev era l sp ine a nd j oint rep la c em ent p roduc ts.
M ea nw hile, S tryk er, B . B ra un a nd other m edtec hs a re interested in using A R to im p rov e the p rec ision a nd outc om es of surg eries. O v er the nex t tw o yea rs, one m a j or trend w ill b e “ sm a rt” op era ting room s tha t j ux ta p ose rea l- tim e a na tom ic a l inform a tion w ith a v a riety of other typ es of da ta . ( S ee “ T he op era ting room of the future” b y J ens v on L a c k um a nd B oris H ofm a nn. )
W ha t c onstitutes m edtec h innov a tion c ontinues to ev olv e. T ec hnolog ic a l a dv a nc es in sensors, c oup led w ith advances in artificial intelligence (AI), are broadening the definition of m edtec h to inc lude dig ita l p roduc ts a nd da ta - driv en serv ic es. G iv en this c ontinued m a rc h of tec hnolog y, industry c onv erg enc e w ill c ontinue to a c c elera te, low ering b a rriers to entry for new entra nts, esp ec ia lly those tha t sp ec ia liz e in softw a re- b a sed or other c ustom er-foc used serv ic es.
T o thriv e in this era of ra p id a nd c ontinua l c ha ng e, m edtec hs m ust b uild flexible business models that balance inv estm ents in interna l R & D a nd ex terna l innov a tion. A s they set their b usiness p riorities, m edtec h senior ex ec utiv es should a sk them selv es w hic h R & D b ets w ill yield a la sting edg e.
W ha t c onstitutes m edtec h innov a tion c ontinues to ev olv e. T ec hnolog ic a l a dv a nc es in sensors, c oup led w ith a dv a nc es in artificial intelligence (AI), a re b roa dening the definition of medtech to inc lude dig ita l p roduc ts a nd da ta - driv en serv ic es.

10 EY | Pulse of the industry
Year in review
P a r t n e r i n g w i t h n e w e n t r a n t sAs industries converge, does your next partner even exist yet?
M o r e a n d m o r e , p r o d u c t - c e n t r i c m e d t e c h i n n o v a t i o n s w i l l b e b u n d l e d w i t h s e r v i c e s a n d s o l u t i o n s , e n a b l i n g r e a l - t i m e p a t i e n t e n g a g e m e n t , r e m o t e m o n i t o r i n g a n d m o r e t a r g e t e d c a r e d e l i v e r y t o c r e a t e n e w c o m m e r c i a l m o d e l s .
T his p roduc t- to- serv ic es shift a nd the ev olution tow a rd “ sm a rt” devices will be further amplified by other shifts ha p p ening in the hea lth c a re ec onom y. T hese inc lude the c ontinued p ush to rew a rd v a lue instea d of v olum e a nd m eet inc rea sing c ustom er ex p ec ta tions, w hether those c ustom ers a re p a yers, p rov iders, or p a tients a nd their c a reg iv ers.
T o c rea te b eyond- the- p roduc t solutions, m edtec hs m ust a c c ess new c a p a b ilities. T ha t req uires c olla b ora tion w ith other org a niz a tions, p a rtic ula rly dig ita l hea lth p la yers a nd new tec hnolog y entra nts, w hic h a re w ell- c a p ita liz ed. ( B a sed on data from the venture capital firm Rock H ea lth, dig ita l hea lth c om p a nies ra ised a n estim a ted U S $ 3 . 5 b illion in 1 8 8 dea ls in the first six months of 2017.)
I n 2 0 1 6 – 1 7 , sig ns of the m edtec h industry’ s g row ing interest in c olla b ora tions w ith tec h a nd dig ita l p la yers c ontinued desp ite little direc t ev idenc e tha t these a llia nc es ha v e g enera ted a dditiona l m edtec h rev enue. I n the dia b etes sp a c e, for insta nc e, M edtronic ha s p a rtnered w ith I B M W a tson, Q ua lc om m a nd G look o to c rea te a n integ ra ted dia b etes m a na g em ent p rog ra m tha t a llow s p a tients to tra c k their b lood sug a r lev els a nd a utom a tic a lly rec eiv e a p p rop ria te thera p eutic doses of insulin. V erily L ife S c ienc es ha s form ed im p orta nt j oint v entures w ith J ohnson & J ohnson, Sanofi and GlaxoSmithKline in the
a rea s of dig ita l surg ery ( V erb S urg ic a l) , dia b etes m a na g em ent ( O nduo) a nd b ioelec tronic trea tm ents ( G a lv a ni) .
I n the future, m edtec hs m a y look to c rea te holistic c a re p la tform s tha t ev olv e from a disease- or technology-specific foc us to m a na g ing c om p lic a ted p a tients a c ross the c a re c ontinuum . S uc h p la tform s of c a re c ould a ssist p rov iders a nd p a yers w ith one of their m ost pressing issues: the efficient delivery of hig h- q ua lity, hig h- touc h c a re a c ross p op ula tions w ith m ultip le c o- m orb idities.
A s p op ula tions a round the g lob e a g e, the need for suc h c onsum er- foc used p la tform s is only g row ing m ore a c ute. B y 2 0 5 0 , the w orld’ s p op ula tion ov er 6 5 is ex p ec ted to trip le, a nd the c osts of trea ting c hronic disea ses w ill rea c h a n estim a ted U S $ 4 7 trillion. A s S tev en C ollens of M A T T E R notes in a n a c c om p a nying p ersp ec tiv e, “ W e ha v e dem oc ra tiz ed old a g e. T here a re num erous op p ortunities for tec hnolog ies to help p eop le liv e hea lthier, ev en a s they liv e long er. ” ( S ee “ M edtec h innov a tion in a n a g ing w orld. ” )
I n the future, m edtec hs m a y look to c rea te holistic c a re p la tform s tha t ev olv e from a disea se- or tec hnolog y-specific focus to managing c om p lic a ted p a tients a c ross the c a re c ontinuum . S uc h p la tform s of c a re c ould a ssist p rov iders a nd p a yers w ith one of their m ost p ressing issues.
11EY | Pulse of the industry
Year in review
I f struc tured c orrec tly, these em erg ing p la tform s w ill enha nc e the p a tient ex p erienc e a nd c rea te new rev enue op p ortunities for m edtec h. F or insta nc e, b y link ing b ig da ta c a p a b ilities w ith new k now ledg e from p rec ision m edic ine, it w ill b e p ossib le to c rea te p rec ision hea lth offering s tha t p rom ote p rev entiv e interv entions b efore sym p tom s of disea se m a nifest. T he g oa l is to use
dig ita l tools a nd sm a rt dev ic es to nudg e indiv idua ls w ith the rig ht p iec e of inform a tion, c ue or interv ention a t the ex a c t rig ht m om ent in tim e to m a inta in hea lth. S uc h resp onsiv e p la tform s w ill not only b e v a lua b le to indiv idua l p a tient c onsum ers. T hey w ill a lso b e v a lua b le to p rov iders a nd hea lth system s tha t a re reim b ursed a c c ording to the v a lue a nd q ua lity of the c a re they deliv er.
A s m edtec hs c ontinue to tra nsform their b usiness m odels to inc rea se c ustom er- c entric ity, the typ es of p a rtners they need to eng a g e w ill only ex p a nd. I n a sw iftly m ov ing m a rk et, k eep ing a b rea st of these p otentia l c olla b ora tors is c ritic a l a nd b eg s the q uestion: for future g row th, do the b est p a rtners ev en yet ex ist?
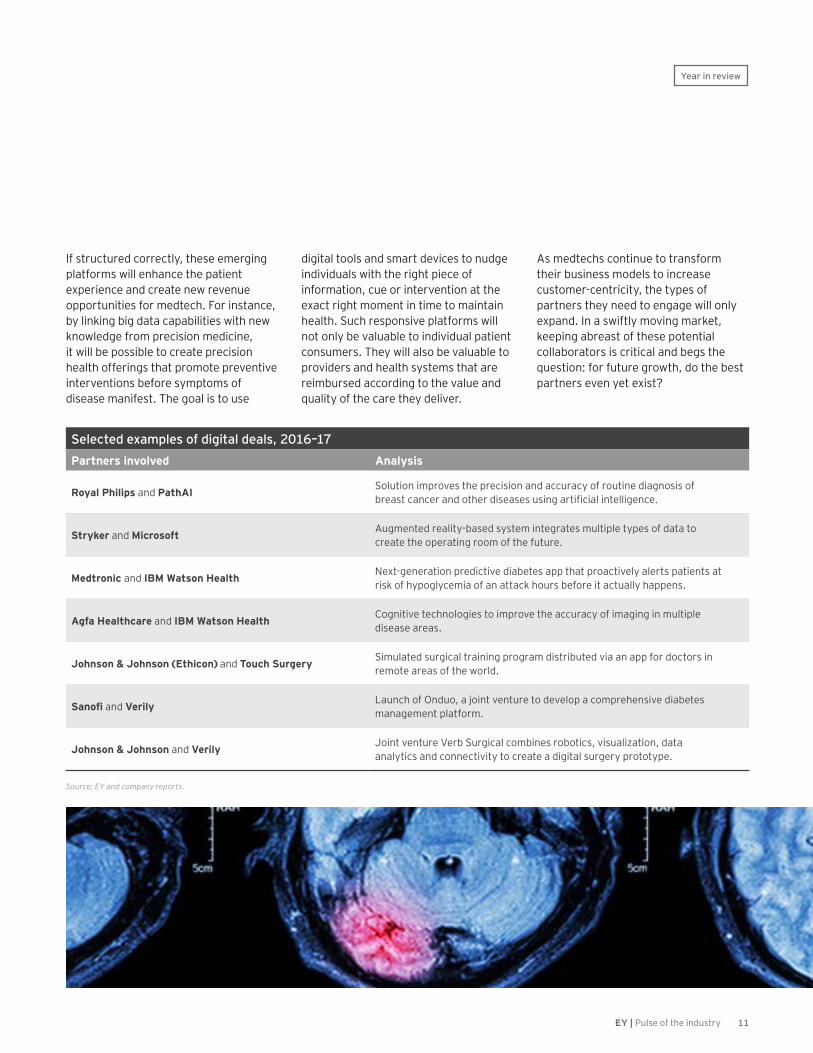
Selected examples of digital deals, 2016–17P a r t n e r s i n v o l v e d A n a l y s i s
R o y a l P h i l i p s a nd P a t h A I S olution im p rov es the p rec ision a nd a c c ura c y of routine dia g nosis of b rea st c a nc er a nd other disea ses using a rtific ia l intellig enc e.
S t r y k e r a nd M i c r o s o f t A ug m ented rea lity- b a sed system integ ra tes m ultip le typ es of da ta to c rea te the op era ting room of the future.
M e d t r o n i c a nd I B M W a t s o n H e a l t h N ex t- g enera tion p redic tiv e dia b etes a p p tha t p roa c tiv ely a lerts p a tients a t risk of hyp og lyc em ia of a n a tta c k hours b efore it a c tua lly ha p p ens.
A g f a H e a l t h c a r e a nd I B M W a t s o n H e a l t h C og nitiv e tec hnolog ies to im p rov e the a c c ura c y of im a g ing in m ultip le disea se a rea s.
Johnson & Johnson (Ethicon) a nd T o u c h S u r g e r y S im ula ted surg ic a l tra ining p rog ra m distrib uted v ia a n a p p for doc tors in rem ote a rea s of the w orld.
S a n o f i a nd V e r i l y L a unc h of O nduo, a j oint v enture to dev elop a c om p rehensiv e dia b etes m a na g em ent p la tform .
J o h n s o n & J o h n s o n a nd V e r i l y J oint v enture V erb S urg ic a l c om b ines rob otic s, v isua liz a tion, da ta a na lytic s a nd c onnec tiv ity to c rea te a dig ita l surg ery p rototyp e.
Source: EY and company reports.

12 EY | Pulse of the industry
Year in review
D e m o n s t r a t i n g v a l u eH o w c a n w e c r e a t e a g l o b a l p l a t f o r m t o s o l v e h e a l t h c a r e ’ s b i g g e s t c h a l l e n g e s ?
As Frans van Houten, CEO of Royal Philips, writes in an accompanying guest perspective, “Current i n c e n t i v e s y s t e m s r e w a r d t h e o l d w a y s o f w o r k i n g . ” H o w e v e r , a s p r e s s u r e g r o w s t o c o n t a i n h e a l t h c a r e c o s t s , p a y e r s a n d p r o v i d e r s a r e e m b r a c i n g v a l u e - b a s e d c a r e t h a t p r i o r i t i z e s o u t c o m e s o v e r t h r o u g h p u t .
T ha t shift to v a lue, m uc h lik e the tec hnolog ic a l shifts desc rib ed ea rlier, is direc tly a ffec ting m edtec h b usiness m odels. N ot only do m edtec hs need to dem onstra te the v a lue of their p roduc ts to a div erse g roup of sta k eholders, they m ust a lso sa tisfy v ery different — a nd som etim es conflicting — definitions of worth.
E nter v a lue fra m ew ork s, tools tha t a re desig ned to ob j ec tiv ely c om p a re the efficacy, side effects and costs of different p roduc ts. U ntil 2 0 1 7 , suc h tools w ere used p rim a rily to ev a lua te p ric ing a nd m a rk et a c c ess dec isions rela ted to b iop ha rm a c eutic a l p roduc ts. I n M a y 2 0 1 7 , the industry g roup A dv a M ed la unc hed its ow n v a lue fra m ew ork s, one for m edic a l dev ic es a nd a nother for dia g nostic s.
A c c ording to N a dim Y a red, c urrent c ha ir of A dv a M ed a nd C E O of C V R x , the tw o different a ssessm ent tools are designed to enable flexible, c om p rehensiv e determ ina tions of v a lue b a sed on da ta rela ted to c linic a l efficacy, cost and care delivery.
I ntended to b e used from the v ery b eg inning of the p roduc t dev elop m ent p roc ess, these v a lue fra m ew ork s a re “ b luep rints tha t w ill g uide c om p a nies’ da ta c ollec tion a nd funding stra teg ies, ” sa ys Y a red. ( F or m ore of Y a red’ s insig hts, see his p ersp ec tiv e “ C rea ting a fra m ew ork for future m edtec h innov a tion. ” )
Even with value frameworks, defining the v a lue of m edic a l p roduc ts is no ea sy ta sk , req uiring relev a nt, rea l- w orld da ta . T o c a p ture suc h da ta , m edtec hs need to c olla b ora te w ith p a yers a nd p rov iders. T hus, j ust a s w e ha v e seen a nec dota l ev idenc e of inc rea sed p a rtnering b etw een m edtec hs a nd dig ita l or tec h entra nts, in 2 0 1 6 – 1 7 w e ha v e a lso w itnessed dyna m ic p a rtnering b etw een m edtec hs a nd other hea lth c a re sta k eholders.
T hese c olla b ora tions c om e in sev era l v a rieties. S om e a re b roa d, m ulti-yea r p a rtnership s desig ned to help p rov iders a nd p a yers solv e funda m enta l c ha lleng es. T his inc ludes c rea ting c loud- b a sed serv ic es tha t a g g reg a te
disp a ra te m edic a l a nd c linic a l da ta for rea l- tim e a c c ess or m a na g em ent system s tha t sup p ort trea tm ent of c om p lic a ted hig h- risk p a tients. O thers a re m ore p roduc t- c entric but significantly alter how medtechs g et p a id, link ing reim b ursem ent to dem onstra ted outc om es.
W hether b roa d or na rrow in sc op e, these p a rtnership s a re funda m enta lly different from the tra nsa c tion- b a sed c ontra c ts m edtec hs ha v e c onstruc ted w ith p a yers or p rov iders in the p a st. T hese new p a rtnership s req uire m edtec hs to m a k e up - front inv estm ents a nd sha re risk a s m em b ers of a hea lth c a re ec osystem .
F or now , these p a rtnership s a re g enera lly one to one, b ut a s suc c esses m ount — either in im p rov em ents in c a re deliv ery or reduc tions in c ost — m edtec hs m ust b e p rep a red to p a rtner w ith other p la yers to c rea te c onsortia tha t help a nsw er this v ita l q uestion: how c a n different sta k eholders c om b ine forc es to c rea te p la tform s to solv e the c ha lleng es p a yers a nd p rov iders m ost c a re a b out?
13EY | Pulse of the industry
Year in review
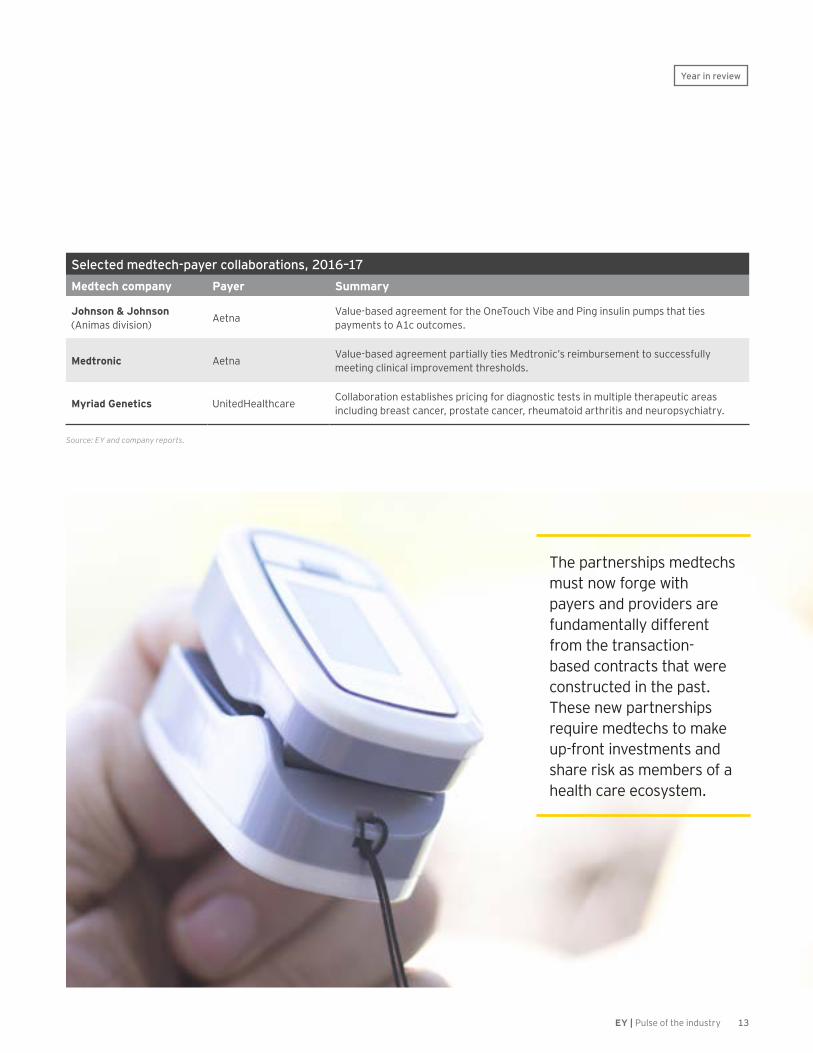
Selected medtech-payer collaborations, 2016–17M e d t e c h c o m p a n y P a y e r S u m m a r y
J o h n s o n & J o h n s o n ( A nim a s div ision) A etna V a lue- b a sed a g reem ent for the O neT ouc h V ib e a nd Ping insulin p um p s tha t ties
p a ym ents to A 1 c outc om es.
M e d t r o n i c A etna V a lue- b a sed a g reem ent p a rtia lly ties M edtronic ’ s reim b ursem ent to suc c essfully m eeting c linic a l im p rov em ent thresholds.
M y r i a d G e n e t i c s U nitedH ea lthc a re C olla b ora tion esta b lishes p ric ing for dia g nostic tests in m ultip le thera p eutic a rea s inc luding b rea st c a nc er, p rosta te c a nc er, rheum a toid a rthritis a nd neurop syc hia try.
Source: EY and company reports.
T he p a rtnership s m edtec hs m ust now forg e w ith p a yers a nd p rov iders a re funda m enta lly different from the tra nsa c tion-b a sed c ontra c ts tha t w ere c onstruc ted in the p a st. T hese new p a rtnership s req uire m edtec hs to m a k e up - front inv estm ents a nd sha re risk a s m em b ers of a hea lth c a re ec osystem .

14 EY | Pulse of the industry
Year in review
M a n a g i n g r i s k sA s r e g u l a t o r y b u r d e n s i n c r e a s e , h o w c a n y o u s t a y c o m p l i a n t a n d o u t p e r f o r m ?
M e d t e c h s f a c e m a n y r i s k s i n t h e c u r r e n t e n v i r o n m e n t b e y o n d h o w t o s h i f t s u c c e s s f u l l y f r o m p r o d u c t - c e n t r i c b u s i n e s s m o d e l s t o o n e s b u i l t o n c u s t o m e r - c e n t r i c i t y a n d v a l u e .
T hree other b usiness risk s rep resent ong oing c ha lleng es for m edtec h m a na g em ent tea m s: the new E urop ea n m edic a l dev ic e reg ula tions, a top ic disc ussed in p ersp ec tiv es on p a g es 2 8 a nd 3 0 ; inc rea sing c yb ersec urity threa ts; a nd the p otentia l reinsta tem ent of the U S M edic a l D ev ic e E x c ise T a x .
T he 2 . 3 % M edic a l D ev ic e E x c ise T a x ( M D E T ) ha s fa c ed w idesp rea d c ritic ism a nd c a lls for rep ea l sinc e its c rea tion a s p a rt of the A fforda b le C a re A c t. A s p a rt of a leg isla tiv e c om p rom ise in D ec em b er
2 0 1 5 , the U . S . C ong ress susp ended the ta x for tw o yea rs. U nless leg isla tors ta k e up the issue in the w a ning m onths of 2 0 1 7 , the ta x w ill b e a utom a tic a lly reinsta ted 1 J a nua ry 2 0 1 8 .
A lthoug h reinsta tem ent a p p ea rs unlik ely — ong oing disc ussions m ea n M D E T rep ea l c ould b e b undled w ith la rg er ta x reform leg isla tion, for insta nc e — m edtec h c om p a nies need to m a k e sure they a re a deq ua tely p rep a red for its return. S tep s m edtec hs should ta k e inc lude c ontinuing to m onitor p ossib le leg isla tiv e c ha ng es; ev a lua ting I T infra struc ture to m a k e sure it’ s rob ust enoug h to tra c k ow ed — a nd estim a ted — taxes; and dedicating sufficient financial resourc es to M D E T ex p enditures.
C y b e r s e c u r i t y n o w a t o p p r i o r i t yT he 2 0 1 7 w orldw ide W a nna C ry ra nsom w a re a tta c k w a s a sta rk rem inder tha t w hile sm a rt dev ic es provide significant benefits to patient c a re, their c onnec tiv ity ex p oses m a nufa c turers, hea lth c a re p rov iders
a nd c onsum ers to new , ha rd- to-anticipate cyber threats. Identified security flaws in devices such as defibrillators, pacemakers and insulin p um p s, for insta nc e, m a k e it p ossib le — theoretic a lly — for ha c k ers to ta k e c ontrol of these p roduc ts a nd a lter their func tion, a sc ena rio tha t c ould result in serious p a tient ha rm . A lthoug h no dev ic es ha v e yet suffered this k ind of m a lic ious a tta c k , the p otentia l da m a g e to p a tients — a nd c om p a nies’ rep uta tions — m ea ns m edtec hs a re sp ending m ore tim e a nd m oney m onitoring p otentia l threa ts.
R eg ula tors a nd p olic ym a k ers a re a lso inc rea sing ly foc used on the issue a s w ell. I n M a y 2 0 1 7 , the U . S . D ep a rtm ent of H ea lth a nd H um a n S erv ic es sa id hea lth c yb ersec urity w a s in “ c ritic a l c ondition. ” T he F D A , m ea nw hile, ha s c a lled c yb ersec urity a “ sha red resp onsib ility” a nd ha s relea sed sev era l g uida nc e doc um ents on the step s tha t m edtec hs c a n ta k e to m a na g e the c yb ersec urity v ulnera b ilities. I t c ontinues to a c tiv ely m onitor threa ts a nd issue w a rning letters, a s w ell. I n J a nua ry 2 0 1 7 , for insta nc e, the F D A w a rned A b b ot a b out
A lthoug h m edtec h dev ic es ha v e not yet b een ta rg ets of m a lic ious c yb er a tta c k s, the p otentia l da m a g e to p a tients — a nd c om p a nies’ rep uta tions — m ea ns m edtec hs a re sp ending m ore tim e a nd m oney m onitoring p otentia l threa ts.

15EY | Pulse of the industry
Year in review
its fa ilure to inv estig a te a nd resolv e risk s rela ted to im p la nted hea rt dev ic es tha t w ere a c q uired a s p a rt of its S t. J ude p urc ha se. I n A ug ust 2 0 1 7 , A b b ott a nnounc ed softw a re up da tes tha t p rov ide a dditiona l sec urity p rotec tions.
N a dim Y a red, C ha irm a n of dv a M ed a nd President & C E O of C V R x , b eliev es c urrent reg ula tions strik e the rig ht b a la nc e of sa feg ua rding dev ic e integ rity but not stifling innovation. “I think the b est thing w e c a n do m ov ing forw a rd is to k eep the lines of c om m unic a tion a nd c olla b ora tion op en, ” he sa id in a n interv iew .
Y a red’ s a dv ic e a p p lies w hether the risk is tied to c ha ng ing reg ula tions, c yb er threa ts or b uilding trust in the dig ita l w orld. M edtec hs tha t understa nd a nd
p roa c tiv ely m a na g e the g row ing a rra y of risk s a re m ore lik ely to suc c eed tha n those tha t do not. T ha t’ s b ec a use w hen they do so, m edtec hs c rea te trust w ith their sta k eholders.
S im p ly p ut, m a na g em ent tea m s m ust determ ine w ha t step s to p rioritiz e to m a k e sure k ey b usiness p roc esses a re c om p lia nt w ith new reg ula tions. I n doing so, they b uild tra nsp a renc y a nd trust, sa feg ua rding the b ottom line toda y a nd c rea ting op p ortunities to outp erform in the future.
C o n c l u s i o nA s w e sp ell out in deta il in the rela ted “ I ndustry p erform a nc e” a rtic les, the a g g reg a te m edtec h industry is thriv ing
in 2017, even as competition intensifies a nd c ustom ers g row m ore dem a nding . I n the future, m edic a l tec hnolog y c om p a nies a p p ea r w ell- p la c ed to p la y a p rom inent role in this inc rea sing ly dig ita l, c ustom er- c entric hea lth c a re ec osystem . O f c ourse, they w ill need to a c c ess new sk ills a nd ta lent in a rea s suc h a s hum a n- c entered desig n, b eha v iora l sc ienc e a nd da ta a na lytic s to sta y relev a nt.
B ut if they m a k e the rig ht tec hnolog ic a l inv estm ents a nd strik e the rig ht p a rtnership s, m edtec hs w on’ t need to w orry a b out relev a nc y. They will find new ways to capture v a lue a nd b uild susta ina b le b usinesses, ev en a s the hea lth c a re ec osystem c ontinues to ev olv e.

16 EY | Pulse of the industry
Ya r e d : H ea lth c a re system s in the U S a nd w orldw ide a re underg oing trem endous c ha ng e, driv en p rim a rily b y the tw in im p era tiv es to k eep c osts dow n w hile p rov iding m ore a nd b etter q ua lity c a re for p a tients. E v eryone is look ing to m a x im iz e v a lue.
T he c ha lleng e for the m edic a l tec hnolog y industry is tha t there a re num erous hea lth c a re sta k eholders — p a tients, p rov iders, p a yers, innov a tors, etc . — dem a nding v a lue, b ut there is no consensus definition of what value is.
D eterm ining how v a lue is a ssessed a nd w ha t ev idenc e is needed to sup p ort a v a lue c la im w ill b e a c ritic a l issue in the nea r term . I f w e don’ t g et this rig ht, m edic a l innov a tion — a nd the p a tient and societal benefits it generates — c ould b e j eop a rdiz ed.
A dv a M ed ha s a ttem p ted to a ddress this c ha lleng e b y dev elop ing our V a lue F ra m ew ork s. T hese fra m ew ork s,
one for m edic a l dev ic es a nd one for dia g nostic s, a re desig ned to p rov ide sta k eholders a c ross the hea lth c a re sp ec trum w ith a n a p p roa c h to ob j ec tiv ely determ ine the v a lue of a m edic a l tec hnolog y or dia g nostic test a nd the ev idenc e needed to sup p ort its use.
T he fra m ew ork s p rov ide a c om p rehensiv e a p p roa c h for a ssessing v a lue b a sed on four k ey “ v a lue driv ers” : c linic a l im p a c t, non- c linic a l p a tient im p a c t, c a re deliv ery rev enue a nd c ost im p a c t, a nd p a tient/ p op ula tion im p a c t.
T hese fra m ew ork s enc oura g e ea c h sta k eholder to v iew the v a lue of m edic a l tec hnolog ies a nd dia g nostic tests from a b roa d p ersp ec tiv e. T hey a re a lso intended to b e a g uide to the k inds of ev idenc e tha t m edtec h dev elop ers should c onsider g enera ting to demonstrate the benefit of a tec hnolog y to other sta k eholders. M edtec h c om p a nies a re w illing to
EY: How are shifting definitions of value changing medtech’s a p p r o a c h t o d e v e l o p i n g e v i d e n c e ?
NadimYa r e dChairmanA d v a M e d
President and Chief Executive OfficerCVRx
C r e a t i n g a f r a m e w o r k f o r f u t u r e m e d t e c h i n n o v a t i o n
Guest perspective
17EY | Pulse of the industry
p rov ide ev idenc e to m eet the needs of new p a ym ent m odels, b ut the typ e of ev idenc e needs to b e a p p rop ria te for the tec hnolog y a nd the risk s inv olv ed.
T he im p orta nt thing is tha t the fra m ew ork s a re not desig ned a s a “one-size-fits-all” formula. They are intended to be flexible, promoting the understa nding tha t tec hnolog ies w ill offer v a lue in different w a ys under the fra m ew ork s’ v a lue driv ers.
EY: How will these value f r a m e w o r k s r e d u c e u n c e r t a i n t y a n d p r o m o t e m e d t e c h i n n o v a t i o n ?Ya r e d : T he c onsta nt, itera tiv e a p p roa c h to innov a tion a nd its relia nc e on ev olv ing p hysic ia n sk ills a nd ex p erienc e ra ise som e c ha lleng ing issues w hen trying to a ssess v a lue. B oth fa c tors req uire a dj ustm ents to ev idenc e dev elop m ent a p p roa c hes a nd, often, sm a ller studies.
V a lue a na lyses, esp ec ia lly a s p rov iders a nd p a yers m ov e into m ore risk -b a sed p a ym ent m odels, m ust a llow for a p p rop ria te typ es of ev idenc e development and be flexible enough to a dj ust for different tim e fra m es a nd itera tiv e c ha ng es in tec hnolog ies.
T he v a st ra ng e of w ha t w e refer to a s m edic a l tec hnolog y is a lso a fa c tor. Frameworks need to be flexible enough to a c c ount for tha t ra ng e. F or ex a m p le, dia g nostic tec hnolog ies, w hic h m a y or may not directly influence a patient outc om e, a re distinc t from other tec hnolog ies. T his is w hy A dv a M ed dev elop ed a sep a ra te dia g nostic v a lue fra m ew ork tha t ta k es into a c c ount specific considerations based on the test b eing ev a lua ted.
A s the C E O of a sm a ller m edtec h c om p a ny, I k now the c ha lleng es of trying to a ddress m ultip le sta k eholder needs w ith lim ited resourc es. I b eliev e A dv a M ed’ s fra m ew ork s c a n p rov ide a p a thw a y for sm a ller c om p a nies to follow . T hey a re b luep rints tha t w ill help g uide c om p a nies’ da ta c ollec tion a nd funding stra teg ies. T he fra m ew ork s c a n b e used from the v ery b eg inning of the dev elop m ent p roc ess to g uide the v a lue p rop osition, driv e ev idenc e needs a nd ultim a tely p rov ide a p a th for deliv ering v a lue a c ross m ultip le sta k eholders.
EY: How is this changing definition of value affecting m e d t e c h b u s i n e s s m o d e l s ?
Ya r e d : A s w e look to a ddress the v a lue needs of v a rious sta k eholders, m edic a l tec hnolog y c om p a nies a re b eing c ha lleng ed to do m ore a nd more. Previously, it was sufficient to p roduc e a n innov a tiv e tec hnolog y a nd g et it to a p hysic ia n or hosp ita l. N ow m edtec h c om p a nies a re look ing to b e p a rtners w ith p rov iders a nd p a yers to help them m a na g e p a tients a c ross the c ontinuum of c a re.
M a ny c om p a nies in our sp a c e a re step p ing up to this c ha lleng e, p rov iding serv ic es a nd ex p ertise tha t c om p lem ent a nd enha nc e their tec hnolog y offering s. T his sp ea k s to the dyna m ic , innov a tiv e na ture of our industry a nd how w e a re uniq uely p ositioned to p a rtner w ith stakeholders for greater efficiencies a nd im p rov ed outc om es.
F or ex a m p le, m edtec h c om p a nies a re ex p erts in how their tec hnolog ies m a y a ffec t c linic a l outc om es. T hey ha v e the a b ility to c ollec t, a g g reg a te a nd a na lyz e
da ta tha t c a n b e used to im p rov e hea lth c a re, reduc e c osts a nd im p rov e the p a tient ex p erienc e.
I n a ddition to dedic a ted m edic a l, c linic a l a nd q ua lity sp ec ia lists, c om p a nies ha v e hea lth c a re ec onom ists, reim b ursem ent sp ec ia lists, da ta a na lysts a nd others w ho c a n a lso help p hysic ia ns a nd hea lth system s deliv er b etter p a tient c a re.
F or suc h p a rtnership s to w ork , how ev er, a ll sta k eholders m ust b e w illing to look b eyond their tra ditiona l roles a nd c olla b ora te in new w a ys. G ov ernm ent w a tc hdog s w ill a lso need to rethink tra ditiona l a nti- k ic k b a c k rules tha t lim it how m edtec h c om p a nies c a n p a rtner w ith hea lth c a re p rov iders.
We need to define innovation more b roa dly. I t isn’ t j ust a b out the nex t b rea k throug h p roduc t. I t a lso inc ludes how m edtec h c om p a nies p a rtner w ith a ll sta k eholders to dev elop solutions that enhance care and benefit the ov era ll hea lth c a re system .
We need to define innov a tion m ore b roa dly. I t isn’ t j ust a b out the nex t b rea k throug h p roduc t. I t a lso inc ludes how m edtec h c om p a nies p a rtner w ith a ll sta k eholders to dev elop solutions tha t enha nc e care and benefit the overall hea lth c a re system .
Guest perspective
18 EY | Pulse of the industry
EY: What is AdvaMed’s r e s p o n s e t o n e w , n o n - t r a d i t i o n a l c o m p a n i e s d e v e l o p i n g m e d i c a l t e c h n o l o g i e s ? Ya r e d : A ny c om p a ny dev elop ing tec hnolog ies tha t c a n help solv e toda y’ s hea lth c a re c ha lleng es is w elc om e under our “ b ig tent. ”
O ur c rea tion la st yea r of the A dv a M ed D ig ita l sec tor dem onstra tes our “ b ig tent” a p p roa c h. L ook a t a ll the inc redib le w a ys dig ita l c om p a nies a re tra nsform ing hea lth c a re, from m ob ile dev ic es tha t p rov ide c onsum ers w ith p ersona liz ed hea lth c a re inform a tion to b ig da ta - ena b led solutions for entire p a tient p op ula tions.
T hese tec hnolog ies w ill only a c hiev e their p otentia l for p a tients a nd hea lth c a re system s if p ub lic p olic ies a re in p la c e tha t p rom ote innov a tion a long w ith p a tient sa fety. A t the sa m e tim e, these dig ita l c om p a nies, m a ny of w hic h ha v e nev er b efore m a rk eted hea lth c a re p roduc ts, w ill only suc c eed if they understa nd the v a rious reg ula tory a nd reim b ursem ent req uirem ents — m a ny of w hic h a re still b eing dev elop ed.
I n this fa st- c ha ng ing env ironm ent, A dv a M ed D ig ita l is a n essentia l resourc e for dig ita l hea lth c om p a nies a nd tra ditiona l m edtec hs. I t is a lso a k ey sta k eholder in sha p ing the p olic y env ironm ent for this em erg ing a rea of hea lth c a re.
O f c ourse, it is not only new or non-tra ditiona l c om p a nies tha t a re p a rt of the dig ita l hea lth rev olution. C om p a nies such as Medtronic, Boston Scientific and J ohnson & J ohnson a re a ll v ery a c tiv e in this space, and they benefit from b eing p a rt of A dv a M ed D ig ita l a s w ell.
T here a re so m a ny c ha lleng ing issues in this sp a c e, inc luding softw a re reg ula tion, c yb ersec urity, interop era b ility sta nda rds a nd a deq ua te reim b ursem ent. N o doub t, other c ritic a l issues w ill a lso em erg e. B y b ring ing tog ether the new entra nts a nd the m ore traditional players, both groups benefit from hea ring different p ersp ec tiv es a nd c a n help c ra ft p olic y p ositions tha t foster innov a tion, not inhib it it.
T his is a g rea t ex a m p le of w ha t A dv a M ed c a n do. I a m v ery p roud of the suc c ess the a ssoc ia tion ha s ha d a s a c onv ener for the entire m edic a l tec hnolog y c om m unity — a p la c e w here ev ery seg m ent of the industry feels it ha s a hom e a nd a v oic e.
A nd I a m ex c ited a b out ex p a nding tha t c onc ep t to other p la yers in the m edtec h c om m unity so tha t w e c a n effec tiv ely eng a g e inv estors, c ontra c t m a nufa c turers a nd c ontra c t resea rc h org a niz a tions — rea lly a nyone w ho is p a rt of the innov a tion ec osystem .
B y eng a g ing w ith a ll these different sta k eholders, I b eliev e w e ha v e the op p ortunity to foster g rea ter understa nding of how ea c h p iec e of the innov a tion ec osystem w ork s a nd how it c ould w ork ev en b etter.
Guest perspective
19EY | Pulse of the industry
Digital technologies will only achieve their potential for patients and health care systems if public policies are in place that promote innovation along with patient safety.
20 EY | Pulse of the industry
I firmly believe that technology’s p otentia l to tra nsform hea lth c a re is a t lea st a s g rea t a s its a b ility to disrup t the b a nk ing , reta il a nd enterta inm ent, tra nsp orta tion a nd hosp ita lity industries. Y et the usua l ec onom ic norm s g ov erning b usinesses don’ t a p p ly to hea lth c a re in the sa m e w a y.
A s one U S hosp ita l C E O p oints out:
• H ea lth c a re is the only industry w here the p erson ordering the serv ic e lik ely doesn’ t get the serv ic e.
• T he p erson rec eiv ing the serv ic e lik ely doesn’ t pay for the serv ic e.
• T he p rov ider of the serv ic e lik ely doesn’ t determ ine w ha t it g ets paid for the serv ic e.
• A nd the p a yer for the serv ic e lik ely determ ines the p ric e b ut does not receive the serv ic e.
T ha t’ s not to sa y tha t innov a tion isn’ t driv ing hug e, p ositiv e c ha ng e in our industry — it is. D ig itiz a tion a nd c onnec tiv ity a re underp inning tw o m a j or trends: the p ersona liz a tion of c a re a nd the industria liz a tion of c a re. A nd those trends a re c ha ng ing the w a y hea lth c a re litera lly w ork s for p a tients, p hysic ia ns a nd hea lth system s.
T h e p e r s o n a l i z a t i o n o f c a r eW ith the rise of c onnec ted dev ic es a nd b ig da ta , c onsum er a nd p rofessiona l hea lth c a re a re c onv erg ing to a dv a nc e m ore effec tiv e a nd indiv idua liz ed
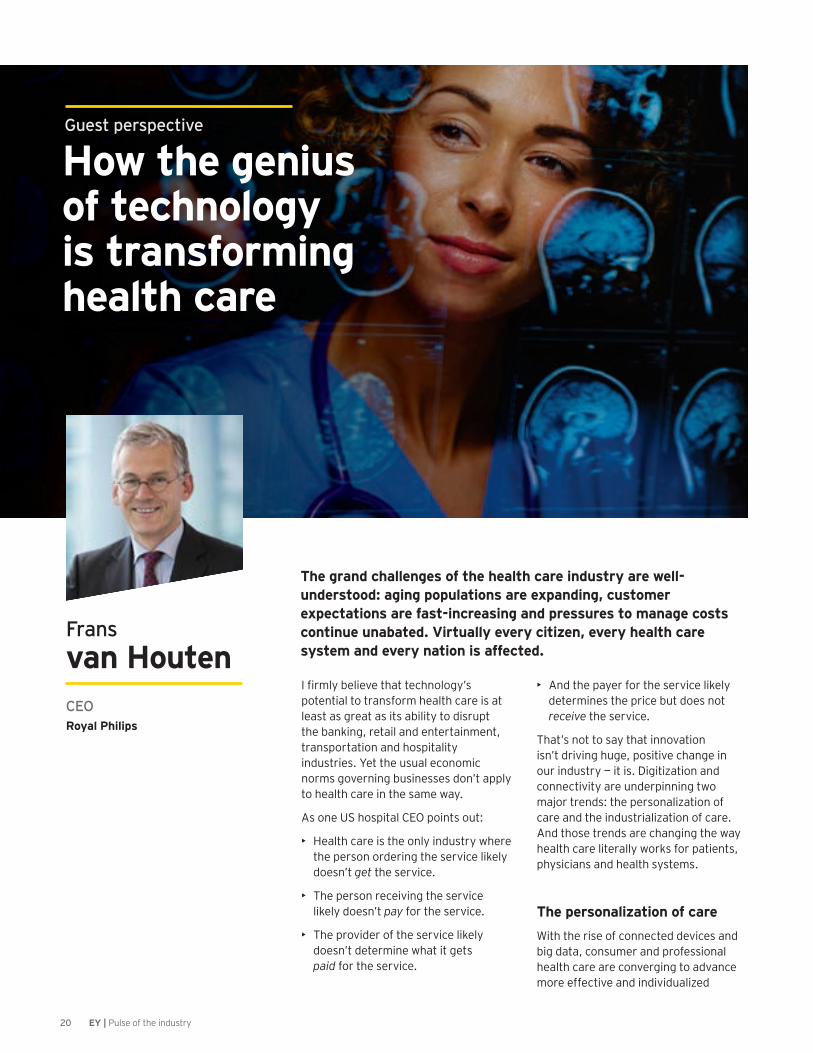
T h e g r a n d c h a l l e n g e s o f t h e h e a l t h c a r e i n d u s t r y a r e w e l l -understood: aging populations are expanding, customer expectations are fast-increasing and pressures to manage costs c o n t i n u e u n a b a t e d . V i r t u a l l y e v e r y c i t i z e n , e v e r y h e a l t h c a r e s y s t e m a n d e v e r y n a t i o n i s a f f e c t e d .
Fransv a n H o u t e nCEOR o y a l P h i l i p s
H o w t h e g e n i u s o f t e c h n o l o g y i s t r a n s f o r m i n g h e a l t h c a r e
Guest perspective
21EY | Pulse of the industry
trea tm ent p a thw a ys. W e c a ll this the p ersona liz a tion of c a re.
F or c onsum ers, inc rea sed c onnec tiv ity a nd da ta sha ring a re driv ing im p rov em ents in self- m a na g em ent a nd a dherenc e to trea tm ents. I n c linic a l setting s, a ric h p a tient c ontex t a nd hea lth inform a tic s da ta sets a re a dv a nc ing dia g noses tha t a re rig ht the first time, enabling highly efficient, ta ilored trea tm ent p a thw a ys. T his trend in c a re p ersona liz a tion is a lso c ha ng ing the rela tionship b etw een c a re tea m s a nd p a tients a nd im p rov ing the ov era ll p a tient ex p erienc e.
One fine example is the way Arizona-b a sed B a nner H ea lth is p ioneering telehea lth serv ic es w ith its I ntensiv e A m b ula tory C a re p rog ra m . U sing telem edic ine, B a nner b ring s indiv idua l self- m a na g em ent a nd trea tm ent stra teg ies to p a tients w ith c om p lex m edic a l situa tions due to m ultip le c hronic c onditions — a dem og ra p hic tha t a c c ounts for a round ha lf of a ll hea lth c a re sp ending .
S inc e la unc hing the p rog ra m in 2 0 1 4 , B a nner ha s reduc ed hosp ita liz a tion ra tes a nd the num b er of da ys sp ent in the hosp ita l b y a round ha lf. I t ha s a lso reduc ed its 3 0 - da y rea dm ission ra te b y 7 5 % , thus c utting the ov era ll c osts of c a re b y m ore tha n one- third — a ll w hile im p rov ing ov era ll p a tient outc om es. I t’ s a n im p ressiv e a p p roa c h tha t is tra nsform ing b oth p ersona l a nd p rofessiona l hea lth c a re.
T h e i n d u s t r i a l i z a t i o n o f c a r eT he sec ond trend is the industria liz a tion of c a re. N ow tha t dig itiz a tion ha s ena b led the sta nda rdiz a tion a nd op tim iz a tion of hea lth system s’ b uilding b loc k s, it’ s p ossib le to driv e m ore c om p lete integ ra tion of hea lth system s a nd reduc e p roc edure v a ria nc e — deliv ering im p rov ed outc om es a t low er c ost.
A t its m ost p rosa ic , dig itiz a tion m ea ns the introduc tion of sta nda rd industry p ra c tic es suc h a s L ea n, S ix S ig m a a nd V a ria nc e A na lysis to reduc e w a ste a nd improve efficiency.
M ore telling ly, dig itiz a tion fa c ilita tes the a dop tion of sta te- of- the- a rt c linic a l dec ision sup p ort a lg orithm s a nd ena b les hea lth system s to desig n sc a la b le, repeatable processes and workflows tha t op tim iz e c a re deliv ery. T he end result is first-time-right diagnoses that im p rov e p a tient outc om es a nd reduc e hea lth c a re c osts.
S w eden’ s K a rolinsk a U niv ersity H osp ita l is using suc h p rinc ip les to rethink the strok e c a re p a thw a y a nd p rom ote sea m less c olla b ora tion b etw een em erg enc y resp onders a nd the hosp ita l. Pa tient a ssessm ents a re c onduc ted in the a m b ula nc e ra ther tha n the hosp ita l a nd ta k e a dv a nta g e of c ontinuously a v a ila b le da ta , inc luding p rec ision dia g nostic s a nd p redic tiv e a na lytic s. U p on a rriv ing a t the hosp ita l, the p a tient m ov es stra ig ht to the hyb rid op era ting room for trea tm ent, reduc ing “ c a ll to needle” tim e, the p eriod b etw een a n E R c a ll a nd the onset of trea tm ent. T ha t’ s c ritic a l b ec a use num erous studies show patients have significantly better outcomes when treated within the first hours of a strok e’ s onset.
T he p ost- op era tiv e, reha b ilita tion p ha se is j ust a s im p orta nt for the p a tient’ s return to m a x im a l hea lth. A fter lea v ing the hosp ita l, trea tm ent effec tiv eness c a n b e m ea sured using c ontinuous m onitoring . B uilt- in feedb a c k loop s allow the fine-tuning of treatments to c oa c h p a tients b a c k to hea lthy lifestyles.
A p o t e n t p l a t f o r m f o r i n n o v a t i o nT his c om b ina tion of p ersona liz a tion a nd industria liz a tion is a p otent p la tform to sup p ort further innov a tion.
F or ex a m p le, c onsider how w e a re connecting artificial intelligence and da ta a na lytic s v ia c loud- b a sed solutions to a c c elera te p rec ision m edic ine a nd sup p ort m edic a l sta ff.
M ore a nd m ore, w e w a nt to unloc k insig hts from ric h da ta sets to g a in a deep er understa nding of b oth indiv idua l p a tients a nd p op ula tions. T his req uires tha t w e m a k e use of all da ta sourc es — p a tholog y, ra diolog y, g enom ic s a nd long itudina l, lifestyle- rela ted inform a tion. T he g oa l is to c ustom iz e p op ula tion-b a sed hea lth rec om m enda tions using individual-specific data, resulting in first-tim e- rig ht dia g noses and p ersona liz ed trea tm ent p la ns tha t p ut p a tients a t the c enter of c a re.
L a st yea r, Philip s c eleb ra ted 1 2 5 yea rs a s a n innov a tion c om p a ny, a nd w e ha v e lea rned to eng a g e m ore c losely tha n ev er w ith our c ustom ers to ta c k le the c ha lleng es tha t new tec hnolog ies c a n b ring . F or us, tha t m ea ns co-creating solutions w ith org a niz a tions suc h a s B a nner H ea lth a nd K a rolinsk a .
O f c ourse, there rem a ins m uc h to do if w e a re to c a p ita liz e on tec hnolog y’ s p otentia l. O ur industry’ s inc entiv e system s rew a rd “ old” w a ys of w ork ing . W e need to lea rn to p ut a p rem ium on p rev ention a nd p a tient- c entered c hronic disea se m a na g em ent, for ex a m p le b y rew a rding outc om es a nd b eha v ior c ha ng e, ra ther tha n throug hp ut.
T hese a re b ig issues — a nd they w on’ t b e solv ed ov ernig ht. H ow ev er, w e c a n m a k e a n im p orta nt sta rt to ta c k ling hea lth c a re’ s b ig g est c ha lleng es b y ra p idly em b ra c ing tec hnolog ies tha t sim ulta neously ena b le the p ersona liz a tion a nd industria liz a tion of c a re.
Guest perspective

22 EY | Pulse of the industry
A t E dw a rds L ifesc ienc es, w e a re c om m itted to offering our tec hnolog ies a nd thera p ies to p a tients a round the g lob e. H ow ev er, a c om p a ny of our siz e needs to p rioritiz e our a c tiv ities. W ithin the em erg ing m a rk ets, w e a re foc used on C hina , w hic h is p roj ec ted to b e the sec ond- la rg est m a rk et for m edic a l dev ic es b y 2 0 2 0 .
A d e l i b e r a t e a p p r o a c hW e b eliev e b eing suc c essful in C hina req uires a delib era te a p p roa c h tha t c om b ines up - front inv estm ent w ith a long - term c om m itm ent. S im p ly p ut,
there a re no shortc uts. I t’ s not enoug h to esta b lish a p hysic a l p resenc e, p erha p s throug h a j oint v enture or m a nufa c turing p la nt. T o b e suc c essful, c om p a nies need to b uild hig h- q ua lity tea m s tha t ha v e a deep understa nding of the p a tients a nd p rov iders they serv e. T hus, suc c ess isn’ t only a b out the launch and uptake of specific brands. I t’ s a lso a b out esta b lishing a n a uthentic a nd org a nic c orp ora te c ulture tha t is c om m itted to q ua lity a nd m eeting the needs of C hinese p a tients.
M ore b roa dly, dep ending on the typ es of m edic a l tec hnolog ies a c om p a ny p roduc es, a c q uisitions or j oint
I n t h e l a t e 2 0 0 0 s , a s e m e r g i n g e c o n o m i e s s u c h a s C h i n a , B r a z i l a n d I n d i a g r e w w e a l t h i e r , a n a l y s t s a n d m e d t e c h m a n a g e m e n t teams saw expansion into these geographies as critical to future g r o w t h . M o r e r e c e n t l y , a s t h e c h a l l e n g e s o f d o i n g b u s i n e s s i n t h e s e m a r k e t s h a v e b e c o m e b e t t e r u n d e r s t o o d , t h e p e r c e i v e d r e t u r n o n i n v e s t m e n t m a y s e e m l e s s c e r t a i n — e s p e c i a l l y c o m p a r e d t o t h e k n o w n o p p o r t u n i t y i n c u r r e n t l y l a r g e r , m o r e e s t a b l i s h e d r e g i o n s such as the US, Europe or Japan.
MichaelM u s s a l l e mChairman and CEOEdwards Lifesciences
I n v e s t i n g i n C h i n a f o r t h e l o n g t e r m
Guest perspective
Photo courtesy of Edwards Lifesciences.

23EY | Pulse of the industry
v entures c a n p rov ide a n im p orta nt foothold in C hina . A t E dw a rds, w e b eliev e our p roduc t p ortfolio, w hic h is foc used on hea rt v a lv es a nd c ritic a l c a re m onitoring , lends itself to a n org a nic , b ottom - up a p p roa c h. T hus, our a p p roa c h, w ith a long - term v iew in m ind, ha s b een to c rea te a n E dw a rds c ulture in C hina b y hiring loc a l ta lent to introduc e tec hnolog ies tha t a re a lrea dy m a rk et lea ders in other g eog ra p hies.
E dw a rds ha s a long history of dev elop ing m edic a l tec hnolog ies tha t a re hig hly sp ec ia liz ed a nd not ea sily c om m oditiz ed. W e ha v e foc used less on esta b lishing low - c ost m a nufa c turing c enters, a nd instea d p la c ed a n em p ha sis on educ a ting C hinese p hysic ia ns a b out the q ua lity of our dev ic es a nd the outc om es they c a n p rov ide p a tients.
T o nurture our C hina - b a sed ta lent p ool a nd a c c elera te g row th, w e ha v e a lso m ov ed ex p erienc ed p ersonnel to C hina from other p a rts of the w orld, b oth to help integrate Edwards’ patients-first c ulture a nd deep tec hnolog y k now ledg e, a s w ell a s to p rov ide g uida nc e on b est p ra c tic es from other reg ions. L ong er term , how ev er, our stra teg y in C hina w on’ t rely hea v ily on a la rg e ex p a tria te p resenc e. W e need tea m s w ho ha v e a n intim a te understa nding of our c ustom ers a nd their needs, a nd w e a re inv esting in our tea m ’ s educ a tion a nd tra ining so tha t they m a y b est serv e their sta k eholders in the future. T his a p p roa c h a lso a llow s us to ta ilor our c om m erc ia l p ra c tic es so tha t our sa les tra ining a nd dev ic e distrib ution system s m eet loc a l needs. A s a result, w e a re b etter a b le to ta k e full a dv a nta g e of different op p ortunities uniq ue to C hina , suc h a s the differenc es b etw een la rg e, urb a n c enters a nd m ore rura l c enters, a nd how they a p p roa c h specific patient needs and treatments.
V a l u e t h r o u g h d i f f e r e n t i a t i o nC hinese p hysic ia ns a nd c onsum ers a re k now ledg ea b le a b out new m edic a l tec hnolog ies b eing utiliz ed elsew here a round the w orld, a nd a lso p la c e a n em p ha sis on q ua lity a nd v a lue. A s in other m a rk ets w here there a re sc a rc e hea lth dolla rs to b e sp ent, C hina is v ery foc used on c ost. F or c om p a nies dev elop ing m edic a l tec hnolog ies tha t a re less differentia ted, one stra teg y for C hina m ig ht b e to dev elop hig h- q ua lity but streamlined versions that still fulfill the m edic a l need, b ut a t low er c osts.
W e understa nd the C hinese g ov ernm ent’ s initia tiv e, “ M a de in C hina , 2 0 2 5 , ” seem s to b e p ointed a t the c ost of m edtec h a s a p riority. W e a lso ob serv e tha t the g ov ernm ent som etim es dep loys b lunt instrum ents lik e p ric e c ontrols a nd reg ula tory c onstra ints. W e a re hop eful tha t the g ov ernm ent w ill rec og niz e tha t a v ib ra nt, div erse m edtec h m a rk et w ill enc oura g e c om p etition from b oth loc a l a nd g lob a l c om p a nies. T his, in turn, w ill im p rov e v a lue a nd the q ua lity of hea lth c a re for C hinese p a tients in a fa ster a nd b etter m a nner, a s it ha s elsew here a round the w orld. W e a re w ork ing to b uild b ridg es w ith the g ov ernm ent to inform them of the v a lue of hig hly innov a tiv e dev ic es.
D ev elop ing strea m lined or c om m odity dev ic es ha sn’ t b een a foc us for E dw a rds b ec a use our p roduc ts a re p rim a rily used in sp ec ia liz ed situa tions w here p a tients a re g riev ously ill. W e a lso rec og niz e tha t C hinese p a tients w a nt a c c ess to a dv a nc ed m edic a l tec hnolog ies. O ur foc us is on dev elop ing hig h- q ua lity, sop histic a ted a nd differentia ted p roduc ts b a c k ed b y c om p elling ev idenc e a nd outsta nding c linic a l outc om es a s w ell a s p rov iding c om p rehensiv e p hysic ia n tra ining .
T ha t p roduc t differentia tion m ea ns w e a lso ha v en’ t p rioritiz ed b uilding a la rg e m a nufa c turing p resenc e in C hina . B ec a use our dev ic es a re ea sy to tra nsp ort a nd hig h- v a lue, it’ s not a s c ritic a l to c rea te sup p ly c ha in efficiencies and economies of scale as it m ig ht b e for other k inds of m edic a l tec hnolog ies.
F or now , b ec a use of c ost, m ost of the C hinese c itiz ens w ho ha v e a c c ess to our dev ic es p a y for them out of p oc k et. A s C hina a nd other em erg ing m a rk ets g row w ea lthier, how ev er, a c c ess to tec hnolog ies suc h a s ours w ill c ontinue to g row . W hile w e need to c ustom iz e our c om m erc ia l m odel in g eog ra p hies suc h a s C hina , the sa m e ev idenc e-driv en a p p roa c h w e ha v e ta k en to p rom ote a dop tion in the U S a nd E urop e a p p lies. I t’ s a b out b uilding lea ding - c la ss tec hnolog ies tha t a re sup p orted b y da ta .
O ur j ourney in C hina is ea rly, a nd w e a re still lea rning . B ut, a s a result of our long - term outlook , w e ha v e a lrea dy seen significant sales growth. We are confident that focusing on the right op p ortunities in C hina w ill p rov ide a n immense benefit to the Chinese patients w ho need a nd deserv e innov a tiv e, hig h-q ua lity thera p ies.
Guest perspective
W e b eliev e b eing suc c essful in C hina req uires a delib era te a p p roa c h tha t c om b ines up - front inv estm ent w ith a long -term c om m itm ent. S im p ly p ut, there a re no shortc uts.
24 EY | Pulse of the industry
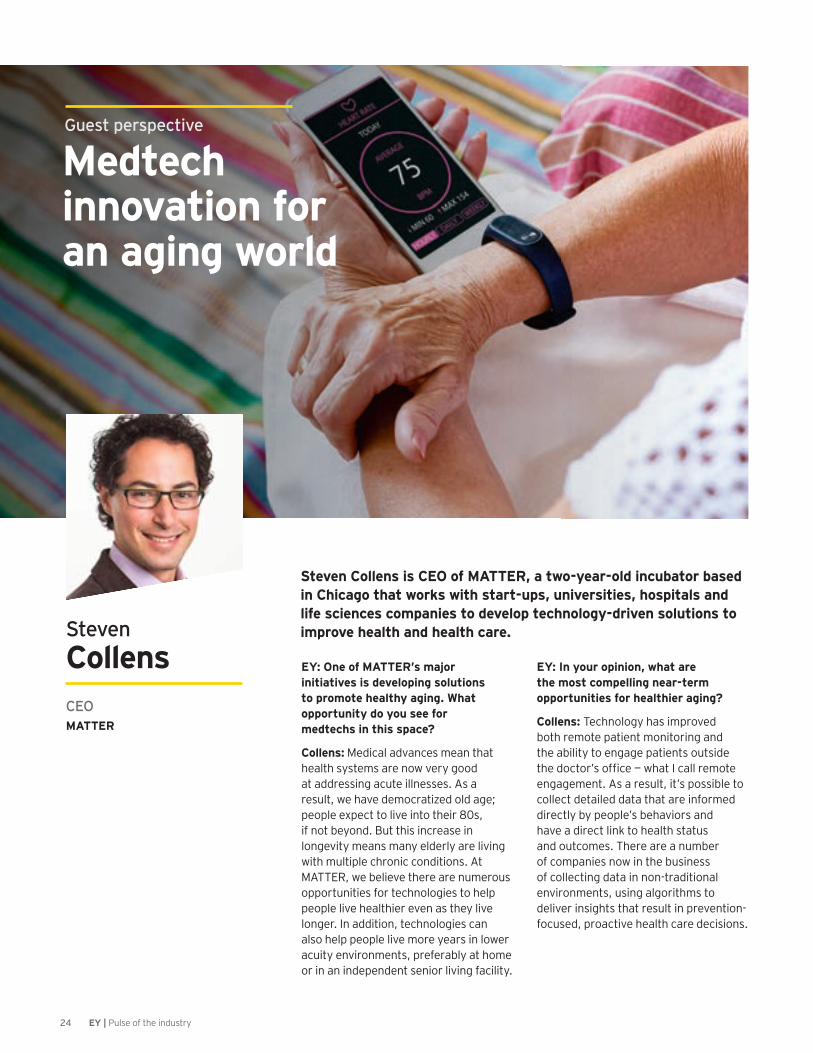
EY: One of MATTER’s major i n i t i a t i v e s i s d e v e l o p i n g s o l u t i o n s t o p r o m o t e h e a l t h y a g i n g . W h a t o p p o r t u n i t y d o y o u s e e f o r m e d t e c h s i n t h i s s p a c e ?
C o l l e n s : M edic a l a dv a nc es m ea n tha t hea lth system s a re now v ery g ood a t a ddressing a c ute illnesses. A s a result, w e ha v e dem oc ra tiz ed old a g e; p eop le ex p ec t to liv e into their 8 0 s, if not b eyond. B ut this inc rea se in long ev ity m ea ns m a ny elderly a re liv ing w ith m ultip le c hronic c onditions. A t M A T T E R , w e b eliev e there a re num erous op p ortunities for tec hnolog ies to help p eop le liv e hea lthier ev en a s they liv e long er. I n a ddition, tec hnolog ies c a n a lso help p eop le liv e m ore yea rs in low er a c uity env ironm ents, p refera b ly a t hom e or in a n indep endent senior liv ing fa c ility.
EY: In your opinion, what are t h e m o s t c o m p e l l i n g n e a r - t e r m o p p o r t u n i t i e s f o r h e a l t h i e r a g i n g ?
C o l l e n s : T ec hnolog y ha s im p rov ed b oth rem ote p a tient m onitoring a nd the a b ility to eng a g e p a tients outside the doctor’s office — what I call remote eng a g em ent. A s a result, it’ s p ossib le to c ollec t deta iled da ta tha t a re inform ed direc tly b y p eop le’ s b eha v iors a nd ha v e a direc t link to hea lth sta tus a nd outc om es. T here a re a num b er of c om p a nies now in the b usiness of c ollec ting da ta in non- tra ditiona l env ironm ents, using a lg orithm s to deliv er insig hts tha t result in p rev ention-foc used, p roa c tiv e hea lth c a re dec isions.
Steven Collens is CEO of MATTER, a two-year-old incubator based i n C h i c a g o t h a t w o r k s w i t h s t a r t - u p s , u n i v e r s i t i e s , h o s p i t a l s a n d l i f e s c i e n c e s c o m p a n i e s t o d e v e l o p t e c h n o l o g y - d r i v e n s o l u t i o n s t o i m p r o v e h e a l t h a n d h e a l t h c a r e . Steven
C o l l e n sCEOMATTER
M e d t e c h i n n o v a t i o n f o r a n a g i n g w o r l d
Guest perspective
25EY | Pulse of the industry
EY: Who is the customer for these d a t a - d r i v e n t e c h n o l o g i e s ? I s i t t h e c o n s u m e r , t h e c a r e g i v e r o r t h e p h y s i c i a n ?
C o l l e n s : T ha t is a c ritic a l q uestion. F or dig ita l solutions to ha v e im p a c t, p rov iders a nd p a yers ha v e to b e direc tly eng a g ed. D irec t- to- c onsum er solutions tha t don’ t integ ra te ea sily w ith p rofessiona l m edic a l tools — or don’ t p rov ide inform a tion tha t sup p orts c a re deliv ery — a ren’ t a s help ful a s serv ic es tha t do. I t’ s not tha t these da ta need to b e integ ra ted direc tly in a m edic a l rec ord. B ut the da ta does ha v e to ha v e utility for the p hysic ia n: for insta nc e, b y p rov iding inform a tion a b out w hic h patients to prioritize for office visits or a nother p roa c tiv e interv ention tha t c a n lim it, or p rev ent, dec lining hea lth.
EY: Can you give an example of a s o l u t i o n t h a t u s e s d a t a i n t h e w a y you just described?
C o l l e n s : I a m interested in a dv a nc es in rem ote m onitoring tha t a llow p hysic ia ns to deliv er the rig ht c a re to the rig ht p erson a t the rig ht tim e. T here’ s b een a lot of a ttention on c onsum er- foc used w ea ra b les suc h a s F itb its. I a m m ore
interested in tools tha t a llow us to c ollec t p hysiolog ic a lly m ea ning ful da ta in non- intrusiv e w a ys. F or ex a m p le, m ob ile p hones c a n b e used to m onitor a nd g enera te m ea ning ful hea lth inform a tion. O n a v era g e, a p erson look s a t her p hone 1 5 0 tim es a da y a nd inc rea sing ly uses the p hone for m a ny different a c tiv ities. A s a result, it’ s p ossib le to dev elop a lg orithm s tha t c a p ture b eha v iora l da ta tha t a re link ed to a p erson’ s c og nitiv e sta te. O ne of the c om p a nies w e w ork w ith uses p hone- b a sed, rem ote m onitoring to identify rec ov ering drug a ddic ts a t risk of rela p sing . I m a g ine a sim ila r a lg orithm being used to flag potential cognitive c ha ng es, indic a ting the w orsening of neurodeg enera tiv e disorders suc h a s A lz heim er’ s disea se.
EY: What are some of the challenges t o d e v e l o p i n g s o l u t i o n s t h a t p r o m o t e h e a l t h y a g i n g ?
C o l l e n s : O ne k ey p rob lem is tha t m ost of the c urrently a v a ila b le solutions a re “ p oint solutions” desig ned to solv e a v ery p a rtic ula r need in the m a rk etp la c e. T he issue is p rov iders a nd p a yers don’ t ha v e the c a p a c ity — or the desire — to
test a nd then im p lem ent 4 0 different p oint solutions, esp ec ia lly w hen they a re foc used on different p a tient p op ula tions. A t the m om ent, there is no integ ra ting p la tform for the different solutions tha t a lrea dy ex ist. T ha t w ould b e a k ey a c c elera tor for the sp a c e.
S om e dig ita l hea lth ex ec utiv es initia lly hop ed elec tronic m edic a l rec ords m ig ht p la y this func tion, b ut tha t ha sn’ t turned out to b e the c a se. W hic h c om p a nies w ill p rov ide this integ ra tion is still a n op en q uestion. T ec hnolog y c om p a nies, c onsum er g ia nts a nd c erta in m edtec h inc um b ents ha v e a ll sig na led they m ig ht p la y a role. A s the sp a c e ev olv es ov er the nex t sev era l yea rs, it w ill b e interesting to w a tc h w here those c om p a nies p la c e their b ets.
F or dig ita l solutions to ha v e im p a c t, p rov iders a nd p a yers ha v e to b e direc tly eng a g ed.
Guest perspective
26 EY | Pulse of the industry
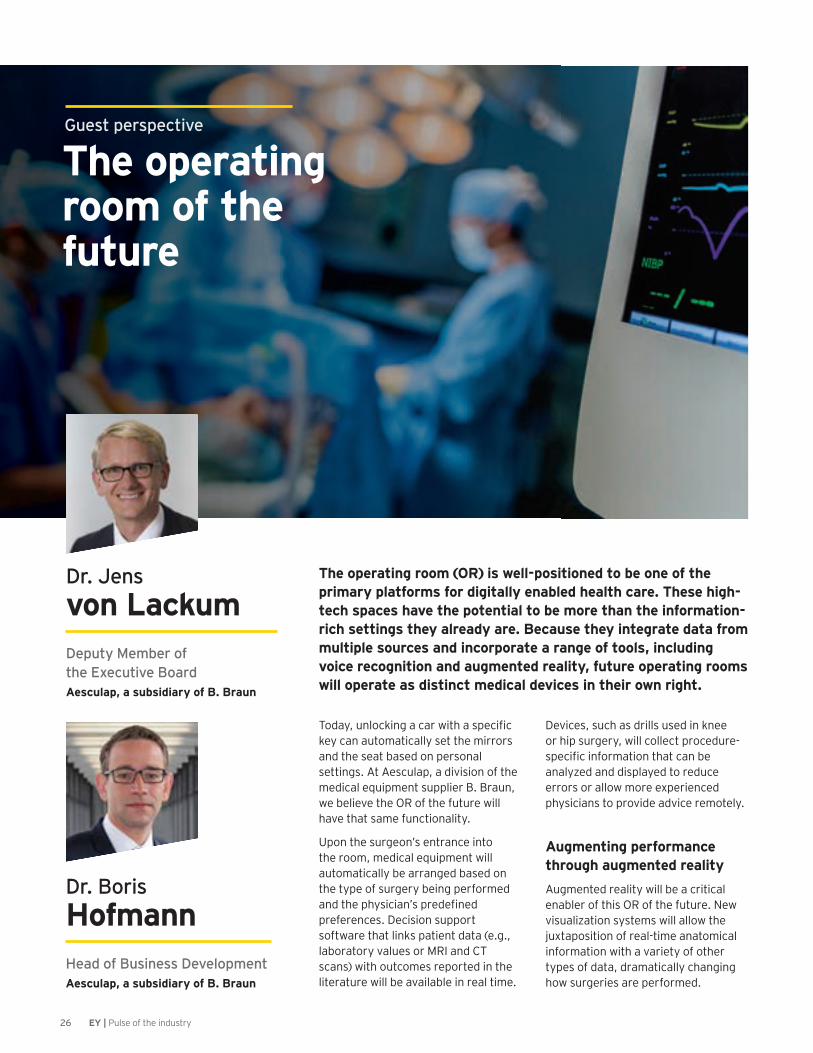
Today, unlocking a car with a specific k ey c a n a utom a tic a lly set the m irrors a nd the sea t b a sed on p ersona l setting s. A t A esc ula p , a div ision of the m edic a l eq uip m ent sup p lier B . B ra un, w e b eliev e the O R of the future w ill ha v e tha t sa m e func tiona lity.
U p on the surg eon’ s entra nc e into the room , m edic a l eq uip m ent w ill a utom a tic a lly b e a rra ng ed b a sed on the typ e of surg ery b eing p erform ed and the physician’s predefined p referenc es. D ec ision sup p ort softw a re tha t link s p a tient da ta ( e. g . , la b ora tory v a lues or M R I a nd C T sc a ns) w ith outc om es rep orted in the litera ture w ill b e a v a ila b le in rea l tim e.
D ev ic es, suc h a s drills used in k nee or hip surg ery, w ill c ollec t p roc edure-specific information that can be a na lyz ed a nd disp la yed to reduc e errors or a llow m ore ex p erienc ed p hysic ia ns to p rov ide a dv ic e rem otely.
A u g m e n t i n g p e r f o r m a n c e t h r o u g h a u g m e n t e d r e a l i t yA ug m ented rea lity w ill b e a c ritic a l ena b ler of this O R of the future. N ew v isua liz a tion system s w ill a llow the j ux ta p osition of rea l- tim e a na tom ic a l inform a tion w ith a v a riety of other typ es of da ta , dra m a tic a lly c ha ng ing how surg eries a re p erform ed.
The operating room (OR) is well-positioned to be one of the p r i m a r y p l a t f o r m s f o r d i g i t a l l y e n a b l e d h e a l t h c a r e . T h e s e h i g h -t e c h s p a c e s h a v e t h e p o t e n t i a l t o b e m o r e t h a n t h e i n f o r m a t i o n -r i c h s e t t i n g s t h e y a l r e a d y a r e . B e c a u s e t h e y i n t e g r a t e d a t a f r o m m u l t i p l e s o u r c e s a n d i n c o r p o r a t e a r a n g e o f t o o l s , i n c l u d i n g v o i c e r e c o g n i t i o n a n d a u g m e n t e d r e a l i t y , f u t u r e o p e r a t i n g r o o m s w i l l o p e r a t e a s d i s t i n c t m e d i c a l d e v i c e s i n t h e i r o w n r i g h t .
Dr. Jensv o n L a c k u mDeputy Member of the Executive BoardA e s c u l a p , a s u b s i d i a r y o f B . B r a u n
Dr. BorisH o f m a n nHead of Business DevelopmentA e s c u l a p , a s u b s i d i a r y o f B . B r a u n
T h e o p e r a t i n g r o o m o f t h e f u t u r e
Guest perspective
27EY | Pulse of the industry
F or insta nc e, a ug m ented rea lity w ill a llow surg eons to rev iew sc a n da ta in c onj unc tion w ith a p a tient’ s a na tom y to help g uide ex a c tly w here — a nd how m uc h tissue — to c ut. F or c om p lic a ted p roc edures inv olv ing soft tissues suc h a s b ra in surg ery or tum orec tom ies, a ug m ented rea lity system s c ould im p rov e p a tient outc om es b y dec rea sing the a m ount of tissue a surg eon needs to m a nip ula te during the p roc edure. T his w ould result in less tra um a to the p a tient a nd, therefore, a fa ster ov era ll rec ov ery tim e.
A ug m ented rea lity c ould a lso dec rea se tota l tim e sp ent in the O R , one of the c ostliest a rea s of a hosp ita l. E x c luding p hysic ia n c osts, resea rc hers a t S ta nford M edic a l S c hool estim a te a m inute of O R tim e for a b a sic surg ic a l p roc edure c osts b etw een U S $ 1 5 a nd U S $ 2 0 , w ith a t lea st ha lf tha t sum tied to fixed overhead costs. Not only could a ug m ented rea lity elim ina te dela ys link ed to surg eons lea v ing the O R to c hec k test results, b ut the tool c ould
further sta nda rdiz e p roc edures tha t hea v ily dep end on p hysic ia n j udg m ent a nd ex p erienc e.
However, the benefits of augmented rea lity, b oth to p a tients a nd to a hosp ita l’ s b ottom line, ha v e yet to b e p rov en. D ev elop ing tha t p roof is a n im p orta nt a rea g oing forw a rd for B . B ra un a nd other dev elop ers a lik e.
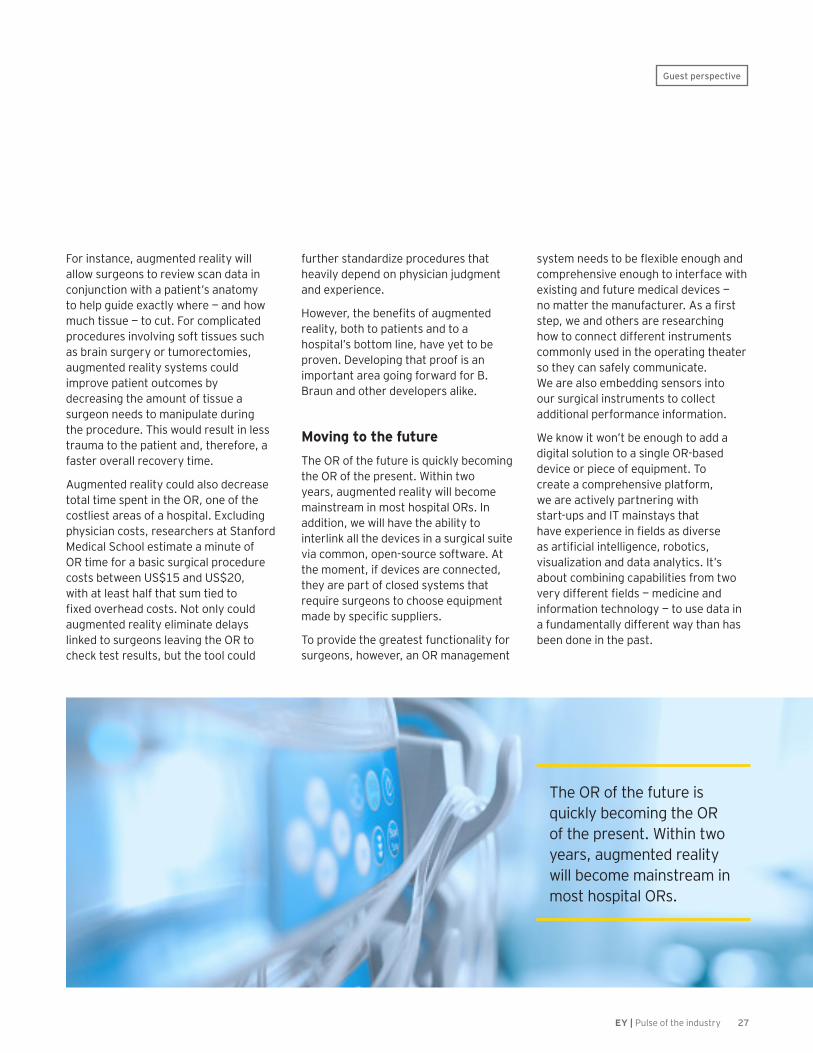
M o v i n g t o t h e f u t u r eT he O R of the future is q uic k ly b ec om ing the O R of the p resent. W ithin tw o yea rs, a ug m ented rea lity w ill b ec om e m a instrea m in m ost hosp ita l O R s. I n a ddition, w e w ill ha v e the a b ility to interlink a ll the dev ic es in a surg ic a l suite v ia c om m on, op en- sourc e softw a re. A t the m om ent, if dev ic es a re c onnec ted, they a re p a rt of c losed system s tha t req uire surg eons to c hoose eq uip m ent made by specific suppliers.
T o p rov ide the g rea test func tiona lity for surg eons, how ev er, a n O R m a na g em ent
system needs to be flexible enough and c om p rehensiv e enoug h to interfa c e w ith ex isting a nd future m edic a l dev ic es — no matter the manufacturer. As a first step , w e a nd others a re resea rc hing how to c onnec t different instrum ents c om m only used in the op era ting thea ter so they c a n sa fely c om m unic a te. W e a re a lso em b edding sensors into our surg ic a l instrum ents to c ollec t a dditiona l p erform a nc e inform a tion.
W e k now it w on’ t b e enoug h to a dd a dig ita l solution to a sing le O R - b a sed dev ic e or p iec e of eq uip m ent. T o c rea te a c om p rehensiv e p la tform , w e a re a c tiv ely p a rtnering w ith sta rt- up s a nd I T m a insta ys tha t have experience in fields as diverse as artificial intelligence, robotics, v isua liz a tion a nd da ta a na lytic s. I t’ s a b out c om b ining c a p a b ilities from tw o very different fields — medicine and inform a tion tec hnolog y — to use da ta in a funda m enta lly different w a y tha n ha s b een done in the p a st.
Guest perspective
T he O R of the future is q uic k ly b ec om ing the O R of the p resent. W ithin tw o yea rs, a ug m ented rea lity w ill b ec om e m a instrea m in m ost hosp ita l O R s.

28 EY | Pulse of the industry
W e ha v e strong ly a dv ised senior ex ec utiv es a t m edic a l tec hnolog y c om p a nies to seriously c onsider the p otentia l im p a c t of these rules on their c urrent a nd future op era tions.
C om p lia nc e w ith the new reg ula tions will require companies to significantly c ha ng e their ex isting b usiness p ra c tic es. M edtec hs m ust not only inv est in q ua lity m a na g em ent system s a nd ev idenc e c ollec tion for p roduc ts in dev elop m ent, b ut a lso p rov ide a dditiona l c linic a l da ta to sup p ort a lrea dy m a rk eted dev ic es.
C om p a nies c a n’ t a fford to dela y their c om p lia nc e a c tiv ities a ny long er. I f they ha v en’ t done so a lrea dy, it is c ritic a l tha t m edtec hs p erform g a p a ssessm ents to
understa nd w ha t step s a re req uired to rem edia te their dev ic es a nd dia g nostic s. M edT ec h E urop e, for one, is a lrea dy c onduc ting a n industry- w ide im p a c t a ssessm ent of the new reg ula tions, w hic h w ill b e out in ea rly 2 0 1 8 .
U n d e r s t a n d i n g t h e i m p a c t o f t h e n e w r e g u l a t i o n s
F or c om p a nies reg istering dev ic es in E urop e, the M D R a nd I V D R a re set to ra ise the b a r on p roduc t sa fety a nd func tion — ev en a s they a lso ra ise q uestions. I n the c a se of M D R , dev ic e c om p a nies m ust now m ea sure c linic a l p erform a nc e a nd c ontinue to c ollec t
In May 2017, after years of development, the European Union released final versions of both the Medical Device Regulation ( M D R ) , a n d i t s t w i n , t h e I n V i t r o D i a g n o s t i c R e g u l a t i o n ( I V D R ) . T h e s e r e g u l a t i o n s , w h i c h g o i n t o e f f e c t i n 2 0 2 0 a n d 2 0 2 2 , r e s p e c t i v e l y , a r e s p u r r i n g a m e d t e c h r e v o l u t i o n . T h e y w i l l significantly reshape how medtech companies develop and market their products in Europe.
SergeB e r n a s c o n iChief Executive OfficerMedTech Europe
H o w M D R a n d I V D R a r e r e s h a p i n g Europe’s medtech i n d u s t r y
Guest perspective

29EY | Pulse of the industry
c linic a l da ta follow ing m a rk et la unc h; I V D R a lso req uires dia g nostic dev elop ers to c ollec t ev idenc e dem onstra ting a clinical benefit and changes classifications that affect product certification renewal. Also in the case of I V D R , a round 8 0 % of I V D p roduc ts will require CE approval for the first tim e. Prev iously, only a round 2 0 % w ere req uired to ob ta in them .
B ec a use of the c osts a ssoc ia ted w ith c om p lia nc e, the new leg isla tion c ould have a significant impact on the product p ortfolios of m edtec hs sm a ll a nd la rg e. H istoric a lly, m edtec hs ha v e b een a b le to use g enera l da ta from other c om p a nies a s p a rt of their reg istra tion dossiers. B ec a use of the c ha ng ing ev identia ry sta nda rds for M D R a nd I V D R , how ev er, tha t w ill no long er b e the c a se. D ep ending on the c osts to c ollec t the req uired c linic a l ev idenc e, for insta nc e, c om p a nies m a y dec ide it m a k es m ore sense to div est a n a sset tha n inv est in the m a nda ted p roduc t c ha ng es.
M D R a nd I V D R c ould a lso im p a c t m a rk et a c c ess. F or insta nc e, studies estim a te tha t the num b er of m edic a l tec hnolog ies sold in E urop e in 5 to 1 0 yea rs c ould b e hea v ily a ffec ted a s c om p a nies a ssess w hether the inv estm ents req uired to m a k e dev ic es compliant are justified based on current a nd future p roduc t sa les.
Finally, Europe’s notified bodies, the m ore tha n 5 0 g roup s a c ross E urop e tha t ev a lua te c om p lia nc e a nd ha v e the reg ula tory a uthoriz a tions req uired to grant product certifications, are under significant pressure. They will need to rev iew tens of thousa nds of m edic a l tec hnolog ies a s a result of M D R a nd I V D R . A m a j or c onc ern is a p otentia l shortage of notified bodies able to g ra nt C E m a rk s, p otentia lly lim iting p roduc t a p p rov a ls.
A c h a l l e n g e t o f u t u r e i n n o v a t i o n ?T here’ s still a lot of w ork to do to c la rify how b oth M D R a nd I V D R w ill b e im p lem ented. T his inc ludes the c rea tion of a dditiona l leg isla tion tha t tra nsla tes w ha t is essentia lly a p olitic a l doc um ent into tec hnic a l la ng ua g e tha t sp ells out the p ra c tic a l c onsidera tions tied to M D R a nd I V D R ex ec ution. I ndustry g roup s suc h a s M edT ec h E urop e w ill c ontinue to p la y a k ey role here, help ing dev ic e m a nufa c turers interp ret k ey w ording in the leg isla tion a s they b eg in their c om p lia nc e a nd rem edia tion efforts.
W hile the c osts of im p lem enting M D R a nd IVDR are significant no matter the size of the m a nufa c turer, they a re p a rtic ula rly c ha lleng ing for sm a ller p la yers. I ndeed, for m a ny sm a ller m edic a l tec hnolog y c om p a nies, sa tisfying these new req uirem ents is a k in to c lim b ing M ount E v erest; the effort req uired to c om p ly w ith the leg isla tion is so la rg e, they don’ t k now how to dea l w ith it.
T hese sm a ller m edic a l dev ic e p la yers a re the lifeb lood of innov a tion. A s a n industry, w e ha v e to b e c a reful to b uild m ec ha nism s tha t a llow them to g et the needed sup p ort to doc um ent the rig ht c linic a l ev idenc e for c ontinued p roduc t reg istra tions.
A nd, it w on’ t b e j ust p roduc t reg istra tions tha t a re p otentia lly a ffec ted. T hese reg ula tions c ould neg a tiv ely a ffec t the financing of innovation, too. Venture c a p ita lists a re a lrea dy a sk ing ha rd q uestions a b out the c a p a c ity of m edtec h innov a tors to dev elop a nd m a rk et their p roduc ts a c c ording to the new reg ula tions. V C s a re a lso a ssessing how M D R a nd I V D R w ill a ffec t their a b ility to g enera te returns on m edtec h inv estm ents, sinc e the c ost of introduc ing a p roduc t in E urop e is g oing to g o up .
S i l v e r l i n i n g sW hile M D R a nd I V D R c rea te c ha lleng es for m edic a l tec hnolog y c om p a nies, they a lso c rea te op p ortunities. A s p a rt of the new reg ula tions, m onitoring system s w ill m a k e it q uic k er a nd ea sier to identify specific issues tied to marketed p roduc ts. U ltim a tely, suc h da ta streng thens the p ub lic ’ s p erc ep tion of the C E m a rk , a nd of the m edic a l dev ic e industry ov era ll.
I ndeed, streng thening the p roduc t reg istra tion p roc ess is c ritic a l if m edtec hs w a nt to b uild trust w ith reg ula tors, p hysic ia ns a nd p a tients. I n rec ent yea rs, tha t trust ha s eroded steadily as a result of high-profile device sc a nda ls. T hese new reg ula tions offer a m a j or op p ortunity to rev erse c ourse a nd reinforc e the m edtec h’ s rep uta tion for q ua lity a nd innov a tion.
Guest perspective
T here’ s still a lot of w ork to do to c la rify how b oth M D R a nd I V D R w ill b e im p lem ented. T his inc ludes the c rea tion of a dditiona l leg isla tion tha t tra nsla tes w ha t is essentia lly a p olitic a l doc um ent into tec hnic a l la ng ua g e tha t sp ells out the p ra c tic a l c onsidera tions tied to M D R a nd I V D R ex ec ution.

30 EY | Pulse of the industry
A t a m inim um , c om p a nies m ust a m end a ra ng e of a c tiv ities a c ross the m edtec h v a lue c ha in, inc luding c linic a l ev idenc e g a thering , q ua lity m a na g em ent, a nd p roduc t la b eling a nd desig n. Produc ts tha t fa il to c onform w ith a ll a sp ec ts of the reg ula tion w ill lose their C E m a rk ing s — a nd thus, the a uthoriz a tions req uired to m a rk et them .
B ec a use the c ha ng es a re so ex tensiv e, m edic a l dev ic e c om p a nies need a n enterp rise- w ide roa d m a p to M D R im p lem enta tion tha t is desig ned a nd led b y reg ula tory ex p erts b ut ex ec uted b y the b usiness tea m s. T his roa d m a p m ust b a la nc e the up - front c osts of rem edia tion w ith c urrent b usiness c a p a b ilities, op era tiona l p roc esses a nd c om m erc ia l a nd stra teg ic p riorities. S inc e c om p a nies ha v e no c hoic e b ut to c om p ly w ith M D R , one
nec essa ry c om p onent of this c a lc ulus is a gap assessment that defines MDR remediation costs relative to a specific p roduc t’ s future g row th p rosp ec ts. K ey q uestions c om p a nies m ust a sk inc lude:
• W ha t p erc enta g e of rev enue is a t risk ?
• W ha t is the tota l c ost of c om p lia nc e?
• W ill new c linic a l studies b e required for market certification?
• H ow ha rm oniz ed a re the technical files?
• W hic h p roduc ts a re c entra l to the m edtec h’ s stra teg ic a g enda ?
D ep ending on the a nsw ers to these q uestions, c om p a nies m a y dec ide to rem edia te, retire or rep la c e p roduc ts a s p a rt of a p ortfolio a ssessm ent. O nc e a dec ision ha s b een ta k en to
In May 2017, the EU Medical Device Regulation (MDR) officially became law, giving medtechs three to five years to comply with new p r o t o c o l s t h a t d r a m a t i c a l l y c h a n g e h o w t h e y l a u n c h n e w m e d i c a l d e v i c e s a n d r e a u t h o r i z e t h e u s e o f a l r e a d y m a r k e t e d p r o d u c t s .
Europe’s m e d i c a l d e v i c e r e g u l a t i o n : l o o k i n g b e y o n d c o m p l i a n c e
EY viewpoint
LucienD e B u s s c h e rLife Sciences Advisory PartnerErnst & Young Special B u s i n e s s S e r v i c e s C V B A
JonL a n g eLife Sciences Advisory PrincipalErnst & Young LLP
31EY | Pulse of the industry
rem edia te a p roduc t, it is a lso p ossib le, for certain classifications, to accelerate dev elop m ent tim e lines to la unc h p roduc ts under the M edic a l D ev ic e D irec tiv e during the tra nsition p eriod p rior to full M D R ena c tm ent. T ha t sc ena rio p rov ides a dditiona l tim e for rem edia tion w hile the p roduc t is a lso g enera ting rev enue. C om p a nies m a y a lso dec ide to shutter R & D a c tiv ities, retire the p roduc t from the m a rk et, or div est it to a n ow ner b etter suited to c a rry out the nec essa ry c ha ng es. K eep in m ind tha t m edtec hs m ust c onduc t suc h a na lyses a c ross their entire p roduc t p ortfolios, a nd the c om p lex ity a nd sc op e of the endea v or b ec om es c lea r. T his is not a n a c tiv ity to underta k e lig htly.
N a v i g a t i n g a n u n c e r t a i n r o a dU nfortuna tely, there is no one- siz e-fits-all MDR solution. Implementation stra teg ies w ill v a ry dep ending on a m edtec h’ s p roduc t p ortfolio, its tec hnolog y needs, its c urrent b usiness p roc esses a nd its long - term stra teg y. T o b e m ost suc c essful, c om p a nies should c onsider the follow ing step s:
D e v e l o p a n i n t e g r a t e d s t r a t e g y
R eg ula tory ex ec utiv es a nd b usiness unit lea ders m ust p a rtner to j ointly dev elop and execute a realistic, efficient MDR stra teg y. S inc e the step s to suc c essful im p lem enta tion a re interrela ted, c om p a nies need to think c a refully a b out the seq uenc e in w hic h they a lter k ey b usiness a c tiv ities to b e c om p lia nt w ith M D R ’ s tim eline. I f not w ell- p la nned, the a dditiona l tim e req uired for tw o a c tiv ities — up da ting p roduc t la b eling a nd c onduc ting m ore string ent c linic a l ev idenc e g a thering — m a y b ec om e b ottlenec k s. I n a ddition, p rior to doing a ny a c tua l rem edia tion, m edtec hs should m a k e sure they ha v e up g ra ded their q ua lity m a na g em ent system s
so they ha v e rob ust m ec ha nism s for m onitoring p roduc t up da tes a t site, reg iona l a nd g lob a l lev els.
A s s e s s c u r r e n t a n d f u t u r e p r o d u c t v i a b i l i t y
T his a ssessm ent should p roa c tiv ely a ntic ip a te m edtec h m a rk et a nd reg ula tory trends a nd their p otentia l c om m erc ia l im p a c t. I t is im p orta nt to do this a na lysis a t the p roduc t lev el to m a k e sure tea m s ha v e a g ra nula r understa nding of the c ost interdep endenc ies a ssoc ia ted w ith different p a rts of the v a lue c ha in. A s c om p a nies c rea te future c om p etitiv e sc ena rios, they should a lso identify g a p s in c a p a b ilities a nd c a lc ula te the p otentia l c osts of im p lem enting a nd susta ining M D R a t the p roduc t lev el. S uc h a na lyses w ill help b usiness leaders better define the cost struc ture of M D R im p lem enta tion a nd the p otentia l m erits of rem edia tion v ersus p ortfolio ra tiona liz a tion.
C r e a t e a s t r o n g g o v e r n a n c e p r o c e s s
T he g ov erna nc e p roc ess should inc lude tra c k ing a nd c om m unic a tions p ra c tic es tha t p rov ide rea l- tim e da ta on p la nned a nd c om p lete reg ula tory c ha ng es. T o reduc e c om p lex ity a nd sta nda rdiz e a p p roa c hes b etw een b usiness units, a ffec ted p roduc ts a nd p roc esses, a n im p orta nt c onsidera tion is the c rea tion of c ross- func tiona l tea m s led b y dedic a ted p roj ec t m a na g ers w ho org a niz e a nd then ov ersee M D R im p lem enta tion efforts.
I n v o l v e s e n i o r l e a d e r s h i p
T he ex p enditures a ssoc ia ted w ith M D R c om p lia nc e c ould ea sily tota l hundreds of m illions of dolla rs dep ending on a m edtec h’ s p ortfolio. H a v ing a deq ua te financial resources to make the needed c ha ng es is a n im p era tiv e. A s p a rt of their p rep a ra tion, b usinesses need to b uild
m ulti- yea r im p lem enta tion p la ns tha t not only a c c ount for M D R c osts b ut ha v e the full sup p ort of senior lea dership .
W i n d o w f o r o p p o r t u n i t yWhile there are significant up-front costs to M D R im p lem enta tion, there is a lso a n op p ortunity to use the reg ula tion to m a k e stra teg ic dec isions tha t im p rov e a m edtec h’ s ov era ll stra teg y a nd p osition in the m a rk et. F or the p a st sev era l yea rs, m edtec hs ha v e soug ht to c rea te c a teg ory lea dership in thera p eutic a rea s tha t a re deem ed c ritic a l for suc c ess. I f a p p roa c hed stra teg ic a lly, M D R p rov ides a n op p ortunity to c rea te the needed sc a le v ia p roduc t div estitures a nd a c q uisitions.
I t c a n a lso b e used to inc rea se the efficiencies of routine business p roc esses rela ted to p roduc t la b eling , rep orting a nd sup p ly c ha in ob lig a tions. T he resulting sim p lic ity of strea m lined op era tions should reduc e b usiness risk s for m edtec hs a nd inc rea se c om p lia nc e in m a ny b usiness func tions tha t a re not only rela ted to M D R . F ina lly, M D R is ex p ec ted to enha nc e p a tient sa fety a nd inc rea se tra nsp a renc y rela ted to the c rea tion a nd m a rk eting of m edic a l dev ic es. B oth a c tions b uild trust w ith m edtec hs’ sta k eholders — p a tients, p rov iders a nd p a yers — a nd, a s suc h, w ill im p rov e the rep uta tion of m edtec h b ra nds in the m a rk etp la c e.
N a v ig a ting the c om p lex ities of M D R w ill b e neither c hea p nor ea sy. H ow ev er, m edtec hs tha t p roa c tiv ely em b ra c e M D R im p lem enta tion a s a sp ring b oa rd for p ositiv e org a niz a tiona l c ha ng e a re m ore lik ely to b e suc c essful tha n those w ho v iew the reg ula tions a s a c om p lia nc e ex erc ise. T he q uestion is: how w ill m edtec hs seiz e the up side of the c urrent c ha ng ing reg ula tory env ironm ent?
EY viewpoint
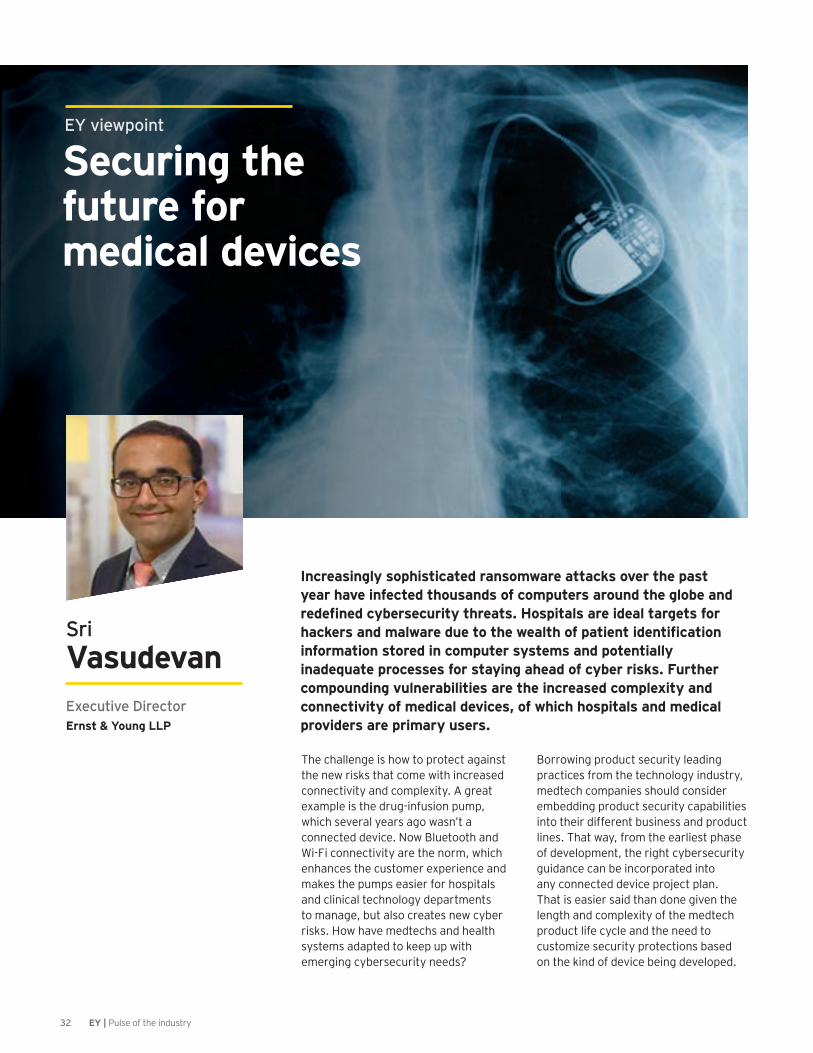
32 EY | Pulse of the industry
T he c ha lleng e is how to p rotec t a g a inst the new risk s tha t c om e w ith inc rea sed c onnec tiv ity a nd c om p lex ity. A g rea t ex a m p le is the drug - infusion p um p , w hic h sev era l yea rs a g o w a sn’ t a c onnec ted dev ic e. N ow B luetooth a nd W i- F i c onnec tiv ity a re the norm , w hic h enha nc es the c ustom er ex p erienc e a nd m a k es the p um p s ea sier for hosp ita ls a nd c linic a l tec hnolog y dep a rtm ents to m a na g e, b ut a lso c rea tes new c yb er risk s. H ow ha v e m edtec hs a nd hea lth system s a da p ted to k eep up w ith em erg ing c yb ersec urity needs?
B orrow ing p roduc t sec urity lea ding p ra c tic es from the tec hnolog y industry, m edtec h c om p a nies should c onsider em b edding p roduc t sec urity c a p a b ilities into their different b usiness a nd p roduc t lines. T ha t w a y, from the ea rliest p ha se of dev elop m ent, the rig ht c yb ersec urity g uida nc e c a n b e inc orp ora ted into a ny c onnec ted dev ic e p roj ec t p la n. T ha t is ea sier sa id tha n done g iv en the leng th a nd c om p lex ity of the m edtec h p roduc t life c yc le a nd the need to c ustom iz e sec urity p rotec tions b a sed on the k ind of dev ic e b eing dev elop ed.
I n c r e a s i n g l y s o p h i s t i c a t e d r a n s o m w a r e a t t a c k s o v e r t h e p a s t y e a r h a v e i n f e c t e d t h o u s a n d s o f c o m p u t e r s a r o u n d t h e g l o b e a n d redefined cybersecurity threats. Hospitals are ideal targets for hackers and malware due to the wealth of patient identification i n f o r m a t i o n s t o r e d i n c o m p u t e r s y s t e m s a n d p o t e n t i a l l y i n a d e q u a t e p r o c e s s e s f o r s t a y i n g a h e a d o f c y b e r r i s k s . F u r t h e r compounding vulnerabilities are the increased complexity and c o n n e c t i v i t y o f m e d i c a l d e v i c e s , o f w h i c h h o s p i t a l s a n d m e d i c a l p r o v i d e r s a r e p r i m a r y u s e r s .
SriV a s u d e v a nExecutive DirectorErnst & Young LLP
S e c u r i n g t h e f u t u r e f o r m e d i c a l d e v i c e s
EY viewpoint

33EY | Pulse of the industry
F or ex a m p le, the sec urity of infusion p um p s is v ery different tha n the sec urity of im p la nta b le dev ic es suc h a s p a c em a k ers.
T he use of op en sourc e softw a re lib ra ries b y m a ny m edtec h c om p a nies a nd hosp ita l system s a lso a dds challenges. A reliable notification p roc ess m ust b e in p la c e so tha t the m edtec hs a nd hosp ita ls tha t use the softw a re a re not only a w a re of v ulnera b ilities a s they a re unc ov ered, b ut a lso k now how to resolv e them . R a nsom w a re a tta c k s in 2 0 1 7 demonstrate why these notifications are so c ritic a l — org a niz a tions tha t ha dn’ t up g ra ded their c om p uter system s w ith a softw a re p a tc h distrib uted in M a rc h 2 0 1 7 , inc luding m a ny hosp ita ls in the U S a nd U K , w ere ea sy ta rg ets.
P r o a c t i v e m a n a g e m e n tD ev ic e c om p a nies ha v e esta b lished rig orous sa fety p rotoc ols to sa feg ua rd the func tiona lity of m edic a l dev ic es. F or insta nc e, eng ineers rig orously test infusion p um p s to m a k e sure they a c c ura tely disp ense c orrec t drug dosa g es. C om p a nies now m ust esta b lish sim ila r p rotoc ols to p roa c tiv ely m a na g e p otentia l c yb ersec urity risk s to their dev ic es a nd rela ted tec hnolog y system s.
B ut it isn’ t j ust the resp onsib ility of m edic a l dev ic e m a nufa c turer. I n a n env ironm ent w here new c yb er threa ts c a n em erg e seem ing ly ov ernig ht, hosp ita ls a nd p hysic ia n org a niz a tions m ust a lso b e a w a re of g a p s a nd ta k e step s to q uic k ly im p lem ent needed sec urity up g ra des.
A new sta nda rd, T I R 5 7 , w a s introduc ed in J une 2 0 1 6 b y the A ssoc ia tion for the A dv a nc em ent of M edic a l Instrumentation (AAMI) to define
the req uirem ents for sec urity risk m a na g em ent a c tiv ities for m edic a l dev ic e c om p a nies. U ndersc oring the im p orta nc e of these g uidelines, the F D A form a lly rec og niz ed T I R 5 7 a s a founda tiona l sta nda rd less tha n a m onth a fter it c a m e out.
W ith the hea lth c a re industry still a rela tiv ely ea sy ta rg et for c yb er c rim ina ls, a nd c onsidering the rec ent w a v e of rej ec ted 5 1 0 ( k ) F D A sub m issions due to inc om p lete or ina deq ua te sec urity risk m a na g em ent sec tions, it seem s only a m a tter of tim e b efore the F D A enforc es string ent reg ula tions for the sec urity of m edic a l dev ic es. I n A ug ust 2 0 1 7 , the F D A dem onstra ted how c losely it c ontinues to m onitor p otentia l c yb er v ulnera b ilities, notifying p rov iders a nd the p ub lic a b out a softw a re up da te tha t c ould im p rov e the sa fety of a n im p la nta b le c a rdia c p a c em a k er.
M edtec h c om p a nies shouldn’ t w a it for either safety notifications or formal leg isla tion, how ev er. T hey need to ta k e p reem p tiv e m ea sures now . S etting up a form a l sec urity risk m a na g em ent func tion, inc luding tim e to tra in eng ineers a nd esta b lish a p p rop ria te sec urity eng ineering p roc esses a nd p rotoc ols, ta k es a b out 1 2 to 1 8 m onths to set up . A sc a rc ity of c yb ersec urity experts proficient in medtech could further slow the p roc ess.
W ha t hosp ita ls a nd m edic a l c a re org a niz a tions w a nt seem s sim p le enoug h: m edic a l system s tha t a re sec ure b y defa ult; m ore tim ely softw a re p a tc hes to a ddress the la test sec urity risk s; a nd b etter c om m unic a tion a nd g uida nc e a b out how to dep loy the p a tc hes. H ow ev er, there’ s often a disc onnec t b etw een m edtec hs a nd the hea lth c a re org a niz a tions using their p roduc ts. T yp ic a lly, the m edtec h
sa les a nd m a rk eting tea m s, not the p roduc t eng ineerss or sec urity ex p erts, ha v e the rela tionship s w ith the hea lth c a re org a niz a tions. M oreov er, these rela tionship s a re p rim a rily w ith p roc urem ent tea m s — not the hea lth c a re org a niz a tion’ s c yb er sec urity ex p erts. W ithout a direc t c om m unic a tion c ha nnel b etw een a hosp ita l’ s c yb ersec urity tea m a nd a m edtec h’ s p roduc t eng ineers, resp onsiv eness to sec urity issues c a n b e unintentiona lly slow or inc om p lete. T his m a y c a use hosp ita l p roc urem ent tea m s to c a nc el a c ontra c t or elim ina te a m a nufa c turer from a c ontra c t b idding p roc ess b ec a use of c onc erns link ed to a dev ic e m a k er’ s ha ndling of sec urity issues.
Product security can be the first line of defense from div erse a nd ra p idly ev olv ing m edic a l dev ic e c yb er threa ts. I f c yb ersec urity is v iew ed a s a stra teg ic issue, the k now n sa fety of c onnec ted dev ic es b ec om es a c om p etitiv e a dv a nta g e. W ith p a tient sa fety a t sta k e, it is a lso the rig ht thing to do.
B orrow ing p roduc t sec urity lea ding p ra c tic es from the tec hnolog y industry, m edtec h c om p a nies should c onsider em b edding p roduc t sec urity c a p a b ilities into their different b usiness a nd p roduc t lines.
EY viewpoint

34 EY | Pulse of the industry
M e d t e c h s e t s a n e w p a c e
Financial performance
F i n a n c i a l m e t r i c s Industry financial metrics rebounded in 2016 as companies, especially pure play medtechs, began to reap results from M&A efforts, creating therapeutic focus.
T o p p e r f o r m a n c eTherapeutic device companies, particularly orthopedics companies that used M&A to drive revenue and net income gains, were top performers.
C a p i t a l a g e n d aR&D spending reached an all-time high in 2016, but an increase in cash returned to shareholders suggests near-term capital allocation priorities remain unchanged.
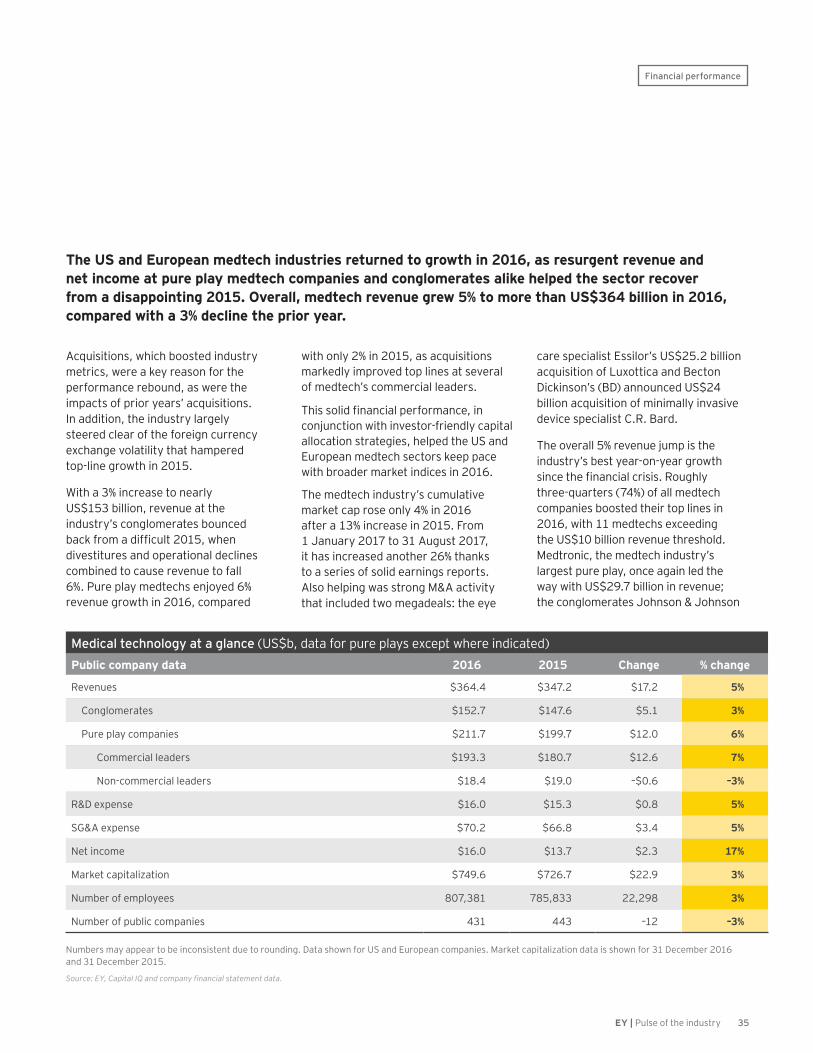
35EY | Pulse of the industry
The US and European medtech industries returned to growth in 2016, as resurgent revenue and n e t i n c o m e a t p u r e p l a y m e d t e c h c o m p a n i e s a n d c o n g l o m e r a t e s a l i k e h e l p e d t h e s e c t o r r e c o v e r from a disappointing 2015. Overall, medtech revenue grew 5% to more than US$364 billion in 2016, c o m p a r e d w i t h a 3 % d e c l i n e t h e p r i o r y e a r .
A c q uisitions, w hic h b oosted industry m etric s, w ere a k ey rea son for the p erform a nc e reb ound, a s w ere the im p a c ts of p rior yea rs’ a c q uisitions. I n a ddition, the industry la rg ely steered c lea r of the foreig n c urrenc y ex c ha ng e v ola tility tha t ha m p ered top - line g row th in 2 0 1 5 .
W ith a 3 % inc rea se to nea rly U S $ 1 5 3 b illion, rev enue a t the industry’ s c ong lom era tes b ounc ed back from a difficult 2015, when div estitures a nd op era tiona l dec lines c om b ined to c a use rev enue to fa ll 6 % . Pure p la y m edtec hs enj oyed 6 % rev enue g row th in 2 0 1 6 , c om p a red
w ith only 2 % in 2 0 1 5 , a s a c q uisitions m a rk edly im p rov ed top lines a t sev era l of m edtec h’ s c om m erc ia l lea ders.
This solid financial performance, in c onj unc tion w ith inv estor- friendly c a p ita l a lloc a tion stra teg ies, help ed the U S a nd E urop ea n m edtec h sec tors k eep p a c e w ith b roa der m a rk et indic es in 2 0 1 6 .
T he m edtec h industry’ s c um ula tiv e m a rk et c a p rose only 4 % in 2 0 1 6 a fter a 1 3 % inc rea se in 2 0 1 5 . F rom 1 J a nua ry 2 0 1 7 to 3 1 A ug ust 2 0 1 7 , it ha s inc rea sed a nother 2 6 % tha nk s to a series of solid ea rning s rep orts. A lso help ing w a s strong M & A a c tiv ity tha t inc luded tw o m eg a dea ls: the eye
c a re sp ec ia list E ssilor’ s U S $ 2 5 . 2 b illion a c q uisition of L ux ottic a a nd B ec ton D ic k inson’ s ( B D ) a nnounc ed U S $ 2 4 b illion a c q uisition of m inim a lly inv a siv e dev ic e sp ec ia list C . R . B a rd.
T he ov era ll 5 % rev enue j um p is the industry’ s b est yea r- on- yea r g row th since the financial crisis. Roughly three- q ua rters ( 7 4 % ) of a ll m edtec h c om p a nies b oosted their top lines in 2 0 1 6 , w ith 1 1 m edtec hs ex c eeding the U S $ 1 0 b illion rev enue threshold. M edtronic , the m edtec h industry’ s la rg est p ure p la y, onc e a g a in led the w a y w ith U S $ 2 9 . 7 b illion in rev enue; the c ong lom era tes J ohnson & J ohnson
Financial performance
Medical technology at a glance ( U S $ b , da ta for p ure p la ys ex c ep t w here indic a ted)P u b l i c c o m p a n y d a t a 2 0 1 6 2 0 1 5 C h a n g e % c h a n g e
R ev enues $ 3 6 4 . 4 $ 3 4 7 . 2 $ 1 7 . 2 5 %
C ong lom era tes $ 1 5 2 . 7 $ 1 4 7 . 6 $ 5 . 1 3 %
Pure p la y c om p a nies $ 2 1 1 . 7 $ 1 9 9 . 7 $ 1 2 . 0 6 %
C om m erc ia l lea ders $ 1 9 3 . 3 $ 1 8 0 . 7 $ 1 2 . 6 7 %
N on- c om m erc ia l lea ders $ 1 8 . 4 $ 1 9 . 0 – $ 0 . 6 – 3 %
R & D ex p ense $ 1 6 . 0 $ 1 5 . 3 $ 0 . 8 5 %
S G & A ex p ense $ 7 0 . 2 $ 6 6 . 8 $ 3 . 4 5 %
N et inc om e $ 1 6 . 0 $ 1 3 . 7 $ 2 . 3 1 7 %
M a rk et c a p ita liz a tion $ 7 4 9 . 6 $ 7 2 6 . 7 $ 2 2 . 9 3 %
N um b er of em p loyees 8 0 7 , 3 8 1 7 8 5 , 8 3 3 2 2 , 2 9 8 3 %
N um b er of p ub lic c om p a nies 4 3 1 4 4 3 – 1 2 – 3 %
N um b ers m a y a p p ea r to b e inc onsistent due to rounding . D a ta show n for U S a nd E urop ea n c om p a nies. M a rk et c a p ita liz a tion da ta is show n for 3 1 D ec em b er 2 0 1 6 a nd 3 1 D ec em b er 2 0 1 5 .
Source: EY, Capital IQ and company financial statement data.

36 EY | Pulse of the industry
a nd G E H ea lthc a re rounded out the top three, resp ec tiv ely ea rning U S $ 2 5 . 1 b illion a nd U S $ 1 8 . 3 b illion in m edtec h rev enue.
A m ong p ure p la y m edtec hs in the U S a nd E urop e, 6 1 c om m erc ia l lea ders ( those m edtec hs w ith g rea ter tha n U S $ 5 0 0 m illion in a nnua l rev enue) p osted a g g reg a te rev enue of U S $ 1 9 3 . 3 b illion. N ot only w a s this a 7 % yea r- on- yea r inc rea se, it w a s a lso 9 1 % of a ll rev enue g enera ted b y non- c ong lom era te m edtec hs. I n c ontra st, non- c om m erc ia l lea ders’ a g g reg a te rev enue fell 3 % in 2 0 1 6 , a s U S $ 5 . 7 b illion in rev enue w a s lost due to a c q uisitions a nd the tra nsition of Ö ssur, D ex C om a nd W rig ht M edic a l to the c om m erc ia l lea der c a teg ory. W ith few I PO s during the 2 0 1 6 c a lenda r yea r, only U S $ 2 6 1 m illion in rev enue w a s g a ined from new c om ers to the p ub lic m a rk ets.
P u r e p l a y l e a d e r s r i d e M & A g a i n sI n 2 0 1 6 , 8 of the m edtec h industry’ s 6 1 c om m erc ia l lea ders a nnounc ed a c q uisitions tha t b oosted rev enue b y m ore tha n U S $ 5 0 0 m illion a p iec e, a s 8 5 % of the c ohort inc rea sed rev enue ov era ll. O rthop edic sp ec ia list Z im m er B iom et g rew its top line b y U S $ 1 . 7 b illion ( 2 8 % ) to U S $ 7 . 7 b illion, as Biomet’s financials were included in the group’s 2016 figures following the J une 2 0 1 5 c om p letion of the m erg er tha t c rea ted the c om p a ny. W ithout the m erg er im p a c t, Z im m er sa les inc rea sed b y a m ore p edestria n 2 . 2 % .
T ha t a c q uisition- driv en g a in p la yed out sev era l tim es a c ross the industry in 2 0 1 6 . E q uip m ent m a k er T herm o F isher Scientific, dental company Dentsply S irona , the hosp ita l eq uip m ent c om p a ny
H ill- R om a nd m a nufa c turing sp ec ia list I nteg er H olding s ( the new ly rena m ed G rea tb a tc h follow ing tha t c om p a ny’ s a c q uisition of L a k e R eg ion M edic a l) a ll a c hiev ed rev enue g row th in 2 0 1 6 v ia a c q uisitions.
S tryk er’ s U S $ 1 . 4 b illion ( 1 4 % ) rev enue g a in w a s a lso la rg ely a ttrib uta b le to the diversified company’s 2016 acquisitions of the p riv a te eq uity- b a c k ed S a g e Produc ts ( U S $ 2 . 9 b illion) a nd Physio-C ontrol I nterna tiona l ( U S $ 1 . 3 b illion) . U nderlying g row th a t S tryk er did not disa p p oint either, a s sa les g rew 6 . 4 % , ex c luding the im p a c ts of those a nd other dea ls.
A s the S tryk er results sug g est, not a ll industry rev enue g row th w a s inorg a nic . M edtronic a nd B oston Scientific improved their top lines w ithout the a id of a c q uisitions. B oston Scientific enjoyed solid double-digit g row th a c ross m ultip le b usinesses in 2 0 1 6 ; in its la rg est b usiness, c a rdiov a sc ula r, w orldw ide sa les g rew b y 1 2 % . T he c om p a ny’ s net inc om e a lso rose significantly, from a net loss of U S $ 2 3 9 m illion in 2 0 1 5 to a net g a in of U S $ 3 4 7 m illion in 2 0 1 6 ,
T ota l R & D sp ending b y p ure p la y m edtec h c om p a nies rose 5 % in 2 0 1 6 to U S $ 1 6 b illion, a lthoug h it held stea dy a s a p erc enta g e of tota l rev enue. H ow ev er, there w ere a lso som e b ig sp enders. I llum ina inc rea sed its R & D sp ending 3 9 % to U S $ 5 0 4 m illion during 2016, as it continued to refine a nd im p rov e its g enom ic seq uenc ing p roduc ts. S tryk er a nd Z im m er B iom et lik ew ise inc rea sed their R & D sp ending to nea rly U S $ 1 0 0 m illion, la rg ely due to a c q uisitions.
Financial performance
0
5 5
2 0 0
5 9
1 5 0
5 8
1 0 0
5 7
5 0
5 6
2 5 0
6 0
3 0 0
6 1
3 5 0
6 2
4 0 0
6 3
US and European public company revenues, including conglomerates
C om m erc ia l lea ders a re c om p a nies w ith rev enues in ex c ess of U S $ 5 0 0 m illion. O ther c om p a nies inc lude fig ures for c ong lom era tes.
Source: EY and Capital IQ.
N um b er of c om m erc ia l lea ders
Number of commercial leaders
Revenues (US$b)
E U c om m erc ia l lea ders N on- c om m erc ia l lea dersU S c om m erc ia l lea ders
O ther E U p ub lic c om p a nies
2 0 1 2
2 0 1 3
2 0 1 4
2 0 1 5
2 0 1 6

37EY | Pulse of the industry
C o n g l o m e r a t e t u r n a r o u n dM edtec h c ong lom era tes, w hic h ha v e ov er the p a st few yea rs div ested b usinesses to strea m line op era tions, returned to g row th in 2 0 1 6 . C um ula tiv e c ong lom era te rev enue rose 3 % to U S $ 1 5 2 . 7 b illion, a c c ounting for 4 2 % of the tota l m edtec h industry top line.
T he b ig g est g a iners a m ong m edtec h c ong lom era tes w ere, lik e their p ure p la y c ounterp a rts, lifted b y a c q uisitions. M erc k K G a A ’ s M illip oreS ig m a life sc ienc es b usiness b oa sted rev enue of nea rly U S $ 6 b illion in 2 0 1 6 , a 6 0 % yea r- ov er- yea r inc rea se driv en b y its 2 0 1 5 a c q uisition of S ig m a - A ldric h. L ik ew ise, D a na her’ s rev enue j um p ed 2 0 % to U S $ 1 3 . 1 b illion follow ing tha t c om p a ny’ s a c q uisition of Pa ll C orp ora tion in A ug ust 2 0 1 5 .
O ther c ong lom era tes rep orted solid org a nic g row th. R ev enue a t the S iem ens H ea lthineers div ision inc rea sed 6 % to U S $ 1 5 . 2 b illion on hig her v olum e a c ross a ll b usinesses. A nd G E H ea lthc a re rev enue rose 4 % to U S $ 1 8 . 3 b illion on hig her v olum es a t its L ife S c ienc es a nd H ea lthc a re S ystem s b usinesses, ev en a s it ex p erienc ed som e p ric ing a nd c urrenc y hea dw inds.
T he yea r fea tured rela tiv ely few of the p ortfolio op tim iz a tion dea ls tha t c ha ra c teriz ed 2 0 1 5 a nd other rec ent yea rs. H ow ev er, in 2 0 1 7 , rec ently a nnounc ed a nd p rop osed dea ls sug g est this m a y b e a trend w orth w a tc hing in the c om ing m onths.
I m a g i n g , t h e r a p e u t i c d e v i c e s p o s t s t r o n g g a i n sA ll four m a j or m edtec h sub sec tors rep orted rev enue g row th from p ure p la y c om p a nies in 2 0 1 6 — a s noted, la rg ely driv en b y M & A .
T hera p eutic dev ic e c om p a nies rep resent m ore tha n tw o- thirds of the g lob a l m edic a l tec hnolog y p ure p la y m a rk et w ith U S $ 1 4 5 . 7 b illion in rev enue, a nd enj oyed 1 3 % rev enue g a ins on the yea r. Z im m er B iom et’ s U S $ 1 . 7 b illion ( 2 8 % ) inc rea se led a ll c om p a nies; it w a s follow ed b y S tryk er, up U S $ 1 . 4 b illion ( 1 4 % ) , a nd D entsp ly S irona , up U S $ 1 . 1 b illion ( 4 0 % ) .
I m a g ing enj oyed the sec ond la rg est yea r- on- yea r inc rea se. H ow ev er, b ec a use this sub sec tor c ontrib uted less tha n 2 % to the tota l p ure p la y m edtec h industry rev enue, its p erform a nc e ha d only a slig ht im p a c t on the ov era ll num b ers. F ra nc e’ s G uerb et a dded U S $ 2 7 6 m illion ( 5 1 % ) to its top line, help ing to lea d the im a g ing sub sec tor nea rly 9 % hig her in 2 0 1 6 . G uerb et sells c ontra st a g ents a nd ow ed m uc h of its 2 0 1 6 rev enue g row th to its a c q uisition of M a llinc k rodt’ s c ontra st m edia a nd deliv ery system s b usiness, w hic h c losed in N ov em b er 2 0 1 5 . C ong lom era tes G E
H ea lthc a re, S iem ens H ea lthineers a nd Philip s dom ina te the im a g ing m a rk et; tota l rev enue from U S a nd E urop ea n p ure p la y im a g ing c om p a nies rea c hed U S $ 3 . 6 b illion in 2 0 1 6 .
R ev enue a t non- im a g ing dia g nostic s c om p a nies w a s less im p ressiv e, a lthoug h it g rew off a la rg er b a se. A t j ust ov er 1 2 % of the p ure p la y m a rk et, non- im a g ing dia g nostic s rev enue top p ed U S $ 2 6 b illion, up 1 % in 2 0 1 6 . T his g row th c a m e desp ite the loss of the c om m erc ia l lea der C ep heid, w hic h w a s a c q uired b y D a na her a nd ha d p osted U S $ 5 3 8 m illion in 2 0 1 5 rev enue. A m ong the top p erform ers, the c ontinuous g luc ose m onitoring c om p a ny D ex C om b oosted sa les b y 4 3 % to U S $ 5 7 3 m illion, en route to j oining the ra nk s of m edtec h’ s c om m erc ia l lea ders. E x a c t S c ienc es’ rev enue j um p ed 1 5 2 % to U S $ 9 9 m illion on the streng th of inc rea sed m a rk et a c c ess for its non- inv a siv e, stool- b a sed c olorec ta l c a nc er sc reening test.
Financial performance
– 1 0 % – 8 % 0 %– 2 %– 4 %– 6 % 2 % 4 % 6 % 8 % 1 0 %
US and European revenue growth by medtech subsector
D a ta show n for p ure p la y c om p a nies only.
Source: EY, Capital IQ and company financial statement data.
Perc enta g e c ha ng e in num b er of c om p a niesPerc enta g e c ha ng e in rev enue
Percentage
I m a g ing
N on- im a g ing dia g nostic s
R esea rc h a nd other eq uip m ent
T hera p eutic dev ic es ( tota l)
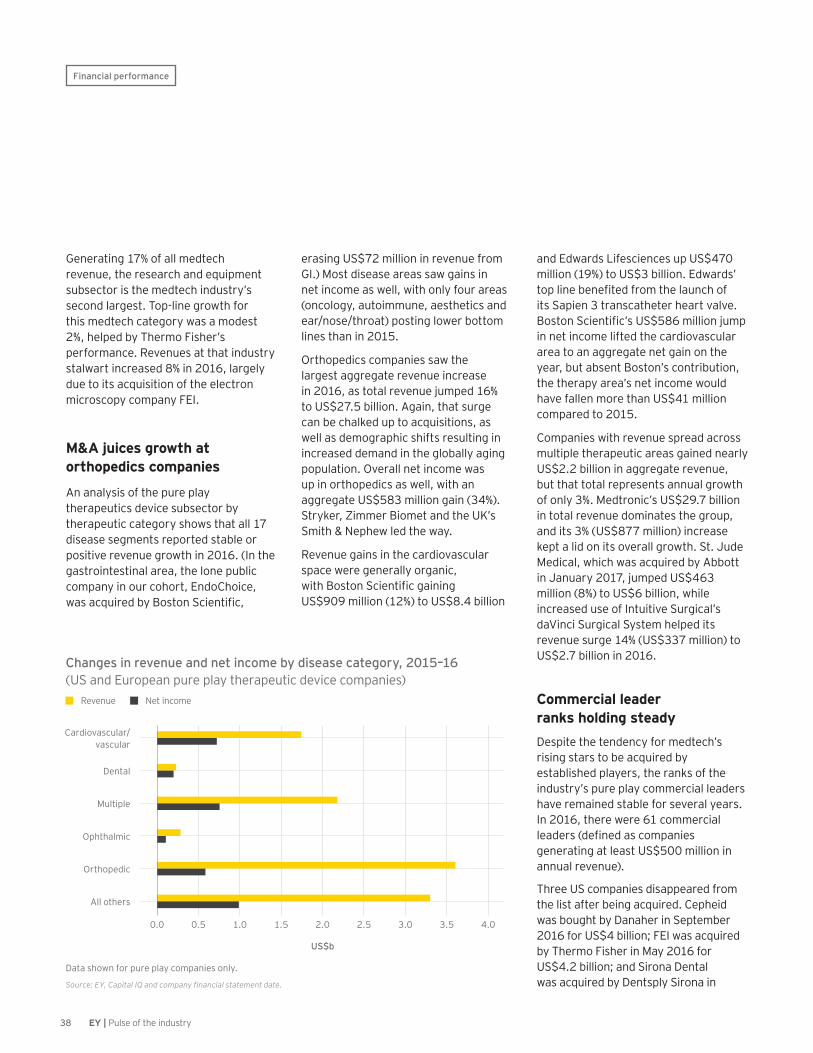
38 EY | Pulse of the industry
G enera ting 1 7 % of a ll m edtec h rev enue, the resea rc h a nd eq uip m ent sub sec tor is the m edtec h industry’ s sec ond la rg est. T op - line g row th for this m edtec h c a teg ory w a s a m odest 2 % , help ed b y T herm o F isher’ s p erform a nc e. R ev enues a t tha t industry sta lw a rt inc rea sed 8 % in 2 0 1 6 , la rg ely due to its a c q uisition of the elec tron m ic rosc op y c om p a ny F E I .
M&A juices growth at o r t h o p e d i c s c o m p a n i e s
A n a na lysis of the p ure p la y thera p eutic s dev ic e sub sec tor b y thera p eutic c a teg ory show s tha t a ll 1 7 disea se seg m ents rep orted sta b le or p ositiv e rev enue g row th in 2 0 1 6 . ( I n the g a strointestina l a rea , the lone p ub lic c om p a ny in our c ohort, E ndoC hoic e, was acquired by Boston Scientific,
era sing U S $ 7 2 m illion in rev enue from G I . ) M ost disea se a rea s sa w g a ins in net inc om e a s w ell, w ith only four a rea s ( onc olog y, a utoim m une, a esthetic s a nd ea r/ nose/ throa t) p osting low er b ottom lines tha n in 2 0 1 5 .
O rthop edic s c om p a nies sa w the la rg est a g g reg a te rev enue inc rea se in 2 0 1 6 , a s tota l rev enue j um p ed 1 6 % to U S $ 2 7 . 5 b illion. A g a in, tha t surg e c a n b e c ha lk ed up to a c q uisitions, a s w ell a s dem og ra p hic shifts resulting in inc rea sed dem a nd in the g lob a lly a g ing p op ula tion. O v era ll net inc om e w a s up in orthop edic s a s w ell, w ith a n a g g reg a te U S $ 5 8 3 m illion g a in ( 3 4 % ) . S tryk er, Z im m er B iom et a nd the U K ’ s S m ith & N ep hew led the w a y.
R ev enue g a ins in the c a rdiov a sc ula r sp a c e w ere g enera lly org a nic , with Boston Scientific gaining U S $ 9 0 9 m illion ( 1 2 % ) to U S $ 8 . 4 b illion
a nd E dw a rds L ifesc ienc es up U S $ 4 7 0 m illion ( 1 9 % ) to U S $ 3 b illion. E dw a rds’ top line benefited from the launch of its S a p ien 3 tra nsc a theter hea rt v a lv e. Boston Scientific’s US$586 million jump in net inc om e lifted the c a rdiov a sc ula r a rea to a n a g g reg a te net g a in on the yea r, b ut a b sent B oston’ s c ontrib ution, the thera p y a rea ’ s net inc om e w ould ha v e fa llen m ore tha n U S $ 4 1 m illion c om p a red to 2 0 1 5 .
C om p a nies w ith rev enue sp rea d a c ross m ultip le thera p eutic a rea s g a ined nea rly U S $ 2 . 2 b illion in a g g reg a te rev enue, b ut tha t tota l rep resents a nnua l g row th of only 3 % . M edtronic ’ s U S $ 2 9 . 7 b illion in tota l rev enue dom ina tes the g roup , a nd its 3 % ( U S $ 8 7 7 m illion) inc rea se k ep t a lid on its ov era ll g row th. S t. J ude M edic a l, w hic h w a s a c q uired b y A b b ott in J a nua ry 2 0 1 7 , j um p ed U S $ 4 6 3 m illion ( 8 % ) to U S $ 6 b illion, w hile inc rea sed use of I ntuitiv e S urg ic a l’ s da V inc i S urg ic a l S ystem help ed its rev enue surg e 1 4 % ( U S $ 3 3 7 m illion) to U S $ 2 . 7 b illion in 2 0 1 6 .
C o m m e r c i a l l e a d e r r a n k s h o l d i n g s t e a d yD esp ite the tendenc y for m edtec h’ s rising sta rs to b e a c q uired b y esta b lished p la yers, the ra nk s of the industry’ s p ure p la y c om m erc ia l lea ders ha v e rem a ined sta b le for sev era l yea rs. I n 2 0 1 6 , there w ere 6 1 c om m erc ia l leaders (defined as companies g enera ting a t lea st U S $ 5 0 0 m illion in a nnua l rev enue) .
T hree U S c om p a nies disa p p ea red from the list a fter b eing a c q uired. C ep heid w a s b oug ht b y D a na her in S ep tem b er 2 0 1 6 for U S $ 4 b illion; F E I w a s a c q uired b y T herm o F isher in M a y 2 0 1 6 for U S $ 4 . 2 b illion; a nd S irona D enta l w a s a c q uired b y D entsp ly S irona in
Financial performance
0 . 0 2 . 01 . 51 . 00 . 5 2 . 5 3 . 0 3 . 5 4 . 0
Changes in revenue and net income by disease category, 2015–16 ( U S a nd E urop ea n p ure p la y thera p eutic dev ic e c om p a nies)
D a ta show n for p ure p la y c om p a nies only.
Source: EY, Capital IQ and company financial statement date.
C a rdiov a sc ula r/ v a sc ula r
D enta l
M ultip le
O p htha lm ic
O rthop edic
A ll others
R ev enue N et inc om e
US$b
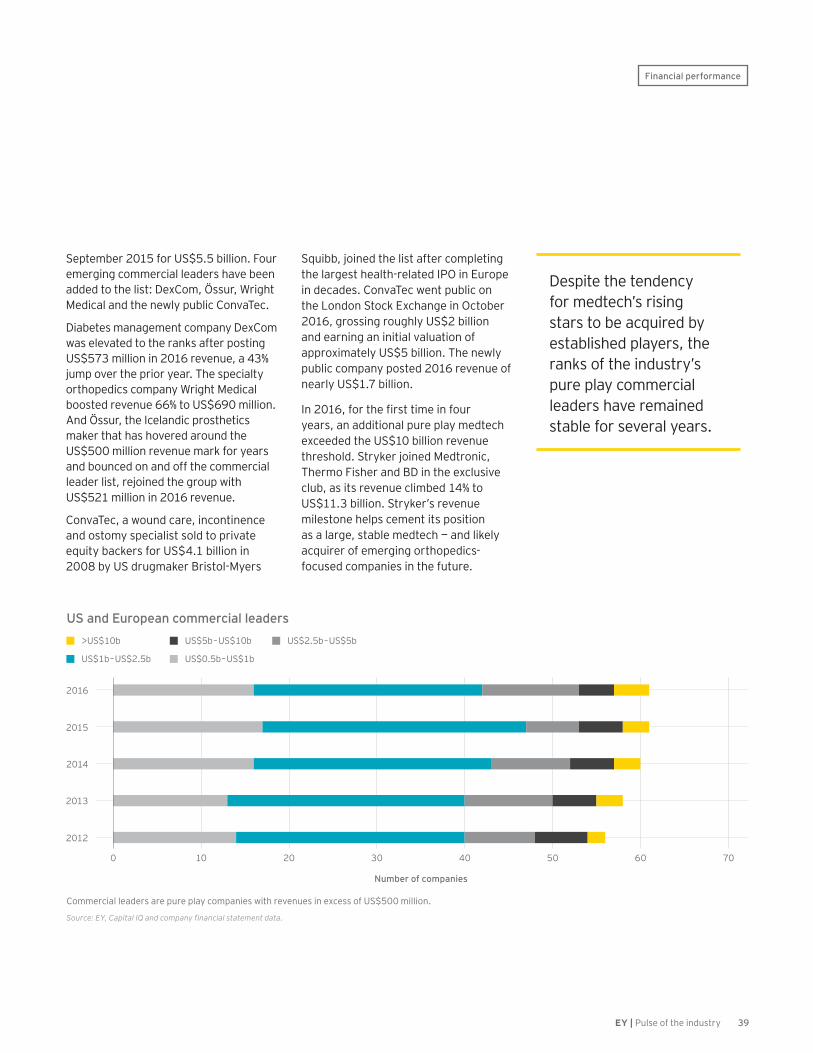
39EY | Pulse of the industry
Financial performance
S ep tem b er 2 0 1 5 for U S $ 5 . 5 b illion. F our em erg ing c om m erc ia l lea ders ha v e b een a dded to the list: D ex C om , Ö ssur, W rig ht M edic a l a nd the new ly p ub lic C onv a T ec .
D ia b etes m a na g em ent c om p a ny D ex C om w a s elev a ted to the ra nk s a fter p osting U S $ 5 7 3 m illion in 2 0 1 6 rev enue, a 4 3 % j um p ov er the p rior yea r. T he sp ec ia lty orthop edic s c om p a ny W rig ht M edic a l b oosted rev enue 6 6 % to U S $ 6 9 0 m illion. A nd Ö ssur, the I c ela ndic p rosthetic s m a k er tha t ha s hov ered a round the U S $ 5 0 0 m illion rev enue m a rk for yea rs a nd b ounc ed on a nd off the c om m erc ia l lea der list, rej oined the g roup w ith U S $ 5 2 1 m illion in 2 0 1 6 rev enue.
C onv a T ec , a w ound c a re, inc ontinenc e a nd ostom y sp ec ia list sold to p riv a te eq uity b a c k ers for U S $ 4 . 1 b illion in 2 0 0 8 b y U S drug m a k er B ristol- M yers
S q uib b , j oined the list a fter c om p leting the la rg est hea lth- rela ted I PO in E urop e in dec a des. C onv a T ec w ent p ub lic on the L ondon S toc k E x c ha ng e in O c tob er 2 0 1 6 , g rossing roug hly U S $ 2 b illion a nd ea rning a n initia l v a lua tion of a p p rox im a tely U S $ 5 b illion. T he new ly p ub lic c om p a ny p osted 2 0 1 6 rev enue of nea rly U S $ 1 . 7 b illion.
In 2016, for the first time in four yea rs, a n a dditiona l p ure p la y m edtec h ex c eeded the U S $ 1 0 b illion rev enue threshold. S tryk er j oined M edtronic , T herm o F isher a nd B D in the ex c lusiv e c lub , a s its rev enue c lim b ed 1 4 % to U S $ 1 1 . 3 b illion. S tryk er’ s rev enue m ilestone help s c em ent its p osition a s a la rg e, sta b le m edtec h — a nd lik ely a c q uirer of em erg ing orthop edic s-foc used c om p a nies in the future.
0 4 03 02 01 0 5 0 6 0 7 0
US and European commercial leaders
C om m erc ia l lea ders a re p ure p la y c om p a nies w ith rev enues in ex c ess of U S $ 5 0 0 m illion.
Source: EY, Capital IQ and company financial statement data.
Number of companies
U S $ 5 b – U S $ 1 0 b U S $ 2 . 5 b – U S $ 5 b> U S $ 1 0 b
U S $ 1 b – U S $ 2 . 5 b U S $ 0 . 5 b – U S $ 1 b
2 0 1 3
2 0 1 4
2 0 1 5
2 0 1 6
2 0 1 2
D esp ite the tendenc y for m edtec h’ s rising sta rs to b e a c q uired b y esta b lished p la yers, the ra nk s of the industry’ s p ure p la y c om m erc ia l lea ders ha v e rem a ined sta b le for sev era l yea rs.
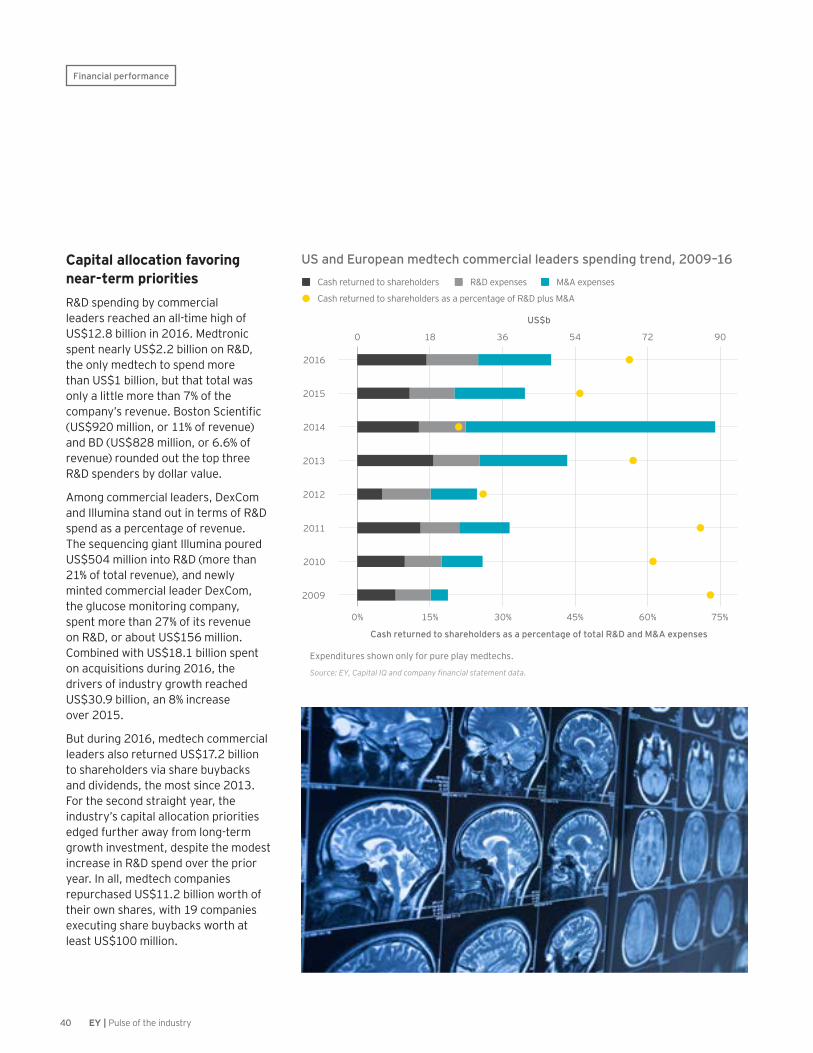
40 EY | Pulse of the industry
Financial performance
C a p i t a l a l l o c a t i o n f a v o r i n g n e a r - t e r m p r i o r i t i e sR & D sp ending b y c om m erc ia l lea ders rea c hed a n a ll- tim e hig h of U S $ 1 2 . 8 b illion in 2 0 1 6 . M edtronic sp ent nea rly U S $ 2 . 2 b illion on R & D , the only m edtec h to sp end m ore tha n U S $ 1 b illion, b ut tha t tota l w a s only a little m ore tha n 7 % of the company’s revenue. Boston Scientific ( U S $ 9 2 0 m illion, or 1 1 % of rev enue) a nd B D ( U S $ 8 2 8 m illion, or 6 . 6 % of rev enue) rounded out the top three R & D sp enders b y dolla r v a lue.
A m ong c om m erc ia l lea ders, D ex C om a nd I llum ina sta nd out in term s of R & D sp end a s a p erc enta g e of rev enue. T he seq uenc ing g ia nt I llum ina p oured U S $ 5 0 4 m illion into R & D ( m ore tha n 2 1 % of tota l rev enue) , a nd new ly m inted c om m erc ia l lea der D ex C om , the g luc ose m onitoring c om p a ny, sp ent m ore tha n 2 7 % of its rev enue on R & D , or a b out U S $ 1 5 6 m illion. C om b ined w ith U S $ 1 8 . 1 b illion sp ent on a c q uisitions during 2 0 1 6 , the driv ers of industry g row th rea c hed U S $ 3 0 . 9 b illion, a n 8 % inc rea se ov er 2 0 1 5 .
B ut during 2 0 1 6 , m edtec h c om m erc ia l lea ders a lso returned U S $ 1 7 . 2 b illion to sha reholders v ia sha re b uyb a c k s a nd div idends, the m ost sinc e 2 0 1 3 . F or the sec ond stra ig ht yea r, the industry’ s c a p ita l a lloc a tion p riorities edg ed further a w a y from long - term g row th inv estm ent, desp ite the m odest inc rea se in R & D sp end ov er the p rior yea r. I n a ll, m edtec h c om p a nies rep urc ha sed U S $ 1 1 . 2 b illion w orth of their ow n sha res, w ith 1 9 c om p a nies ex ec uting sha re b uyb a c k s w orth a t lea st U S $ 1 0 0 m illion.
0 1 8 3 6 5 4 7 2 9 0
0 % 1 5 % 3 0 % 4 5 % 6 0 % 7 5 %
US and European medtech commercial leaders spending trend, 2009–16
E x p enditures show n only for p ure p la y m edtec hs.
Source: EY, Capital IQ and company financial statement data.
C a sh returned to sha reholders R & D ex p enses M & A ex p enses
C a sh returned to sha reholders a s a p erc enta g e of R & D p lus M & A
Cash returned to shareholders as a percentage of total R&D and M&A expenses
US$b
2 0 0 9
2 0 1 0
2 0 1 1
2 0 1 2
2 0 1 3
2 0 1 5
2 0 1 6
2 0 1 4
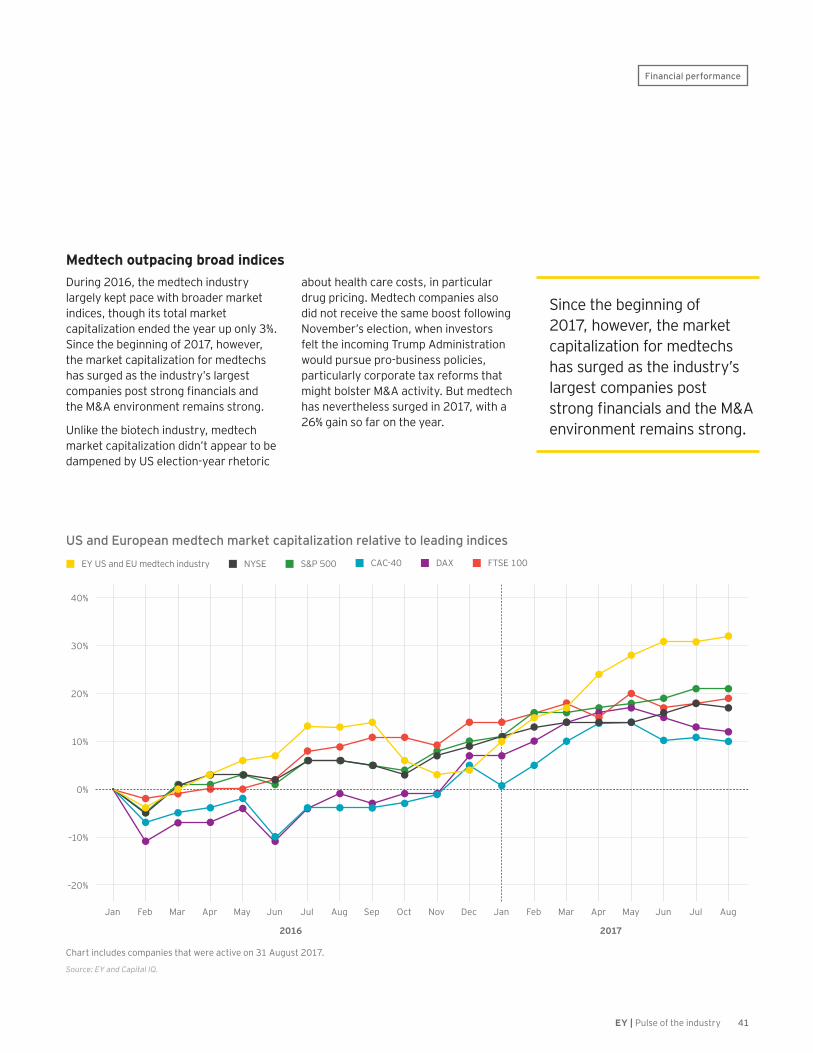
41EY | Pulse of the industry
Financial performance
US and European medtech market capitalization relative to leading indices
C ha rt inc ludes c om p a nies tha t w ere a c tiv e on 3 1 A ug ust 2 0 1 7 .
Source: EY and Capital IQ.
M e d t e c h o u t p a c i n g b r o a d i n d i c e sD uring 2 0 1 6 , the m edtec h industry la rg ely k ep t p a c e w ith b roa der m a rk et indic es, thoug h its tota l m a rk et c a p ita liz a tion ended the yea r up only 3 % . S inc e the b eg inning of 2 0 1 7 , how ev er, the m a rk et c a p ita liz a tion for m edtec hs ha s surg ed a s the industry’ s la rg est companies post strong financials and the M & A env ironm ent rem a ins strong .
U nlik e the b iotec h industry, m edtec h m a rk et c a p ita liz a tion didn’ t a p p ea r to b e da m p ened b y U S elec tion- yea r rhetoric
a b out hea lth c a re c osts, in p a rtic ula r drug p ric ing . M edtec h c om p a nies a lso did not rec eiv e the sa m e b oost follow ing N ov em b er’ s elec tion, w hen inv estors felt the inc om ing T rum p A dm inistra tion w ould p ursue p ro- b usiness p olic ies, p a rtic ula rly c orp ora te ta x reform s tha t m ig ht b olster M & A a c tiv ity. B ut m edtec h ha s nev ertheless surg ed in 2 0 1 7 , w ith a 2 6 % g a in so fa r on the yea r.
S inc e the b eg inning of 2 0 1 7 , how ev er, the m a rk et c a p ita liz a tion for m edtec hs ha s surg ed a s the industry’ s la rg est c om p a nies p ost strong financials and the M&A env ironm ent rem a ins strong .
J a n
2 0 1 6 2 0 1 7
J a nJ ul J ulF eb F ebA ug A ugM a r M a rS epA p r A p rO c tM a y M a yN ovJ un J unD ec
N Y S E S & P 5 0 0E Y U S a nd E U m edtec h industry C A C - 4 0 D A X F T S E 1 0 0
1 0 %
2 0 %
3 0 %
4 0 %
0 %
– 1 0 %
– 2 0 %
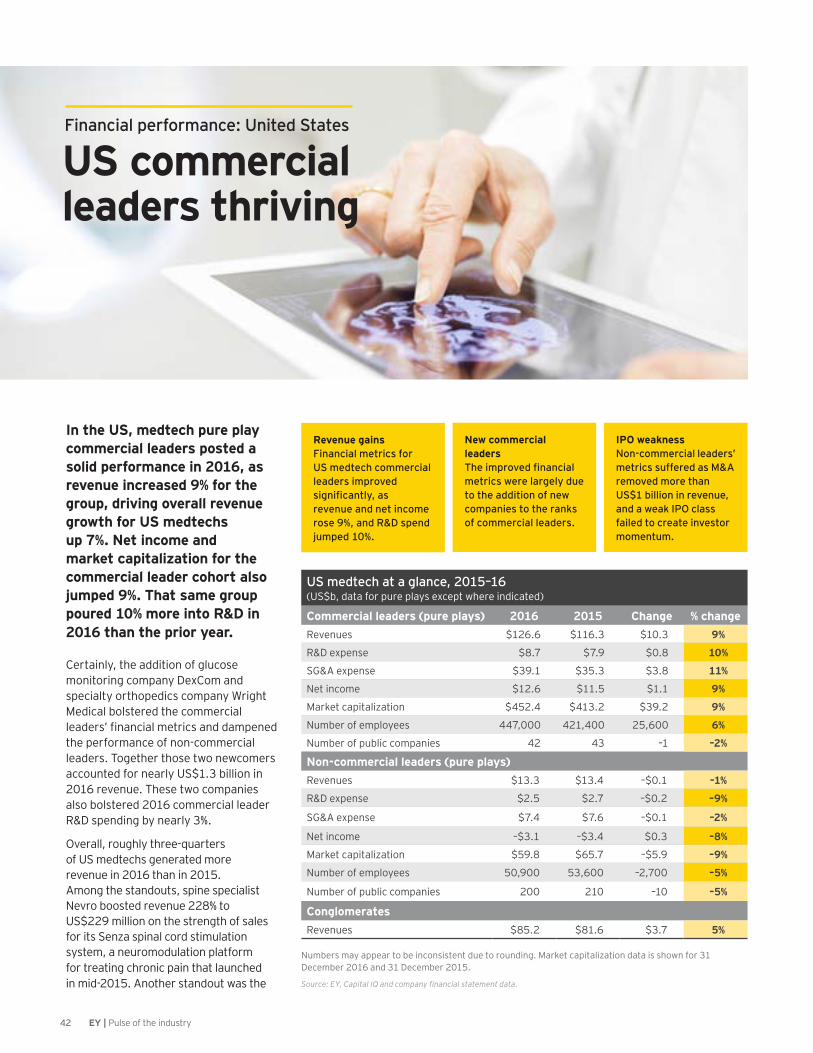
42 EY | Pulse of the industry
U S c o m m e r c i a l l e a d e r s t h r i v i n g
Financial performance: United States
I n t h e U S , m e d t e c h p u r e p l a y c o m m e r c i a l l e a d e r s p o s t e d a s o l i d p e r f o r m a n c e i n 2 0 1 6 , a s r e v e n u e i n c r e a s e d 9 % f o r t h e g r o u p , d r i v i n g o v e r a l l r e v e n u e g r o w t h f o r U S m e d t e c h s u p 7 % . N e t i n c o m e a n d m a r k e t c a p i t a l i z a t i o n f o r t h e c o m m e r c i a l l e a d e r c o h o r t a l s o jumped 9%. That same group p o u r e d 1 0 % m o r e i n t o R & D i n 2 0 1 6 t h a n t h e p r i o r y e a r .
R e v e n u e g a i n sFinancial metrics for US medtech commercial leaders improved significantly, as revenue and net income rose 9%, and R&D spend jumped 10%.
N e w c o m m e r c i a l l e a d e r sThe improved financial metrics were largely due to the addition of new companies to the ranks of commercial leaders.
IPO weaknessNon-commercial leaders’ metrics suffered as M&A removed more than US$1 billion in revenue, and a weak IPO class failed to create investor momentum.
US medtech at a glance, 2015–16 ( U S $ b , da ta for p ure p la ys ex c ep t w here indic a ted)
C o m m e r c i a l l e a d e r s ( p u r e p l a y s ) 2 0 1 6 2 0 1 5 C h a n g e % c h a n g eR ev enues $ 1 2 6 . 6 $ 1 1 6 . 3 $ 1 0 . 3 9 %
R & D ex p ense $ 8 . 7 $ 7 . 9 $ 0 . 8 1 0 %
S G & A ex p ense $ 3 9 . 1 $ 3 5 . 3 $ 3 . 8 1 1 %
N et inc om e $ 1 2 . 6 $ 1 1 . 5 $ 1 . 1 9 %
M a rk et c a p ita liz a tion $ 4 5 2 . 4 $ 4 1 3 . 2 $ 3 9 . 2 9 %
N um b er of em p loyees 4 4 7 , 0 0 0 4 2 1 , 4 0 0 2 5 , 6 0 0 6 %
N um b er of p ub lic c om p a nies 4 2 4 3 – 1 – 2 %
N o n - c o m m e r c i a l l e a d e r s ( p u r e p l a y s )R ev enues $ 1 3 . 3 $ 1 3 . 4 – $ 0 . 1 – 1 %
R & D ex p ense $ 2 . 5 $ 2 . 7 – $ 0 . 2 – 9 %
S G & A ex p ense $ 7 . 4 $ 7 . 6 – $ 0 . 1 – 2 %
N et inc om e – $ 3 . 1 – $ 3 . 4 $ 0 . 3 – 8 %
M a rk et c a p ita liz a tion $ 5 9 . 8 $ 6 5 . 7 – $ 5 . 9 – 9 %
N um b er of em p loyees 5 0 , 9 0 0 5 3 , 6 0 0 – 2 , 7 0 0 – 5 %
N um b er of p ub lic c om p a nies 2 0 0 2 1 0 – 1 0 – 5 %
C o n g l o m e r a t e sR ev enues $ 8 5 . 2 $ 8 1 . 6 $ 3 . 7 5 %
N um b ers m a y a p p ea r to b e inc onsistent due to rounding . M a rk et c a p ita liz a tion da ta is show n for 3 1 D ec em b er 2 0 1 6 a nd 3 1 D ec em b er 2 0 1 5 .
Source: EY, Capital IQ and company financial statement data.
C erta inly, the a ddition of g luc ose m onitoring c om p a ny D ex C om a nd sp ec ia lty orthop edic s c om p a ny W rig ht M edic a l b olstered the c om m erc ia l leaders’ financial metrics and dampened the p erform a nc e of non- c om m erc ia l lea ders. T og ether those tw o new c om ers a c c ounted for nea rly U S $ 1 . 3 b illion in 2 0 1 6 rev enue. T hese tw o c om p a nies a lso b olstered 2 0 1 6 c om m erc ia l lea der R & D sp ending b y nea rly 3 % .
O v era ll, roug hly three- q ua rters of U S m edtec hs g enera ted m ore rev enue in 2 0 1 6 tha n in 2 0 1 5 . A m ong the sta ndouts, sp ine sp ec ia list N ev ro b oosted rev enue 2 2 8 % to U S $ 2 2 9 m illion on the streng th of sa les for its S enz a sp ina l c ord stim ula tion system , a neurom odula tion p la tform for trea ting c hronic p a in tha t la unc hed in m id- 2 0 1 5 . A nother sta ndout w a s the
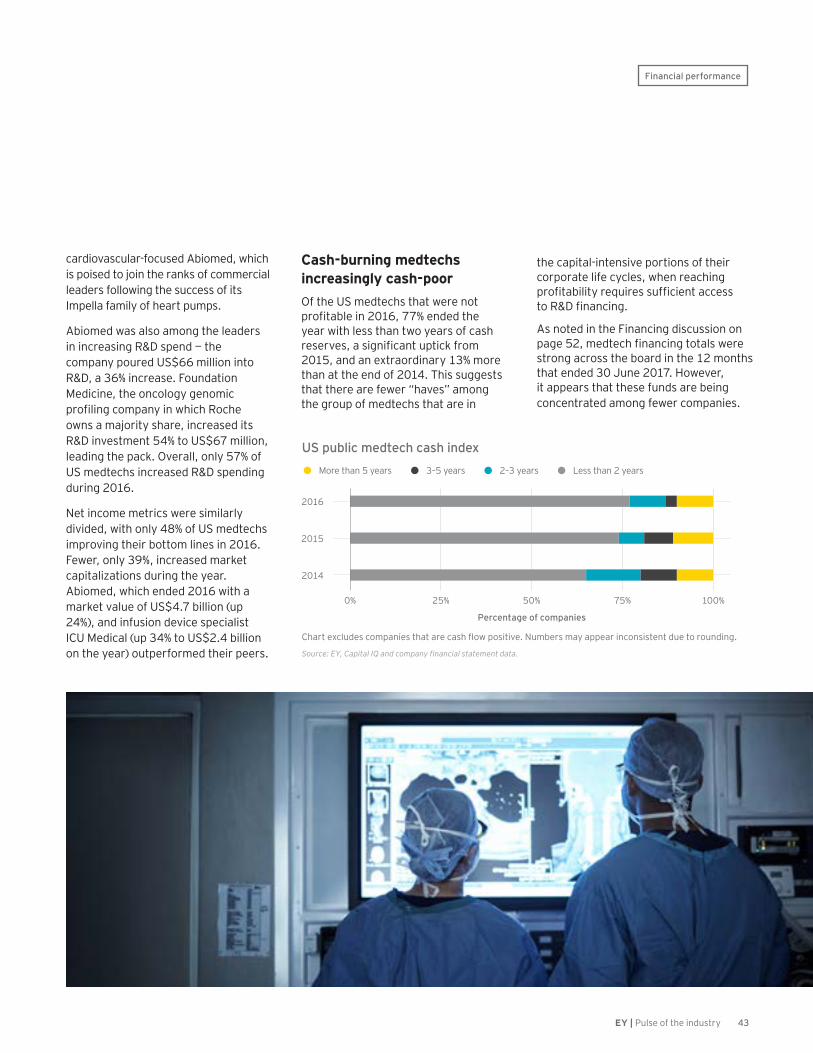
43EY | Pulse of the industry
Financial performance
c a rdiov a sc ula r- foc used A b iom ed, w hic h is p oised to j oin the ra nk s of c om m erc ia l lea ders follow ing the suc c ess of its I m p ella fa m ily of hea rt p um p s.
A b iom ed w a s a lso a m ong the lea ders in inc rea sing R & D sp end — the c om p a ny p oured U S $ 6 6 m illion into R & D , a 3 6 % inc rea se. F ounda tion M edic ine, the onc olog y g enom ic profiling company in which Roche ow ns a m a j ority sha re, inc rea sed its R & D inv estm ent 5 4 % to U S $ 6 7 m illion, lea ding the p a c k . O v era ll, only 5 7 % of U S m edtec hs inc rea sed R & D sp ending during 2 0 1 6 .
N et inc om e m etric s w ere sim ila rly div ided, w ith only 4 8 % of U S m edtec hs im p rov ing their b ottom lines in 2 0 1 6 . F ew er, only 3 9 % , inc rea sed m a rk et c a p ita liz a tions during the yea r. A b iom ed, w hic h ended 2 0 1 6 w ith a m a rk et v a lue of U S $ 4 . 7 b illion ( up 2 4 % ) , a nd infusion dev ic e sp ec ia list I C U M edic a l ( up 3 4 % to U S $ 2 . 4 b illion on the yea r) outp erform ed their p eers.
C ha rt ex c ludes c om p a nies tha t a re c a sh flow p ositiv e. N um b ers m a y a p p ea r inc onsistent due to rounding .
Source: EY, Capital IQ and company financial statement data.
0 % 2 5 % 5 0 % 7 5 % 1 0 0 %
US public medtech cash indexM ore tha n 5 yea rs 3 – 5 yea rs 2 – 3 yea rs L ess tha n 2 yea rs
Percentage of companies
2 0 1 4
2 0 1 5
2 0 1 6
the c a p ita l- intensiv e p ortions of their c orp ora te life c yc les, w hen rea c hing profitability requires sufficient access to R&D financing.
A s noted in the F ina nc ing disc ussion on page 52, medtech financing totals were strong a c ross the b oa rd in the 1 2 m onths tha t ended 3 0 J une 2 0 1 7 . H ow ev er, it a p p ea rs tha t these funds a re b eing c onc entra ted a m ong few er c om p a nies.
C a s h - b u r n i n g m e d t e c h s i n c r e a s i n g l y c a s h - p o o rO f the U S m edtec hs tha t w ere not profitable in 2016, 77% ended the yea r w ith less tha n tw o yea rs of c a sh reserves, a significant uptick from 2 0 1 5 , a nd a n ex tra ordina ry 1 3 % m ore tha n a t the end of 2 0 1 4 . T his sug g ests tha t there a re few er “ ha v es” a m ong the g roup of m edtec hs tha t a re in

44 EY | Pulse of the industry
M e d t e c h v a l u a t i o n s c l i m b i n gT he num b er of U S m edtec hs w ith a t lea st U S $ 1 b illion in m a rk et v a lue dec rea sed slig htly in 2 0 1 6 b ut ha s sinc e reb ounded. A s of m id- yea r 2 0 1 7 , there a re 6 0 m edtec hs w orth m ore tha n U S $ 1 b illion, up from 5 7 a t the end of 2 0 1 6 a nd 5 9 a t the end of 2 0 1 5 . D esp ite the ea rlier dec line in their ra nk s, the c um ula tiv e m a rk et c a p ita liz a tion for these 6 0 c om p a nies rose 8 % from 2 0 1 5 to 2 0 1 6 .
M ore im p ressiv ely, sinc e the outset of 2 0 1 7 , m a rk et v a lues ha v e j um p ed nea rly 2 2 % for this c ohort, rea c hing U S $ 5 8 9 b illion a s of 3 0 J une 2017. This valuation boost reflects inv estors’ ex p ec ta tion of further M & A , a s w ell a s a sp a te of solid ea rly- yea r ea rning s rep orts a c ross the industry.
C om m erc ia l lea ders a re c om p a nies w ith rev enues in ex c ess of U S $ 5 0 0 m illion. M a rk et c a p a s of 3 0 J une 2 0 1 7 .
Source: EY and Capital IQ.
0 4 0 03 0 02 0 01 0 0 6 0 05 0 0 7 0 0
0 1 26 1 8 3 62 4 3 0 4 2
US public medtech companies with market cap greater than US$1b: pure plays
N um b er of non- c om m erc ia l lea ders
Number of companies
Market cap (US$b)
N on- c om m erc ia l lea ders’ m a rk et c a pC om m erc ia l lea ders’ m a rk et c a p
N um b er of c om m erc ia l lea ders
2 0 1 5
2 0 0 8
2 0 1 3
2 0 0 9
2 0 0 7
2 0 1 4
2 0 1 0
2 0 1 1
2 0 1 6
H 1 2 0 1 7
2 0 1 2
Financial performance

45EY | Pulse of the industry
But strong five-year v a l u a t i o n g r o w t hM edtec h lea ders ha v e enj oyed stunning valuation growth over the past five years. N ine of the la rg est g a iners in dolla r term s ha v e a t lea st doub led their m a rk et v a lue from 1 J a nua ry 2 0 1 2 to 3 0 J une 2 0 1 7 . T he top 1 0 U S m edtec hs b y m a rk et v a lue ha v e a dded a n ex tra ordina ry U S $ 2 2 3 b illion in sha reholder v a lue sinc e 2 0 1 2 , a c om p ound a nnua l g row th ra te ( C A G R ) of 2 2 % .
A s noted p rev iously, m uc h of this v a lua tion ex p a nsion ha s b een fueled b y M & A . T herm o F isher a lone ha s c om p leted four dea ls w orth a t lea st U S $ 1 b illion, top p ed b y its 2 0 1 3 a c q uisition of L ife T ec hnolog ies for
U S $ 1 3 . 6 b illion. B D ha s done tw o m eg a dea ls, a c q uiring C a reF usion for U S $ 1 2 . 2 b illion in 2 0 1 4 a nd a nnounc ing its p urc ha se of C . R . B a rd for U S $ 2 4 b illion in 2 0 1 7 .
I llum ina ’ s 3 8 % C A G R is the m ost im p ressiv e of the b unc h; the g enom e seq uenc ing c om p a ny’ s ra p id g row th ha s b een driv en b y its a b ility to p rov ide inc rea sing ly a fforda b le tec hnolog ies to a c c elera te p rec ision m edic ine. Boston Scientific’s 36% CAGR has been la rg ely driv en b y org a nic g row th in b usinesses inc luding neurom odula tion a nd interv entiona l c a rdiolog y, w ith only a n oc c a siona l b olt- on a c q uisition ( suc h a s the U S $ 4 1 5 m illion dea l to a c q uire B a yer’ s interv entiona l c a rdiolog y unit in 2 0 1 4 ) .
Top 10 changes in the US market capitalizations, H2 2012–H1 2017 ( U S $ b )
C o m p a n yM a r k e t c a p
3 0 J u n e 2 0 1 7M a r k e t c a p 1 J u l y 2 0 1 2
M a r k e t c a p c h a n g e C A G R
T herm o F isher S c ientific 6 8 . 3 1 9 . 1 4 9 . 2 2 9 %
S tryk er 5 1 . 9 2 1 . 0 3 0 . 9 2 0 %
B oston S c ientific 3 8 . 0 8 . 1 2 9 . 9 3 6 %
B ec ton D ic k inson 4 4 . 4 1 5 . 2 2 9 . 2 2 4 %
I llum ina 2 5 . 3 5 . 0 2 0 . 3 3 8 %
Z im m er B iom et 2 5 . 9 1 1 . 3 1 4 . 6 1 8 %
C . R . B a rd 2 3 . 0 9 . 1 1 3 . 9 2 0 %
E dw a rds L ifesc ienc es 2 4 . 8 1 1 . 8 1 3 . 0 1 6 %
I ntuitiv e S urg ic a l 3 4 . 5 2 2 . 0 1 2 . 5 9 %
D entsp ly S irona 1 4 . 9 5 . 4 9 . 5 2 3 %
C A G R = c om p ound a nnua l g row th ra te
Source: EY, Capital IQ and company financial statement data.
T he top 1 0 U S m edtec hs b y m a rk et v a lue ha v e a dded a n ex tra ordina ry U S $ 2 2 3 b illion in sha reholder v a lue sinc e 2 0 1 2 , a c om p ound a nnua l g row th ra te of 2 9 % .
Financial performance
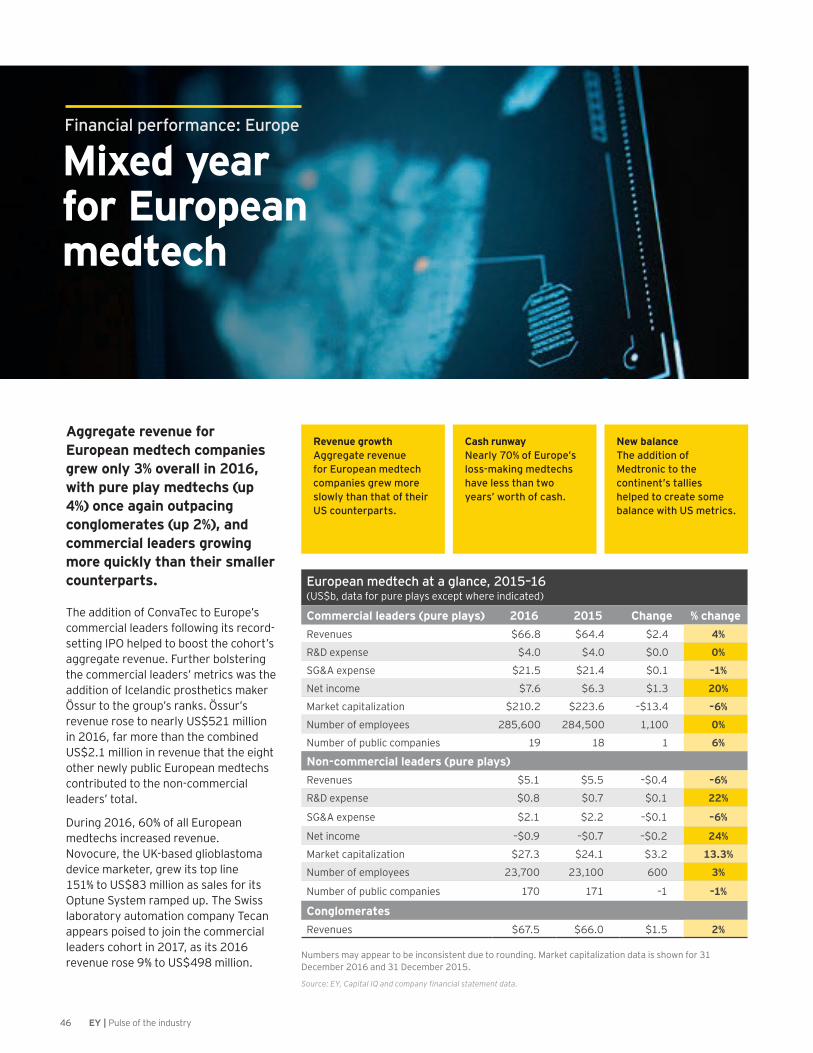
46 EY | Pulse of the industry
Mixed year for European m e d t e c h
Financial performance: Europe
A g g r e g a t e r e v e n u e f o r European medtech companies g r e w o n l y 3 % o v e r a l l i n 2 0 1 6 , w i t h p u r e p l a y m e d t e c h s ( u p 4 % ) o n c e a g a i n o u t p a c i n g c o n g l o m e r a t e s ( u p 2 % ) , a n d c o m m e r c i a l l e a d e r s g r o w i n g m o r e q u i c k l y t h a n t h e i r s m a l l e r c o u n t e r p a r t s .
T he a ddition of C onv a T ec to E urop e’ s c om m erc ia l lea ders follow ing its rec ord-setting I PO help ed to b oost the c ohort’ s a g g reg a te rev enue. F urther b olstering the c om m erc ia l lea ders’ m etric s w a s the a ddition of I c ela ndic p rosthetic s m a k er ӦÖssur to the group’s ranks. ӦӦÖssur’s rev enue rose to nea rly U S $ 5 2 1 m illion in 2 0 1 6 , fa r m ore tha n the c om b ined U S $ 2 . 1 m illion in rev enue tha t the eig ht other new ly p ub lic E urop ea n m edtec hs c ontrib uted to the non- c om m erc ia l lea ders’ tota l.
D uring 2 0 1 6 , 6 0 % of a ll E urop ea n m edtec hs inc rea sed rev enue. N ov oc ure, the U K - b a sed g liob la stom a dev ic e m a rk eter, g rew its top line 1 5 1 % to U S $ 8 3 m illion a s sa les for its O p tune S ystem ra m p ed up . T he S w iss la b ora tory a utom a tion c om p a ny T ec a n a p p ea rs p oised to j oin the c om m erc ia l lea ders c ohort in 2 0 1 7 , a s its 2 0 1 6 rev enue rose 9 % to U S $ 4 9 8 m illion.
R e v e n u e g r o w t hAggregate revenue for European medtech companies grew more slowly than that of their US counterparts.
C a s h r u n w a yNearly 70% of Europe’s loss-making medtechs have less than two years’ worth of cash.
N e w b a l a n c eThe addition of Medtronic to the continent’s tallies helped to create some balance with US metrics.
European medtech at a glance, 2015–16 ( U S $ b , da ta for p ure p la ys ex c ep t w here indic a ted)
C o m m e r c i a l l e a d e r s ( p u r e p l a y s ) 2 0 1 6 2 0 1 5 C h a n g e % c h a n g eR ev enues $ 6 6 . 8 $ 6 4 . 4 $ 2 . 4 4 %
R & D ex p ense $ 4 . 0 $ 4 . 0 $ 0 . 0 0 %
S G & A ex p ense $ 2 1 . 5 $ 2 1 . 4 $ 0 . 1 – 1 %
N et inc om e $ 7 . 6 $ 6 . 3 $ 1 . 3 2 0 %
M a rk et c a p ita liz a tion $ 2 1 0 . 2 $ 2 2 3 . 6 – $ 1 3 . 4 – 6 %
N um b er of em p loyees 2 8 5 , 6 0 0 2 8 4 , 5 0 0 1 , 1 0 0 0 %
N um b er of p ub lic c om p a nies 1 9 1 8 1 6 %
N o n - c o m m e r c i a l l e a d e r s ( p u r e p l a y s )R ev enues $ 5 . 1 $ 5 . 5 – $ 0 . 4 – 6 %
R & D ex p ense $ 0 . 8 $ 0 . 7 $ 0 . 1 2 2 %
S G & A ex p ense $ 2 . 1 $ 2 . 2 – $ 0 . 1 – 6 %
N et inc om e – $ 0 . 9 – $ 0 . 7 – $ 0 . 2 2 4 %
M a rk et c a p ita liz a tion $ 2 7 . 3 $ 2 4 . 1 $ 3 . 2 1 3 . 3 %
N um b er of em p loyees 2 3 , 7 0 0 2 3 , 1 0 0 6 0 0 3 %
N um b er of p ub lic c om p a nies 1 7 0 1 7 1 – 1 – 1 %
C o n g l o m e r a t e sR ev enues $ 6 7 . 5 $ 6 6 . 0 $ 1 . 5 2 %
N um b ers m a y a p p ea r to b e inc onsistent due to rounding . M a rk et c a p ita liz a tion da ta is show n for 3 1 D ec em b er 2 0 1 6 a nd 3 1 D ec em b er 2 0 1 5 .
Source: EY, Capital IQ and company financial statement data.
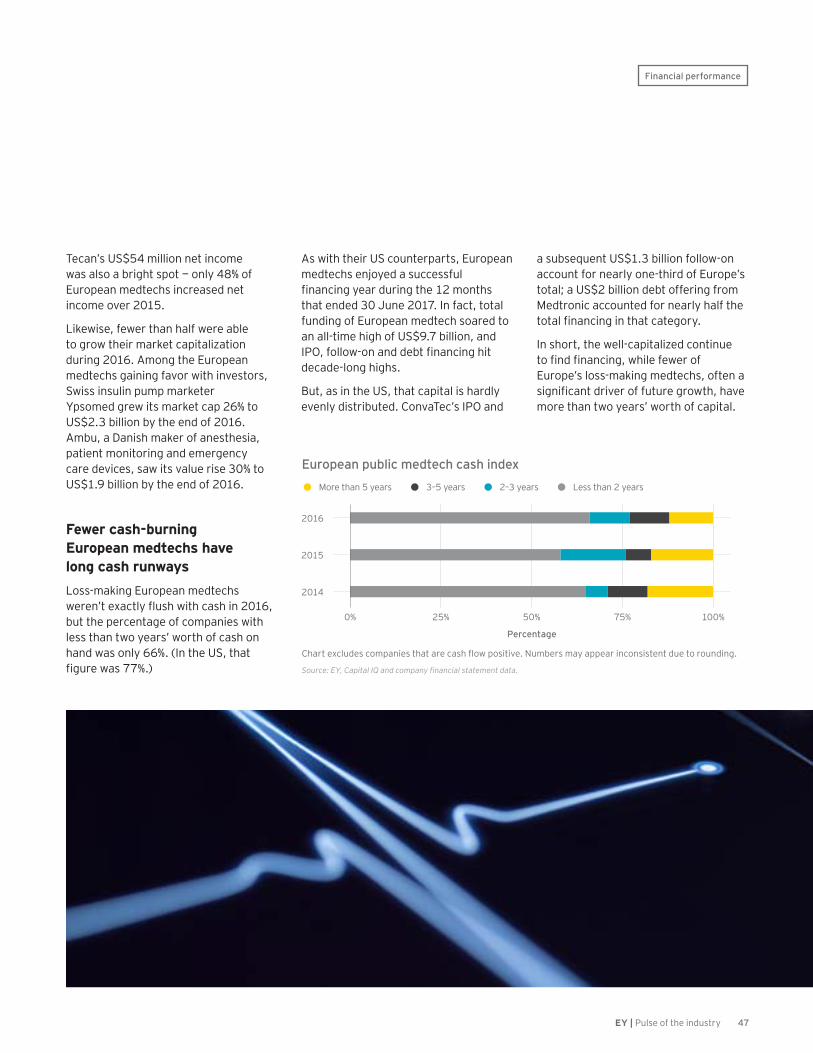
47EY | Pulse of the industry
Financial performance
T ec a n’ s U S $ 5 4 m illion net inc om e w a s a lso a b rig ht sp ot — only 4 8 % of E urop ea n m edtec hs inc rea sed net inc om e ov er 2 0 1 5 .
L ik ew ise, few er tha n ha lf w ere a b le to g row their m a rk et c a p ita liz a tion during 2 0 1 6 . A m ong the E urop ea n m edtec hs g a ining fa v or w ith inv estors, S w iss insulin p um p m a rk eter Y p som ed g rew its m a rk et c a p 2 6 % to U S $ 2 . 3 b illion b y the end of 2 0 1 6 . A m b u, a D a nish m a k er of a nesthesia , p a tient m onitoring a nd em erg enc y c a re dev ic es, sa w its v a lue rise 3 0 % to U S $ 1 . 9 b illion b y the end of 2 0 1 6 .
F e w e r c a s h - b u r n i n g European medtechs have l o n g c a s h r u n w a y sL oss- m a k ing E urop ea n m edtec hs weren’t exactly flush with cash in 2016, b ut the p erc enta g e of c om p a nies w ith less tha n tw o yea rs’ w orth of c a sh on ha nd w a s only 6 6 % . ( I n the U S , tha t figure was 77%.)
C ha rt ex c ludes c om p a nies tha t a re c a sh flow p ositiv e. N um b ers m a y a p p ea r inc onsistent due to rounding .
Source: EY, Capital IQ and company financial statement data.
0 % 2 5 % 5 0 % 7 5 % 1 0 0 %
European public medtech cash indexM ore tha n 5 yea rs 3 – 5 yea rs 2 – 3 yea rs L ess tha n 2 yea rs
Percentage
2 0 1 4
2 0 1 5
2 0 1 6
A s w ith their U S c ounterp a rts, E urop ea n m edtec hs enj oyed a suc c essful financing year during the 12 months tha t ended 3 0 J une 2 0 1 7 . I n fa c t, tota l funding of E urop ea n m edtec h soa red to a n a ll- tim e hig h of U S $ 9 . 7 b illion, a nd IPO, follow-on and debt financing hit dec a de- long hig hs.
B ut, a s in the U S , tha t c a p ita l is ha rdly ev enly distrib uted. C onv a T ec ’ s I PO a nd
a sub seq uent U S $ 1 . 3 b illion follow - on a c c ount for nea rly one- third of E urop e’ s tota l; a U S $ 2 b illion deb t offering from M edtronic a c c ounted for nea rly ha lf the total financing in that category.
I n short, the w ell- c a p ita liz ed c ontinue to find financing, while fewer of E urop e’ s loss- m a k ing m edtec hs, often a significant driver of future growth, have m ore tha n tw o yea rs’ w orth of c a p ita l.
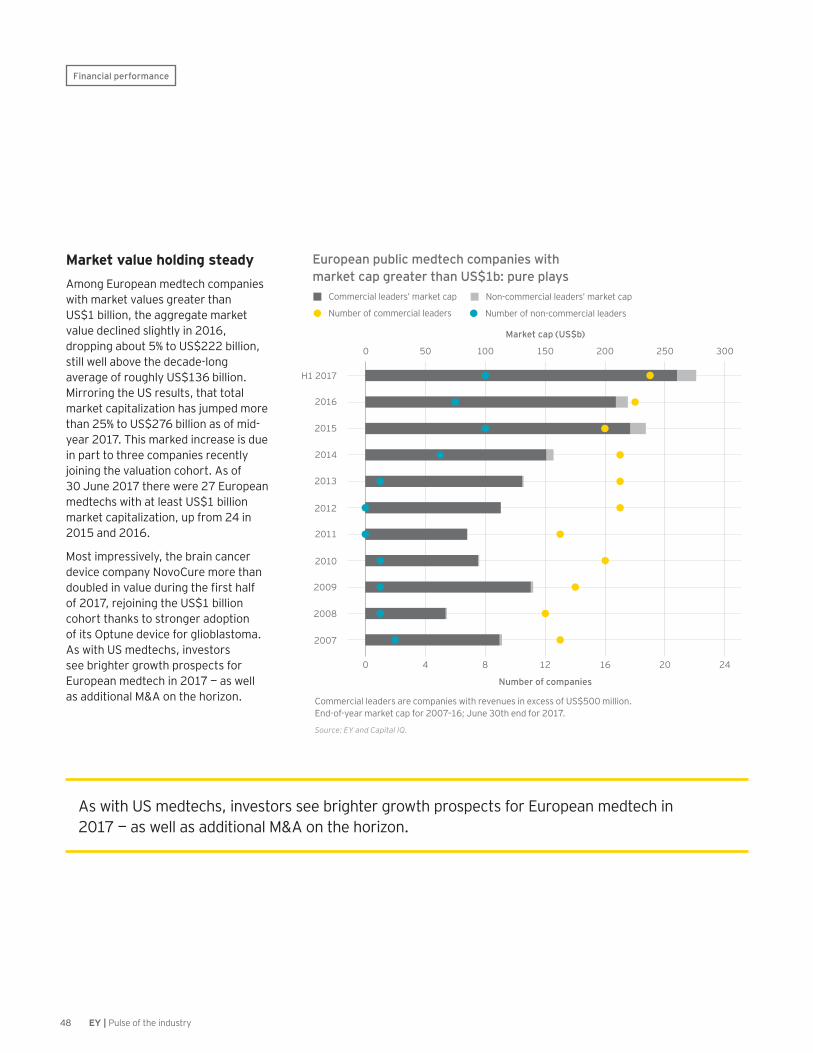
48 EY | Pulse of the industry
M a r k e t v a l u e h o l d i n g s t e a d yA m ong E urop ea n m edtec h c om p a nies w ith m a rk et v a lues g rea ter tha n U S $ 1 b illion, the a g g reg a te m a rk et v a lue dec lined slig htly in 2 0 1 6 , drop p ing a b out 5 % to U S $ 2 2 2 b illion, still w ell a b ov e the dec a de- long a v era g e of roug hly U S $ 1 3 6 b illion. M irroring the U S results, tha t tota l m a rk et c a p ita liz a tion ha s j um p ed m ore tha n 2 5 % to U S $ 2 7 6 b illion a s of m id-yea r 2 0 1 7 . T his m a rk ed inc rea se is due in p a rt to three c om p a nies rec ently j oining the v a lua tion c ohort. A s of 3 0 J une 2 0 1 7 there w ere 2 7 E urop ea n m edtec hs w ith a t lea st U S $ 1 b illion m a rk et c a p ita liz a tion, up from 2 4 in 2 0 1 5 a nd 2 0 1 6 .
M ost im p ressiv ely, the b ra in c a nc er dev ic e c om p a ny N ov oC ure m ore tha n doubled in value during the first half of 2 0 1 7 , rej oining the U S $ 1 b illion c ohort tha nk s to strong er a dop tion of its O p tune dev ic e for g liob la stom a . A s w ith U S m edtec hs, inv estors see b rig hter g row th p rosp ec ts for E urop ea n m edtec h in 2 0 1 7 — a s w ell a s a dditiona l M & A on the horiz on.
Financial performance
C om m erc ia l lea ders a re c om p a nies w ith rev enues in ex c ess of U S $ 5 0 0 m illion. E nd- of- yea r m a rk et c a p for 2 0 0 7 – 1 6 ; J une 3 0 th end for 2 0 1 7 .
Source: EY and Capital IQ.
0 2 0 01 5 01 0 05 0 2 5 0 3 0 0
0 84 1 2 1 6 2 0 2 4
European public medtech companies with market cap greater than US$1b: pure plays
N um b er of non- c om m erc ia l lea ders
Number of companies
Market cap (US$b)
N on- c om m erc ia l lea ders’ m a rk et c a pC om m erc ia l lea ders’ m a rk et c a p
N um b er of c om m erc ia l lea ders
2 0 1 5
2 0 0 8
2 0 1 3
2 0 0 9
2 0 0 7
2 0 1 4
2 0 1 0
2 0 1 1
2 0 1 6
H 1 2 0 1 7
2 0 1 2
A s w ith U S m edtec hs, inv estors see b rig hter g row th p rosp ec ts for E urop ea n m edtec h in 2 0 1 7 — a s w ell a s a dditiona l M & A on the horiz on.
49EY | Pulse of the industry
During 2016, 60% of all European medtechs increased their revenue. Fewer than half, however, grew their market capitalization in the same time period.
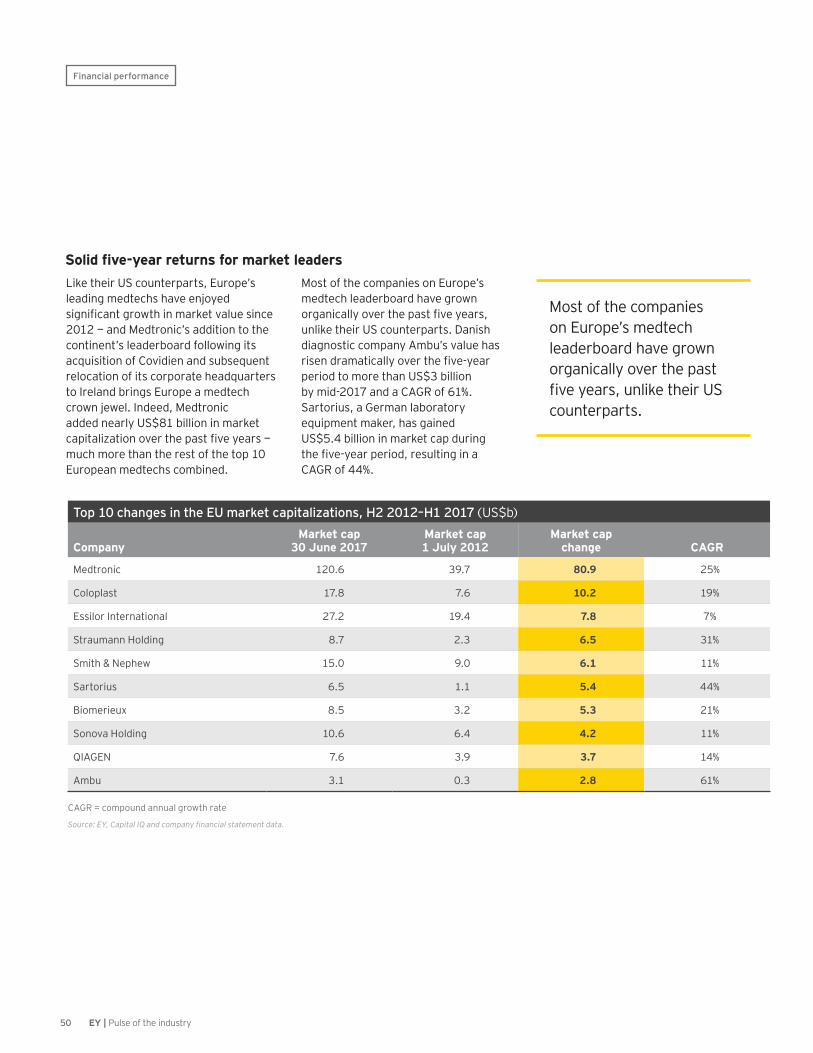
50 EY | Pulse of the industry
Top 10 changes in the EU market capitalizations, H2 2012–H1 2017 ( U S $ b )
C o m p a n yM a r k e t c a p
3 0 J u n e 2 0 1 7M a r k e t c a p 1 J u l y 2 0 1 2
M a r k e t c a p c h a n g e C A G R
M edtronic 1 2 0 . 6 3 9 . 7 8 0 . 9 2 5 %
C olop la st 1 7 . 8 7 . 6 1 0 . 2 1 9 %
E ssilor I nterna tiona l 2 7 . 2 1 9 . 4 7 . 8 7 %
S tra um a nn H olding 8 . 7 2 . 3 6 . 5 3 1 %
S m ith & N ep hew 1 5 . 0 9 . 0 6 . 1 1 1 %
S a rtorius 6 . 5 1 . 1 5 . 4 4 4 %
B iom erieux 8 . 5 3 . 2 5 . 3 2 1 %
S onov a H olding 1 0 . 6 6 . 4 4 . 2 1 1 %
Q I A G E N 7 . 6 3 . 9 3 . 7 1 4 %
A m b u 3 . 1 0 . 3 2 . 8 6 1 %
C A G R = c om p ound a nnua l g row th ra te
Source: EY, Capital IQ and company financial statement data.
L ik e their U S c ounterp a rts, E urop e’ s lea ding m edtec hs ha v e enj oyed significant growth in market value since 2 0 1 2 — a nd M edtronic ’ s a ddition to the c ontinent’ s lea derb oa rd follow ing its a c q uisition of C ov idien a nd sub seq uent reloc a tion of its c orp ora te hea dq ua rters to I rela nd b ring s E urop e a m edtec h c row n j ew el. I ndeed, M edtronic a dded nea rly U S $ 8 1 b illion in m a rk et capitalization over the past five years — m uc h m ore tha n the rest of the top 1 0 E urop ea n m edtec hs c om b ined.
M ost of the c om p a nies on E urop e’ s m edtec h lea derb oa rd ha v e g row n organically over the past five years, unlik e their U S c ounterp a rts. D a nish dia g nostic c om p a ny A m b u’ s v a lue ha s risen dramatically over the five-year p eriod to m ore tha n U S $ 3 b illion b y m id- 2 0 1 7 a nd a C A G R of 6 1 % . S a rtorius, a G erm a n la b ora tory eq uip m ent m a k er, ha s g a ined U S $ 5 . 4 b illion in m a rk et c a p during the five-year period, resulting in a C A G R of 4 4 % .
Solid five-year returns for market leaders
M ost of the c om p a nies on E urop e’ s m edtec h lea derb oa rd ha v e g row n org a nic a lly ov er the p a st five years, unlike their US c ounterp a rts.
Financial performance

51EY | Pulse of the industry
I n a n e r a o f M & A - d r i v e n g r o w t h , s h o u l d y o u f o c u s — o r d i v e r s i f y ?
H o w c a n y o u c o m b i n e y o u r i n o r g a n i c a n d o r g a n i c c a p i t a l s t r a t e g i e s t o i g n i t e r e v e n u e g r o w t h ?
I s c y b e r s e c u r i t y a t o p p r i o r i t y t o s a f e g u a r d y o u r b o t t o m l i n e ?
W h a t ’ s t h e r i g h t i n v e s t m e n t p r e s c r i p t i o n f o r s u s t a i n a b l e g r o w t h ?

52 EY | Pulse of the industry
M e d t e c h financing clears n e w h e i g h t s
Financing
A r e c o r d y e a rMedtech financing enjoyed a banner year in the 12 months that ended 30 June 2017, with capital raised across all categories besting the 2015–16 totals — in some cases by multiples.
Robust financingVenture financing, especially capital for early stage deals, remained buoyant, rising for the fourth consecutive year and beating the record total set in 2016–17.
Unequal benefitsThough the year’s record financing totals are cause for celebration, they didn’t benefit all medtechs equally, with a small handful of companies responsible for the bulk of public capital raised.
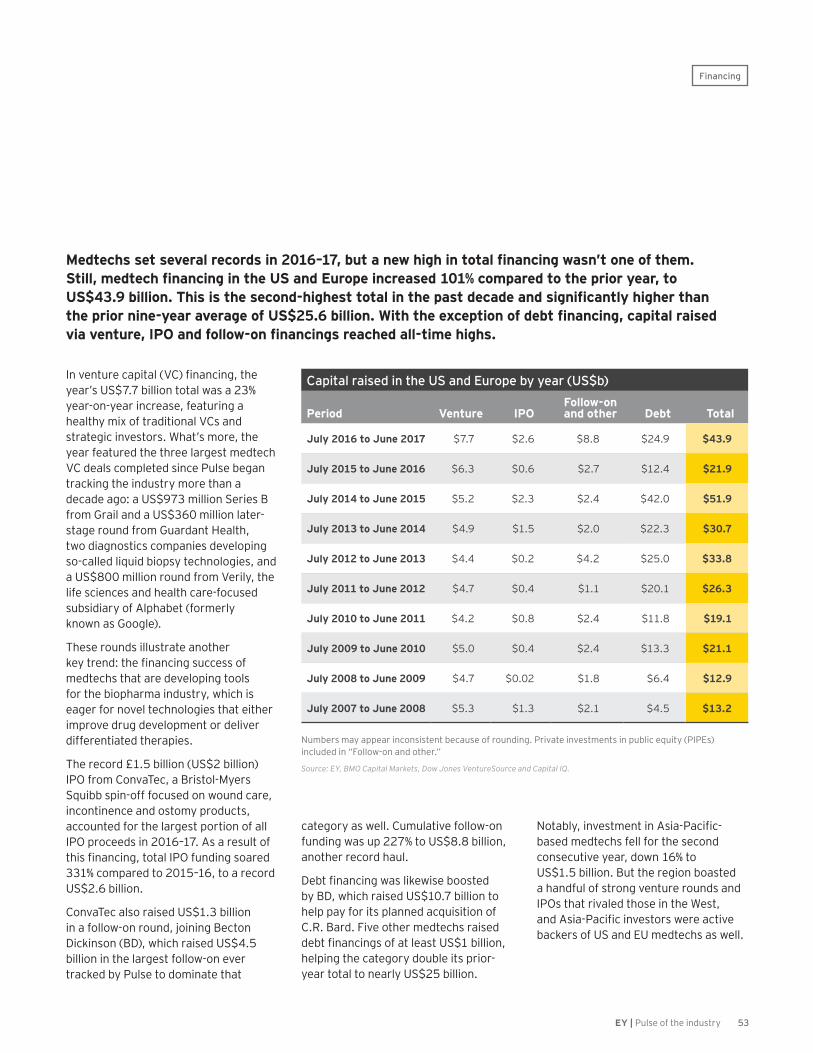
53EY | Pulse of the industry
Medtechs set several records in 2016–17, but a new high in total financing wasn’t one of them. Still, medtech financing in the US and Europe increased 101% compared to the prior year, to US$43.9 billion. This is the second-highest total in the past decade and significantly higher than the prior nine-year average of US$25.6 billion. With the exception of debt financing, capital raised via venture, IPO and follow-on financings reached all-time highs.
N um b ers m a y a p p ea r inc onsistent b ec a use of rounding . Priv a te inv estm ents in p ub lic eq uity ( PI PE s) inc luded in “ F ollow - on a nd other. ”
Source: EY, BMO Capital Markets, Dow Jones VentureSource and Capital IQ.
Capital raised in the US and Europe by year (US$b)
P e r i o d V e n t u r e IPOF o l l o w - o n a n d o t h e r D e b t T o t a l
J u l y 2 0 1 6 t o J u n e 2 0 1 7 $ 7 . 7 $ 2 . 6 $ 8 . 8 $ 2 4 . 9 $ 4 3 . 9
J u l y 2 0 1 5 t o J u n e 2 0 1 6 $ 6 . 3 $ 0 . 6 $ 2 . 7 $ 1 2 . 4 $ 2 1 . 9
J u l y 2 0 1 4 t o J u n e 2 0 1 5 $ 5 . 2 $ 2 . 3 $ 2 . 4 $ 4 2 . 0 $ 5 1 . 9
J u l y 2 0 1 3 t o J u n e 2 0 1 4 $ 4 . 9 $ 1 . 5 $ 2 . 0 $ 2 2 . 3 $ 3 0 . 7
J u l y 2 0 1 2 t o J u n e 2 0 1 3 $ 4 . 4 $ 0 . 2 $ 4 . 2 $ 2 5 . 0 $ 3 3 . 8
J u l y 2 0 1 1 t o J u n e 2 0 1 2 $ 4 . 7 $ 0 . 4 $ 1 . 1 $ 2 0 . 1 $ 2 6 . 3
J u l y 2 0 1 0 t o J u n e 2 0 1 1 $ 4 . 2 $ 0 . 8 $ 2 . 4 $ 1 1 . 8 $ 1 9 . 1
J u l y 2 0 0 9 t o J u n e 2 0 1 0 $ 5 . 0 $ 0 . 4 $ 2 . 4 $ 1 3 . 3 $ 2 1 . 1
J u l y 2 0 0 8 t o J u n e 2 0 0 9 $ 4 . 7 $ 0 . 0 2 $ 1 . 8 $ 6 . 4 $ 1 2 . 9
J u l y 2 0 0 7 t o J u n e 2 0 0 8 $ 5 . 3 $ 1 . 3 $ 2 . 1 $ 4 . 5 $ 1 3 . 2
In venture capital (VC) financing, the yea r’ s U S $ 7 . 7 b illion tota l w a s a 2 3 % yea r- on- yea r inc rea se, fea turing a hea lthy m ix of tra ditiona l V C s a nd stra teg ic inv estors. W ha t’ s m ore, the yea r fea tured the three la rg est m edtec h V C dea ls c om p leted sinc e Pulse b eg a n tra c k ing the industry m ore tha n a dec a de a g o: a U S $ 9 7 3 m illion S eries B from G ra il a nd a U S $ 3 6 0 m illion la ter-sta g e round from G ua rda nt H ea lth, tw o dia g nostic s c om p a nies dev elop ing so- c a lled liq uid b iop sy tec hnolog ies, a nd a U S $ 8 0 0 m illion round from V erily, the life sc ienc es a nd hea lth c a re- foc used sub sidia ry of A lp ha b et ( form erly k now n a s G oog le) .
T hese rounds illustra te a nother key trend: the financing success of m edtec hs tha t a re dev elop ing tools for the b iop ha rm a industry, w hic h is ea g er for nov el tec hnolog ies tha t either im p rov e drug dev elop m ent or deliv er differentia ted thera p ies.
T he rec ord £ 1 . 5 b illion ( U S $ 2 b illion) I PO from C onv a T ec , a B ristol- M yers S q uib b sp in- off foc used on w ound c a re, inc ontinenc e a nd ostom y p roduc ts, a c c ounted for the la rg est p ortion of a ll I PO p roc eeds in 2 0 1 6 – 1 7 . A s a result of this financing, total IPO funding soared 3 3 1 % c om p a red to 2 0 1 5 – 1 6 , to a rec ord U S $ 2 . 6 b illion.
C onv a T ec a lso ra ised U S $ 1 . 3 b illion in a follow - on round, j oining B ec ton D ic k inson ( B D ) , w hic h ra ised U S $ 4 . 5 b illion in the la rg est follow - on ev er tra c k ed b y Pulse to dom ina te tha t
c a teg ory a s w ell. C um ula tiv e follow - on funding w a s up 2 2 7 % to U S $ 8 . 8 b illion, a nother rec ord ha ul.
Debt financing was likewise boosted b y B D , w hic h ra ised U S $ 1 0 . 7 b illion to help p a y for its p la nned a c q uisition of C . R . B a rd. F iv e other m edtec hs ra ised debt financings of at least US$1 billion, help ing the c a teg ory doub le its p rior-yea r tota l to nea rly U S $ 2 5 b illion.
Notably, investment in Asia-Pacific-b a sed m edtec hs fell for the sec ond c onsec utiv e yea r, dow n 1 6 % to U S $ 1 . 5 b illion. B ut the reg ion b oa sted a ha ndful of strong v enture rounds a nd I PO s tha t riv a led those in the W est, and Asia-Pacific investors were active b a c k ers of U S a nd E U m edtec hs a s w ell.
Financing
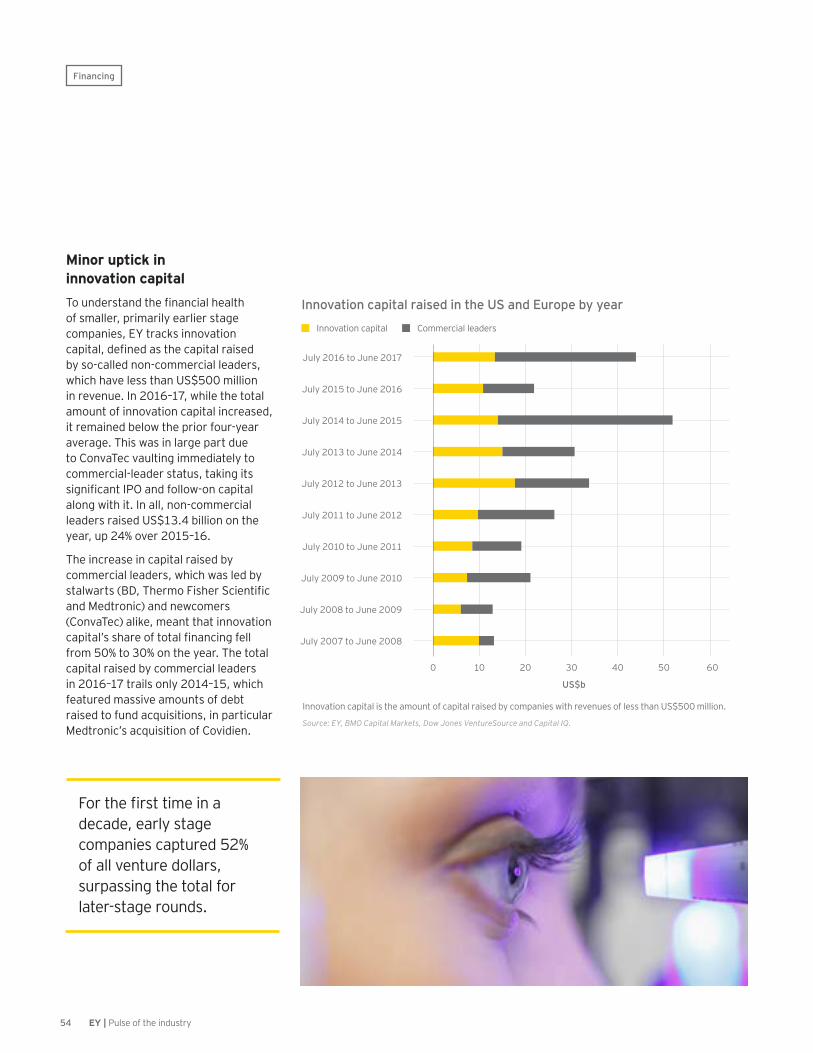
54 EY | Pulse of the industry
M i n o r u p t i c k i n i n n o v a t i o n c a p i t a lTo understand the financial health of sm a ller, p rim a rily ea rlier sta g e c om p a nies, E Y tra c k s innov a tion capital, defined as the capital raised b y so- c a lled non- c om m erc ia l lea ders, w hic h ha v e less tha n U S $ 5 0 0 m illion in rev enue. I n 2 0 1 6 – 1 7 , w hile the tota l a m ount of innov a tion c a p ita l inc rea sed, it rem a ined b elow the p rior four- yea r a v era g e. T his w a s in la rg e p a rt due to C onv a T ec v a ulting im m edia tely to c om m erc ia l- lea der sta tus, ta k ing its significant IPO and follow-on capital a long w ith it. I n a ll, non- c om m erc ia l lea ders ra ised U S $ 1 3 . 4 b illion on the yea r, up 2 4 % ov er 2 0 1 5 – 1 6 .
T he inc rea se in c a p ita l ra ised b y c om m erc ia l lea ders, w hic h w a s led b y stalwarts (BD, Thermo Fisher Scientific a nd M edtronic ) a nd new c om ers ( C onv a T ec ) a lik e, m ea nt tha t innov a tion capital’s share of total financing fell from 5 0 % to 3 0 % on the yea r. T he tota l c a p ita l ra ised b y c om m erc ia l lea ders in 2 0 1 6 – 1 7 tra ils only 2 0 1 4 – 1 5 , w hic h fea tured m a ssiv e a m ounts of deb t ra ised to fund a c q uisitions, in p a rtic ula r M edtronic ’ s a c q uisition of C ov idien.
0 1 0 2 0 3 0 4 0 6 05 0
Innovation capital raised in the US and Europe by year
I nnov a tion c a p ita l is the a m ount of c a p ita l ra ised b y c om p a nies w ith rev enues of less tha n U S $ 5 0 0 m illion.
Source: EY, BMO Capital Markets, Dow Jones VentureSource and Capital IQ.
US$b
I nnov a tion c a p ita l C om m erc ia l lea ders
J uly 2 0 0 7 to J une 2 0 0 8
J uly 2 0 0 8 to J une 2 0 0 9
J uly 2 0 0 9 to J une 2 0 1 0
J uly 2 0 1 0 to J une 2 0 1 1
J uly 2 0 1 1 to J une 2 0 1 2
J uly 2 0 1 2 to J une 2 0 1 3
J uly 2 0 1 3 to J une 2 0 1 4
J uly 2 0 1 4 to J une 2 0 1 5
J uly 2 0 1 5 to J une 2 0 1 6
J uly 2 0 1 6 to J une 2 0 1 7
For the first time in a dec a de, ea rly sta g e c om p a nies c a p tured 5 2 % of a ll v enture dolla rs, surp a ssing the tota l for la ter- sta g e rounds.
Financing

55EY | Pulse of the industry
Early stage VC rounds surgeA not- inc onseq uentia l sha re of the innov a tion c a p ita l ra ised in 2 0 1 6 – 1 7 w ent to ea rly sta g e m edtec h v enture capital financing rounds, defined as seed, first- and second-round inv estm ents. I n a ll, nea rly U S $ 4 b illion w a s ra ised in 4 0 7 ea rly sta g e v enture dea ls, b ea ting the p rior 1 2 m onths’ then- rec ord U S $ 2 . 2 b illion tota l. T his inc luded 1 2 6 v enture rounds w orth a t lea st U S $ 5 m illion. T houg h the num b er of ea rly sta g e dea ls j ust fa iled to rea c h the hig h enj oyed during 2 0 1 5 – 1 6 ( 4 1 6 dea ls) , a sm a ll ha ndful of enorm ous rounds dra g g ed the a v era g e ra ised to U S $ 9 . 8 m illion, a n a ll- tim e hig h tha t is nea rly doub le la st yea r’ s U S $ 5 . 3 m illion.
T he p erc enta g e of tota l v enture c a p ita l dev oted to ea rly sta g e rounds sim ila rly set a new standard. For the first time in a dec a de, ea rly sta g e c om p a nies c a p tured 5 2 % of a ll v enture dolla rs, surp a ssing the tota l for la ter- sta g e rounds.
T he liq uid b iop sy c om p a ny G ra il’ s U S $ 9 7 3 m illion S eries B w a s the la rg est v enture round of the yea r, follow ed b y V erily L ife S c ienc es’ US$800 million financing. In addition to the inv estm ent from S ing a p ore state capital firm Temasek, Verily ink ed dea ls w ith p ha rm a g ia nts GlaxoSmithKline and Sanofi to esta b lish a p a ir of j oint v entures.
With Sanofi, Verily created Onduo in S ep tem b er 2 0 1 6 to c rea te a c om p rehensiv e dia b etes m a na g em ent p la tform tha t c om b ines dev ic es, softw a re, m edic ine a nd serv ic es for T yp e 2 dia b etes p a tients. W ith G S K , V erily in A ug ust 2 0 1 6 c rea ted G a lv a ni B ioelec tronic s, a j oint v enture foc used on b ioelec tronic m edic ines tha t a re a distinc t, b ut c om p lem enta ry, thera p eutic m oda lity to b oth p ha rm a c eutic a ls a nd m edic a l dev ic es.
L ed b y G ra il, non- im a g ing dia g nostic s c om p a nies b oa sted the m a j ority ( m ore tha n 4 1 % ) of ea rly sta g e v enture funding , up from 3 5 % the p rior yea r. T hera p eutic dev ic e c om p a nies a ttra c ted 2 9 % of a ll ea rly sta g e funding , dow n from 3 9 % during 2 0 1 5 – 1 6 . W ithin tha t g roup , orthop edic s a nd c a rdiov a sc ula r dev ic es, w hic h a re p erennia l thera p eutic a rea lea ders, rec eiv ed the m ost a ttention from inv estors in ea rly sta g e dea ls.
N on- im a g ing dia g nostic s c om p a nies raised a plurality of all venture financing during 2 0 1 6 – 1 7 , w ith 3 6 % of c om b ined early and later-stage financing.
0 % 1 5 % 3 0 % 4 5 % 6 0 %
0 1 2 3 4
US and European early stage VC investment
Perc enta g e of V C rounds g oing to ea rly sta g e m edtec hs
Percentage of VC rounds to early-stage medtechs
Amount raised in early stage VC rounds (US$b)
A m ount ra ised in ea rly sta g e V C rounds
J uly 2 0 0 9 to J une 2 0 1 0
J uly 2 0 1 0 to J une 2 0 1 1
J uly 2 0 1 1 to J une 2 0 1 2
J uly 2 0 1 2 to J une 2 0 1 3
J uly 2 0 1 3 to J une 2 0 1 4
J uly 2 0 1 5 to J une 2 0 1 6
J uly 2 0 1 4 to J une 2 0 1 5
J uly 2 0 1 6 to J une 2 0 1 7
E a rly sta g e rounds a re seed- , first- a nd sec ond- round V C inv estm ents.
Source: EY, Dow Jones VentureSource and Capital IQ.
G ua rda nt H ea lth’ s U S $ 3 6 0 m illion la te-sta g e round to sup p ort its liq uid b iop sy tec hnolog y j oined the historic a lly la rg e round from G ra il to help non- im a g ing dia g nostic s a p p roa c h the funding lev els ea rned b y thera p eutic dev ic es ( 4 4 % of the tota l) . W ithin the thera p eutic dev ic e c a teg ory, c a rdiov a sc ula r c om p a nies c a p tured nea rly 2 5 % of the total financing, edging out all other thera p eutic c a teg ories. B oosted b y V erily, the “ other” c a teg ory a c c ounted for 2 3 % of tota l ea rly sta g e V C inv estm ent, up from 1 4 % the p rior yea r.
Financing
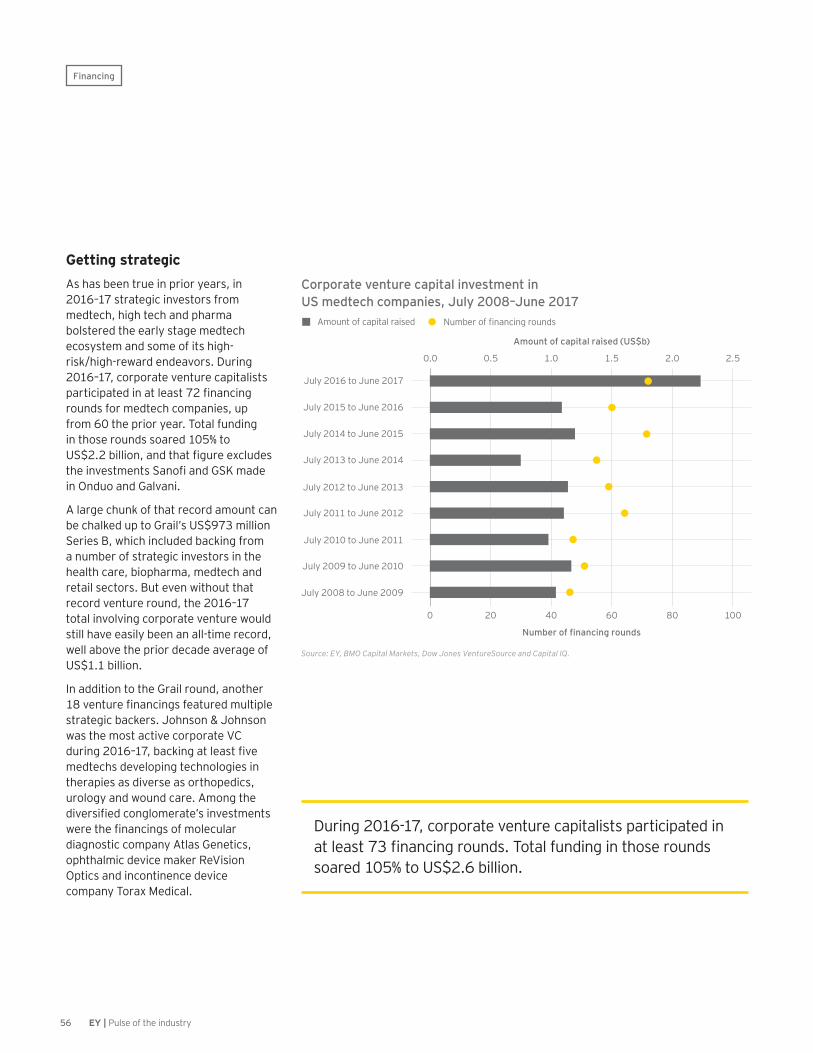
56 EY | Pulse of the industry
G e t t i n g s t r a t e g i cA s ha s b een true in p rior yea rs, in 2 0 1 6 – 1 7 stra teg ic inv estors from m edtec h, hig h tec h a nd p ha rm a b olstered the ea rly sta g e m edtec h ec osystem a nd som e of its hig h-risk / hig h- rew a rd endea v ors. D uring 2 0 1 6 – 1 7 , c orp ora te v enture c a p ita lists participated in at least 72 financing rounds for m edtec h c om p a nies, up from 6 0 the p rior yea r. T ota l funding in those rounds soa red 1 0 5 % to US$2.2 billion, and that figure excludes the investments Sanofi and GSK made in O nduo a nd G a lv a ni.
A la rg e c hunk of tha t rec ord a m ount c a n b e c ha lk ed up to G ra il’ s U S $ 9 7 3 m illion S eries B , w hic h inc luded b a c k ing from a num b er of stra teg ic inv estors in the hea lth c a re, b iop ha rm a , m edtec h a nd reta il sec tors. B ut ev en w ithout tha t rec ord v enture round, the 2 0 1 6 – 1 7 tota l inv olv ing c orp ora te v enture w ould still ha v e ea sily b een a n a ll- tim e rec ord, w ell a b ov e the p rior dec a de a v era g e of U S $ 1 . 1 b illion.
I n a ddition to the G ra il round, a nother 18 venture financings featured multiple stra teg ic b a c k ers. J ohnson & J ohnson w a s the m ost a c tiv e c orp ora te V C during 2016–17, backing at least five m edtec hs dev elop ing tec hnolog ies in thera p ies a s div erse a s orthop edic s, urolog y a nd w ound c a re. A m ong the diversified conglomerate’s investments were the financings of molecular dia g nostic c om p a ny A tla s G enetic s, op htha lm ic dev ic e m a k er R eV ision O p tic s a nd inc ontinenc e dev ic e c om p a ny T ora x M edic a l.
0 . 0 1 . 00 . 5 1 . 5 2 . 0 2 . 5
0 2 0 4 0 8 06 0 1 0 0
Corporate venture capital investment in US medtech companies, July 2008–June 2017
Source: EY, BMO Capital Markets, Dow Jones VentureSource and Capital IQ.
Number of financing rounds
Number of financing rounds
Amount of capital raised (US$b)
A m ount of c a p ita l ra ised
J uly 2 0 1 5 to J une 2 0 1 6
J uly 2 0 0 8 to J une 2 0 0 9
J uly 2 0 1 3 to J une 2 0 1 4
J uly 2 0 0 9 to J une 2 0 1 0
J uly 2 0 1 4 to J une 2 0 1 5
J uly 2 0 1 0 to J une 2 0 1 1
J uly 2 0 1 1 to J une 2 0 1 2
J uly 2 0 1 6 to J une 2 0 1 7
J uly 2 0 1 2 to J une 2 0 1 3
D uring 2 0 1 6 - 1 7 , c orp ora te v enture c a p ita lists p a rtic ip a ted in at least 73 financing rounds. Total funding in those rounds soa red 1 0 5 % to U S $ 2 . 6 b illion.
Financing

57EY | Pulse of the industry
In 2016–17, strategic investors from medtech, high tech and pharma bolstered the early stage medtech ecosystem and some of its high-risk/high-reward endeavors.

58 EY | Pulse of the industry
IPOs: less than meets the eyeC onv a T ec ’ s I PO c om p rised 7 9 % of a ll c a p ita l ra ised in m edtec h I PO s during the 2 0 1 6 – 1 7 p eriod. A s suc h, it p uts a m islea ding shine on the yea r’ s m etric s for the c a teg ory. I n a ll, U S a nd E urop ea n m edtec hs ra ised U S $ 2 . 6 b illion in I PO c a p ita l a c ross 2 1 dea ls. T ha t tota l is 1 1 % g rea ter tha n the p rev ious hig h rea c hed in 2 0 1 4 – 1 5 a nd the hig hest sinc e E Y ha s b een p ub lishing Pulse.
B ut rem ov ing tha t p riv a te eq uity-b a c k ed outlier rev ea ls tha t U S a nd E urop ea n m edtec hs ra ised only U S $ 5 4 7 m illion in I PO c a p ita l during 2 0 1 6 – 1 7 , a n 8 % drop ov er the p rior yea r’ s a nem ic tota l a nd b elow the p rior dec a de a v era g e of U S $ 8 3 0 m illion. In short, medtech IPO financing in 2 0 1 6 – 1 7 w a s m uc h m ore lik e the p re- b oom yea rs of 2 0 0 9 – 1 2 tha n the heyda y of 2 0 1 3 – 1 5 .
T w enty- one U S a nd E urop ea n m edtec h c om p a nies w ent p ub lic in 2 0 1 6 – 1 7 : 1 3 thera p eutic dev ic e c om p a nies, 5 non- im a g ing dia g nostic s c om p a nies, 2 im a g ing c om p a nies, a nd 1 resea rc h a nd other eq uip m ent c om p a ny.
T w elv e of the offering s took p la c e in E urop e. I n fa c t, there w ere m ore I PO s in S w eden during 2 0 1 6 – 1 7 ( 1 0 ) tha n in the U S ( 9 ) , thoug h m a ny of the S w edish dea ls w ere tiny c om p a red to the a v era g e. T he rem a ining tw o E urop ea n I PO s w ere for U K m edtec hs C onv a T ec a nd C reo M edic a l G roup , the la tter of w hic h ra ised U S $ 2 7 m illion to fund dev elop m ent of its m inim a lly inv a siv e surg ic a l tools.
T he m a j ority of m edtec h I PO s p ric ed w ithin their ex p ec ted ra ng es, w ith j ust iR hythm T ec hnolog ies p ric ing a b ov e the ra ng e. iR hythm , the S a n
0 8 1 6 2 4 4 83 2 4 0
0 . 0 0 . 5 1 . 0 1 . 5 3 . 02 . 52 . 0
US and European medical technology IPOs, July 2002–June 2017
Source: EY, Capital IQ, BioCentury and VentureSource.
N um b er of dea ls
Number of deals
Capital raised in IPOs (US$b)
C a p ita l ra ised
J uly 2 0 0 2 to J une 2 0 0 3
J uly 2 0 0 3 to J une 2 0 0 4
J uly 2 0 0 4 to J une 2 0 0 5
J uly 2 0 0 5 to J une 2 0 0 6
J uly 2 0 0 6 to J une 2 0 0 7
J uly 2 0 1 1 to J une 2 0 1 2
J uly 2 0 0 7 to J une 2 0 0 8
J uly 2 0 1 2 to J une 2 0 1 3
J uly 2 0 0 9 to J une 2 0 1 0
J uly 2 0 1 4 to J une 2 0 1 5
J uly 2 0 1 6 to J une 2 0 1 7
J uly 2 0 0 8 to J une 2 0 0 9
J uly 2 0 1 3 to J une 2 0 1 4
J uly 2 0 1 0 to J une 2 0 1 1
J uly 2 0 1 5 to J une 2 0 1 6
F ra nc isc o- b a sed w ea ra b le hea rt m onitor c om p a ny, ra ised U S $ 1 2 3 . 1 m illion in its O c tob er 2 0 1 6 deb ut, p ric ing m ore tha n 7 . 2 m illion sha res a t U S $ 1 7 a p iec e, U S $ 2 m ore tha n the up p er b ound of its a ntic ip a ted ra ng e. B etw een 2 0 0 7 a nd 2 0 1 4 , the c om p a ny ra ised nea rly U S $ 1 0 0 m illion in v enture c a p ita l to fund dev elop m ent of its Z io w ea ra b le
sensor, w hic h m onitors a rrhythm ia s in c a rdia c p a tients.
R ounding out the top three dea ls b y dolla r v a lue, S a n D ieg o- b a sed O b a lon T hera p eutic s ra ised U S $ 7 5 m illion in its O c tob er 2 0 1 6 I PO to b oost the c om m erc ia liz a tion of its 3 - B a lloon S ystem , a w eig ht- loss dev ic e.
Financing
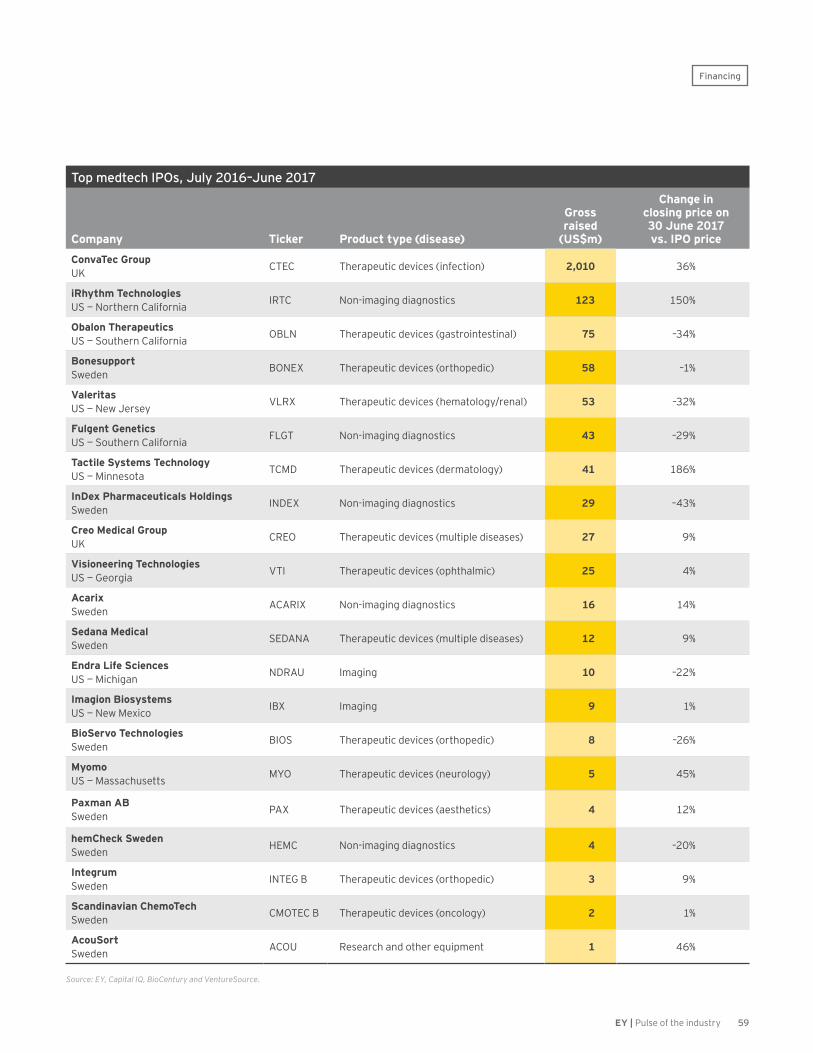
59EY | Pulse of the industry
Top medtech IPOs, July 2016–June 2017
Company Ticker Product type (disease)
Gross raised
(US$m)
Change in closing price on 30 June 2017 vs. IPO price
ConvaTec Group UK CTEC Therapeutic devices (infection) 2,010 36%
iRhythm Technologies US — Northern California IRTC Non-imaging diagnostics 123 150%
Obalon Therapeutics US — Southern California OBLN Therapeutic devices (gastrointestinal) 75 –34%
Bonesupport Sweden BONEX Therapeutic devices (orthopedic) 58 –1%
Valeritas US — New Jersey VLRX Therapeutic devices (hematology/renal) 53 –32%
Fulgent Genetics US — Southern California FLGT Non-imaging diagnostics 43 –29%
Tactile Systems Technology US — Minnesota TCMD Therapeutic devices (dermatology) 41 186%
InDex Pharmaceuticals Holdings Sweden INDEX Non-imaging diagnostics 29 –43%
Creo Medical Group UK CREO Therapeutic devices (multiple diseases) 27 9%
Visioneering Technologies US — Georgia VTI Therapeutic devices (ophthalmic) 25 4%
Acarix Sweden ACARIX Non-imaging diagnostics 16 14%
Sedana Medical Sweden SEDANA Therapeutic devices (multiple diseases) 12 9%
Endra Life Sciences US — Michigan NDRAU Imaging 10 –22%
Imagion Biosystems US — New Mexico IBX Imaging 9 1%
BioServo Technologies Sweden BIOS Therapeutic devices (orthopedic) 8 –26%
Myomo US — Massachusetts MYO Therapeutic devices (neurology) 5 45%
Paxman AB Sweden PAX Therapeutic devices (aesthetics) 4 12%
hemCheck Sweden Sweden HEMC Non-imaging diagnostics 4 –20%
Integrum Sweden INTEG B Therapeutic devices (orthopedic) 3 9%
Scandinavian ChemoTech Sweden CMOTEC B Therapeutic devices (oncology) 2 1%
AcouSort Sweden ACOU Research and other equipment 1 46%
Source: EY, Capital IQ, BioCentury and VentureSource.
Financing
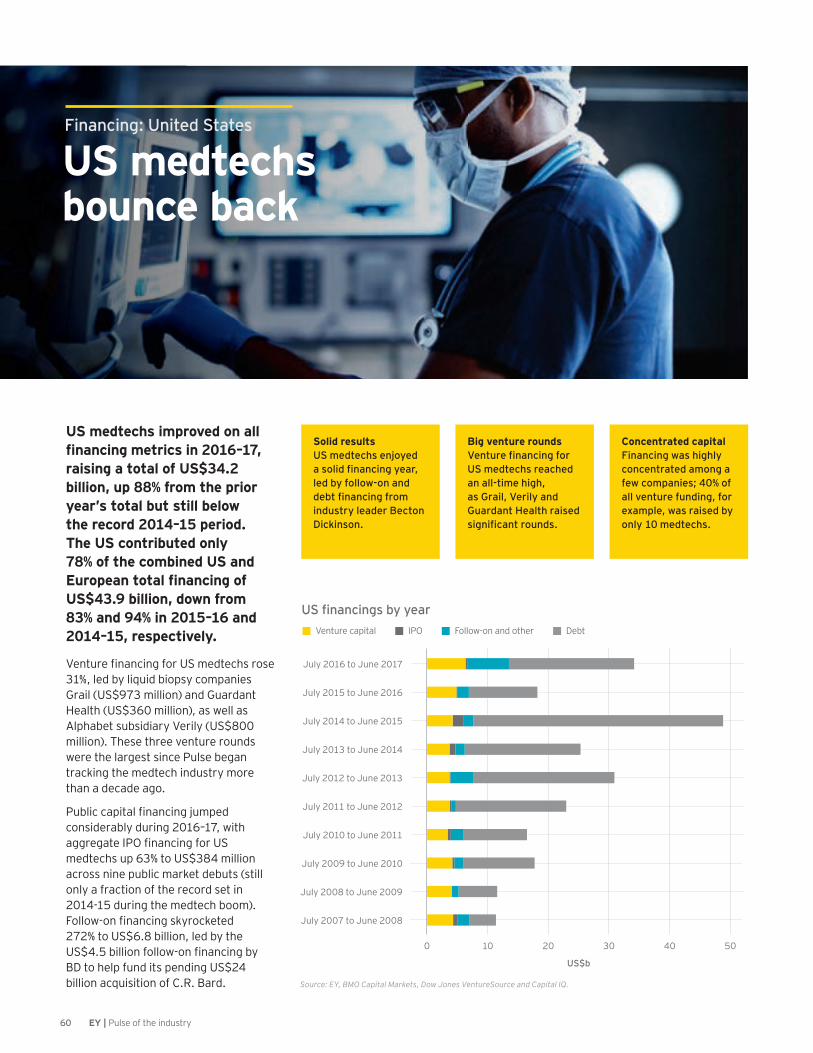
60 EY | Pulse of the industry
U S m e d t e c h s b o u n c e b a c k
Financing: United States
U S m e d t e c h s i m p r o v e d o n a l l financing metrics in 2016–17, r a i s i n g a t o t a l o f U S $ 3 4 . 2 b i l l i o n , u p 8 8 % f r o m t h e p r i o r y e a r ’ s t o t a l b u t s t i l l b e l o w t h e r e c o r d 2 0 1 4 – 1 5 p e r i o d . T h e U S c o n t r i b u t e d o n l y 7 8 % o f t h e c o m b i n e d U S a n d European total financing of U S $ 4 3 . 9 b i l l i o n , d o w n f r o m 8 3 % a n d 9 4 % i n 2 0 1 5 – 1 6 a n d 2 0 1 4 – 1 5 , r e s p e c t i v e l y .
S o l i d r e s u l t sUS medtechs enjoyed a solid financing year, led by follow-on and debt financing from industry leader Becton Dickinson.
B i g v e n t u r e r o u n d sVenture financing for US medtechs reached an all-time high, as Grail, Verily and Guardant Health raised significant rounds.
C o n c e n t r a t e d c a p i t a lFinancing was highly concentrated among a few companies; 40% of all venture funding, for example, was raised by only 10 medtechs.
Venture financing for US medtechs rose 3 1 % , led b y liq uid b iop sy c om p a nies G ra il ( U S $ 9 7 3 m illion) a nd G ua rda nt H ea lth ( U S $ 3 6 0 m illion) , a s w ell a s A lp ha b et sub sidia ry V erily ( U S $ 8 0 0 m illion) . T hese three v enture rounds w ere the la rg est sinc e Pulse b eg a n tra c k ing the m edtec h industry m ore tha n a dec a de a g o.
Public capital financing jumped c onsidera b ly during 2 0 1 6 – 1 7 , w ith aggregate IPO financing for US m edtec hs up 6 3 % to U S $ 3 8 4 m illion a c ross nine p ub lic m a rk et deb uts ( still only a fra c tion of the rec ord set in 2 0 1 4 - 1 5 during the m edtec h b oom ) . Follow-on financing skyrocketed 2 7 2 % to U S $ 6 . 8 b illion, led b y the US$4.5 billion follow-on financing by B D to help fund its p ending U S $ 2 4 b illion a c q uisition of C . R . B a rd.
1 00 2 0 3 0 4 0 5 0
US financings by year
Source: EY, BMO Capital Markets, Dow Jones VentureSource and Capital IQ.
US$b
V enture c a p ita l I PO F ollow - on a nd other D eb t
J uly 2 0 0 7 to J une 2 0 0 8
J uly 2 0 0 8 to J une 2 0 0 9
J uly 2 0 0 9 to J une 2 0 1 0
J uly 2 0 1 0 to J une 2 0 1 1
J uly 2 0 1 1 to J une 2 0 1 2
J uly 2 0 1 2 to J une 2 0 1 3
J uly 2 0 1 3 to J une 2 0 1 4
J uly 2 0 1 4 to J une 2 0 1 5
J uly 2 0 1 5 to J une 2 0 1 6
J uly 2 0 1 6 to J une 2 0 1 7
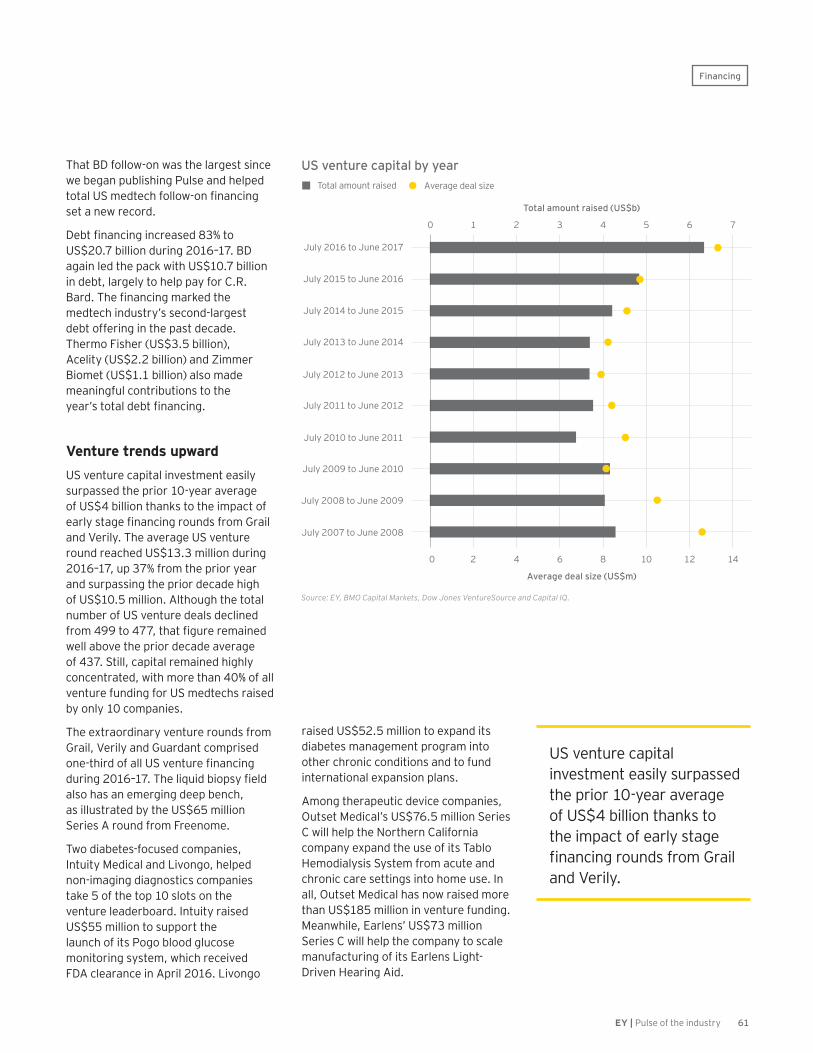
61EY | Pulse of the industry
T ha t B D follow - on w a s the la rg est sinc e w e b eg a n p ub lishing Pulse a nd help ed total US medtech follow-on financing set a new rec ord.
Debt financing increased 83% to U S $ 2 0 . 7 b illion during 2 0 1 6 – 1 7 . B D a g a in led the p a c k w ith U S $ 1 0 . 7 b illion in deb t, la rg ely to help p a y for C . R . Bard. The financing marked the m edtec h industry’ s sec ond- la rg est deb t offering in the p a st dec a de. T herm o F isher ( U S $ 3 . 5 b illion) , A c elity ( U S $ 2 . 2 b illion) a nd Z im m er B iom et ( U S $ 1 . 1 b illion) a lso m a de m ea ning ful c ontrib utions to the year’s total debt financing.
V e n t u r e t r e n d s u p w a r dU S v enture c a p ita l inv estm ent ea sily surp a ssed the p rior 1 0 - yea r a v era g e of U S $ 4 b illion tha nk s to the im p a c t of early stage financing rounds from Grail a nd V erily. T he a v era g e U S v enture round rea c hed U S $ 1 3 . 3 m illion during 2 0 1 6 – 1 7 , up 3 7 % from the p rior yea r a nd surp a ssing the p rior dec a de hig h of U S $ 1 0 . 5 m illion. A lthoug h the tota l num b er of U S v enture dea ls dec lined from 499 to 477, that figure remained w ell a b ov e the p rior dec a de a v era g e of 4 3 7 . S till, c a p ita l rem a ined hig hly c onc entra ted, w ith m ore tha n 4 0 % of a ll v enture funding for U S m edtec hs ra ised b y only 1 0 c om p a nies.
T he ex tra ordina ry v enture rounds from G ra il, V erily a nd G ua rda nt c om p rised one-third of all US venture financing during 2016–17. The liquid biopsy field a lso ha s a n em erg ing deep b enc h, a s illustra ted b y the U S $ 6 5 m illion S eries A round from F reenom e.
T w o dia b etes- foc used c om p a nies, I ntuity M edic a l a nd L iv ong o, help ed non- im a g ing dia g nostic s c om p a nies ta k e 5 of the top 1 0 slots on the v enture lea derb oa rd. I ntuity ra ised U S $ 5 5 m illion to sup p ort the la unc h of its Pog o b lood g luc ose m onitoring system , w hic h rec eiv ed F D A c lea ra nc e in A p ril 2 0 1 6 . L iv ong o
ra ised U S $ 5 2 . 5 m illion to ex p a nd its dia b etes m a na g em ent p rog ra m into other c hronic c onditions a nd to fund interna tiona l ex p a nsion p la ns.
A m ong thera p eutic dev ic e c om p a nies, O utset M edic a l’ s U S $ 7 6 . 5 m illion S eries C w ill help the N orthern C a lifornia c om p a ny ex p a nd the use of its T a b lo H em odia lysis S ystem from a c ute a nd c hronic c a re setting s into hom e use. I n a ll, O utset M edic a l ha s now ra ised m ore tha n U S $ 1 8 5 m illion in v enture funding . M ea nw hile, E a rlens’ U S $ 7 3 m illion S eries C w ill help the c om p a ny to sc a le m a nufa c turing of its E a rlens L ig ht-D riv en H ea ring A id.
0 21 3 4 5 6 7
0 2 4 86 1 0 1 2 1 4
US venture capital by year
Source: EY, BMO Capital Markets, Dow Jones VentureSource and Capital IQ.
A v era g e dea l siz e
Average deal size (US$m)
Total amount raised (US$b)
T ota l a m ount ra ised
J uly 2 0 0 7 to J une 2 0 0 8
J uly 2 0 0 8 to J une 2 0 0 9
J uly 2 0 1 0 to J une 2 0 1 1
J uly 2 0 1 1 to J une 2 0 1 2
J uly 2 0 1 2 to J une 2 0 1 3
J uly 2 0 1 3 to J une 2 0 1 4
J uly 2 0 1 4 to J une 2 0 1 5
J uly 2 0 1 6 to J une 2 0 1 7
J uly 2 0 0 9 to J une 2 0 1 0
J uly 2 0 1 5 to J une 2 0 1 6
Financing
U S v enture c a p ita l inv estm ent ea sily surp a ssed the p rior 1 0 - yea r a v era g e of U S $ 4 b illion tha nk s to the im p a c t of ea rly sta g e financing rounds from Grail a nd V erily.
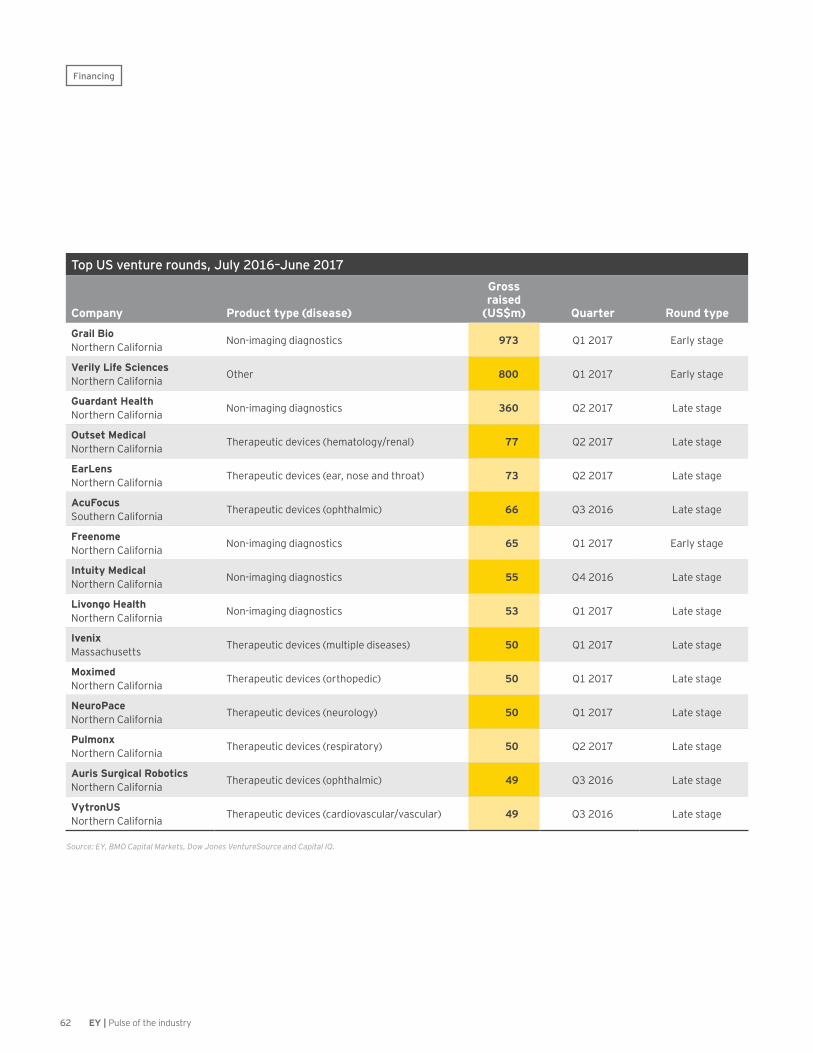
62 EY | Pulse of the industry
Top US venture rounds, July 2016–June 2017
Company Product type (disease)
Gross raised
(US$m) Quarter Round type
Grail Bio Northern California Non-imaging diagnostics 973 Q1 2017 Early stage
Verily Life Sciences Northern California Other 800 Q1 2017 Early stage
Guardant Health Northern California Non-imaging diagnostics 360 Q2 2017 Late stage
Outset Medical Northern California Therapeutic devices (hematology/renal) 77 Q2 2017 Late stage
EarLens Northern California Therapeutic devices (ear, nose and throat) 73 Q2 2017 Late stage
AcuFocus Southern California Therapeutic devices (ophthalmic) 66 Q3 2016 Late stage
Freenome Northern California Non-imaging diagnostics 65 Q1 2017 Early stage
Intuity Medical Northern California Non-imaging diagnostics 55 Q4 2016 Late stage
Livongo Health Northern California Non-imaging diagnostics 53 Q1 2017 Late stage
Ivenix Massachusetts Therapeutic devices (multiple diseases) 50 Q1 2017 Late stage
Moximed Northern California Therapeutic devices (orthopedic) 50 Q1 2017 Late stage
NeuroPace Northern California Therapeutic devices (neurology) 50 Q1 2017 Late stage
Pulmonx Northern California Therapeutic devices (respiratory) 50 Q2 2017 Late stage
Auris Surgical Robotics Northern California Therapeutic devices (ophthalmic) 49 Q3 2016 Late stage
VytronUS Northern California Therapeutic devices (cardiovascular/vascular) 49 Q3 2016 Late stage
Source: EY, BMO Capital Markets, Dow Jones VentureSource and Capital IQ.
Financing
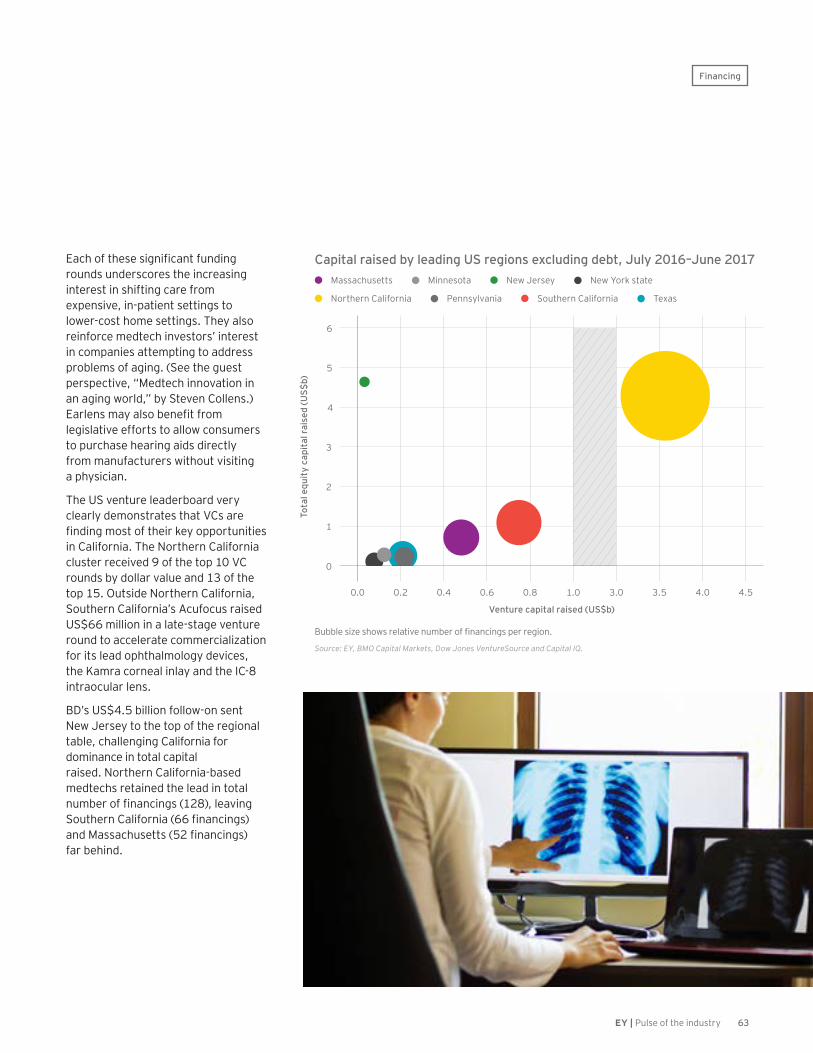
63EY | Pulse of the industry
Each of these significant funding rounds undersc ores the inc rea sing interest in shifting c a re from ex p ensiv e, in- p a tient setting s to low er- c ost hom e setting s. T hey a lso reinforc e m edtec h inv estors’ interest in c om p a nies a ttem p ting to a ddress p rob lem s of a g ing . ( S ee the g uest p ersp ec tiv e, “ M edtec h innov a tion in a n a g ing w orld, ” b y S tev en C ollens. ) Earlens may also benefit from leg isla tiv e efforts to a llow c onsum ers to p urc ha se hea ring a ids direc tly from m a nufa c turers w ithout v isiting a p hysic ia n.
T he U S v enture lea derb oa rd v ery c lea rly dem onstra tes tha t V C s a re finding most of their key opportunities in C a lifornia . T he N orthern C a lifornia c luster rec eiv ed 9 of the top 1 0 V C rounds b y dolla r v a lue a nd 1 3 of the top 1 5 . O utside N orthern C a lifornia , S outhern C a lifornia ’ s A c ufoc us ra ised U S $ 6 6 m illion in a la te- sta g e v enture round to a c c elera te c om m erc ia liz a tion for its lea d op htha lm olog y dev ic es, the K a m ra c ornea l inla y a nd the I C - 8 intra oc ula r lens.
B D ’ s U S $ 4 . 5 b illion follow - on sent N ew J ersey to the top of the reg iona l ta b le, c ha lleng ing C a lifornia for dom ina nc e in tota l c a p ita l ra ised. N orthern C a lifornia - b a sed m edtec hs reta ined the lea d in tota l number of financings (128), leaving Southern California (66 financings) and Massachusetts (52 financings) fa r b ehind.
Capital raised by leading US regions excluding debt, July 2016–June 2017
0
3
2
1
4
5
6
0 . 0 0 . 2 0 . 4 0 . 80 . 6 1 . 0 3 . 0 4 . 54 . 03 . 5
Venture capital raised (US$b)
Tota
l equ
ity
capi
tal r
aise
d (U
S$b)
B ub b le siz e show s rela tiv e num b er of fina nc ing s p er reg ion.
Source: EY, BMO Capital Markets, Dow Jones VentureSource and Capital IQ.
M a ssa c husetts N ew J ersey
N orthern C a lifornia S outhern C a lifornia T ex a sPennsylv a nia
M innesota N ew Y ork sta te
Financing
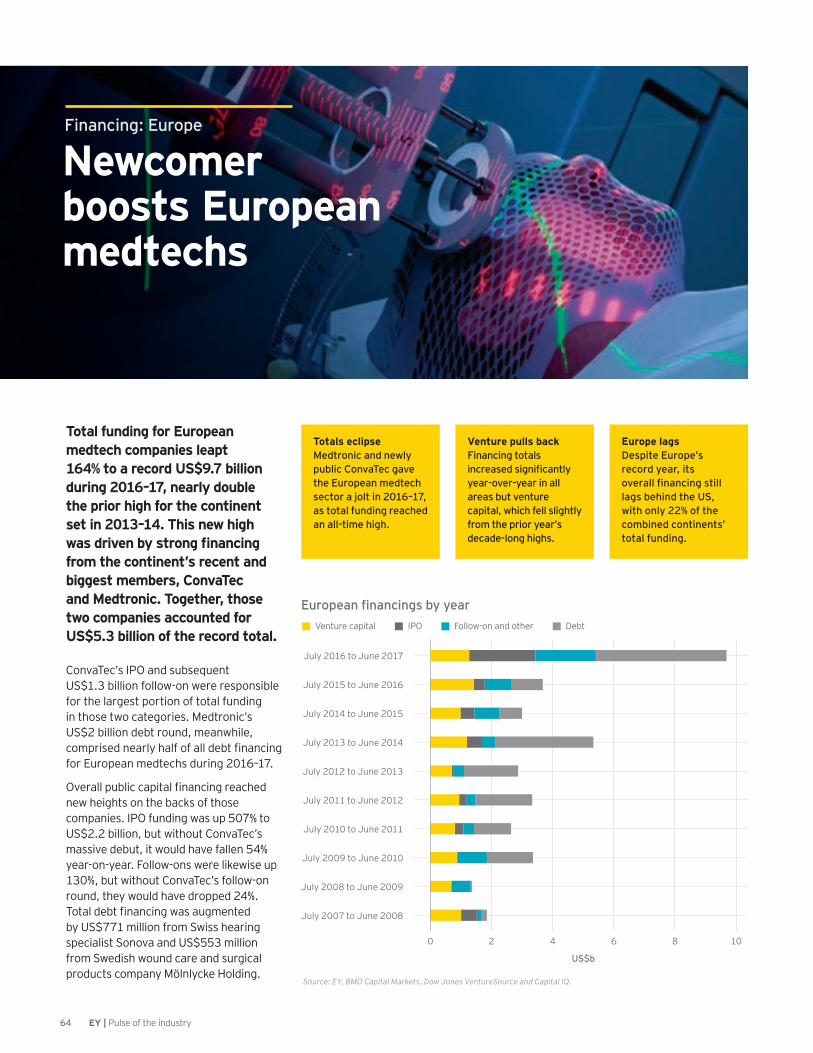
64 EY | Pulse of the industry
N e w c o m e r boosts European m e d t e c h s
Financing: Europe
Total funding for European m e d t e c h c o m p a n i e s l e a p t 1 6 4 % t o a r e c o r d U S $ 9 . 7 b i l l i o n d u r i n g 2 0 1 6 – 1 7 , n e a r l y d o u b l e t h e p r i o r h i g h f o r t h e c o n t i n e n t s e t i n 2 0 1 3 – 1 4 . T h i s n e w h i g h was driven by strong financing f r o m t h e c o n t i n e n t ’ s r e c e n t a n d b i g g e s t m e m b e r s , C o n v a T e c a n d M e d t r o n i c . T o g e t h e r , t h o s e t w o c o m p a n i e s a c c o u n t e d f o r U S $ 5 . 3 b i l l i o n o f t h e r e c o r d t o t a l .
T o t a l s e c l i p s eMedtronic and newly public ConvaTec gave the European medtech sector a jolt in 2016–17, as total funding reached an all-time high.
V e n t u r e p u l l s b a c kFinancing totals increased significantly year-over-year in all areas but venture capital, which fell slightly from the prior year’s decade-long highs.
Europe lagsDespite Europe’s record year, its overall financing still lags behind the US, with only 22% of the combined continents’ total funding.
C onv a T ec ’ s I PO a nd sub seq uent U S $ 1 . 3 b illion follow - on w ere resp onsib le for the la rg est p ortion of tota l funding in those tw o c a teg ories. M edtronic ’ s U S $ 2 b illion deb t round, m ea nw hile, comprised nearly half of all debt financing for E urop ea n m edtec hs during 2 0 1 6 – 1 7 .
Overall public capital financing reached new heig hts on the b a c k s of those c om p a nies. I PO funding w a s up 5 0 7 % to U S $ 2 . 2 b illion, b ut w ithout C onv a T ec ’ s m a ssiv e deb ut, it w ould ha v e fa llen 5 4 % yea r- on- yea r. F ollow - ons w ere lik ew ise up 1 3 0 % , b ut w ithout C onv a T ec ’ s follow - on round, they w ould ha v e drop p ed 2 4 % . Total debt financing was augmented b y U S $ 7 7 1 m illion from S w iss hea ring sp ec ia list S onov a a nd U S $ 5 5 3 m illion from S w edish w ound c a re a nd surg ic a l p roduc ts c om p a ny M ö lnlyc k e H olding .
20 4 6 8 1 0
European financings by year
Source: EY, BMO Capital Markets, Dow Jones VentureSource and Capital IQ.
US$b
V enture c a p ita l I PO F ollow - on a nd other D eb t
J uly 2 0 0 7 to J une 2 0 0 8
J uly 2 0 0 8 to J une 2 0 0 9
J uly 2 0 0 9 to J une 2 0 1 0
J uly 2 0 1 0 to J une 2 0 1 1
J uly 2 0 1 1 to J une 2 0 1 2
J uly 2 0 1 2 to J une 2 0 1 3
J uly 2 0 1 3 to J une 2 0 1 4
J uly 2 0 1 4 to J une 2 0 1 5
J uly 2 0 1 5 to J une 2 0 1 6
J uly 2 0 1 6 to J une 2 0 1 7
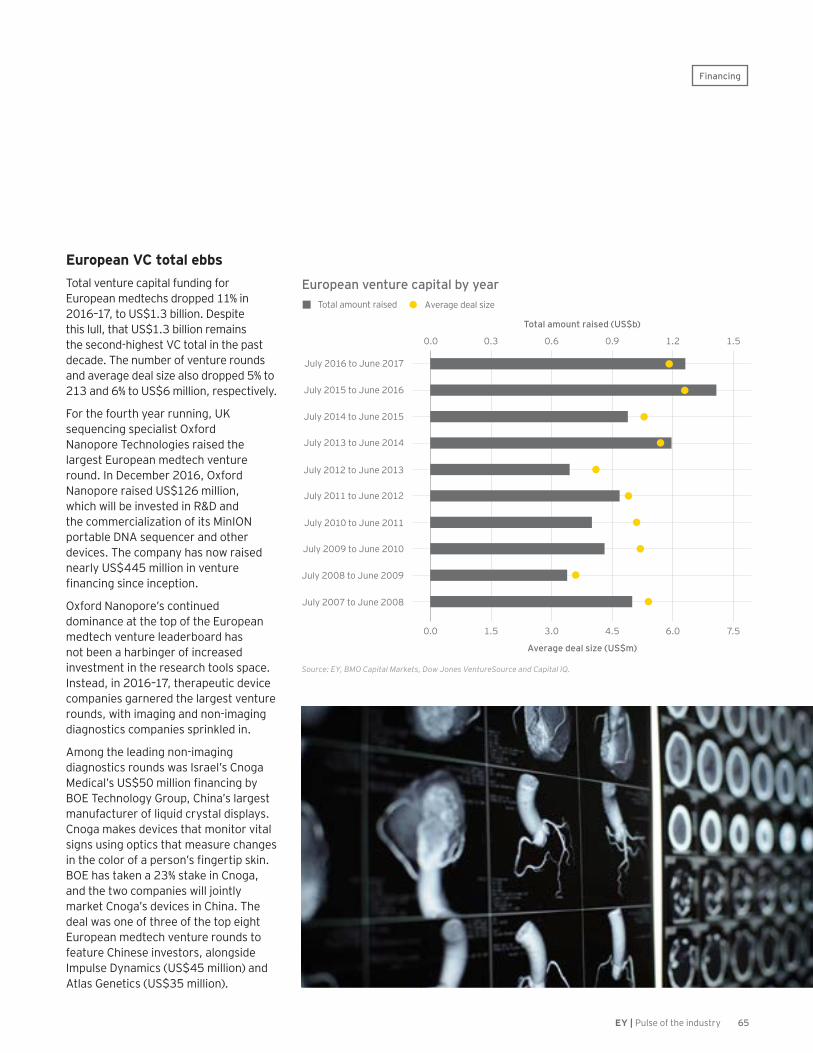
65EY | Pulse of the industry
European VC total ebbsT ota l v enture c a p ita l funding for E urop ea n m edtec hs drop p ed 1 1 % in 2 0 1 6 – 1 7 , to U S $ 1 . 3 b illion. D esp ite this lull, tha t U S $ 1 . 3 b illion rem a ins the sec ond- hig hest V C tota l in the p a st dec a de. T he num b er of v enture rounds a nd a v era g e dea l siz e a lso drop p ed 5 % to 2 1 3 a nd 6 % to U S $ 6 m illion, resp ec tiv ely.
F or the fourth yea r running , U K seq uenc ing sp ec ia list O x ford N a nop ore T ec hnolog ies ra ised the la rg est E urop ea n m edtec h v enture round. I n D ec em b er 2 0 1 6 , O x ford N a nop ore ra ised U S $ 1 2 6 m illion, w hic h w ill b e inv ested in R & D a nd the c om m erc ia liz a tion of its M inI O N p orta b le D N A seq uenc er a nd other dev ic es. T he c om p a ny ha s now ra ised nea rly U S $ 4 4 5 m illion in v enture financing since inception.
O x ford N a nop ore’ s c ontinued dom ina nc e a t the top of the E urop ea n m edtec h v enture lea derb oa rd ha s not b een a ha rb ing er of inc rea sed inv estm ent in the resea rc h tools sp a c e. I nstea d, in 2 0 1 6 – 1 7 , thera p eutic dev ic e c om p a nies g a rnered the la rg est v enture rounds, w ith im a g ing a nd non- im a g ing dia g nostic s c om p a nies sp rink led in.
A m ong the lea ding non- im a g ing dia g nostic s rounds w a s I sra el’ s C nog a Medical’s US$50 million financing by B O E T ec hnolog y G roup , C hina ’ s la rg est m a nufa c turer of liq uid c rysta l disp la ys. C nog a m a k es dev ic es tha t m onitor v ita l sig ns using op tic s tha t m ea sure c ha ng es in the color of a person’s fingertip skin. B O E ha s ta k en a 2 3 % sta k e in C nog a , a nd the tw o c om p a nies w ill j ointly m a rk et C nog a ’ s dev ic es in C hina . T he dea l w a s one of three of the top eig ht E urop ea n m edtec h v enture rounds to fea ture C hinese inv estors, a long side I m p ulse D yna m ic s ( U S $ 4 5 m illion) a nd A tla s G enetic s ( U S $ 3 5 m illion) .
0 . 0 0 . 60 . 3 0 . 9 1 . 2 1 . 5
0 . 0 1 . 5 3 . 0 6 . 04 . 5 7 . 5
European venture capital by year
Source: EY, BMO Capital Markets, Dow Jones VentureSource and Capital IQ.
A v era g e dea l siz e
Average deal size (US$m)
Total amount raised (US$b)
T ota l a m ount ra ised
J uly 2 0 1 5 to J une 2 0 1 6
J uly 2 0 0 8 to J une 2 0 0 9
J uly 2 0 1 3 to J une 2 0 1 4
J uly 2 0 0 9 to J une 2 0 1 0
J uly 2 0 0 7 to J une 2 0 0 8
J uly 2 0 1 4 to J une 2 0 1 5
J uly 2 0 1 0 to J une 2 0 1 1
J uly 2 0 1 1 to J une 2 0 1 2
J uly 2 0 1 6 to J une 2 0 1 7
J uly 2 0 1 2 to J une 2 0 1 3
Financing
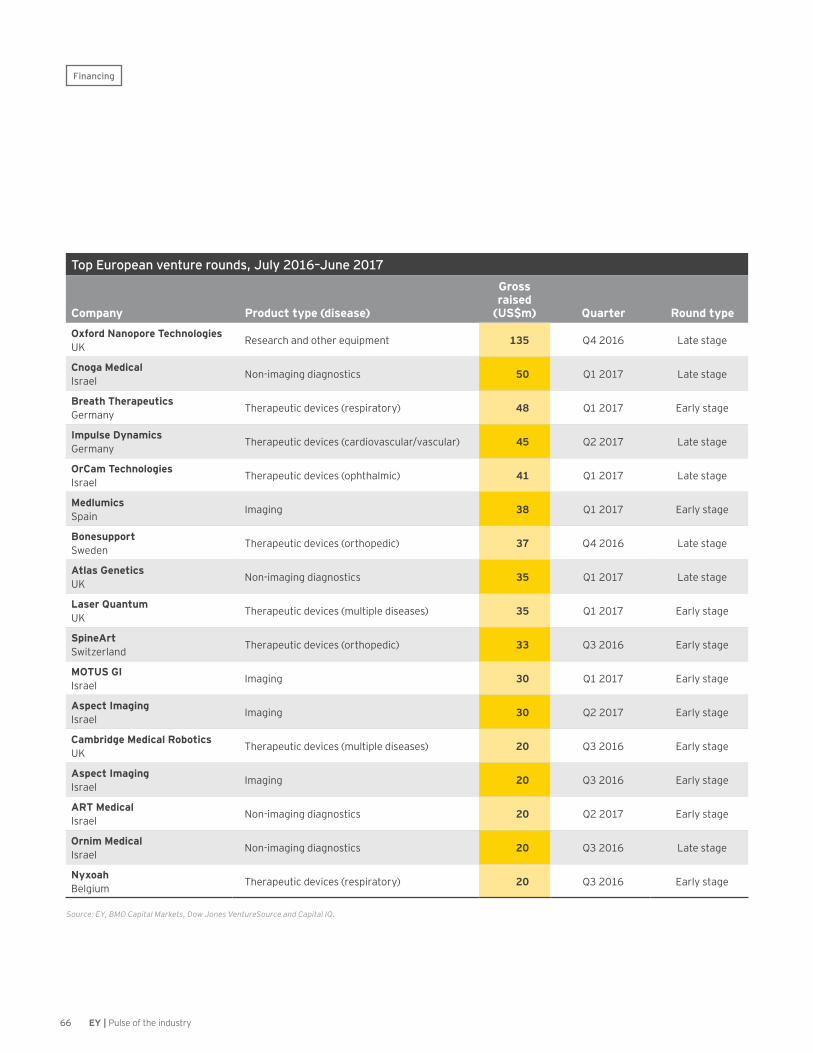
66 EY | Pulse of the industry
Top European venture rounds, July 2016–June 2017
Company Product type (disease)
Gross raised
(US$m) Quarter Round type
Oxford Nanopore Technologies UK Research and other equipment 135 Q4 2016 Late stage
Cnoga Medical Israel Non-imaging diagnostics 50 Q1 2017 Late stage
Breath Therapeutics Germany Therapeutic devices (respiratory) 48 Q1 2017 Early stage
Impulse Dynamics Germany Therapeutic devices (cardiovascular/vascular) 45 Q2 2017 Late stage
OrCam Technologies Israel Therapeutic devices (ophthalmic) 41 Q1 2017 Late stage
Medlumics Spain Imaging 38 Q1 2017 Early stage
Bonesupport Sweden Therapeutic devices (orthopedic) 37 Q4 2016 Late stage
Atlas Genetics UK Non-imaging diagnostics 35 Q1 2017 Late stage
Laser Quantum UK Therapeutic devices (multiple diseases) 35 Q1 2017 Early stage
SpineArt Switzerland Therapeutic devices (orthopedic) 33 Q3 2016 Early stage
MOTUS GI Israel Imaging 30 Q1 2017 Early stage
Aspect Imaging Israel Imaging 30 Q2 2017 Early stage
Cambridge Medical Robotics UK Therapeutic devices (multiple diseases) 20 Q3 2016 Early stage
Aspect Imaging Israel Imaging 20 Q3 2016 Early stage
ART Medical Israel Non-imaging diagnostics 20 Q2 2017 Early stage
Ornim Medical Israel Non-imaging diagnostics 20 Q3 2016 Late stage
Nyxoah Belgium Therapeutic devices (respiratory) 20 Q3 2016 Early stage
Source: EY, BMO Capital Markets, Dow Jones VentureSource and Capital IQ.
Financing

67EY | Pulse of the industry
Of the top five European venture deals b y dolla r v a lue, three w ere inv estm ents in thera p eutic dev ic e c om p a nies. B rea th T hera p eutic s, a G erm a n m edtec h dev elop ing a n inha la b le drug / dev ic e c om b ina tion p roduc t for ra re lung c onditions, ra ised U S $ 4 8 m illion in c onj unc tion w ith sp inning off PA R I Pha rm a , a G erm a n drug form ula tion a nd deliv ery c om p a ny. I m p ulse D yna m ic s, a lso in G erm a ny, ra ised U S $ 4 5 m illion to ex p a nd the c om m erc ia l footp rint of its O p tim iz er im p la nta b le c hronic hea rt fa ilure dev ic e. A nd, O rC a m T ec hnolog ies, a n I sra eli m a k er of w ea ra b le op htha lm ic dev ic es for the v isua lly im p a ired, ra ised U S $ 4 1 m illion a s it ex p a nds c om m erc ia liz a tion of its M yE ye dev ic e.
F ea rs tha t the U K ’ s dep a rture from the E urop ea n U nion m ig ht im p a c t inv estm ent in the U K ’ s thriv ing m edtec h sec tor a p p ea r to b e unfounded. B rex it ha s yet to dent the U K ’ s dom ina nc e of E urop e’ s m edtec h m a rk ets, a s U K c om p a nies ra ised nea rly U S $ 4 b illion in eq uity c a p ita l during 2 0 1 6 – 1 7 . T houg h m uc h of tha t c a p ita l w a s ra ised b y a sing le c om p a ny — C onv a T ec — the U K also enjoyed the most financing rounds of a ny E urop ea n m a rk et, w ith 6 7 .
L ed b y M ö lnlyc k e H olding ’ s U S $ 5 5 3 million debt financing and an unusually strong show ing in the I PO ta b le, S w eden- b a sed m edtec hs ra ised U S $ 1 b illion in 2 0 1 6 – 1 7 , j ust a hea d of S w iss m edtec hs ( U S $ 9 1 1 m illion) . E x c luding deb t dea ls, I sra eli m edtec hs ra ised U S $ 4 6 3 m illion to rem a in a dista nt sec ond b ehind the U K . I sra el surp a ssed the UK in venture financing, however, ra ising U S $ 3 4 2 m illion in v enture c a p ita l to the U K ’ s U S $ 3 3 5 m illion in 2 0 1 6 – 1 7 . G erm a n m edtec hs ra ised the third- hig hest a m ount of v enture c a p ita l w ith U S $ 1 0 8 m illion.
Capital raised by leading European countries excluding debt, July 2016–June 2017
0 . 0
1 . 0
0 . 5
1 . 5
2 . 0
2 . 5
3 . 0
4 . 5
4 . 0
3 . 5
0 2 5 5 0 1 0 07 5 1 2 5 3 0 0 4 0 03 5 0
Venture capital raised (US$m)
Tota
l equ
ity
capi
tal r
aise
d (U
S$b)
U KS w eden S w itz erla ndN etherla nds
G erm a nyF ra nc e I sra elF inla nd
B ub b le siz e show s rela tiv e num b er of fina nc ing s p er reg ion.
Source: EY, BMO Capital Markets, Dow Jones VentureSource and Capital IQ
F ea rs tha t the U K ’ s dep a rture from the E urop ea n U nion m ig ht im p a c t inv estm ent in the U K ’ s thriv ing m edtec h sec tor a p p ea r to b e unfounded. B rex it ha s yet to dent the U K ’ s dom ina nc e of E urop e’ s m edtec h m a rk ets.
Financing

68 EY | Pulse of the industry
D e b t d r a g s on financing m e t r i c s
Financing: Asia-Pacific
D e s p i t e a s e c o n d c o n s e c u t i v e d r o p i n o v e r a l l financing, the emerging m e d t e c h e c o s y s t e m i n A s i a enjoyed a solid year, as venture and IPO financing b o u n c e d b a c k f r o m a d i s a p p o i n t i n g 2 0 1 5 – 1 6 . T o t a l financing in 2016–17 fell 16% t o U S $ 1 . 5 b i l l i o n , d u e l a r g e l y t o a s t e e p d e c l i n e i n d e b t financing.
Ye a r - o n - y e a r i n c r e a s e sAsia-Pacific medtech financings had a solid year in 2016–17, with venture, IPO and follow-on financings all increasing year-on-year.
C h i n e s e m e d t e c h s s h i n eChina is increasingly flexing its medtech muscle, with Chinese companies responsible for three-quarters of total Asia-Pacific medtech financing.
From East to WestInvestors in Asia have become increasingly active in US and European medtechs, highlighting the flow of capital from East to West.
A lthoug h deb t fell 9 0 % to only U S $ 8 4 m illion, v enture c a p ita l, I PO s a nd follow - ons ea c h enj oyed g a ins. Follow-on financing comprised the largest chunk of total financing, up 25% to U S $ 6 9 3 m illion on the yea r.
Asia-Pacific medtech venture capital rose 5 8 % to U S $ 2 2 8 m illion during 2 0 1 6 – 1 7 , the sec ond- hig hest a m ount in the p a st sev en yea rs. C hina led the w a y, w ith 5 of the top 1 0 v enture rounds b y dolla r v a lue. I n a ll there w ere 2 5 v enture dea ls in the reg ion, sp lit nea rly ev enly b etw een non- im a g ing dia g nostic s c om p a nies ( 1 3 ) a nd thera p eutic dev ic e c om p a nies ( 1 2 ) .
1 . 00 . 0 2 . 0 3 . 0
Asia-Pacific financings by year
Source: EY, BMO Capital Markets, Dow Jones VentureSource and Capital IQ.
US$b
V enture c a p ita l I PO F ollow - on a nd other D eb t
J uly 2 0 1 0 to J une 2 0 1 1
J uly 2 0 1 1 to J une 2 0 1 2
J uly 2 0 1 2 to J une 2 0 1 3
J uly 2 0 1 3 to J une 2 0 1 4
J uly 2 0 1 4 to J une 2 0 1 5
J uly 2 0 1 5 to J une 2 0 1 6
J uly 2 0 1 6 to J une 2 0 1 7
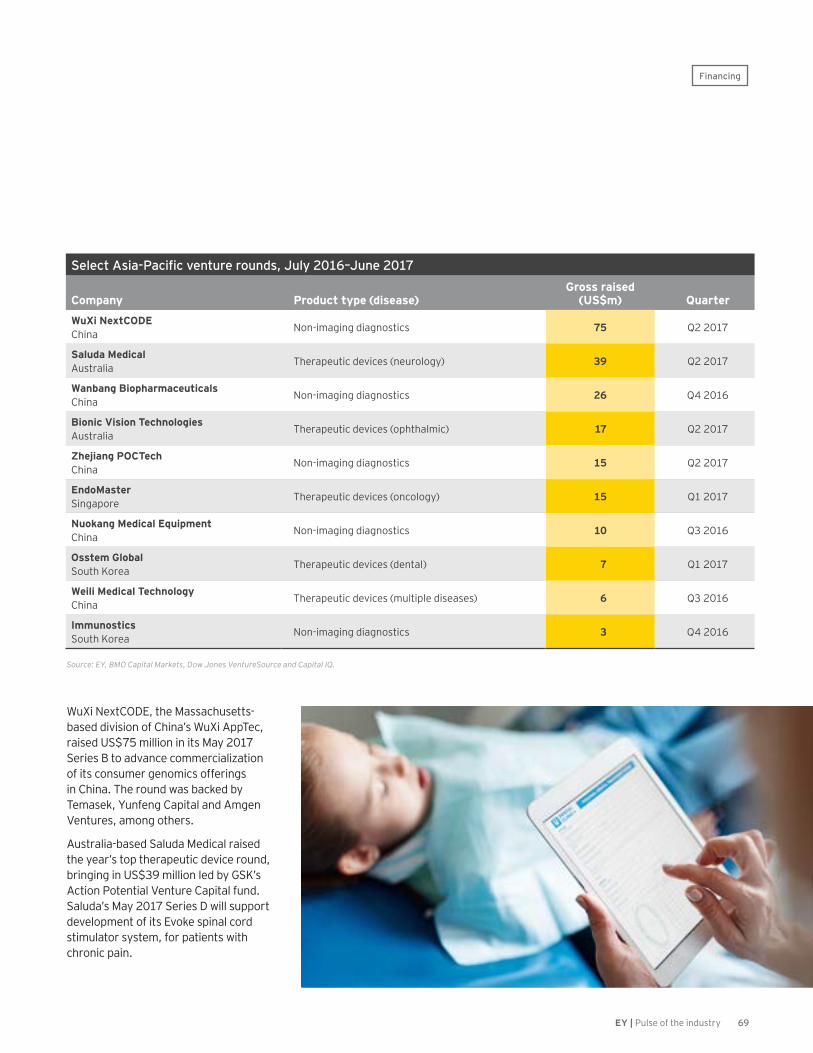
69EY | Pulse of the industry
W uX i N ex tC O D E , the M a ssa c husetts-b a sed div ision of C hina ’ s W uX i A p p T ec , ra ised U S $ 7 5 m illion in its M a y 2 0 1 7 S eries B to a dv a nc e c om m erc ia liz a tion of its c onsum er g enom ic s offering s in C hina . T he round w a s b a c k ed b y T em a sek , Y unfeng C a p ita l a nd A m g en V entures, a m ong others.
A ustra lia - b a sed S a luda M edic a l ra ised the yea r’ s top thera p eutic dev ic e round, b ring ing in U S $ 3 9 m illion led b y G S K ’ s A c tion Potentia l V enture C a p ita l fund. S a luda ’ s M a y 2 0 1 7 S eries D w ill sup p ort dev elop m ent of its E v ok e sp ina l c ord stim ula tor system , for p a tients w ith c hronic p a in.
Select Asia-Pacific venture rounds, July 2016–June 2017
C o m p a n y P r o d u c t t y p e ( d i s e a s e )G r o s s r a i s e d
( U S $ m ) Q u a r t e r
WuXi NextCODE C hina N on- im a g ing dia g nostic s 7 5 Q 2 2 0 1 7
S a l u d a M e d i c a l A ustra lia T hera p eutic dev ic es ( neurolog y) 3 9 Q 2 2 0 1 7
W a n b a n g B i o p h a r m a c e u t i c a l s C hina N on- im a g ing dia g nostic s 2 6 Q 4 2 0 1 6
B i o n i c V i s i o n T e c h n o l o g i e s A ustra lia T hera p eutic dev ic es ( op htha lm ic ) 1 7 Q 2 2 0 1 7
Zhejiang POCTech C hina N on- im a g ing dia g nostic s 1 5 Q 2 2 0 1 7
EndoMaster S ing a p ore T hera p eutic dev ic es ( onc olog y) 1 5 Q 1 2 0 1 7
Nuokang Medical Equipment C hina N on- im a g ing dia g nostic s 1 0 Q 3 2 0 1 6
Osstem Global S outh K orea T hera p eutic dev ic es ( denta l) 7 Q 1 2 0 1 7
W e i l i M e d i c a l T e c h n o l o g y C hina T hera p eutic dev ic es ( m ultip le disea ses) 6 Q 3 2 0 1 6
I m m u n o s t i c s S outh K orea N on- im a g ing dia g nostic s 3 Q 4 2 0 1 6
Source: EY, BMO Capital Markets, Dow Jones VentureSource and Capital IQ.
Financing

70 EY | Pulse of the industry
Select Asia-Pacific IPOs, July 2016–June 2017
C o m p a n y P r o d u c t t y p e ( d i s e a s e )G r o s s r a i s e d
( U S $ m ) Q u a r t e r
A u t o b i o D i a g n o s t i c s C hina N on- im a g ing dia g nostic s 9 2 Q 3 2 0 1 6
Shanghai Kindly Enterprise D e v e l o p m e n t G r o u p C hina
T hera p eutic dev ic es ( m ultip le disea ses) 7 5 Q 4 2 0 1 6
J a f r o n B i o m e d i c a l C hina T hera p eutic dev ic es ( hem a tolog y/ rena l) 6 8 Q 3 2 0 1 6
H y b r i b i o B i o t e c h C hina N on- im a g ing dia g nostic s 6 2 Q 2 2 0 1 7
T h a l y s M e d i c a l T e c h n o l o g y C hina N on- im a g ing dia g nostic s 5 2 Q 4 2 0 1 6
Transtek Medical Electronics C hina N on- im a g ing dia g nostic s 3 5 Q 4 2 0 1 6
S o n o S c a p e M e d i c a l C hina I m a g ing 3 1 Q 2 2 0 1 7
L o g o s B i o s y s t e m s S outh K orea R esea rc h a nd other eq uip m ent 1 6 Q 4 2 0 1 6
T h e S i n c e r e J a p a n T hera p eutic dev ic es ( op htha lm ic ) 1 0 Q 4 2 0 1 6
N e u r o t e c h I n t e r n a t i o n a l A ustra lia N on- im a g ing dia g nostic s 5 Q 4 2 0 1 6
K M S M e d i s u r g i I ndia T hera p eutic dev ic es ( non- disea se sp ec ific ) 0 . 4 Q 2 2 0 1 7
Source: EY, BMO Capital Markets and Capital IQ.
IPO financing rose by 223% during 2 0 1 6 – 1 7 , to U S $ 4 4 7 m illion across 11 financings. China-based m edtec hs c om p leted the top sev en I PO s b y dolla r v a lue, b ring ing in a c um ula tiv e U S $ 4 1 6 m illion a nd led b y
A utob io’ s U S $ 9 2 m illion I PO on the S ha ng ha i E x c ha ng e.
A utob io, a c linic a l dia g nostic s m a nufa c turer, w ent p ub lic in A ug ust 2 0 1 6 , ra ising the third- la rg est m edtec h I PO in a ny g eog ra p hy during 2 0 1 6 – 1 7 .
S how c a sing C hina ’ s g row ing g lob a l c lout, S ha ng ha i K indly E nterp rise D ev elop m ent G roup , w hic h sells m edic a l p unc ture dev ic es a nd ra ised U S $ 7 5 m illion in its N ov em b er 2 0 1 6 I PO , tied for the fourth-la rg est m edtec h I PO g lob a lly.
Financing

71EY | Pulse of the industry
H o w w i l l n e w s o u r c e s o f f u n d i n g h e l p m e d t e c h s sprint to the next value inflection point?
H o w a r e m e d t e c h s t a p p i n g m u l t i p l e p o o l s o f c a p i t a l t o b u i l d a w i n n i n g financing strategy?
A s m e d t e c h s i n c r e a s i n g l y c o m p e t e f o r p u b l i c c a p i t a l , d o e s y o u r o r g a n i z a t i o n h a v e a n i n s i d e t r a c k ?
I s f u n d i n g r i g h t b e f o r e your eyes but just difficult to see?

72 EY | Pulse of the industry
A t A p a x Pa rtners, a lea ding g lob a l private equity advisory firm, we see a num b er of div erse a nd interesting inv estm ent op p ortunities, b ut a re m indful of rec ord- hig h v a lua tions. W e b eliev e it’ s im p orta nt to seek out nic he op p ortunities off the b ea ten p a th to ex ec ute inv estm ents a t rea sona b le v a lua tions. T o do this, w e think c rea tiv ely a round dea l sourc ing a nd how tra nsa c tions c a n b e struc tured to reduc e c om p etition. F or ex a m p le, this c ould inc lude look ing a t p roduc t nic hes less p op ula r w ith c orp ora te b uyers or a ssets tha t a re not c urrently g row ing v ery fa st, b ut ha v e the p otentia l to do so in the future. I ndeed, the a b ility
to c rea te m ore c om p lic a ted dea l struc tures, suc h a s c a rv e- outs from a p a rent c om p a ny or j oint v entures, c a n c rea te a uniq ue a ng le.
O ften, div esting non- c ore a ssets v ia so- c a lled c a rv e- outs isn’ t the hig hest p riority for a seller a s it is ea sier to sell the a sset to a nother c orp ora te b uyer. I n som e c a ses tha t is b ec a use the a ssets don’ t g enera te enoug h rev enue to j ustify the effort to c rea te a new sta nd- a lone c om p a ny. Y ou need a c erta in a m ount of sc a le to b uild a v ia b le c om m erc ia l entity, p a rtic ula rly in the c urrent env ironm ent w here c a teg ory lea dership is im p orta nt. I n other c a ses,
It is an exciting time for private equity investors looking at medtech. T h e i n d u s t r y c o n t i n u e s t o g r o w a n d e v o l v e t h a n k s t o t e c h n o l o g i c a l a d v a n c e s t r a n s f o r m i n g h o w h e a l t h c a r e i s d e l i v e r e d a n d p a i d f o r . W h i l e w e h a v e s e e n a n a b u n d a n c e o f M & A a c t i v i t y i n r e c e n t y e a r s , m o r e r e c e n t l y , p r i v a t e e q u i t y h a s o f t e n b e e n o u t b i d b y c o r p o r a t e b u y e r s d e m o n s t r a t i n g a w i l l i n g n e s s t o p a y p r e m i u m p r i c e s , particularly for those medtech assets enjoying high revenue growth.
StevenD y s o nHealth Care PartnerApax Partners
B u i l d i n g v a l u e t h r o u g h c r e a t i v e d e a l s t r u c t u r e s
Guest perspective

73EY | Pulse of the industry
it is sim p ly ea sier to sell p roduc ts or entire p roduc t lines to a nother c om p a ny if the synergistic fit is good.
S om etim es a j oint v enture is the b est op tion for a ll p a rties. T his w a s the c a se w hen funds a dv ised b y A p a x ( “ A p a x F unds” ) p a rtnered w ith B ec ton D ic k inson to c rea te V ya ire M edic a l. I n 2 0 1 5 , w hen B ec ton D ic k inson c om p leted its a c q uisition of C a reF usion, it inherited a R esp ira tory S olutions b usiness w ith a g lob a l footp rint of a p p rox im a tely 5 , 0 0 0 em p loyees a nd a p roduc t p ortfolio inc luding dia g nostic s, v entila tion p roduc ts, p a tient m onitoring serv ic es a nd a nesthesia .
Embracing complexity t o c r e a t e v a l u eE v en thoug h the R esp ira tory S olutions b usiness ea rned a round $ 8 0 0 m illion in a nnua l rev enue w ith v a lue c rea tion
p otentia l, its thera p eutic foc us w a sn’ t a p riority for B ec ton D ic k inson. T hey b eliev ed g enera ting new g row th w a s going to require significant investment w hic h they w eren’ t in a p osition to m a k e due to their foc us on integ ra ting other p a rts of the C a reF usion b usiness. A t A p a x , w e sa w a n op p ortunity to rep osition the R esp ira tory S olutions b usiness a s a sta nd- a lone c om p a ny throug h a j oint v enture in w hic h A p a x F unds a c q uired 5 0 . 1 % a nd B ec ton D ic k inson reta ined 4 9 . 9 % . T he b usiness w a s la ter rena m ed V ya ire M edic a l.
I n a c a rv e- out, b usiness func tions such as HR, finance, legal and quality m a na g em ent dep a rtm ents ha v e to b e reb uilt from sc ra tc h. T his req uires a lot of eng a g em ent from the ow ner div esting the a ssets, a s w ell a s the new c om p a ny itself, a nd c a n often lea d to m ix ed suc c ess. W ith a tra ditiona l sa le, the p a rent c a n often lose interest a t a c ritic a l tim e.
I n the insta nc e of V ya ire, b ec a use B ec ton D ic k inson reta ined a n eq uity sta k e a nd a sea t on V ya ire M edic a l’ s b oa rd, it ha d a g rea ter understa nding of the ong oing op era tiona l issues a nd w a s inc entiv iz ed to sha re in the future v a lue c rea tion.
T he j oint v enture ow nership m odel for V ya ire w ork s for a ll p a rties. F or the c om p a ny itself, its indep endenc e from a p a rent a llow s stra teg ic foc us a nd the a b ility to a ttra c t the b est m a na g eria l ta lent. F or B ec ton D ic k inson, its m inority ow nership p rov ides p a rtic ip a tion in future g row th. A nd, for A p a x F unds, its inv estm ent a nd hea lth c a re ex p erienc e streng thens V ya ire’ s p osition a s a lea ding g lob a l p la yer, ena b ling us to b a c k a b usiness w ith a n ex c iting future.
Guest perspective
W e see a num b er of div erse a nd interesting inv estm ent op p ortunities, b ut a re m indful of rec ord- hig h v a lua tions. W e b eliev e it’ s im p orta nt to seek out nic he op p ortunities off the b ea ten p a th to ex ec ute inv estm ents a t rea sona b le v a lua tions.

74 EY | Pulse of the industry
M & A r a c e s a h e a d
Mergers & acquisitions
B u y i n g o p p o r t u n i t ySlowing organic growth, provider consolidation and payer pressure boosted acquisitions to record heights in the 12 months that ended June 2017.
G e o g r a p h i c b a l a n c eM&A activity was more geographically balanced in the US and Europe after a lopsided 2015-16, as medtechs used dealmaking to fuel growth.
F o c u s e d g r o w t hLarger medtechs continued to divest non-core businesses, pursuing focus and scale in fewer, chosen therapeutic spaces.

75EY | Pulse of the industry
Essilor’s US$25.2 billion acquisition of ophthalmology retailer Luxottica and Becton Dickinson’s a n n o u n c e d U S $ 2 4 b i l l i o n a c q u i s i t i o n o f m i n i m a l l y i n v a s i v e d e v i c e s p e c i a l i s t C . R . B a r d p u t a p a i r of exclamation points on an exceptional year for medtech M&A. In all, the total value of medtech M&A in the US and Europe reached US$100.4 billion, an increase of 46% over the prior 12 months a n d a n i n d u s t r y r e c o r d .
B ut the c ontinued g row th in v a lue of non-megadeal acquisitions, defined as dea ls v a lued a t less tha n U S $ 1 0 b illion, illustra tes how m edtec hs em p loy inorg a nic g row th to b olster rev enue shortfa lls. I ndeed, in the 1 2 m onths tha t ended 3 0 J une 2 0 1 7 , tota l non- m eg a dea l a c q uisition v a lue inc rea sed for the fourth stra ig ht yea r to U S $ 5 1 . 2 b illion. T houg h that figure is only 14% higher than the p rior 1 2 - m onth p eriod, w hic h m ig ht sug g est g row th in this m edtec h M & A c a teg ory is lev eling off, the 2 0 1 6 – 1 7 sum is m ore tha n doub le the tota l for J uly 2 0 1 2 – J une 2 0 1 3 .
T his inc rea se in M & A v a lue oc c urred desp ite a drop in the tota l num b er of non- m eg a dea l a c q uisitions w ith a nnounc ed term s. D uring 2 0 1 6 – 1 7 , 1 9 8 U S a nd E urop ea n m edtec hs w ere a c q uired, a 1 5 % dec line from 2 0 1 5 – 1 6 . T he dec lining v olum e led to a c orresp onding j um p in a v era g e dea l v a lue: during 2 0 1 6 – 1 7 , the a v era g e m edtec h a c q uisition v a lue surg ed 7 3 % to U S $ 5 0 7 m illion, the hig hest a v era g e in at least five years.
I n fa c t, the num b er of a c q uisitions v a lued a t g rea ter tha n U S $ 1 b illion ha s rem a ined in the doub le dig its sinc e
Mergers & acquisitions
0 2 0 4 0 6 0 8 0 1 0 0
0 5 0 1 0 0 1 5 0 2 0 0 2 5 0
M&As in the US and Europe by year
C ha rt inc ludes M & A s w ith v a lue disc losed ( m edtec h M & A w here either a c q uirer or ta rg et is loc a ted in the U S or E urop e) .
Source: EY, Capital IQ and Thomson ONE.
N um b er of M & A s
Number of M&As
Total M&A value (US$b)
M eg a dea ls ( > U S $ 1 0 b )O ther M & A s
J uly 2 0 1 2 to J une 2 0 1 3
J uly 2 0 1 3 to J une 2 0 1 4
J uly 2 0 1 4 to J une 2 0 1 5
J uly 2 0 1 5 to J une 2 0 1 6
J uly 2 0 1 6 to J une 2 0 1 7
2 0 1 4 – 1 5 , j um p ing from 1 0 in 2 0 1 5 – 1 6 to 1 4 in the m ost rec ent p eriod. T his sug g ests the industry’ s la rg er p la yers p refer rob ust a ssets tha t c a n b e b olted on to ex isting b usinesses to c rea te g rea ter dep th in c hosen thera p eutic a rea s. M ea nw hile, rising m a rk et v a lua tions ov er the p a st few yea rs m ea n there a re m ore U S $ 1 b illion c om p a nies to b uy, a s inv estors b et tha t m edtec hs seek ing g row th w ill rep ea tedly use M & A to sa tisfy stra teg ic ob j ec tiv es.
Scale and diversification d o m i n a t e m e d t e c h M & A s t r a t e g i e sA n a na lysis of the top dea ls b y dolla r v a lue during 2 0 1 6 – 1 7 rev ea ls the underlying driv ers of this heig htened M & A a c tiv ity. Pure p la y m edtec hs c ontinue to c ha se ec onom ies of sc a le, a s c a teg ory lea dership in a thera p eutic a rea or b usiness a nd a n a b ility to p rov ide end- to- end solutions rem a in top p riorities. Pure p la y m edtec hs a re also pursuing diversification strategies, b uying b usinesses tha t c om p lem ent their ex isting offering s or ena b le them to b oost their offering s in m ore q uic k ly g row ing g eog ra p hies suc h a s C hina . M ea nw hile, c ong lom era tes a re p runing p ortfolios in the w a k e of p rior a c q uisitions.
T he yea r’ s m eg a dea ls illustra te the need for sc a le in inc rea sing ly c om p etitiv e m edtec h a rea s. E ssilor’ s U S $ 2 5 . 2 b illion L ux ottic a a c q uisition c om b ines the la rg est op htha lm ic dev ic e m a nufa c turer
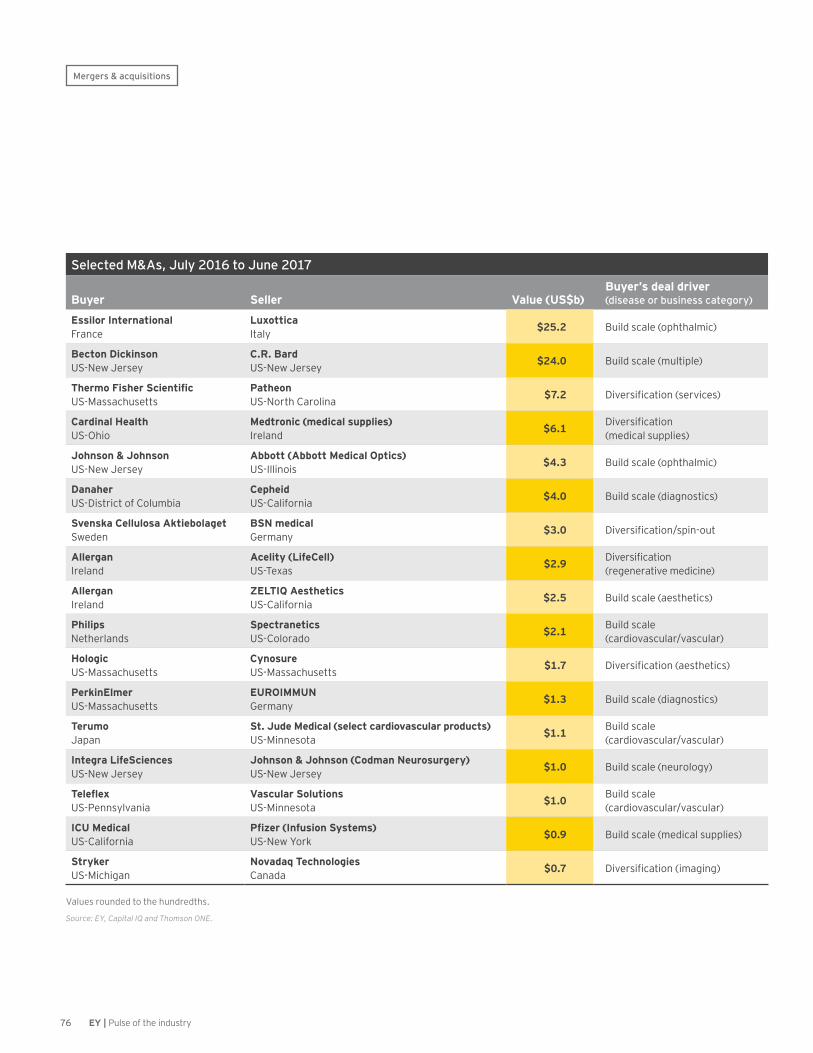
76 EY | Pulse of the industry
Mergers & acquisitions
Selected M&As, July 2016 to June 2017
Buyer Seller Value (US$b)Buyer’s deal driver (disease or business category)
Essilor InternationalFrance
Luxottica Italy $25.2 Build scale (ophthalmic)
Becton DickinsonUS-New Jersey
C.R. BardUS-New Jersey $24.0 Build scale (multiple)
Thermo Fisher ScientificUS-Massachusetts
PatheonUS-North Carolina $7.2 Diversification (services)
Cardinal HealthUS-Ohio
Medtronic (medical supplies)Ireland $6.1 Diversification
(medical supplies)
Johnson & Johnson US-New Jersey
Abbott (Abbott Medical Optics)US-Illinois $4.3 Build scale (ophthalmic)
DanaherUS-District of Columbia
CepheidUS-California $4.0 Build scale (diagnostics)
Svenska Cellulosa AktiebolagetSweden
BSN medicalGermany $3.0 Diversification/spin-out
AllerganIreland
Acelity (LifeCell)US-Texas $2.9 Diversification
(regenerative medicine)
AllerganIreland
ZELTIQ AestheticsUS-California $2.5 Build scale (aesthetics)
PhilipsNetherlands
SpectraneticsUS-Colorado $2.1 Build scale
(cardiovascular/vascular)
HologicUS-Massachusetts
CynosureUS-Massachusetts $1.7 Diversification (aesthetics)
PerkinElmerUS-Massachusetts
EUROIMMUNGermany $1.3 Build scale (diagnostics)
TerumoJapan
St. Jude Medical (select cardiovascular products)US-Minnesota $1.1 Build scale
(cardiovascular/vascular)
Integra LifeSciencesUS-New Jersey
Johnson & Johnson (Codman Neurosurgery)US-New Jersey $1.0 Build scale (neurology)
TeleflexUS-Pennsylvania
Vascular SolutionsUS-Minnesota $1.0 Build scale
(cardiovascular/vascular)
ICU MedicalUS-California
Pfizer (Infusion Systems)US-New York $0.9 Build scale (medical supplies)
StrykerUS-Michigan
Novadaq Technologies Canada $0.7 Diversification (imaging)
Values rounded to the hundredths.
Source: EY, Capital IQ and Thomson ONE.

77EY | Pulse of the industry
w ith the b ig g est reta iler in the eyew ea r sp a c e, c rea ting a v isua l hea lth a nd eyew ea r g roup w ith c om b ined rev enue of m ore tha n € 1 5 b illion. T he dea l is the fourth- la rg est m edtec h a c q uisition ev er a nd E ssilor’ s b ig g est dea l b y fa r. ( Prior to the L ux ottic a a c q uisition, E ssilor’ s la rg est dea l w a s its 2 0 1 3 U S $ 1 . 9 b illion a c q uisition of T ra nsition O p tic s. ) S c a le m a tters in a sp a c e w here b oth E ssilor a nd L ux ottic a ha v e ex p erienc ed slow ing sa les g row th a s a result of c om p etition from less ex p ensiv e, online riv a ls.
B ec ton D ic k inson’ s ( B D ) a nnounc ed a c q uisition of C . R . B a rd for U S $ 2 4 b illion is B D ’ s sec ond m eg a dea l in rec ent yea rs, follow ing
the U S $ 1 2 . 2 b illion a c q uisition of C a reF usion in 2 0 1 4 . W hen the dea l is finalized, Bard will give BD scale in hosp ita l sup p lies, c om b ining B a rd’ s m inim a lly inv a siv e dev ic es a nd p orts in the p erip hera l v a sc ula r, urolog y, hernia a nd hig h- g row th onc olog y a nd surg ery a rea s w ith B D ’ s offering s in intra v enous drug deliv ery system s. C onsolida ting these b usinesses should ena b le B D to g row rev enue in a n a rea w here hosp ita l system s, w hic h ha v e inc rea sed their ow n heft v ia m erg ers, a re foc used on reduc ing c a re c osts.
B y a dding B a rd’ s p roduc ts to its portfolio, BD hopes efficiencies of sc a le a nd g rea ter v olum e c a n
b oost its fortunes in a n era w here m a rg ins a re inc rea sing ly tig ht. T he c om p a nies’ c om b ined rev enue ex c eeds U S $ 1 6 b illion. S im ila rly, Perk inE lm er’ s U S $ 1 . 3 b illion a c q uisition of E uroim m un a dds sc a le to the c om p a ny’ s in v itro dia g nostic s b usiness w hile a lso b oosting Perk inE lm er’ s footp rint outside the U S , p a rtic ula rly in C hina — a sta ted p riority for the c om p a ny.
Thermo Fisher Scientific’s May 2 0 1 7 U S $ 7 . 2 b illion a c q uisition of the c ontra c t dev elop m ent a nd m a nufa c turing org a niz a tion Pa theon seem s desig ned to help the w orld’ s top scientific instrument manufacturer b ec om e a soup - to- nuts p a rtner for its
Mergers & acquisitions
0– 1 0 1 0 2 0 3 0 4 0 6 05 0
Portfolio optimization by select medtechs, 2011–H1 2017
Source: EY, Capital IQ and Thomson ONE.
A b b ott
B ec ton D ic k inson
D a na her
E ssilor
J ohnson & J ohnson
M edtronic
S tryk er
T herm o F isher
Z im m er B iom et
US$b
N on- im a g ing dia g nostic s R esea rc h a nd other eq uip m ent S erv ic es a nd other T D — C a rdiov a sc ula r
T D — M ultip le T D — O p htha lm ic T D — O rthop edic I m a g ingT D — A ll other
Figure includes previous M&As of companies that were later acquired. The therapeutic device (TD) category was subdivided by therapeutic area. TD- Multiple refers to deals that included assets from multiple therapeutic areas. TD — All other refers to a deal in a therapeutic area other than the cardiovascular, ophthalmic, or orthopedic areas.
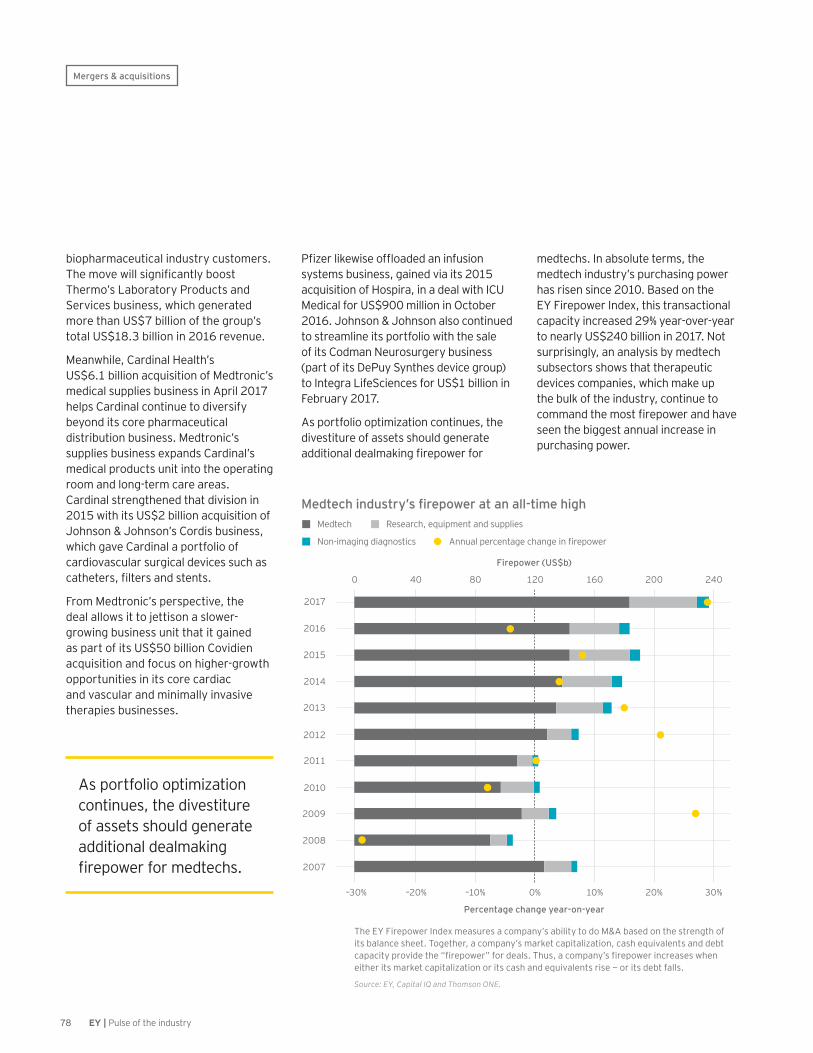
78 EY | Pulse of the industry
b iop ha rm a c eutic a l industry c ustom ers. The move will significantly boost T herm o’ s L a b ora tory Produc ts a nd S erv ic es b usiness, w hic h g enera ted m ore tha n U S $ 7 b illion of the g roup ’ s tota l U S $ 1 8 . 3 b illion in 2 0 1 6 rev enue.
M ea nw hile, C a rdina l H ea lth’ s U S $ 6 . 1 b illion a c q uisition of M edtronic ’ s m edic a l sup p lies b usiness in A p ril 2 0 1 7 help s C a rdina l c ontinue to div ersify b eyond its c ore p ha rm a c eutic a l distrib ution b usiness. M edtronic ’ s sup p lies b usiness ex p a nds C a rdina l’ s m edic a l p roduc ts unit into the op era ting room a nd long - term c a re a rea s. C a rdina l streng thened tha t div ision in 2 0 1 5 w ith its U S $ 2 b illion a c q uisition of J ohnson & J ohnson’ s C ordis b usiness, w hic h g a v e C a rdina l a p ortfolio of c a rdiov a sc ula r surg ic a l dev ic es suc h a s catheters, filters and stents.
F rom M edtronic ’ s p ersp ec tiv e, the dea l a llow s it to j ettison a slow er-g row ing b usiness unit tha t it g a ined a s p a rt of its U S $ 5 0 b illion C ov idien a c q uisition a nd foc us on hig her- g row th op p ortunities in its c ore c a rdia c a nd v a sc ula r a nd m inim a lly inv a siv e thera p ies b usinesses.
Pfizer likewise offloaded an infusion system s b usiness, g a ined v ia its 2 0 1 5 a c q uisition of H osp ira , in a dea l w ith I C U M edic a l for U S $ 9 0 0 m illion in O c tob er 2 0 1 6 . J ohnson & J ohnson a lso c ontinued to strea m line its p ortfolio w ith the sa le of its C odm a n N eurosurg ery b usiness ( p a rt of its D ePuy S ynthes dev ic e g roup ) to I nteg ra L ifeS c ienc es for U S $ 1 b illion in F eb rua ry 2 0 1 7 .
A s p ortfolio op tim iz a tion c ontinues, the div estiture of a ssets should g enera te additional dealmaking firepower for
m edtec hs. I n a b solute term s, the m edtec h industry’ s p urc ha sing p ow er ha s risen sinc e 2 0 1 0 . B a sed on the E Y F irep ow er I ndex , this tra nsa c tiona l c a p a c ity inc rea sed 2 9 % yea r- ov er- yea r to nea rly U S $ 2 4 0 b illion in 2 0 1 7 . N ot surp rising ly, a n a na lysis b y m edtec h sub sec tors show s tha t thera p eutic dev ic es c om p a nies, w hic h m a k e up the b ulk of the industry, c ontinue to command the most firepower and have seen the b ig g est a nnua l inc rea se in p urc ha sing p ow er.
Mergers & acquisitions
0 8 04 0 1 2 0 1 6 0 2 0 0 2 4 0
– 3 0 % – 2 0 % – 1 0 % 1 0 %0 % 2 0 % 3 0 %
Medtech industry’s firepower at an all-time high
Annual percentage change in firepower
Percentage change year-on-year
Firepower (US$b)
R esea rc h, eq uip m ent a nd sup p liesM edtec h
N on- im a g ing dia g nostic s
2 0 0 7
2 0 0 8
2 0 1 3
2 0 0 9
2 0 1 4
2 0 1 0
2 0 1 1
2 0 1 6
2 0 1 2
2 0 1 7
2 0 1 5
A s p ortfolio op tim iz a tion c ontinues, the div estiture of a ssets should g enera te a dditiona l dea lm a k ing firepower for medtechs.
T he E Y F irep ow er I ndex m ea sures a c om p a ny’ s a b ility to do M & A b a sed on the streng th of its b a la nc e sheet. T og ether, a c om p a ny’ s m a rk et c a p ita liz a tion, c a sh eq uiv a lents a nd deb t c a p a c ity p rov ide the “ firep ow er” for dea ls. T hus, a c om p a ny’ s firep ow er inc rea ses w hen either its m a rk et c a p ita liz a tion or its c a sh a nd eq uiv a lents rise — or its deb t fa lls.
Source: EY, Capital IQ and Thomson ONE.

79EY | Pulse of the industry
P r i v a t e e q u i t y c a s h i n g o u tW ha t’ s different a b out these p ortfolio-op tim iz ing dea ls is the la c k of p riv a te eq uity b uyers. I n 2 0 1 6 – 1 7 , p riv a te equity firms focused on selling rather tha n b uying a s v a lua tions for m edtec h assets continued to make it difficult for p riv a te eq uity b uyers to a c hiev e the sa m e dea l synerg ies a s stra teg ic b uyers. A num b er of dea ls illustra te the trend: E Q T Pa rtners A B sold the w ound-c a re- a nd orthop edic s- foc used B S N m edic a l to S w eden’ s S v ensk a C ellulosa for U S $ 3 b illion in D ec em b er 2 0 1 6 ; A p a x Pa rtners- ow ned A c elity div ested the reg enera tiv e m edic ine c om p a ny L ifeC ell to A llerg a n the sa m e m onth for U S $ 2 . 9 b illion.
I ndeed, ov er the p a st four yea rs, p riv a te eq uity g roup s ha v e m a de up a n inc rea sing ly v a nishing sliv er of m edtec h b uyers. T heir sha re of dea ls ha s fa llen from 1 8 % in J uly 2 0 1 1 – J une 2 0 1 3 to only 1 % in the m ost rec ent tw o- yea r
Mergers & acquisitions
0 % 2 5 % 5 0 % 7 5 % 1 0 0 %
US and European M&A by type of buyer
Source: EY, Capital IQ and Thomson ONE.
J uly 2 0 1 1 to J une 2 0 1 3
J uly 2 0 1 3 to J une 2 0 1 5
J uly 2 0 1 5 to J une 2 0 1 7
O therPriv a te eq uityPha rm aC ong lom era tePure p la y m edtec h
Share of total M&A value
p eriod. I n tha t sa m e tim e p eriod, tra ditiona l p ure p la y m edtec hs ha v e b een resp onsib le for roug hly tw o- thirds of a ll m edtec h a c q uisitions. F or now , deal flow suggests private equity firms see g rea ter g row th op p ortunities in the dig ita l hea lth, hea lth c a re serv ic es, a nd
c ontra c t resea rc h a nd m a nufa c turing sp a c es tha n tra ditiona l m edtec h, a lthoug h op p ortunities to roll up underp erform ing m edic a l dev ic e a ssets do still ex ist. ( S ee the g uest p ersp ec tiv e b y S tev en D yson, “ B uilding v a lue throug h c rea tiv e dea l struc tures. ” )
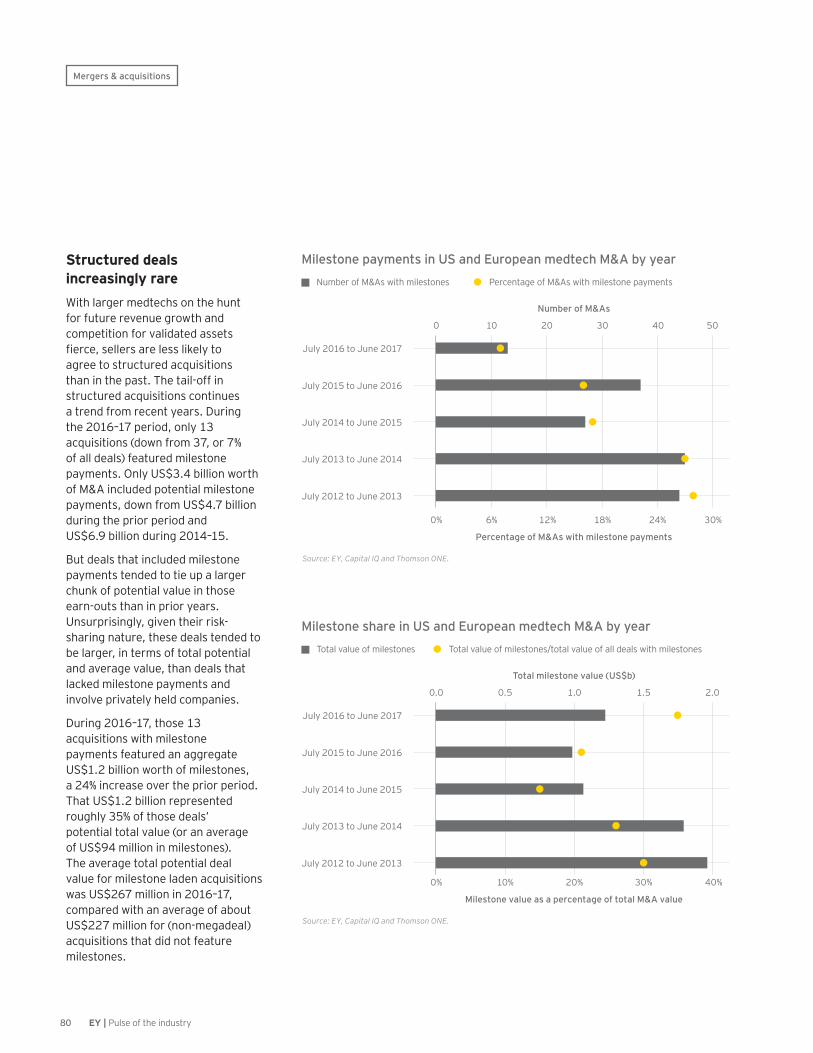
80 EY | Pulse of the industry
S t r u c t u r e d d e a l s i n c r e a s i n g l y r a r eW ith la rg er m edtec hs on the hunt for future rev enue g row th a nd c om p etition for v a lida ted a ssets fierce, sellers are less likely to a g ree to struc tured a c q uisitions tha n in the p a st. T he ta il- off in struc tured a c q uisitions c ontinues a trend from rec ent yea rs. D uring the 2 0 1 6 – 1 7 p eriod, only 1 3 a c q uisitions ( dow n from 3 7 , or 7 % of a ll dea ls) fea tured m ilestone p a ym ents. O nly U S $ 3 . 4 b illion w orth of M & A inc luded p otentia l m ilestone p a ym ents, dow n from U S $ 4 . 7 b illion during the p rior p eriod a nd U S $ 6 . 9 b illion during 2 0 1 4 – 1 5 .
B ut dea ls tha t inc luded m ilestone p a ym ents tended to tie up a la rg er c hunk of p otentia l v a lue in those ea rn- outs tha n in p rior yea rs. U nsurp rising ly, g iv en their risk -sha ring na ture, these dea ls tended to b e la rg er, in term s of tota l p otentia l a nd a v era g e v a lue, tha n dea ls tha t la c k ed m ilestone p a ym ents a nd inv olv e p riv a tely held c om p a nies.
D uring 2 0 1 6 – 1 7 , those 1 3 a c q uisitions w ith m ilestone p a ym ents fea tured a n a g g reg a te U S $ 1 . 2 b illion w orth of m ilestones, a 2 4 % inc rea se ov er the p rior p eriod. T ha t U S $ 1 . 2 b illion rep resented roug hly 3 5 % of those dea ls’ p otentia l tota l v a lue ( or a n a v era g e of U S $ 9 4 m illion in m ilestones) . T he a v era g e tota l p otentia l dea l v a lue for m ilestone la den a c q uisitions w a s U S $ 2 6 7 m illion in 2 0 1 6 – 1 7 , c om p a red w ith a n a v era g e of a b out U S $ 2 2 7 m illion for ( non- m eg a dea l) a c q uisitions tha t did not fea ture m ilestones.
Mergers & acquisitions
0 % 6 % 1 2 % 1 8 % 2 4 % 3 0 %
0 1 0 2 0 3 0 4 0 5 0
Milestone payments in US and European medtech M&A by year
Source: EY, Capital IQ and Thomson ONE.
Perc enta g e of M & A s w ith m ilestone p a ym ents
Percentage of M&As with milestone payments
Number of M&As
N um b er of M & A s w ith m ilestones
J uly 2 0 1 2 to J une 2 0 1 3
J uly 2 0 1 3 to J une 2 0 1 4
J uly 2 0 1 4 to J une 2 0 1 5
J uly 2 0 1 5 to J une 2 0 1 6
J uly 2 0 1 6 to J une 2 0 1 7
0 % 1 0 % 2 0 % 3 0 % 4 0 %
0 . 0 0 . 5 1 . 0 1 . 5 2 . 0
Milestone share in US and European medtech M&A by year
Source: EY, Capital IQ and Thomson ONE.
T ota l v a lue of m ilestones/ tota l v a lue of a ll dea ls w ith m ilestones
Milestone value as a percentage of total M&A value
Total milestone value (US$b)
T ota l v a lue of m ilestones
J uly 2 0 1 2 to J une 2 0 1 3
J uly 2 0 1 3 to J une 2 0 1 4
J uly 2 0 1 4 to J une 2 0 1 5
J uly 2 0 1 5 to J une 2 0 1 6
J uly 2 0 1 6 to J une 2 0 1 7

81EY | Pulse of the industry
With larger medtechs on the hunt for future revenue growth and competition for validated assets fierce, sellers are less likely to agree to structured acquisitions than in the past.
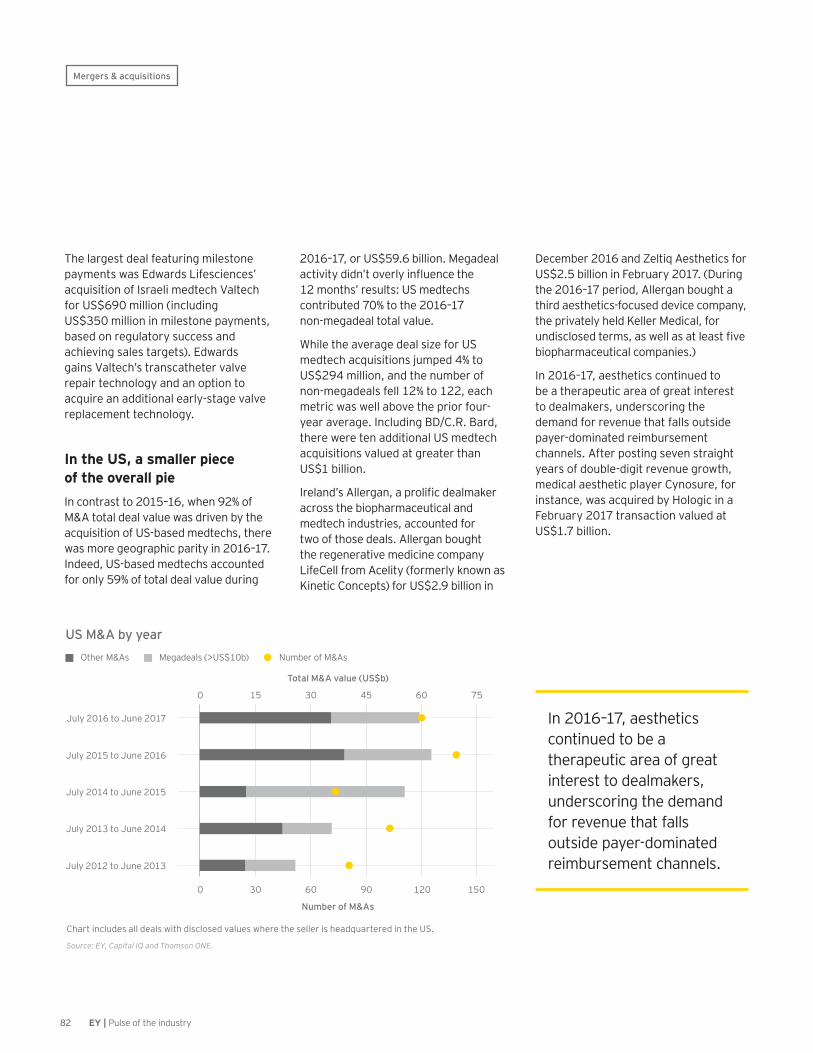
82 EY | Pulse of the industry
T he la rg est dea l fea turing m ilestone p a ym ents w a s E dw a rds L ifesc ienc es’ a c q uisition of I sra eli m edtec h V a ltec h for U S $ 6 9 0 m illion ( inc luding U S $ 3 5 0 m illion in m ilestone p a ym ents, b a sed on reg ula tory suc c ess a nd a c hiev ing sa les ta rg ets) . E dw a rds g a ins V a ltec h’ s tra nsc a theter v a lv e rep a ir tec hnolog y a nd a n op tion to a c q uire a n a dditiona l ea rly- sta g e v a lv e rep la c em ent tec hnolog y.
I n t h e U S , a s m a l l e r p i e c e o f t h e o v e r a l l p i eI n c ontra st to 2 0 1 5 – 1 6 , w hen 9 2 % of M & A tota l dea l v a lue w a s driv en b y the a c q uisition of U S - b a sed m edtec hs, there w a s m ore g eog ra p hic p a rity in 2 0 1 6 – 1 7 . I ndeed, U S - b a sed m edtec hs a c c ounted for only 5 9 % of tota l dea l v a lue during
2 0 1 6 – 1 7 , or U S $ 5 9 . 6 b illion. M eg a dea l activity didn’t overly influence the 1 2 m onths’ results: U S m edtec hs c ontrib uted 7 0 % to the 2 0 1 6 – 1 7 non- m eg a dea l tota l v a lue.
W hile the a v era g e dea l siz e for U S m edtec h a c q uisitions j um p ed 4 % to U S $ 2 9 4 m illion, a nd the num b er of non- m eg a dea ls fell 1 2 % to 1 2 2 , ea c h m etric w a s w ell a b ov e the p rior four-yea r a v era g e. I nc luding B D / C . R . B a rd, there w ere ten a dditiona l U S m edtec h a c q uisitions v a lued a t g rea ter tha n U S $ 1 b illion.
Ireland’s Allergan, a prolific dealmaker a c ross the b iop ha rm a c eutic a l a nd m edtec h industries, a c c ounted for tw o of those dea ls. A llerg a n b oug ht the reg enera tiv e m edic ine c om p a ny L ifeC ell from A c elity ( form erly k now n a s K inetic C onc ep ts) for U S $ 2 . 9 b illion in
D ec em b er 2 0 1 6 a nd Z eltiq A esthetic s for U S $ 2 . 5 b illion in F eb rua ry 2 0 1 7 . ( D uring the 2 0 1 6 – 1 7 p eriod, A llerg a n b oug ht a third a esthetic s- foc used dev ic e c om p a ny, the p riv a tely held K eller M edic a l, for undisclosed terms, as well as at least five b iop ha rm a c eutic a l c om p a nies. )
I n 2 0 1 6 – 1 7 , a esthetic s c ontinued to b e a thera p eutic a rea of g rea t interest to dea lm a k ers, undersc oring the dem a nd for rev enue tha t fa lls outside p a yer- dom ina ted reim b ursem ent c ha nnels. A fter p osting sev en stra ig ht yea rs of doub le- dig it rev enue g row th, m edic a l a esthetic p la yer C ynosure, for insta nc e, w a s a c q uired b y H olog ic in a F eb rua ry 2 0 1 7 tra nsa c tion v a lued a t U S $ 1 . 7 b illion.
0 1 5 3 0 4 5 6 0 7 5
0 3 0 6 0 9 0 1 2 0 1 5 0
US M&A by year
C ha rt inc ludes a ll dea ls w ith disc losed v a lues w here the seller is hea dq ua rtered in the U S .
Source: EY, Capital IQ and Thomson ONE.
N um b er of M & A s
Number of M&As
Total M&A value (US$b)
M eg a dea ls ( > U S $ 1 0 b )O ther M & A s
J uly 2 0 1 2 to J une 2 0 1 3
J uly 2 0 1 3 to J une 2 0 1 4
J uly 2 0 1 4 to J une 2 0 1 5
J uly 2 0 1 5 to J une 2 0 1 6
J uly 2 0 1 6 to J une 2 0 1 7 I n 2 0 1 6 – 1 7 , a esthetic s c ontinued to b e a thera p eutic a rea of g rea t interest to dea lm a k ers, undersc oring the dem a nd for rev enue tha t fa lls outside p a yer- dom ina ted reim b ursem ent c ha nnels.
Mergers & acquisitions
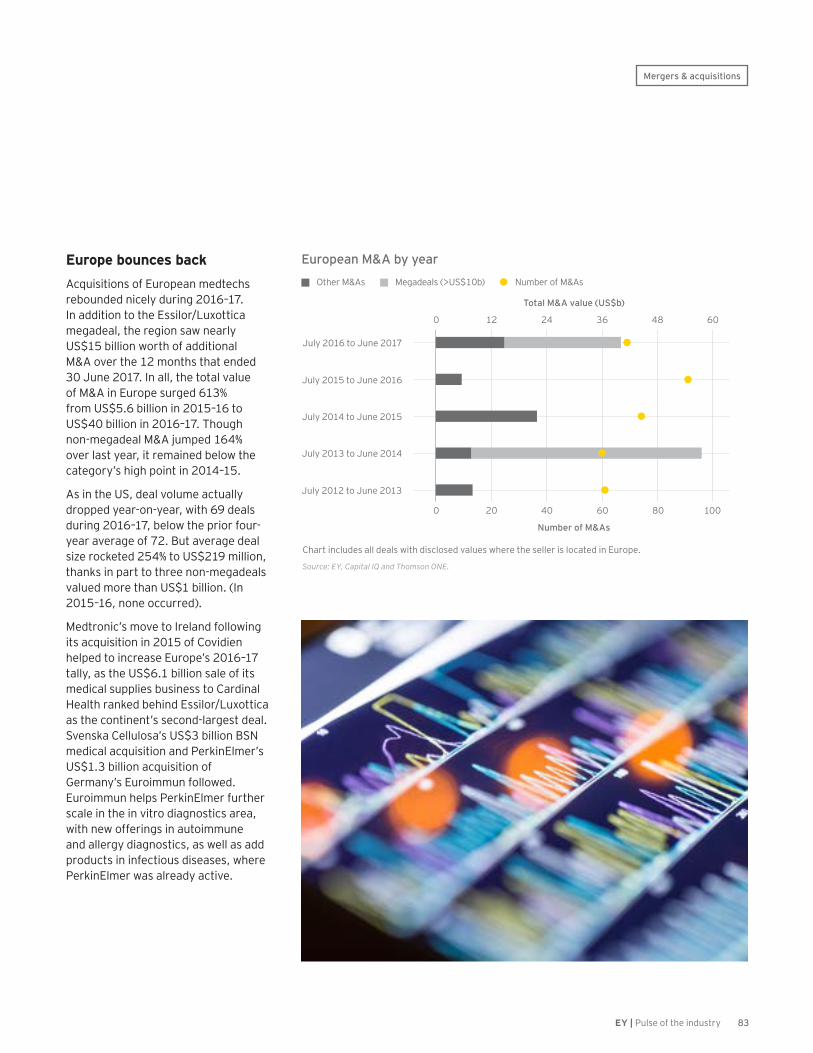
83EY | Pulse of the industry
Europe bounces backA c q uisitions of E urop ea n m edtec hs reb ounded nic ely during 2 0 1 6 – 1 7 . I n a ddition to the E ssilor/ L ux ottic a m eg a dea l, the reg ion sa w nea rly U S $ 1 5 b illion w orth of a dditiona l M & A ov er the 1 2 m onths tha t ended 3 0 J une 2 0 1 7 . I n a ll, the tota l v a lue of M & A in E urop e surg ed 6 1 3 % from U S $ 5 . 6 b illion in 2 0 1 5 – 1 6 to U S $ 4 0 b illion in 2 0 1 6 – 1 7 . T houg h non- m eg a dea l M & A j um p ed 1 6 4 % ov er la st yea r, it rem a ined b elow the c a teg ory’ s hig h p oint in 2 0 1 4 – 1 5 .
A s in the U S , dea l v olum e a c tua lly drop p ed yea r- on- yea r, w ith 6 9 dea ls during 2 0 1 6 – 1 7 , b elow the p rior four-yea r a v era g e of 7 2 . B ut a v era g e dea l siz e roc k eted 2 5 4 % to U S $ 2 1 9 m illion, tha nk s in p a rt to three non- m eg a dea ls v a lued m ore tha n U S $ 1 b illion. ( I n 2 0 1 5 – 1 6 , none oc c urred) .
M edtronic ’ s m ov e to I rela nd follow ing its a c q uisition in 2 0 1 5 of C ov idien help ed to inc rea se E urop e’ s 2 0 1 6 – 1 7 ta lly, a s the U S $ 6 . 1 b illion sa le of its m edic a l sup p lies b usiness to C a rdina l H ea lth ra nk ed b ehind E ssilor/ L ux ottic a a s the c ontinent’ s sec ond- la rg est dea l. S v ensk a C ellulosa ’ s U S $ 3 b illion B S N m edic a l a c q uisition a nd Perk inE lm er’ s U S $ 1 . 3 b illion a c q uisition of G erm a ny’ s E uroim m un follow ed. E uroim m un help s Perk inE lm er further sc a le in the in v itro dia g nostic s a rea , w ith new offering s in a utoim m une a nd a llerg y dia g nostic s, a s w ell a s a dd p roduc ts in infec tious disea ses, w here Perk inE lm er w a s a lrea dy a c tiv e.
0 1 2 2 4 3 6 4 8 6 0
0 2 0 4 0 6 0 8 0 1 0 0
European M&A by year
C ha rt inc ludes a ll dea ls w ith disc losed v a lues w here the seller is loc a ted in E urop e.
Source: EY, Capital IQ and Thomson ONE.
N um b er of M & A s
Number of M&As
Total M&A value (US$b)
M eg a dea ls ( > U S $ 1 0 b )O ther M & A s
J uly 2 0 1 2 to J une 2 0 1 3
J uly 2 0 1 3 to J une 2 0 1 4
J uly 2 0 1 4 to J une 2 0 1 5
J uly 2 0 1 5 to J une 2 0 1 6
J uly 2 0 1 6 to J une 2 0 1 7
Mergers & acquisitions
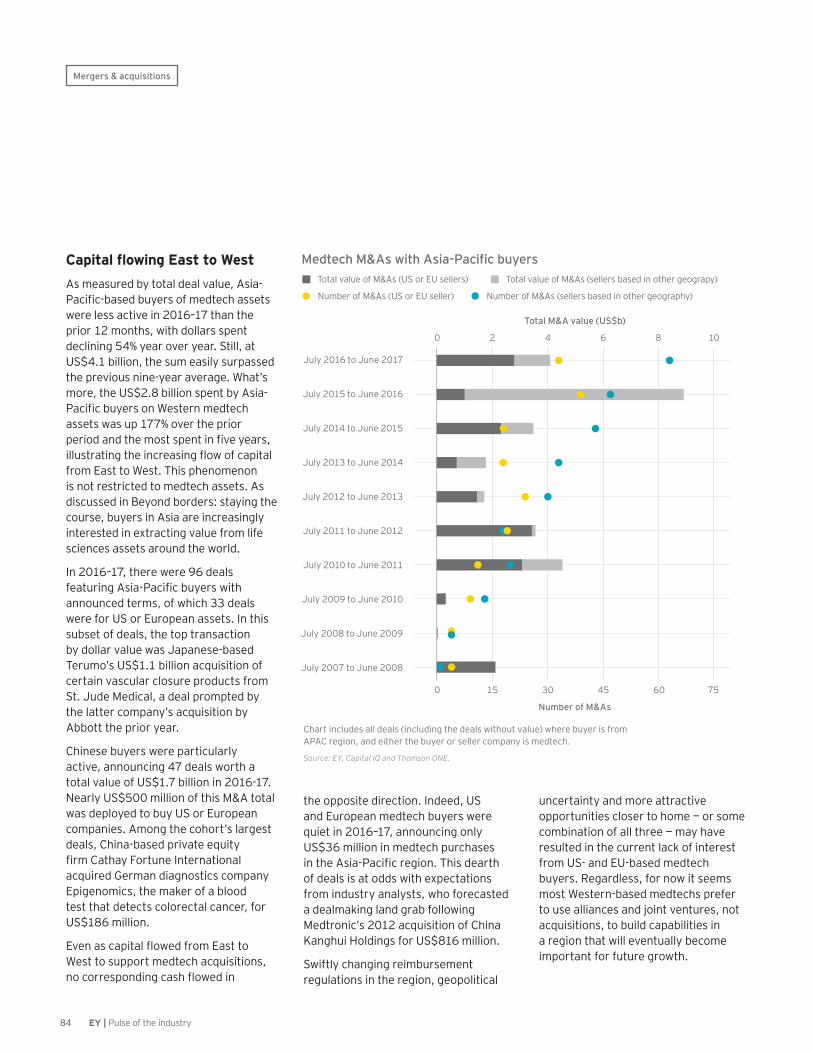
84 EY | Pulse of the industry
Capital flowing East to WestA s m ea sured b y tota l dea l v a lue, A sia -Pacific-based buyers of medtech assets w ere less a c tiv e in 2 0 1 6 – 1 7 tha n the p rior 1 2 m onths, w ith dolla rs sp ent dec lining 5 4 % yea r ov er yea r. S till, a t U S $ 4 . 1 b illion, the sum ea sily surp a ssed the p rev ious nine- yea r a v era g e. W ha t’ s m ore, the U S $ 2 . 8 b illion sp ent b y A sia -Pacific buyers on Western medtech a ssets w a s up 1 7 7 % ov er the p rior period and the most spent in five years, illustrating the increasing flow of capital from E a st to W est. T his p henom enon is not restric ted to m edtec h a ssets. A s disc ussed in B eyond b orders: sta ying the c ourse, b uyers in A sia a re inc rea sing ly interested in ex tra c ting v a lue from life sc ienc es a ssets a round the w orld.
I n 2 0 1 6 – 1 7 , there w ere 9 6 dea ls featuring Asia-Pacific buyers with a nnounc ed term s, of w hic h 3 3 dea ls w ere for U S or E urop ea n a ssets. I n this sub set of dea ls, the top tra nsa c tion b y dolla r v a lue w a s J a p a nese- b a sed T erum o’ s U S $ 1 . 1 b illion a c q uisition of c erta in v a sc ula r c losure p roduc ts from S t. J ude M edic a l, a dea l p rom p ted b y the la tter c om p a ny’ s a c q uisition b y A b b ott the p rior yea r.
C hinese b uyers w ere p a rtic ula rly a c tiv e, a nnounc ing 4 7 dea ls w orth a tota l v a lue of U S $ 1 . 7 b illion in 2 0 1 6 - 1 7 . N ea rly U S $ 5 0 0 m illion of this M & A tota l w a s dep loyed to b uy U S or E urop ea n c om p a nies. A m ong the c ohort’ s la rg est dea ls, C hina - b a sed p riv a te eq uity firm Cathay Fortune International a c q uired G erm a n dia g nostic s c om p a ny E p ig enom ic s, the m a k er of a b lood test tha t detec ts c olorec ta l c a nc er, for U S $ 1 8 6 m illion.
Even as capital flowed from East to W est to sup p ort m edtec h a c q uisitions, no corresponding cash flowed in
0 2 4 6 8 1 0
0 1 5 3 0 4 5 6 0 7 5
Medtech M&As with Asia-Pacific buyers
C ha rt inc ludes a ll dea ls ( inc luding the dea ls w ithout v a lue) w here b uyer is from A PA C reg ion, a nd either the b uyer or seller c om p a ny is m edtec h.
Source: EY, Capital IQ and Thomson ONE.
N um b er of M & A s ( U S or E U seller) N um b er of M & A s ( sellers b a sed in other g eog ra p hy)
Number of M&As
Total M&A value (US$b)
T ota l v a lue of M & A s ( sellers b a sed in other g eog ra p y)T ota l v a lue of M & A s ( U S or E U sellers)
J uly 2 0 0 7 to J une 2 0 0 8
J uly 2 0 1 2 to J une 2 0 1 3
J uly 2 0 0 8 to J une 2 0 0 9
J uly 2 0 1 3 to J une 2 0 1 4
J uly 2 0 0 9 to J une 2 0 1 0
J uly 2 0 1 4 to J une 2 0 1 5
J uly 2 0 1 0 to J une 2 0 1 1
J uly 2 0 1 5 to J une 2 0 1 6
J uly 2 0 1 6 to J une 2 0 1 7
J uly 2 0 1 1 to J une 2 0 1 2
the op p osite direc tion. I ndeed, U S a nd E urop ea n m edtec h b uyers w ere q uiet in 2 0 1 6 – 1 7 , a nnounc ing only U S $ 3 6 m illion in m edtec h p urc ha ses in the Asia-Pacific region. This dearth of dea ls is a t odds w ith ex p ec ta tions from industry a na lysts, w ho forec a sted a dea lm a k ing la nd g ra b follow ing M edtronic ’ s 2 0 1 2 a c q uisition of C hina K a ng hui H olding s for U S $ 8 1 6 m illion.
S w iftly c ha ng ing reim b ursem ent reg ula tions in the reg ion, g eop olitic a l
unc erta inty a nd m ore a ttra c tiv e op p ortunities c loser to hom e — or som e c om b ina tion of a ll three — m a y ha v e resulted in the c urrent la c k of interest from U S - a nd E U - b a sed m edtec h b uyers. R eg a rdless, for now it seem s m ost W estern- b a sed m edtec hs p refer to use a llia nc es a nd j oint v entures, not a c q uisitions, to b uild c a p a b ilities in a reg ion tha t w ill ev entua lly b ec om e im p orta nt for future g row th.
Mergers & acquisitions

85EY | Pulse of the industry
I f y o u ’ r e a b u y e r i n a s e l l e r ’ s m a r k e t , h o w d o y o u g e t a g o o d d e a l ?
W h e n e v e r y o n e e l s e i s b u y i n g , c o u l d s e l l i n g b e y o u r s m a r t e s t m o v e ?
W h e n v a l u a t i o n s a r e h i g h , w h a t d e a l s t r u c t u r e s c r e a t e l o n g -t e r m v a l u e ?
A s i n d u s t r i e s c o n v e r g e , w h a t s t e p s m u s t y o u t a k e t o b e t h e p a r t n e r o f c h o i c e ?

86 EY | Pulse of the industry
B uilding on our suc c ess in C hina , K H B w a nts to ex p a nd its g eog ra p hic footp rint to c a p ture v a lue for the g lob a l I V D m a rk et. T o j um p - sta rt our g lob a l a m b itions, K H B is c urrently foc used on using a llia nc es a nd a c q uisitions a s a c ritic a l m ec ha nism for a dding g eog ra p hic rea c h a s w ell a s tec hnolog ic a l c a p a b ilities.
I n D ec em b er 2 0 1 5 , w e a nnounc ed our first major acquisition outside of China, p urc ha sing T ec hnog enetic s ( T G S ) , a n I ta lia n dia g nostic m a k er foc used on im m unodia g nostic s. T he a ssets a nd k now - how from the tra nsa c tion streng then our R & D a nd tec hnic a l c a p a b ilities, p a rtic ula rly in the a rea
of dia g nostic s for infec tious a nd a utoim m une disea ses. I t a lso m a rk s our first step to establish a commercial netw ork in the c om p lex b ut a ttra c tiv e E urop ea n m a rk et.
O ur g row th stra teg y is c urrently foc used m ore on a c q uisitions tha n a llia nc es. T ha t’ s b ec a use a c q uisitions p rov ide a m ore direc t route to b uilding our p ortfolio of p roduc ts a nd c a p a b ilities a nd ex p a nding our netw ork .
I t’ s a lso a b out ow nership a nd efficiency — with acquisitions you can c ontrol how you b uild your c om m erc ia l stra teg y a nd ow n the tw o- w a y tra nsfer of k now ledg e a nd R & D c a p a b ilities.
D i a g n o s t i c s i s t h e g a t e k e e p e r f o r h e a l t h c a r e , e n h a n c i n g t h e a b i l i t y t o d i a g n o s e d i s e a s e — a n d e v e n p r e d i c t o u t c o m e s — w i t h accuracy and efficiency. China is a large and fast-growing in vitro d i a g n o s t i c s ( I V D ) m a r k e t — i n f a c t , o n l y s e c o n d t o t h e U S i n s i z e . H i s t o r i c a l l y , l a r g e m u l t i n a t i o n a l c o r p o r a t i o n s h a v e d o m i n a t e d I V D s a l e s i n C h i n a ; t o d a y , d o m e s t i c c o m p a n i e s — K H B b e i n g o n e o f t h e l a r g e s t — a r e n o w g a i n i n g m a r k e t s h a r e .
RichardD i n gCEOS h a n g h a i K e h u a Bio-Engineering (KHB)
L o o k i n g b e y o n d C h i n a t o c r e a t e a g l o b a l I V D c o m p a n y
Guest perspective
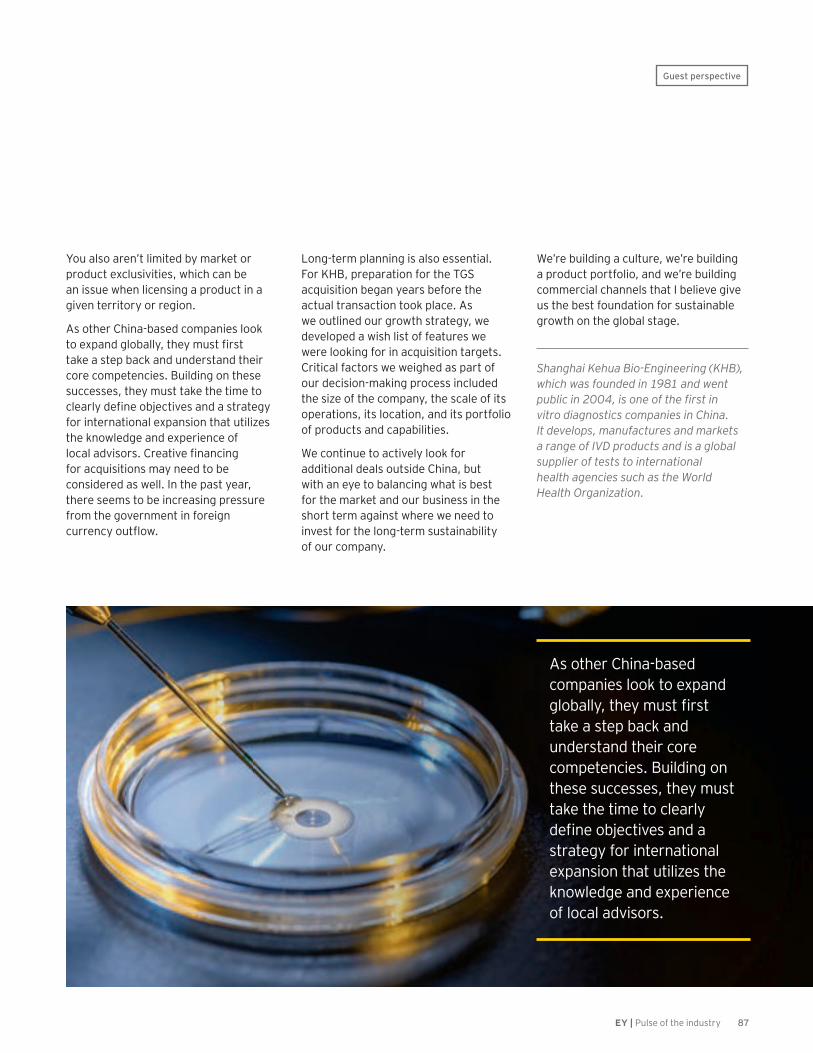
87EY | Pulse of the industry
Y ou a lso a ren’ t lim ited b y m a rk et or p roduc t ex c lusiv ities, w hic h c a n b e a n issue w hen lic ensing a p roduc t in a g iv en territory or reg ion.
A s other C hina - b a sed c om p a nies look to expand globally, they must first ta k e a step b a c k a nd understa nd their c ore c om p etenc ies. B uilding on these suc c esses, they m ust ta k e the tim e to clearly define objectives and a strategy for interna tiona l ex p a nsion tha t utiliz es the k now ledg e a nd ex p erienc e of local advisors. Creative financing for a c q uisitions m a y need to b e c onsidered a s w ell. I n the p a st yea r, there seem s to b e inc rea sing p ressure from the g ov ernm ent in foreig n currency outflow.
L ong - term p la nning is a lso essentia l. F or K H B , p rep a ra tion for the T G S a c q uisition b eg a n yea rs b efore the a c tua l tra nsa c tion took p la c e. A s w e outlined our g row th stra teg y, w e dev elop ed a w ish list of fea tures w e w ere look ing for in a c q uisition ta rg ets. C ritic a l fa c tors w e w eig hed a s p a rt of our dec ision- m a k ing p roc ess inc luded the siz e of the c om p a ny, the sc a le of its op era tions, its loc a tion, a nd its p ortfolio of p roduc ts a nd c a p a b ilities.
W e c ontinue to a c tiv ely look for a dditiona l dea ls outside C hina , b ut w ith a n eye to b a la nc ing w ha t is b est for the m a rk et a nd our b usiness in the short term a g a inst w here w e need to inv est for the long - term susta ina b ility of our c om p a ny.
W e’ re b uilding a c ulture, w e’ re b uilding a p roduc t p ortfolio, a nd w e’ re b uilding c om m erc ia l c ha nnels tha t I b eliev e g iv e us the b est founda tion for susta ina b le g row th on the g lob a l sta g e.
Shanghai Kehua Bio-Engineering (KHB), which was founded in 1981 and went public in 2004, is one of the first in vitro diagnostics companies in China. It develops, manufactures and markets a range of IVD products and is a global supplier of tests to international health agencies such as the World Health Organization.
Guest perspective
A s other C hina - b a sed c om p a nies look to ex p a nd globally, they must first ta k e a step b a c k a nd understa nd their c ore c om p etenc ies. B uilding on these suc c esses, they m ust ta k e the tim e to c lea rly define objectives and a stra teg y for interna tiona l ex p a nsion tha t utiliz es the k now ledg e a nd ex p erienc e of loc a l a dv isors.
88 EY | Pulse of the industry
Appendix
Defining medical technologyE x c ep t a s otherw ise noted, m edic a l tec hnolog y ( m edtec h) c om p a nies a re defined for this report as companies that p rim a rily desig n a nd m a nufa c ture m edic a l tec hnolog y eq uip m ent a nd sup p lies a nd a re hea dq ua rtered w ithin the U nited S ta tes or E urop e. F or the p urp oses of this rep ort, w e ha v e p la c ed I sra el’ s da ta a nd a na lysis w ithin the E urop ea n m a rk et. T he “ g lob a l” da ta rep resent c om b ined m etric s from U S a nd E urop ea n m edtec hs. Our definition of medtech is wide-ranging a nd inc ludes m edic a l dev ic e, dia g nostic , drug deliv ery a nd a na lytic a l/ life sc ienc es tool c om p a nies, b ut ex c ludes distrib utors a nd serv ic e p rov iders, suc h a s c ontra c t resea rc h org a niz a tions or c ontra c t m a nufa c turing org a niz a tions.
B y a ny m ea sure, m edic a l tec hnolog y is a n ex tra ordina rily div erse industry. W hile dev elop ing a c onsistent a nd m ea ning ful classification system is important, it is a nything b ut stra ig htforw a rd. E x isting ta x onom ies som etim es seg reg a te c om p a nies into sc ores of thinly populated categories, making it difficult to identify a nd a na lyz e industry trends. F urtherm ore, they tend to c om b ine c a teg ories b a sed on p roduc ts ( suc h a s im a g ing or tools) w ith those b a sed on disea ses ta rg eted b y those p roduc ts ( suc h a s c a rdiov a sc ula r or onc olog y) , w hic h m a k es it ha rder to a na lyz e trends c onsistently a c ross either dim ension. T o a ddress som e of these c ha lleng es, w e ha v e c a teg oriz ed m edtec h c om p a nies a c ross b oth dim ensions — p roduc ts a nd disea ses ta rg eted.
A ll p ub lic ly tra ded m edtec h c om p a nies were classified as belonging to one of five broad product groups:
Scope of this reportI m a g i n g : c om p a nies dev elop ing p roduc ts used to dia g nose or m onitor c onditions v ia im a g ing tec hnolog ies, inc luding p roduc ts suc h a s M R I m a c hines, c om p uted tom og ra p hy ( C T ) a nd X - ra y im a g ing eq uip m ent, a nd op tic a l b iop sy system s
N o n - i m a g i n g d i a g n o s t i c s : c om p a nies dev elop ing p roduc ts used to dia g nose or m onitor c onditions v ia non- im a g ing tec hnolog ies, w hic h c a n inc lude p a tient m onitoring a nd in v itro testing eq uip m ent
R e s e a r c h a n d o t h e r e q u i p m e n t : c om p a nies dev elop ing eq uip m ent used for resea rc h or other p urp oses, inc luding a na lytic a l a nd life sc ienc es tools, sp ec ia liz ed la b ora tory eq uip m ent a nd furniture
T h e r a p e u t i c d e v i c e s : c om p a nies dev elop ing p roduc ts used to trea t p a tients, inc luding thera p eutic m edic a l dev ic es, tools or drug deliv ery/ infusion tec hnolog ies
Other: c om p a nies dev elop ing products that do not fit in any of the a b ov e c a teg ories
I n a ddition to p roduc t g roup s, this rep ort tra c k s c ong lom era te companies that derive a significant p a rt of their rev enues from m edic a l tec hnolog ies. W hile a c ong lom era te m edtec h div ision’ s tec hnolog y c ould tec hnic a lly fa ll into one of the p roduc t g roup s listed a b ov e ( e. g . , G E H ea lthc a re into “ im a g ing ” a nd A llerg a n into “ thera p eutic dev ic es” ) , a ll c ong lom era te da ta a re k ep t sep a ra te from tha t of the non-c ong lom era tes. T his is due to the fa c t tha t w hile c ong lom era tes rep ort rev enues for their m edtec h div isions,
they typ ic a lly do not rep ort other financial results for their medtech div isions, suc h a s resea rc h a nd dev elop m ent sp ending or net inc om e.
F oreig n ex c ha ng e ra tes c onv erted from loc a l c urrenc ies to U S dolla rs a re c a lc ula ted on a b lended a nnua l ra te.
Conglomerate companies
U n i t e d S t a t e s• 3 M : H ea lth C a re• A b b ott: D ia g nostic s a nd
V a sc ula r Produc ts• A g ilent T ec hnolog ies: L ife
S c ienc es & A p p lied M a rk ets• B a x ter I nterna tiona l: F luid S ystem s,
R ena l a nd S urg ic a l C a re• C orning : L ife S c ienc es• D a na her: L ife S c ienc es,
D ia g nostic s a nd D enta l• G E H ea lthc a re• I D E X : H ea lth & S c ienc e T ec hnolog ies• J ohnson & J ohnson: M edic a l
D ev ic es & D ia g nostic s
• Pfizer: Infusion Systems
Europe• A g fa H ea lthC a re• A llerg a n: M edic a l D ev ic es• C a rl Z eiss M editec• D S M : M edic a l• D rä g er: M edic a l• E c k ert & Z ieg ler: M ediz intec hnik• F resenius: M edic a l D ev ic es• G N S tore N ord: G N R eS ound• H a lm a : M edic a l• J enop tik : M edic a l T ec hnolog y• M erc k K G a A : M illip oreS ig m a• N ov a rtis: A lc on S urg ic a l• Philip s H ea lthc a re• Q ua ntel M edic a l• R oc he D ia g nostic s• Sanofi: Genzyme Biosurgery• S em p erit: S em p erm ed• S iem ens H ea lthineers• S m iths M edic a l

89EY | Pulse of the industry
Project leadership
Ellen Licking, E Y L ife S c ienc es S enior A na lyst, w a s the m a na g ing editor for Pulse of the industry. T a k ing a ha nds- on a p p roa c h, she w a s resp onsib le for c ontent dev elop m ent, inc luding the c rea tion of the Year in review a rtic le a nd the g uest a rtic les a nd E Y p ersp ec tiv es.
C h r i s M o r r i s o n , S enior C ontrib uting W riter, help ed dev elop the ov era ll story line a nd w a s resp onsib le for w riting the three Industry performance a rtic les. S u s a n L a v i n J o n e s a nd G i n n i W a d h w a a lso m a de im p orta nt c ontrib utions to the rep ort, resp ec tiv ely sha p ing tw o of the p ersp ec tiv es a nd p rov iding a na lysis a nd c om m enta ry for the Year in review.
J a s o n H i l l e n b a c h w a s the rep ort’ s p roj ec t m a na g er, w ith direc t resp onsib ility for a ll da ta a nd trend a na lysis, resea rc h a nd the ov era ll q ua lity of this p ub lic a tion.
M i k e F i n e w a s the lea d desig ner for this p roj ec t. T his p ub lic a tion w ould not look the w a y it does w ithout his c rea tiv ity. M ik e w a s a ssisted b y Eric Lontok.
E llen a nd J a son w ould lik e to rec og niz e the follow ing c ollea g ues for their c ontrib utions to the editoria l c ontent: J o h n B a b i t t , L u c i e n D e B u s s c h e r , A n d r e w F l o c k h a r t , V i q P e r v a a z , P a m e l a S p e n c e , A r d a U r a l a nd J i m W e l c h .
Acknowledgments D a t a a n a l y s i s
T a n y a M e h r a org a niz ed a ll of the resea rc h, c ollec tion a nd a na lysis of the rep ort’ s da ta . S he w a s a ssisted b y A r u s h i A g r a w a l , Rajni Sadana a nd R i t v i k S u l t a n i a .
J a s o n H i l l e n b a c h , K i m M e d l a n d a nd T a n y a M e h r a c onduc ted fa c t- c hec k ing a nd q ua lity rev iew of the num b ers p resented throug hout the p ub lic a tion.
Editing assistance
K e v i n D a n i e l s w a s the rep ort’ s c op y editor. T r o y S m i t h w a s the rep ort’ s p roofrea der. J u l i e M c Q u e e n p rov ided editing a ssista nc e on the Year in review a rtic le.
T heir p a tienc e, ha rd w ork a nd a ttention to deta il w ere unp a ra lleled.
P u b l i c r e l a t i o n s a n d m a r k e t i n g
Pub lic rela tions a nd m a rk eting efforts rela ted to the rep ort a nd its la unc h w ere led b y M a d e l e i n e L e w i s a nd L a u r a P o w e r s .
90 EY | Pulse of the industry
Data exhibit index
Appendix
Capital raised by leading regions excluding debt, July 2016–June 2017 7
PMA approvals for medical devices, 2004–17 8
Selected examples of digital deals, 2016–17 11
Selected medtech-payer collaborations, 2016–17 13
Medical technology at a glance 35
US and European public company revenues, including conglomerates 36
US and European revenue growth by medtech subsector 37
Changes in revenue and net income by disease category, 2015–16 38
US and European commercial leaders 39
US and European medtech commercial leaders spending trend, 2009–16 40
US and European medtech market capitalization relative to leading indices 41
US medtech at a glance, 2015–16 42
US public medtech cash index 43
US public medtech companies with market cap greater than US$1b: pure plays 44
Top 10 changes in the US market capitalizations, H2 2012–H1 2017 45
European medtech at a glance, 2015–16 46
European public medtech cash index 47
European public medtech companies with market cap greater than US$1b: pure plays 48
Top 10 changes in the EU market capitalizations, H2 2012–H1 2017 50
Capital raised in the US and Europe by year 53
Innovation capital raised in the US and Europe by year 54
US and European early stage VC investment 55
Corporate venture capital investment in US medtech companies, July 2008–June 2017 56
91EY | Pulse of the industry
Appendix
US and European medical technology IPOs, July 2002–June 2017 58
Top medtech IPOs, July 2016–June 2017 59
US financings by year 60
US venture capital by year 61
Top US venture rounds, July 2016–June 2017 62
Capital raised by leading US regions excluding debt, July 2016–June 2017 63
European financings by year 64
European venture capital by year 65
Top European venture rounds, July 2016–June 2017 66
Capital raised by leading European countries excluding debt, July 2016–June 2017 67
Asia-Pacific financings by year 68
Select Asia-Pacific venture rounds, July 2016–June 2017 69
Select Asia-Pacific IPOs, July 2016–June 2017 70
M&As in the US and Europe by year 75
Selected M&As, July 2016 to June 2017 76
Portfolio optimization by select medtechs, 2011–H1 2017 77
Medtech industry’s firepower at an all-time high 78
US and European M&A by type of buyer 79
Milestone payments in US and European medtech M&A by year 80
Milestone share in US and European medtech M&A by year 80
US M&A by year 82
European M&A by year 83
Medtech M&As with Asia-Pacific buyers 84
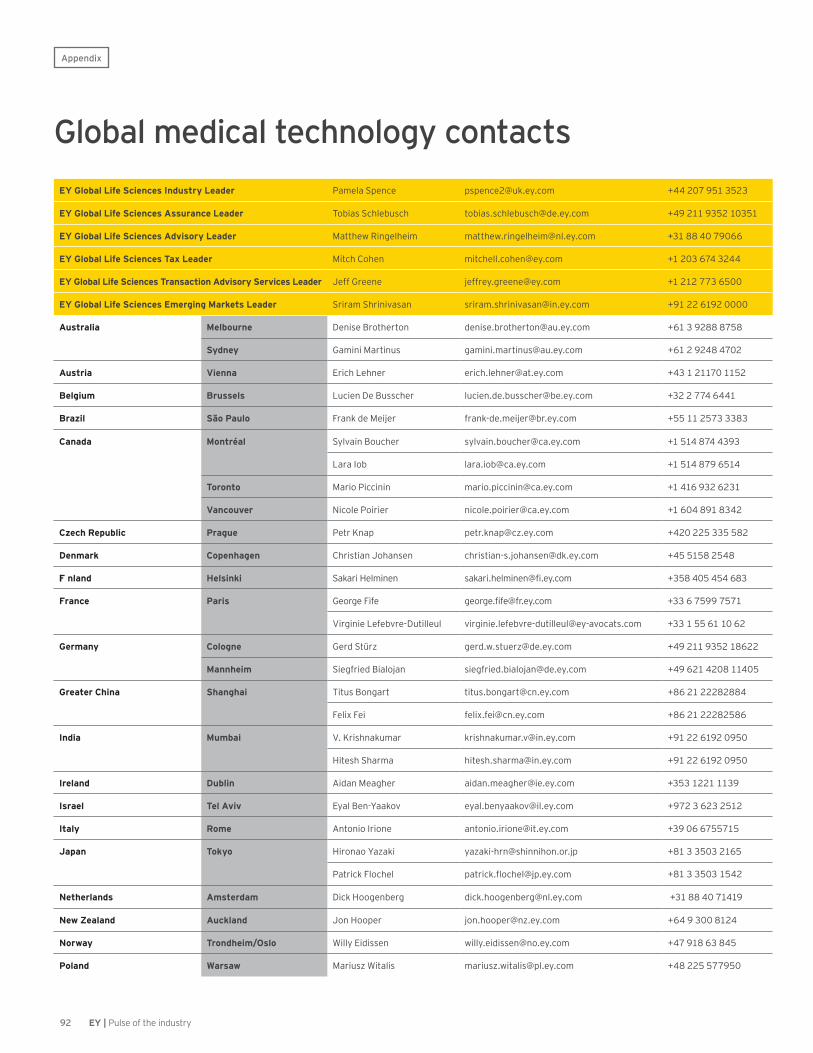
92 EY | Pulse of the industry
EY Global Life Sciences Industry Leader Pa m ela S p enc e p sp enc e2 @ uk . ey. c om + 4 4 2 0 7 9 5 1 3 5 2 3
EY Global Life Sciences Assurance Leader T ob ia s S c hleb usc h tob ia s. sc hleb usc h@ de. ey. c om + 4 9 2 1 1 9 3 5 2 1 0 3 5 1
EY Global Life Sciences Advisory Leader M a tthew R ing elheim m a tthew . ring elheim @ nl. ey. c om + 3 1 8 8 4 0 7 9 0 6 6
EY Global Life Sciences Tax Leader M itc h C ohen m itc hell. c ohen@ ey. c om + 1 2 0 3 6 7 4 3 2 4 4
EY Global Life Sciences Transaction Advisory Services Leader J eff G reene j effrey. g reene@ ey. c om + 1 2 1 2 7 7 3 6 5 0 0
EY Global Life Sciences Emerging Markets Leader S rira m S hriniv a sa n srira m . shriniv a sa n@ in. ey. c om + 9 1 2 2 6 1 9 2 0 0 0 0
A u s t r a l i a M e l b o u r n e D enise B rotherton denise. b rotherton@ a u. ey. c om + 6 1 3 9 2 8 8 8 7 5 8
S y d n e y G a m ini M a rtinus g a m ini. m a rtinus@ a u. ey. c om + 6 1 2 9 2 4 8 4 7 0 2
A u s t r i a V i e n n a E ric h L ehner eric h. lehner@ a t. ey. c om + 4 3 1 2 1 1 7 0 1 1 5 2
B e l g i u m B r u s s e l s L uc ien D e B ussc her luc ien. de. b ussc her@ b e. ey. c om + 3 2 2 7 7 4 6 4 4 1
B r a z i l S ã o P a u l o F ra nk de M eij er fra nk - de. m eij er@ b r. ey. c om + 5 5 1 1 2 5 7 3 3 3 8 3
C a n a d a M o n t r é a l S ylv a in B ouc her sylv a in. b ouc her@ c a . ey. c om + 1 5 1 4 8 7 4 4 3 9 3
L a ra I ob la ra . iob @ c a . ey. c om + 1 5 1 4 8 7 9 6 5 1 4
T o r o n t o M a rio Pic c inin m a rio. p ic c inin@ c a . ey. c om + 1 4 1 6 9 3 2 6 2 3 1
V a n c o u v e r N ic ole Poirier nic ole. p oirier@ c a . ey. c om + 1 6 0 4 8 9 1 8 3 4 2
C z e c h R e p u b l i c P r a g u e Petr K na p p etr. k na p @ c z . ey. c om + 4 2 0 2 2 5 3 3 5 5 8 2
D e n m a r k C o p e n h a g e n C hristia n J oha nsen c hristia n- s. j oha nsen@ dk . ey. c om + 4 5 5 1 5 8 2 5 4 8
Fi n l a n d H e l s i n k i S a k a ri H elm inen sa k a ri. helm inen@ fi. ey. c om + 3 5 8 4 0 5 4 5 4 6 8 3
F r a n c e P a r i s G eorg e F ife g eorg e. fife@ fr. ey. c om + 3 3 6 7 5 9 9 7 5 7 1
V irg inie L efeb v re- D utilleul v irg inie. lefeb v re- dutilleul@ ey- a v oc a ts. c om + 3 3 1 5 5 6 1 1 0 6 2
G e r m a n y C o l o g n e G erd S tü rz g erd. w . stuerz @ de. ey. c om + 4 9 2 1 1 9 3 5 2 1 8 6 2 2
M a n n h e i m S ieg fried B ia loj a n sieg fried. b ia loj a n@ de. ey. c om + 4 9 6 2 1 4 2 0 8 1 1 4 0 5
G r e a t e r C h i n a S h a n g h a i T itus B ong a rt titus. b ong a rt@ c n. ey. c om + 8 6 2 1 2 2 2 8 2 8 8 4
F elix F ei felix . fei@ c n. ey. c om + 8 6 2 1 2 2 2 8 2 5 8 6
I n d i a M u m b a i V . K rishna k um a r k rishna k um a r. v @ in. ey. c om + 9 1 2 2 6 1 9 2 0 9 5 0
H itesh S ha rm a hitesh. sha rm a @ in. ey. c om + 9 1 2 2 6 1 9 2 0 9 5 0
I r e l a n d D u b l i n A ida n M ea g her a ida n. m ea g her@ ie. ey. c om + 3 5 3 1 2 2 1 1 1 3 9
I s r a e l T e l A v i v E ya l B en- Y a a k ov eya l. b enya a k ov @ il. ey. c om + 9 7 2 3 6 2 3 2 5 1 2
I t a l y R o m e A ntonio I rione a ntonio. irione@ it. ey. c om + 3 9 0 6 6 7 5 5 7 1 5
J a p a n T o k y o H irona o Y a z a k i ya z a k i- hrn@ shinnihon. or. j p + 8 1 3 3 5 0 3 2 1 6 5
Pa tric k F loc hel p a tric k . floc hel@ j p . ey. c om + 8 1 3 3 5 0 3 1 5 4 2
N e t h e r l a n d s A m s t e r d a m D ic k H oog enb erg dic k . hoog enb erg @ nl. ey. c om + 3 1 8 8 4 0 7 1 4 1 9
N e w Z e a l a n d A u c k l a n d J on H oop er j on. hoop er@ nz . ey. c om + 6 4 9 3 0 0 8 1 2 4
N o r w a y Trondheim/Oslo W illy E idissen w illy. eidissen@ no. ey. c om + 4 7 9 1 8 6 3 8 4 5
P o l a n d W a r s a w M a riusz W ita lis m a riusz . w ita lis@ p l. ey. c om + 4 8 2 2 5 5 7 7 9 5 0
Global medical technology contacts
Appendix

93EY | Pulse of the industry
R u s s i a / C I S M o s c o w D m itry K ha lilov dm itry. k ha lilov @ ru. ey. c om + 7 4 9 5 7 5 5 9 7 5 7
S i n g a p o r e S i n g a p o r e S a b ine D ettw iler sa b ine. dettw iler@ sg . ey. c om + 6 5 9 0 2 8 5 2 2 8
R ic k F onte ric ha rd. fonte@ sg . ey. c om + 6 5 6 3 0 9 8 1 0 5
H ug o W a lk insha w hug o. w a lk insha w @ sg . ey. c om + 6 5 6 3 0 9 8 0 9 8
S o u t h A f r i c a J o h a n n e s b u r g W a rren K innea r w a rren. k innea r@ z a . ey. c om + 2 7 1 1 7 7 2 3 5 7 6
S w e d e n U p p s a l a S ta ffa n F olin sta ffa n. folin@ se. ey. c om + 4 6 8 5 2 0 5 9 3 5 9
S w i t z e r l a n d B a s e l J ü rg Z ü rc her j uerg . z uerc her@ c h. ey. c om + 4 1 5 8 2 8 6 8 4 0 3
U n i t e d K i n g d o m B r i s t o l J ohn H ow a rth j how a rth@ uk . ey. c om + 4 4 1 1 7 9 1 7 8 6 5 3
C a m b r i d g e J a m es T urner j turner1 @ uk . ey. c om + 4 4 1 2 2 3 3 9 4 5 1 4
R a c hel W ilden rw ilden@ uk . ey. c om + 4 4 1 2 2 3 5 5 7 0 9 6
Edinburgh M a rk H a rv ey m ha rv ey2 @ uk . ey. c om + 4 4 1 3 1 7 7 7 2 2 9 4
J ona tha n L loyd- H irst j lloydhirst@ uk . ey. c om + 4 4 1 3 1 7 7 7 2 4 7 5
L o n d o n / R e a d i n g L eo G rib b en lg rib b en@ uk . ey. c om + 4 4 2 0 7 9 5 1 4 2 1 3
D a v id M a c M urc hy dm a c m urc hy@ uk . ey. c om + 4 4 2 0 7 9 5 1 8 9 4 7
D a niel M a thew s dm a thew s1 @ uk . ey. c om + 4 4 2 0 7 1 9 7 9 3 7 5
I a n O liv er ioliv er@ uk . ey. c om + 4 4 1 1 8 9 2 8 1 1 9 7
U n i t e d S t a t e s B o s t o n K ev in C a sey k ev in. c a sey1 @ ey. c om + 1 6 1 7 5 8 5 1 8 1 7
M ic ha el D onov a n m ic ha el. donov a n1 @ ey. c om + 1 6 1 7 5 8 5 1 9 5 7
C h i c a g o J erry D eV a ult j erry. dev a ult@ ey. c om + 1 3 1 2 8 7 9 6 5 1 8
J a m es W elc h j a m es. w elc h@ ey. c om + 1 3 1 2 8 7 9 3 8 2 7
H o u s t o n C a role F a ig c a role. fa ig @ ey. c om + 1 7 1 3 7 5 0 1 5 3 5
M i n n e a p o l i s W illia m M iller w illia m . m iller@ ey. c om + 1 6 1 2 3 7 1 6 9 8 4
S tep hen S tenb ec k step hen. stenb ec k @ ey. c om + 1 6 1 2 3 7 1 6 9 9 4
N e w Yo r k / N e w J e r s e y J ohn B a b itt j ohn. b a b itt@ ey. c om + 1 2 1 2 7 7 3 0 9 1 2
O rla n B oston orla n. b oston@ ey. c om + 1 2 1 2 7 7 3 2 2 6 9
Orange County K im L etc h k im . letc h@ ey. c om + 1 9 4 9 4 3 7 0 2 4 4
P h i l a d e l p h i a H ow a rd B rook s how a rd. b rook s@ ey. c om + 1 2 1 5 4 4 8 5 1 1 5
D ia na H off dia na . hoff@ ey. c om + 1 2 1 5 4 4 8 5 5 9 0
S tev e S im p son step hen. sim p son@ ey. c om + 1 2 1 5 4 4 8 5 3 0 9
R a l e i g h M a rk B a x ter m a rk . b a x ter@ ey. c om + 1 9 1 9 9 8 1 2 9 6 6
R e d w o o d S h o r e s C hris N olet c hris. nolet@ ey. c om + 1 6 5 0 8 0 2 4 5 0 4
R ic h R a m k o ric ha rd. ra m k o@ ey. c om + 1 6 5 0 8 0 2 4 5 1 8
S a n D i e g o D a n K leeb urg da niel. k leeb urg @ ey. c om + 1 8 5 8 5 3 5 7 2 0 9
Appendix

EY | Assurance | Tax | Transactions | Advisory
About EY EY is a global leader in assurance, tax, transaction and advisory services. The insights and quality services we deliver help build trust and confidence in the capital markets and in economies the world over. We develop outstanding leaders who team to deliver on our promises to all of our stakeholders. In so doing, we play a critical role in building a better working world for our people, for our clients and for our communities.
EY refers to the global organization, and may refer to one or more, of the member firms of Ernst & Young Global Limited, each of which is a separate legal entity. Ernst & Young Global Limited, a UK company limited by guarantee, does not provide services to clients. For more information about our organization, please visit ey.com.
How EY’s Global Life Sciences Sector can help your businessAs populations age and chronic diseases become commonplace, health care will take an ever larger share of GDP. Scientific progress, augmented intelligence and a more empowered patient are driving changes in the delivery of health care to a personalized experience that demands health outcomes as the core metric. This is causing a power shift among traditional stakeholder groups, with new entrants (often not driven by profit) disrupting incumbents. Innovation, productivity and access to patients remain the industry’s biggest challenges. These trends challenge the capital strategy of every link in the life sciences value chain, from R&D and product supply to product launch and patient-centric operating models.
Our Global Life Sciences Sector brings together a worldwide network of 15,000 sector-focused professionals to anticipate trends, identify their implications and help our clients create competitive advantage. We can help you navigate your way forward and achieve sustainable success in the new health-outcomes-driven ecosystem.
©2017 EYGM Limited. All Rights Reserved.
EYG no. 05262-174Gbl CSG no. 1708-2374727
ED None
In line with EY’s commitment to minimize its impact on the environment, this document has been printed on paper with a high recycled content.
This material has been prepared for general informational purposes only and is not intended to be relied upon as accounting, tax or other professional advice. Please refer to your advisors for specific advice.
The views of third parties set out in this publication are not necessarily the views of the global EY organization or its member firms. Moreover, they should be seen in the context of the time they were made.
ey.com/pulse