Embed Size (px)
DESCRIPTION
EXXON
Citation preview
The Outlook for Energy: A View to 2040
William Colton
December 12, 2013
This presentation includes forward-looking statements. Actual future conditions (including economic conditions, energy demand, and energy supply) could differ materially due to changes
in technology, the development of new supply sources, political events, demographic changes, and other factors discussed herein and under the heading "Factors Affecting Future
Results" in the Investors section of our website at: www.exxonmobil.com. The information provided includes ExxonMobil's internal estimates and forecasts based upon internal data and
analyses as well as publically-available information from external sources including the International Energy Agency. This material is not to be used or reproduced without the permission
of Exxon Mobil Corporation. All rights reserved.
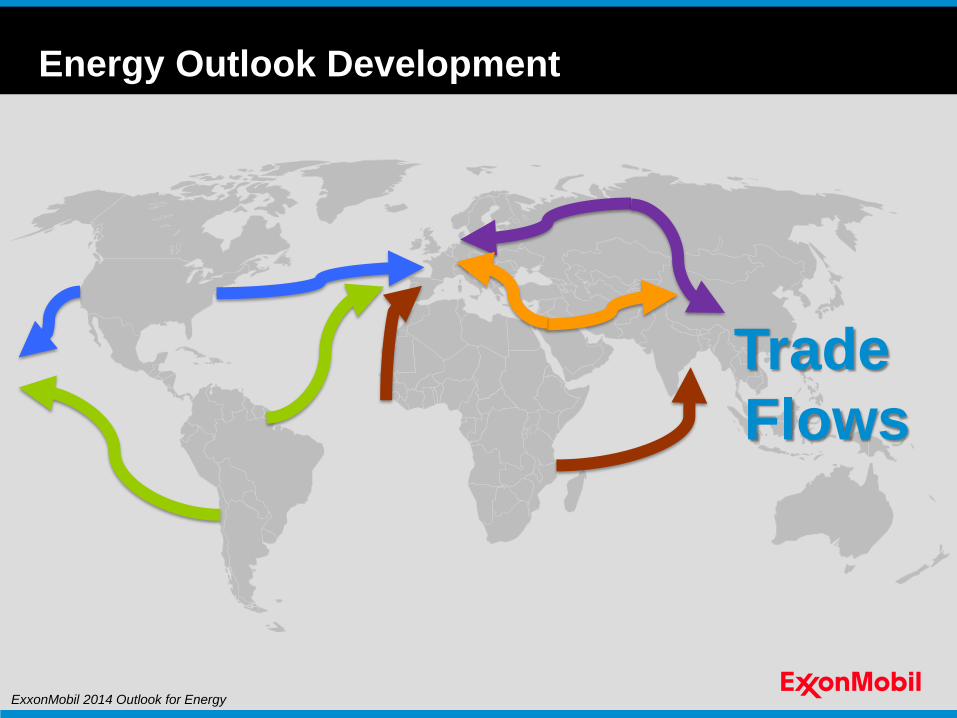
Energy Outlook Development
ExxonMobil 2014 Outlook for Energy
100
countries
Energy Outlook Development
ExxonMobil 2014 Outlook for Energy
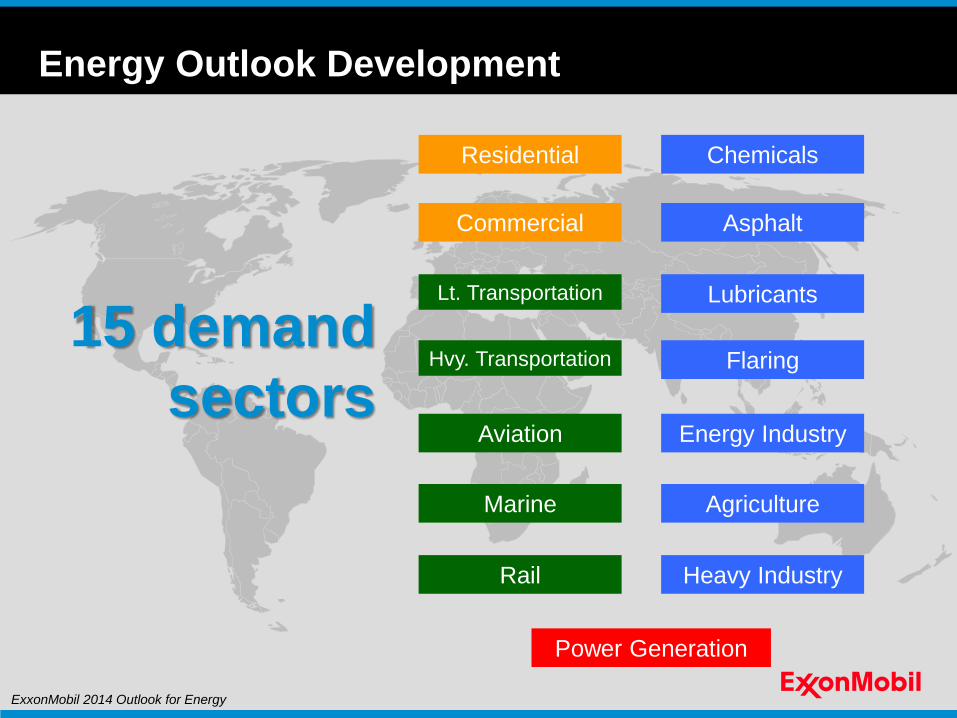
15 demand
sectors
Residential
Commercial
Lt. Transportation
Hvy. Transportation
Aviation
Marine
Rail
Chemicals
Asphalt
Lubricants
Flaring
Energy Industry
Agriculture
Heavy Industry
Power Generation
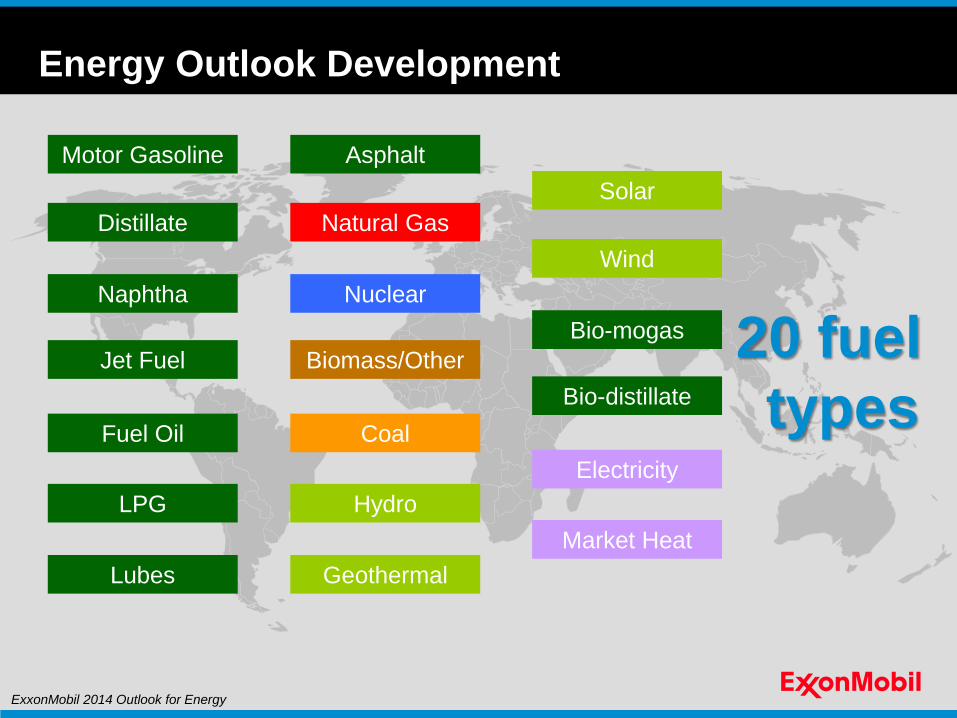
Motor Gasoline
Distillate
Naphtha
Jet Fuel
Fuel Oil
LPG
Lubes
Asphalt
Natural Gas
Nuclear
Biomass/Other
Coal
Hydro
Geothermal
20 fuel
types
Solar
Wind
Bio-mogas
Bio-distillate
Electricity
Market Heat
Energy Outlook Development
ExxonMobil 2014 Outlook for Energy
Energy Outlook Development
ExxonMobil 2014 Outlook for Energy
Technology &
Policy
Energy Outlook Development
ExxonMobil 2014 Outlook for Energy
Trade
Flows
0
20
40
60
80
100
120
2000 2020 2040
0
3
6
9
12
15
18
21
2000 2020 2040
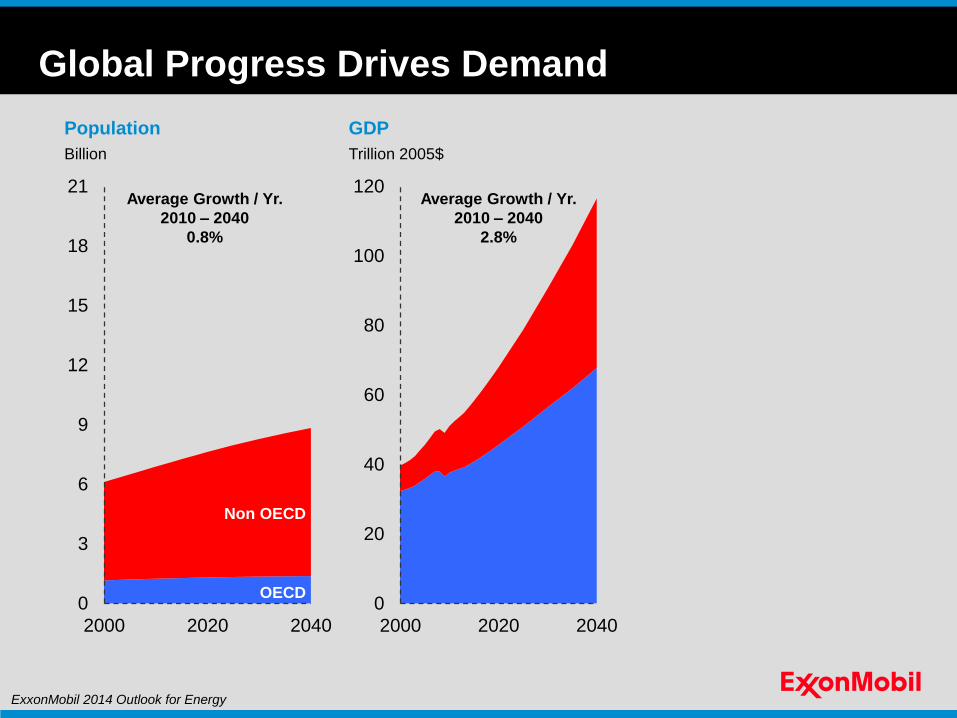
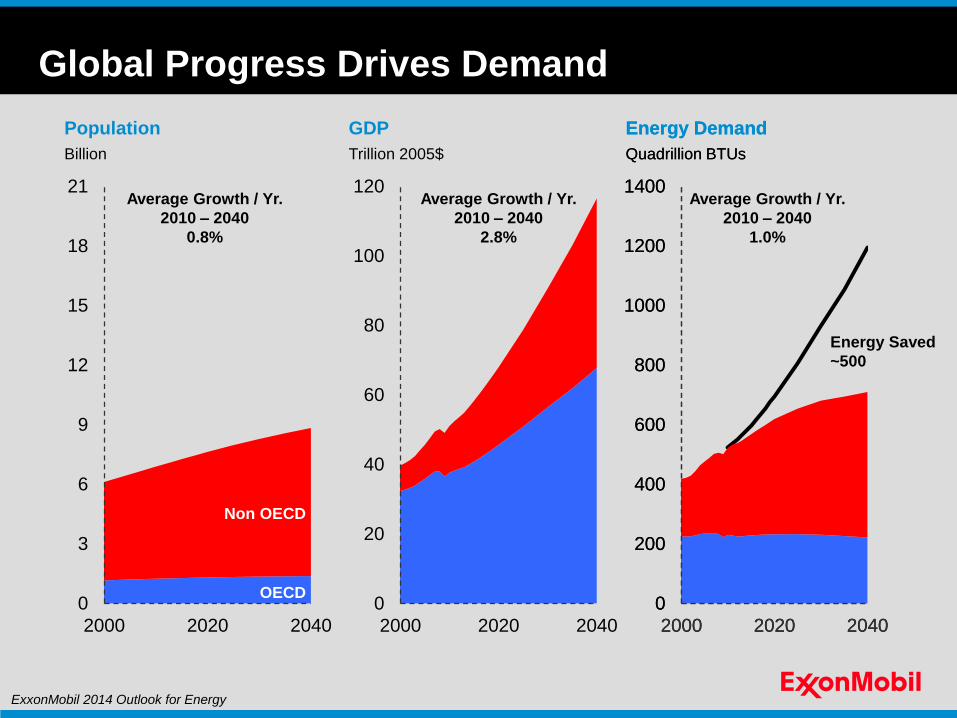
Global Progress Drives Demand
Billion
Population GDP
Trillion 2005$
Average Growth / Yr.
2010 – 2040
0.8%
Average Growth / Yr.
2010 – 2040
2.8%
OECD
Non OECD
ExxonMobil 2014 Outlook for Energy
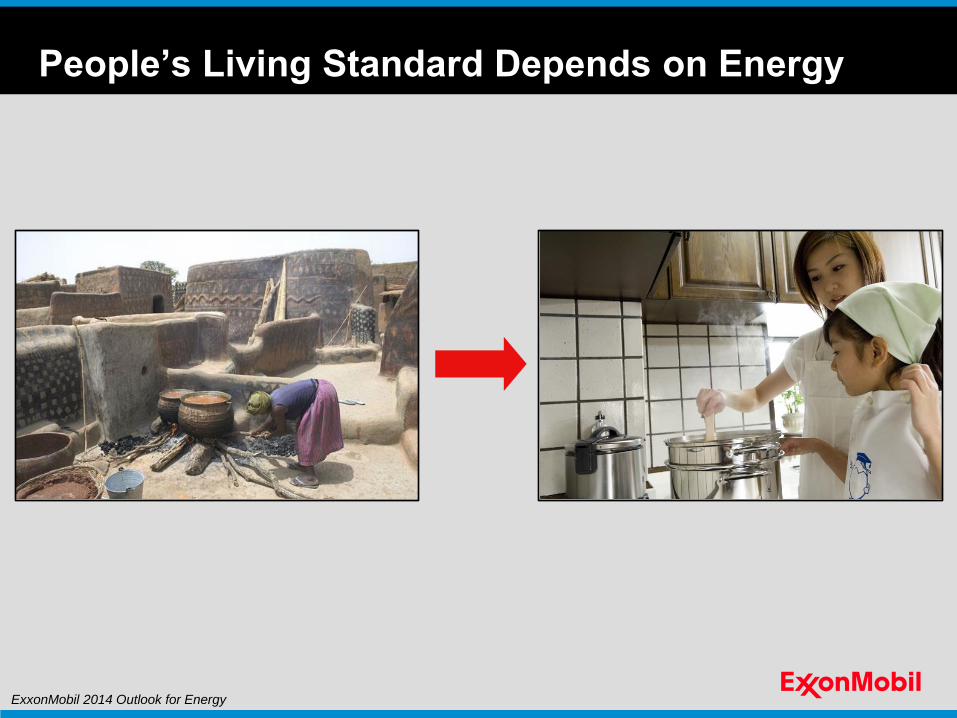
People’s Living Standard Depends on Energy
ExxonMobil 2014 Outlook for Energy
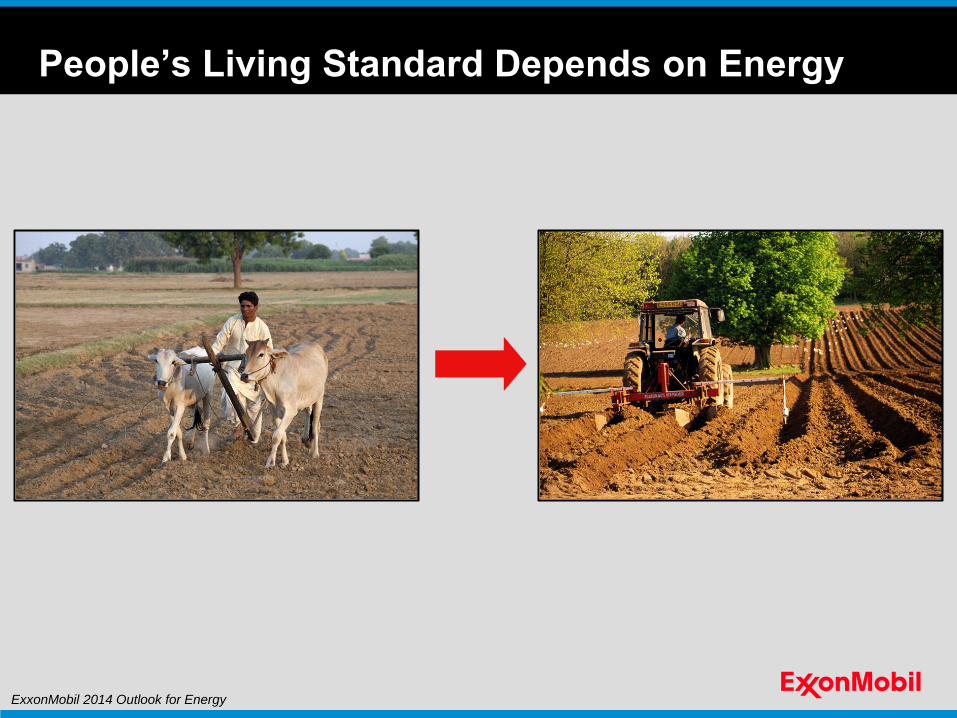
People’s Living Standard Depends on Energy
ExxonMobil 2014 Outlook for Energy
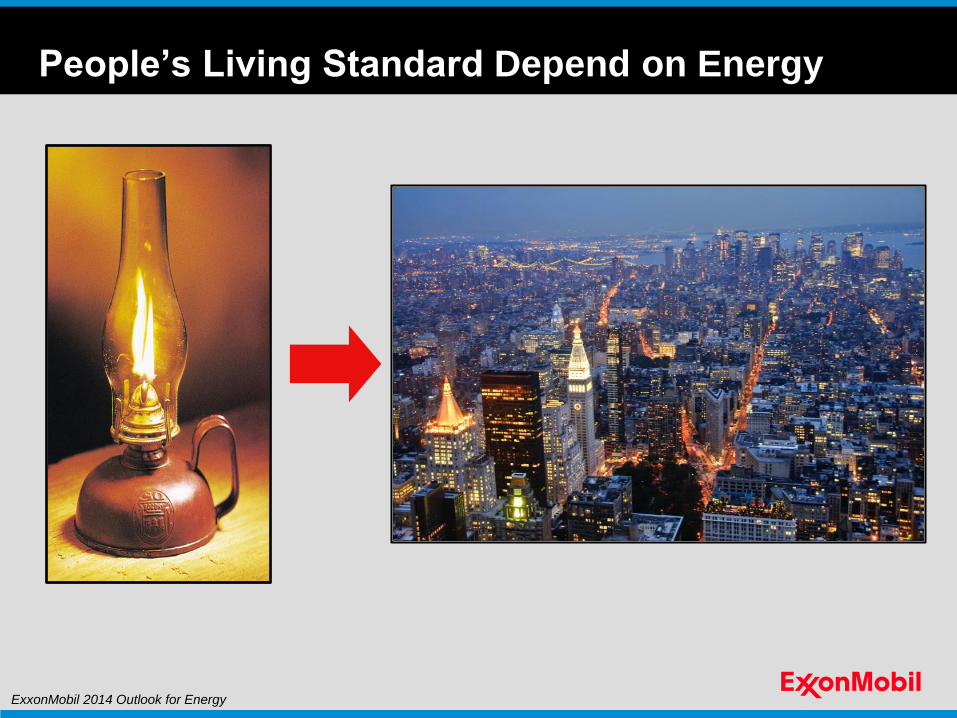
People’s Living Standard Depend on Energy
ExxonMobil 2014 Outlook for Energy
0
200
400
600
800
1000
1200
1400
2000 2020 2040
Energy Saved
~500
Energy Demand
Quadrillion BTUs
Energy Demand
0
200
400
600
800
1000
1200
1400
2000 2020 2040
Quadrillion BTUs
Average Growth / Yr.
2010 – 2040
1.0%
0
20
40
60
80
100
120
2000 2020 2040
0
3
6
9
12
15
18
21
2000 2020 2040
Global Progress Drives Demand
Billion
Population GDP
Trillion 2005$
Average Growth / Yr.
2010 – 2040
0.8%
Average Growth / Yr.
2010 – 2040
2.8%
OECD
Non OECD
ExxonMobil 2014 Outlook for Energy
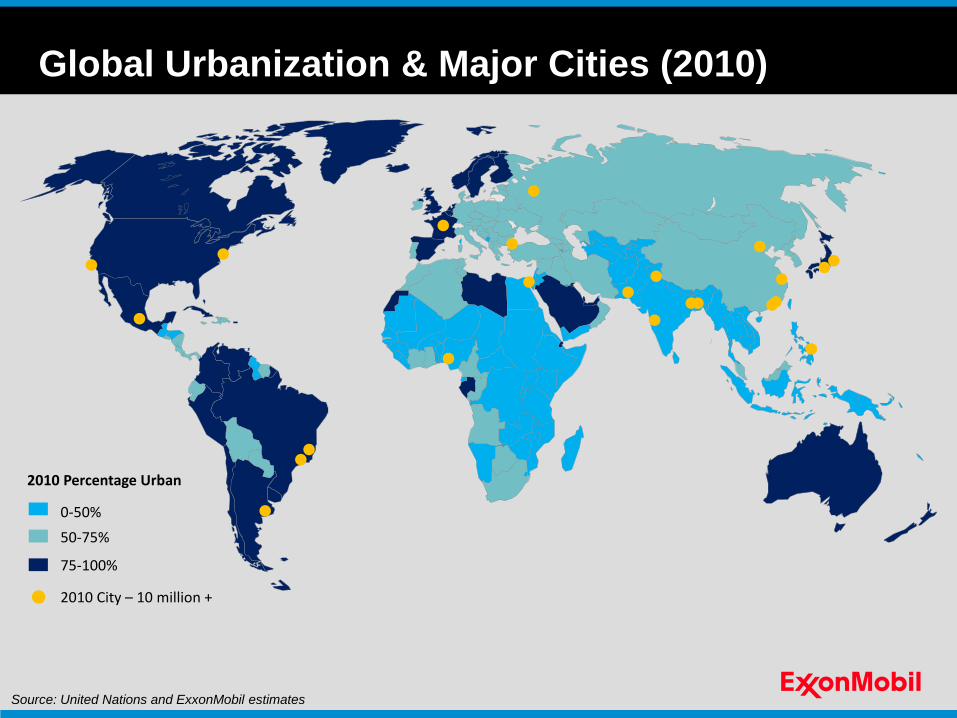
Global Urbanization & Major Cities (2010)
2010 Percentage Urban
0-50%
50-75%
75-100%
2010 City – 10 million +
Source: United Nations and ExxonMobil estimates
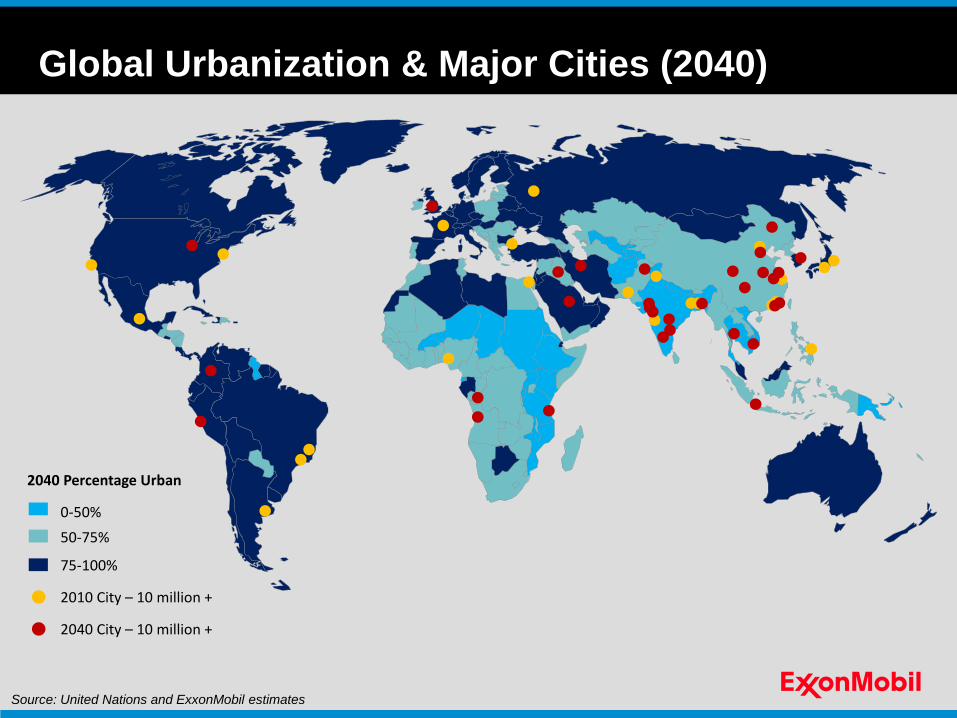
Global Urbanization & Major Cities (2040)
2040 Percentage Urban
0-50%
50-75%
75-100%
2010 City – 10 million +
2040 City – 10 million +
Source: United Nations and ExxonMobil estimates
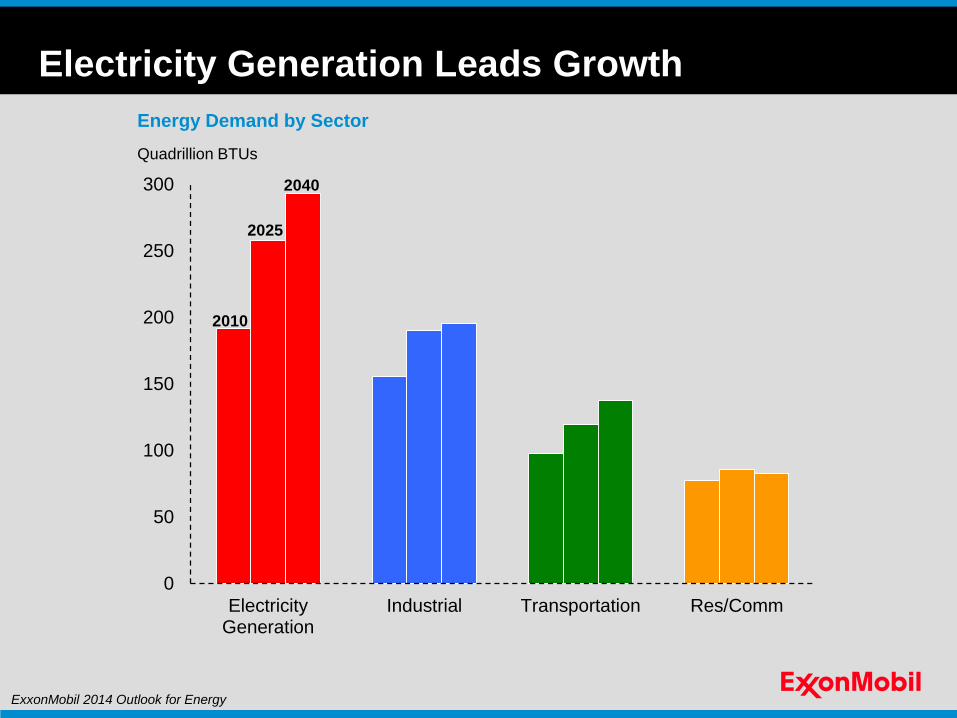
Energy Demand by Sector
0
50
100
150
200
250
300
ElectricityGeneration
Industrial Transportation Res/Comm
Quadrillion BTUs
2010
2025
2040
Electricity Generation Leads Growth
ExxonMobil 2014 Outlook for Energy

Industrial
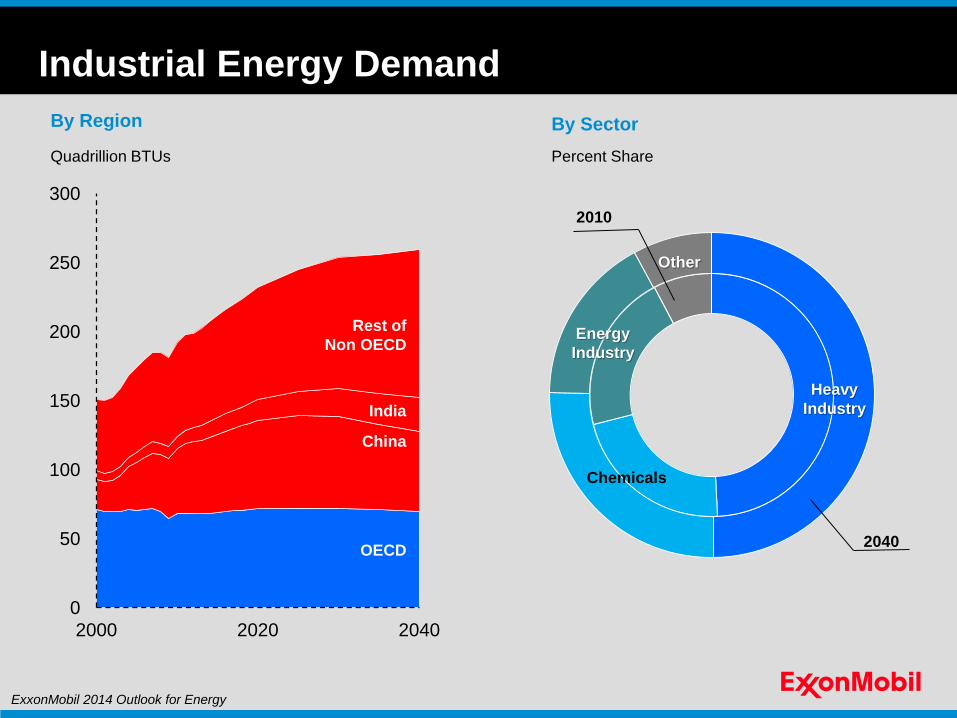
By Sector
Energy
Industry
Chemicals
Heavy
Industry
Other
Percent Share
Industrial Energy Demand
By Region
Quadrillion BTUs
0
50
100
150
200
250
300
2000 2020 2040
OECD
China
India
Rest of
Non OECD
2010
2040
ExxonMobil 2014 Outlook for Energy
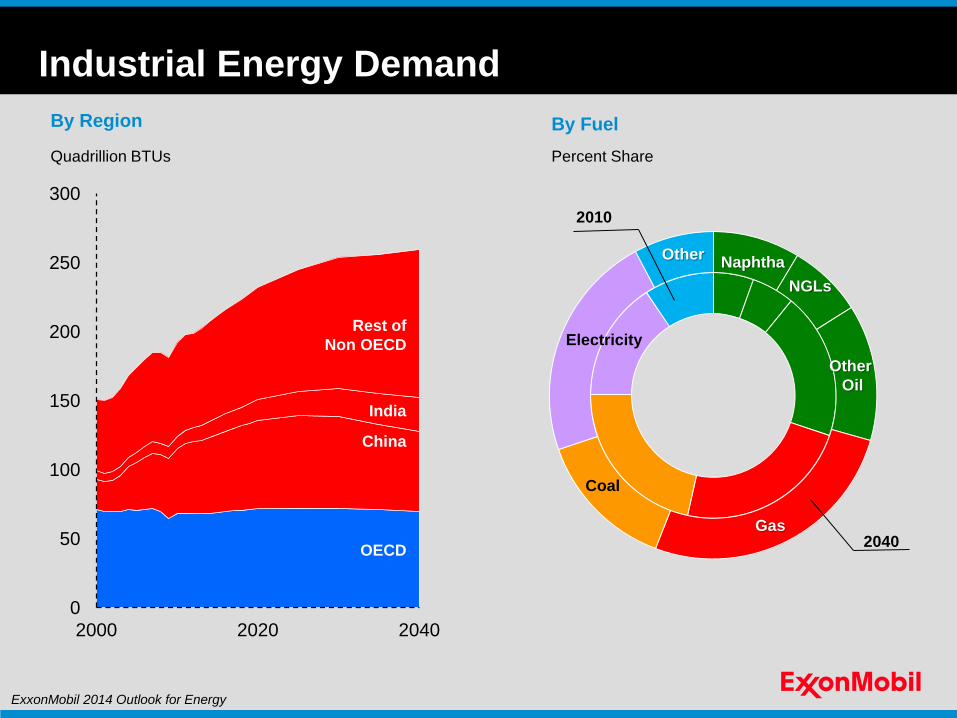
By Fuel
Percent Share
Other
Oil
NGLs
Naphtha Other
Electricity
Coal
Gas
Industrial Energy Demand
By Region
Quadrillion BTUs
0
50
100
150
200
250
300
2000 2020 2040
OECD
China
India
Rest of
Non OECD
2010
2040
ExxonMobil 2014 Outlook for Energy

Transportation
0
15
30
45
60
75
2010 2020 2030 2040
0
15
30
45
60
75
2010 2020 2030 2040
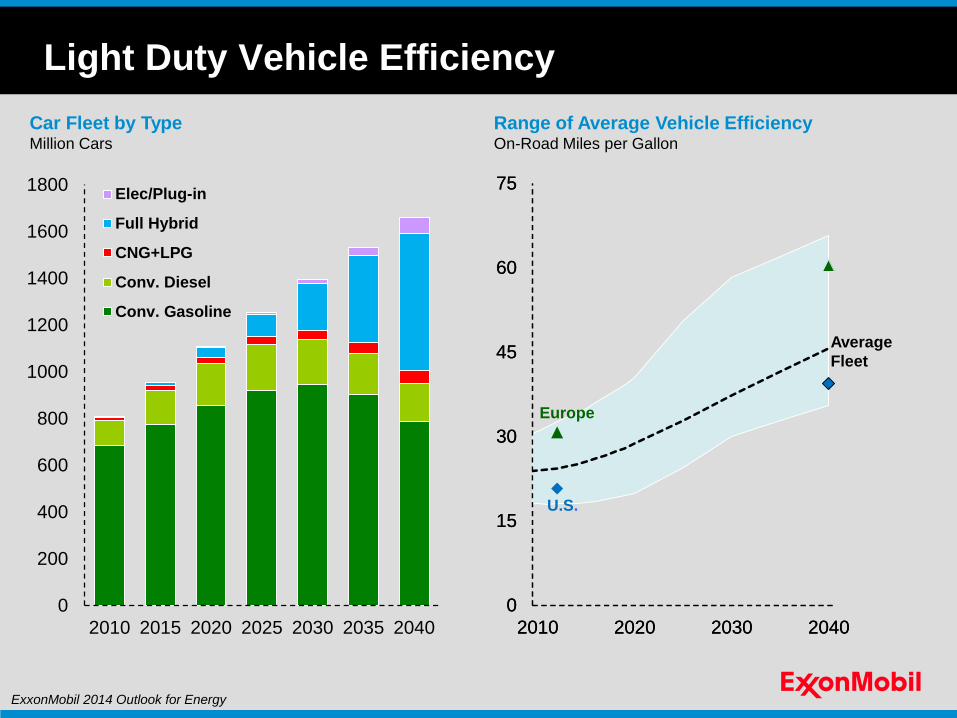
Range of Average Vehicle Efficiency On-Road Miles per Gallon
U.S.
Average
Fleet
Europe
Light Duty Vehicle Efficiency
0
200
400
600
800
1000
1200
1400
1600
1800
2010 2015 2020 2025 2030 2035 2040
Elec/Plug-in
Full Hybrid
CNG+LPG
Conv. Diesel
Conv. Gasoline
Car Fleet by Type Million Cars
ExxonMobil 2014 Outlook for Energy
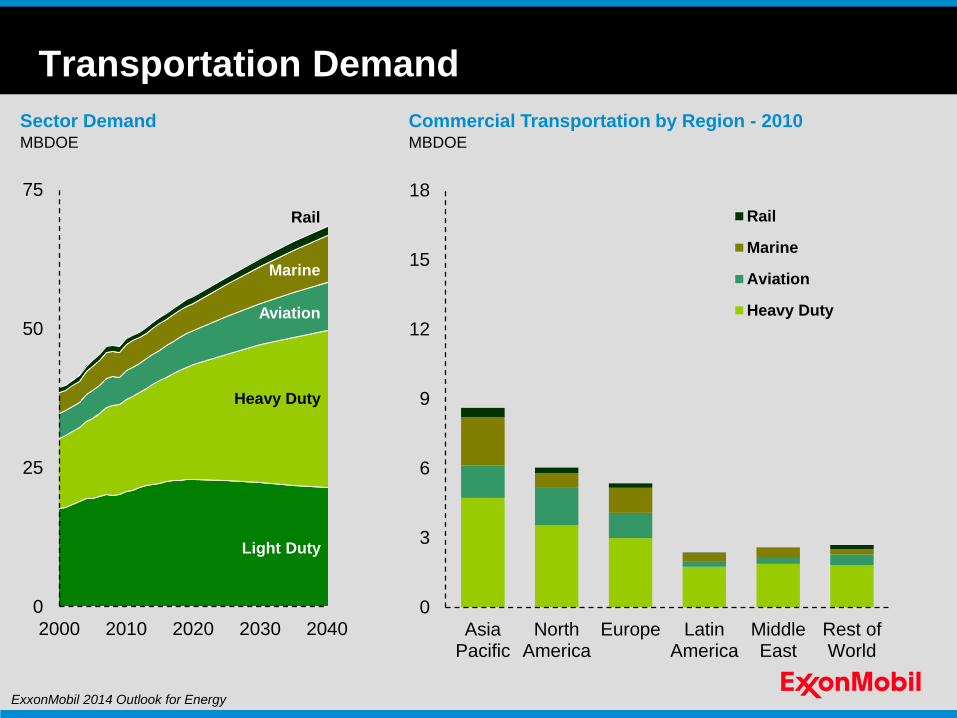
0
3
6
9
12
15
18
AsiaPacific
NorthAmerica
Europe LatinAmerica
MiddleEast
Rest ofWorld
Rail
Marine
Aviation
Heavy Duty
Commercial Transportation by Region - 2010
0
25
50
75
2000 2010 2020 2030 2040
Sector Demand MBDOE
Light Duty
Marine
Rail
Heavy Duty
Aviation
Transportation Demand
MBDOE
ExxonMobil 2014 Outlook for Energy
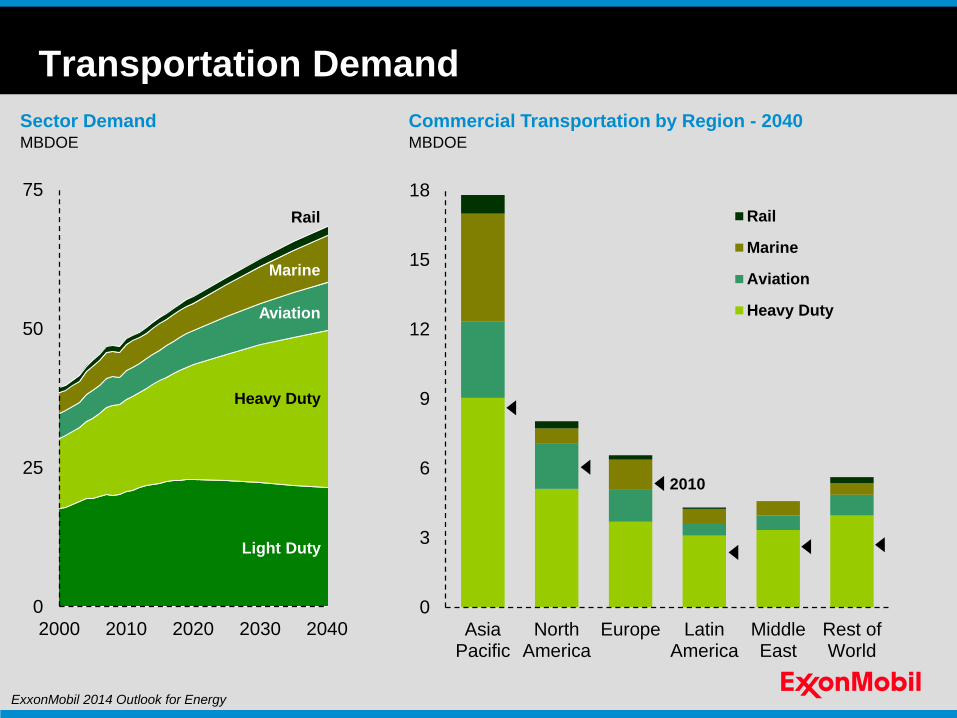
0
3
6
9
12
15
18
AsiaPacific
NorthAmerica
Europe LatinAmerica
MiddleEast
Rest ofWorld
Rail
Marine
Aviation
Heavy Duty
Commercial Transportation by Region - 2040
0
25
50
75
2000 2010 2020 2030 2040
Sector Demand MBDOE
Light Duty
Marine
Rail
Heavy Duty
Aviation
Transportation Demand
MBDOE
2010
ExxonMobil 2014 Outlook for Energy

Electricity generation
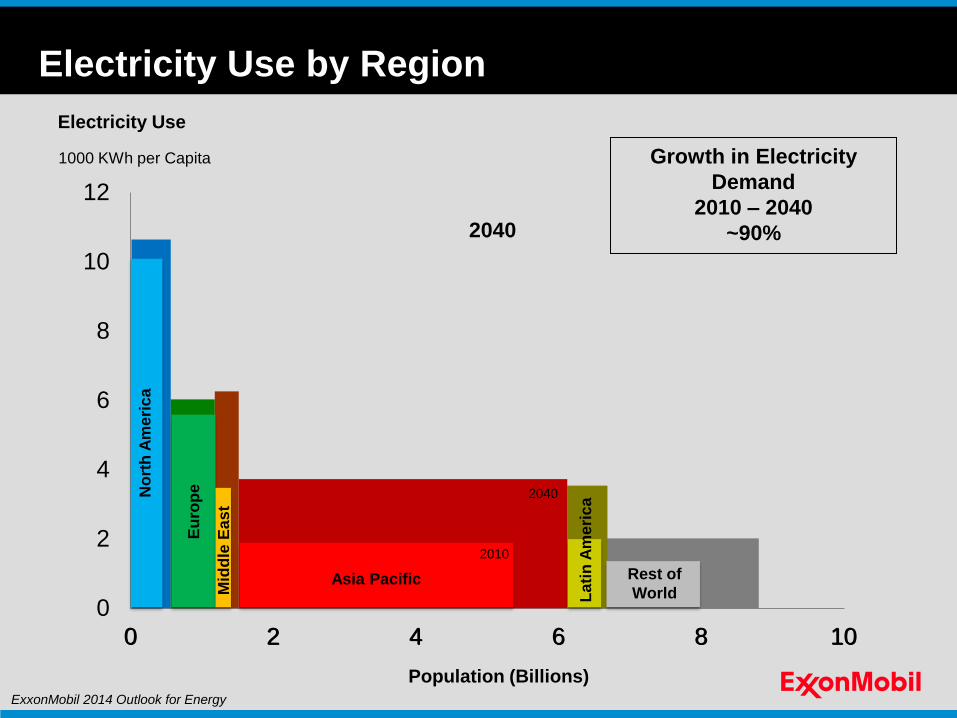
0
2
4
6
8
10
12
0 2 4 6 8 10
2040
0 2 4 6 8 10
No
rth
Am
eri
ca
Eu
rop
e
1000 KWh per Capita
Population (Billions)
Electricity Use
Electricity Use by Region
Growth in Electricity
Demand
2010 – 2040
~90%
No
rth
Am
eri
ca
Eu
rop
e
Mid
dle
Ea
st
Rest of
World Lati
n A
me
ric
a
Asia Pacific
ExxonMobil 2014 Outlook for Energy
2010
2040
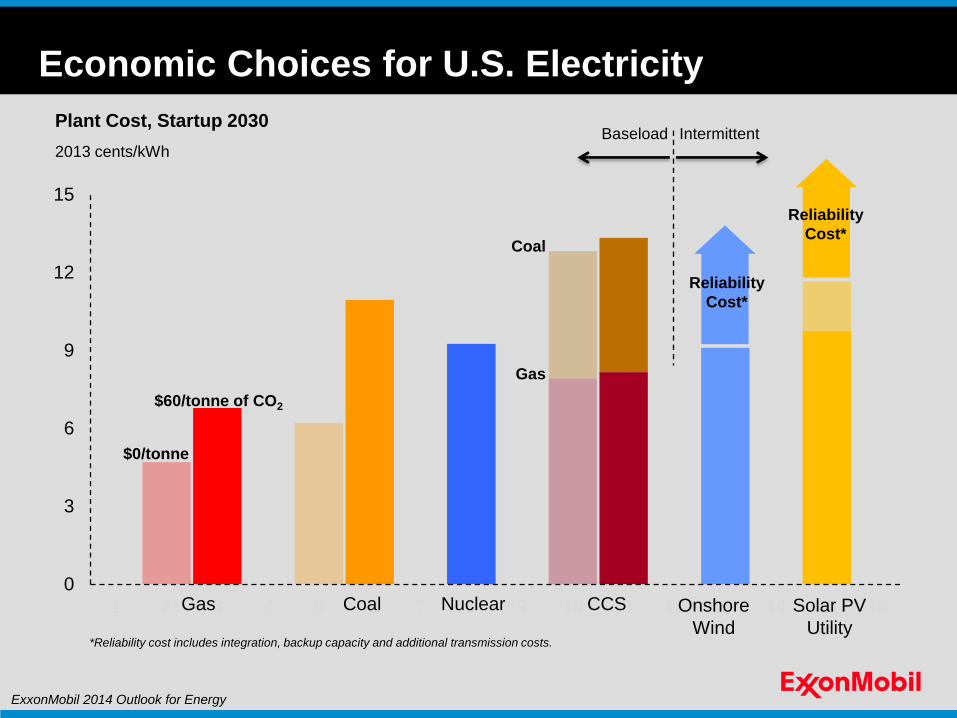
0
3
6
9
12
15
1 2 3 4 5 6 7 8 9 10 11 12 13 14 15 16CCS Onshore
Wind
Gas
Coal
Gas
Plant Cost, Startup 2030
2013 cents/kWh
Coal Nuclear
$60/tonne of CO2
$0/tonne
Solar PV
Utility *Reliability cost includes integration, backup capacity and additional transmission costs.
Economic Choices for U.S. Electricity
Baseload Intermittent
Reliability
Cost*
Reliability
Cost*
ExxonMobil 2014 Outlook for Energy
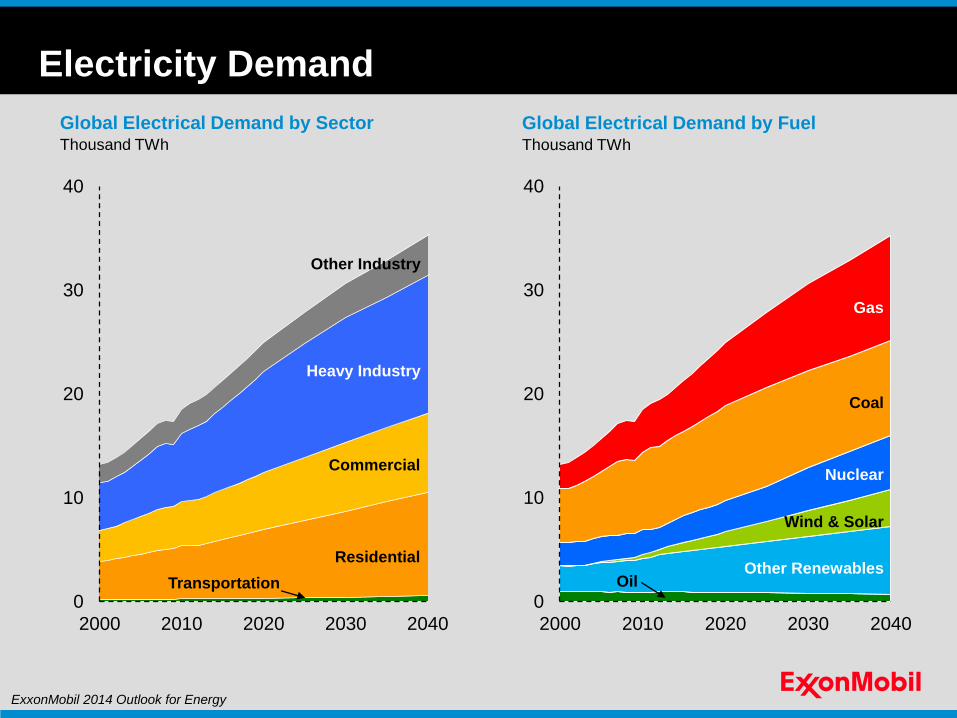
Electricity Demand
0
10
20
30
40
2000 2010 2020 2030 2040
Global Electrical Demand by Sector Thousand TWh
Residential
Commercial
Heavy Industry
Other Industry
Transportation
0
10
20
30
40
2000 2010 2020 2030 2040
Global Electrical Demand by Fuel Thousand TWh
Wind & Solar
Oil
Coal
Nuclear
Other Renewables
Gas
ExxonMobil 2014 Outlook for Energy
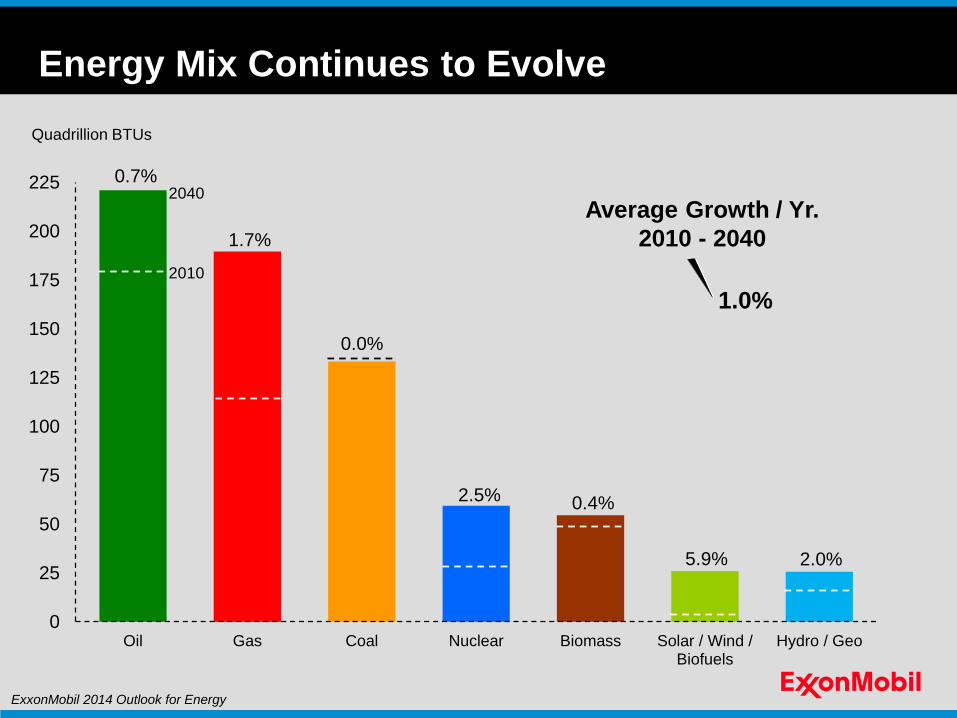
Energy Mix Continues to Evolve
Quadrillion BTUs
0
25
50
75
100
125
150
175
200
225
Oil Gas Coal Nuclear Biomass Solar / Wind /Biofuels
Hydro / Geo
Average Growth / Yr.
2010 - 2040
1.0%
2040
2010
0.7%
1.7%
0.0%
2.5% 0.4%
5.9% 2.0%
ExxonMobil 2014 Outlook for Energy
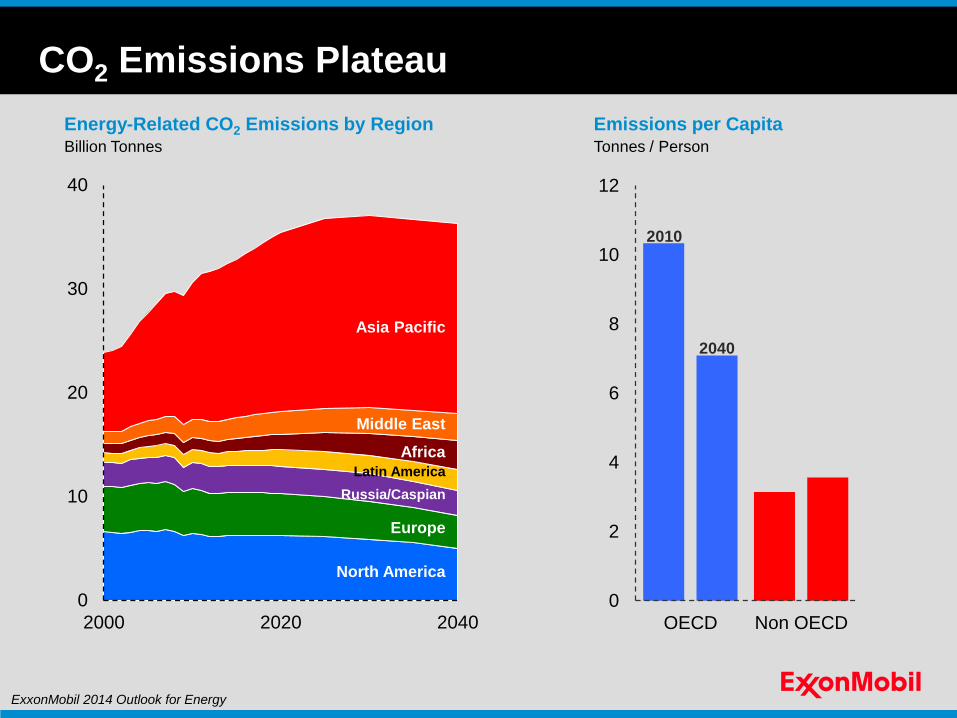
Energy-Related CO2 Emissions by Region
0
10
20
30
40
2000 2020 2040
Billion Tonnes
Latin America
Middle East
Africa
Asia Pacific
North America
Russia/Caspian
Europe
0
2
4
6
8
10
12
OECD Non OECD
2010
2040
Emissions per Capita Tonnes / Person
CO2 Emissions Plateau
ExxonMobil 2014 Outlook for Energy

Supply
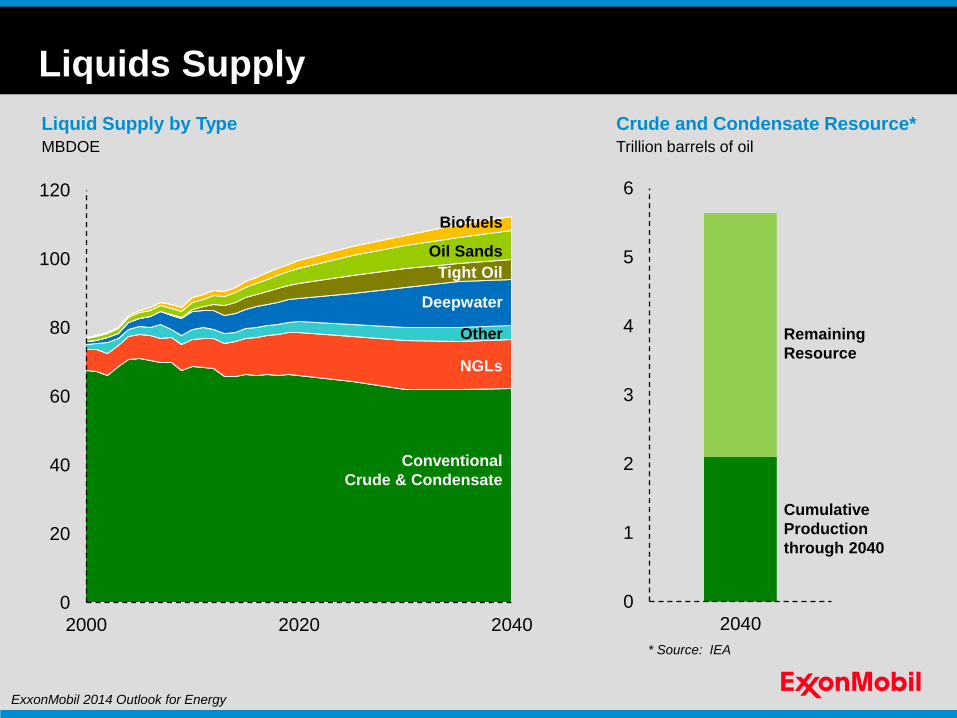
Liquids Supply
Liquid Supply by Type
MBDOE
0
20
40
60
80
100
120
2000 2020 2040
Other
Biofuels
Conventional
Crude & Condensate
Tight Oil
Oil Sands
NGLs
Deepwater
Crude and Condensate Resource*
0
1
2
3
4
5
6
2040
Cumulative
Production
through 2040
Remaining
Resource
Trillion barrels of oil
ExxonMobil 2014 Outlook for Energy
* Source: IEA
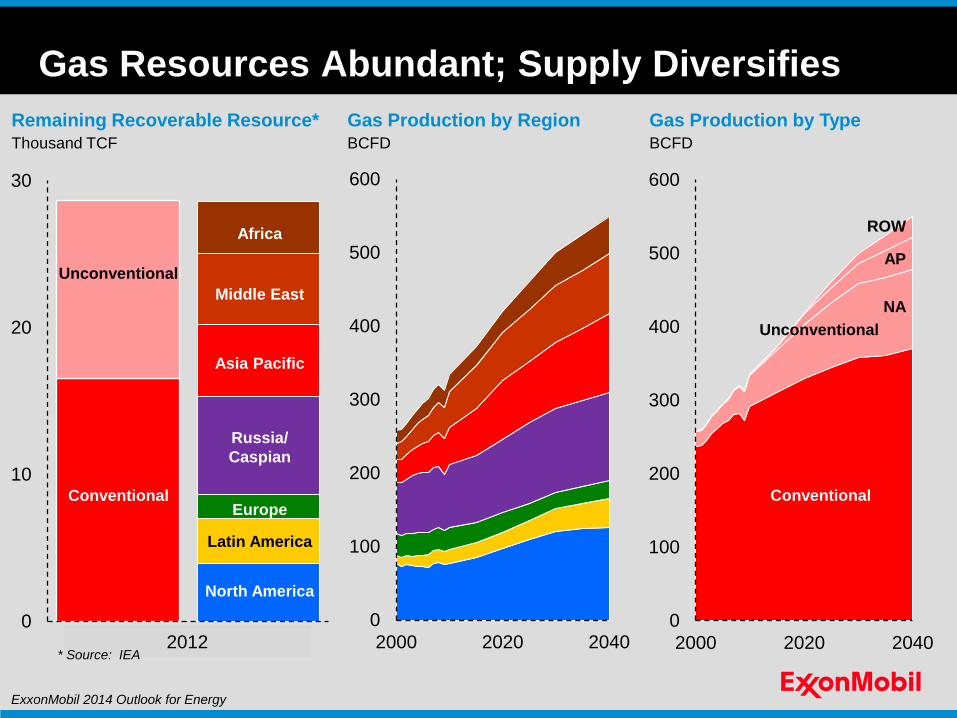
Gas Resources Abundant; Supply Diversifies
Thousand TCF
0
100
200
300
400
500
600
2000 2020 2040
Gas Production by Region
0
10
20
30
2012 2011
Remaining Recoverable Resource*
BCFD
Conventional
Unconventional
BCFD
0
100
200
300
400
500
600
2000 2020 2040
Unconventional
Conventional
ROW
Gas Production by Type
2012
AP
NA
Africa
Middle East
Asia Pacific
Russia/
Caspian
Europe
North America
Latin America
ExxonMobil 2014 Outlook for Energy
* Source: IEA
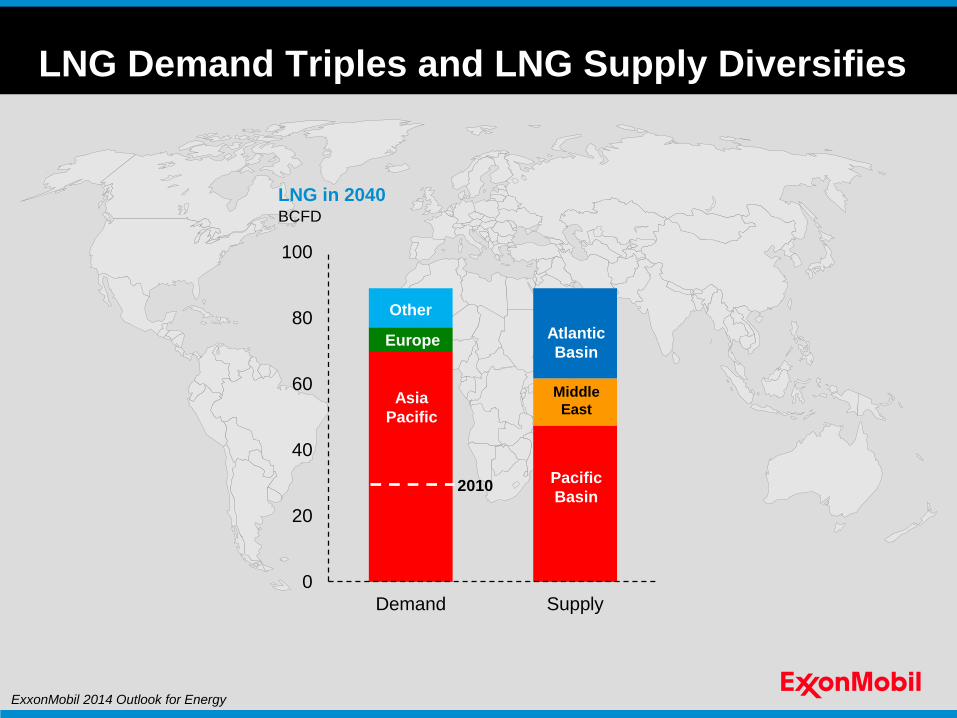
0
20
40
60
80
100
SupplyDemand
LNG Demand Triples and LNG Supply Diversifies
BCFD
LNG in 2040
Asia
Pacific
Other
2010 Pacific
Basin
Europe
Middle
East
Atlantic
Basin
ExxonMobil 2014 Outlook for Energy
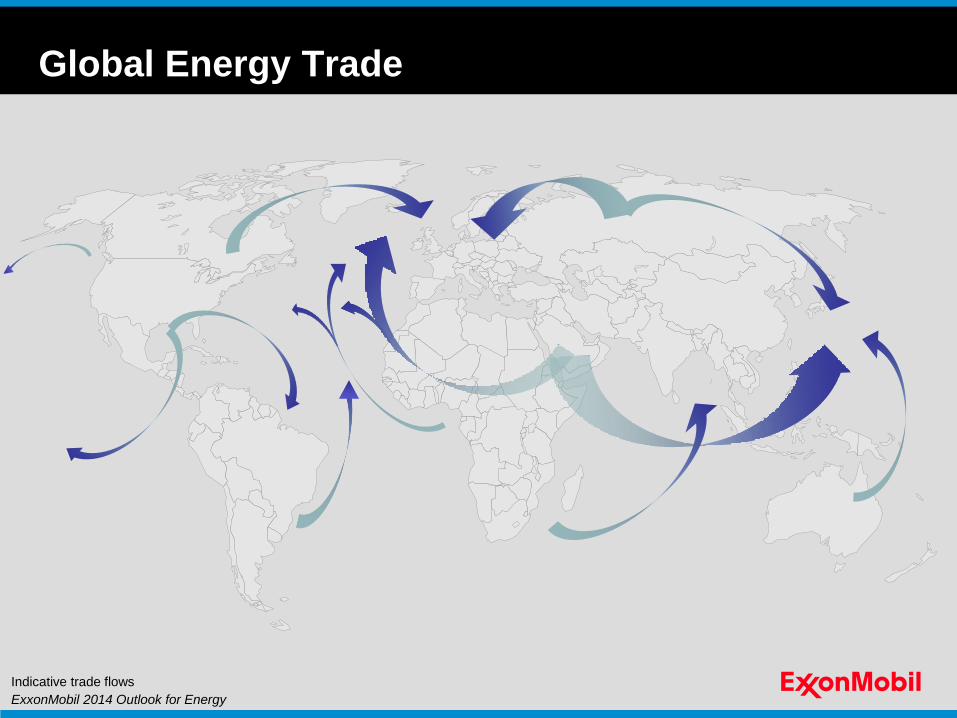
Global Energy Trade
ExxonMobil 2014 Outlook for Energy
Indicative trade flows
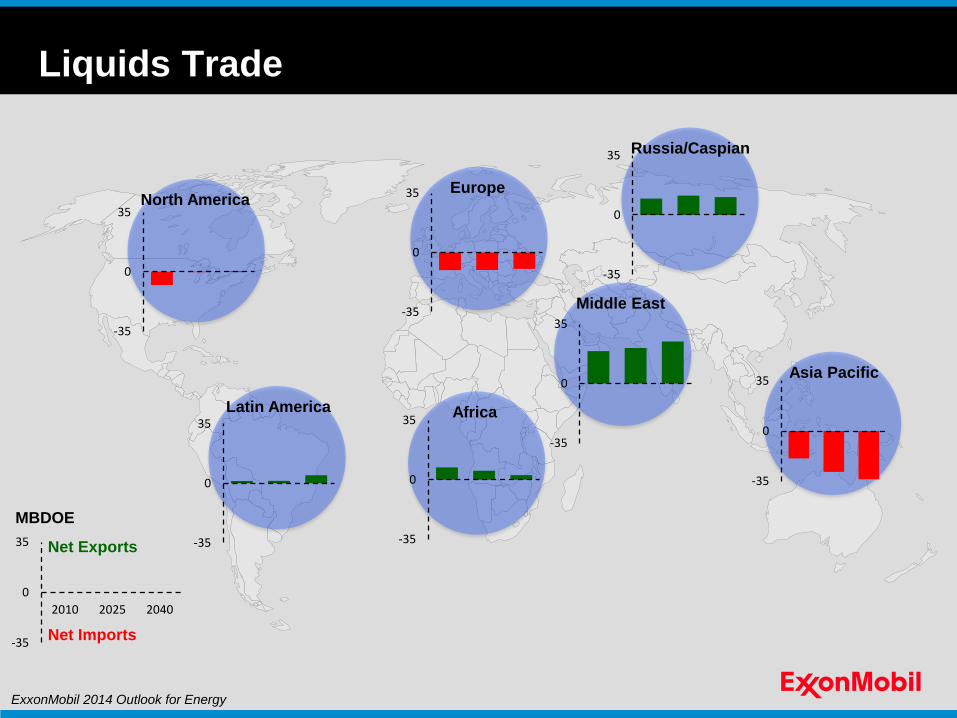
Liquids Trade
-35
0
35North America
MBDOE
-35
0
35
2010 2025 2040
Net Exports
Net Imports
-35
0
35Latin America
-35
0
35Africa
-35
0
35 Europe
-35
0
35
-35
0
35
Middle East
-35
0
35Asia Pacific
Russia/Caspian
ExxonMobil 2014 Outlook for Energy
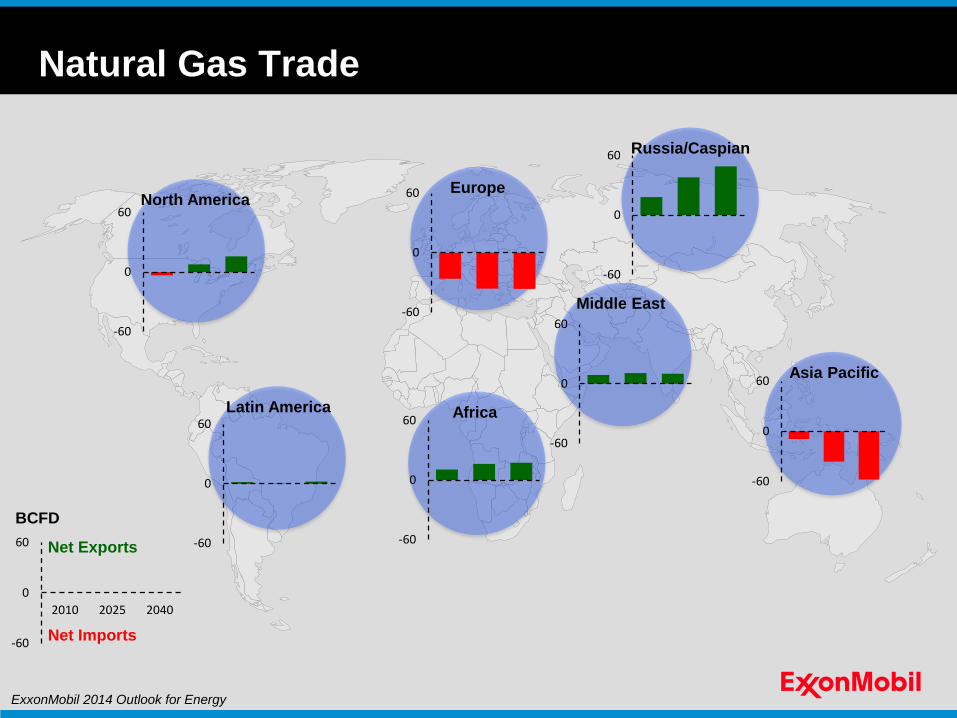
Natural Gas Trade
-60
0
60North America
BCFD
-60
0
60
2010 2025 2040
Net Exports
Net Imports
-60
0
60Latin America
-60
0
60Africa
-60
0
60 Europe
-60
0
60
-60
0
60
Middle East
-60
0
60Asia Pacific
Russia/Caspian
ExxonMobil 2014 Outlook for Energy
Conclusions
ExxonMobil 2014 Outlook for Energy