Embed Size (px)
Citation preview
Exxaro year end results dec 2016EXXARO RESOURCES LIMITED
(Incorporated in the Republic of South Africa)Registration number: 2000/011076/06JSE share code: EXXISIN: ZAE000084992ADR code: EXXAY(“Exxaro” or “the company” or “the group”)
REVIEWED CONDENSED GROUP ANNUAL FINANCIAL STATEMENTS AND UNREVIEWED PRODUCTION AND SALES VOLUMES INFORMATIONfor the year ended 31 December 2016
SALIENT FEATURES
Owner‐controlled operations ‐ Coal revenue R20,7 billion, up 14% ‐ Coal NOP* of R5,2 billion, up 101% SIOC ‐ R2,4 billion post‐tax equity‐accounted income ‐ No dividends declared for FY16 Tronox ‐ R384 million post‐tax equity‐accounted losses ‐ Dividend of R298 million Group ‐ Net debt: equity of 3,8% ‐ Final dividend of 410 cents per share, up 382% ‐ HEPS** of R13,02 per share, up 185% ‐ AEPS*** of R16,00 per share, up from 83 cents per share * Net operating profit.** Headline earnings per share.*** Attributable earnings per share.
Please refer to the end for an explanation of the acronyms used throughout this document.
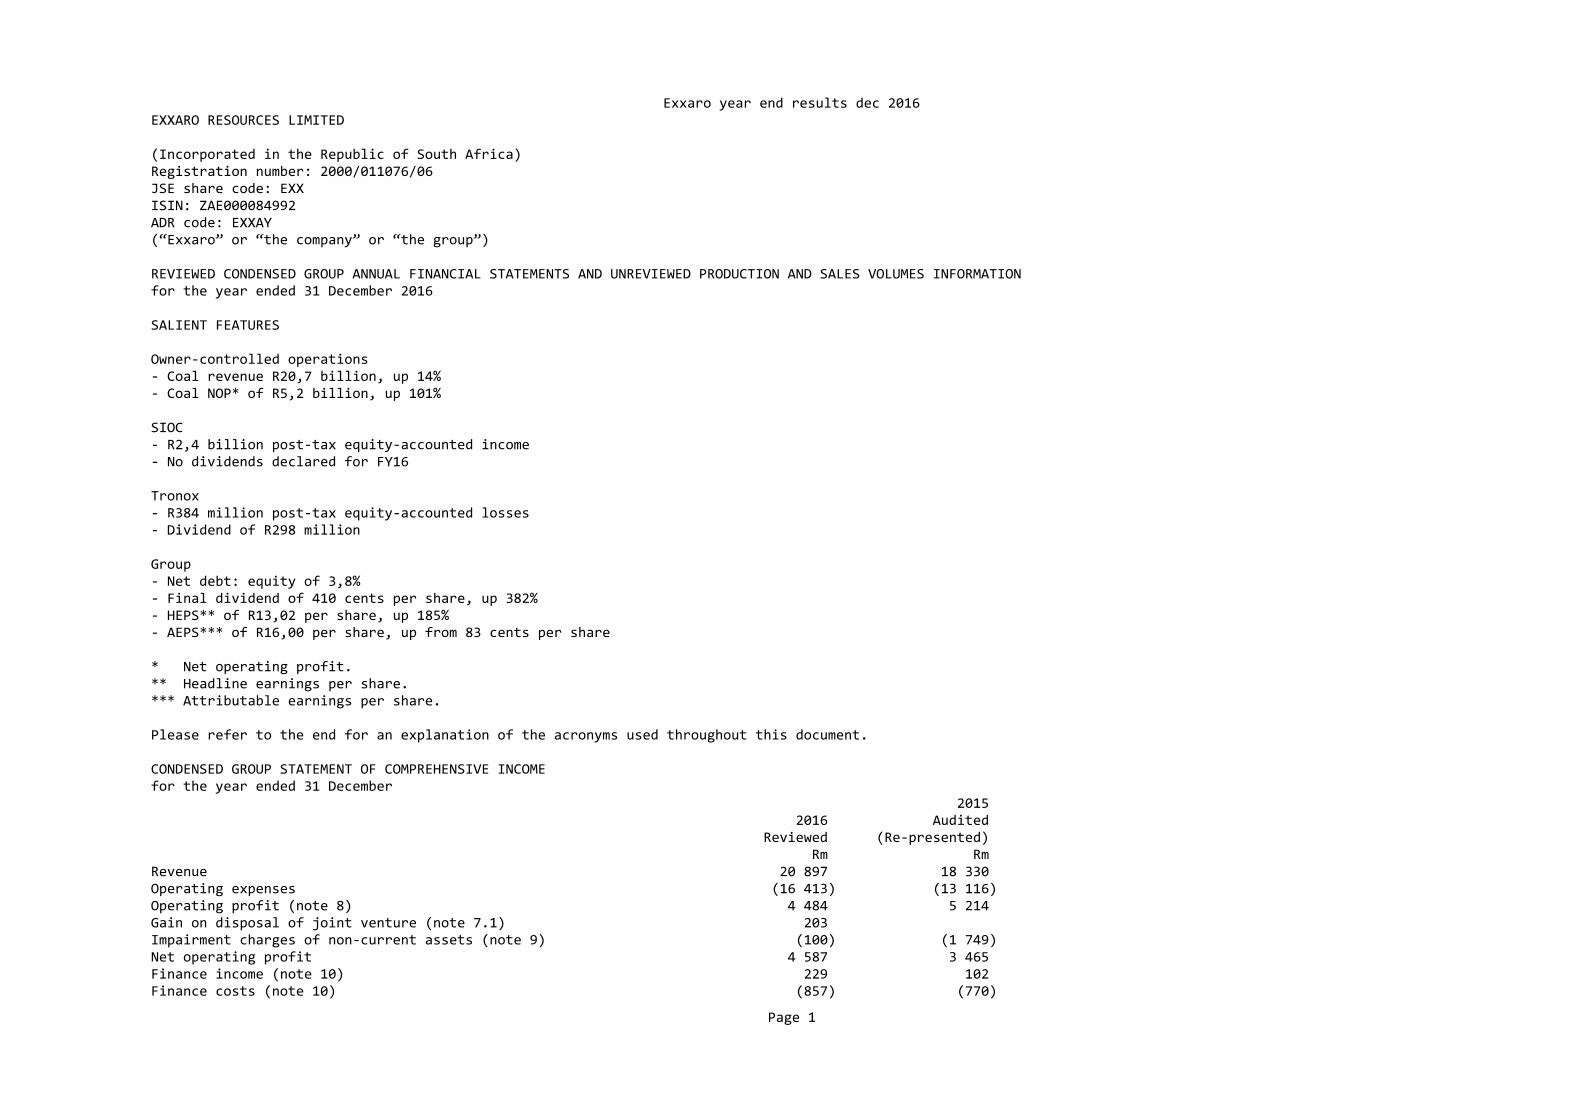
CONDENSED GROUP STATEMENT OF COMPREHENSIVE INCOME for the year ended 31 December 2015 2016 Audited Reviewed (Re‐presented) Rm Rm Revenue 20 897 18 330 Operating expenses (16 413) (13 116) Operating profit (note 8) 4 484 5 214 Gain on disposal of joint venture (note 7.1) 203 Impairment charges of non‐current assets (note 9) (100) (1 749) Net operating profit 4 587 3 465 Finance income (note 10) 229 102 Finance costs (note 10) (857) (770)
Page 1
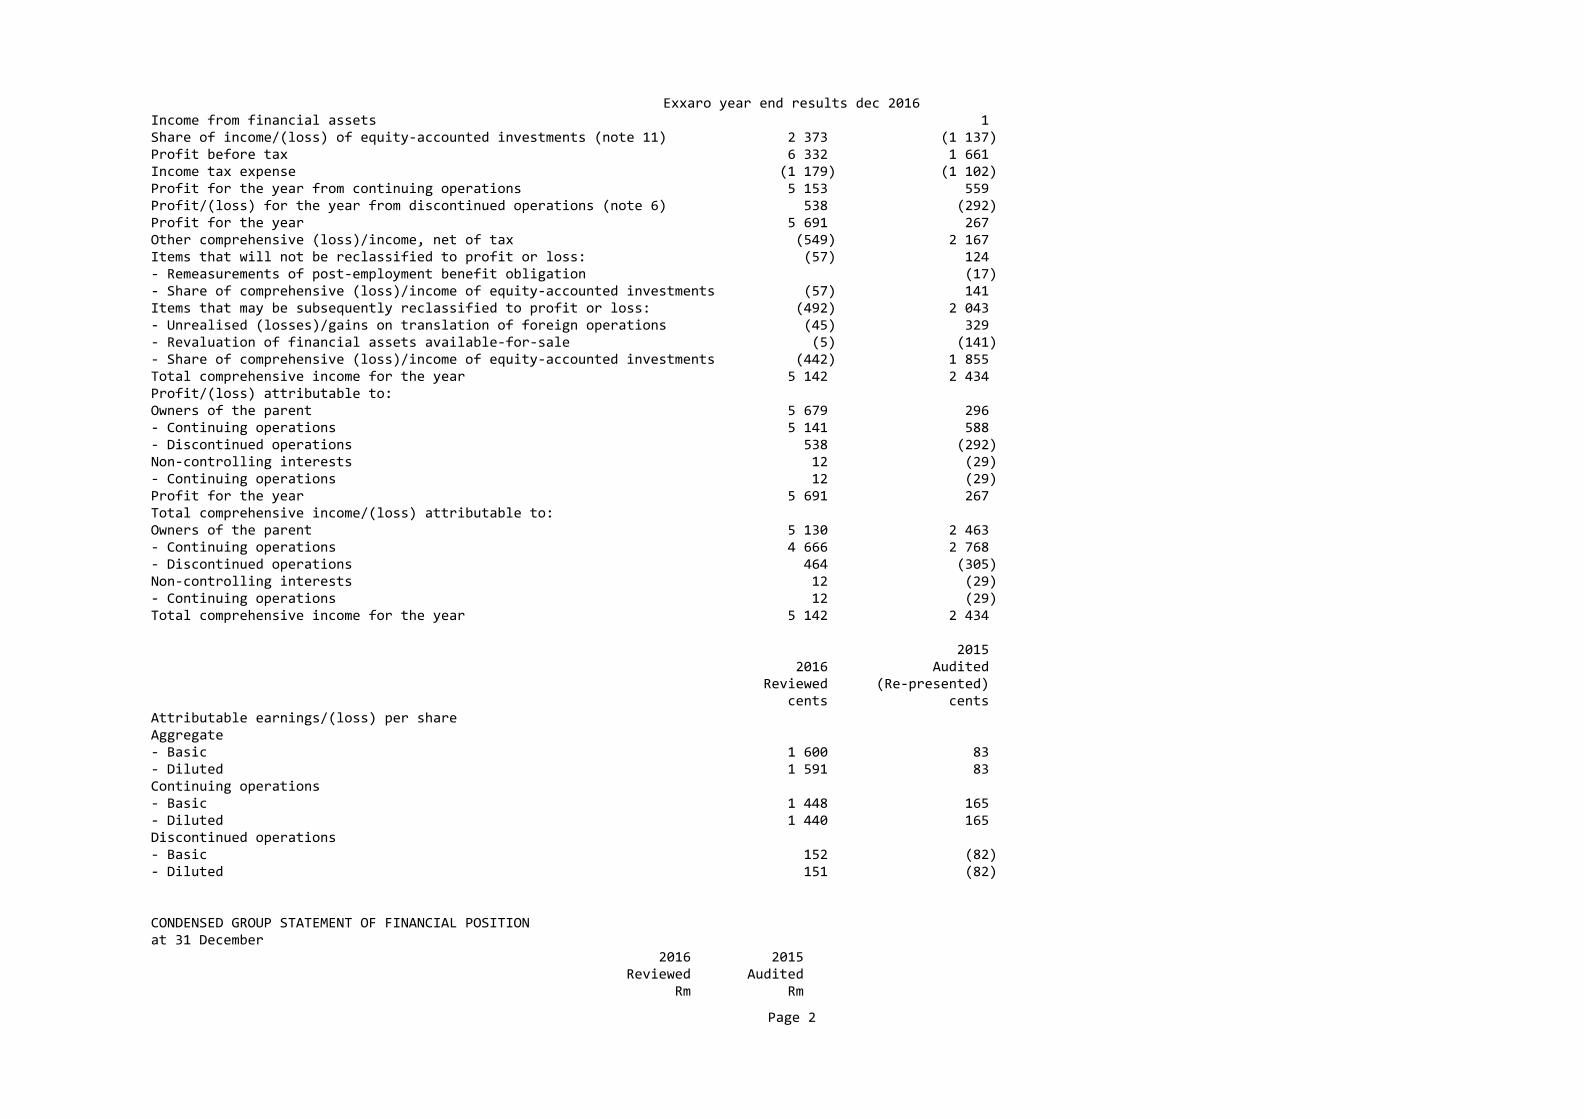
Exxaro year end results dec 2016Income from financial assets 1 Share of income/(loss) of equity‐accounted investments (note 11) 2 373 (1 137) Profit before tax 6 332 1 661 Income tax expense (1 179) (1 102) Profit for the year from continuing operations 5 153 559 Profit/(loss) for the year from discontinued operations (note 6) 538 (292) Profit for the year 5 691 267 Other comprehensive (loss)/income, net of tax (549) 2 167 Items that will not be reclassified to profit or loss: (57) 124 ‐ Remeasurements of post‐employment benefit obligation (17) ‐ Share of comprehensive (loss)/income of equity‐accounted investments (57) 141 Items that may be subsequently reclassified to profit or loss: (492) 2 043 ‐ Unrealised (losses)/gains on translation of foreign operations (45) 329 ‐ Revaluation of financial assets available‐for‐sale (5) (141) ‐ Share of comprehensive (loss)/income of equity‐accounted investments (442) 1 855 Total comprehensive income for the year 5 142 2 434 Profit/(loss) attributable to: Owners of the parent 5 679 296 ‐ Continuing operations 5 141 588 ‐ Discontinued operations 538 (292) Non‐controlling interests 12 (29) ‐ Continuing operations 12 (29) Profit for the year 5 691 267 Total comprehensive income/(loss) attributable to: Owners of the parent 5 130 2 463 ‐ Continuing operations 4 666 2 768 ‐ Discontinued operations 464 (305) Non‐controlling interests 12 (29) ‐ Continuing operations 12 (29) Total comprehensive income for the year 5 142 2 434 2015 2016 Audited Reviewed (Re‐presented) cents cents Attributable earnings/(loss) per share Aggregate ‐ Basic 1 600 83 ‐ Diluted 1 591 83 Continuing operations ‐ Basic 1 448 165 ‐ Diluted 1 440 165 Discontinued operations ‐ Basic 152 (82) ‐ Diluted 151 (82)
CONDENSED GROUP STATEMENT OF FINANCIAL POSITIONat 31 December 2016 2015 Reviewed Audited Rm Rm
Page 2

Exxaro year end results dec 2016ASSETS Non‐current assets 49 959 46 482 Property, plant and equipment 21 972 20 412 Biological assets 45 51 Intangible assets 31 56 Investments in associates (note 14) 21 518 19 690 Investments in joint ventures (note 15) 1 258 1 662 Financial assets (note 16) 4 720 4 067 Deferred tax 415 544 Current assets 9 842 6 016 Inventories 1 036 1 240 Financial assets (note 16) 480 Trade and other receivables 3 050 2 666 Current tax receivable 81 55 Cash and cash equivalents 5 195 2 055 Non‐current assets held‐for‐sale (note 17) 130 128 Total assets 59 931 52 626 EQUITY AND LIABILITIES Capital and other components of equity Share capital 2 509 2 445 Other components of equity 2 085 6 911 Retained earnings 31 281 25 670 Equity attributable to owners of the parent 35 875 35 026 Non‐controlling interests (788) (800) Total equity 35 087 34 226 Total liabilities 24 844 18 400 Non‐current liabilities 16 282 12 701 Interest‐bearing borrowings (note 18) 6 002 4 185 Provisions 4 162 3 112 Post‐retirement employee obligations 239 217 Financial liabilities (note 20) 479 116 Deferred tax 5 400 5 071 Current liabilities 7 461 4 655 Trade and other payables 3 010 3 546 Shareholder loans 18 21 Interest‐bearing borrowings (note 18) 503 882 Current tax payable 210 48 Financial liabilities (note 20) 3 599 Provisions 109 158 Overdraft (note 18) 12 Non‐current liabilities held‐for‐sale (note 17) 1 101 1 044 Total equity and liabilities 59 931 52 626
CONDENSED GROUP STATEMENT OF CHANGES IN EQUITY Other components of equity Foreign Financial Retirement Available‐ Share currency instruments Equity‐ benefit for‐sale capital translation revaluation settled obligation revaluation Rm Rm Rm Rm Rm Rm At 1 January 2015 (Audited) 2 409 4 167 116 1 695 (329) 382
Page 3
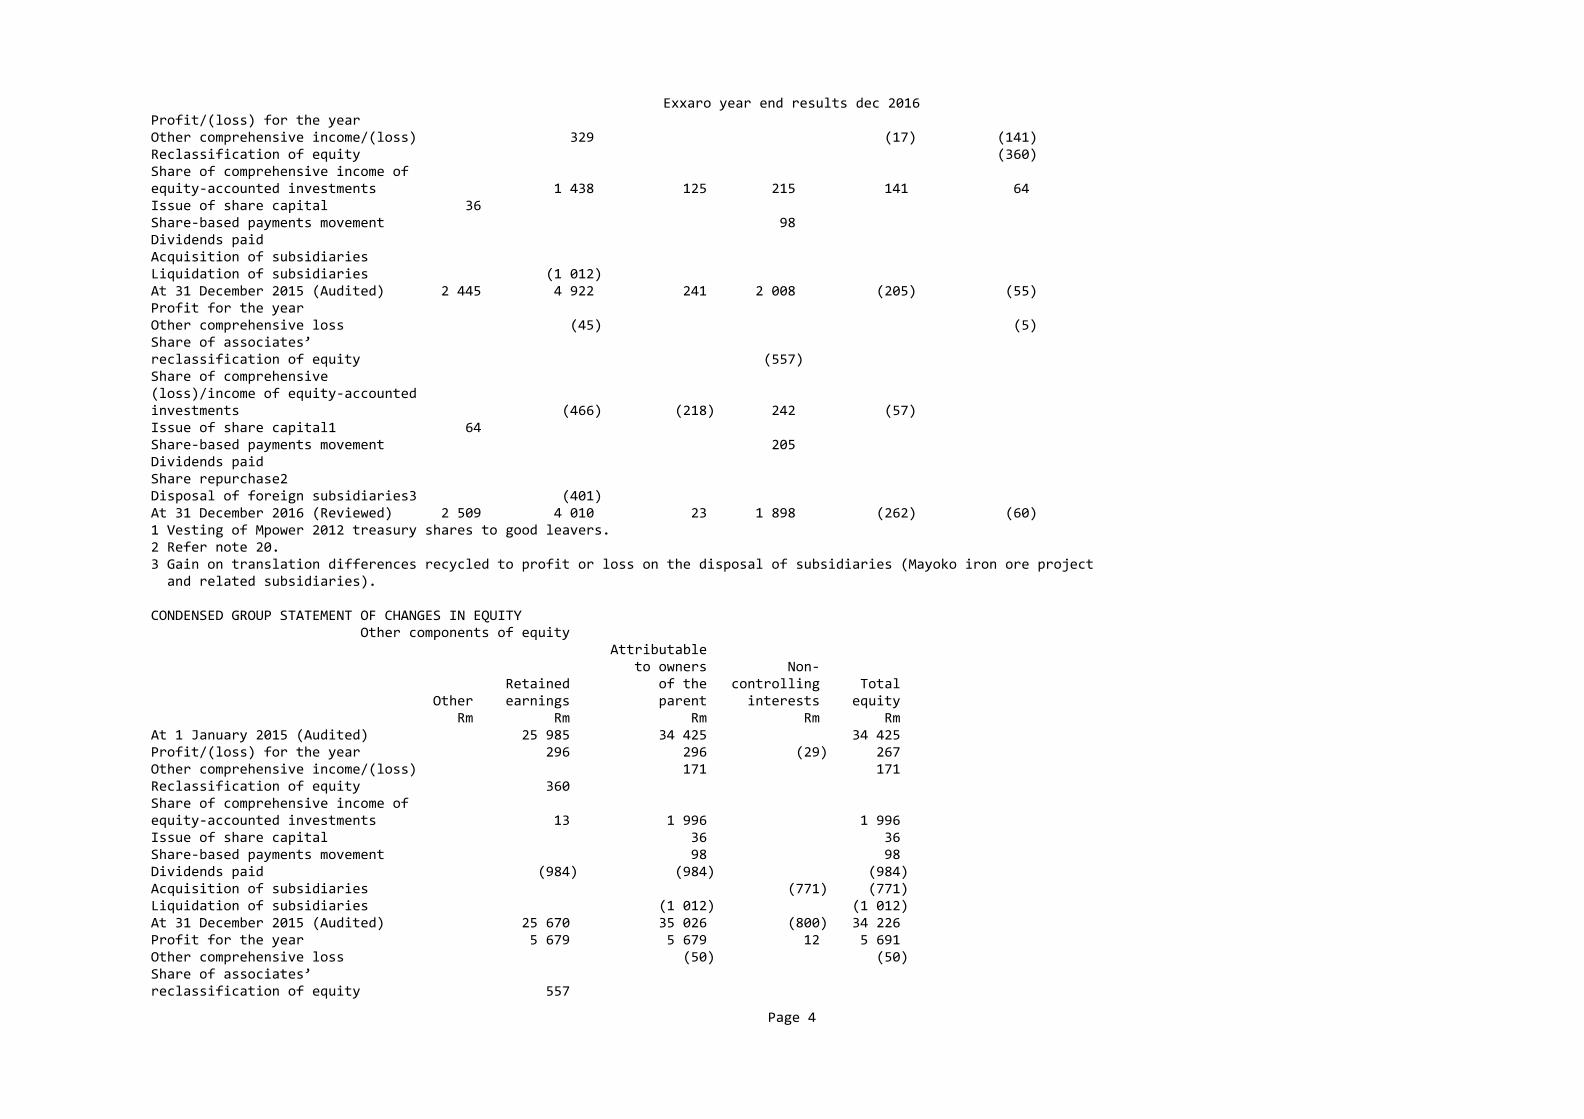
Exxaro year end results dec 2016Profit/(loss) for the year Other comprehensive income/(loss) 329 (17) (141) Reclassification of equity (360) Share of comprehensive income of equity‐accounted investments 1 438 125 215 141 64 Issue of share capital 36 Share‐based payments movement 98 Dividends paid Acquisition of subsidiaries Liquidation of subsidiaries (1 012) At 31 December 2015 (Audited) 2 445 4 922 241 2 008 (205) (55) Profit for the year Other comprehensive loss (45) (5) Share of associates’ reclassification of equity (557) Share of comprehensive (loss)/income of equity‐accountedinvestments (466) (218) 242 (57) Issue of share capital1 64 Share‐based payments movement 205 Dividends paid Share repurchase2 Disposal of foreign subsidiaries3 (401) At 31 December 2016 (Reviewed) 2 509 4 010 23 1 898 (262) (60) 1 Vesting of Mpower 2012 treasury shares to good leavers. 2 Refer note 20. 3 Gain on translation differences recycled to profit or loss on the disposal of subsidiaries (Mayoko iron ore project and related subsidiaries).
CONDENSED GROUP STATEMENT OF CHANGES IN EQUITY Other components of equity Attributable to owners Non‐ Retained of the controlling Total Other earnings parent interests equity Rm Rm Rm Rm Rm At 1 January 2015 (Audited) 25 985 34 425 34 425 Profit/(loss) for the year 296 296 (29) 267 Other comprehensive income/(loss) 171 171 Reclassification of equity 360 Share of comprehensive income of equity‐accounted investments 13 1 996 1 996 Issue of share capital 36 36 Share‐based payments movement 98 98 Dividends paid (984) (984) (984) Acquisition of subsidiaries (771) (771) Liquidation of subsidiaries (1 012) (1 012) At 31 December 2015 (Audited) 25 670 35 026 (800) 34 226 Profit for the year 5 679 5 679 12 5 691 Other comprehensive loss (50) (50) Share of associates’ reclassification of equity 557
Page 4
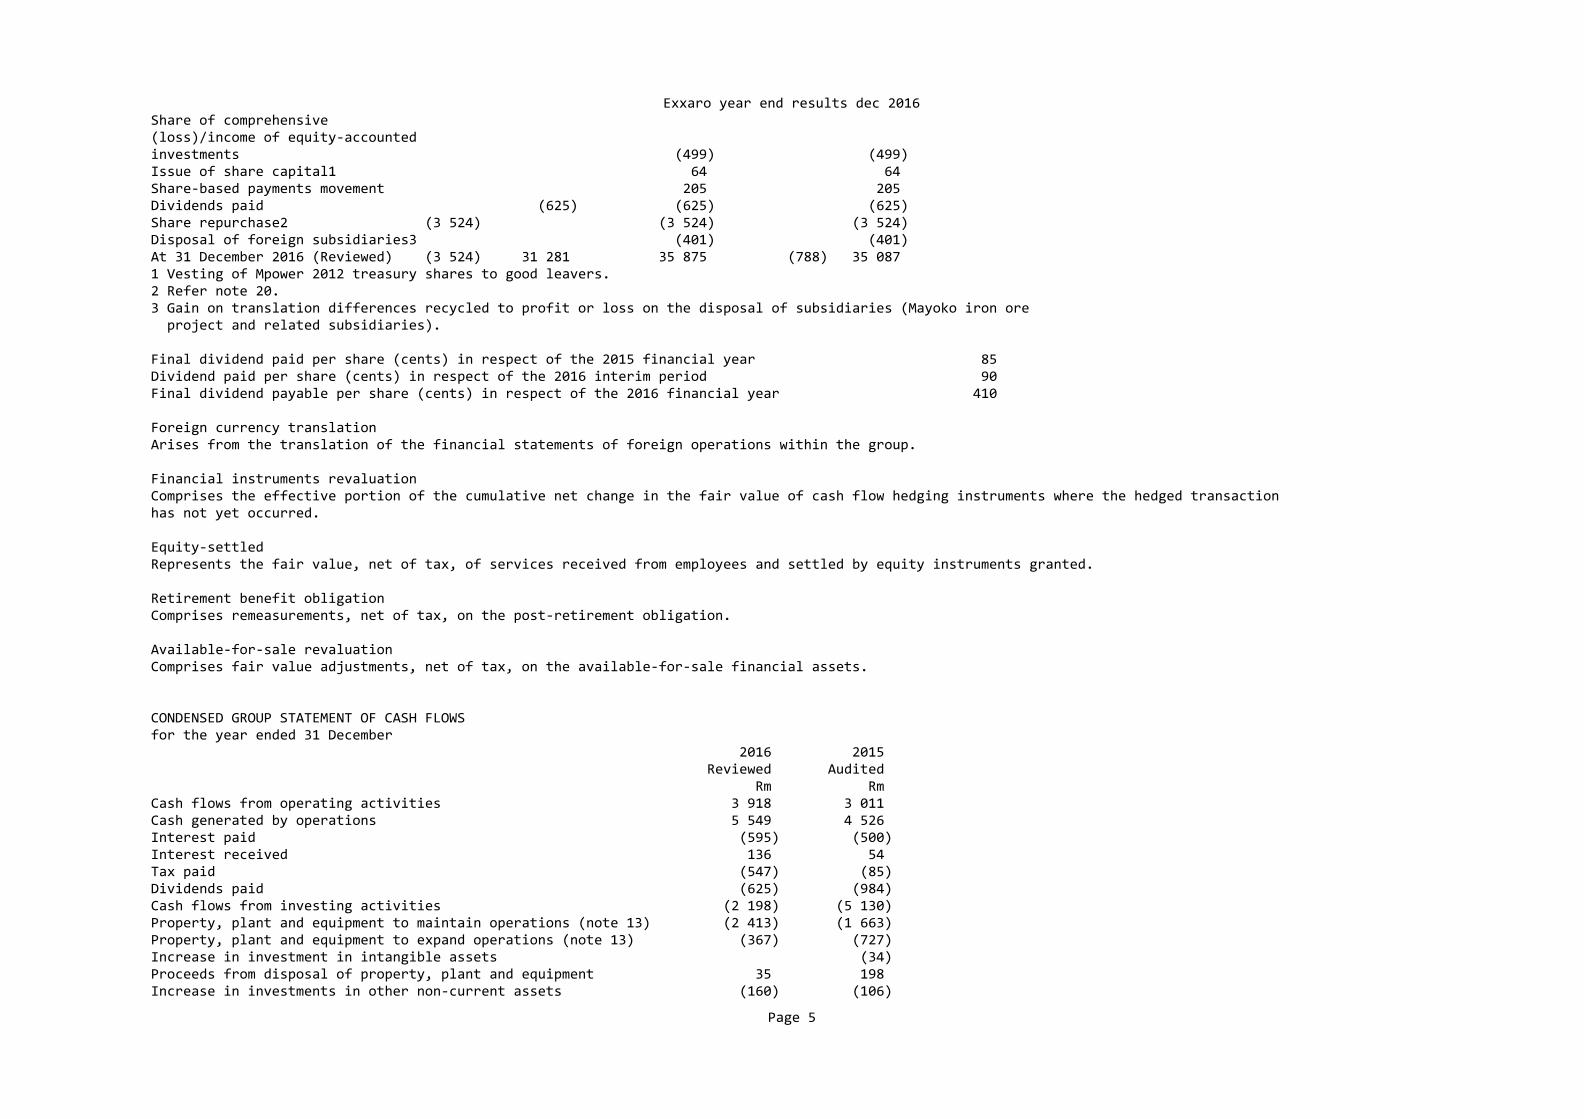
Exxaro year end results dec 2016Share of comprehensive (loss)/income of equity‐accountedinvestments (499) (499) Issue of share capital1 64 64 Share‐based payments movement 205 205 Dividends paid (625) (625) (625) Share repurchase2 (3 524) (3 524) (3 524) Disposal of foreign subsidiaries3 (401) (401) At 31 December 2016 (Reviewed) (3 524) 31 281 35 875 (788) 35 087 1 Vesting of Mpower 2012 treasury shares to good leavers. 2 Refer note 20. 3 Gain on translation differences recycled to profit or loss on the disposal of subsidiaries (Mayoko iron ore project and related subsidiaries). Final dividend paid per share (cents) in respect of the 2015 financial year 85 Dividend paid per share (cents) in respect of the 2016 interim period 90 Final dividend payable per share (cents) in respect of the 2016 financial year 410 Foreign currency translation Arises from the translation of the financial statements of foreign operations within the group. Financial instruments revaluation Comprises the effective portion of the cumulative net change in the fair value of cash flow hedging instruments where the hedged transaction has not yet occurred. Equity‐settled Represents the fair value, net of tax, of services received from employees and settled by equity instruments granted. Retirement benefit obligation Comprises remeasurements, net of tax, on the post‐retirement obligation. Available‐for‐sale revaluation Comprises fair value adjustments, net of tax, on the available‐for‐sale financial assets.
CONDENSED GROUP STATEMENT OF CASH FLOWSfor the year ended 31 December 2016 2015 Reviewed Audited Rm Rm Cash flows from operating activities 3 918 3 011 Cash generated by operations 5 549 4 526 Interest paid (595) (500) Interest received 136 54 Tax paid (547) (85) Dividends paid (625) (984) Cash flows from investing activities (2 198) (5 130) Property, plant and equipment to maintain operations (note 13) (2 413) (1 663) Property, plant and equipment to expand operations (note 13) (367) (727) Increase in investment in intangible assets (34) Proceeds from disposal of property, plant and equipment 35 198 Increase in investments in other non‐current assets (160) (106)
Page 5
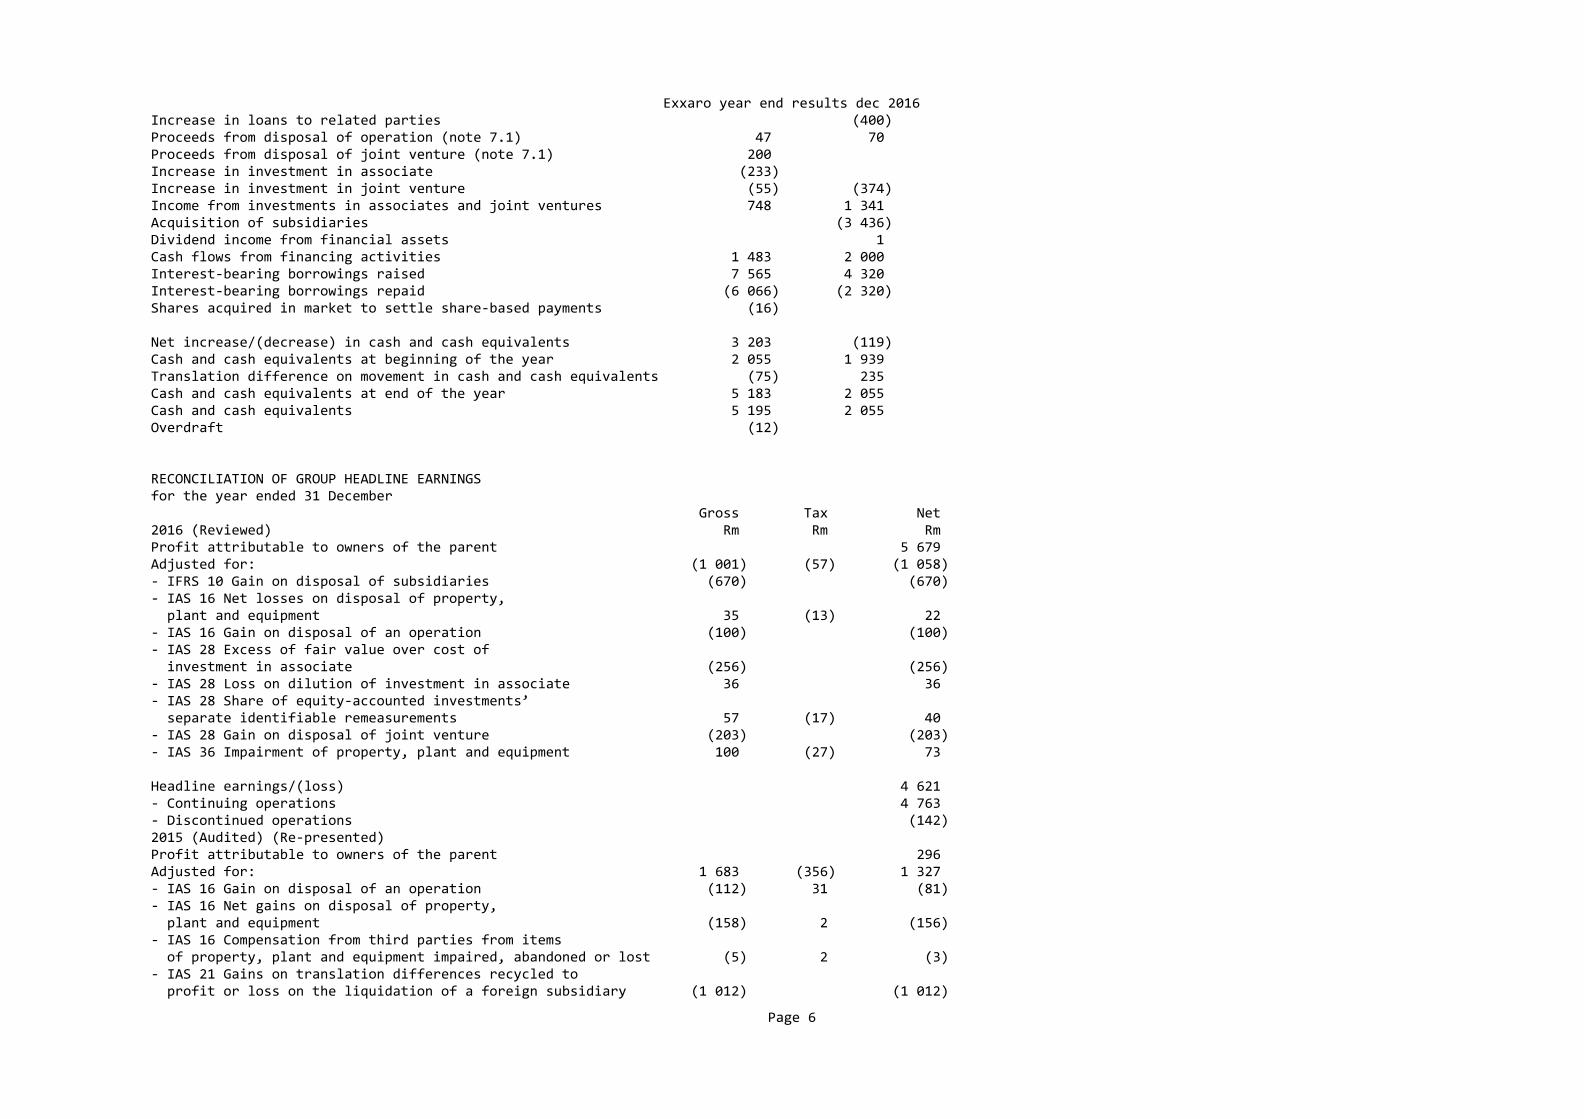
Exxaro year end results dec 2016Increase in loans to related parties (400) Proceeds from disposal of operation (note 7.1) 47 70 Proceeds from disposal of joint venture (note 7.1) 200 Increase in investment in associate (233) Increase in investment in joint venture (55) (374) Income from investments in associates and joint ventures 748 1 341 Acquisition of subsidiaries (3 436) Dividend income from financial assets 1 Cash flows from financing activities 1 483 2 000 Interest‐bearing borrowings raised 7 565 4 320 Interest‐bearing borrowings repaid (6 066) (2 320) Shares acquired in market to settle share‐based payments (16) Net increase/(decrease) in cash and cash equivalents 3 203 (119) Cash and cash equivalents at beginning of the year 2 055 1 939 Translation difference on movement in cash and cash equivalents (75) 235 Cash and cash equivalents at end of the year 5 183 2 055 Cash and cash equivalents 5 195 2 055 Overdraft (12)
RECONCILIATION OF GROUP HEADLINE EARNINGS for the year ended 31 December Gross Tax Net 2016 (Reviewed) Rm Rm Rm Profit attributable to owners of the parent 5 679 Adjusted for: (1 001) (57) (1 058) ‐ IFRS 10 Gain on disposal of subsidiaries (670) (670) ‐ IAS 16 Net losses on disposal of property, plant and equipment 35 (13) 22 ‐ IAS 16 Gain on disposal of an operation (100) (100) ‐ IAS 28 Excess of fair value over cost of investment in associate (256) (256) ‐ IAS 28 Loss on dilution of investment in associate 36 36 ‐ IAS 28 Share of equity‐accounted investments’ separate identifiable remeasurements 57 (17) 40 ‐ IAS 28 Gain on disposal of joint venture (203) (203) ‐ IAS 36 Impairment of property, plant and equipment 100 (27) 73 Headline earnings/(loss) 4 621 ‐ Continuing operations 4 763 ‐ Discontinued operations (142) 2015 (Audited) (Re‐presented) Profit attributable to owners of the parent 296 Adjusted for: 1 683 (356) 1 327 ‐ IAS 16 Gain on disposal of an operation (112) 31 (81) ‐ IAS 16 Net gains on disposal of property, plant and equipment (158) 2 (156) ‐ IAS 16 Compensation from third parties from items of property, plant and equipment impaired, abandoned or lost (5) 2 (3) ‐ IAS 21 Gains on translation differences recycled to profit or loss on the liquidation of a foreign subsidiary (1 012) (1 012)
Page 6
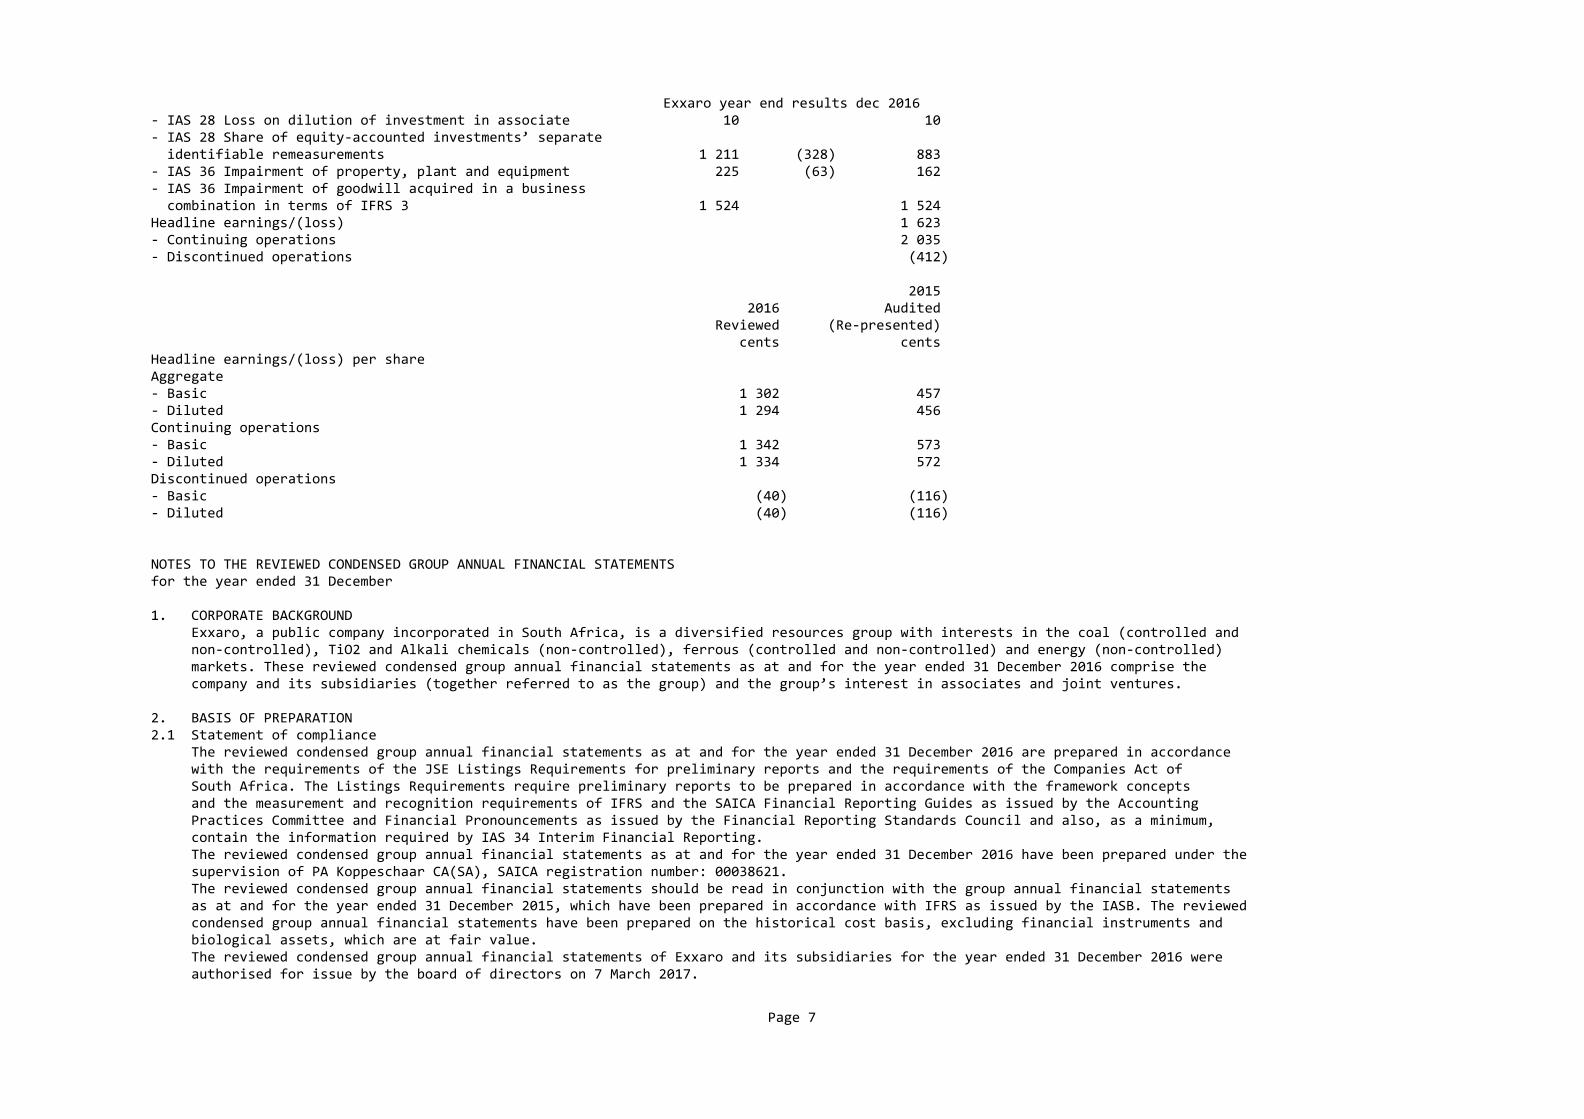
Exxaro year end results dec 2016‐ IAS 28 Loss on dilution of investment in associate 10 10 ‐ IAS 28 Share of equity‐accounted investments’ separate identifiable remeasurements 1 211 (328) 883 ‐ IAS 36 Impairment of property, plant and equipment 225 (63) 162 ‐ IAS 36 Impairment of goodwill acquired in a business combination in terms of IFRS 3 1 524 1 524 Headline earnings/(loss) 1 623 ‐ Continuing operations 2 035 ‐ Discontinued operations (412) 2015 2016 Audited Reviewed (Re‐presented) cents cents Headline earnings/(loss) per share Aggregate ‐ Basic 1 302 457 ‐ Diluted 1 294 456 Continuing operations ‐ Basic 1 342 573 ‐ Diluted 1 334 572 Discontinued operations ‐ Basic (40) (116) ‐ Diluted (40) (116)
NOTES TO THE REVIEWED CONDENSED GROUP ANNUAL FINANCIAL STATEMENTSfor the year ended 31 December
1. CORPORATE BACKGROUND Exxaro, a public company incorporated in South Africa, is a diversified resources group with interests in the coal (controlled and non‐controlled), TiO2 and Alkali chemicals (non‐controlled), ferrous (controlled and non‐controlled) and energy (non‐controlled) markets. These reviewed condensed group annual financial statements as at and for the year ended 31 December 2016 comprise the company and its subsidiaries (together referred to as the group) and the group’s interest in associates and joint ventures.
2. BASIS OF PREPARATION 2.1 Statement of compliance The reviewed condensed group annual financial statements as at and for the year ended 31 December 2016 are prepared in accordance with the requirements of the JSE Listings Requirements for preliminary reports and the requirements of the Companies Act of South Africa. The Listings Requirements require preliminary reports to be prepared in accordance with the framework concepts and the measurement and recognition requirements of IFRS and the SAICA Financial Reporting Guides as issued by the Accounting Practices Committee and Financial Pronouncements as issued by the Financial Reporting Standards Council and also, as a minimum, contain the information required by IAS 34 Interim Financial Reporting. The reviewed condensed group annual financial statements as at and for the year ended 31 December 2016 have been prepared under the supervision of PA Koppeschaar CA(SA), SAICA registration number: 00038621. The reviewed condensed group annual financial statements should be read in conjunction with the group annual financial statements as at and for the year ended 31 December 2015, which have been prepared in accordance with IFRS as issued by the IASB. The reviewed condensed group annual financial statements have been prepared on the historical cost basis, excluding financial instruments and biological assets, which are at fair value. The reviewed condensed group annual financial statements of Exxaro and its subsidiaries for the year ended 31 December 2016 were authorised for issue by the board of directors on 7 March 2017.
Page 7

Exxaro year end results dec 20162.2 Judgements and estimates In preparing these reviewed condensed group annual financial statements, management made judgements, estimates and assumptions that affect the application of accounting policies and the reported amounts of assets, liabilities, income and expense. Actual results may differ from these estimates. The significant judgements made by management in applying the group’s accounting policies and the key source of estimation uncertainty were similar to those applied to the group annual financial statements as at and for the year ended 31 December 2015.
3. ACCOUNTING POLICIES The accounting policies adopted in the preparation of the reviewed condensed group annual financial statements are consistent with those followed in the preparation of the group annual financial statements as at and for the year ended 31 December 2015. Amendments to IFRS effective for the financial year ending 31 December 2016 did not have a material impact on the group. New accounting standards and amendments issued to accounting standards and interpretations which are relevant to the group, but not yet effective on 31 December 2016, have not been adopted. The group continuously evaluates the impact of these standards and amendments.
4. RE‐PRESENTATION OF COMPARATIVE INFORMATION The prior year of the condensed group statement of comprehensive income (and related notes) has been re‐presented as a result of the ferrous iron ore operating segment being identified as discontinued operations. Refer note 6 on discontinued operations. 5. SEGMENTAL INFORMATION Operating segments are reported on in a manner consistent with the internal reporting provided to the chief operating decision‐maker, who is responsible for allocating resources and assessing performance of the reportable operating segments. The chief operating decision‐maker has been identified as the group executive committee. Segments reported are based on the group’s different products and operations.
Total operating segment revenue, which excludes VAT, represents the gross value of goods invoiced, services rendered and includes operating revenues directly and reasonably allocable to the segments. Export revenue is recorded according to the relevant sales terms, when the risks and rewards of ownership are transferred.
Segment revenue includes sales made between segments. These sales are made on a commercial basis. Segment operating expenses, assets and liabilities represent direct or reasonably allocable operating expenses, assets and liabilities. Segment net operating profit equals segment revenue less operating segment expenses, less impairment charges, plus impairment reversals.
The group has four reportable segments, as described below. These offer different products and services, and are managed separately based on commodity, location and support function grouping. The group executive committee reviews internal management reports on these divisions at least quarterly.
Coal The coal operations are mainly situated in the Waterberg and Mpumalanga regions and are split between coal commercial operations and coal tied operations, a 50% (2015: 50%) investment in Mafube (a joint venture with Anglo) as well as a 10,82% (2015: 9,37%) effective equity interest in RBCT. The coal operations produce thermal coal, metallurgical coal and SSCC.
Ferrous The ferrous segment comprises a 20,62% (2015: 19,98%) equity interest in SIOC (located in South Africa) reported within the other ferrous operating segment as well as the FerroAlloys operations (referred to as Alloys). Although the SIOC investment is an investment in an iron ore commodity company and the executive committee classifies the investment as a non‐controlled business, it is classified under the other ferrous segment where investments and other are reviewed by the executive committee. The iron ore operating segment (comprising the Mayoko iron ore project and related subsidiaries) was classified as discontinued operations and sold on 23 September 2016.
TiO2 and Alkali chemicals Exxaro holds a 43,66% (2015: 43,87%) equity interest in Tronox and a 26% (2015: 26%) equity interest in Tronox SA (each of the South
Page 8
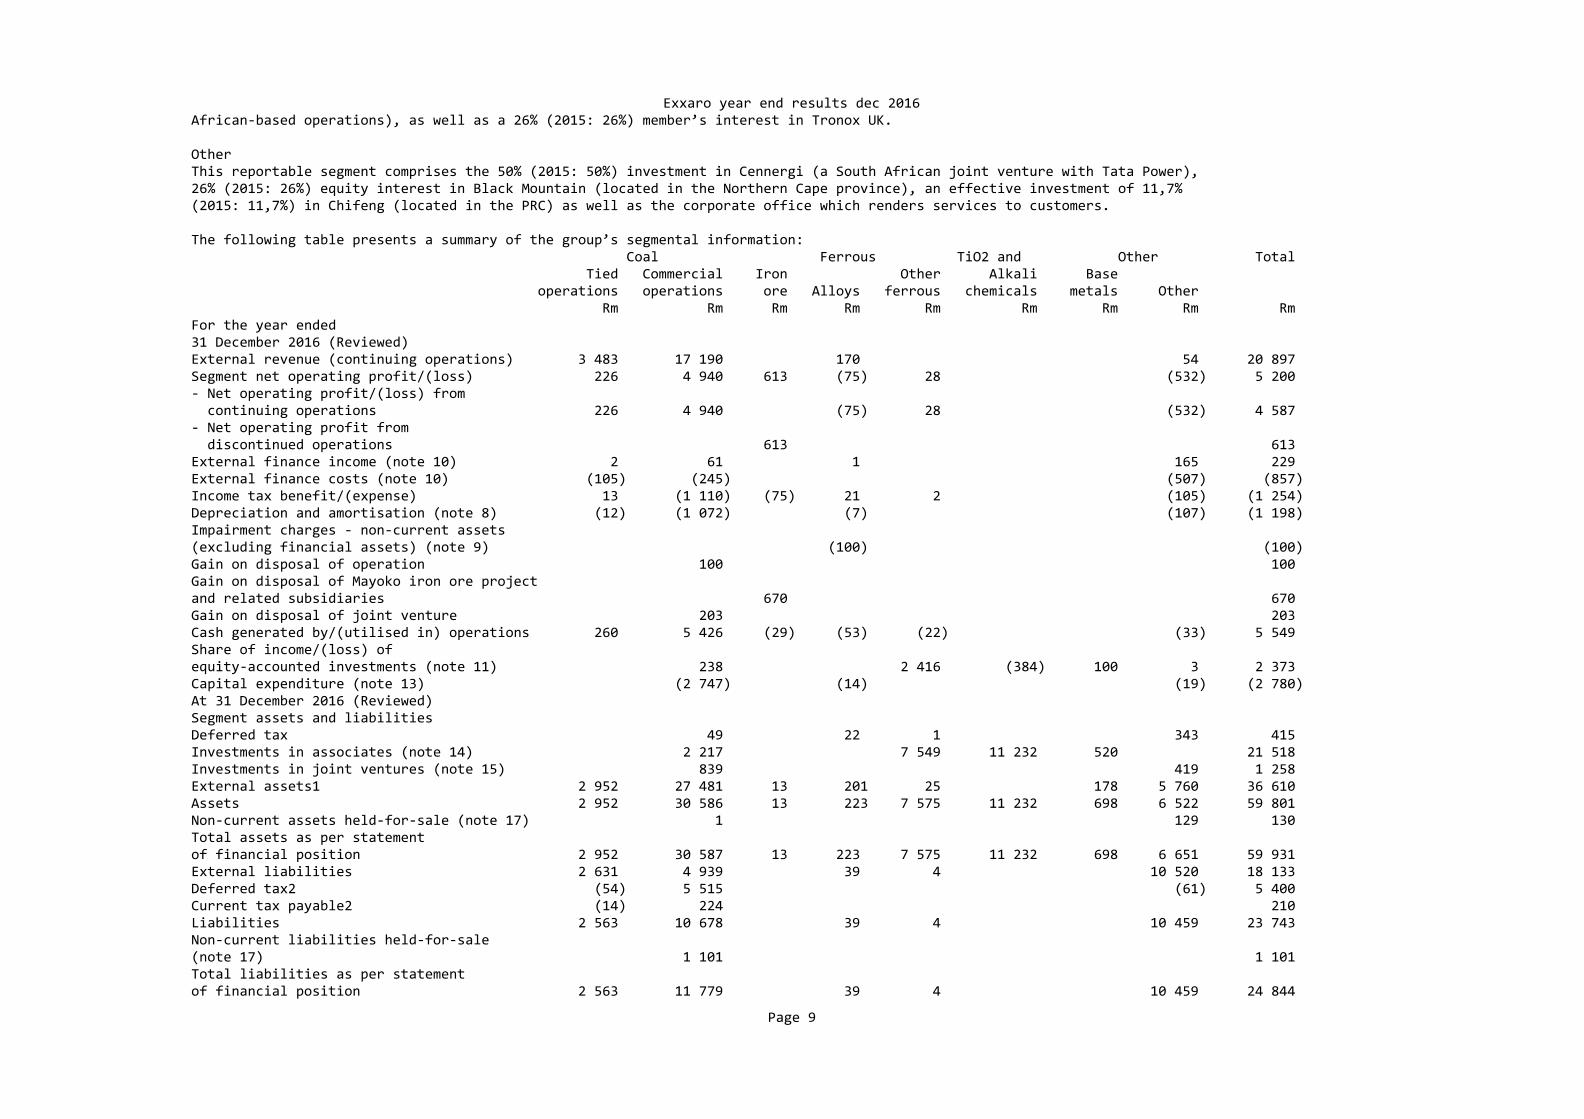
Exxaro year end results dec 2016 African‐based operations), as well as a 26% (2015: 26%) member’s interest in Tronox UK.
Other This reportable segment comprises the 50% (2015: 50%) investment in Cennergi (a South African joint venture with Tata Power), 26% (2015: 26%) equity interest in Black Mountain (located in the Northern Cape province), an effective investment of 11,7% (2015: 11,7%) in Chifeng (located in the PRC) as well as the corporate office which renders services to customers. The following table presents a summary of the group’s segmental information: Coal Ferrous TiO2 and Other Total Tied Commercial Iron Other Alkali Base operations operations ore Alloys ferrous chemicals metals Other Rm Rm Rm Rm Rm Rm Rm Rm Rm For the year ended 31 December 2016 (Reviewed) External revenue (continuing operations) 3 483 17 190 170 54 20 897 Segment net operating profit/(loss) 226 4 940 613 (75) 28 (532) 5 200 ‐ Net operating profit/(loss) from continuing operations 226 4 940 (75) 28 (532) 4 587 ‐ Net operating profit from discontinued operations 613 613 External finance income (note 10) 2 61 1 165 229 External finance costs (note 10) (105) (245) (507) (857) Income tax benefit/(expense) 13 (1 110) (75) 21 2 (105) (1 254) Depreciation and amortisation (note 8) (12) (1 072) (7) (107) (1 198) Impairment charges ‐ non‐current assets (excluding financial assets) (note 9) (100) (100) Gain on disposal of operation 100 100 Gain on disposal of Mayoko iron ore project and related subsidiaries 670 670 Gain on disposal of joint venture 203 203 Cash generated by/(utilised in) operations 260 5 426 (29) (53) (22) (33) 5 549 Share of income/(loss) of equity‐accounted investments (note 11) 238 2 416 (384) 100 3 2 373 Capital expenditure (note 13) (2 747) (14) (19) (2 780) At 31 December 2016 (Reviewed) Segment assets and liabilities Deferred tax 49 22 1 343 415 Investments in associates (note 14) 2 217 7 549 11 232 520 21 518 Investments in joint ventures (note 15) 839 419 1 258 External assets1 2 952 27 481 13 201 25 178 5 760 36 610 Assets 2 952 30 586 13 223 7 575 11 232 698 6 522 59 801 Non‐current assets held‐for‐sale (note 17) 1 129 130 Total assets as per statement of financial position 2 952 30 587 13 223 7 575 11 232 698 6 651 59 931 External liabilities 2 631 4 939 39 4 10 520 18 133 Deferred tax2 (54) 5 515 (61) 5 400 Current tax payable2 (14) 224 210 Liabilities 2 563 10 678 39 4 10 459 23 743 Non‐current liabilities held‐for‐sale (note 17) 1 101 1 101 Total liabilities as per statement of financial position 2 563 11 779 39 4 10 459 24 844
Page 9
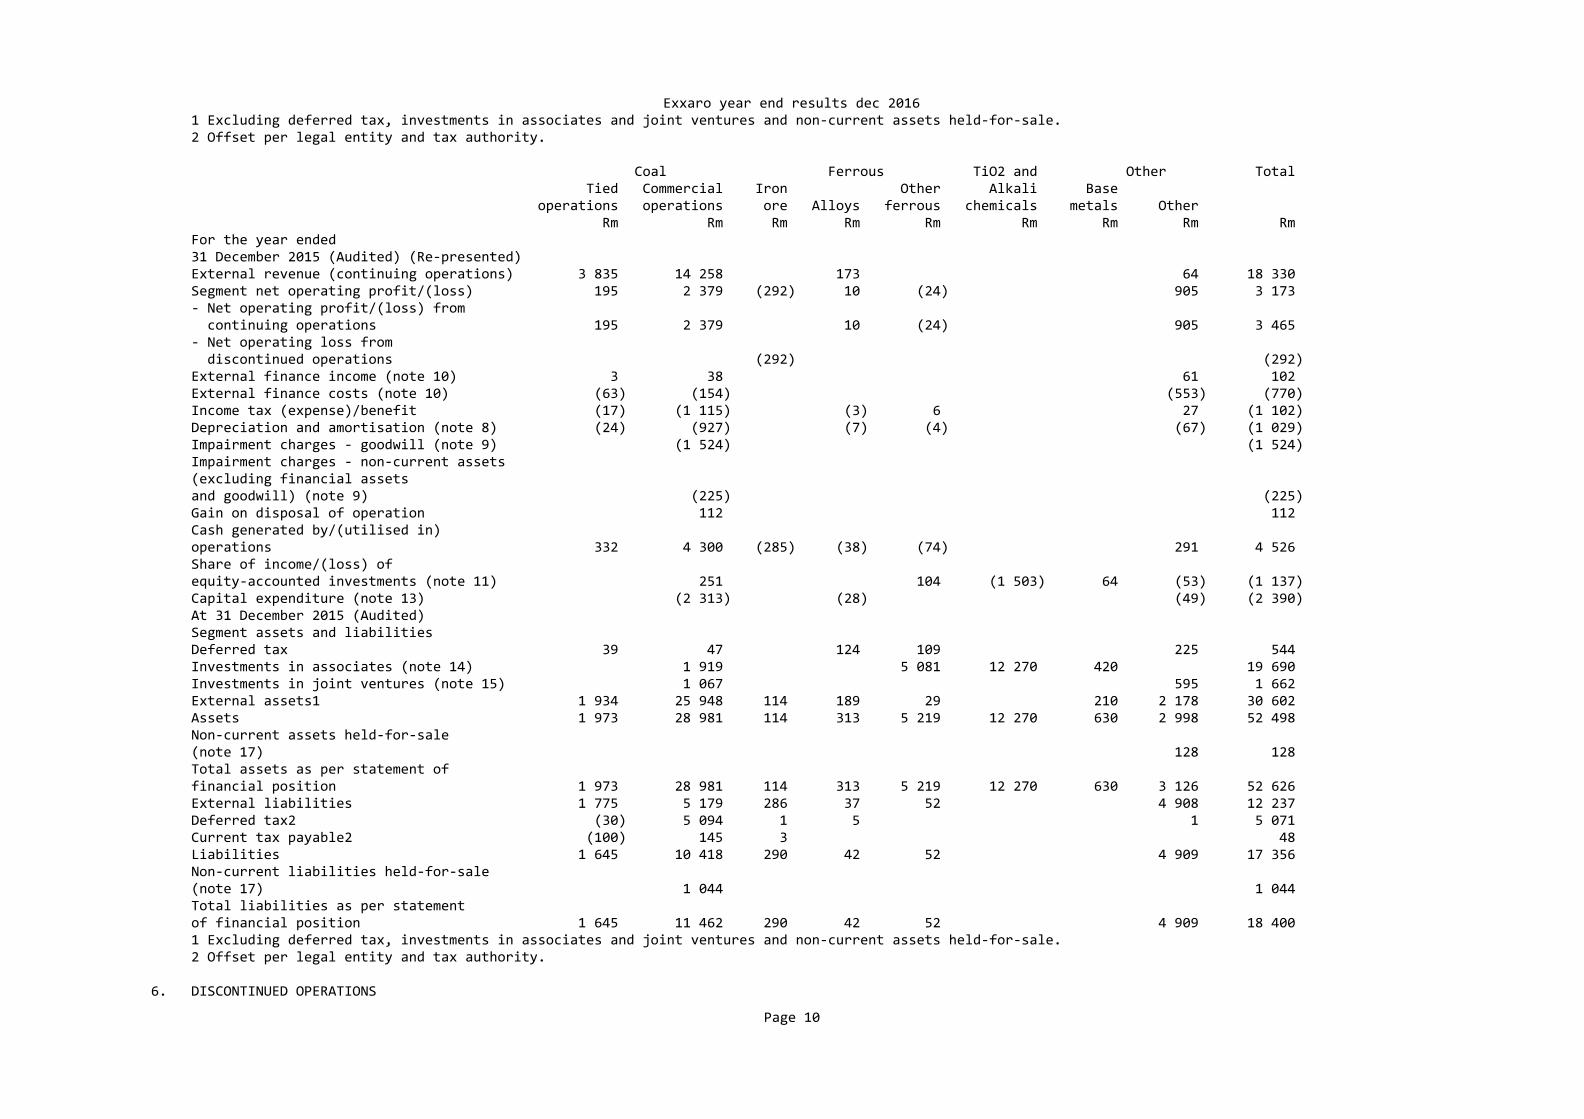
Exxaro year end results dec 2016 1 Excluding deferred tax, investments in associates and joint ventures and non‐current assets held‐for‐sale. 2 Offset per legal entity and tax authority. Coal Ferrous TiO2 and Other Total Tied Commercial Iron Other Alkali Base operations operations ore Alloys ferrous chemicals metals Other Rm Rm Rm Rm Rm Rm Rm Rm Rm For the year ended 31 December 2015 (Audited) (Re‐presented) External revenue (continuing operations) 3 835 14 258 173 64 18 330 Segment net operating profit/(loss) 195 2 379 (292) 10 (24) 905 3 173 ‐ Net operating profit/(loss) from continuing operations 195 2 379 10 (24) 905 3 465 ‐ Net operating loss from discontinued operations (292) (292) External finance income (note 10) 3 38 61 102 External finance costs (note 10) (63) (154) (553) (770) Income tax (expense)/benefit (17) (1 115) (3) 6 27 (1 102) Depreciation and amortisation (note 8) (24) (927) (7) (4) (67) (1 029) Impairment charges ‐ goodwill (note 9) (1 524) (1 524) Impairment charges ‐ non‐current assets (excluding financial assets and goodwill) (note 9) (225) (225) Gain on disposal of operation 112 112 Cash generated by/(utilised in) operations 332 4 300 (285) (38) (74) 291 4 526 Share of income/(loss) of equity‐accounted investments (note 11) 251 104 (1 503) 64 (53) (1 137) Capital expenditure (note 13) (2 313) (28) (49) (2 390) At 31 December 2015 (Audited) Segment assets and liabilities Deferred tax 39 47 124 109 225 544 Investments in associates (note 14) 1 919 5 081 12 270 420 19 690 Investments in joint ventures (note 15) 1 067 595 1 662 External assets1 1 934 25 948 114 189 29 210 2 178 30 602 Assets 1 973 28 981 114 313 5 219 12 270 630 2 998 52 498 Non‐current assets held‐for‐sale (note 17) 128 128 Total assets as per statement of financial position 1 973 28 981 114 313 5 219 12 270 630 3 126 52 626 External liabilities 1 775 5 179 286 37 52 4 908 12 237 Deferred tax2 (30) 5 094 1 5 1 5 071 Current tax payable2 (100) 145 3 48 Liabilities 1 645 10 418 290 42 52 4 909 17 356 Non‐current liabilities held‐for‐sale (note 17) 1 044 1 044 Total liabilities as per statement of financial position 1 645 11 462 290 42 52 4 909 18 400 1 Excluding deferred tax, investments in associates and joint ventures and non‐current assets held‐for‐sale. 2 Offset per legal entity and tax authority.
6. DISCONTINUED OPERATIONS
Page 10
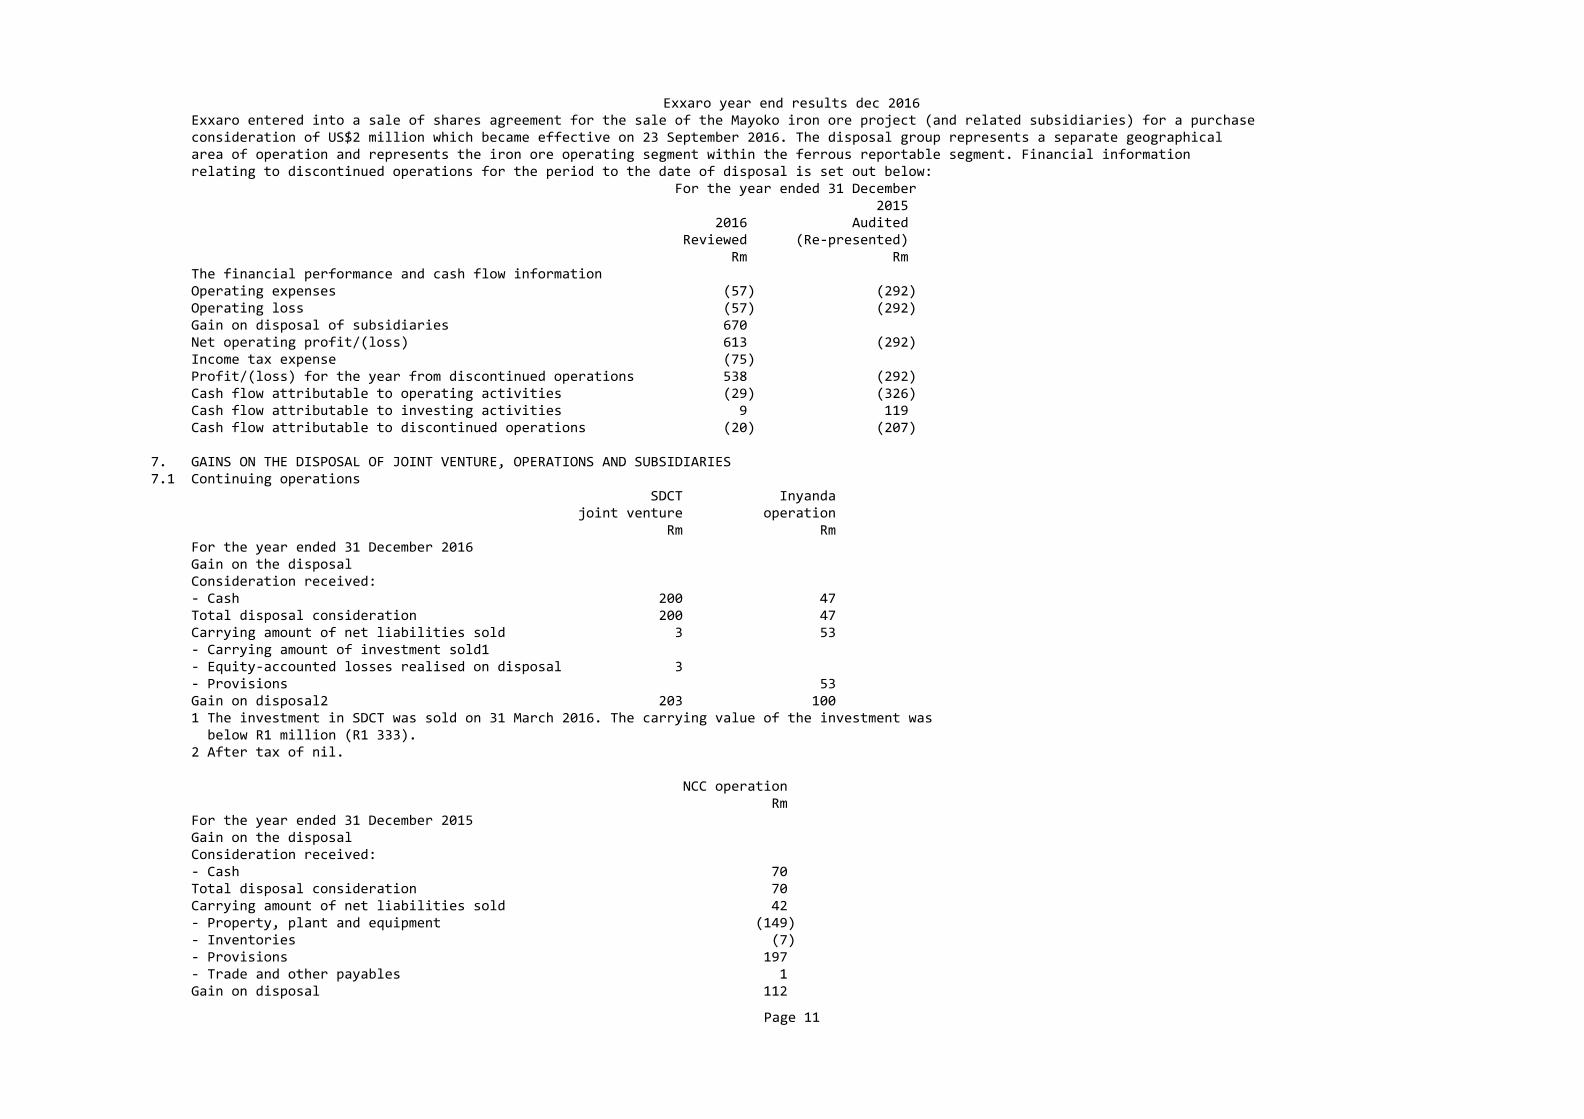
Exxaro year end results dec 2016 Exxaro entered into a sale of shares agreement for the sale of the Mayoko iron ore project (and related subsidiaries) for a purchase consideration of US$2 million which became effective on 23 September 2016. The disposal group represents a separate geographical area of operation and represents the iron ore operating segment within the ferrous reportable segment. Financial information relating to discontinued operations for the period to the date of disposal is set out below: For the year ended 31 December 2015 2016 Audited Reviewed (Re‐presented) Rm Rm The financial performance and cash flow information Operating expenses (57) (292) Operating loss (57) (292) Gain on disposal of subsidiaries 670 Net operating profit/(loss) 613 (292) Income tax expense (75) Profit/(loss) for the year from discontinued operations 538 (292) Cash flow attributable to operating activities (29) (326) Cash flow attributable to investing activities 9 119 Cash flow attributable to discontinued operations (20) (207)
7. GAINS ON THE DISPOSAL OF JOINT VENTURE, OPERATIONS AND SUBSIDIARIES 7.1 Continuing operations SDCT Inyanda joint venture operation Rm Rm For the year ended 31 December 2016 Gain on the disposal Consideration received: ‐ Cash 200 47 Total disposal consideration 200 47 Carrying amount of net liabilities sold 3 53 ‐ Carrying amount of investment sold1 ‐ Equity‐accounted losses realised on disposal 3 ‐ Provisions 53 Gain on disposal2 203 100 1 The investment in SDCT was sold on 31 March 2016. The carrying value of the investment was below R1 million (R1 333). 2 After tax of nil. NCC operation Rm For the year ended 31 December 2015 Gain on the disposal Consideration received: ‐ Cash 70 Total disposal consideration 70 Carrying amount of net liabilities sold 42 ‐ Property, plant and equipment (149) ‐ Inventories (7) ‐ Provisions 197 ‐ Trade and other payables 1 Gain on disposal 112
Page 11
Exxaro year end results dec 2016 Net tax effect (31)
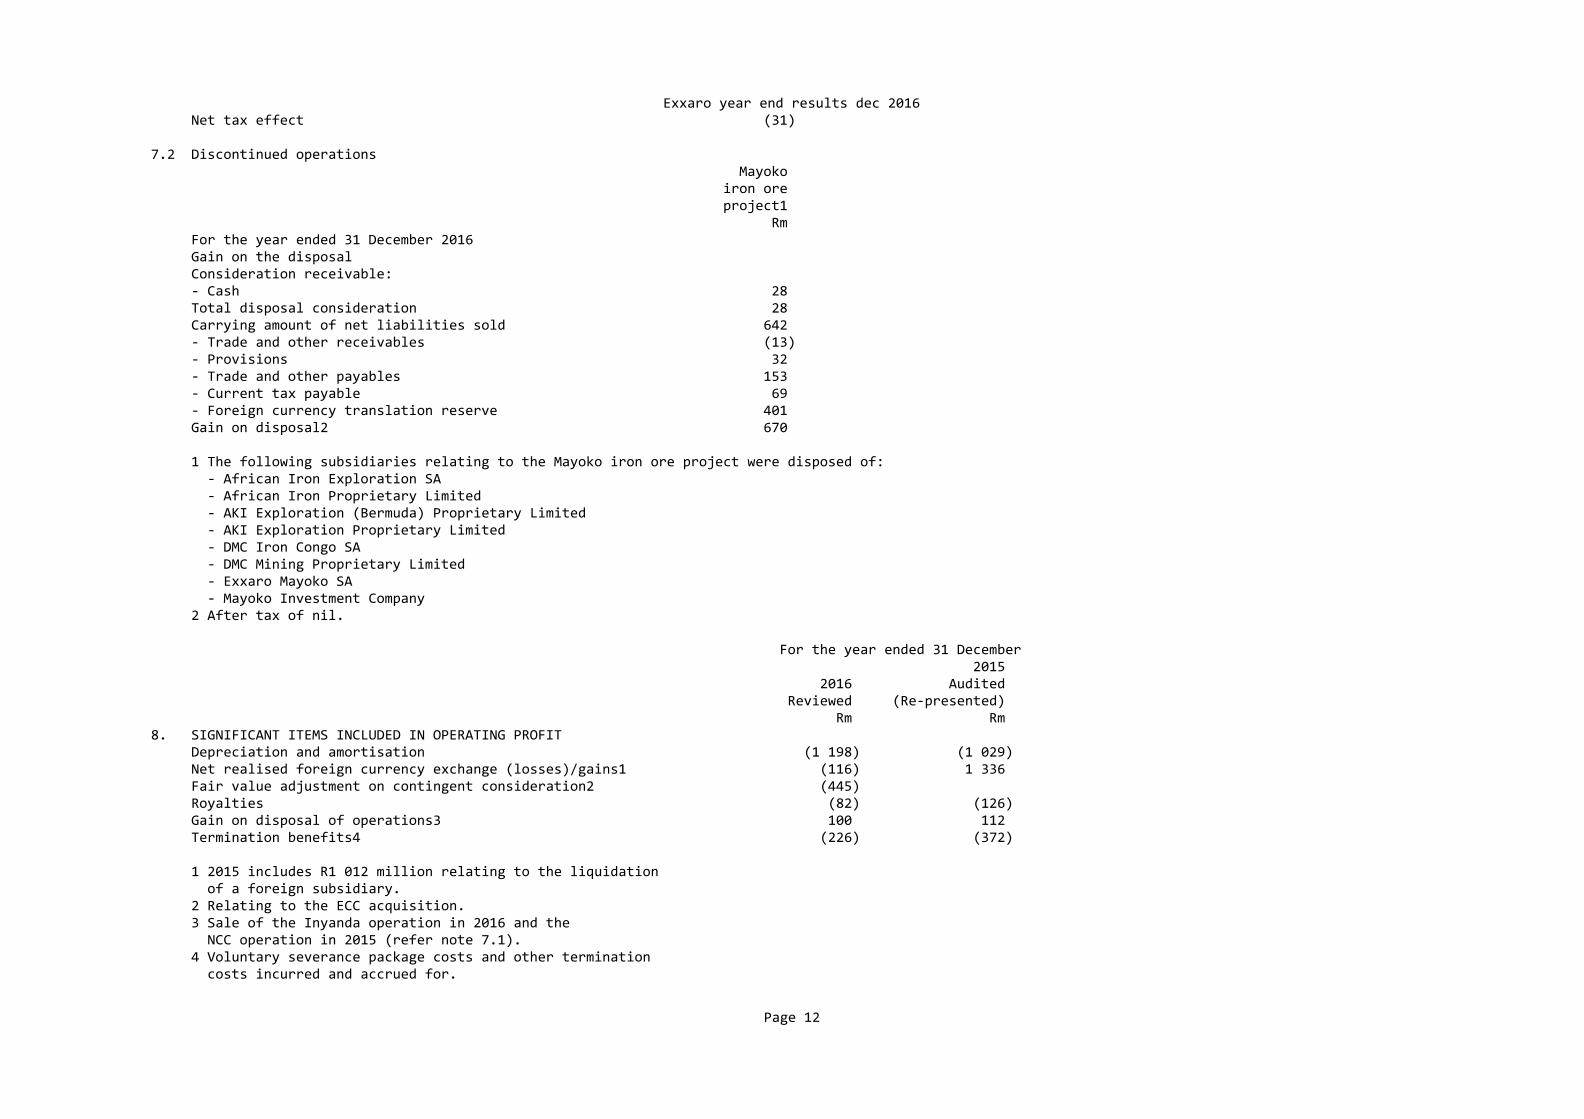
7.2 Discontinued operations Mayoko iron ore project1 Rm For the year ended 31 December 2016 Gain on the disposal Consideration receivable: ‐ Cash 28 Total disposal consideration 28 Carrying amount of net liabilities sold 642 ‐ Trade and other receivables (13) ‐ Provisions 32 ‐ Trade and other payables 153 ‐ Current tax payable 69 ‐ Foreign currency translation reserve 401 Gain on disposal2 670
1 The following subsidiaries relating to the Mayoko iron ore project were disposed of: ‐ African Iron Exploration SA ‐ African Iron Proprietary Limited ‐ AKI Exploration (Bermuda) Proprietary Limited ‐ AKI Exploration Proprietary Limited ‐ DMC Iron Congo SA ‐ DMC Mining Proprietary Limited ‐ Exxaro Mayoko SA ‐ Mayoko Investment Company 2 After tax of nil. For the year ended 31 December 2015 2016 Audited Reviewed (Re‐presented) Rm Rm 8. SIGNIFICANT ITEMS INCLUDED IN OPERATING PROFIT Depreciation and amortisation (1 198) (1 029) Net realised foreign currency exchange (losses)/gains1 (116) 1 336 Fair value adjustment on contingent consideration2 (445) Royalties (82) (126) Gain on disposal of operations3 100 112 Termination benefits4 (226) (372)
1 2015 includes R1 012 million relating to the liquidation of a foreign subsidiary. 2 Relating to the ECC acquisition. 3 Sale of the Inyanda operation in 2016 and the NCC operation in 2015 (refer note 7.1). 4 Voluntary severance package costs and other termination costs incurred and accrued for.
Page 12

Exxaro year end results dec 20169. IMPAIRMENT CHARGES OF NON‐CURRENT ASSETS FerroAlloys operation Impairment charges, net of tax 73 ‐ Property, plant and equipment 100 ‐ Tax effect (27) ECC Impairment charges, net of tax 1 524 ‐ Goodwill 1 524 Reductants operation Impairment charges, net of tax 162 ‐ Property, plant and equipment 225 ‐ Tax effect (63) Net impairment charges per statement of comprehensive income 100 1 749 Net tax effect (27) (63) Net effect on attributable earnings 73 1 686 FerroAlloys operation The ferrosilicon plant was expanded during 2013/4 which led to a material increase in production capacity on commissioning. This expansion project was in line with Exxaro’s strategy and expected increased demand from customers. During 2016, one of the major customers was put into business rescue and another major customer gave notice to terminate the current supply agreement on 31 December 2018.
FerroAlloys has been engaged in product diversification, promotions and test campaigns at various plants and markets. Although some interest was shown in the product and positive test results were obtained, it is not possible to determine growth in the new market. The significant lower demand from current customers and the prospects of securing new customers for the ferrosilicon product has been identified as an impairment indicator (according to IFRS) and as a result an impairment assessment was performed at 31 December 2016. The ferrosilicon plant was fully impaired (R100 million) on 31 December 2016.
ECC Exxaro acquired TCSA on 20 August 2015 and renamed it ECC. The PPA was completed and goodwill of R1 524 million was recognised at acquisition. The goodwill was assessed for impairment on 31 December 2015 and was fully impaired on that date.
Reductants operation The decline in demand, lower FeCr prices and rising production costs drastically impacted local producers. This, coupled with continued declining imported semi‐coke and cheaper market coke prices resulted in producers increasing market coke usage and further reducing semi‐coke demand. The char plant was fully impaired in 2015 based on the cessation of production. For the year ended 31 December 2016 2015 Reviewed Audited Rm Rm 10. NET FINANCING COSTS Total finance income 229 102 ‐ Interest income 218 91 ‐ Finance lease interest income 11 11 Total finance costs (857) (770) ‐ Interest expense (496) (546) ‐ Unwinding of discount rate on rehabilitation cost (347) (220) ‐ Finance lease interest expense (5) ‐ Amortisation of transaction costs (25) (10) ‐ Borrowing costs capitalised1 16 6 Total net financing costs (628) (668)
Page 13
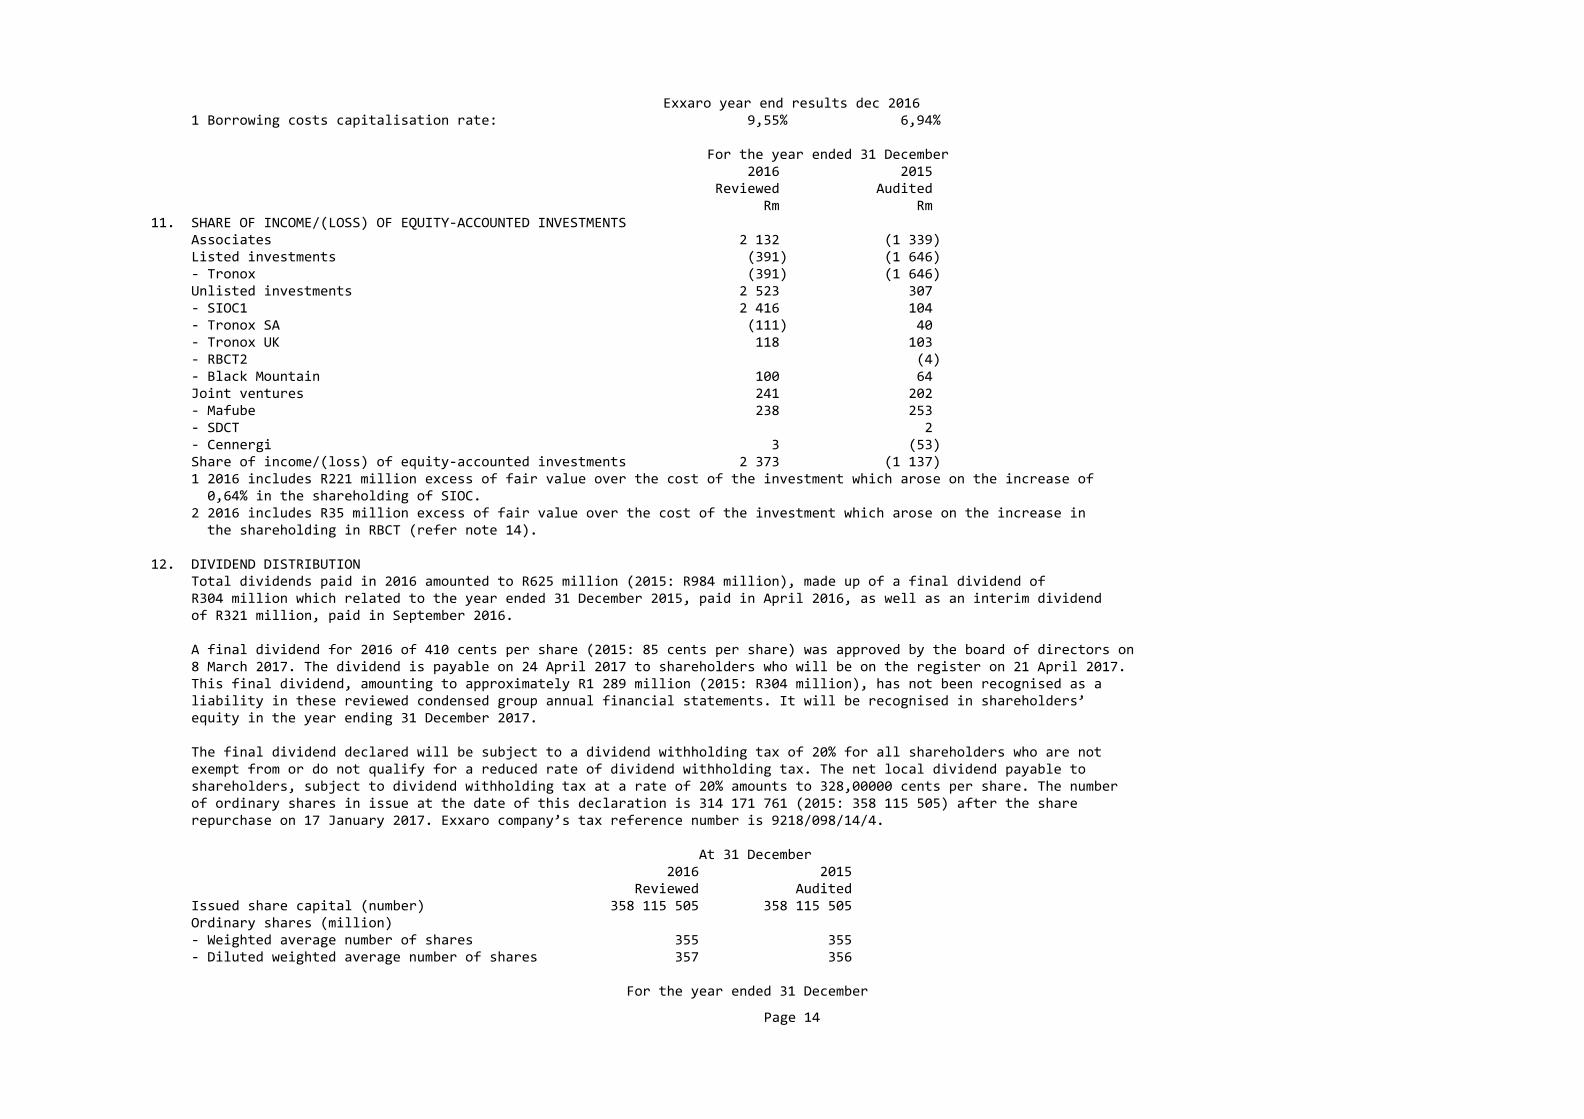
Exxaro year end results dec 2016 1 Borrowing costs capitalisation rate: 9,55% 6,94% For the year ended 31 December 2016 2015 Reviewed Audited Rm Rm 11. SHARE OF INCOME/(LOSS) OF EQUITY‐ACCOUNTED INVESTMENTS Associates 2 132 (1 339) Listed investments (391) (1 646) ‐ Tronox (391) (1 646) Unlisted investments 2 523 307 ‐ SIOC1 2 416 104 ‐ Tronox SA (111) 40 ‐ Tronox UK 118 103 ‐ RBCT2 (4) ‐ Black Mountain 100 64 Joint ventures 241 202 ‐ Mafube 238 253 ‐ SDCT 2 ‐ Cennergi 3 (53) Share of income/(loss) of equity‐accounted investments 2 373 (1 137) 1 2016 includes R221 million excess of fair value over the cost of the investment which arose on the increase of 0,64% in the shareholding of SIOC. 2 2016 includes R35 million excess of fair value over the cost of the investment which arose on the increase in the shareholding in RBCT (refer note 14).
12. DIVIDEND DISTRIBUTION Total dividends paid in 2016 amounted to R625 million (2015: R984 million), made up of a final dividend of R304 million which related to the year ended 31 December 2015, paid in April 2016, as well as an interim dividend of R321 million, paid in September 2016.
A final dividend for 2016 of 410 cents per share (2015: 85 cents per share) was approved by the board of directors on 8 March 2017. The dividend is payable on 24 April 2017 to shareholders who will be on the register on 21 April 2017. This final dividend, amounting to approximately R1 289 million (2015: R304 million), has not been recognised as a liability in these reviewed condensed group annual financial statements. It will be recognised in shareholders’ equity in the year ending 31 December 2017.
The final dividend declared will be subject to a dividend withholding tax of 20% for all shareholders who are not exempt from or do not qualify for a reduced rate of dividend withholding tax. The net local dividend payable to shareholders, subject to dividend withholding tax at a rate of 20% amounts to 328,00000 cents per share. The number of ordinary shares in issue at the date of this declaration is 314 171 761 (2015: 358 115 505) after the share repurchase on 17 January 2017. Exxaro company’s tax reference number is 9218/098/14/4.
At 31 December 2016 2015 Reviewed Audited Issued share capital (number) 358 115 505 358 115 505 Ordinary shares (million) ‐ Weighted average number of shares 355 355 ‐ Diluted weighted average number of shares 357 356 For the year ended 31 December
Page 14
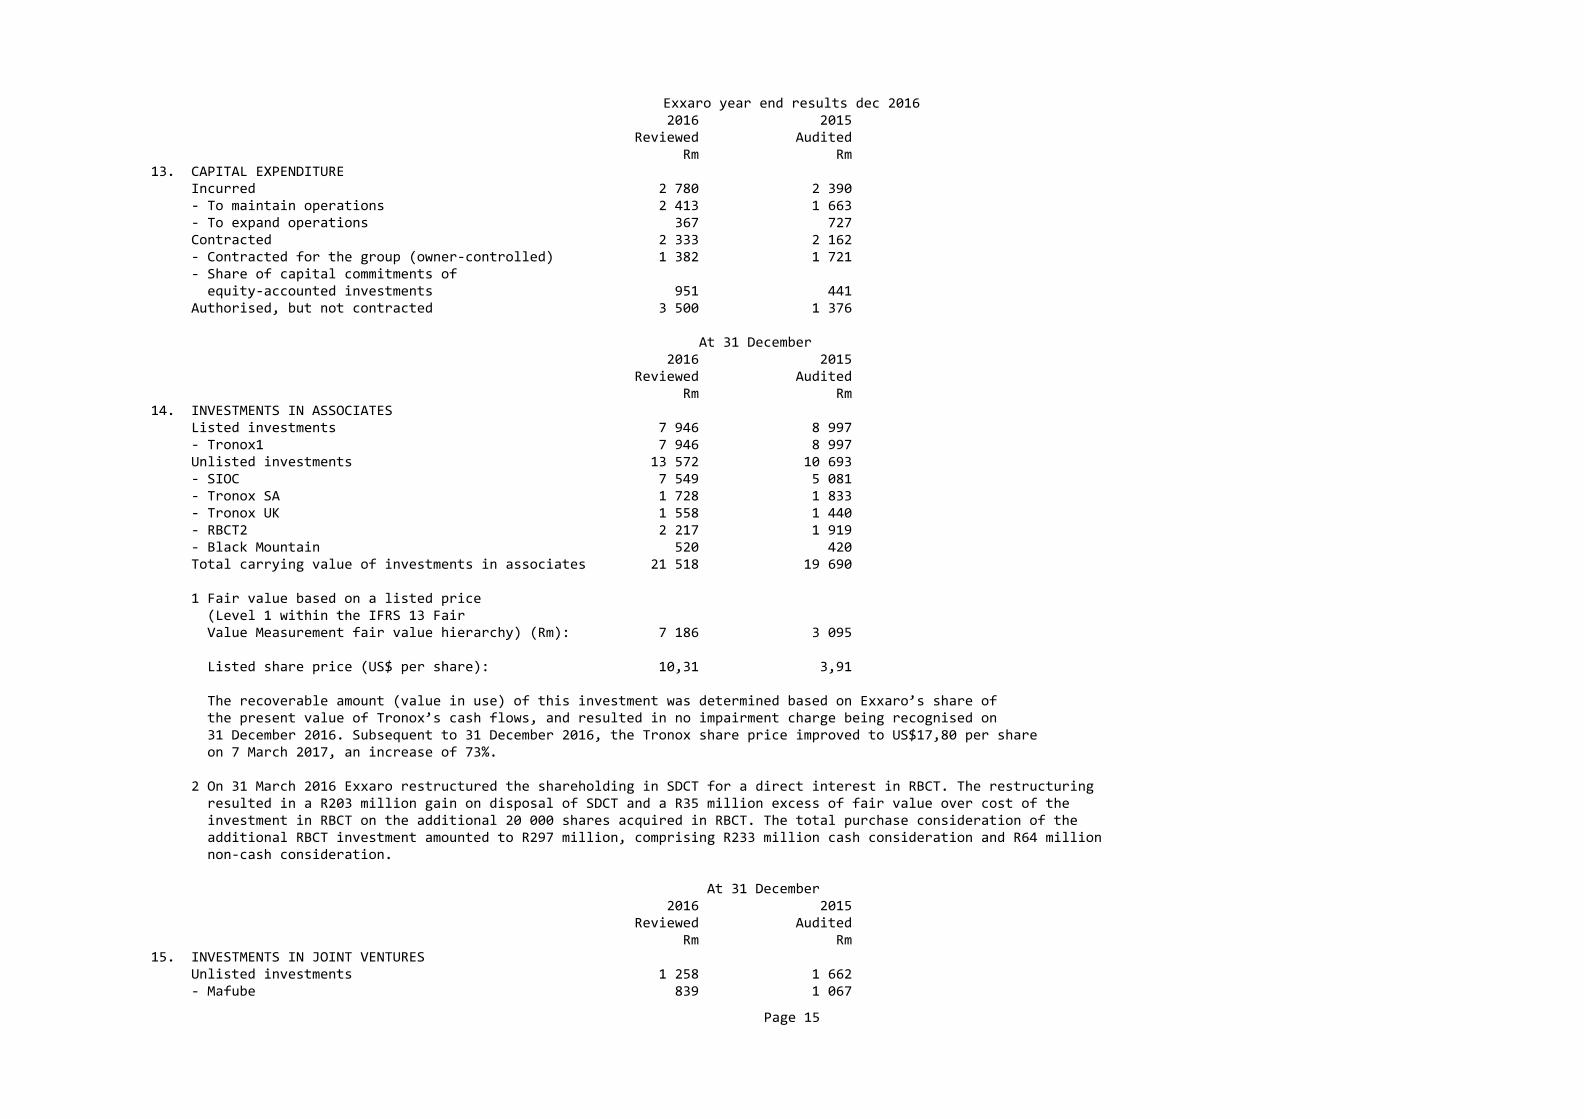
Exxaro year end results dec 2016 2016 2015 Reviewed Audited Rm Rm 13. CAPITAL EXPENDITURE Incurred 2 780 2 390 ‐ To maintain operations 2 413 1 663 ‐ To expand operations 367 727 Contracted 2 333 2 162 ‐ Contracted for the group (owner‐controlled) 1 382 1 721 ‐ Share of capital commitments of equity‐accounted investments 951 441 Authorised, but not contracted 3 500 1 376 At 31 December 2016 2015 Reviewed Audited Rm Rm 14. INVESTMENTS IN ASSOCIATES Listed investments 7 946 8 997 ‐ Tronox1 7 946 8 997 Unlisted investments 13 572 10 693 ‐ SIOC 7 549 5 081 ‐ Tronox SA 1 728 1 833 ‐ Tronox UK 1 558 1 440 ‐ RBCT2 2 217 1 919 ‐ Black Mountain 520 420 Total carrying value of investments in associates 21 518 19 690
1 Fair value based on a listed price (Level 1 within the IFRS 13 Fair Value Measurement fair value hierarchy) (Rm): 7 186 3 095
Listed share price (US$ per share): 10,31 3,91
The recoverable amount (value in use) of this investment was determined based on Exxaro’s share of the present value of Tronox’s cash flows, and resulted in no impairment charge being recognised on 31 December 2016. Subsequent to 31 December 2016, the Tronox share price improved to US$17,80 per share on 7 March 2017, an increase of 73%.
2 On 31 March 2016 Exxaro restructured the shareholding in SDCT for a direct interest in RBCT. The restructuring resulted in a R203 million gain on disposal of SDCT and a R35 million excess of fair value over cost of the investment in RBCT on the additional 20 000 shares acquired in RBCT. The total purchase consideration of the additional RBCT investment amounted to R297 million, comprising R233 million cash consideration and R64 million non‐cash consideration. At 31 December 2016 2015 Reviewed Audited Rm Rm 15. INVESTMENTS IN JOINT VENTURES Unlisted investments 1 258 1 662 ‐ Mafube 839 1 067
Page 15
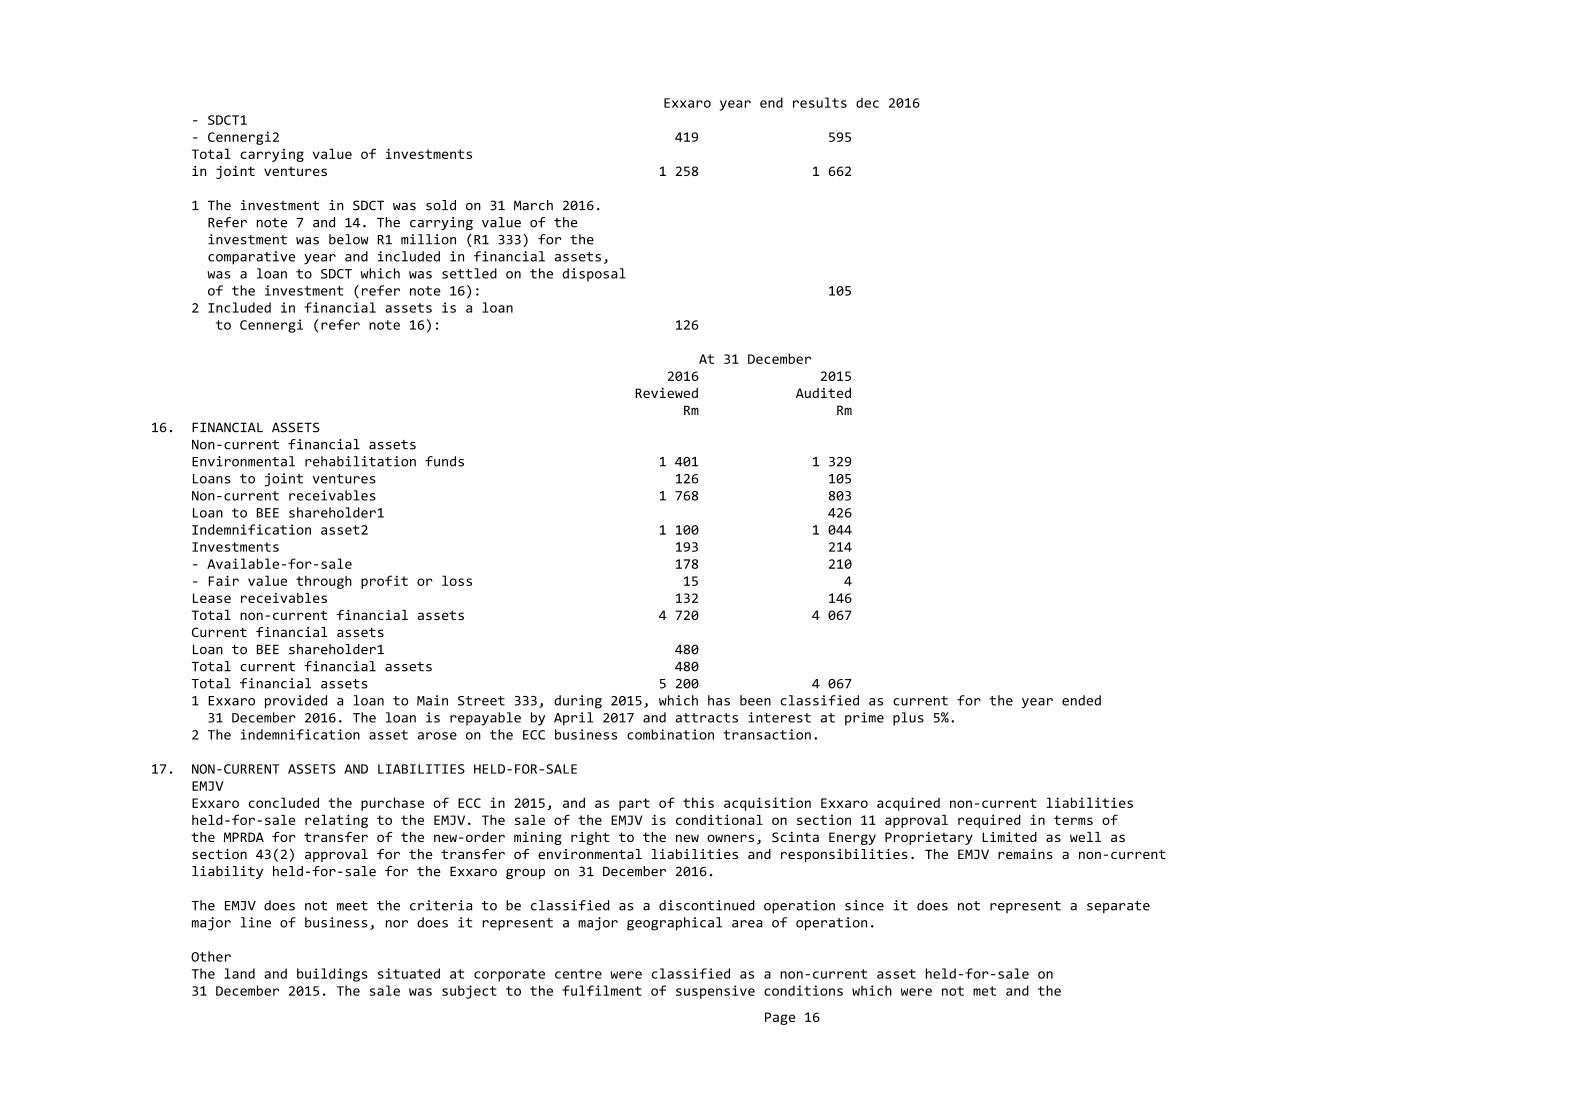
Exxaro year end results dec 2016 ‐ SDCT1 ‐ Cennergi2 419 595 Total carrying value of investments in joint ventures 1 258 1 662
1 The investment in SDCT was sold on 31 March 2016. Refer note 7 and 14. The carrying value of the investment was below R1 million (R1 333) for the comparative year and included in financial assets, was a loan to SDCT which was settled on the disposal of the investment (refer note 16): 105 2 Included in financial assets is a loan to Cennergi (refer note 16): 126 At 31 December 2016 2015 Reviewed Audited Rm Rm 16. FINANCIAL ASSETS Non‐current financial assets Environmental rehabilitation funds 1 401 1 329 Loans to joint ventures 126 105 Non‐current receivables 1 768 803 Loan to BEE shareholder1 426 Indemnification asset2 1 100 1 044 Investments 193 214 ‐ Available‐for‐sale 178 210 ‐ Fair value through profit or loss 15 4 Lease receivables 132 146 Total non‐current financial assets 4 720 4 067 Current financial assets Loan to BEE shareholder1 480 Total current financial assets 480 Total financial assets 5 200 4 067 1 Exxaro provided a loan to Main Street 333, during 2015, which has been classified as current for the year ended 31 December 2016. The loan is repayable by April 2017 and attracts interest at prime plus 5%. 2 The indemnification asset arose on the ECC business combination transaction.
17. NON‐CURRENT ASSETS AND LIABILITIES HELD‐FOR‐SALE EMJV Exxaro concluded the purchase of ECC in 2015, and as part of this acquisition Exxaro acquired non‐current liabilities held‐for‐sale relating to the EMJV. The sale of the EMJV is conditional on section 11 approval required in terms of the MPRDA for transfer of the new‐order mining right to the new owners, Scinta Energy Proprietary Limited as well as section 43(2) approval for the transfer of environmental liabilities and responsibilities. The EMJV remains a non‐current liability held‐for‐sale for the Exxaro group on 31 December 2016.
The EMJV does not meet the criteria to be classified as a discontinued operation since it does not represent a separate major line of business, nor does it represent a major geographical area of operation.
Other The land and buildings situated at corporate centre were classified as a non‐current asset held‐for‐sale on 31 December 2015. The sale was subject to the fulfilment of suspensive conditions which were not met and the
Page 16
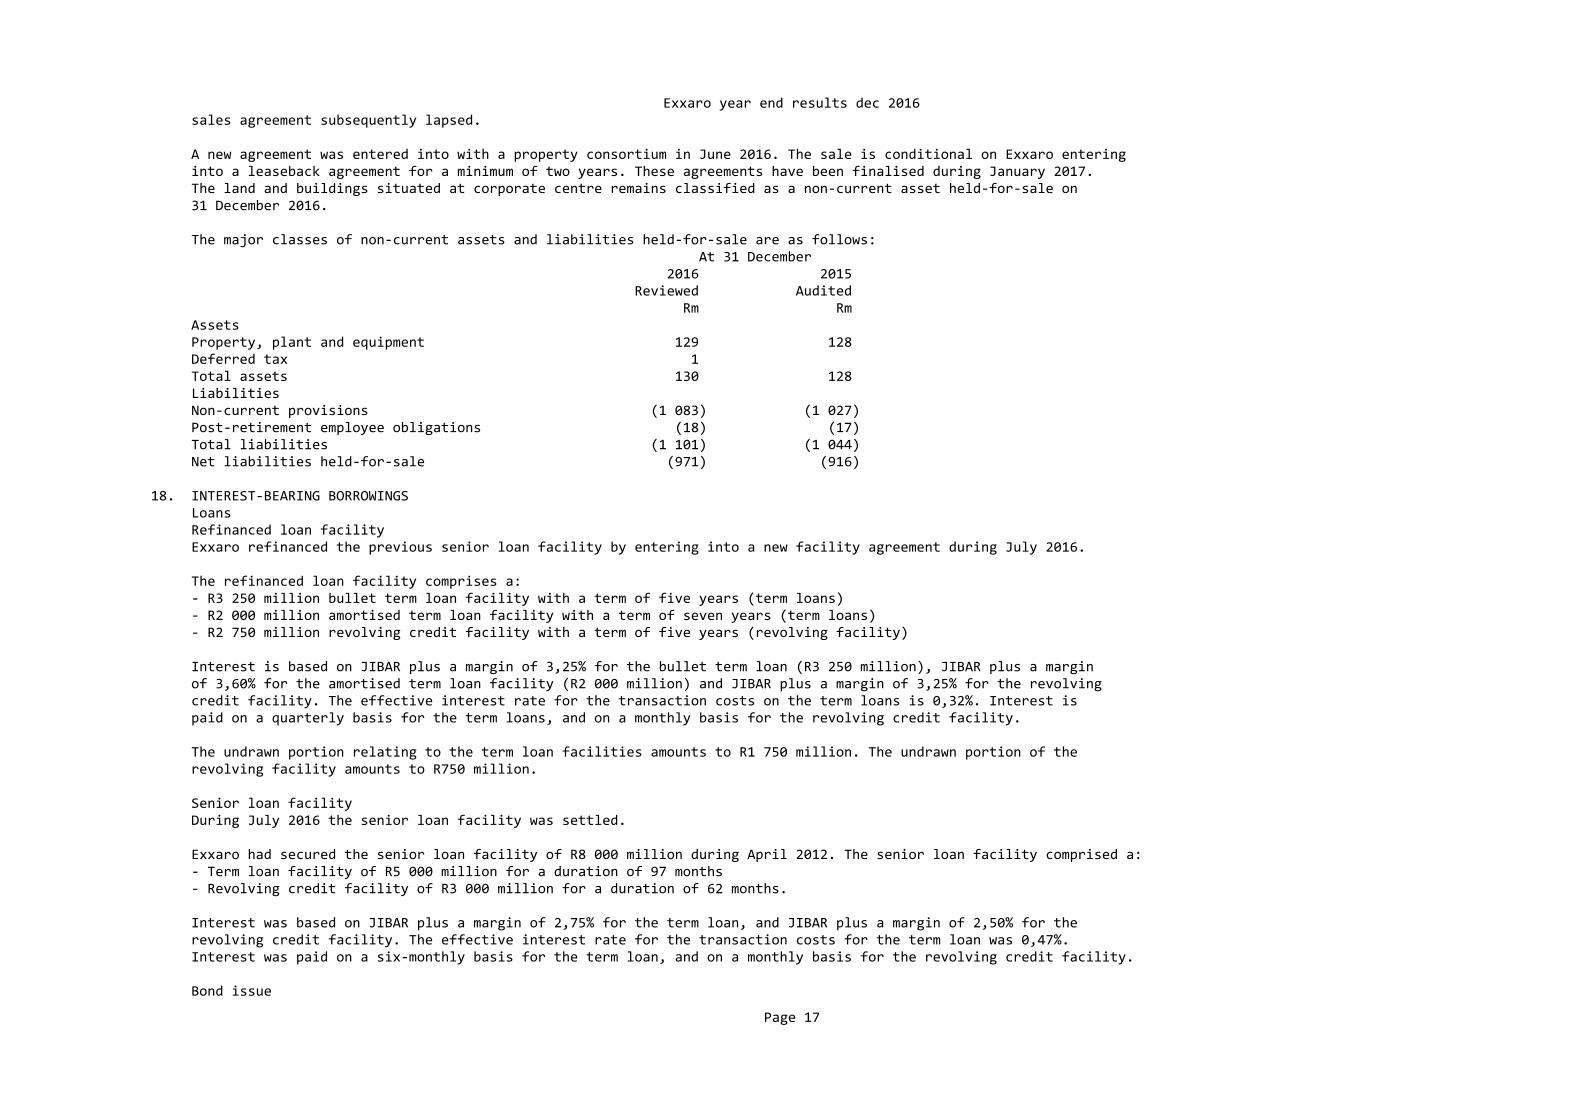
Exxaro year end results dec 2016 sales agreement subsequently lapsed.
A new agreement was entered into with a property consortium in June 2016. The sale is conditional on Exxaro entering into a leaseback agreement for a minimum of two years. These agreements have been finalised during January 2017. The land and buildings situated at corporate centre remains classified as a non‐current asset held‐for‐sale on 31 December 2016. The major classes of non‐current assets and liabilities held‐for‐sale are as follows: At 31 December 2016 2015 Reviewed Audited Rm Rm Assets Property, plant and equipment 129 128 Deferred tax 1 Total assets 130 128 Liabilities Non‐current provisions (1 083) (1 027) Post‐retirement employee obligations (18) (17) Total liabilities (1 101) (1 044) Net liabilities held‐for‐sale (971) (916)
18. INTEREST‐BEARING BORROWINGS Loans Refinanced loan facility Exxaro refinanced the previous senior loan facility by entering into a new facility agreement during July 2016.
The refinanced loan facility comprises a: ‐ R3 250 million bullet term loan facility with a term of five years (term loans) ‐ R2 000 million amortised term loan facility with a term of seven years (term loans) ‐ R2 750 million revolving credit facility with a term of five years (revolving facility)
Interest is based on JIBAR plus a margin of 3,25% for the bullet term loan (R3 250 million), JIBAR plus a margin of 3,60% for the amortised term loan facility (R2 000 million) and JIBAR plus a margin of 3,25% for the revolving credit facility. The effective interest rate for the transaction costs on the term loans is 0,32%. Interest is paid on a quarterly basis for the term loans, and on a monthly basis for the revolving credit facility.
The undrawn portion relating to the term loan facilities amounts to R1 750 million. The undrawn portion of the revolving facility amounts to R750 million. Senior loan facility During July 2016 the senior loan facility was settled.
Exxaro had secured the senior loan facility of R8 000 million during April 2012. The senior loan facility comprised a: ‐ Term loan facility of R5 000 million for a duration of 97 months ‐ Revolving credit facility of R3 000 million for a duration of 62 months.
Interest was based on JIBAR plus a margin of 2,75% for the term loan, and JIBAR plus a margin of 2,50% for the revolving credit facility. The effective interest rate for the transaction costs for the term loan was 0,47%. Interest was paid on a six‐monthly basis for the term loan, and on a monthly basis for the revolving credit facility.
Bond issue
Page 17
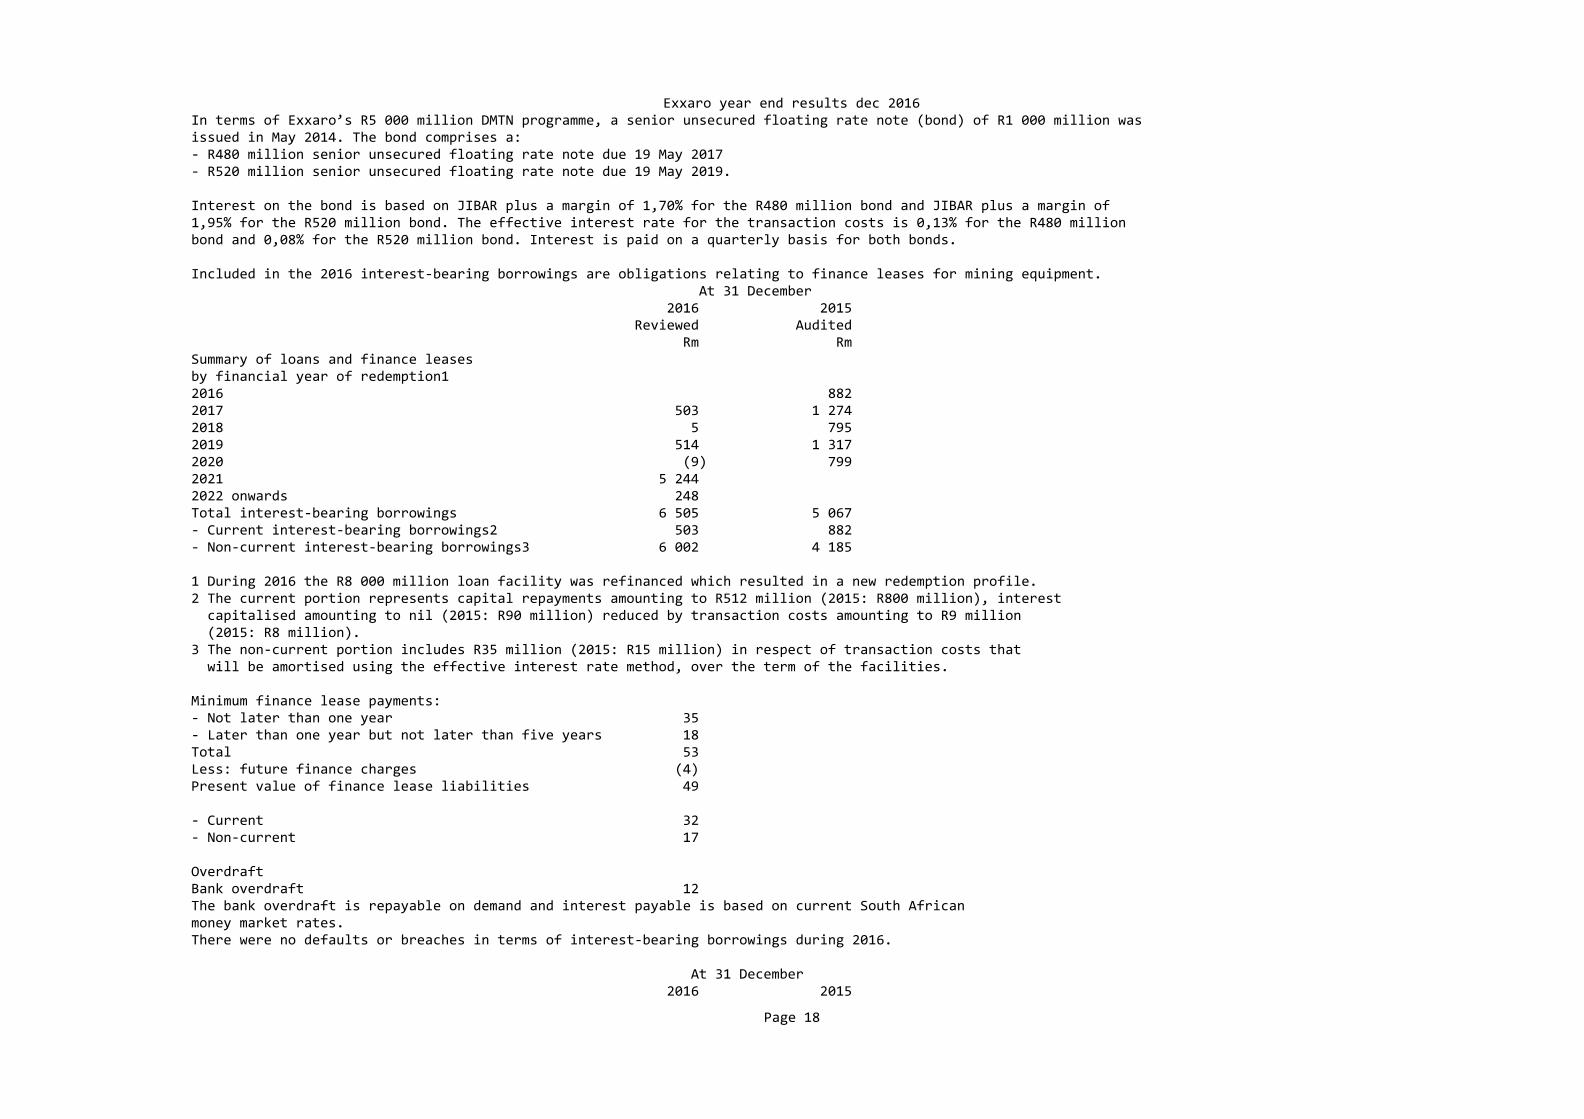
Exxaro year end results dec 2016 In terms of Exxaro’s R5 000 million DMTN programme, a senior unsecured floating rate note (bond) of R1 000 million was issued in May 2014. The bond comprises a: ‐ R480 million senior unsecured floating rate note due 19 May 2017 ‐ R520 million senior unsecured floating rate note due 19 May 2019.
Interest on the bond is based on JIBAR plus a margin of 1,70% for the R480 million bond and JIBAR plus a margin of 1,95% for the R520 million bond. The effective interest rate for the transaction costs is 0,13% for the R480 million bond and 0,08% for the R520 million bond. Interest is paid on a quarterly basis for both bonds. Included in the 2016 interest‐bearing borrowings are obligations relating to finance leases for mining equipment. At 31 December 2016 2015 Reviewed Audited Rm Rm Summary of loans and finance leases by financial year of redemption1 2016 882 2017 503 1 274 2018 5 795 2019 514 1 317 2020 (9) 799 2021 5 244 2022 onwards 248 Total interest‐bearing borrowings 6 505 5 067 ‐ Current interest‐bearing borrowings2 503 882 ‐ Non‐current interest‐bearing borrowings3 6 002 4 185 1 During 2016 the R8 000 million loan facility was refinanced which resulted in a new redemption profile. 2 The current portion represents capital repayments amounting to R512 million (2015: R800 million), interest capitalised amounting to nil (2015: R90 million) reduced by transaction costs amounting to R9 million (2015: R8 million). 3 The non‐current portion includes R35 million (2015: R15 million) in respect of transaction costs that will be amortised using the effective interest rate method, over the term of the facilities.
Minimum finance lease payments: ‐ Not later than one year 35 ‐ Later than one year but not later than five years 18 Total 53 Less: future finance charges (4) Present value of finance lease liabilities 49 ‐ Current 32 ‐ Non‐current 17 Overdraft Bank overdraft 12 The bank overdraft is repayable on demand and interest payable is based on current South African money market rates. There were no defaults or breaches in terms of interest‐bearing borrowings during 2016. At 31 December 2016 2015
Page 18
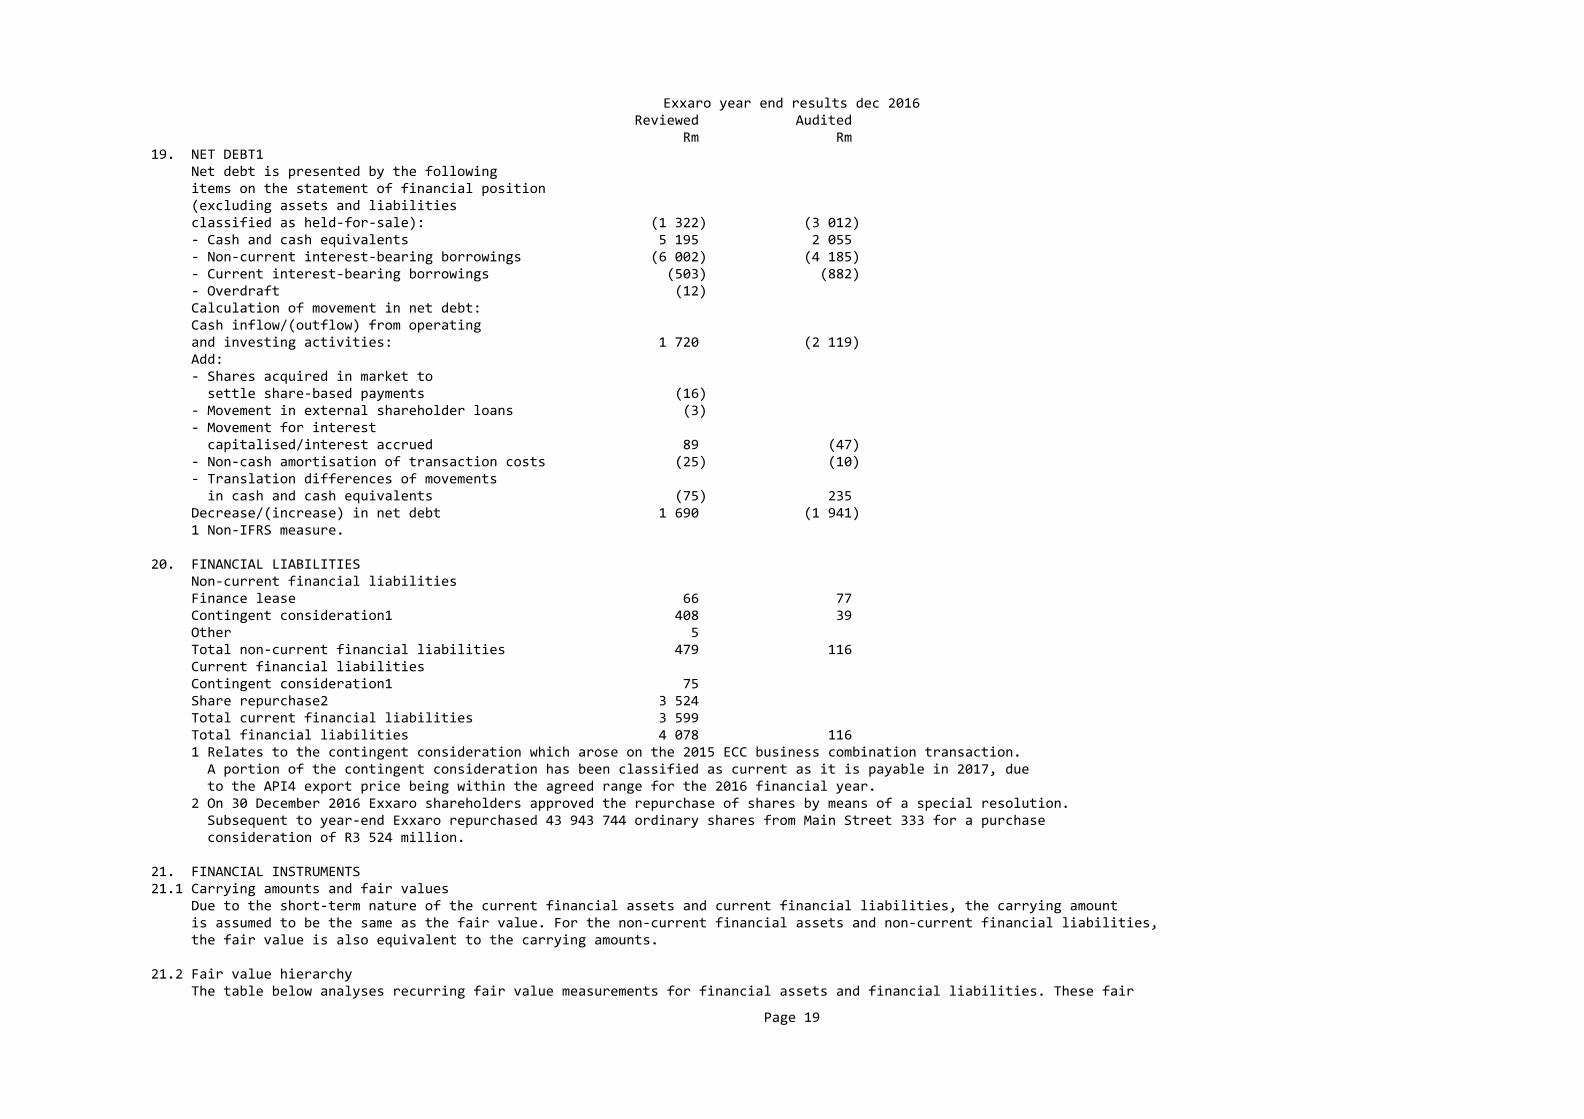
Exxaro year end results dec 2016 Reviewed Audited Rm Rm 19. NET DEBT1 Net debt is presented by the following items on the statement of financial position (excluding assets and liabilities classified as held‐for‐sale): (1 322) (3 012) ‐ Cash and cash equivalents 5 195 2 055 ‐ Non‐current interest‐bearing borrowings (6 002) (4 185) ‐ Current interest‐bearing borrowings (503) (882) ‐ Overdraft (12) Calculation of movement in net debt: Cash inflow/(outflow) from operating and investing activities: 1 720 (2 119) Add: ‐ Shares acquired in market to settle share‐based payments (16) ‐ Movement in external shareholder loans (3) ‐ Movement for interest capitalised/interest accrued 89 (47) ‐ Non‐cash amortisation of transaction costs (25) (10) ‐ Translation differences of movements in cash and cash equivalents (75) 235 Decrease/(increase) in net debt 1 690 (1 941) 1 Non‐IFRS measure.
20. FINANCIAL LIABILITIES Non‐current financial liabilities Finance lease 66 77 Contingent consideration1 408 39 Other 5 Total non‐current financial liabilities 479 116 Current financial liabilities Contingent consideration1 75 Share repurchase2 3 524 Total current financial liabilities 3 599 Total financial liabilities 4 078 116 1 Relates to the contingent consideration which arose on the 2015 ECC business combination transaction. A portion of the contingent consideration has been classified as current as it is payable in 2017, due to the API4 export price being within the agreed range for the 2016 financial year. 2 On 30 December 2016 Exxaro shareholders approved the repurchase of shares by means of a special resolution. Subsequent to year‐end Exxaro repurchased 43 943 744 ordinary shares from Main Street 333 for a purchase consideration of R3 524 million. 21. FINANCIAL INSTRUMENTS 21.1 Carrying amounts and fair values Due to the short‐term nature of the current financial assets and current financial liabilities, the carrying amount is assumed to be the same as the fair value. For the non‐current financial assets and non‐current financial liabilities, the fair value is also equivalent to the carrying amounts.
21.2 Fair value hierarchy The table below analyses recurring fair value measurements for financial assets and financial liabilities. These fair
Page 19
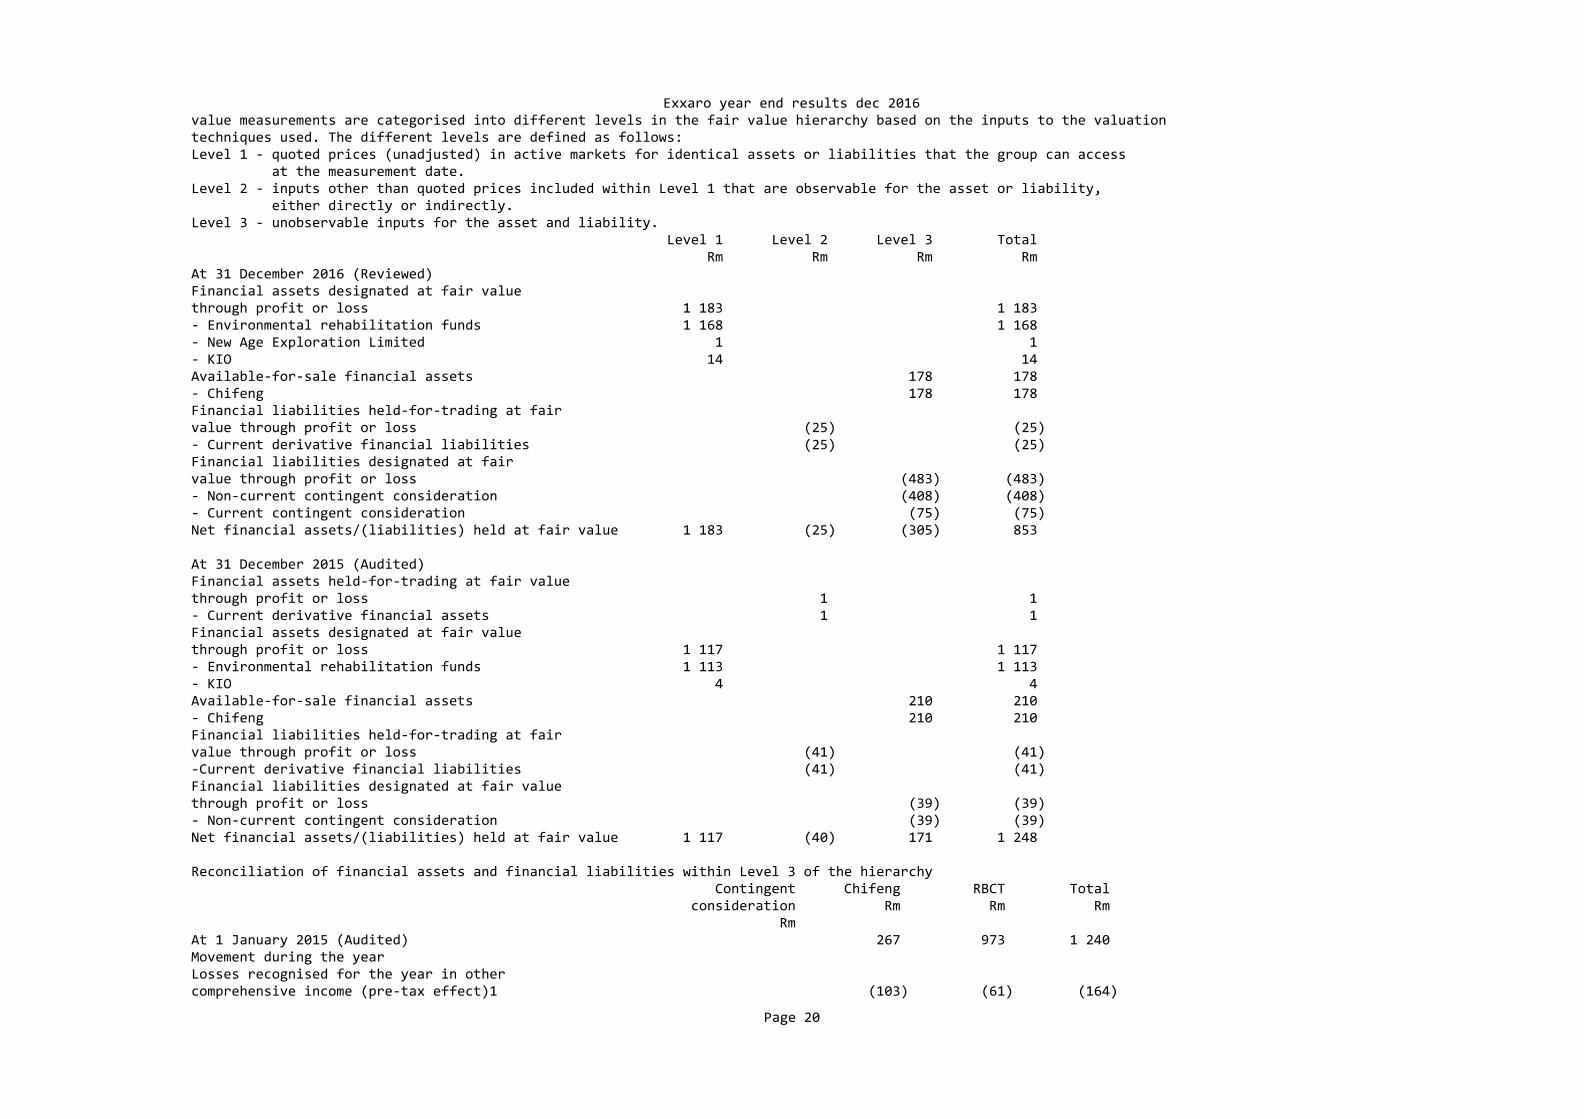
Exxaro year end results dec 2016 value measurements are categorised into different levels in the fair value hierarchy based on the inputs to the valuation techniques used. The different levels are defined as follows: Level 1 ‐ quoted prices (unadjusted) in active markets for identical assets or liabilities that the group can access at the measurement date. Level 2 ‐ inputs other than quoted prices included within Level 1 that are observable for the asset or liability, either directly or indirectly. Level 3 ‐ unobservable inputs for the asset and liability. Level 1 Level 2 Level 3 Total Rm Rm Rm Rm At 31 December 2016 (Reviewed) Financial assets designated at fair value through profit or loss 1 183 1 183 ‐ Environmental rehabilitation funds 1 168 1 168 ‐ New Age Exploration Limited 1 1 ‐ KIO 14 14 Available‐for‐sale financial assets 178 178 ‐ Chifeng 178 178 Financial liabilities held‐for‐trading at fair value through profit or loss (25) (25) ‐ Current derivative financial liabilities (25) (25) Financial liabilities designated at fair value through profit or loss (483) (483) ‐ Non‐current contingent consideration (408) (408) ‐ Current contingent consideration (75) (75) Net financial assets/(liabilities) held at fair value 1 183 (25) (305) 853 At 31 December 2015 (Audited) Financial assets held‐for‐trading at fair value through profit or loss 1 1 ‐ Current derivative financial assets 1 1 Financial assets designated at fair value through profit or loss 1 117 1 117 ‐ Environmental rehabilitation funds 1 113 1 113 ‐ KIO 4 4 Available‐for‐sale financial assets 210 210 ‐ Chifeng 210 210 Financial liabilities held‐for‐trading at fair value through profit or loss (41) (41) ‐Current derivative financial liabilities (41) (41) Financial liabilities designated at fair value through profit or loss (39) (39) ‐ Non‐current contingent consideration (39) (39) Net financial assets/(liabilities) held at fair value 1 117 (40) 171 1 248 Reconciliation of financial assets and financial liabilities within Level 3 of the hierarchy Contingent Chifeng RBCT Total consideration Rm Rm Rm Rm At 1 January 2015 (Audited) 267 973 1 240 Movement during the year Losses recognised for the year in other comprehensive income (pre‐tax effect)1 (103) (61) (164)
Page 20
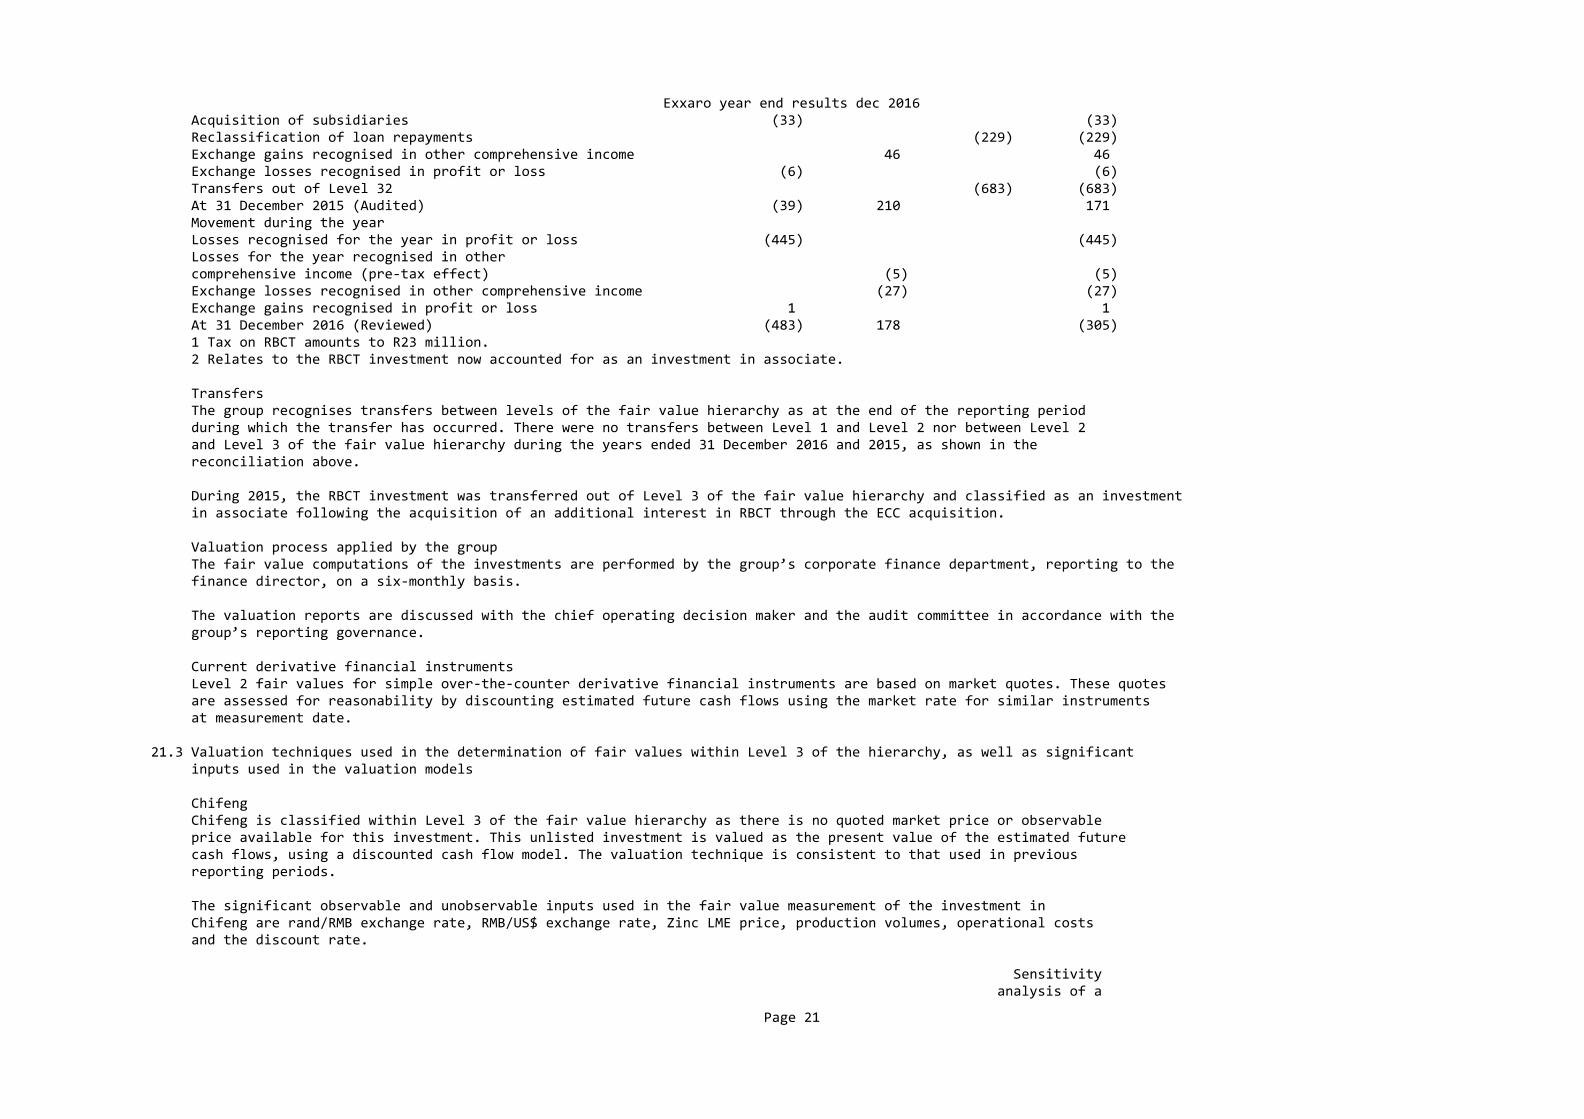
Exxaro year end results dec 2016 Acquisition of subsidiaries (33) (33) Reclassification of loan repayments (229) (229) Exchange gains recognised in other comprehensive income 46 46 Exchange losses recognised in profit or loss (6) (6) Transfers out of Level 32 (683) (683) At 31 December 2015 (Audited) (39) 210 171 Movement during the year Losses recognised for the year in profit or loss (445) (445) Losses for the year recognised in other comprehensive income (pre‐tax effect) (5) (5) Exchange losses recognised in other comprehensive income (27) (27) Exchange gains recognised in profit or loss 1 1 At 31 December 2016 (Reviewed) (483) 178 (305) 1 Tax on RBCT amounts to R23 million. 2 Relates to the RBCT investment now accounted for as an investment in associate.
Transfers The group recognises transfers between levels of the fair value hierarchy as at the end of the reporting period during which the transfer has occurred. There were no transfers between Level 1 and Level 2 nor between Level 2 and Level 3 of the fair value hierarchy during the years ended 31 December 2016 and 2015, as shown in the reconciliation above.
During 2015, the RBCT investment was transferred out of Level 3 of the fair value hierarchy and classified as an investment in associate following the acquisition of an additional interest in RBCT through the ECC acquisition.
Valuation process applied by the group The fair value computations of the investments are performed by the group’s corporate finance department, reporting to the finance director, on a six‐monthly basis.
The valuation reports are discussed with the chief operating decision maker and the audit committee in accordance with the group’s reporting governance.
Current derivative financial instruments Level 2 fair values for simple over‐the‐counter derivative financial instruments are based on market quotes. These quotes are assessed for reasonability by discounting estimated future cash flows using the market rate for similar instruments at measurement date. 21.3 Valuation techniques used in the determination of fair values within Level 3 of the hierarchy, as well as significant inputs used in the valuation models
Chifeng Chifeng is classified within Level 3 of the fair value hierarchy as there is no quoted market price or observable price available for this investment. This unlisted investment is valued as the present value of the estimated future cash flows, using a discounted cash flow model. The valuation technique is consistent to that used in previous reporting periods.
The significant observable and unobservable inputs used in the fair value measurement of the investment in Chifeng are rand/RMB exchange rate, RMB/US$ exchange rate, Zinc LME price, production volumes, operational costs and the discount rate.
Sensitivity analysis of a
Page 21

Exxaro year end results dec 2016 10% increase Sensitivity of in the inputs is inputs and fair demonstrated value below2 At 31 December 2016 (Reviewed) Inputs measurement1 Rm Observable inputs Rand/RMB exchange rate R1,96/RMB1 Strengthening of 18 the rand to the RMB RMB/US$ exchange rate RMB6,52 Strengthening of 158 to RMB7,13/US$1 the RMB to the US$ Zinc LME price (US$ per tonne in real terms) US$2 026 to Increase in 158 US$2 113 price of zinc concentrate Unobservable inputs Production volumes (tonnes) 85 000 tonnes Increase in 33 production volumes Operational costs (US$ million per annum in real terms) US$58,97 to Decrease in (129) US$74,38 operations costs Discount rate (%) 11,23% Decrease in the (15) discount rate 1 Change in observable/unobservable input which will result in an increase in the fair value measurement. 2 A 10% decrease in the respective inputs would have an equal but opposite effect on the above, on the basis that all other variables remain constant. Sensitivity analysis of a 10% increase Sensitivity of in the inputs is inputs and fair demonstrated value below2 At 31 December 2015 (Audited) Inputs measurement1 Rm Observable inputs Rand/RMB exchange rate R2,31/RMB1 Strengthening of 21 the rand to the RMB RMB/US$ exchange rate RMB6,26 to Strengthening of 203 RMB7,12/US$1 the RMB to the US$ Zinc LME price (US$ per tonne in real terms) US$1 611 to Increase in 203 US$2 200 price of zinc concentrate Unobservable inputs Production volumes (tonnes) 85 000 tonnes Increase in 31 production volumes Operational costs (US$ million per annum in real terms) US$56,94 Decrease in (173) to US$75,22 operations costs
Page 22
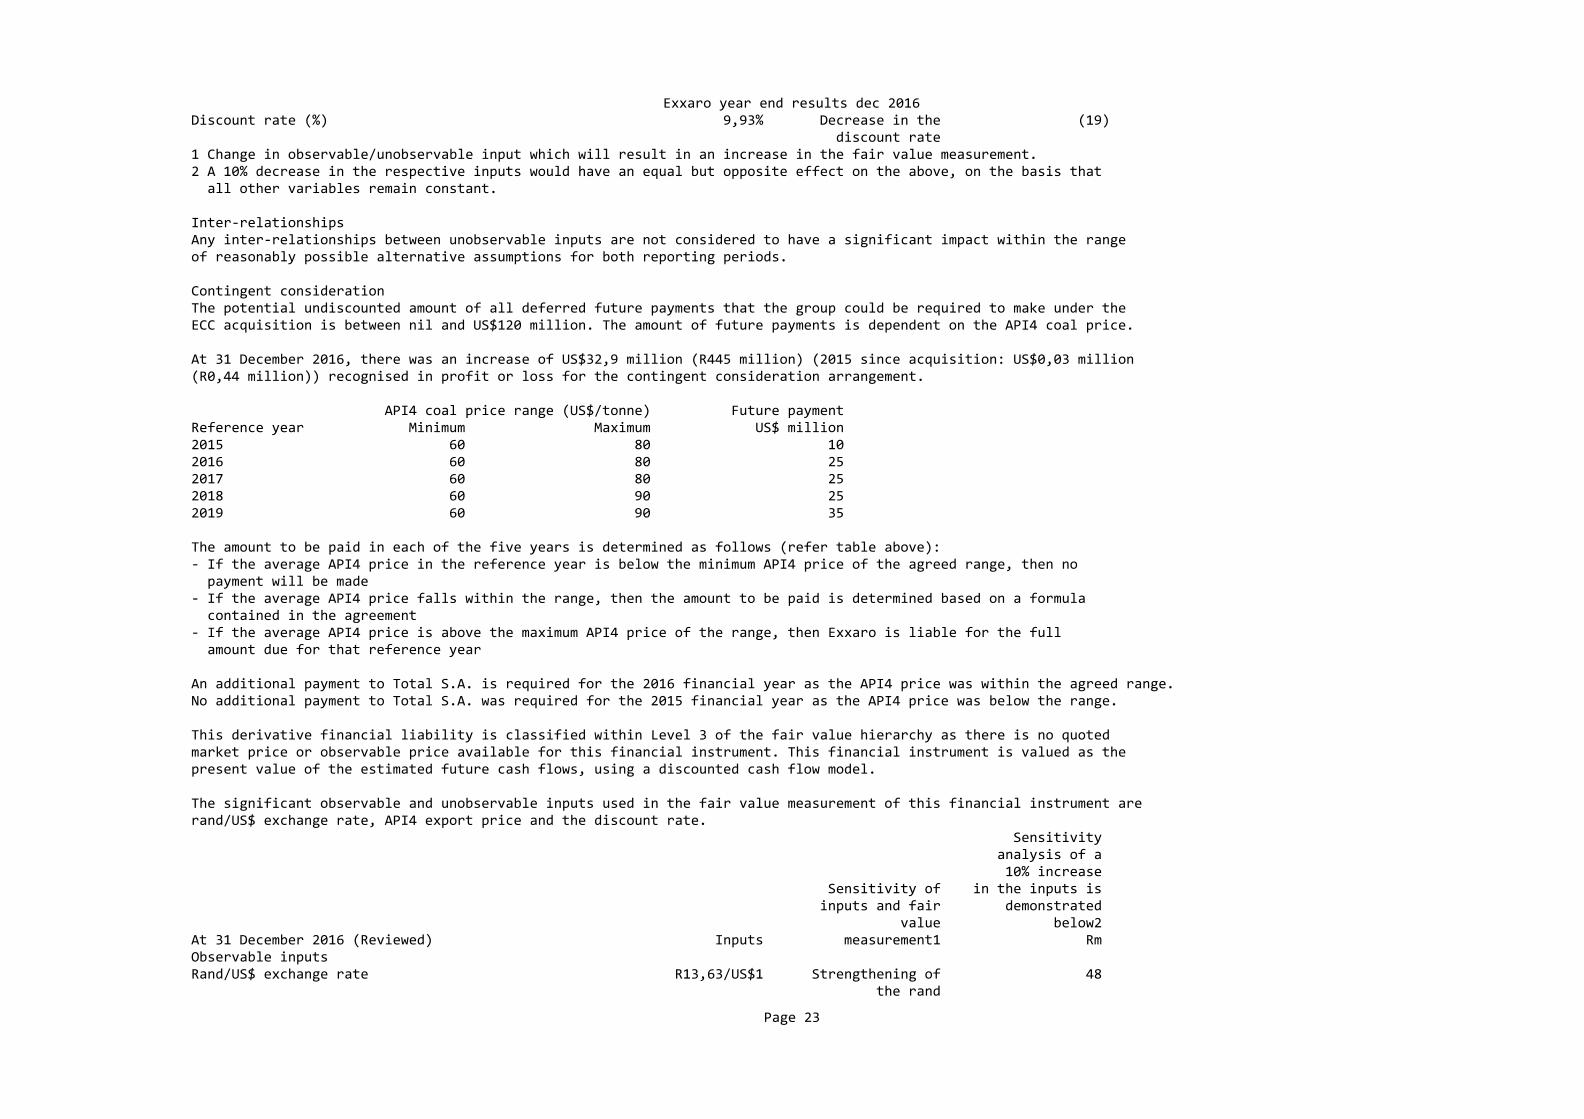
Exxaro year end results dec 2016 Discount rate (%) 9,93% Decrease in the (19) discount rate 1 Change in observable/unobservable input which will result in an increase in the fair value measurement. 2 A 10% decrease in the respective inputs would have an equal but opposite effect on the above, on the basis that all other variables remain constant.
Inter‐relationships Any inter‐relationships between unobservable inputs are not considered to have a significant impact within the range of reasonably possible alternative assumptions for both reporting periods.
Contingent consideration The potential undiscounted amount of all deferred future payments that the group could be required to make under the ECC acquisition is between nil and US$120 million. The amount of future payments is dependent on the API4 coal price.
At 31 December 2016, there was an increase of US$32,9 million (R445 million) (2015 since acquisition: US$0,03 million (R0,44 million)) recognised in profit or loss for the contingent consideration arrangement.
API4 coal price range (US$/tonne) Future payment Reference year Minimum Maximum US$ million 2015 60 80 10 2016 60 80 25 2017 60 80 25 2018 60 90 25 2019 60 90 35 The amount to be paid in each of the five years is determined as follows (refer table above): ‐ If the average API4 price in the reference year is below the minimum API4 price of the agreed range, then no payment will be made ‐ If the average API4 price falls within the range, then the amount to be paid is determined based on a formula contained in the agreement ‐ If the average API4 price is above the maximum API4 price of the range, then Exxaro is liable for the full amount due for that reference year
An additional payment to Total S.A. is required for the 2016 financial year as the API4 price was within the agreed range. No additional payment to Total S.A. was required for the 2015 financial year as the API4 price was below the range.
This derivative financial liability is classified within Level 3 of the fair value hierarchy as there is no quoted market price or observable price available for this financial instrument. This financial instrument is valued as the present value of the estimated future cash flows, using a discounted cash flow model.
The significant observable and unobservable inputs used in the fair value measurement of this financial instrument are rand/US$ exchange rate, API4 export price and the discount rate. Sensitivity analysis of a 10% increase Sensitivity of in the inputs is inputs and fair demonstrated value below2 At 31 December 2016 (Reviewed) Inputs measurement1 Rm Observable inputs Rand/US$ exchange rate R13,63/US$1 Strengthening of 48 the rand
Page 23

Exxaro year end results dec 2016 to the US$ API4 export price (price per tonne) US$57,19 to Increase in API4 248 US$75 export price per tonne Unobservable inputs Discount rate (%) 3,44% Decrease in the (21) discount rate At 31 December 2015 (Audited) Observable inputs Rand/US$ exchange rate R15,48/US$1 Strengthening of 4 the rand to the US$ API4 export price (price per tonne) US$51,15 Increase in API4 175 to US$62,5 export price per tonne Unobservable inputs Discount rate (%) 3,44% Decrease in the (1) discount rate 1 Change in observable/unobservable input which will result in an increase in the fair value measurement. 2 A 10% decrease in the respective inputs would have an equal but opposite effect on the above, on the basis that all other variables remain constant.
Inter‐relationships Any inter‐relationships between unobservable inputs are not considered to have a significant impact within the range of reasonably possible alternative assumptions for the reporting period.
At 31 December 2016 2015 Reviewed Audited Rm Rm 22. CONTINGENT LIABILITIES Total contingent liabilities 6 907 7 378 ‐ DMC Iron Congo SA 6 ‐ Pending litigation and other claims1 1 136 1 233 ‐ Operational guarantees2 4 331 3 559 ‐ Share of contingent liabilities of equity‐accounted investments3 1 440 2 580 1 Pending litigation and other claims consist of legal cases as well as tax disputes with Exxaro as defendant. The outcome of these claims is uncertain and the amount of possible legal obligations that may be incurred can only be estimated at date of reporting. 2 Operational guarantees include guarantees to banks and other institutions in the normal course of business from which it is anticipated that no material liabilities will arise. 3 Decrease mainly relates to SIOC settlement with SARS.
The timing and occurrence of any possible outflows of the contingent liabilities above are uncertain.
SARS On 18 January 2016, Exxaro received a letter of intent from SARS following an international income tax audit for the years of assessment 2009 to 2013. According to the letter, SARS proposes that certain international Exxaro companies will be subject to South African Income Tax under Section 9D of the Income Tax Act. Assessments to the amount of R442 million (R199 million tax payable, R91 million interest and R152 million penalties) were issued on 30 March 2016 and Exxaro formally objected against these assessments. The group is awaiting SARS’ response.
Page 24

Exxaro year end results dec 2016
These assessments have been considered in consultation with external tax and legal advisers and senior counsel. Exxaro believes this matter has been treated appropriately by disclosing a contingent liability.
23. RELATED PARTY TRANSACTIONS The group entered into various sale and purchase transactions with associates and joint ventures during the ordinary course of business. These transactions were subject to terms that are no less, nor more favourable than those arranged with independent third parties.
Exxaro received payments amounting to R15,5 million from Main Street 333, Exxaro’s majority BEE shareholder, during the year for interest on the loan granted in July 2015. Subsequent to the reporting date, Main Street 333 settled the loan and accrued interest thereon.
24. GOING CONCERN Based on the results for the year ended 31 December 2016, and the latest budget for 2017, as well as the available bank facilities and cash generating capability, Exxaro satisfies the criteria of a going concern.
25. JSE LISTINGS REQUIREMENTS The reviewed condensed group annual financial results were prepared in accordance with the Listings Requirements of the JSE. 26. EVENTS AFTER THE REPORTING PERIOD Details of the final dividend proposed are given in note 12.
On 17 January 2017, Exxaro paid R3 524 million to Main Street 333 for the repurchase of 43 943 744 ordinary shares. On 20 January 2017, Main Street 333 settled its loan with Exxaro.
The directors are not aware of any other significant matter or circumstance arising after the reporting period up to the date of this report, not otherwise dealt with in this report.
27. REVIEW CONCLUSION These reviewed condensed group annual financial statements for the year ended 31 December 2016 have been reviewed by PricewaterhouseCoopers Inc., who expressed an unmodified review conclusion. A copy of the auditor’s review report is available for inspection at the company’s registered office together with the financial statements identified in the auditor’s report.
28. CORPORATE GOVERNANCE Detailed disclosure of the company’s application of the principles contained in the King Report on Governance for South Africa 2009 (King III) will be made in the 2016 Integrated Report and will, in accordance with the JSE Listings Requirements, be available on the company’s website in April 2017. The company is in the process of preparing itself for the implementation of the King Report on Corporate Governance for South Africa 2016 (King IV) and further information on the plans and progress will be provided in due course. As previously communicated, during the 2016 financial year Messrs EJ (Ras) Myburgh and PCCH (Peet) Snyders were appointed as independent non‐executive directors to the board and Mr PA (Riaan) Koppeschaar as Finance Director. Please contact the group company secretary and legal, Mrs CH (Carina) Wessels, for any additional information in this regard.
29. KEY MEASURES1 At 31 December 2016 2015 Closing share price (rand/share) 89,50 44,04 Market capitalisation (Rb) 32,05 15,77 Average rand/US$ exchange rate (for the year ended) 14,69 12,76
Page 25

Exxaro year end results dec 2016 Closing rand/US$ spot exchange rate 13,63 15,48 1 Non‐IFRS numbers.
EXXARO 2016 PERFORMANCE AT A GLANCE Sustainable operations Lost‐time injury frequency rate (LTIFR) improved 47% to 0,09
Strong profit margins and resilient balance sheet Core net operating profit margin of 24%, up 6%
R2,4 billion income from equity‐accounted investments, up 309% from FY15
Headline earnings per share at 1 302 cents per share
Net debt to equity at 3,8%
Cash generated from operations at R5,5 billion, up 23%
Growth in coal R5,2 billion coal net operating profit (NOP), up 101%
Operating profit margin of 25%
Exports volume ‐ at 7,9Mt up 27%
Returning cash to shareholders Final dividend of 410 cents per share (cps) at a FY16 core attributable earnings cover of 3,2 times
COMMENTARY for the year ended 31 December Comments below are based on a comparison between the financial years ended 31 December 2016 and 2015 (FY16 and FY15 respectively). 1. ROBUST PERFORMANCE The Exxaro group of companies reached another unprecedented milestone on 31 December 2016 achieving two consecutive calendar years without a fatality. By December 2016, the company had operated for a record 30 consecutive months without a fatality. The group also achieved a lost‐time injury frequency rate (LTIFR) of 0,09 (FY15: 0,17) representing a 47% improvement. Regrettably, an employee at Matla Mine 2 in Mpumalanga, Mr Sibongiseni Sihle Majozi, was fatally injured on 1 March 2017 following an underground accident. Exxaro continues to strive for a consistent fatality‐free environment and to continuously improve all aspects of safety. Exxaro delivered a very strong performance for FY16 with higher net operating profit, mainly driven by higher coal selling prices. The income from equity‐accounted investments increased substantially during the second half of the year, to end FY16 at R2 373 million (FY15: loss of R1 137 million). The increase can mainly be attributed to an improved performance from SIOC (increase of R2 312 million) as a result of a recovery in iron ore export selling prices, and lower losses from our investment in Tronox (decrease in losses of R1 119 million). Following the Exxaro Improvement Project (EIP) to reduce costs and improve efficiencies, Exxaro achieved sustainable cost savings of R235 million in FY16.
2. COMPARABILITY OF RESULTS The key transactions shown in table 1 below should be taken into account to gain a better understanding of the
Page 26

Exxaro year end results dec 2016 comparability of the results for the two years.
Table 1: Key transactions impacting on comparability
Reporting FY16 FY15 segment Description Rm Description Rm Coal ‐ Termination and voluntary severance packages (10) ‐ Termination and voluntary severance packages (110) ‐ Gain on disposal of operation (Inyanda)1 100 ‐ Impairment of goodwill recognised on the (1 524) acquisition of TCSA1 ‐ Gain on disposal of SDCT shareholding1 203 ‐ Gain on disposal of non‐core assets, property, 137 plant and equipment and insurance claim income1 ‐ Loss on disposal of property, plant and equipment1 (45) ‐ Impairment of property, plant and equipment (225) (reductants operation)1 Ferrous ‐ Termination and voluntary severance packages (1) ‐ Termination and voluntary severance packages (39) ‐ Gain on disposal of property, plant 10 ‐ Gain on disposal of property, plant 122 and equipment1 and equipment1 ‐ Gain on disposal of subsidiaries (Mayoko iron 670 ‐ Partial reversal of previous 11 ore project and related subsidiaries)1 write‐off of financial assets ‐ Impairment of property, plant and equipment (100) (FerroAlloys)1 1 Excluded from headline earnings.
Reporting FY16 FY15 segment Description Rm Description Rm Other ‐ Termination and voluntary severance packages (87) ‐ Termination and voluntary severance packages (259) ‐ Loss on dilution of shareholding in Tronox1 (36) ‐ Loss on dilution of shareholding in Tronox1 (10) ‐ Fair value adjustment on contingent (445) ‐ Gain on disposal of property, plant and 17 consideration relating to the acquisition of ECC equipment and non‐core assets1 ‐ Foreign exchange gain on US$ 747 held for TCSA acquisition ‐ Gains on translation differences of 1 012 foreign subsidiaries1 ‐ Other (96)
Group Total net operating profit impact 259 Total net operating loss impact (217)
Coal ‐ Tax on disposal of property, 13 ‐ Tax on disposal of non‐core assets, insurance 28 plant and equipment1 claim income and impairment1 ‐ Excess of fair value over cost of 35 investment in RBCT1 ‐ Post‐tax share of Mafube impairment (16) of property, plant and equipment1 ‐ Post‐tax share of Mafube gain on 1 disposal of property, plant and equipment1 Ferrous ‐ Tax on impairment of property, plant 27 ‐ Post‐tax share of SIOC gains on disposal of 3 and equipment1 non‐core assets and insurance claims income1 ‐ Excess of fair value over cost of 221 ‐ Post‐tax share of SIOC’s impairment (866) investment in SIOC1 of operation1 ‐ Post‐tax share of SIOC loss on disposal (28) of property, plant and equipment1 ‐ Post‐tax share of SIOC impairment of (1) property, plant and equipment1
Page 27
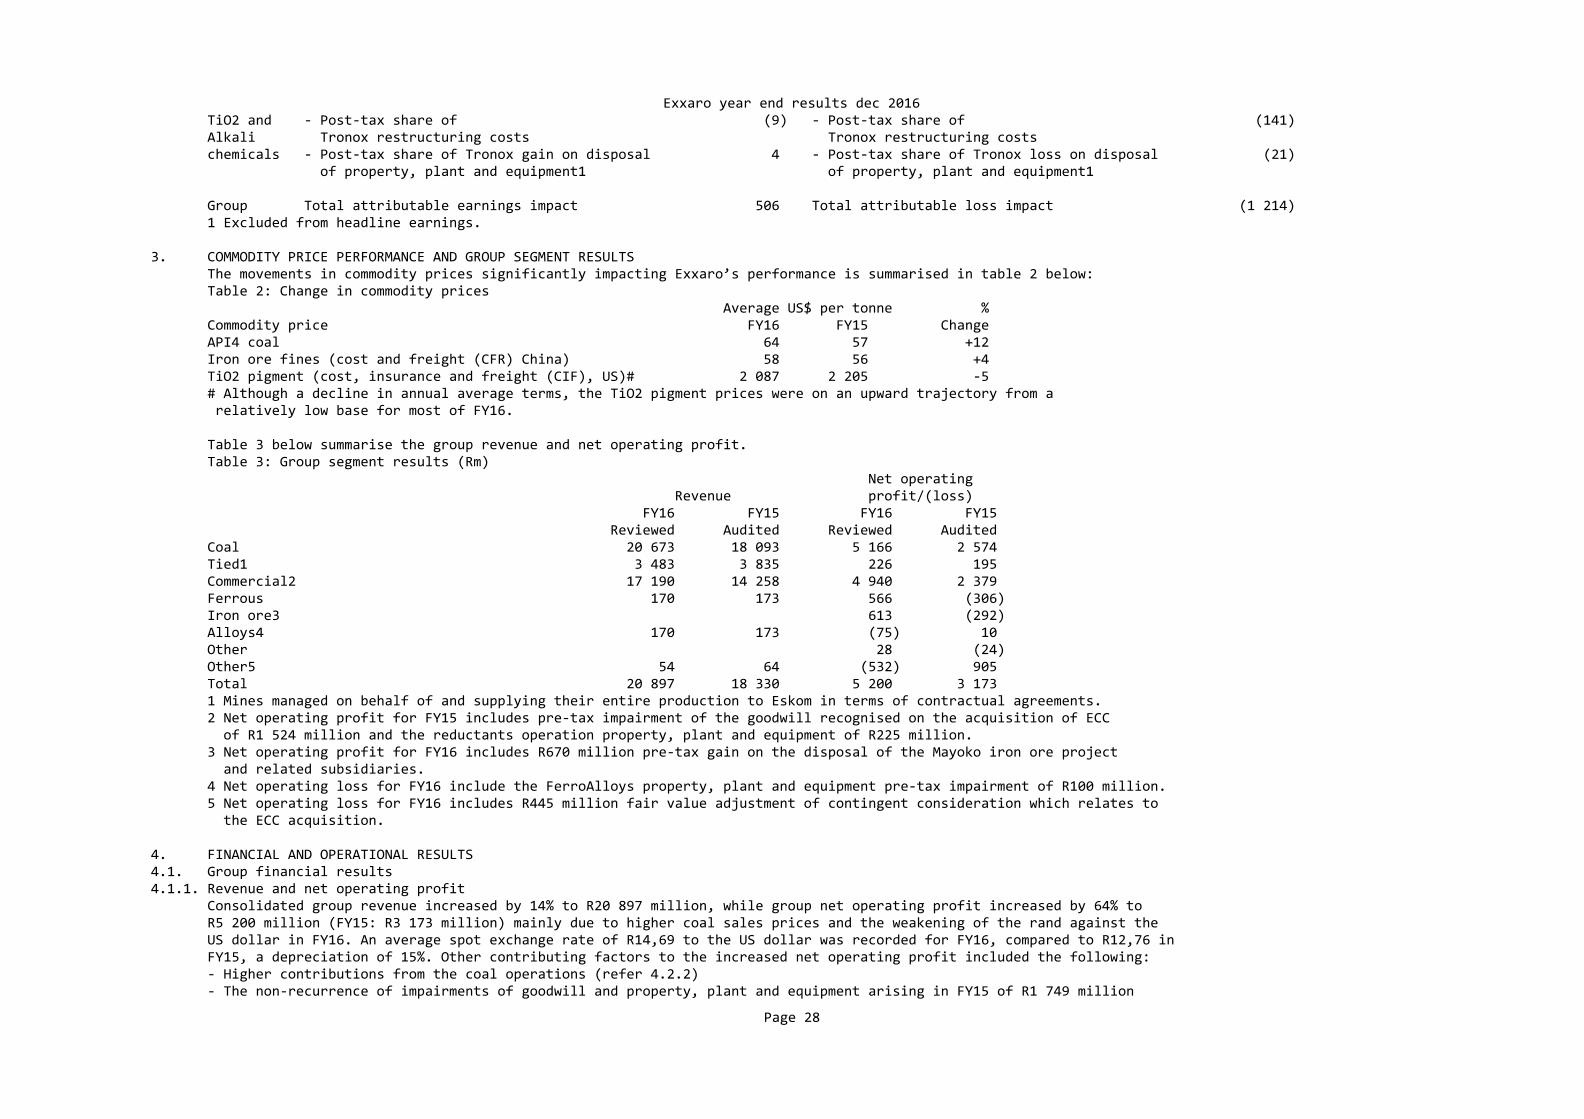
Exxaro year end results dec 2016 TiO2 and ‐ Post‐tax share of (9) ‐ Post‐tax share of (141) Alkali Tronox restructuring costs Tronox restructuring costs chemicals ‐ Post‐tax share of Tronox gain on disposal 4 ‐ Post‐tax share of Tronox loss on disposal (21) of property, plant and equipment1 of property, plant and equipment1 Group Total attributable earnings impact 506 Total attributable loss impact (1 214) 1 Excluded from headline earnings.
3. COMMODITY PRICE PERFORMANCE AND GROUP SEGMENT RESULTS The movements in commodity prices significantly impacting Exxaro’s performance is summarised in table 2 below: Table 2: Change in commodity prices Average US$ per tonne % Commodity price FY16 FY15 Change API4 coal 64 57 +12 Iron ore fines (cost and freight (CFR) China) 58 56 +4 TiO2 pigment (cost, insurance and freight (CIF), US)# 2 087 2 205 ‐5 # Although a decline in annual average terms, the TiO2 pigment prices were on an upward trajectory from a relatively low base for most of FY16.
Table 3 below summarise the group revenue and net operating profit. Table 3: Group segment results (Rm) Net operating Revenue profit/(loss) FY16 FY15 FY16 FY15 Reviewed Audited Reviewed Audited Coal 20 673 18 093 5 166 2 574 Tied1 3 483 3 835 226 195 Commercial2 17 190 14 258 4 940 2 379 Ferrous 170 173 566 (306) Iron ore3 613 (292) Alloys4 170 173 (75) 10 Other 28 (24) Other5 54 64 (532) 905 Total 20 897 18 330 5 200 3 173 1 Mines managed on behalf of and supplying their entire production to Eskom in terms of contractual agreements. 2 Net operating profit for FY15 includes pre‐tax impairment of the goodwill recognised on the acquisition of ECC of R1 524 million and the reductants operation property, plant and equipment of R225 million. 3 Net operating profit for FY16 includes R670 million pre‐tax gain on the disposal of the Mayoko iron ore project and related subsidiaries. 4 Net operating loss for FY16 include the FerroAlloys property, plant and equipment pre‐tax impairment of R100 million. 5 Net operating loss for FY16 includes R445 million fair value adjustment of contingent consideration which relates to the ECC acquisition.
4. FINANCIAL AND OPERATIONAL RESULTS4.1. Group financial results4.1.1. Revenue and net operating profit Consolidated group revenue increased by 14% to R20 897 million, while group net operating profit increased by 64% to R5 200 million (FY15: R3 173 million) mainly due to higher coal sales prices and the weakening of the rand against the US dollar in FY16. An average spot exchange rate of R14,69 to the US dollar was recorded for FY16, compared to R12,76 in FY15, a depreciation of 15%. Other contributing factors to the increased net operating profit included the following: ‐ Higher contributions from the coal operations (refer 4.2.2) ‐ The non‐recurrence of impairments of goodwill and property, plant and equipment arising in FY15 of R1 749 million
Page 28

Exxaro year end results dec 2016 ‐ R670 million gain on disposal of the Mayoko iron ore project and its related subsidiaries in FY16 ‐ Cost savings in the ferrous segment due to the disposal of Mayoko iron ore project, offset by the non‐recurrence of gains in FY15 relating to: ‐ Unrealised foreign exchange profits recorded on US dollars held for the ECC acquisition ‐ Translation differences recycled to profit or loss on liquidation of foreign subsidiaries ‐ R445 million loss on the fair value adjustment recognised in FY16 relating to the contingent consideration which arose on the acquisition of ECC.
4.1.2. Earnings Earnings, which include Exxaro’s equity‐accounted investments in associates and joint ventures, was R5 679 million (FY15: R296 million) or 1 600 cents earnings per share (FY15: 83 cents per share).
Headline earnings were 185% higher at R4 621 million (FY15: R1 623 million) or 1 302 cents per share (FY15: 457 cents per share).
Table 4: Equity‐accounted investments (Rm) Equity‐accounted income/(loss) Dividends received FY16 FY15 FY16 FY15 Reviewed Audited Reviewed Audited SIOC1 2 416 104 673 Tronox (384) (1 503) 298 668 Mafube 238 253 450 Black Mountain 100 64 Cennergi 3 (53) RBCT2 (4) SDCT 2 Total 2 373 (1 137) 748 1 341 1 FY16 includes R221 million excess of fair value over the cost of the investment which arose on the 0,64% increase in the shareholding of SIOC and FY15 includes Exxaro’s share of an impairment charge on property, plant and equipment amounting to R866 million. 2 FY16 includes R35 million excess of fair value over the cost of the investment which arose on the increase in the shareholding in RBCT, offset by a R35 million equity‐accounted loss.
4.1.3. Cash flow and funding Cash flow generated by operations increased by R1 023 million to R5 549 million (FY15: R4 526 million) and was sufficient to cover capital expenditure of R2 780 million, dividends of R625 million, net financing charges of R459 million and tax of R547 million.
Total capital expenditure increased by 16% or R390 million, consisting of a R750 million increase in expenditure on sustaining and environmental capital (stay‐in‐business capital) offset by a R360 million decrease in expenditure on new capacity (expansion capital).
Dividends received of R748 million (FY15: R1 341 million) consisted of R450 million (FY15: nil) from Mafube (a joint venture with Anglo South Africa Capital Proprietary Limited), and R298 million (FY15: R668 million) from our investment in Tronox. No dividends were received from SIOC in FY16 (FY15: R673 million).
4.1.4. Debt exposure Net debt at 31 December 2016 was R1 322 million, compared to R3 012 million at 31 December 2015. This equates to a net debt to equity ratio of 3,8% (8,8% at 31 December 2015). Exxaro’s capital structure remains robust and we successfully refinanced our R8 billion term loan facility at attractive terms, despite Standard and Poor’s downgrading of Exxaro's domestic credit rating to zaBB+/zaB.
Page 29
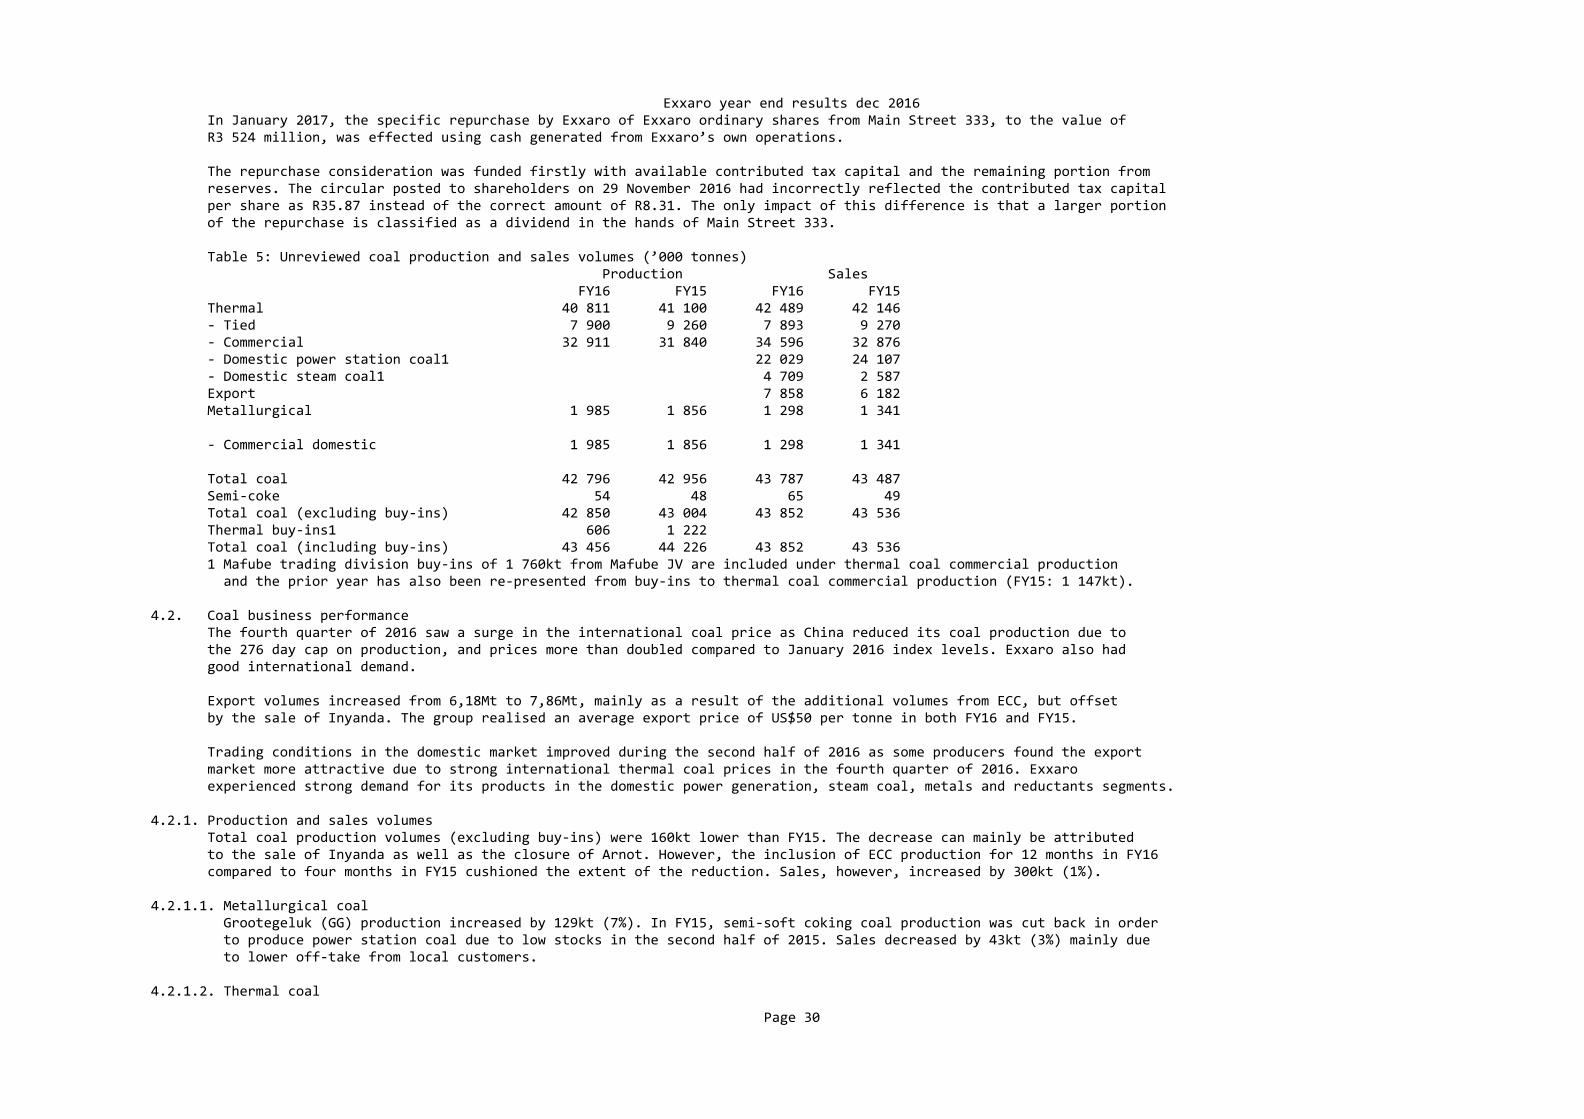
Exxaro year end results dec 2016 In January 2017, the specific repurchase by Exxaro of Exxaro ordinary shares from Main Street 333, to the value of R3 524 million, was effected using cash generated from Exxaro’s own operations.
The repurchase consideration was funded firstly with available contributed tax capital and the remaining portion from reserves. The circular posted to shareholders on 29 November 2016 had incorrectly reflected the contributed tax capital per share as R35.87 instead of the correct amount of R8.31. The only impact of this difference is that a larger portion of the repurchase is classified as a dividend in the hands of Main Street 333.
Table 5: Unreviewed coal production and sales volumes (’000 tonnes) Production Sales FY16 FY15 FY16 FY15 Thermal 40 811 41 100 42 489 42 146 ‐ Tied 7 900 9 260 7 893 9 270 ‐ Commercial 32 911 31 840 34 596 32 876 ‐ Domestic power station coal1 22 029 24 107 ‐ Domestic steam coal1 4 709 2 587 Export 7 858 6 182 Metallurgical 1 985 1 856 1 298 1 341 ‐ Commercial domestic 1 985 1 856 1 298 1 341 Total coal 42 796 42 956 43 787 43 487 Semi‐coke 54 48 65 49 Total coal (excluding buy‐ins) 42 850 43 004 43 852 43 536 Thermal buy‐ins1 606 1 222 Total coal (including buy‐ins) 43 456 44 226 43 852 43 536 1 Mafube trading division buy‐ins of 1 760kt from Mafube JV are included under thermal coal commercial production and the prior year has also been re‐presented from buy‐ins to thermal coal commercial production (FY15: 1 147kt).
4.2. Coal business performance The fourth quarter of 2016 saw a surge in the international coal price as China reduced its coal production due to the 276 day cap on production, and prices more than doubled compared to January 2016 index levels. Exxaro also had good international demand.
Export volumes increased from 6,18Mt to 7,86Mt, mainly as a result of the additional volumes from ECC, but offset by the sale of Inyanda. The group realised an average export price of US$50 per tonne in both FY16 and FY15.
Trading conditions in the domestic market improved during the second half of 2016 as some producers found the export market more attractive due to strong international thermal coal prices in the fourth quarter of 2016. Exxaro experienced strong demand for its products in the domestic power generation, steam coal, metals and reductants segments.
4.2.1. Production and sales volumes Total coal production volumes (excluding buy‐ins) were 160kt lower than FY15. The decrease can mainly be attributed to the sale of Inyanda as well as the closure of Arnot. However, the inclusion of ECC production for 12 months in FY16 compared to four months in FY15 cushioned the extent of the reduction. Sales, however, increased by 300kt (1%).
4.2.1.1. Metallurgical coal Grootegeluk (GG) production increased by 129kt (7%). In FY15, semi‐soft coking coal production was cut back in order to produce power station coal due to low stocks in the second half of 2015. Sales decreased by 43kt (3%) mainly due to lower off‐take from local customers.
4.2.1.2. Thermal coal
Page 30
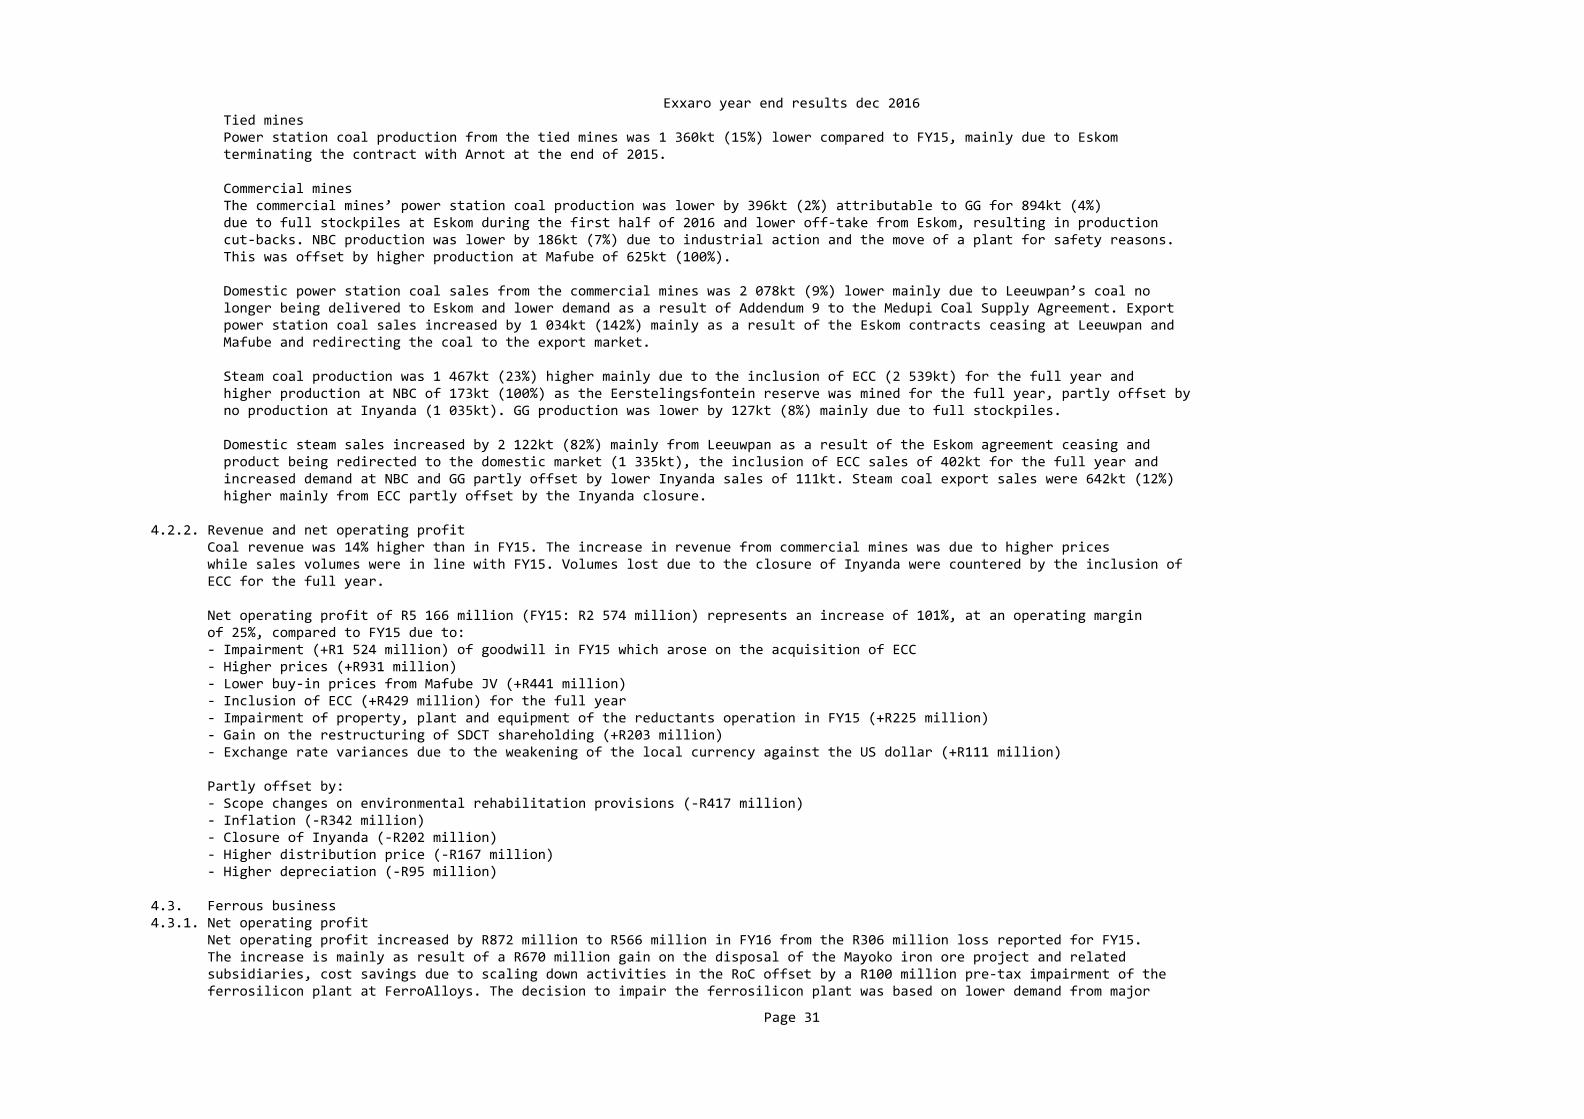
Exxaro year end results dec 2016 Tied mines Power station coal production from the tied mines was 1 360kt (15%) lower compared to FY15, mainly due to Eskom terminating the contract with Arnot at the end of 2015.
Commercial mines The commercial mines’ power station coal production was lower by 396kt (2%) attributable to GG for 894kt (4%) due to full stockpiles at Eskom during the first half of 2016 and lower off‐take from Eskom, resulting in production cut‐backs. NBC production was lower by 186kt (7%) due to industrial action and the move of a plant for safety reasons. This was offset by higher production at Mafube of 625kt (100%).
Domestic power station coal sales from the commercial mines was 2 078kt (9%) lower mainly due to Leeuwpan’s coal no longer being delivered to Eskom and lower demand as a result of Addendum 9 to the Medupi Coal Supply Agreement. Export power station coal sales increased by 1 034kt (142%) mainly as a result of the Eskom contracts ceasing at Leeuwpan and Mafube and redirecting the coal to the export market.
Steam coal production was 1 467kt (23%) higher mainly due to the inclusion of ECC (2 539kt) for the full year and higher production at NBC of 173kt (100%) as the Eerstelingsfontein reserve was mined for the full year, partly offset by no production at Inyanda (1 035kt). GG production was lower by 127kt (8%) mainly due to full stockpiles.
Domestic steam sales increased by 2 122kt (82%) mainly from Leeuwpan as a result of the Eskom agreement ceasing and product being redirected to the domestic market (1 335kt), the inclusion of ECC sales of 402kt for the full year and increased demand at NBC and GG partly offset by lower Inyanda sales of 111kt. Steam coal export sales were 642kt (12%) higher mainly from ECC partly offset by the Inyanda closure.
4.2.2. Revenue and net operating profit Coal revenue was 14% higher than in FY15. The increase in revenue from commercial mines was due to higher prices while sales volumes were in line with FY15. Volumes lost due to the closure of Inyanda were countered by the inclusion of ECC for the full year.
Net operating profit of R5 166 million (FY15: R2 574 million) represents an increase of 101%, at an operating margin of 25%, compared to FY15 due to: ‐ Impairment (+R1 524 million) of goodwill in FY15 which arose on the acquisition of ECC ‐ Higher prices (+R931 million) ‐ Lower buy‐in prices from Mafube JV (+R441 million) ‐ Inclusion of ECC (+R429 million) for the full year ‐ Impairment of property, plant and equipment of the reductants operation in FY15 (+R225 million) ‐ Gain on the restructuring of SDCT shareholding (+R203 million) ‐ Exchange rate variances due to the weakening of the local currency against the US dollar (+R111 million) Partly offset by: ‐ Scope changes on environmental rehabilitation provisions (‐R417 million) ‐ Inflation (‐R342 million) ‐ Closure of Inyanda (‐R202 million) ‐ Higher distribution price (‐R167 million) ‐ Higher depreciation (‐R95 million) 4.3. Ferrous business4.3.1. Net operating profit Net operating profit increased by R872 million to R566 million in FY16 from the R306 million loss reported for FY15. The increase is mainly as result of a R670 million gain on the disposal of the Mayoko iron ore project and related subsidiaries, cost savings due to scaling down activities in the RoC offset by a R100 million pre‐tax impairment of the ferrosilicon plant at FerroAlloys. The decision to impair the ferrosilicon plant was based on lower demand from major
Page 31

Exxaro year end results dec 2016 customers as well as our current view of securing new contracts in future.
4.3.2. Equity‐accounted investments The increase in equity‐accounted income from SIOC is largely attributable to the increase in export iron ore prices in FY16, a R221 million excess of fair value over the cost of the investment which arose due to a 0,64% increase in Exxaro’s shareholding following the unwinding of SIOC’s employee ownership scheme in FY16, as well as Exxaro’s share of the impairment charge amounting to R866 million which was included in FY15. No dividends were received from SIOC in FY16 (FY15: R673 million).
4.4. TiO2 and Alkali chemicals investment4.4.1. Equity‐accounted investment Equity‐accounted losses from the Tronox investment decreased from R1 503 million in FY15 to R384 million for FY16, mainly due to tax benefits realised on an organisational restructuring which occurred during the latter part of the year, reduction in restructuring costs as well as net realisable value adjustments on inventory which were released through profit or loss.
Tronox continued its dividend declaration during the year, however, at a rate of US$0,25 per share for the first quarter of 2016 (final 2015 dividend) and US$0,045 per share for the remainder of the year (FY15: US$0,25 per share per quarter).
On 21 February 2017, Tronox entered into a definitive agreement to acquire the titanium dioxide business of Cristal (also known as The National Titanium Dioxide Company Limited) for US$1 673 million cash and shares, representing a 24% shareholding in the enlarged company. As Tronox’s largest shareholder, Exxaro intends to vote its shares in favour of the proposed transaction.
Exxaro’s board has determined that it will explore available alternatives to sell its Tronox shares in a thoughtful, efficient and staged process over time to focus on its core activities.
4.5. Energy business4.5.1. Equity‐accounted investment Cennergi, a 50% joint venture with Tata Power, recorded equity‐accounted income of R3 million for FY16 (FY15: loss of R53 million) mainly due to the two wind‐farm projects being brought into commercial operation. The wind‐farm projects, Amakhala Emoyeni (AE) and Tsitsikamma Community Wind Farm (TCWF), both achieved Commercial Operation Date (COD) during the third quarter of FY16 and started earning revenue from electricity supplied into the national grid.
5. BROAD‐BASED BLACK ECONOMIC EMPOWERMENT Exxaro supports transformation through, inter alia, economic empowerment ownership and strongly believes that the proposed replacement BEE transaction (as announced on SENS dated 22 November 2016) has a greater ability to create wealth through its reduced risk profile, which contributes to sustainable empowerment. The new proposed structure is less risky and more flexible which is important in a cyclical industry. Exxaro learned valuable lessons from the previous empowerment transaction and aims to create sustainable value for the BEE shareholders. A sustainable ownership structure is in the best interest of BEE shareholders, minority shareholders, the company, employees and our communities.
Exxaro remain of the view that a transaction at the listed level is appropriate to ensure flexibility, a well capitalised funding package for the new empowerment vehicle, while also allowing our strategic BEE shareholders to significantly participate in Exxaro. Our benchmarking indicated the proposed cost of the replacement transaction is below market norms but we could potentially implement a further specific share repurchase from Main Street 333 to act as a further anti‐dilutive measure.
Current contracts with Eskom are not affected by the decision to reduce our BEE shareholding.
Page 32
Exxaro year end results dec 2016 It is expected that Exxaro will seek shareholder approval in the second quarter of 2017 for the replacement BEE transaction.
6. MINERAL RESOURCES AND RESERVES There has been a material change in the reserves of ECC following new geological models and life of mine plans developed in FY16. Run of mine for the Dorstfontein complex increased from 20,3Mt to 43,5Mt, and Forzando increased from 11,5Mt to 48,5Mt. The reported tonnage in 2015 was a conservative estimate, as the mentioned models and plans were still in development at the time.
7. MINING AND PROSPECTING RIGHTS The mining right application for the Thabametsi project, a resource adjacent to the Grootegeluk Waterberg coal mine, which will supply coal to the Thabametsi Coal IPP, was granted in June 2016 for a period of 30 years. The approval, execution and subsequent registration of the right signify the start of a new and exciting phase for Exxaro within the Waterberg. Exxaro also holds a 100% ownership in the Waterberg North and South prospecting right areas situated roughly 30km north‐west of the Grootegeluk coal mine. The project areas consist of four prospecting rights for which applications for renewals were timeously submitted. Approvals for two of the renewals were granted in the second half of 2016 and Exxaro has a reasonable expectation that the remaining renewals will be granted in early 2017.
ECC holds a 51% interest in the Eloff prospecting right, a project situated near the town of Delmas and close to Exxaro’s Leeuwpan operation. The project area lies within the Delmas coalfield, to the west of the Witbank Coalfield, and along the northern edge of the main Karoo sedimentary basin. Three major coal seams are present in the project area although with variable seam thickness, coal qualities and depth below surface. A mining right compilation for the project was completed in December 2016 and the application will be submitted within the first quarter of 2017.
Technical studies concluded have resulted in a significant increase in the life of mine at both the Forzando and Dorstfontein operations, a complex of which ECC holds 74%. The approval of a section 102 application to incorporate the Forzando‐West prospecting right into the Forzando‐South mining right was received which adds additional potential for the expansion of the Forzando operation.
The mining right registrations of Matla, Arnot, Leeuwpan extension, Forzando‐South and Glisa (NBC) are pending. Exxaro has a reasonable expectation that registrations will be concluded during the first half of 2017.
NBC includes the traditional mining areas of Glisa (converted mining right), Strathrae (converted mining right) and Eerstelingsfontein, an executed new mining right. Environmental approvals for Eerstelingsfontein have been granted and approval for the renewal of the mining right, timeously submitted in March 2013, is pending. In addition, a renewal for a prospecting right and an application for a new mining right for the Glisa South project area, immediately adjacent to Glisa, was timeously submitted in November 2013. An appeal received on this right is being addressed through the DMR’s Regional Mining Development and Environment Committee.
8. OUTLOOK Supportive market conditions are expected in 2017 for most of Exxaro’s chosen coal market segments compared to 2016, both domestically and internationally. Exxaro is confident that the strength of the diversified coal product portfolio will create new opportunities in this environment.
Exxaro expects an improvement in the operational results of the coal business in 2017 based on: ‐ Stable trading conditions in domestic markets ‐ Higher international coal prices compared to 2016 ‐ Our operational excellence process delivering further results ‐ Technology and innovation improvements The rand exchange rate against the US dollar is expected to remain volatile for most of 2017 due to the combination of significant event risks and volatility in the US dollar.
Page 33

Exxaro year end results dec 2016 The performance of the investment portfolio (SIOC and Tronox) is currently expected to be positively influenced by a favourable commodity price outlook for 2017.
9. FINAL DIVIDEND Exxaro’s dividend policy is based on a cover ratio of between 2,5 and 3,5 times core attributable earnings.
Notice is therefore given that a gross final cash dividend, number 28 of 410 cents (final FY15: 85 cents) per share, for the financial year ended 31 December 2016 was declared, payable to shareholders of ordinary shares. For details of the dividend, please refer note 12 of the reviewed condensed group annual financial statements.
Salient dates for payment of the final dividend are: ‐ Last day to trade cum dividend on the JSE Tuesday, 18 April 2017 ‐ First trading day ex dividend on the JSE Wednesday, 19 April 2017 ‐ Record date Friday, 21 April 2017 ‐ Payment date Monday, 24 April 2017 No share certificates may be dematerialised or rematerialised between Wednesday, 19 April 2017 and Friday, 21 April 2017, both days inclusive. Dividends for certificated shareholders will be transferred electronically to their bank accounts on payment date. Shareholders who hold dematerialised shares will have their accounts at their central securities depository participant or broker credited on Monday, 24 April 2017.
10. GENERAL Additional information on financial and operational results for the financial year ended 31 December 2016, and the accompanying presentation can be accessed on our website on www.exxaro.com.
On behalf of the board
Len Konar Mxolisi Mgojo Riaan Koppeschaar Chairman Chief executive officer Finance director
7 March 2017
CORPORATE INFORMATION
Registered officeExxaro Resources LimitedRoger Dyason RoadPretoria West, 0183Tel: +27 12 307 5000Fax: +27 12 323 3400
DirectorsMW Hlahla**, Dr D Konar*** (chairman), S Mayet***, MDM Mgojo* (chief executive officer), PA Koppeschaar (finance director)*, S Dakile‐Hlongwane***, Dr CJ Fauconnier***, V Nkonyeni***, VZ Mntambo**, EJ Mybrugh***, Dr MF Randera**, J van Rooyen***, PCCH Snyders***, D Zihlangu*** Executive ** Non‐executive *** Independent non‐executive
Prepared under supervision of: PA Koppeschaar, CA(SA)
Page 34
Exxaro year end results dec 2016SAICA registration number: 00038621
Group company secretary CH Wessels
Transfer secretariesComputershare Investor Services Proprietary LimitedGround Floor70 Marshall StreetJohannesburg, 2001PO Box 61051Marshalltown, 2107
Investor relations MI Mthenjane (+27 12 307 7393)
SponsorAbsa Bank Limited (acting through its Corporate and Investment Bank Division) Tel: +27 11 895 6000
If you have any queries regarding your shareholding in Exxaro Resources Limited, please contact the transfersecretaries at +27 11 370 5000.
ACRONYMS Anglo Anglo South Africa Capital Proprietary Limited API4 All publications index 4 (fob Richards Bay 6000kcal/kg) BEE Black Economic Empowerment Black Mountain Black Mountain Proprietary Limited Cennergi Cennergi Proprietary Limited CFR Cost and Freight Chifeng Chifeng Kumba Hongye Corporation Limited CIF Cost, insurance and freight Companies Act Companies Act No 71 of 2008, as amended Cps cents per share DMR Department of Mineral Resources DMTN Domestic Medium‐Term Note ECC Exxaro Coal Central Proprietary Limited EIP Exxaro Improvement Project EMJV Ermelo joint venture Exxaro Exxaro Resources Limited FeCr FerroChrome FY15 Financial year ended 31 December 2015 FY16 Financial year ended 31 December 2016 GG Grootegeluk HEPS Headline earnings per share IAS International Accounting Standard IASB International Accounting Standards Board IPP Independent Power Producer IFRS International Financial Reporting Standard JIBAR Johannesburg Interbank Average Rate
Page 35
Exxaro year end results dec 2016JSE JSE Limited KIO Kumba Iron Ore Limited kt kilo tonnes Listings Requirements JSE Listings Requirements LME London Metal Exchange LTIFR Lost‐time injury frequency rate Mafube Mafube Coal Proprietary Limited Main Street 333 Main Street 333 Proprietary Limited (RF), controlling shareholder Mpower 2012 Exxaro Employee Empowerment Trust MPRDA Mineral and Petroleum Resources Development Act 28 2002 Mt Million tonnes NBC North Block Complex NCC New Clydesdale Colliery NOP Net operating profitPPA Purchase Price Allocation PRC People’s Republic of China Rb Rand billion RBCT Richards Bay Coal Terminal Proprietary Limited Rm Rand million RMB Chinese Renminbi RoC Republic of Congo RSA Republic of South AfricaSAICA South African Institute of Chartered Accountants SARS South African Revenue Service SDCT South Dunes Coal Terminal SOC Limited SENS Stock Exchange News Service SIOC Sishen Iron Ore Company Proprietary Limited SOC State‐owned company SSCC Semi‐soft coking coal Tata Power Tata Power Company Limited TCSA Total Coal South Africa Proprietary Limited TiO2 Titanium dioxide Tronox Tronox Limited Tronox SA Tronox KZN Sands Proprietary Limited and Tronox Mineral Sands Proprietary Limited Tronox UK Tronox Sands Limited Liability Partnership in the United Kingdom US United States of America US$ United States dollar VAT Value Added Tax DisclaimerOpinions expressed herein are by nature subjective to known and unknown risks and uncertainties. Changing informationor circumstances may cause the actual results, plans and objectives of Exxaro Resources Limited (the “Company”) todiffer materially from those expressed or implied in the forward looking statements. Financial forecasts and data givenherein are estimates based on the reports prepared by experts who in turn relied on management estimates. Undue relianceshould not be placed on such opinions, forecasts or data. No representation is made as to the completeness or correctness ofthe opinions, forecasts or data contained herein. Neither the company, nor any of its affiliates, advisers orrepresentatives accepts any responsibility for any loss arising from the use of any opinion expressed or forecast or data herein.Forward looking statements apply only as of the date on which they are made and the company does not undertake anyobligation to publicly update or revise any of its opinions or forward looking statements whether to reflect new data orfuture events or circumstances.
The full report is available on www.exxaro.com
Page 36


![The U.S. Environmental Protection Agency (EPA) Proposes to ... · discharges (40 CFR §§ 122.26, 122.30-35, and 123.35; see also 64 FR 68722 [Dec. 8, 1999] and 81 FR 89320 [Dec](https://img.pdfslide.us/doc/110x75/5f200e8dffe8627bf6168c32/the-us-environmental-protection-agency-epa-proposes-to-discharges-40-cfr.jpg)