Embed Size (px)
Citation preview
NREL is a national laboratory of the U.S. Department of Energy, Office of Energy Efficiency & Renewable Energy, operated by the Alliance for Sustainable Energy, LLC.
Contract No. DE-AC36-08GO28308
Extremely Low-Energy Design for Army Buildings: Tactical Equipment Maintenance Facility Preprint Rois Langner and Michael Deru National Renewable Energy Laboratory
Alexander Zhivov, Richard Liesen, and Dale Herron U.S. Army Engineer Research and Development Center
Presented at the 2012 ASHRAE Winter Conference Chicago, Illinois January 21-25, 2012
Conference Paper NREL/CP-5500-53810 March 2012
NOTICE
The submitted manuscript has been offered by an employee of the Alliance for Sustainable Energy, LLC (Alliance), a contractor of the US Government under Contract No. DE-AC36-08GO28308. Accordingly, the US Government and Alliance retain a nonexclusive royalty-free license to publish or reproduce the published form of this contribution, or allow others to do so, for US Government purposes.
This report was prepared as an account of work sponsored by an agency of the United States government. Neither the United States government nor any agency thereof, nor any of their employees, makes any warranty, express or implied, or assumes any legal liability or responsibility for the accuracy, completeness, or usefulness of any information, apparatus, product, or process disclosed, or represents that its use would not infringe privately owned rights. Reference herein to any specific commercial product, process, or service by trade name, trademark, manufacturer, or otherwise does not necessarily constitute or imply its endorsement, recommendation, or favoring by the United States government or any agency thereof. The views and opinions of authors expressed herein do not necessarily state or reflect those of the United States government or any agency thereof.
Available electronically at http://www.osti.gov/bridge
Available for a processing fee to U.S. Department of Energy and its contractors, in paper, from:
U.S. Department of Energy Office of Scientific and Technical Information
P.O. Box 62 Oak Ridge, TN 37831-0062 phone: 865.576.8401 fax: 865.576.5728 email: mailto:[email protected]
Available for sale to the public, in paper, from:
U.S. Department of Commerce National Technical Information Service 5285 Port Royal Road Springfield, VA 22161 phone: 800.553.6847 fax: 703.605.6900 email: [email protected] online ordering: http://www.ntis.gov/help/ordermethods.aspx
Cover Photos: (left to right) PIX 16416, PIX 17423, PIX 16560, PIX 17613, PIX 17436, PIX 17721
Printed on paper containing at least 50% wastepaper, including 10% post consumer waste.

Rois Langner is a mechanical engineer and Michael Deru is a senior engineer with the Commercial Buildings Research Group at the National Renewable Energy Laboratory, Golden, CO. Alexander Zhivov is a program manager and Richard Liesen and Dale Herron are mechanical engineers and project managers in the Energy Branch of the U.S. Army Engineer Research and Development Center, Construction Engineering Research Laboratory, Champaign, IL.
1
Extremely Low-Energy Design for Army Buildings: Tactical Equipment Maintenance Facility
Rois Langner Michael Deru, PhD Associate Member ASHRAE Member ASHRAE Alexander Zhivov, PhD Richard Liesen, PhD Dale Herron Member ASHRAE Member ASHRAE Member ASHRAE
ABSTRACT
The U.S. Army Corps of Engineers Headquarters, the U.S. Army Corps of Engineers Construction Energy Research Laboratory (CERL), and the National Renewable Energy Laboratory (NREL) worked together to explore the potential to reach the 2015 energy performance goal of the Energy Independence and Security Act of 2007: to reduce fossil fuel-generated energy consumption by 65% for five common military construction building types (U.S. Congress 2007). This report covers the analysis, approach, and results examining energy performance for the Army tactical equipment maintenance facility. Starting with a previous project by CERL and NREL that explored 30% energy savings for the Energy Policy Act of 2005 (U.S. Congress 2005), the current project was able to achieve 40%–63% site energy savings (depending on climate zone) compared to a baseline building model, and 51%–76% source energy savings compared to Commercial Buildings Energy Consumption Survey 2003 (EIA 2008) data for a similar building type. Recommended energy efficiency measures include passive house insulation standards, demand control ventilation strategies in the maintenance repair bays, radiant floor heating, transpired solar collectors, reduced lighting power densities, daylighting, and lighting control strategies.
INTRODUCTION
The Energy Independence and Security Act (EISA) of 2007 set aggressive energy performance goals for all U.S. federal buildings (U.S. Congress 2007). The law states that “buildings shall be designed so that the fossil fuel-generated energy consumption of the buildings is reduced, as compared with such energy consumption by a similar building in fiscal year 2003 (as measured by the Commercial Buildings Energy Consumption Survey or Residential Energy Consumption Survey data from the Energy Information Agency),” by the percentage specified in Table1.
2
Table 1. EISA 2007 Fossil Fuel Energy Reductions
Fiscal Year Percent Reduction 2010 55 2015 65 2020 80 2025 90 2030 100
The U.S. Army Corps of Engineers (USACE) Headquarters, the USACE Construction Energy Research Laboratory (CERL), and the National Renewable Energy Laboratory (NREL) worked together to explore the potential to reach the EISA 2015 energy performance goal for five common military construction building types. The building types explored included an unaccompanied enlisted personnel housing (barracks), a brigade headquarters (administrative building), a company operations facility, a tactical equipment maintenance facility (TEMF), and a dining facility. This report covers the analysis, approach, and results examining energy performance for a TEMF. A previous project by CERL and NREL that explored 30% energy savings for the Energy Policy Act of 2005 served as the starting point (Zhivov et al. 2009).
BUILDING DESCRIPTION
TEMFs house army vehicles that are being maintained and repaired. These facilities are equipped with typical vehicle maintenance equipment such as lifts and tools that enable service personnel to perform tasks that are similar to those performed in an automotive repair garage (Zhivov et al. 2009).
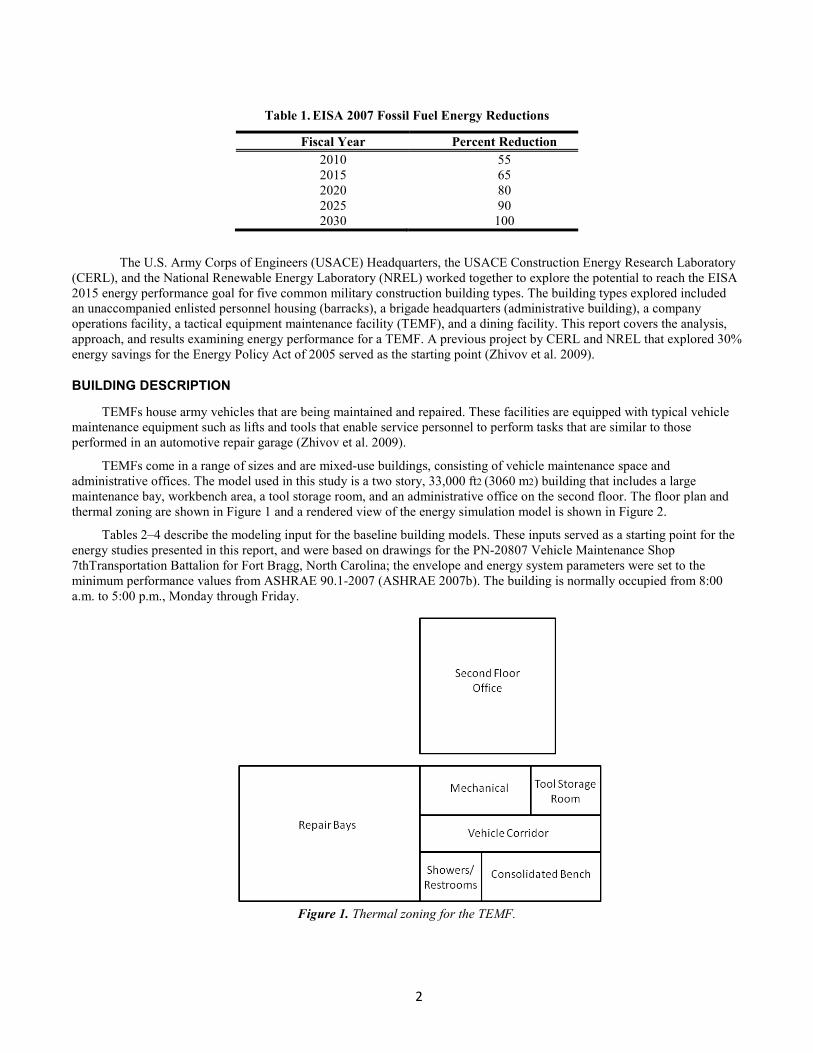
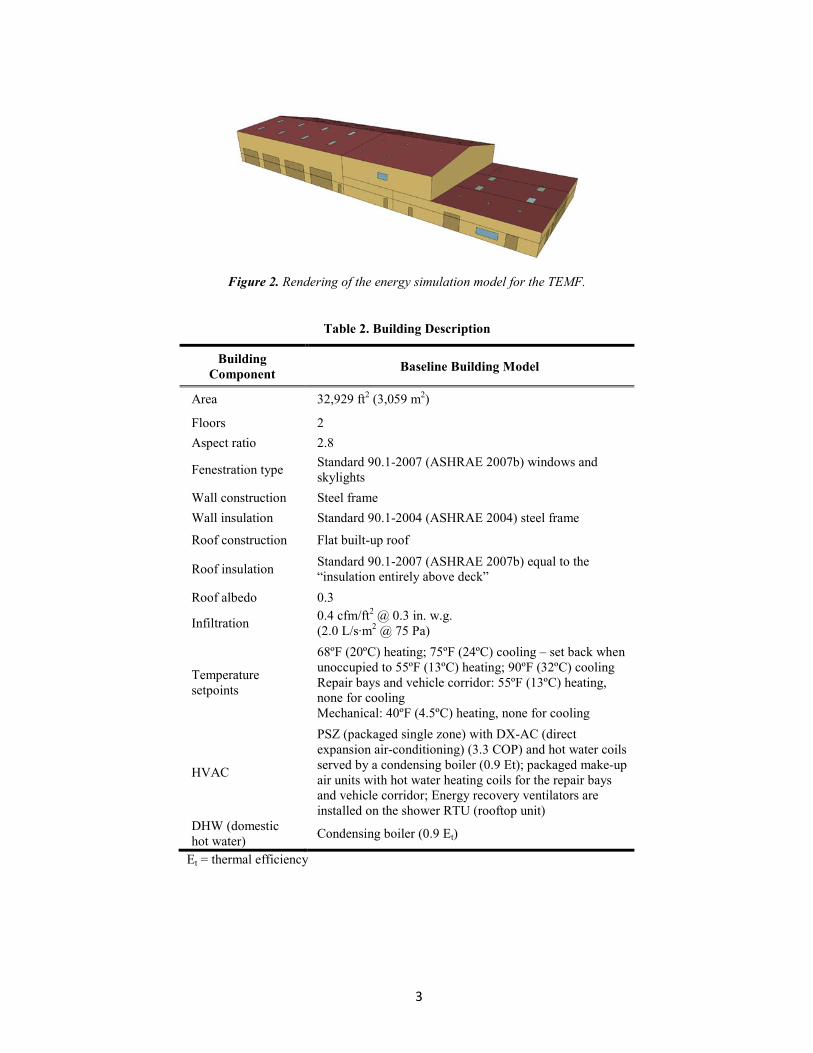
TEMFs come in a range of sizes and are mixed-use buildings, consisting of vehicle maintenance space and administrative offices. The model used in this study is a two story, 33,000 ft2 (3060 m2) building that includes a large maintenance bay, workbench area, a tool storage room, and an administrative office on the second floor. The floor plan and thermal zoning are shown in Figure 1 and a rendered view of the energy simulation model is shown in Figure 2.
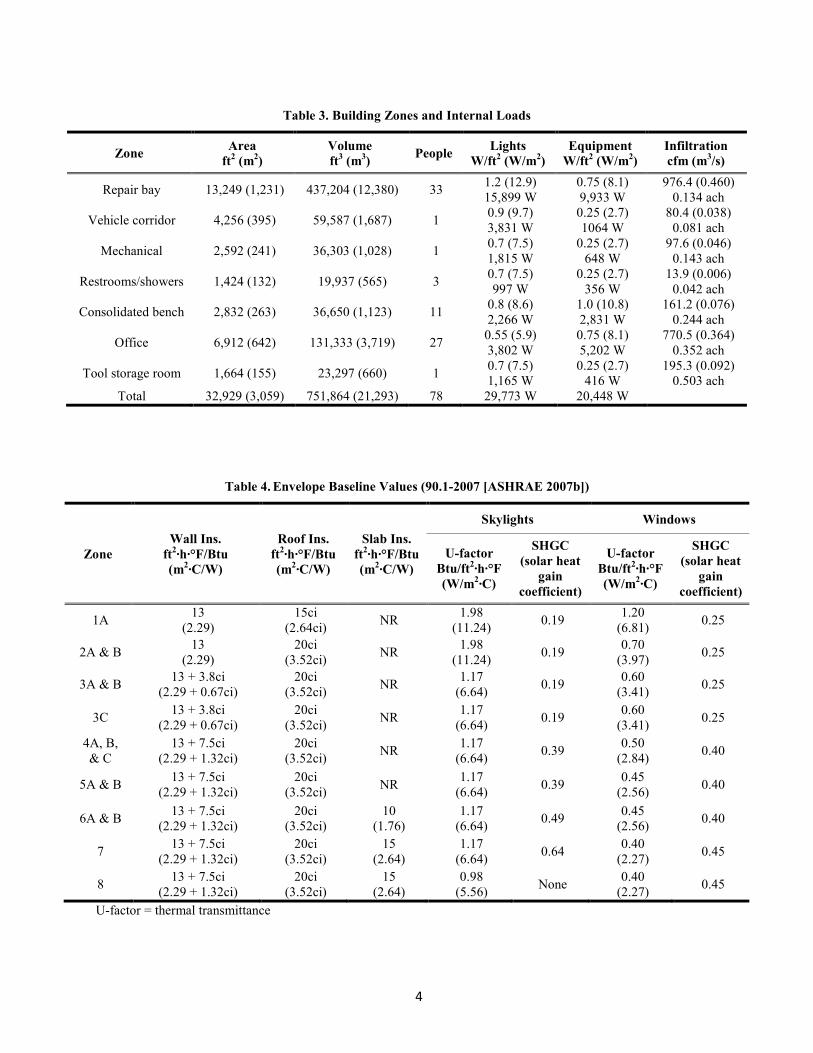
Tables 2–4 describe the modeling input for the baseline building models. These inputs served as a starting point for the energy studies presented in this report, and were based on drawings for the PN-20807 Vehicle Maintenance Shop 7thTransportation Battalion for Fort Bragg, North Carolina; the envelope and energy system parameters were set to the minimum performance values from ASHRAE 90.1-2007 (ASHRAE 2007b). The building is normally occupied from 8:00 a.m. to 5:00 p.m., Monday through Friday.
Figure 1. Thermal zoning for the TEMF.
3
Figure 2. Rendering of the energy simulation model for the TEMF.
Table 2. Building Description
Building Component Baseline Building Model
Area 32,929 ft2 (3,059 m2)
Floors 2 Aspect ratio 2.8
Fenestration type Standard 90.1-2007 (ASHRAE 2007b) windows and skylights
Wall construction Steel frame Wall insulation Standard 90.1-2004 (ASHRAE 2004) steel frame
Roof construction Flat built-up roof
Roof insulation Standard 90.1-2007 (ASHRAE 2007b) equal to the “insulation entirely above deck”
Roof albedo 0.3
Infiltration 0.4 cfm/ft2 @ 0.3 in. w.g. (2.0 L/s·m2 @ 75 Pa)
Temperature setpoints
68ºF (20ºC) heating; 75ºF (24ºC) cooling – set back when unoccupied to 55ºF (13ºC) heating; 90ºF (32ºC) cooling Repair bays and vehicle corridor: 55ºF (13ºC) heating, none for cooling Mechanical: 40ºF (4.5ºC) heating, none for cooling
HVAC
PSZ (packaged single zone) with DX-AC (direct expansion air-conditioning) (3.3 COP) and hot water coils served by a condensing boiler (0.9 Et); packaged make-up air units with hot water heating coils for the repair bays and vehicle corridor; Energy recovery ventilators are installed on the shower RTU (rooftop unit)
DHW (domestic hot water) Condensing boiler (0.9 Et)
Et = thermal efficiency
4
Table 3. Building Zones and Internal Loads
Zone Area ft2 (m2)
Volume ft3 (m3) People Lights
W/ft2 (W/m2) Equipment
W/ft2 (W/m2) Infiltration cfm (m3/s)
Repair bay 13,249 (1,231) 437,204 (12,380) 33 1.2 (12.9) 15,899 W
0.75 (8.1) 9,933 W
976.4 (0.460) 0.134 ach
Vehicle corridor 4,256 (395) 59,587 (1,687) 1 0.9 (9.7) 3,831 W
0.25 (2.7) 1064 W
80.4 (0.038) 0.081 ach
Mechanical 2,592 (241) 36,303 (1,028) 1 0.7 (7.5) 1,815 W
0.25 (2.7) 648 W
97.6 (0.046) 0.143 ach
Restrooms/showers 1,424 (132) 19,937 (565) 3 0.7 (7.5) 997 W
0.25 (2.7) 356 W
13.9 (0.006) 0.042 ach
Consolidated bench 2,832 (263) 36,650 (1,123) 11 0.8 (8.6) 2,266 W
1.0 (10.8) 2,831 W
161.2 (0.076) 0.244 ach
Office 6,912 (642) 131,333 (3,719) 27 0.55 (5.9) 3,802 W
0.75 (8.1) 5,202 W
770.5 (0.364) 0.352 ach
Tool storage room 1,664 (155) 23,297 (660) 1 0.7 (7.5) 1,165 W
0.25 (2.7) 416 W
195.3 (0.092) 0.503 ach
Total 32,929 (3,059) 751,864 (21,293) 78 29,773 W 20,448 W
Table 4. Envelope Baseline Values (90.1-2007 [ASHRAE 2007b])
Zone Wall Ins.
ft2∙h∙°F/Btu (m2∙C/W)
Roof Ins. ft2∙h∙°F/Btu (m2∙C/W)
Slab Ins. ft2∙h∙°F/Btu (m2∙C/W)
Skylights Windows
U-factor Btu/ft2∙h∙°F (W/m2∙C)
SHGC (solar heat
gain coefficient)
U-factor Btu/ft2∙h∙°F (W/m2∙C)
SHGC (solar heat
gain coefficient)
1A 13 (2.29)
15ci (2.64ci) NR 1.98
(11.24) 0.19 1.20 (6.81) 0.25
2A & B 13 (2.29)
20ci (3.52ci) NR 1.98
(11.24) 0.19 0.70 (3.97) 0.25
3A & B 13 + 3.8ci (2.29 + 0.67ci)
20ci (3.52ci) NR 1.17
(6.64) 0.19 0.60 (3.41) 0.25
3C 13 + 3.8ci (2.29 + 0.67ci)
20ci (3.52ci) NR 1.17
(6.64) 0.19 0.60 (3.41) 0.25
4A, B, & C
13 + 7.5ci (2.29 + 1.32ci)
20ci (3.52ci) NR 1.17
(6.64) 0.39 0.50 (2.84) 0.40
5A & B 13 + 7.5ci (2.29 + 1.32ci)
20ci (3.52ci) NR 1.17
(6.64) 0.39 0.45 (2.56) 0.40
6A & B 13 + 7.5ci (2.29 + 1.32ci)
20ci (3.52ci)
10 (1.76)
1.17 (6.64) 0.49 0.45
(2.56) 0.40
7 13 + 7.5ci (2.29 + 1.32ci)
20ci (3.52ci)
15 (2.64)
1.17 (6.64) 0.64 0.40
(2.27) 0.45
8 13 + 7.5ci (2.29 + 1.32ci)
20ci (3.52ci)
15 (2.64)
0.98 (5.56) None 0.40
(2.27) 0.45
U-factor = thermal transmittance
5
LOCATIONS
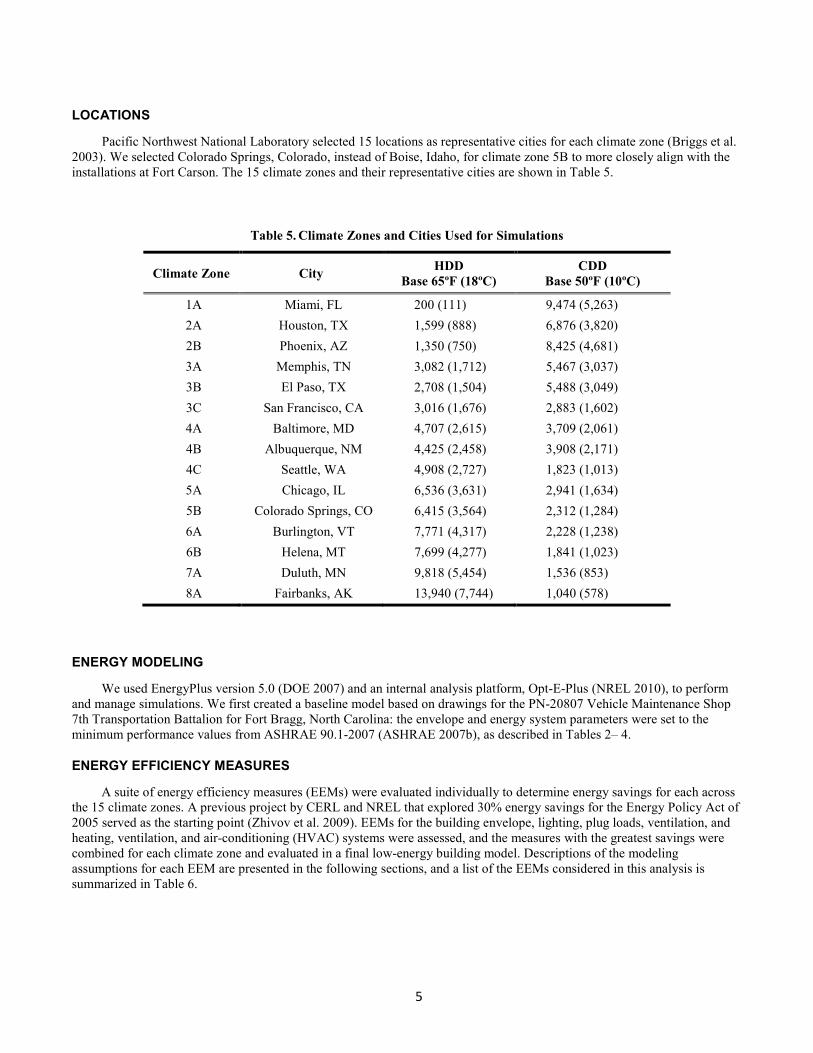
Pacific Northwest National Laboratory selected 15 locations as representative cities for each climate zone (Briggs et al. 2003). We selected Colorado Springs, Colorado, instead of Boise, Idaho, for climate zone 5B to more closely align with the installations at Fort Carson. The 15 climate zones and their representative cities are shown in Table 5.
Table 5. Climate Zones and Cities Used for Simulations
Climate Zone City HDD Base 65ºF (18ºC)
CDD Base 50ºF (10ºC)
1A Miami, FL 200 (111) 9,474 (5,263) 2A Houston, TX 1,599 (888) 6,876 (3,820) 2B Phoenix, AZ 1,350 (750) 8,425 (4,681) 3A Memphis, TN 3,082 (1,712) 5,467 (3,037) 3B El Paso, TX 2,708 (1,504) 5,488 (3,049) 3C San Francisco, CA 3,016 (1,676) 2,883 (1,602) 4A Baltimore, MD 4,707 (2,615) 3,709 (2,061) 4B Albuquerque, NM 4,425 (2,458) 3,908 (2,171) 4C Seattle, WA 4,908 (2,727) 1,823 (1,013) 5A Chicago, IL 6,536 (3,631) 2,941 (1,634) 5B Colorado Springs, CO 6,415 (3,564) 2,312 (1,284) 6A Burlington, VT 7,771 (4,317) 2,228 (1,238) 6B Helena, MT 7,699 (4,277) 1,841 (1,023) 7A Duluth, MN 9,818 (5,454) 1,536 (853) 8A Fairbanks, AK 13,940 (7,744) 1,040 (578)
ENERGY MODELING
We used EnergyPlus version 5.0 (DOE 2007) and an internal analysis platform, Opt-E-Plus (NREL 2010), to perform and manage simulations. We first created a baseline model based on drawings for the PN-20807 Vehicle Maintenance Shop 7th Transportation Battalion for Fort Bragg, North Carolina: the envelope and energy system parameters were set to the minimum performance values from ASHRAE 90.1-2007 (ASHRAE 2007b), as described in Tables 2– 4.
ENERGY EFFICIENCY MEASURES
A suite of energy efficiency measures (EEMs) were evaluated individually to determine energy savings for each across the 15 climate zones. A previous project by CERL and NREL that explored 30% energy savings for the Energy Policy Act of 2005 served as the starting point (Zhivov et al. 2009). EEMs for the building envelope, lighting, plug loads, ventilation, and heating, ventilation, and air-conditioning (HVAC) systems were assessed, and the measures with the greatest savings were combined for each climate zone and evaluated in a final low-energy building model. Descriptions of the modeling assumptions for each EEM are presented in the following sections, and a list of the EEMs considered in this analysis is summarized in Table 6.
6
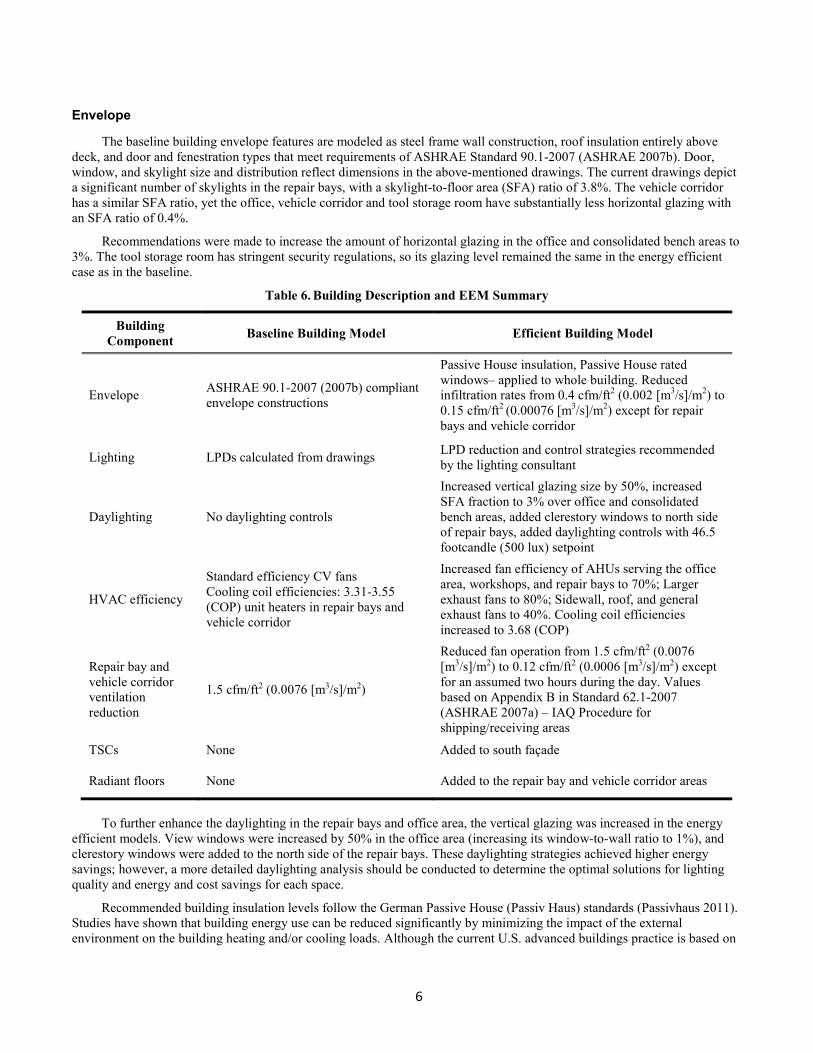
Envelope
The baseline building envelope features are modeled as steel frame wall construction, roof insulation entirely above deck, and door and fenestration types that meet requirements of ASHRAE Standard 90.1-2007 (ASHRAE 2007b). Door, window, and skylight size and distribution reflect dimensions in the above-mentioned drawings. The current drawings depict a significant number of skylights in the repair bays, with a skylight-to-floor area (SFA) ratio of 3.8%. The vehicle corridor has a similar SFA ratio, yet the office, vehicle corridor and tool storage room have substantially less horizontal glazing with an SFA ratio of 0.4%.
Recommendations were made to increase the amount of horizontal glazing in the office and consolidated bench areas to 3%. The tool storage room has stringent security regulations, so its glazing level remained the same in the energy efficient case as in the baseline.
Table 6. Building Description and EEM Summary
Building Component Baseline Building Model Efficient Building Model
Envelope ASHRAE 90.1-2007 (2007b) compliant envelope constructions
Passive House insulation, Passive House rated windows– applied to whole building. Reduced infiltration rates from 0.4 cfm/ft2 (0.002 [m3/s]/m2) to 0.15 cfm/ft2 (0.00076 [m3/s]/m2) except for repair bays and vehicle corridor
Lighting LPDs calculated from drawings LPD reduction and control strategies recommended by the lighting consultant
Daylighting No daylighting controls
Increased vertical glazing size by 50%, increased SFA fraction to 3% over office and consolidated bench areas, added clerestory windows to north side of repair bays, added daylighting controls with 46.5 footcandle (500 lux) setpoint
HVAC efficiency
Standard efficiency CV fans Cooling coil efficiencies: 3.31-3.55 (COP) unit heaters in repair bays and vehicle corridor
Increased fan efficiency of AHUs serving the office area, workshops, and repair bays to 70%; Larger exhaust fans to 80%; Sidewall, roof, and general exhaust fans to 40%. Cooling coil efficiencies increased to 3.68 (COP)
Repair bay and vehicle corridor ventilation reduction
1.5 cfm/ft2 (0.0076 [m3/s]/m2)
Reduced fan operation from 1.5 cfm/ft2 (0.0076 [m3/s]/m2) to 0.12 cfm/ft2 (0.0006 [m3/s]/m2) except for an assumed two hours during the day. Values based on Appendix B in Standard 62.1-2007 (ASHRAE 2007a) – IAQ Procedure for shipping/receiving areas
TSCs None Added to south façade
Radiant floors None Added to the repair bay and vehicle corridor areas
To further enhance the daylighting in the repair bays and office area, the vertical glazing was increased in the energy
efficient models. View windows were increased by 50% in the office area (increasing its window-to-wall ratio to 1%), and clerestory windows were added to the north side of the repair bays. These daylighting strategies achieved higher energy savings; however, a more detailed daylighting analysis should be conducted to determine the optimal solutions for lighting quality and energy and cost savings for each space.
Recommended building insulation levels follow the German Passive House (Passiv Haus) standards (Passivhaus 2011). Studies have shown that building energy use can be reduced significantly by minimizing the impact of the external environment on the building heating and/or cooling loads. Although the current U.S. advanced buildings practice is based on
7
ASHRAE Standards 90.1 (ASHRAE 2010) and 189.1 (ASHRAE 2009), the most rigorous standards for building envelope are the Passive House standards (ACE HQ 2011).
Typical Passive House characteristics for central European locations include: • Airtight building shell ≤ 0.6 ACH @ 50 Pa (0.2 in. w.g.) (~0.0006 (m3/s)/m2 (0.11cfm/ft2) of the building envelope
area at 75 Pa (0.3 in. w.g.) measured by a blower-door test). • Annual heat requirement ≤ 15 kWh/m2·year (< 4.75 kBtu/ft2·year ) • Primary energy ≤ 120 kWh/m2·year (38.1 kBtu/ft2·year) • Window U-value ≤ 0.8 W/m2·K (0.14 Btu/ft2·h·°F) • Ventilation system with heat recovery with ≥ 75% efficiency and low electric consumption @ 0.45 W·h/m3 (0.43
Btu/ft3) • Thermal bridge free construction ≤ 0.01 W/m·K (0.005 Btu/ft·h·°F)
In addition to a reduction in energy consumption, improved building insulation and airtightness results in a more stable
room temperature between day and night, higher internal wall surface temperatures in winter, and lower internal wall temperatures in summer. All these improve thermal comfort. A higher wall temperature in winter also reduces mold and mildew on internal wall surfaces, improving the quality of life in a building.
CERL researchers collaborated with Architekturburo Zielke Passivhäuser and the Passivhaus Institut in Germany to develop an interpretation of Passive House building envelope characteristics to be applied to U.S. construction specifics in all 15 U.S. Department of Energy (DOE) climate zones. More detailed information about Passive House insulation can be found in the MILCON Summary Report (ACE HQ 2011). A summary of the Passive House criteria can be found in Table 7.
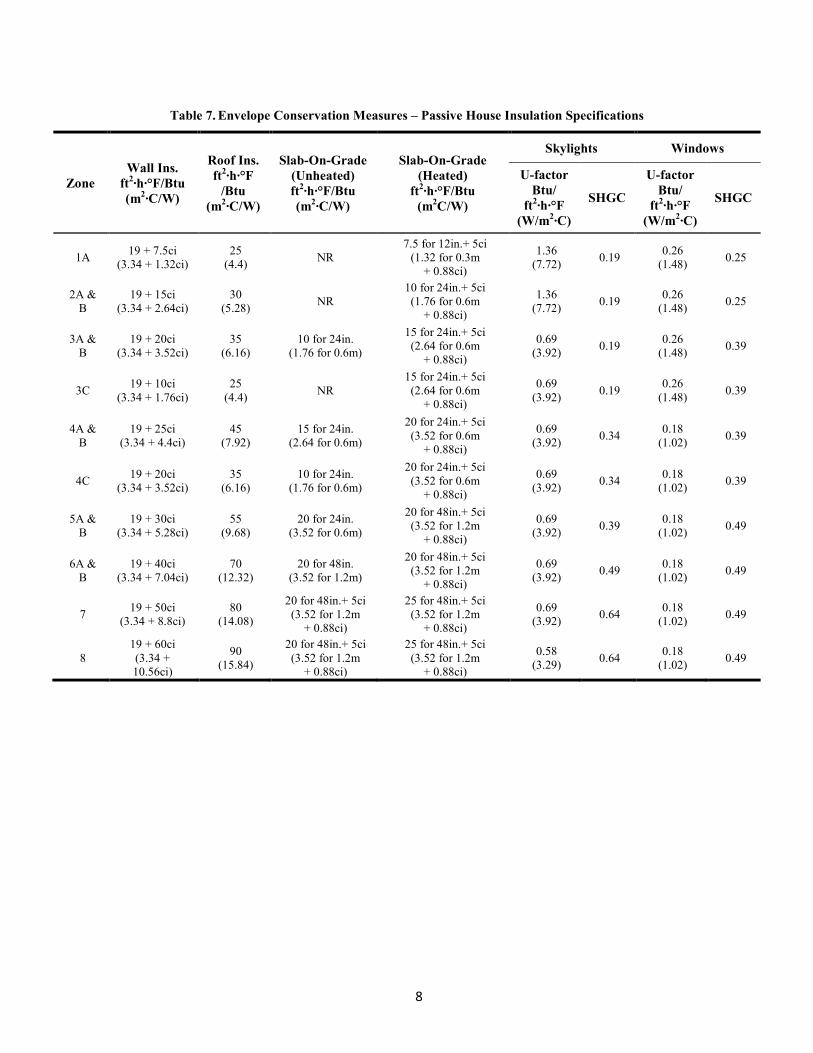
8
Table 7. Envelope Conservation Measures – Passive House Insulation Specifications
Zone Wall Ins.
ft2∙h∙°F/Btu (m2∙C/W)
Roof Ins. ft2∙h∙°F
/Btu (m2∙C/W)
Slab-On-Grade (Unheated) ft2∙h∙°F/Btu (m2∙C/W)
Slab-On-Grade (Heated)
ft2∙h∙°F/Btu (m2C/W)
Skylights Windows
U-factor Btu/
ft2∙h∙°F (W/m2∙C)
SHGC
U-factor Btu/
ft2∙h∙°F (W/m2∙C)
SHGC
1A 19 + 7.5ci (3.34 + 1.32ci)
25 (4.4) NR
7.5 for 12in.+ 5ci (1.32 for 0.3m
+ 0.88ci)
1.36 (7.72) 0.19 0.26
(1.48) 0.25
2A & B
19 + 15ci (3.34 + 2.64ci)
30 (5.28) NR
10 for 24in.+ 5ci (1.76 for 0.6m
+ 0.88ci)
1.36 (7.72) 0.19 0.26
(1.48) 0.25
3A & B
19 + 20ci (3.34 + 3.52ci)
35 (6.16)
10 for 24in. (1.76 for 0.6m)
15 for 24in.+ 5ci (2.64 for 0.6m
+ 0.88ci)
0.69 (3.92) 0.19 0.26
(1.48) 0.39
3C 19 + 10ci (3.34 + 1.76ci)
25 (4.4) NR
15 for 24in.+ 5ci (2.64 for 0.6m
+ 0.88ci)
0.69 (3.92) 0.19 0.26
(1.48) 0.39
4A & B
19 + 25ci (3.34 + 4.4ci)
45 (7.92)
15 for 24in. (2.64 for 0.6m)
20 for 24in.+ 5ci (3.52 for 0.6m
+ 0.88ci)
0.69 (3.92) 0.34 0.18
(1.02) 0.39
4C 19 + 20ci (3.34 + 3.52ci)
35 (6.16)
10 for 24in. (1.76 for 0.6m)
20 for 24in.+ 5ci (3.52 for 0.6m
+ 0.88ci)
0.69 (3.92) 0.34 0.18
(1.02) 0.39
5A & B
19 + 30ci (3.34 + 5.28ci)
55 (9.68)
20 for 24in. (3.52 for 0.6m)
20 for 48in.+ 5ci (3.52 for 1.2m
+ 0.88ci)
0.69 (3.92) 0.39 0.18
(1.02) 0.49
6A & B
19 + 40ci (3.34 + 7.04ci)
70 (12.32)
20 for 48in. (3.52 for 1.2m)
20 for 48in.+ 5ci (3.52 for 1.2m
+ 0.88ci)
0.69 (3.92) 0.49 0.18
(1.02) 0.49
7 19 + 50ci (3.34 + 8.8ci)
80 (14.08)
20 for 48in.+ 5ci (3.52 for 1.2m
+ 0.88ci)
25 for 48in.+ 5ci (3.52 for 1.2m
+ 0.88ci)
0.69 (3.92) 0.64 0.18
(1.02) 0.49
8 19 + 60ci (3.34 + 10.56ci)
90 (15.84)
20 for 48in.+ 5ci (3.52 for 1.2m
+ 0.88ci)
25 for 48in.+ 5ci (3.52 for 1.2m
+ 0.88ci)
0.58 (3.29) 0.64 0.18
(1.02) 0.49
9
Lighting and Plug Loads
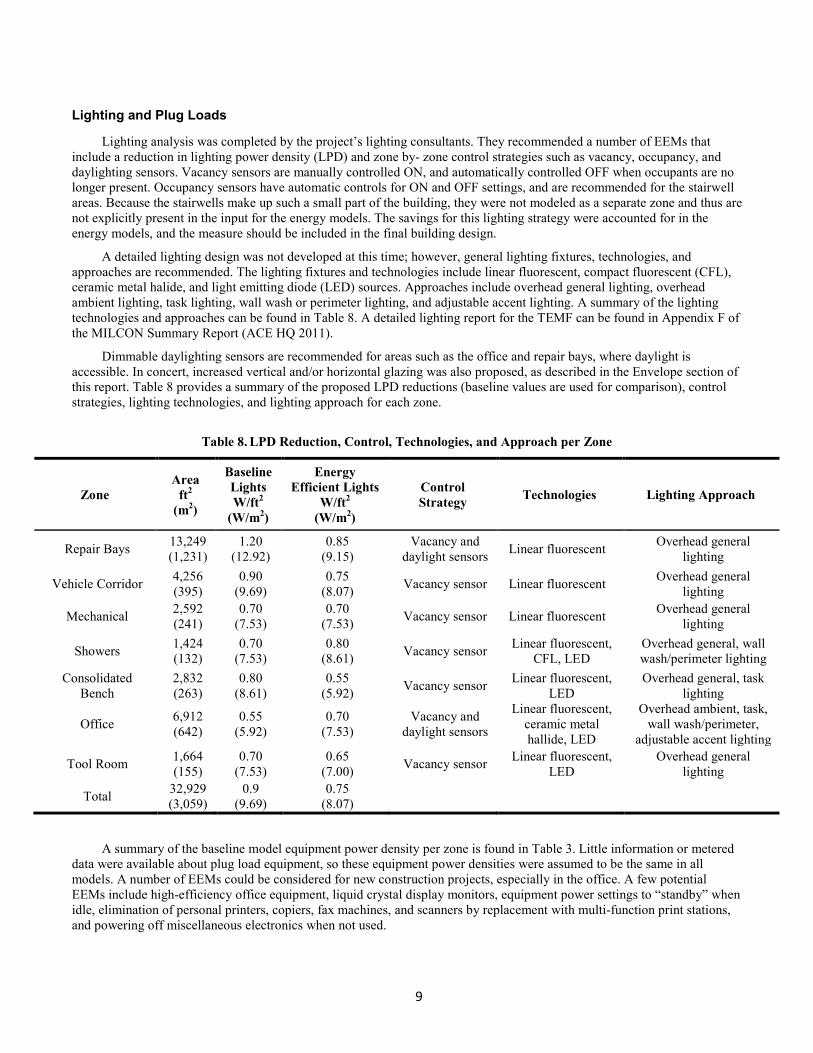
Lighting analysis was completed by the project’s lighting consultants. They recommended a number of EEMs that include a reduction in lighting power density (LPD) and zone by- zone control strategies such as vacancy, occupancy, and daylighting sensors. Vacancy sensors are manually controlled ON, and automatically controlled OFF when occupants are no longer present. Occupancy sensors have automatic controls for ON and OFF settings, and are recommended for the stairwell areas. Because the stairwells make up such a small part of the building, they were not modeled as a separate zone and thus are not explicitly present in the input for the energy models. The savings for this lighting strategy were accounted for in the energy models, and the measure should be included in the final building design.
A detailed lighting design was not developed at this time; however, general lighting fixtures, technologies, and approaches are recommended. The lighting fixtures and technologies include linear fluorescent, compact fluorescent (CFL), ceramic metal halide, and light emitting diode (LED) sources. Approaches include overhead general lighting, overhead ambient lighting, task lighting, wall wash or perimeter lighting, and adjustable accent lighting. A summary of the lighting technologies and approaches can be found in Table 8. A detailed lighting report for the TEMF can be found in Appendix F of the MILCON Summary Report (ACE HQ 2011).
Dimmable daylighting sensors are recommended for areas such as the office and repair bays, where daylight is accessible. In concert, increased vertical and/or horizontal glazing was also proposed, as described in the Envelope section of this report. Table 8 provides a summary of the proposed LPD reductions (baseline values are used for comparison), control strategies, lighting technologies, and lighting approach for each zone.
Table 8. LPD Reduction, Control, Technologies, and Approach per Zone
Zone Area
ft2 (m2)
Baseline Lights W/ft2
(W/m2)
Energy Efficient Lights
W/ft2
(W/m2)
Control Strategy Technologies Lighting Approach
Repair Bays 13,249 (1,231)
1.20 (12.92)
0.85 (9.15)
Vacancy and daylight sensors Linear fluorescent Overhead general
lighting
Vehicle Corridor 4,256 (395)
0.90 (9.69)
0.75 (8.07) Vacancy sensor Linear fluorescent Overhead general
lighting
Mechanical 2,592 (241)
0.70 (7.53)
0.70 (7.53) Vacancy sensor Linear fluorescent Overhead general
lighting
Showers 1,424 (132)
0.70 (7.53)
0.80 (8.61) Vacancy sensor Linear fluorescent,
CFL, LED Overhead general, wall wash/perimeter lighting
Consolidated Bench
2,832 (263)
0.80 (8.61)
0.55 (5.92) Vacancy sensor Linear fluorescent,
LED Overhead general, task
lighting
Office 6,912 (642)
0.55 (5.92)
0.70 (7.53)
Vacancy and daylight sensors
Linear fluorescent, ceramic metal hallide, LED
Overhead ambient, task, wall wash/perimeter,
adjustable accent lighting
Tool Room 1,664 (155)
0.70 (7.53)
0.65 (7.00) Vacancy sensor Linear fluorescent,
LED Overhead general
lighting
Total 32,929 (3,059)
0.9 (9.69)
0.75 (8.07)
A summary of the baseline model equipment power density per zone is found in Table 3. Little information or metered
data were available about plug load equipment, so these equipment power densities were assumed to be the same in all models. A number of EEMs could be considered for new construction projects, especially in the office. A few potential EEMs include high-efficiency office equipment, liquid crystal display monitors, equipment power settings to “standby” when idle, elimination of personal printers, copiers, fax machines, and scanners by replacement with multi-function print stations, and powering off miscellaneous electronics when not used.
10
Infiltration
The U.S. ACE Engineering Construction Bulletin 29- 2009 (ACE HQ 2009) states that the air leakage rate of a building envelope shall not exceed 0.25 cfm/ft2 (0.0013 [m3/s]/m2) at a pressure differential of 0.3 in. w.g. (75 Pa) for new and renovation construction projects. In 2010 more than 200 buildings were constructed and renovated to meet or exceed this requirement (achieving airtightness of 0.10 cfm/ft2 [0.0005 [m3/s]/m2] or better was not uncommon) at no or little additional cost. Based on this experience and industry consensus, the airtightness level for this study was lowered to 0.15 cfm/ft2 (0.0007 [m3/s]/m2) at a pressure differential of 0.3 in. w.g. (75 Pa).
The mechanical ventilation system pressurizes the office area by providing outdoor air equal to the exhaust plus the air leakage at 0.02 in. w.g. (5 Pa). Infiltration is often assumed to go to zero when buildings are pressurized. The average uncontrolled infiltration when the building is pressurized was presumably reduced to 10% of the value calculated at 0.02 in. w.g. (5 Pa). The difference in the leakage rates between the two air tightness levels was accounted for in the outdoor ventilation rates for the baseline and energy-efficient models.
Ventilation
A significant potential for energy savings is associated with the ventilation flow rates for the repair bays and vehicle corridor. ASHRAE 62.1-2007 (ASHRAE 2007a) recommends a ventilation rate of 1.5 cfm/ft2 (0.0076 [m3/s]/m2) for automotive maintenance and repair areas. This ventilation rate consists of 100% outdoor air with no recirculation air, and reflects the current operation of the TEMF maintenance areas during occupied hours. The high flow rate is designed to ensure safe levels of health-threatening contaminants emitted in vehicle exhaust.
Ventilation air in the maintenance bays and vehicle corridor is minimally conditioned to 55°F (12.78°C) during the heating season. Typically, for large volumetric spaces such as a TEMF, heat recovery devices should be considered for dedicated outdoor air systems in colder climate zones. The air is only minimally heated during the winter, however, so the energy savings from heat recovery devices are insignificant. Thus, EEMs applied to the maintenance areas focused on HVAC design, high-efficiency equipment, and ventilation flow reduction strategies.
Following the IAQ procedure of ASHRAE Standard 62.1-2007 (ASHRAE 2007a) Appendix B, a demand control flow reduction strategy for the repair bays was modeled to drastically reduce fan flow rates from 1.5 cfm/ft2 (0.0076 [m3/s]/m2) to 0.12 cfm/ft2 (0.0006 [m3/s]/m2) for most operating hours. The reduced minimum ventilation flow rate of 0.12 cfm/ft2 (0.0006 [m3/s]/m2) was calculated by assuming that the minimum ventilation requirement for the repair bays and vehicle corridor could be equivalent to the minimum ventilation rates in the breathing zone for shipping and receiving areas—when the space is vacant of running or idling vehicles. Of course, if vehicles are present and contaminant levels rise, the ventilation system will have the capacity to meet the full ASHRAE recommended ventilation rate of 1.5 cfm/ft2 (0.0076 [m3/s]/m2). This strategy ensures that contaminant levels will not rise above health-safety levels, and allows for a significant reduction in ventilation flow rates when contaminant levels are low.
The major health-threatening contaminants in diesel engine exhaust are carbon monoxide, carbon dioxide, nitric oxide, nitrogen dioxide, formaldehyde, and sulfur dioxide (ASHRAE 2007c). The Occupation Safety and Health Administration and the American Conference of Governmental Industrial Hygienists publish permissible exposure limit (OSHA 2011) and threshold limit values (ACGIH 2001) for each contaminant. This information can be used to detect high contaminant levels with sensors. Sensor placement should also be considered and will require a more specific volumetric analysis of contaminant generation and air exchange rates (ASHRAE 2007c).
To account for varying contaminant levels throughout the day, the ventilation flow rates in the energy model were programmed to run at 1.5 cfm/ft2 (0.0076 [m3/s]/m2) for two hours during occupied hours, and 0.12 cfm/ft2 (0.0006 [m3/s]/m2) for the remaining occupied hours—and turning off at night. This assumption was based on communications with TEMF operation engineers about typical TEMF operation and space use.
Close capture evacuation systems for vehicle exhaust fumes should be considered to further reduce the need for higher ventilation rates in the maintenance areas. These can be placed directly on vehicle tail pipes to trap and remove byproducts of the engine combustion process (gas or diesel) without contaminating the building air (Zhivov et al. 2009).
HVAC Systems
The baseline HVAC design for the repair bays and vehicle corridor includes a dedicated outdoor air system that minimally conditions outdoor air (the air is only heated to 55°F [12.78°C]), with high-temperature overhead radiant heaters
11
for supplemental heat. Along with the flow reduction strategy that was discussed in the previous section, two heating EEMs were explored. Radiant floors and transpired solar collectors (TSCs) are recommended for colder climate zones. The main driver for recommending radiant floor heat was to provide a more uniform heating source for maintenance personnel. The high temperature overhead radiant heaters are less successful at maintaining thermal comfort when workers are blocked from the radiant heat. This can occur frequently, especially when maintenance personnel work behind or under a vehicle, or in any situation where the radiant heaters are blocked from the worker’s view.
TSCs were also considered for preheating ventilation air; these draw makeup air through perforated steel or aluminum cladding that is warmed by solar radiation. The TSC is typically attached to the south façade, with an air gap between the wall and the TSC cladding. The TSC is dark-colored to absorb maximum solar radiation, and the warm air is drawn through the perforations and air gap by the ventilation system fan to preheat ventilation air.
TSCs are cost effective and energy efficient for preheating ventilation air and are recommended for climate zones 2A through 8. Energy savings are most significant in climate zones 3A to 7. The collectors were sized to meet flows of 7–10 cfm/ft2 (0.35-0.5 [m3/s]/m2). The performance depends mostly on four parameters: the solar reflectance of the wall, the wall orientation, the size and spacing of the perforations, and the pressure drop maintained by the ventilation system across the wall. For a properly designed wall with small, closely spaced perforations and a relatively high pressure drop, the laminar boundary layer created by suction at the wall will largely negate the effects of changing wind speed and direction (Zhivov et al. 2009). TSCs following these design criteria were modeled on the south façade of the TEMF, feeding into the ventilation system of the repair bays and vehicle corridor.
The baseline HVAC design for the office area includes typical rooftop units (RTUs) with standard efficiency, constant volume (CV) fans. Serving the RTUs is a condensing boiler and direct expansion cooling coils. EEMs applied to this system design include increased fan and cooling coil efficiencies.
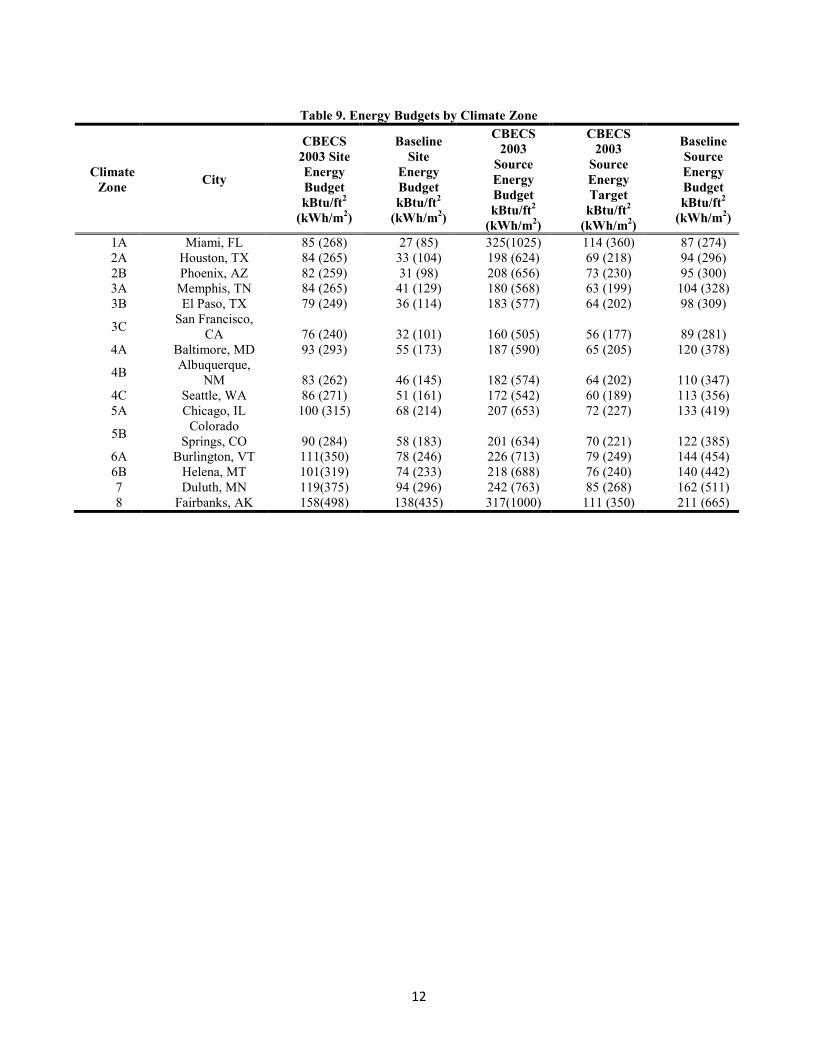
ENERGY BUDGETS
The annual energy use intensity (EUI) for the ASHRAE Standard 90.1 (2010) baseline models in each climate were simulated by EnergyPlus version 5.0 (DOE 2007) and used as baseline comparisons for the energy-efficient models. EISA 2007, however, requires that the building source energy be compared to EUI data for a similar building type measured by the 2003 Commercial Buildings Energy Consumption Survey (CBECS) (EIA 2008). The project thus first compared the site EUI of the energy-efficient models to a baseline TEMF model for each climate zone to achieve the maximum site energy savings. The energy-efficient site EUIs were then converted to source EUIs and compared to source EUI values measured by CBECS for “other repair service” buildings.
The site EUIs from 2003 CBECS (EIA 2008) are based on the median value for each CBECS building category (Sharp 2010). The source EUIs were calculated with conversion factors of 11.4 kBtu/kWh (12.0 MJ/kWh) for electricity, and 1.047 kBtu/kBtu for natural gas, as defined by the U.S. Energy Information Administration’s (EIA) 2003 Annual Energy Outlook (EIA 2003). The EUIs for each climate zone were calculated by adjusting the CBECS median values with climate zone multipliers for each building type from energy simulations of the DOE Reference Building Models (Deru et al. 2011).
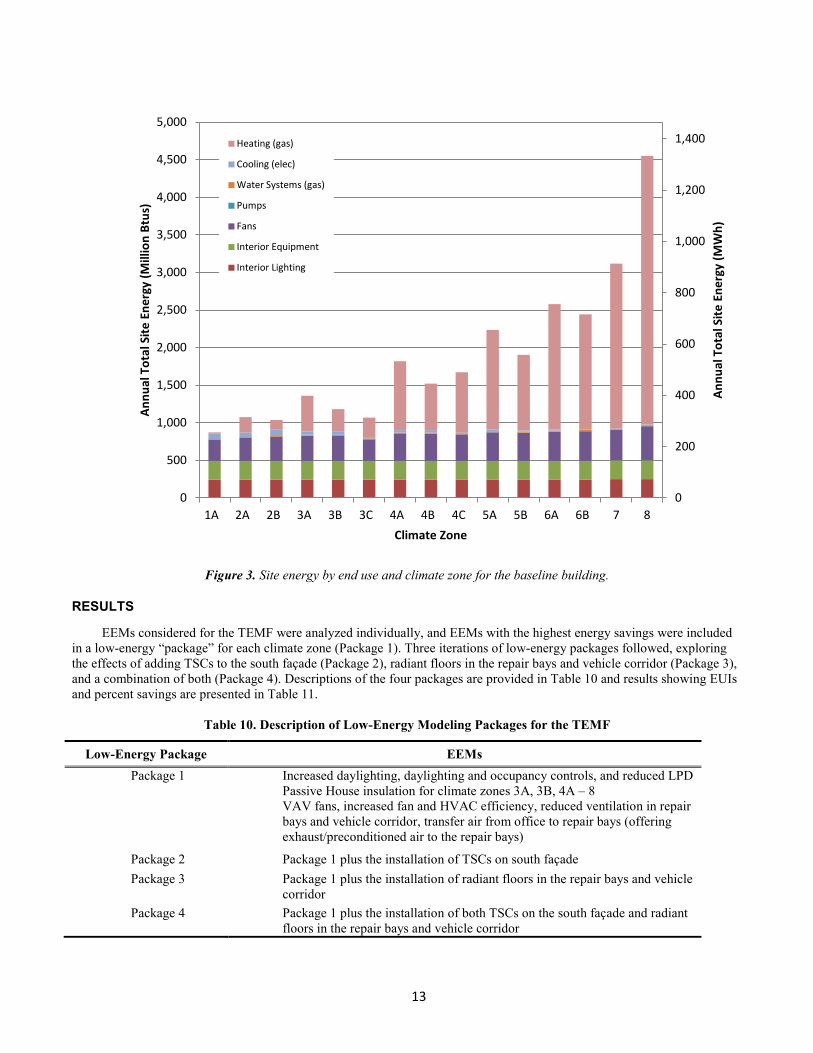
The target energy budget is 65% of the baseline CBECS source EUI values. The “other repair service” CBECS building category and source EUIs were chosen for this study. Site and source EUIs for the CBECS baseline and target energy budgets are shown in Table 9 for each climate zone. A break out of the modeled baseline building’s site energy consumption by end use is shown in Figure 3.
12
Table 9. Energy Budgets by Climate Zone
Climate Zone City
CBECS 2003 Site Energy Budget kBtu/ft2
(kWh/m2)
Baseline Site
Energy Budget kBtu/ft2
(kWh/m2)
CBECS 2003
Source Energy Budget kBtu/ft2
(kWh/m2)
CBECS 2003
Source Energy Target
kBtu/ft2 (kWh/m2)
Baseline Source Energy Budget kBtu/ft2
(kWh/m2)
1A Miami, FL 85 (268) 27 (85) 325(1025) 114 (360) 87 (274) 2A Houston, TX 84 (265) 33 (104) 198 (624) 69 (218) 94 (296) 2B Phoenix, AZ 82 (259) 31 (98) 208 (656) 73 (230) 95 (300) 3A Memphis, TN 84 (265) 41 (129) 180 (568) 63 (199) 104 (328) 3B El Paso, TX 79 (249) 36 (114) 183 (577) 64 (202) 98 (309)
3C San Francisco, CA 76 (240) 32 (101) 160 (505) 56 (177) 89 (281)
4A Baltimore, MD 93 (293) 55 (173) 187 (590) 65 (205) 120 (378)
4B Albuquerque, NM 83 (262) 46 (145) 182 (574) 64 (202) 110 (347)
4C Seattle, WA 86 (271) 51 (161) 172 (542) 60 (189) 113 (356) 5A Chicago, IL 100 (315) 68 (214) 207 (653) 72 (227) 133 (419)
5B Colorado Springs, CO 90 (284) 58 (183) 201 (634) 70 (221) 122 (385)
6A Burlington, VT 111(350) 78 (246) 226 (713) 79 (249) 144 (454) 6B Helena, MT 101(319) 74 (233) 218 (688) 76 (240) 140 (442) 7 Duluth, MN 119(375) 94 (296) 242 (763) 85 (268) 162 (511) 8 Fairbanks, AK 158(498) 138(435) 317(1000) 111 (350) 211 (665)
13
Figure 3. Site energy by end use and climate zone for the baseline building.
RESULTS
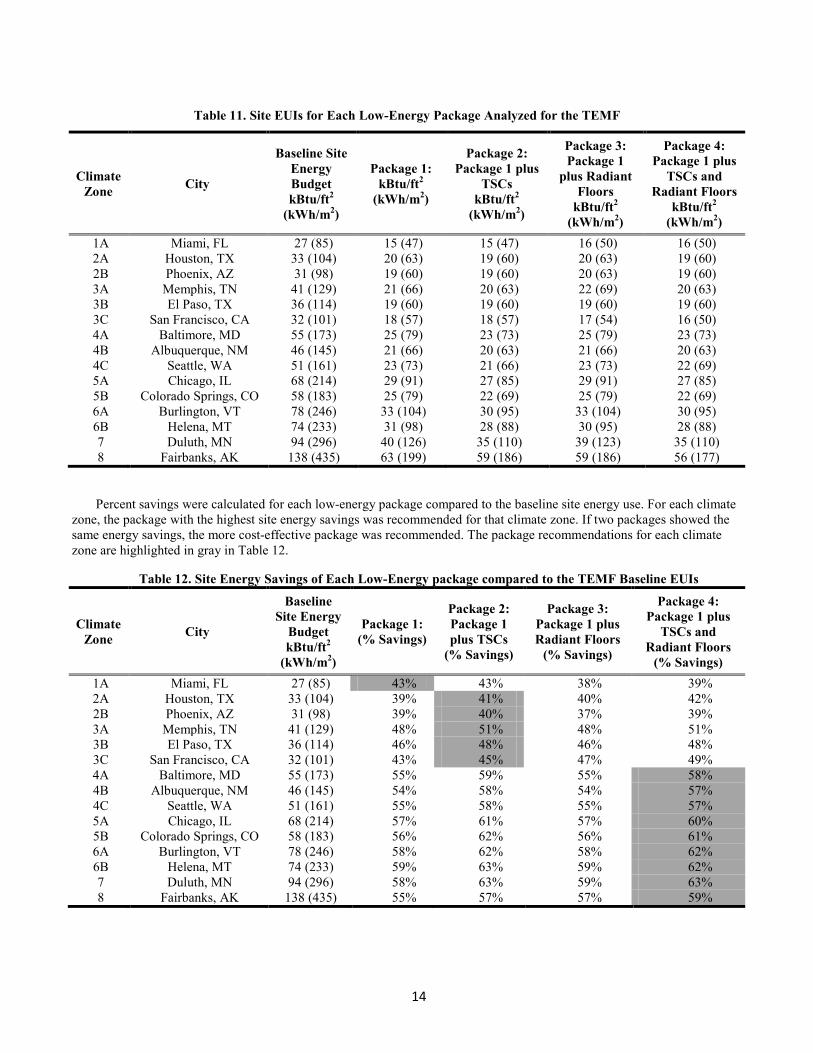
EEMs considered for the TEMF were analyzed individually, and EEMs with the highest energy savings were included in a low-energy “package” for each climate zone (Package 1). Three iterations of low-energy packages followed, exploring the effects of adding TSCs to the south façade (Package 2), radiant floors in the repair bays and vehicle corridor (Package 3), and a combination of both (Package 4). Descriptions of the four packages are provided in Table 10 and results showing EUIs and percent savings are presented in Table 11.
Table 10. Description of Low-Energy Modeling Packages for the TEMF
Low-Energy Package EEMs Package 1 Increased daylighting, daylighting and occupancy controls, and reduced LPD
Passive House insulation for climate zones 3A, 3B, 4A – 8 VAV fans, increased fan and HVAC efficiency, reduced ventilation in repair bays and vehicle corridor, transfer air from office to repair bays (offering exhaust/preconditioned air to the repair bays)
Package 2 Package 1 plus the installation of TSCs on south façade Package 3 Package 1 plus the installation of radiant floors in the repair bays and vehicle
corridor Package 4 Package 1 plus the installation of both TSCs on the south façade and radiant
floors in the repair bays and vehicle corridor
0
200
400
600
800
1,000
1,200
1,400
0
500
1,000
1,500
2,000
2,500
3,000
3,500
4,000
4,500
5,000
1A 2A 2B 3A 3B 3C 4A 4B 4C 5A 5B 6A 6B 7 8
Ann
ual T
otal
Sit
e En
ergy
(MW
h)
Ann
ual T
otal
Sit
e En
ergy
(Mill
ion
Btus
)
Climate Zone
Heating (gas)
Cooling (elec)
Water Systems (gas)
Pumps
Fans
Interior Equipment
Interior Lighting
14
Table 11. Site EUIs for Each Low-Energy Package Analyzed for the TEMF
Climate Zone City
Baseline Site Energy Budget kBtu/ft2
(kWh/m2)
Package 1: kBtu/ft2
(kWh/m2)
Package 2: Package 1 plus
TSCs kBtu/ft2
(kWh/m2)
Package 3: Package 1
plus Radiant Floors
kBtu/ft2
(kWh/m2)
Package 4: Package 1 plus
TSCs and Radiant Floors
kBtu/ft2
(kWh/m2) 1A Miami, FL 27 (85) 15 (47) 15 (47) 16 (50) 16 (50) 2A Houston, TX 33 (104) 20 (63) 19 (60) 20 (63) 19 (60) 2B Phoenix, AZ 31 (98) 19 (60) 19 (60) 20 (63) 19 (60) 3A Memphis, TN 41 (129) 21 (66) 20 (63) 22 (69) 20 (63) 3B El Paso, TX 36 (114) 19 (60) 19 (60) 19 (60) 19 (60) 3C San Francisco, CA 32 (101) 18 (57) 18 (57) 17 (54) 16 (50) 4A Baltimore, MD 55 (173) 25 (79) 23 (73) 25 (79) 23 (73) 4B Albuquerque, NM 46 (145) 21 (66) 20 (63) 21 (66) 20 (63) 4C Seattle, WA 51 (161) 23 (73) 21 (66) 23 (73) 22 (69) 5A Chicago, IL 68 (214) 29 (91) 27 (85) 29 (91) 27 (85) 5B Colorado Springs, CO 58 (183) 25 (79) 22 (69) 25 (79) 22 (69) 6A Burlington, VT 78 (246) 33 (104) 30 (95) 33 (104) 30 (95) 6B Helena, MT 74 (233) 31 (98) 28 (88) 30 (95) 28 (88) 7 Duluth, MN 94 (296) 40 (126) 35 (110) 39 (123) 35 (110) 8 Fairbanks, AK 138 (435) 63 (199) 59 (186) 59 (186) 56 (177)
Percent savings were calculated for each low-energy package compared to the baseline site energy use. For each climate zone, the package with the highest site energy savings was recommended for that climate zone. If two packages showed the same energy savings, the more cost-effective package was recommended. The package recommendations for each climate zone are highlighted in gray in Table 12.
Table 12. Site Energy Savings of Each Low-Energy package compared to the TEMF Baseline EUIs
Climate Zone City
Baseline Site Energy
Budget kBtu/ft2
(kWh/m2)
Package 1: (% Savings)
Package 2: Package 1 plus TSCs
(% Savings)
Package 3: Package 1 plus Radiant Floors
(% Savings)
Package 4: Package 1 plus
TSCs and Radiant Floors
(% Savings) 1A Miami, FL 27 (85) 43% 43% 38% 39% 2A Houston, TX 33 (104) 39% 41% 40% 42% 2B Phoenix, AZ 31 (98) 39% 40% 37% 39% 3A Memphis, TN 41 (129) 48% 51% 48% 51% 3B El Paso, TX 36 (114) 46% 48% 46% 48% 3C San Francisco, CA 32 (101) 43% 45% 47% 49% 4A Baltimore, MD 55 (173) 55% 59% 55% 58% 4B Albuquerque, NM 46 (145) 54% 58% 54% 57% 4C Seattle, WA 51 (161) 55% 58% 55% 57% 5A Chicago, IL 68 (214) 57% 61% 57% 60% 5B Colorado Springs, CO 58 (183) 56% 62% 56% 61% 6A Burlington, VT 78 (246) 58% 62% 58% 62% 6B Helena, MT 74 (233) 59% 63% 59% 62% 7 Duluth, MN 94 (296) 58% 63% 59% 63% 8 Fairbanks, AK 138 (435) 55% 57% 57% 59%
15
The recommendations highlighted in Table 12 were based on the level of energy savings and a rough assumption on cost feasibility for TSCs and radiant floors. We were able to achieve 40%–63% site energy savings (depending on climate zone) compared to the baseline building models. Achieving the highest energy savings was the goal for this project. However, for climate zones 4A through 8, radiant floors were recommended along with TSCs to increase occupant comfort in the repair bays and vehicle corridor, even though this option (in some cases) shows slightly lower energy savings than Package 2.
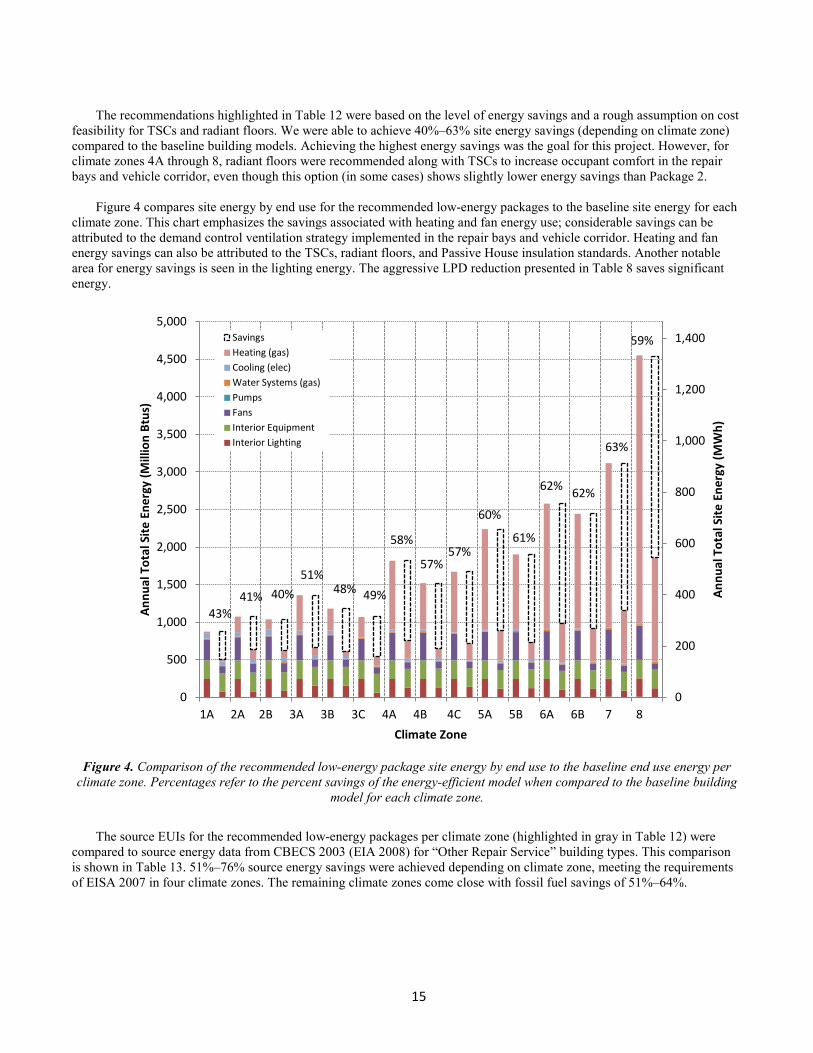
Figure 4 compares site energy by end use for the recommended low-energy packages to the baseline site energy for each
climate zone. This chart emphasizes the savings associated with heating and fan energy use; considerable savings can be attributed to the demand control ventilation strategy implemented in the repair bays and vehicle corridor. Heating and fan energy savings can also be attributed to the TSCs, radiant floors, and Passive House insulation standards. Another notable area for energy savings is seen in the lighting energy. The aggressive LPD reduction presented in Table 8 saves significant energy.
Figure 4. Comparison of the recommended low-energy package site energy by end use to the baseline end use energy per
climate zone. Percentages refer to the percent savings of the energy-efficient model when compared to the baseline building model for each climate zone.
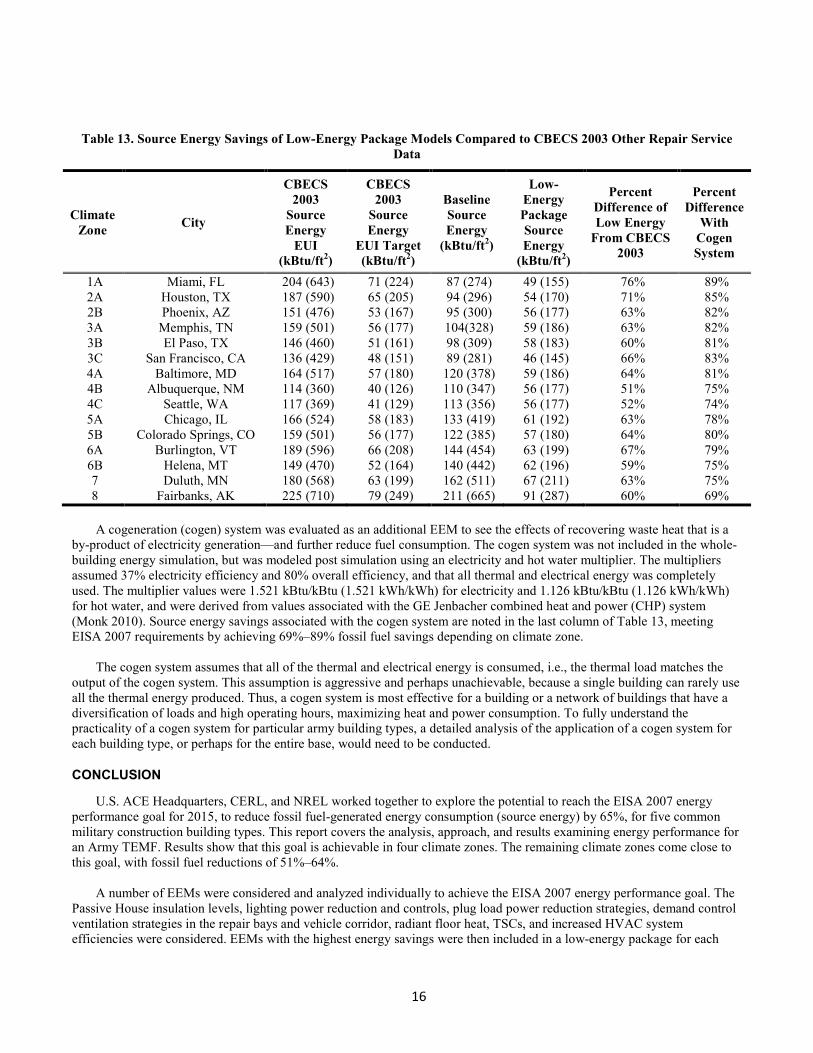
The source EUIs for the recommended low-energy packages per climate zone (highlighted in gray in Table 12) were compared to source energy data from CBECS 2003 (EIA 2008) for “Other Repair Service” building types. This comparison is shown in Table 13. 51%–76% source energy savings were achieved depending on climate zone, meeting the requirements of EISA 2007 in four climate zones. The remaining climate zones come close with fossil fuel savings of 51%–64%.
0
200
400
600
800
1,000
1,200
1,400
0
500
1,000
1,500
2,000
2,500
3,000
3,500
4,000
4,500
5,000
1A 2A 2B 3A 3B 3C 4A 4B 4C 5A 5B 6A 6B 7 8 A
nnua
l Tot
al S
ite
Ener
gy (M
Wh)
Ann
ual T
otal
Sit
e En
ergy
(Mill
ion
Btus
)
Climate Zone
Savings Heating (gas) Cooling (elec) Water Systems (gas) Pumps Fans Interior Equipment Interior Lighting
43% 41% 40%
51% 48% 49%
58%
57% 57%
60%
61%
62% 62%
63%
59%
16
Table 13. Source Energy Savings of Low-Energy Package Models Compared to CBECS 2003 Other Repair Service Data
Climate Zone City
CBECS 2003
Source Energy
EUI (kBtu/ft2)
CBECS 2003
Source Energy
EUI Target (kBtu/ft2)
Baseline Source Energy
(kBtu/ft2)
Low-Energy Package Source Energy
(kBtu/ft2)
Percent Difference of Low Energy
From CBECS 2003
Percent Difference
With Cogen System
1A Miami, FL 204 (643) 71 (224) 87 (274) 49 (155) 76% 89% 2A Houston, TX 187 (590) 65 (205) 94 (296) 54 (170) 71% 85% 2B Phoenix, AZ 151 (476) 53 (167) 95 (300) 56 (177) 63% 82% 3A Memphis, TN 159 (501) 56 (177) 104(328) 59 (186) 63% 82% 3B El Paso, TX 146 (460) 51 (161) 98 (309) 58 (183) 60% 81% 3C San Francisco, CA 136 (429) 48 (151) 89 (281) 46 (145) 66% 83% 4A Baltimore, MD 164 (517) 57 (180) 120 (378) 59 (186) 64% 81% 4B Albuquerque, NM 114 (360) 40 (126) 110 (347) 56 (177) 51% 75% 4C Seattle, WA 117 (369) 41 (129) 113 (356) 56 (177) 52% 74% 5A Chicago, IL 166 (524) 58 (183) 133 (419) 61 (192) 63% 78% 5B Colorado Springs, CO 159 (501) 56 (177) 122 (385) 57 (180) 64% 80% 6A Burlington, VT 189 (596) 66 (208) 144 (454) 63 (199) 67% 79% 6B Helena, MT 149 (470) 52 (164) 140 (442) 62 (196) 59% 75% 7 Duluth, MN 180 (568) 63 (199) 162 (511) 67 (211) 63% 75% 8 Fairbanks, AK 225 (710) 79 (249) 211 (665) 91 (287) 60% 69%
A cogeneration (cogen) system was evaluated as an additional EEM to see the effects of recovering waste heat that is a
by-product of electricity generation—and further reduce fuel consumption. The cogen system was not included in the whole-building energy simulation, but was modeled post simulation using an electricity and hot water multiplier. The multipliers assumed 37% electricity efficiency and 80% overall efficiency, and that all thermal and electrical energy was completely used. The multiplier values were 1.521 kBtu/kBtu (1.521 kWh/kWh) for electricity and 1.126 kBtu/kBtu (1.126 kWh/kWh) for hot water, and were derived from values associated with the GE Jenbacher combined heat and power (CHP) system (Monk 2010). Source energy savings associated with the cogen system are noted in the last column of Table 13, meeting EISA 2007 requirements by achieving 69%–89% fossil fuel savings depending on climate zone.
The cogen system assumes that all of the thermal and electrical energy is consumed, i.e., the thermal load matches the
output of the cogen system. This assumption is aggressive and perhaps unachievable, because a single building can rarely use all the thermal energy produced. Thus, a cogen system is most effective for a building or a network of buildings that have a diversification of loads and high operating hours, maximizing heat and power consumption. To fully understand the practicality of a cogen system for particular army building types, a detailed analysis of the application of a cogen system for each building type, or perhaps for the entire base, would need to be conducted.
CONCLUSION
U.S. ACE Headquarters, CERL, and NREL worked together to explore the potential to reach the EISA 2007 energy performance goal for 2015, to reduce fossil fuel-generated energy consumption (source energy) by 65%, for five common military construction building types. This report covers the analysis, approach, and results examining energy performance for an Army TEMF. Results show that this goal is achievable in four climate zones. The remaining climate zones come close to this goal, with fossil fuel reductions of 51%–64%.
A number of EEMs were considered and analyzed individually to achieve the EISA 2007 energy performance goal. The
Passive House insulation levels, lighting power reduction and controls, plug load power reduction strategies, demand control ventilation strategies in the repair bays and vehicle corridor, radiant floor heat, TSCs, and increased HVAC system efficiencies were considered. EEMs with the highest energy savings were then included in a low-energy package for each
17
climate zone. From there, three iterations of low energy packages followed that explored the effects of adding TSCs to the south façade of the building, radiant floor heating in the repair bays and vehicle corridor, and a combination of TSCs and radiant floor heat. The final recommended packages were chosen based on the level of energy savings for each climate zone. For cases where two packages showed the same energy savings, the more cost-effective package was chosen. Overall, the achieved annual site energy savings were 40%–63%, depending on the climate zone.
Source EUI was calculated for each recommended low energy package and compared to EUIs measured by CBECS
2003 (EIA 2008) for the “other repair service” building type. Depending on the climate zone, source energy savings were 51%–76%. A cogen system was also considered and predicted savings from the system were post-processed into the results. Assuming that all thermal and electrical energy is consumed, the total source energy savings for the building increases to 69%–89%—meeting the energy goals of EISA 2007: to reduce fossil fuel consumption by 65%. These numbers show the maximum source energy savings achieved with a cogen system, and it is recommended that further analysis be conducted to fully understand the practicality and application of a cogen system for this building type.
In summary, the EISA 2007 analysis studies showed that significant energy savings are possible for all climates;
however, reaching 65% source energy savings with EEMs alone is difficult. Additional savings may be achievable with additional measures not considered in the analysis, but renewable energy generation will most likely be required to reach and exceed 65% energy savings.
ACKNOWLEDGMENTS
This study was conducted by the U.S. ACE Headquarters under the leadership of Daniel Carpio and in collaboration with CERL and NREL. We would like to acknowledge the help of the private sector subject matter experts who participated on this project: Al Woody and Stanley Mumma for HVAC, Halley Fitzpatrick and Chad Groshart for the lighting, as well as the Savannah District, who provided specific input on building design, equipment and operation to aid in the modeling efforts presented in this report.
REFERENCES
ACE. 2009. Engineering and Construction Bulletin 2009-29, Building Air Tightness Requirements. Washington, D.C.: U.S. Army Corps of Engineers.
ACE. 2011. MILCON Energy Efficiency and Sustainability Study of Five Types of Army Buildings, Summary Report.
Washington, D.C.: U.S. Army Corps of Engineers. ACGIH. 2001. Documentation of the Threshold Limit Values and Biological Exposure Indices, 7th ed. Cincinnati, OH:
American Conference of Governmental Industrial Hygienists. ASHRAE. 2004. ANSI/ASHRAE/IESNA Standard 90.1- 2007, Energy Standard for Buildings except Low-Rise Residential
Buildings. Atlanta: American Society of Heating, Refrigerating and Air-Conditioning Engineers. ASHRAE. 2007a. ANSI/ASHRAE Standard 62.1-2007, Ventilation for Acceptable Indoor Air Quality. Atlanta: American
Society of Heating, Refrigerating and Air- Conditioning Engineers. ASHRAE 2007b. ANSI/ASHRAE/IESNA Standard 90.1- 2007, Energy Standard for Buildings except Low-Rise Residential
Buildings. Atlanta: American Society of Heating, Refrigerating and Air-Conditioning Engineers. ASHRAE. 2007c. ASHRAE Handbook—HVAC Applications. Atlanta: American Society of Heating, Refrigerating and Air-
Conditioning Engineers. ASHRAE. 2009. ANSI/ASHRAE/USGBC/IES Standard 189.1-2009, Standard for the Design of High-Performance Green
Buildings Except Low-Rise Residential Buildings. Atlanta: American Society of Heating, Refrigerating and Air-Conditioning Engineers.
18
ASHRAE. 2010. ANSI/ASHRAE/IESNA Standard 90.1- 2010, Energy Standard for Buildings Except Low-Rise Residential Buildings. Atlanta: American Society of Heating, Refrigerating and Air-Conditioning Engineers.
Briggs, R.S., R.G. Lucas, and T. Taylor. 2003. Climate classification for building energy codes and standards: Part 2—Zone
definitions, maps and comparisons. Technical and Symposium Papers, ASHRAE Winter Meeting, January 27, 2003, Chicago, IL.
Deru, M., K. Field, D. Studer, K. Benne, B. Griffith, P. Torcellini, B. Liu, M. Halverson, D. Winiarski, M. Rosenberg, M.
Yazdanian, J. Huang, and D. Crawley. 2011. U.S. Department of Energy commercial reference building models of the National Building Stock. Technical Report NREL/TP-5500-46861, National Renewable Energy Laboratory, Golden, CO.
DOE. 2007. EnergyPlus energy simulation software. www.eere.energy.gov/buildings/energyplus/. U.S. Department of
Energy, Washington, D.C. EIA. 2008. 2003 Commercial Buildings Energy Consumption Survey. U.S. Energy Information Administration, Washington,
DC. EIA. 2003. Annual Energy Outlook. www.eia.gov/oiaf/aeo.html. U.S. Energy Information Administration, Washington, DC. Monk, W. 2010. J208 Cogeneration vs. separate power and heat generation, GE Energy. PowerPoint Presentation. NREL. 2010. Opt-E-Plus Software for Commercial Building Optimization, FS-550-45620. National Renewable Energy
Laboratory, Golden, CO. OSHA. 2011. Occupational Safety & Health Administration, Permissible Exposure Limits. www.osha.gov/SLTC/pel. U.S.
Department of Labor, Washington, DC. Passivhaus. 2011. Passivhaus Institut.www.passivehouse.com. Darmstadt, Germany. Sharp, T. 2010. Telephone and e-mail conversations between Deru and Sharp, June 2010. U.S. Congress. 2005. Energy Policy Act of 2005. United States Congress, Washington, DC. U.S. Congress. 2007. Energy Independence and Security Act of 2007. United States Congress, Washington, DC. Zhivov, A.D., D. Herron, and M. Deru. 2009. Achieving energy efficiency and improving indoor air quality in Army
maintenance facilities. ASHRAE Transactions 115 (II).


![Tactical Combat Casualty Care [TCCC] Some reminders and ...€¦ · Tactical Combat Casualty Care Tactical Evacuation Care The term “Tactical Evacuation” includes both Casualty](https://img.pdfslide.us/doc/110x75/604ef4767ef6a83727287be2/tactical-combat-casualty-care-tccc-some-reminders-and-tactical-combat-casualty.jpg)