Embed Size (px)
Citation preview
Extraction and Transformation of General Ledger Data from
SAP ERP to Microsoft Power Pivot
Arinto Hadi Wiharyo
Bachelor’s Thesis
Business Information Technology
November 2014
Abstract November 2014 BITE
Author or authors Arinto Hadi Wiharyo
Group or year of entry BITE, 2010
Title of report Extraction and Transformation of General Ledger Data from SAP ERP to Microsoft Power Pivot
Number of report pages and attachment pages 51 + 10 pages
Teacher(s) or supervisor(s) Ralf Rehn.
SAP ERP is an automated and integrated system that supports end-to-end business process of organization by combining functional and cross-functional business process, and integrating business modules into a logical architecture. SAP ERP has the ability to hold unstructed general ledger data from business transactions in data warehouse. Unstructured general ledger data brings no value to organizations, Microsoft Power Pivot is used to structure and transform the unstructured general data into structured data for analysis, reporting and decision making through fast, simple and efficient processes. The study was conducted through qualitative research that was divided into theoretical and empirical researches. The theoretical research is based on the literature analysis from books, courses provided by HAAGA-HELIA UAS, internet sources, community guidelines, journals and articles, and thesis. Meanwhile the empirical research is based on the business transaction scenario, extraction, transformation and loading of general ledger data, and an addition of brief explanation of Power View and Power BI. The dashboard created has shown the change in general ledger data as a result of the business transaction scenario, the dashboard clearly transforms the general ledger data into a structured report for analysis and decisions making. Additional findings regarding Power View and Power BI functonalities were discovered during the study. Power View has allowed the general ledger data to be presented in more stylish manners without eliminating the main idea of BI, while Power BI has the shown its ability to allow users to share, collaborate, track and communicate one Power BI workbook through the SharePoint.
Keywords Business Intelligence, Microsoft Power Pivot, ETL, Dashboard, SAP ERP and General Ledger Accounting.
Table of contents
1 Introduction .......................................................................................................................... 1
1.1 Background .................................................................................................................. 1
1.2 Research ........................................................................................................................ 2
1.3 Research Questions ..................................................................................................... 2
1.4 Methodology ................................................................................................................ 3
1.5 Hypothesis .................................................................................................................... 3
2 Business Intelligence ............................................................................................................ 5
2.1 Business Intelligence Implementation ...................................................................... 5
2.2 Business Intelligence Architectures and Framework .............................................. 7
2.2.1 Metadata Layer ................................................................................................. 8
2.2.2 Data Source Layer ........................................................................................... 8
2.2.3 ETL Layer ........................................................................................................ 8
2.2.4 Data Warehouse Layer .................................................................................. 10
2.2.5 End-User layer ............................................................................................... 12
2.3 Microsoft Power Pivot ............................................................................................. 12
2.3.1 Microsoft Power Pivot Features .................................................................. 12
2.3.2 Reporting and Analysis in Microsoft Power Pivot ................................... 13
2.3.3 Dashboard ...................................................................................................... 14
3 SAP ERP ............................................................................................................................. 15
3.1 HAAGA-HELIA UAS SAP ERP Ecosystem ...................................................... 16
3.1.1 Global Bike Incorporated............................................................................. 16
3.2 SAP ERP Master Data and Transaction Data....................................................... 17
3.3 Financial Accounting ................................................................................................ 18
3.3.1 Accounting Documents ................................................................................ 18
3.3.2 General Ledger Accounting ......................................................................... 20
4 Empirical Background ....................................................................................................... 22
4.1 Purpose ....................................................................................................................... 22
4.2 Business Scenario ...................................................................................................... 22
4.3 Prerequisites ............................................................................................................... 23
4.4 Process ........................................................................................................................ 23
5 Empirical Process ............................................................................................................... 24
5.1 Display and Transfer of GBI General Ledger Data ............................................. 24
5.2 Extraction of General Ledger Data from SAP ERP ............................................ 31
5.3 Transformation of General Ledger Data using Microsoft Power Pivot ........... 36
5.4 Power View and Power BI ....................................................................................... 41
6 Discussion ........................................................................................................................... 45
References ................................................................................................................................ 48
Appendices ............................................................................................................................... 52
Appendix 1. Table BKPF Field Labels ........................................................................... 52
Appendix 2. Table BSEG Field Labels ........................................................................... 54
Appendix 3. SAP Document Types ................................................................................ 60
Appendix 4. Data Extractions Try Outs ......................................................................... 61
Glossary
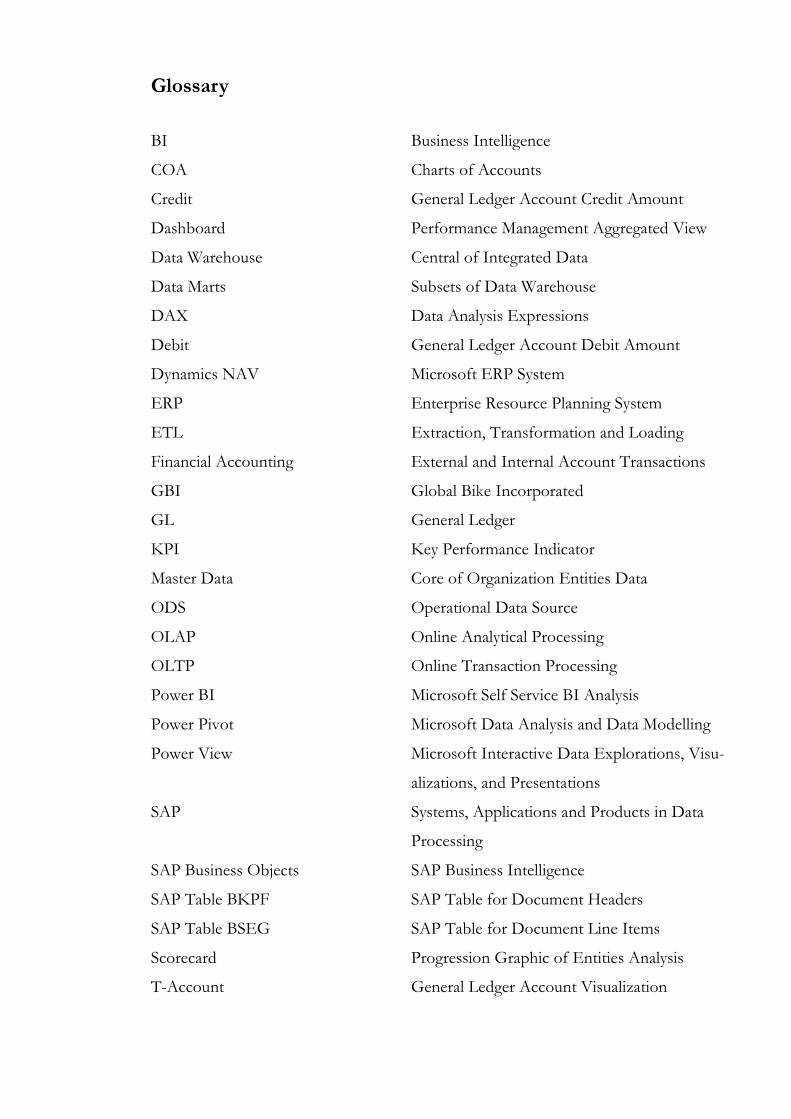
BI Business Intelligence
COA Charts of Accounts
Credit General Ledger Account Credit Amount
Dashboard Performance Management Aggregated View
Data Warehouse Central of Integrated Data
Data Marts Subsets of Data Warehouse
DAX Data Analysis Expressions
Debit General Ledger Account Debit Amount
Dynamics NAV Microsoft ERP System
ERP Enterprise Resource Planning System
ETL Extraction, Transformation and Loading
Financial Accounting External and Internal Account Transactions
GBI Global Bike Incorporated
GL General Ledger
KPI Key Performance Indicator
Master Data Core of Organization Entities Data
ODS Operational Data Source
OLAP Online Analytical Processing
OLTP Online Transaction Processing
Power BI Microsoft Self Service BI Analysis
Power Pivot Microsoft Data Analysis and Data Modelling
Power View Microsoft Interactive Data Explorations, Visu-
alizations, and Presentations
SAP Systems, Applications and Products in Data
Processing
SAP Business Objects SAP Business Intelligence
SAP Table BKPF SAP Table for Document Headers
SAP Table BSEG SAP Table for Document Line Items
Scorecard Progression Graphic of Entities Analysis
T-Account General Ledger Account Visualization

Transaction Data Executed Data from SAP ERP Transaction
1
1 Introduction
1.1 Background
The reasons behind this project started during my study in HAAGA-HELIA Universi-
ty of Applied Sciences where I got the chances to be acquainted with Enterprise Re-
sources Planning related courses such as ERP Application and Business Process De-
velopment, SAP ERP Basics, SAP ERP Advanced, and Financial Management and
Accounting Process. In spring 2013 I enrolled for a HAAGA-HELIA’s intensive week
course Business Intelligence, BUS8TF017-1 by Ralf Rehn where I got interested with
the Business Intelligence and the use of it. After discussing with my thesis advisor, Ralf
Rehn about the possible thesis subject I decided that I would do my thesis in the com-
bination of SAP ERP and Microsoft Power Pivot whereas the thesis would be concen-
trated on the Extract, Transform and Load process. The idea did not come immediate-
ly as many changes were done and I encountered many obstacles along the way.
I choose SAP ERP for data extraction purpose because I believe that I have gotten
enough knowledge and experience in using SAP ERP and since SAP ERP is available
for students in HAAGA-HELIA UAS. The SAP ERP version used for this project is
SAP ECC 6.0 with Global Bike as the company entity, client 204 and user GBI-183.
For data transformation and loading purpose I choose Microsoft Power Pivot because
it is easily accessible and available in HAAGA-HELIA’s system, and also I believe that
Microsoft Power Pivot is the simplest yet cost effective Business Intelligence system
there is that transforms unstructured data into structured data using easily approacha-
ble image visualizations and presentations in Power Pivot workbook. General ledger
data was chosen because it shows the external accounting process and business trans-
actions of GBI organization through systematics and comprehensive collections of
business transactions data.
Along the way of this project I have realized that using SAP ERP for data extraction
purpose is not the easiest and getting the right data tables seems to me quite compli-
cated, however as it has been decided before I would continue on working on this pro-
ject with SAP ERP as the main data extraction source. After the summer holiday of

2
2014 I have gotten the chance to sit and talk with my thesis advisor where it was decid-
ed that it is better to emphasize and concentrate this thesis on the theory part and if
there would be enough time it would be used for empirical part and project manage-
ment.
It is hoped that this thesis would give me more understanding about the Extract,
Transform and Loading of data from SAP ERP to Microsoft Power Pivot whereas the
unstructured data would later be transformed into structured data using Microsoft
Power Pivot Dashboard.
1.2 Research
I choose qualitative research for this study because qualitative research delivers results
that can be tested using case studies and unlike quantitative research there is no need
of conducting mathematical modeling such as statistical modeling. (Strauss & Corbi
1998, 10-11.)
1.3 Research Questions
The research question regarding this study derives from my observations through the
previous studies conducted in HAAGA-HELIA UAS. Research question defines the
focus of the study, guidance on how to conduct the study, and creating a communica-
tion between the writer and others about the goals of the research. (Maxwell 2005.)
In this study the main research question is, how can SAP ERP general ledger data be
presented in Microsoft Power Pivot using ETL Process?
And from above mentioned research question derived two sub-questions:
− How to create the connection from SAP ERP to Microsoft Power Pivot? Is it a
manual or an automated connection?
− What is the most suitable data presentation in Microsoft Power Pivot for GBI-
183 General Ledger data?
3
1.4 Methodology
The methodology used in this study is a combination of theoretical and empirical re-
search conducted during my study in HAAGA-HELIA UAS and during the actual the-
sis project.
The theoretical research is done through the literature analysis from books, SAP Help
Portal, Microsoft Developer Network, journals and articles, thesis and courses provid-
ed in HAAGA-HELIA UAS. The information collected for the theoretical research is
mainly focused on:
Definitions, architectures and structures of Microsoft Power Pivot.
ETL process.
Data warehouse.
Data presentation and visualization in Microsoft Power Pivot.
Definitions, architectures and structures of SAP ERP.
General ledger accounting.
The theoretical research serves as the basic fundamental of the empirical research and
both theoretical and empirical research work together in order to answer the research
questions. The empirical research serves as the answer to the research questions. The
empirical research is conducted through observations, testing and try outs, and the ac-
tual extraction, transformation and loading process of general ledger data from SAP
ERP to Microsoft Power Pivot.
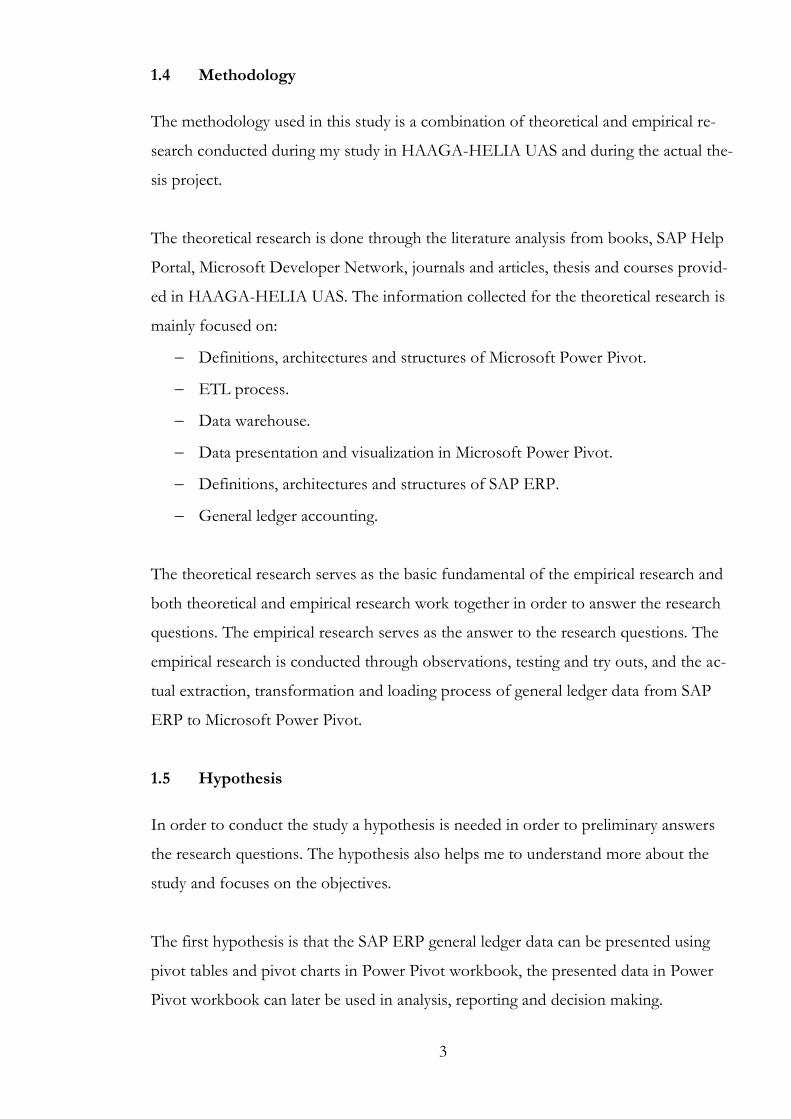
1.5 Hypothesis
In order to conduct the study a hypothesis is needed in order to preliminary answers
the research questions. The hypothesis also helps me to understand more about the
study and focuses on the objectives.
The first hypothesis is that the SAP ERP general ledger data can be presented using
pivot tables and pivot charts in Power Pivot workbook, the presented data in Power
Pivot workbook can later be used in analysis, reporting and decision making.
4
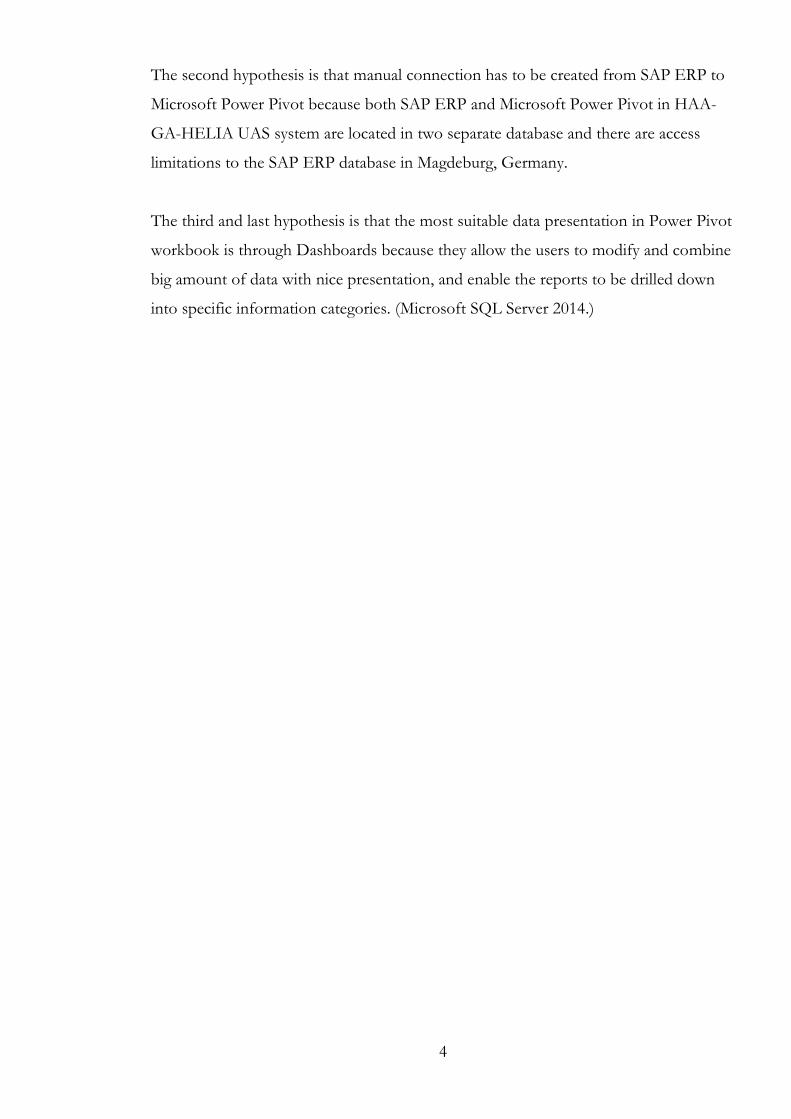
The second hypothesis is that manual connection has to be created from SAP ERP to
Microsoft Power Pivot because both SAP ERP and Microsoft Power Pivot in HAA-
GA-HELIA UAS system are located in two separate database and there are access
limitations to the SAP ERP database in Magdeburg, Germany.
The third and last hypothesis is that the most suitable data presentation in Power Pivot
workbook is through Dashboards because they allow the users to modify and combine
big amount of data with nice presentation, and enable the reports to be drilled down
into specific information categories. (Microsoft SQL Server 2014.)
5
2 Business Intelligence
Business Intelligence or BI is a tool for processing and transforming raw and unstruc-
tured data into knowledge, the knowledge is used for business purposes such as report-
ing, analytical thinking and decisions making. BI allows the organization to look and
analyze the past and present situations, and predict the future trend of the organization
and the market in order to make the right and effective decisions. BI strongly empha-
sizes on agile analytics to deliver the results by establishing methodologies and process
that derive from the utilization of technology and data.
The goals of BI for each organization might be different from one to another, the pri-
mary goal of BI at the enterprise level is to deliver critical business information and
analysis from all data sources in context and in a timely manner. (Biere 2010, 12.)
A true novelty of BI is its ability to present business information in a fast, simple and
efficient way so that users can understand the logic and meaning of business infor-
mation by employing a wide range of analytical possibilities and ad-hoc queries. (Hoce-
var & Jaklic 2010, 3.)
There are many types of BI available in the market and each BI brings its own ad-
vantages and disadvantages depending on the goals of the organization. Common ex-
amples of BI that are available in the market are Microsoft Power Pivot, QlikView,
SAP Business Objects and IBM Cognos.
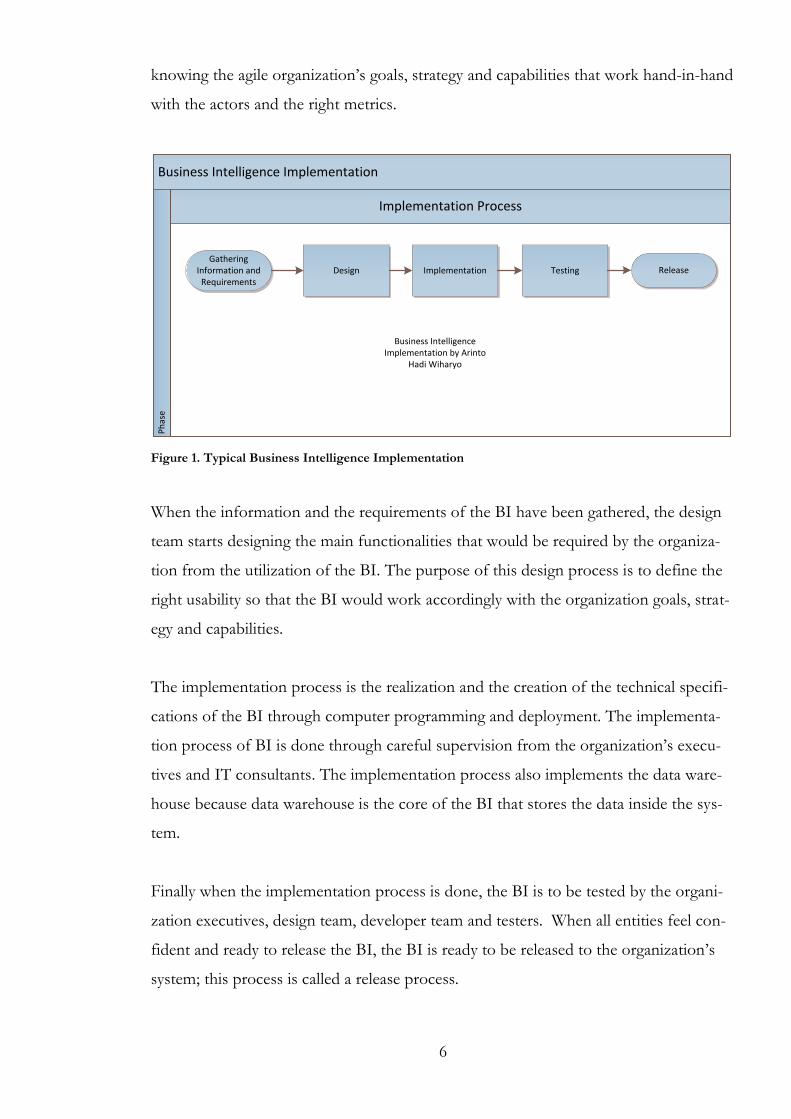
2.1 Business Intelligence Implementation
The implementation of BI starts when an organization is in need of a fast, simple and
efficient decision making tool for their executives. In order for the organization to start
the BI implementation successfully both actors and the right metrics that align with the
organization’s goals, strategy and capabilities have to be defined. This step is often
called as the gathering of the information and the requirements of the BI. This is the
core of the BI implementation because BI implementation will not succeed without
6
knowing the agile organization’s goals, strategy and capabilities that work hand-in-hand
with the actors and the right metrics.
Business Intelligence Implementation
Implementation Process
Ph
ase
Gathering Information and Requirements
Design Implementation Release
Business Intelligence Implementation by Arinto
Hadi Wiharyo
Testing
Figure 1. Typical Business Intelligence Implementation
When the information and the requirements of the BI have been gathered, the design
team starts designing the main functionalities that would be required by the organiza-
tion from the utilization of the BI. The purpose of this design process is to define the
right usability so that the BI would work accordingly with the organization goals, strat-
egy and capabilities.
The implementation process is the realization and the creation of the technical specifi-
cations of the BI through computer programming and deployment. The implementa-
tion process of BI is done through careful supervision from the organization’s execu-
tives and IT consultants. The implementation process also implements the data ware-
house because data warehouse is the core of the BI that stores the data inside the sys-
tem.
Finally when the implementation process is done, the BI is to be tested by the organi-
zation executives, design team, developer team and testers. When all entities feel con-
fident and ready to release the BI, the BI is ready to be released to the organization’s
system; this process is called a release process.
7
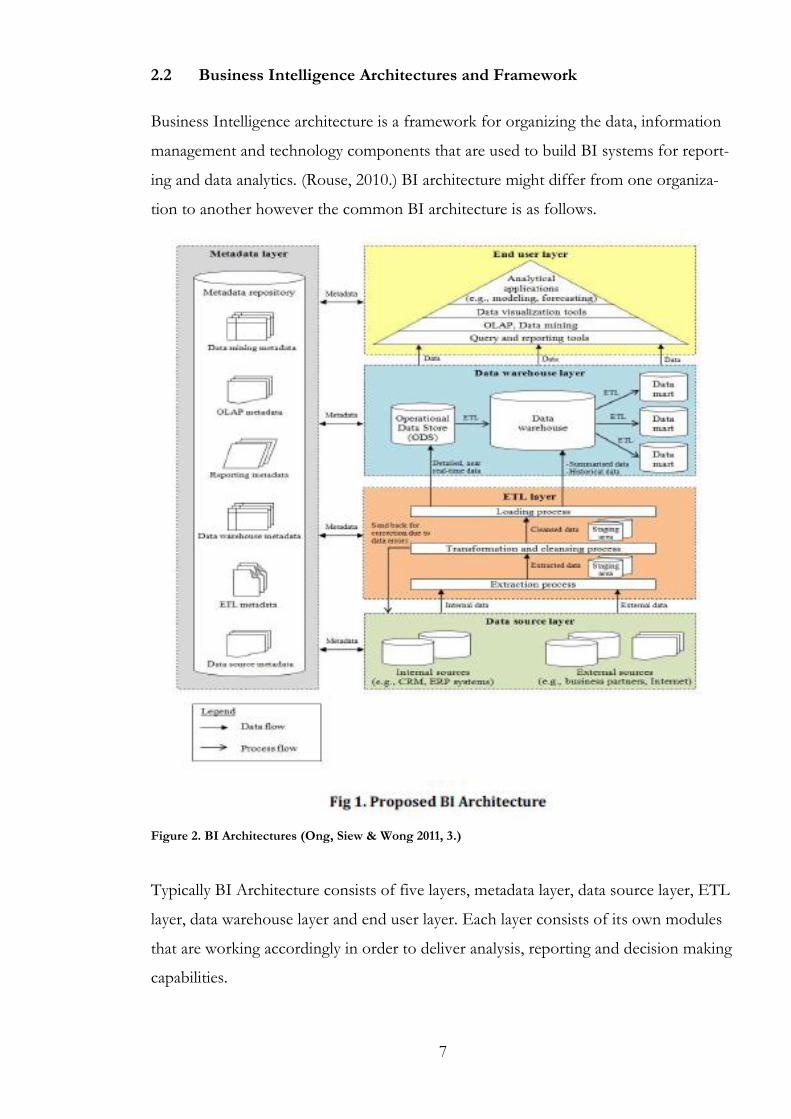
2.2 Business Intelligence Architectures and Framework
Business Intelligence architecture is a framework for organizing the data, information
management and technology components that are used to build BI systems for report-
ing and data analytics. (Rouse, 2010.) BI architecture might differ from one organiza-
tion to another however the common BI architecture is as follows.
Figure 2. BI Architectures (Ong, Siew & Wong 2011, 3.)
Typically BI Architecture consists of five layers, metadata layer, data source layer, ETL
layer, data warehouse layer and end user layer. Each layer consists of its own modules
that are working accordingly in order to deliver analysis, reporting and decision making
capabilities.
8
2.2.1 Metadata Layer
Metadata layer or data about data is the layer that defines and specifies the data struc-
tures which is saved in the data warehouse. Metadata layer arranges the logical data
information, sources and structures of the data inside the data warehouse. Moreover
metadata layer works as walls and filters for the data that is coming into the database.
“The metadata layer is absolutely critical to the entire structures. It is not only where
you define the sources, but where you may opt to add definitions, calculations, and
more. This is often-discussed “single version of truth.”” (Biere 2010, 43.)
2.2.2 Data Source Layer
Data Source Layer is the acquisition and collection of data into BI system, the use of
the data can be acquired both internally and externally. Internal data source refers to
data that is captured and maintained by operational systems inside an organization such
as Customer Relationship Management and Enterprise Resource Planning systems.
(Ong, Siew & Wong 2011, 4.) Data Source Layer often referred as OLTP or Online
Transaction Processing is a place where the interaction between data is in real-time or
online, and its main purpose is to get data into the BI system.
In BI system the use of external data source is the utilization of data outside the organ-
ization’s system. The data can be collected from many external sources, from vendors,
customers, the internet, government organizations and business partners.
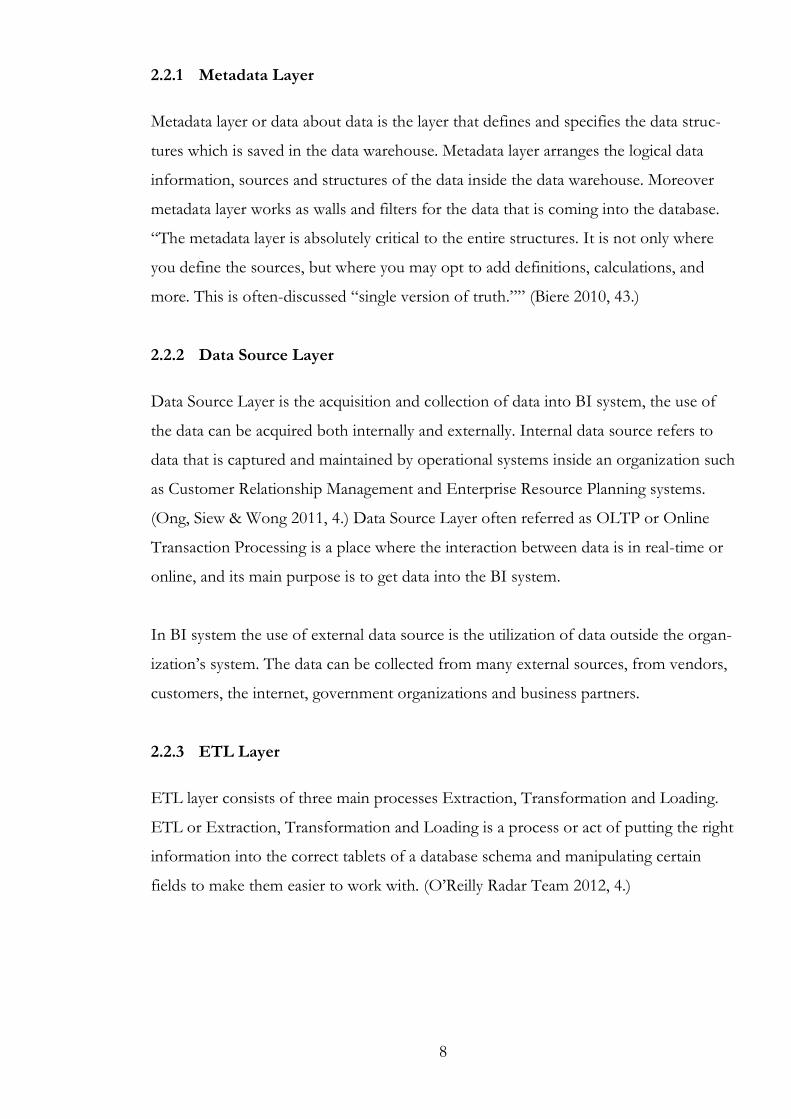
2.2.3 ETL Layer
ETL layer consists of three main processes Extraction, Transformation and Loading.
ETL or Extraction, Transformation and Loading is a process or act of putting the right
information into the correct tablets of a database schema and manipulating certain
fields to make them easier to work with. (O’Reilly Radar Team 2012, 4.)
9
Figure 3. Extract Transform and Loading (IMC 2011.)
According to IMC, ETL Lifecycle can be concluded as a movement of data from
source applications to final destination and consists of several steps.
- Validate data consistency from source to destination
- Integrate source data changes into monitoring processes
- Performance tuning, error repair, and processes scheduling
- Create transformation scripts for the new business requirements
- Maintain and monitor transformation scripts (IMC 2011.)
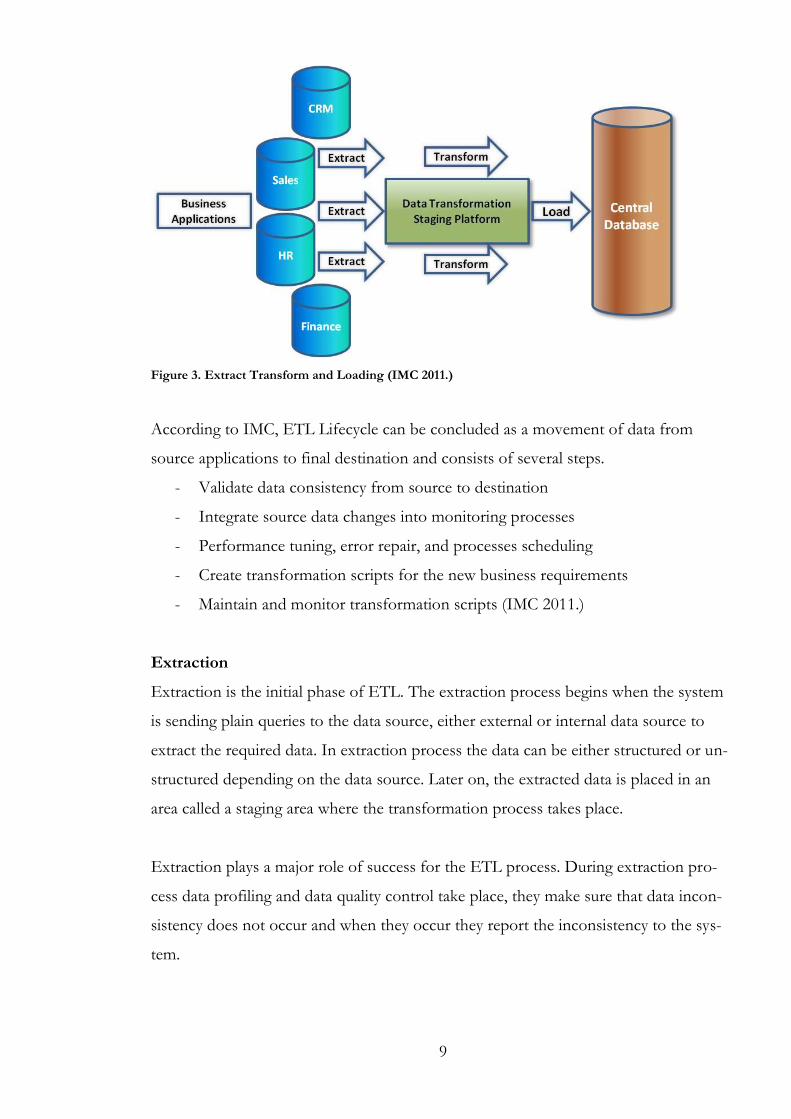
Extraction
Extraction is the initial phase of ETL. The extraction process begins when the system
is sending plain queries to the data source, either external or internal data source to
extract the required data. In extraction process the data can be either structured or un-
structured depending on the data source. Later on, the extracted data is placed in an
area called a staging area where the transformation process takes place.
Extraction plays a major role of success for the ETL process. During extraction pro-
cess data profiling and data quality control take place, they make sure that data incon-
sistency does not occur and when they occur they report the inconsistency to the sys-
tem.
10
Transformation
Transformation is the second phase of ETL, transformation is the phase when data
staging takes place. During staging phase, extracted data is being staged and catego-
rized depending on their attributes, this is done so that the data can be joined, filtered
or to find the union.
The transformation process makes sure that the data is transformed into the right
structure that the organization requires. During transformation process data quality is
checked and it may include several process, cleansing, merging, sorting, defining
unique identifiers, ensuring population timestamps, ensuring validity period date
stamps, delta processing, creating data, validating data, ensuring validity period date
stamps, delta processing, creating data, validating data, ensuring referential integrity,
aggregating, summarizing and profiling data. (Laberge 2011, 257-258.)
Loading
Loading is the final phase of ETL, the loading process is a process of combining, ag-
gregating and loading the structured data into the desired data warehouse. There are
three types of loading process in ETL, initial loading, refresh loading and update load-
ing. The initial loading refers to the first time loading of data into data warehouse, re-
fresh loading refers to dropping or deleting existing data and replacing them with the
desired data, and update loading refers to the incremental load of new data to the data
warehouse. (Laberge 2011, 281.)
The loading process allows the database to command real-time data integration so that
OLAP can take place. Loading process is the phase when data analysis is possible and
it allows any tools to emphasize on reporting and decision making purposes.
2.2.4 Data Warehouse Layer
Data warehouse layer consists of three main components Operational Data Store or
ODS, Data Warehouse and Data Marts. The first component is ODS, unlike other
data warehouse layers ODS tends to focus on the operational requirements of a partic-
ular business process such as customer service. (Gartner 2013a.) ODS is used to inte-
11
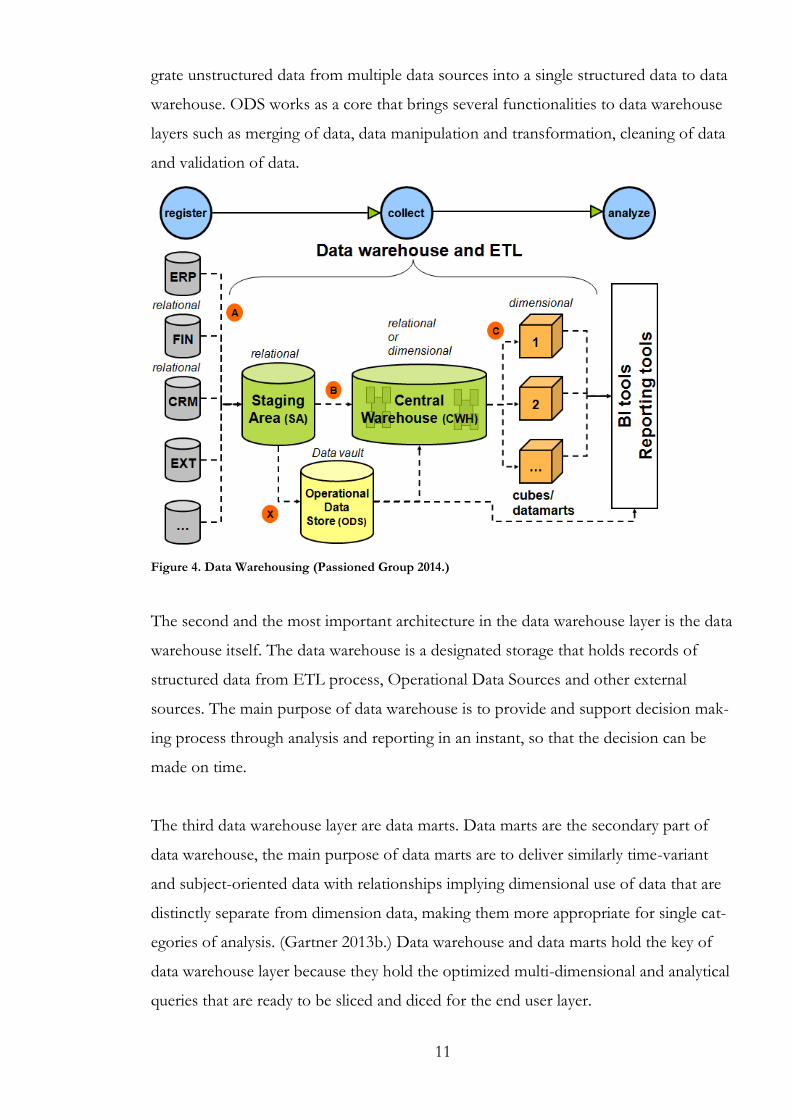
grate unstructured data from multiple data sources into a single structured data to data
warehouse. ODS works as a core that brings several functionalities to data warehouse
layers such as merging of data, data manipulation and transformation, cleaning of data
and validation of data.
Figure 4. Data Warehousing (Passioned Group 2014.)
The second and the most important architecture in the data warehouse layer is the data
warehouse itself. The data warehouse is a designated storage that holds records of
structured data from ETL process, Operational Data Sources and other external
sources. The main purpose of data warehouse is to provide and support decision mak-
ing process through analysis and reporting in an instant, so that the decision can be
made on time.
The third data warehouse layer are data marts. Data marts are the secondary part of
data warehouse, the main purpose of data marts are to deliver similarly time-variant
and subject-oriented data with relationships implying dimensional use of data that are
distinctly separate from dimension data, making them more appropriate for single cat-
egories of analysis. (Gartner 2013b.) Data warehouse and data marts hold the key of
data warehouse layer because they hold the optimized multi-dimensional and analytical
queries that are ready to be sliced and diced for the end user layer.
12
2.2.5 End-User layer
End user layer is illustrated as a pyramid that consists of several analysis tools for BI
users. The pyramid consists of queries and reporting tools, OLAP and data mining,
data visualization tools and analytical applications. The main purpose of the end-user
layer is to provide the users with the ability to present the data in data warehouse
through accumulated presentation within user applications such as BI.
2.3 Microsoft Power Pivot
Microsoft Power Pivot is a Business Intelligence developed by Microsoft Corporation
as an add-in to the Microsoft Excel 2010 and integrated in the later version of Mi-
crosoft Excel. According to Microsoft, Power Pivot is an add-in that can be used to
perform powerful data analysis in Microsoft Excel, bringing a self-service BI to users’
desktop. (Microsoft Office Support 2014a.)
The main thing that distinguishes Microsoft Power Pivot from other BI is that Mi-
crosoft Power Pivot allows the users to process a big amount of data within a short
period of time in Pivot workbook, as Power Pivot is an add-in to Microsoft Excel
many functionalities and buttons are derived from Microsoft Excel making it easier for
common Microsoft Office users. One of the reasons why Microsoft Power Pivot was
chosen for this project is because of its simplicity and the availability in HAAGA-
HELIA UAS’ system.
2.3.1 Microsoft Power Pivot Features
Despite its simplicity Microsoft Power Pivot still brings a wide range of features with
more agile and cost effective approach to the Business Intelligence, and not to mention
delivering the main feature of Business Intelligence which is to present business infor-
mation in a fast, simple and efficient way so that users can understand the logic and
meaning of business information by employing a wide range of analytical possibilities
and ad-hoc queries. (Hocevar & Jaklic 2010, 3.)
13
The main features of Microsoft Power Pivot are import million rows of data from mul-
tiple data sources, fast calculations and analysis within short period of time, virtually
unlimited support of data sources that provides the foundation to import and combine
many data sources into one, security and management through monitors and manage-
ment from IT administrators, Data Analysis Expressions or DAX that enables the us-
ers to manipulate data in Excel through more sophisticated and complex grouping,
calculation and analysis. (Microsoft Office Support 2014a.)
Importing millions of rows of data is done by collecting data from multiple data
sources through ETL process, here the unstructured data from SAP ERP is imported
into Microsoft Power Pivot. After the importing process Microsoft Power Pivot starts
calculating and making analysis in Pivot workbook where the unstructured data is pre-
sented in the forms of dashboards or scorecards for analysis and decisions making
purposes.
2.3.2 Reporting and Analysis in Microsoft Power Pivot
In business, reporting should be straight forward and deliver the main objectives in a
generally structured document that represents a specific set of data in a fairly structured
manner. In advanced reporting the requirement system is called ad hoc reporting, ad
hoc reporting focuses on a reduced number of specific users that are the real target of
the reports. Ad hoc reporting allows reports to be done within a scalability concern
that synchronizes with the set of data design.
As part of an add-in of Microsoft Excel, Power Pivot offers much similar functionality
to Microsoft Excel. With create relationship between tables in Excel, Excel allows the
users to combine many sets of data tables to create a single set of table that fulfills the
ad hoc requirements. It is done through the process of creating a common primary key
using unique and non-repeated values between set of tables. Besides creating relation-
ship between tables Excel also offers the users the ability to create calculated columns
in the designated table using DAX or Data Analysis Expressions.
14
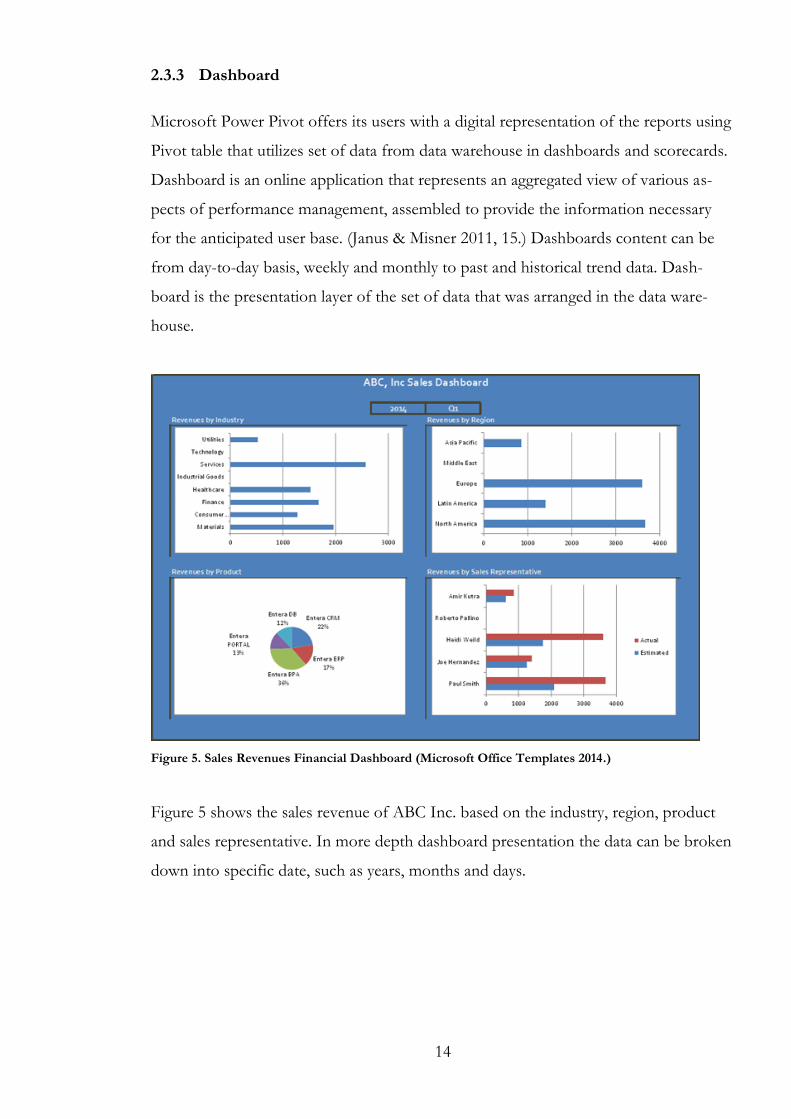
2.3.3 Dashboard
Microsoft Power Pivot offers its users with a digital representation of the reports using
Pivot table that utilizes set of data from data warehouse in dashboards and scorecards.
Dashboard is an online application that represents an aggregated view of various as-
pects of performance management, assembled to provide the information necessary
for the anticipated user base. (Janus & Misner 2011, 15.) Dashboards content can be
from day-to-day basis, weekly and monthly to past and historical trend data. Dash-
board is the presentation layer of the set of data that was arranged in the data ware-
house.
Figure 5. Sales Revenues Financial Dashboard (Microsoft Office Templates 2014.)
Figure 5 shows the sales revenue of ABC Inc. based on the industry, region, product
and sales representative. In more depth dashboard presentation the data can be broken
down into specific date, such as years, months and days.
15
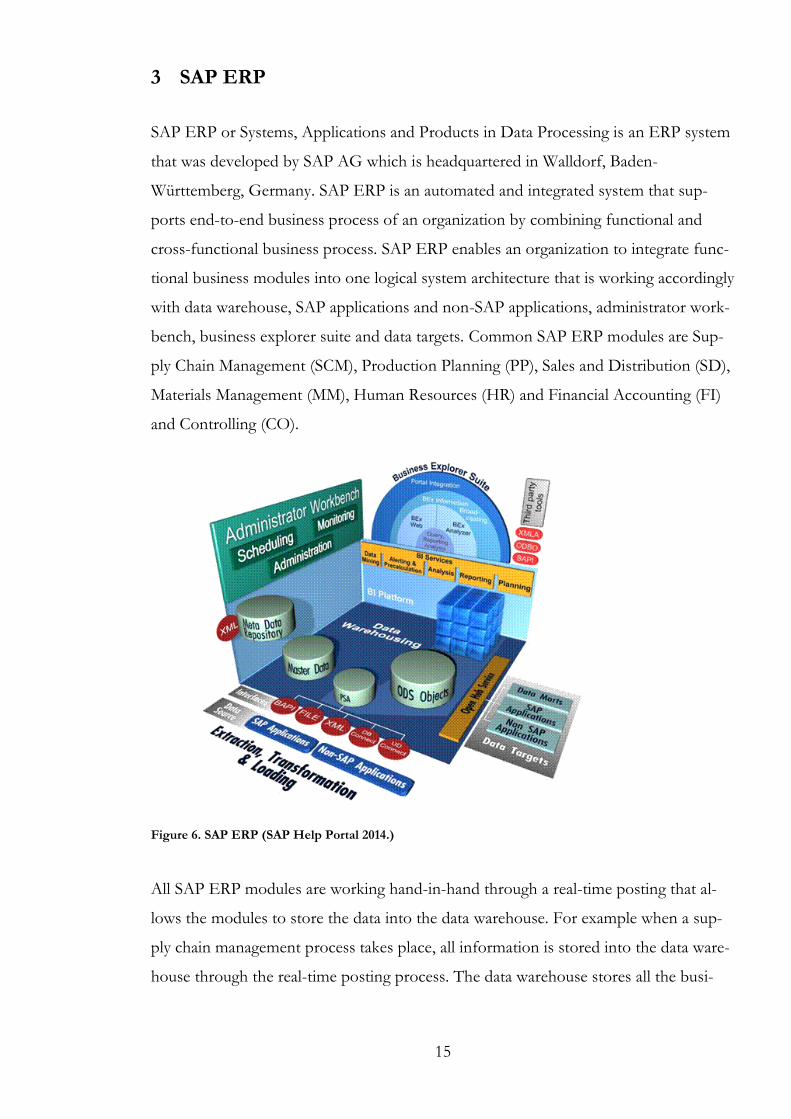
3 SAP ERP
SAP ERP or Systems, Applications and Products in Data Processing is an ERP system
that was developed by SAP AG which is headquartered in Walldorf, Baden-
Württemberg, Germany. SAP ERP is an automated and integrated system that sup-
ports end-to-end business process of an organization by combining functional and
cross-functional business process. SAP ERP enables an organization to integrate func-
tional business modules into one logical system architecture that is working accordingly
with data warehouse, SAP applications and non-SAP applications, administrator work-
bench, business explorer suite and data targets. Common SAP ERP modules are Sup-
ply Chain Management (SCM), Production Planning (PP), Sales and Distribution (SD),
Materials Management (MM), Human Resources (HR) and Financial Accounting (FI)
and Controlling (CO).
Figure 6. SAP ERP (SAP Help Portal 2014.)
All SAP ERP modules are working hand-in-hand through a real-time posting that al-
lows the modules to store the data into the data warehouse. For example when a sup-
ply chain management process takes place, all information is stored into the data ware-
house through the real-time posting process. The data warehouse stores all the busi-
16
ness transactions that are happening internally within the organization. By storing the
business transactions in the data warehouse any other SAP ERP modules will have the
capability to access the information whenever is needed.
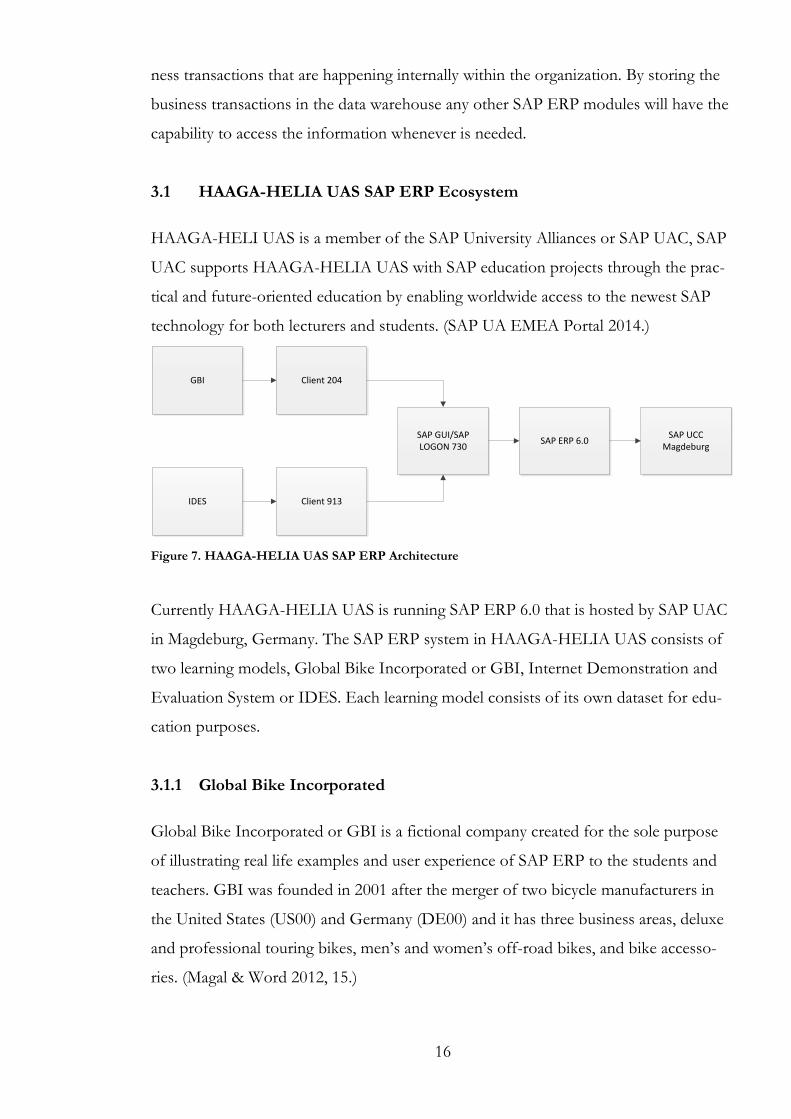
3.1 HAAGA-HELIA UAS SAP ERP Ecosystem
HAAGA-HELI UAS is a member of the SAP University Alliances or SAP UAC, SAP
UAC supports HAAGA-HELIA UAS with SAP education projects through the prac-
tical and future-oriented education by enabling worldwide access to the newest SAP
technology for both lecturers and students. (SAP UA EMEA Portal 2014.)
GBI
IDES
Client 204
Client 913
SAP GUI/SAP LOGON 730
SAP ERP 6.0SAP UCC
Magdeburg
Figure 7. HAAGA-HELIA UAS SAP ERP Architecture
Currently HAAGA-HELIA UAS is running SAP ERP 6.0 that is hosted by SAP UAC
in Magdeburg, Germany. The SAP ERP system in HAAGA-HELIA UAS consists of
two learning models, Global Bike Incorporated or GBI, Internet Demonstration and
Evaluation System or IDES. Each learning model consists of its own dataset for edu-
cation purposes.
3.1.1 Global Bike Incorporated
Global Bike Incorporated or GBI is a fictional company created for the sole purpose
of illustrating real life examples and user experience of SAP ERP to the students and
teachers. GBI was founded in 2001 after the merger of two bicycle manufacturers in
the United States (US00) and Germany (DE00) and it has three business areas, deluxe
and professional touring bikes, men’s and women’s off-road bikes, and bike accesso-
ries. (Magal & Word 2012, 15.)
17
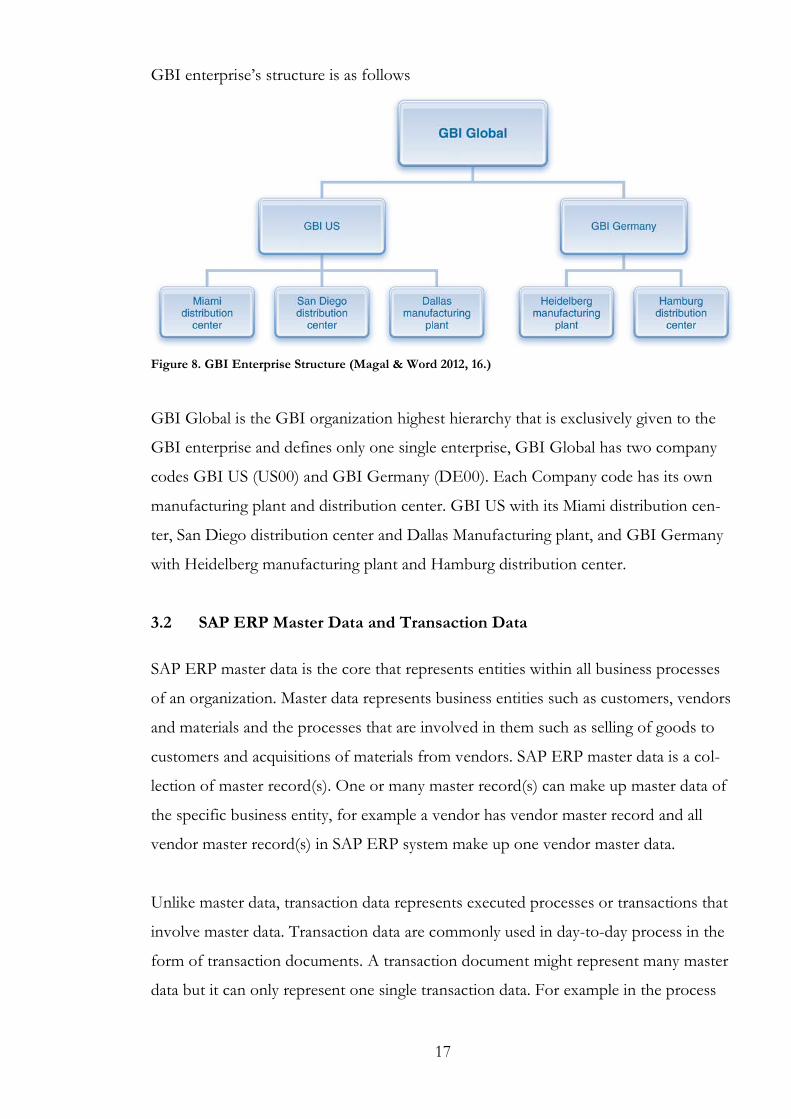
GBI enterprise’s structure is as follows
Figure 8. GBI Enterprise Structure (Magal & Word 2012, 16.)
GBI Global is the GBI organization highest hierarchy that is exclusively given to the
GBI enterprise and defines only one single enterprise, GBI Global has two company
codes GBI US (US00) and GBI Germany (DE00). Each Company code has its own
manufacturing plant and distribution center. GBI US with its Miami distribution cen-
ter, San Diego distribution center and Dallas Manufacturing plant, and GBI Germany
with Heidelberg manufacturing plant and Hamburg distribution center.
3.2 SAP ERP Master Data and Transaction Data
SAP ERP master data is the core that represents entities within all business processes
of an organization. Master data represents business entities such as customers, vendors
and materials and the processes that are involved in them such as selling of goods to
customers and acquisitions of materials from vendors. SAP ERP master data is a col-
lection of master record(s). One or many master record(s) can make up master data of
the specific business entity, for example a vendor has vendor master record and all
vendor master record(s) in SAP ERP system make up one vendor master data.
Unlike master data, transaction data represents executed processes or transactions that
involve master data. Transaction data are commonly used in day-to-day process in the
form of transaction documents. A transaction document might represent many master
data but it can only represent one single transaction data. For example in the process
18
of order purchasing, material master data, customer master data and vendor master
data are used in order to fulfill the order purchasing process. The three master data are
used in order to make sure that the order purchasing process happens according to the
business requirements.
3.3 Financial Accounting
Accounting is the process of identifying, recording, summarizing, and reporting eco-
nomic information for decision makers that is primarily caused by business transac-
tions. Accounting is mainly divided into two main categories, financial accounting and
management accounting. Financial accounting’s main task is to record all the transac-
tions that happen within an organizations, both externally and internally. The main
purpose of financial accounting is to meet the legal financial reporting requirements in
order to report them to SEC or Securities and Exchange Commission, and IRS or In-
ternal Revenue Service in the United States.
Financial accounting plays an important role within an organization as it is the core of
an organization and it reflects how healthy the organization is at the current given time.
Financial accounting can be broken down into several accounting process such as gen-
eral ledger accounting, accounts receivable accounting, accounts payable accounting,
asset accounting and bank ledger accounting. (Magal &Word 2012, 50.)
3.3.1 Accounting Documents
In financial accounting, financial accounting document or FI document records the
impact of a transaction process on financial accounting. (Magal & Word 2012, 58.) It
forms the basic structure for providing the right information about the financial ac-
counting process.
19
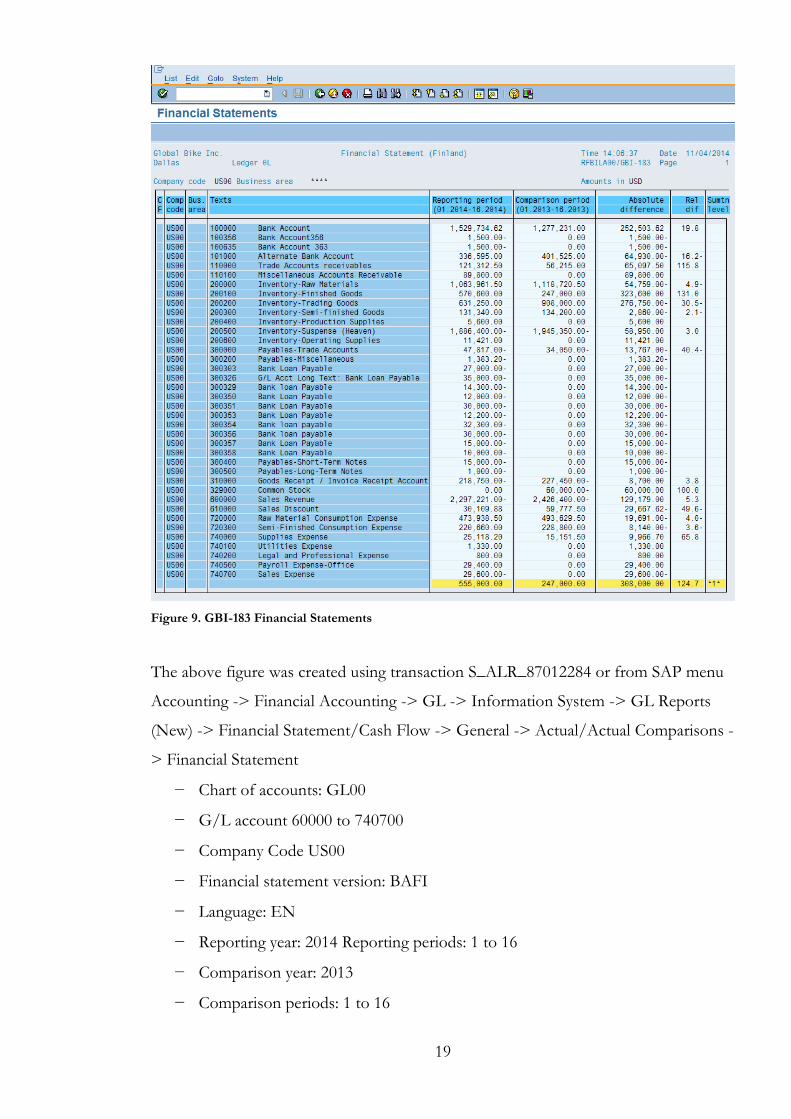
Figure 9. GBI-183 Financial Statements
The above figure was created using transaction S_ALR_87012284 or from SAP menu
Accounting -> Financial Accounting -> GL -> Information System -> GL Reports
(New) -> Financial Statement/Cash Flow -> General -> Actual/Actual Comparisons -
> Financial Statement
− Chart of accounts: GL00
− G/L account 60000 to 740700
− Company Code US00
− Financial statement version: BAFI
− Language: EN
− Reporting year: 2014 Reporting periods: 1 to 16
− Comparison year: 2013
− Comparison periods: 1 to 16
20
Typically an FI document consists of two sections, headers and items. The headers
define the information that is applied to the document and the items define the
amount of debit or credit item. The header section typically consists of document data,
document type, document number, company code, posting date, currency and refer-
ence number while the items section consists of account, description, debit or credit
posting key and amount.
Both headers and items have to give enough information and description of the trans-
action process, the actors that are involved in the transaction process usually in the
form of company code, the amount of debit or credit and a unique assignment of the
documents numbers in the form of posting keys.
3.3.2 General Ledger Accounting
General ledger accounting concentrates on all the external accounting process that
happen within an organization, it records all the business transactions both systemati-
cally and comprehensively. General ledger accounting’s main task is to provide a com-
prehensive picture of the external accounting process and the accounts involved in it.
(Brinkmann & Zeilinger 2010, 79.) In SAP ERP, general ledger accounts are summa-
rized into charts of accounts or COA. Charts of account are collections of general
ledger accounts in one directory.
General ledger accounting typically consists of liabilities, assets, revenues, expenses and
equities. Liabilities are the amount that an organization owes to others. Assets are what
an organization actually owns such as cash, inventory and capitals. Revenues are the
amount of money that an organization earns by selling or providing products and ser-
vices to others. Expenses are the amount of the costs required in order to produce, sell
and provide the products and services to others. Equities are the amount that share-
holders andor owners own that is part of the organization.
21
General ledger accounting provides the following functionalities
− Automatic and simultaneous posting of all sub-ledger items to the corresponding ledger accounts
(reconciliation accounts, i.e. accounts receivable, accounts payable, asset.)
− Simultaneous updating of the general ledger and controlling data (i.e. cost centers, internal orders,
etc.)
− Real time evaluation and reporting of current posting data in the form of account displays and clos-
ing accounts with different financial statement versions, as well as additional analyses. (Brink-
mann & Zeilinger, 2010 79.)
A common representation of a general ledger accounting is through the T account that
indicates the debit and credit items. Debit and credits are the amount that record the
changes made to the general ledger account resulting from business transactions. The
amount of debit and credit in the general ledger accounting have to be in balance for
each business transaction.
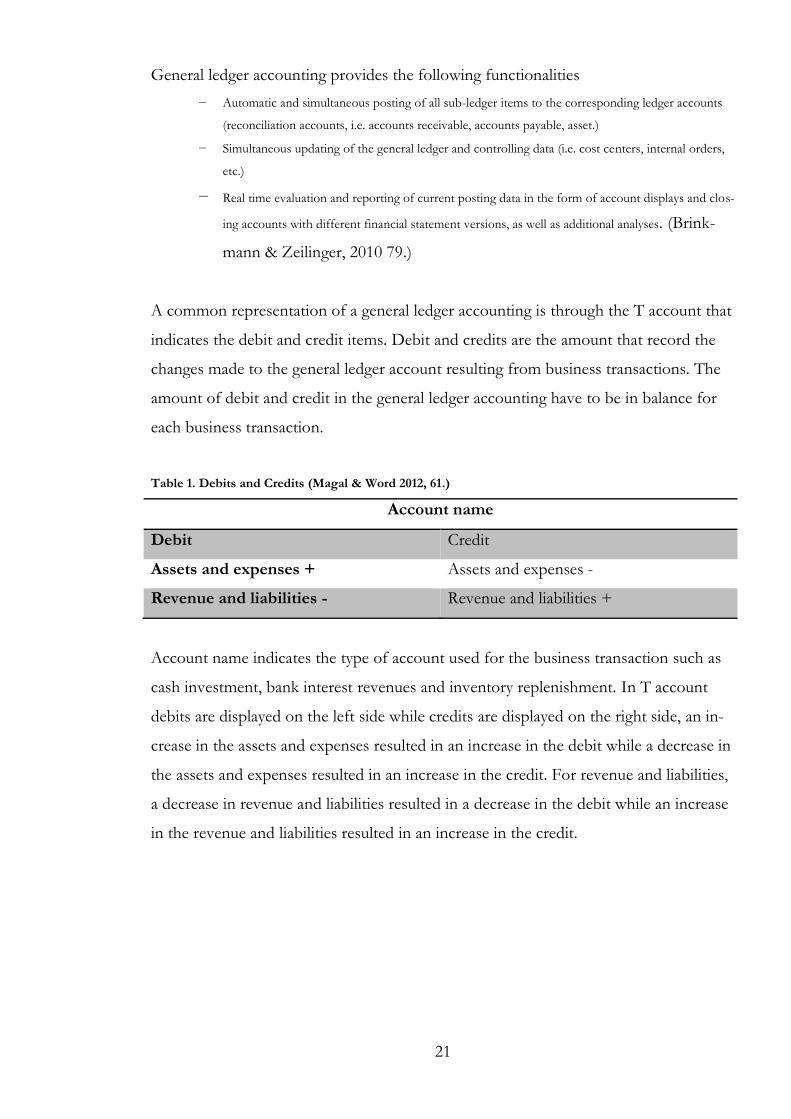
Table 1. Debits and Credits (Magal & Word 2012, 61.)
Account name
Debit Credit
Assets and expenses + Assets and expenses -
Revenue and liabilities - Revenue and liabilities +
Account name indicates the type of account used for the business transaction such as
cash investment, bank interest revenues and inventory replenishment. In T account
debits are displayed on the left side while credits are displayed on the right side, an in-
crease in the assets and expenses resulted in an increase in the debit while a decrease in
the assets and expenses resulted in an increase in the credit. For revenue and liabilities,
a decrease in revenue and liabilities resulted in a decrease in the debit while an increase
in the revenue and liabilities resulted in an increase in the credit.
22
4 Empirical Background
4.1 Purpose
The purpose of this project is to analyze the general ledger data in HAAGA-HELIA
UAS’ SAP ERP system through business transactions scenario, extraction, transfor-
mation and loading using Microsoft Power Pivot. As an addition to this, GBI general
ledger data would be presented in Power View and is going to be uploaded to HAA-
GA-HELIA’s SharePoint using Power BI.
4.2 Business Scenario
Despite a lack of a commissioning party, a business scenario that would give a better
understanding of the study would be created for this thesis. The scenario is as fol-
lowed, Global Bike Incorporated of GBI is in need of a simple yet cost effective tool
for analyzing their external accounting process that happens within the organization.
All business transactions are recorded in their SAP ERP system and displayed in the
form of general ledgers in directories called chart of accounts.
GBI is utilizing their SAP ERP system to post transfer some funds through “T” ac-
counting that consists of debit and credit accounts. The debit and credit accounts are
part of GBI general ledger accounts that record all the business transactions within the
GBI organization. After the post transfer is done, the transferred funds are used for
the purpose of paying bike transport.
After all the business transactions are done, GBI is in need to analyze the business
transaction through a simple yet cost effective analysis tool therefore Microsoft Power
Pivot was chosen. However it was realized that there is an access limitation from GBI’s
SAP ERP system to Microsoft Power Pivot, therefore a manual extraction has to be
done in order to analyze the general ledger data. The manual extraction is done
through data browser in SAP ERP system and by downloading them to spreadsheet
documents.
23
4.3 Prerequisites
In order to conduct the scenario several prerequisites have to available
- Access to HAAGA-HELIA UAS’ system or through Citrix Receiver.
- SAP LOGON 730 provided by SAP UAC Magdeburg, Germany with GBI cre-
dentials GBI-183.
- Microsoft Excel 2013.
- Microsoft Power Pivot, Power View and Power BI.
All systems are located in HAAGA-HELIA UAS’ architecture therefore HAAGA-
HELIA UAS’s system works as the fundamental system of this study. SAP Logon used
for this study is SAP Logon 730 provided by SAP UAC Magdeburg, Germany and
SAP credentials GBI-183 was given by HAAGA-HELIA UAS’ SAP courses teacher
Jarmo Harmonen. Microsoft Excel 2013 is part of Microsoft Office 365 that is availa-
ble for all units in HAAGA-HELIA UAS. Microsoft Power Pivot and Power View are
included in Microsoft Excel 2013, while Power BI is part of HAAGA-HELIA UAS’
SharePoint system.
4.4 Process
The empirical study consists of four main processes
- Display and transfer of GBI general ledger data.
- The extraction of general ledger data from SAP ERP.
- The transformation of general ledger data using Microsoft Excel and Power
Pivot.
- The uploading of the Power Pivot to Power BI.
Each process consists of different steps based on the business transaction scenario
mentioned before. Each process is done through agile and specific methods so that the
study would be as accurate as possible.
24
5 Empirical Process
5.1 Display and Transfer of GBI General Ledger Data
The foundation of the display and transfer of GBI general ledger data is the exercise FI
1 to FI 9, provided by SAP University Alliances through Financial Management and
Accounting course. (SAP University Alliances.) The exercise consists of nine different
exercises, display chart of accounts, display chart of accounts 2, display general ledger
account, post transfer of funds to alternate bank account, display general account doc-
ument, post purchase of office supplies, display general ledger account balances,
change financial accounting document and display changes to financial accounting
documents. However for the purpose of this study some changes were done in order
to create a better business transaction scenario that clearly pictures the change in the
general ledger accounts.
Display GBI-183 G/L account
SAP ERP database
(Magdeburg)SAP Logon 730
SAP ERP Global Bike (GBI 183)
Display GBI-183 COA
Post transfer of funds to account
100645 from account 100785
Display G/L post transfer of funds
account documents
Post paying miscellaneous to account 300200
from account 100645
Display G/L post paying
miscellaneous account balance
Change financial accounting
document from paying
miscellaneous to paying bike transport
Display changes to financial accounting
documents
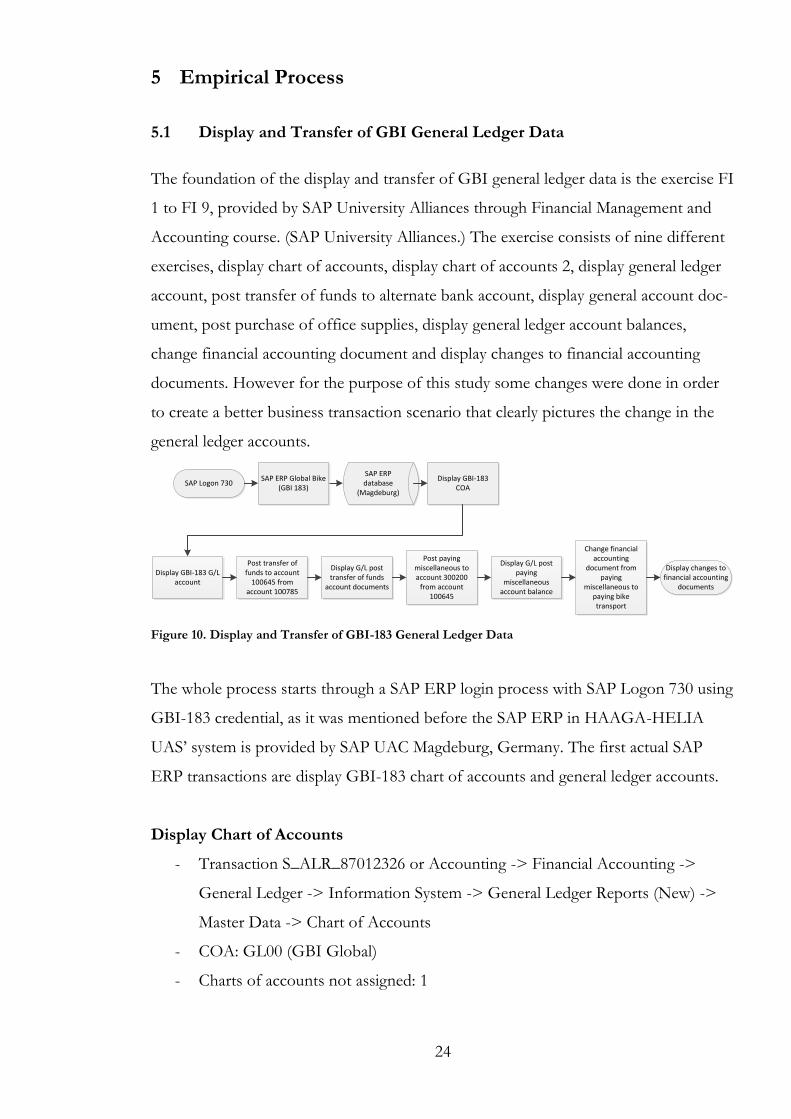
Figure 10. Display and Transfer of GBI-183 General Ledger Data
The whole process starts through a SAP ERP login process with SAP Logon 730 using
GBI-183 credential, as it was mentioned before the SAP ERP in HAAGA-HELIA
UAS’ system is provided by SAP UAC Magdeburg, Germany. The first actual SAP
ERP transactions are display GBI-183 chart of accounts and general ledger accounts.
Display Chart of Accounts
- Transaction S_ALR_87012326 or Accounting -> Financial Accounting ->
General Ledger -> Information System -> General Ledger Reports (New) ->
Master Data -> Chart of Accounts
- COA: GL00 (GBI Global)
- Charts of accounts not assigned: 1
25
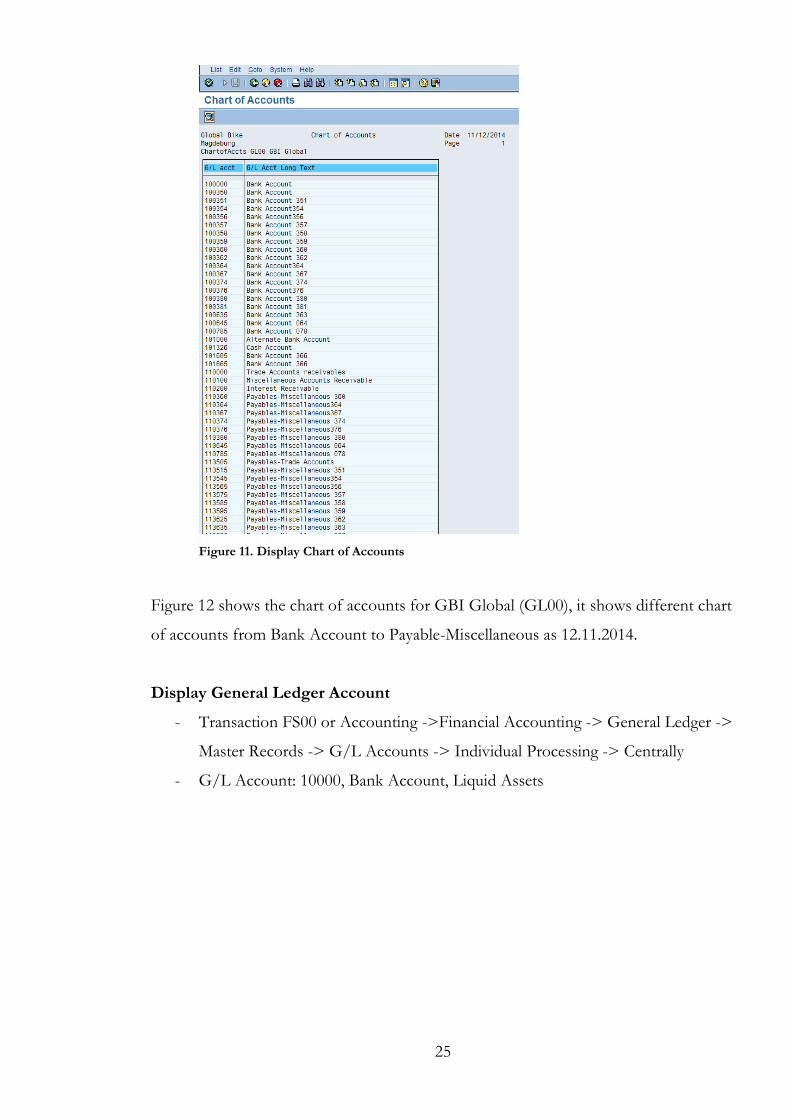
Figure 11. Display Chart of Accounts
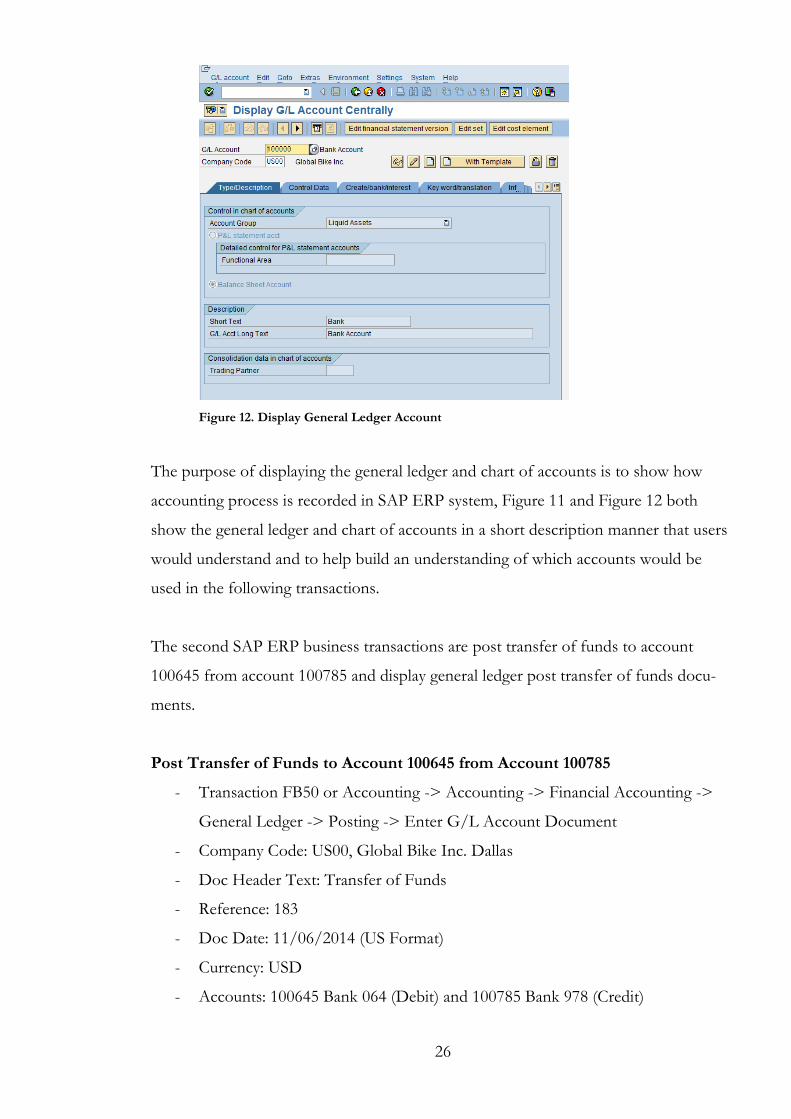
Figure 12 shows the chart of accounts for GBI Global (GL00), it shows different chart
of accounts from Bank Account to Payable-Miscellaneous as 12.11.2014.
Display General Ledger Account
- Transaction FS00 or Accounting ->Financial Accounting -> General Ledger ->
Master Records -> G/L Accounts -> Individual Processing -> Centrally
- G/L Account: 10000, Bank Account, Liquid Assets
26
Figure 12. Display General Ledger Account
The purpose of displaying the general ledger and chart of accounts is to show how
accounting process is recorded in SAP ERP system, Figure 11 and Figure 12 both
show the general ledger and chart of accounts in a short description manner that users
would understand and to help build an understanding of which accounts would be
used in the following transactions.
The second SAP ERP business transactions are post transfer of funds to account
100645 from account 100785 and display general ledger post transfer of funds docu-
ments.
Post Transfer of Funds to Account 100645 from Account 100785
- Transaction FB50 or Accounting -> Accounting -> Financial Accounting ->
General Ledger -> Posting -> Enter G/L Account Document
- Company Code: US00, Global Bike Inc. Dallas
- Doc Header Text: Transfer of Funds
- Reference: 183
- Doc Date: 11/06/2014 (US Format)
- Currency: USD
- Accounts: 100645 Bank 064 (Debit) and 100785 Bank 978 (Credit)
27
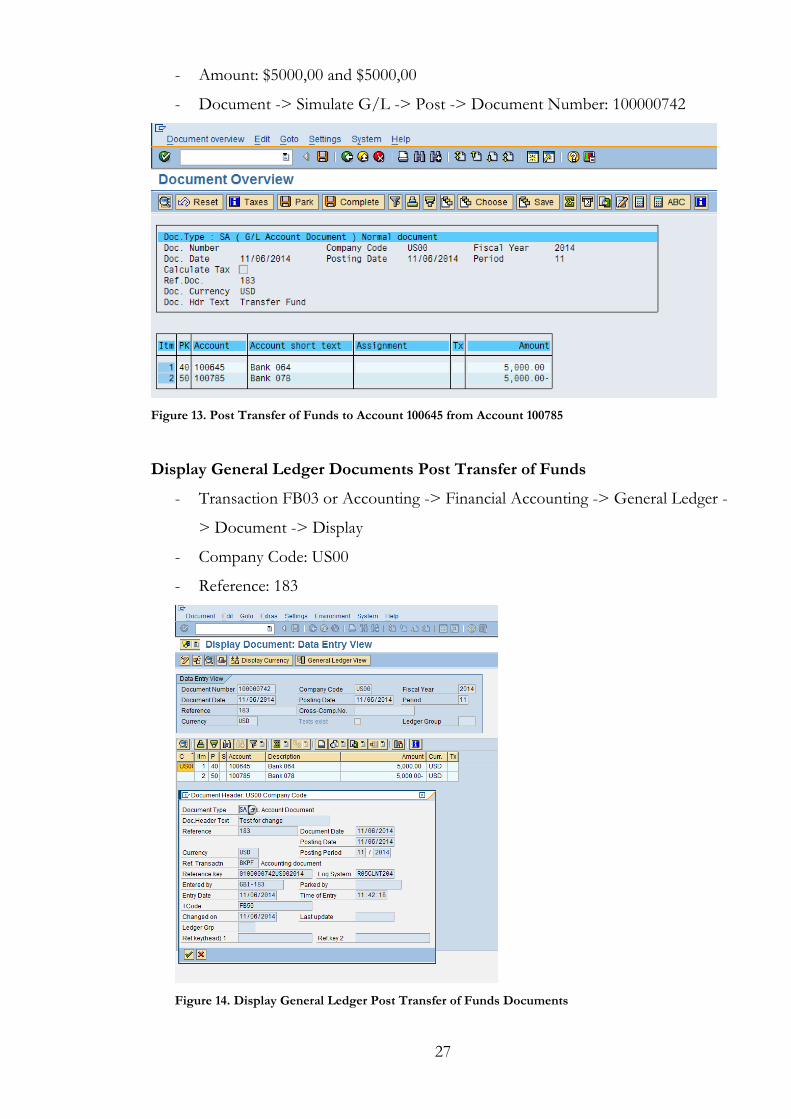
- Amount: $5000,00 and $5000,00
- Document -> Simulate G/L -> Post -> Document Number: 100000742
Figure 13. Post Transfer of Funds to Account 100645 from Account 100785
Display General Ledger Documents Post Transfer of Funds
- Transaction FB03 or Accounting -> Financial Accounting -> General Ledger -
> Document -> Display
- Company Code: US00
- Reference: 183
Figure 14. Display General Ledger Post Transfer of Funds Documents
28
Figure 13 and Figure 14 show the post transfer of funds process from account 100785
to account 100645. Account 100645 has received the amount of $ 5.000,00 through
debit while account 100785 has a reduction of $ 5.000,00 through credit. This is the
foundation of general ledger accounting as it was explained before. General ledger ac-
counting records all business transactions that happen within an organization, typically
general ledger accounting consists of two or more accounts. For each debit transaction
there should be a credit transaction or vice versa, and the amount should be balance on
both sides.
The third SAP ERP business transactions are post paying miscellaneous to account
300200 from account 100645 and display G/L post paying miscellaneous account bal-
ances.
Post Paying Miscellaneous to Account 300200 from Account 100645
- Transaction FB50 or Accounting -> Financial Accounting -> General Ledger -
> Posting -> Enter G/L Account Document
- Document Date: 11/06/2014 (US Format)
- Reference: 183
- Doc. Header Text: Paying Misc
- Accounts: 300200 Payable Miscellaneous (Debit) and 100645 Bank 064 (Credit)
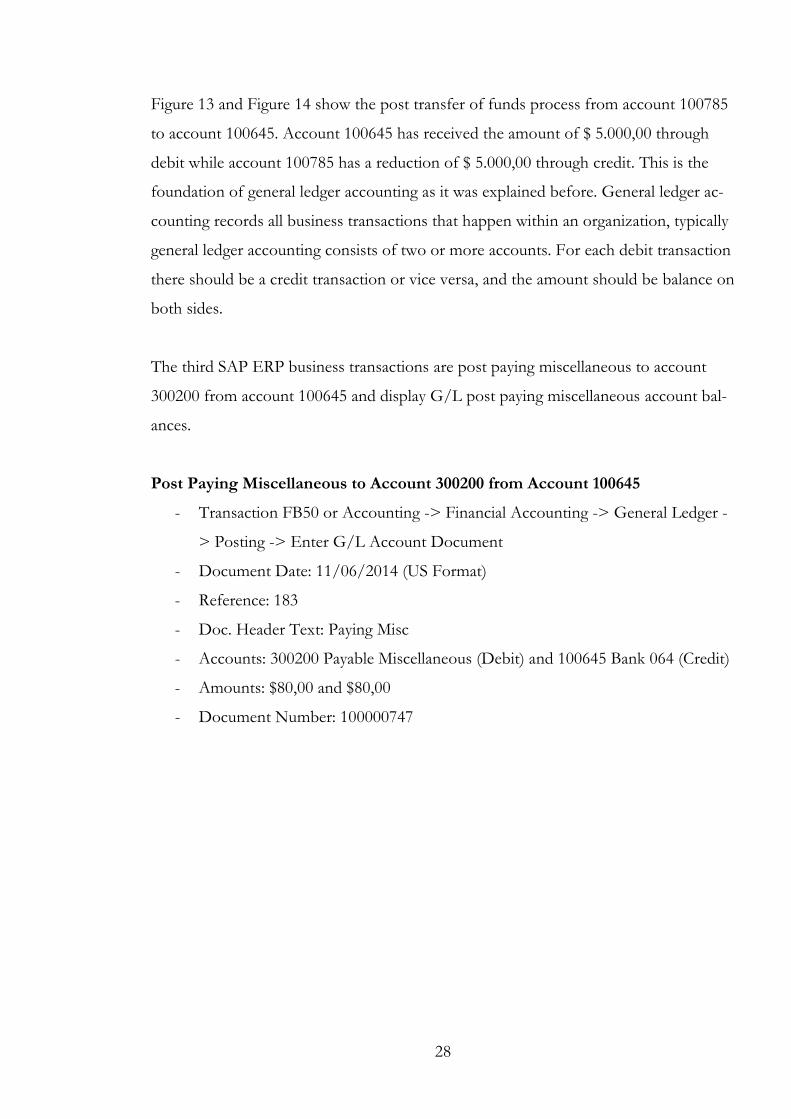
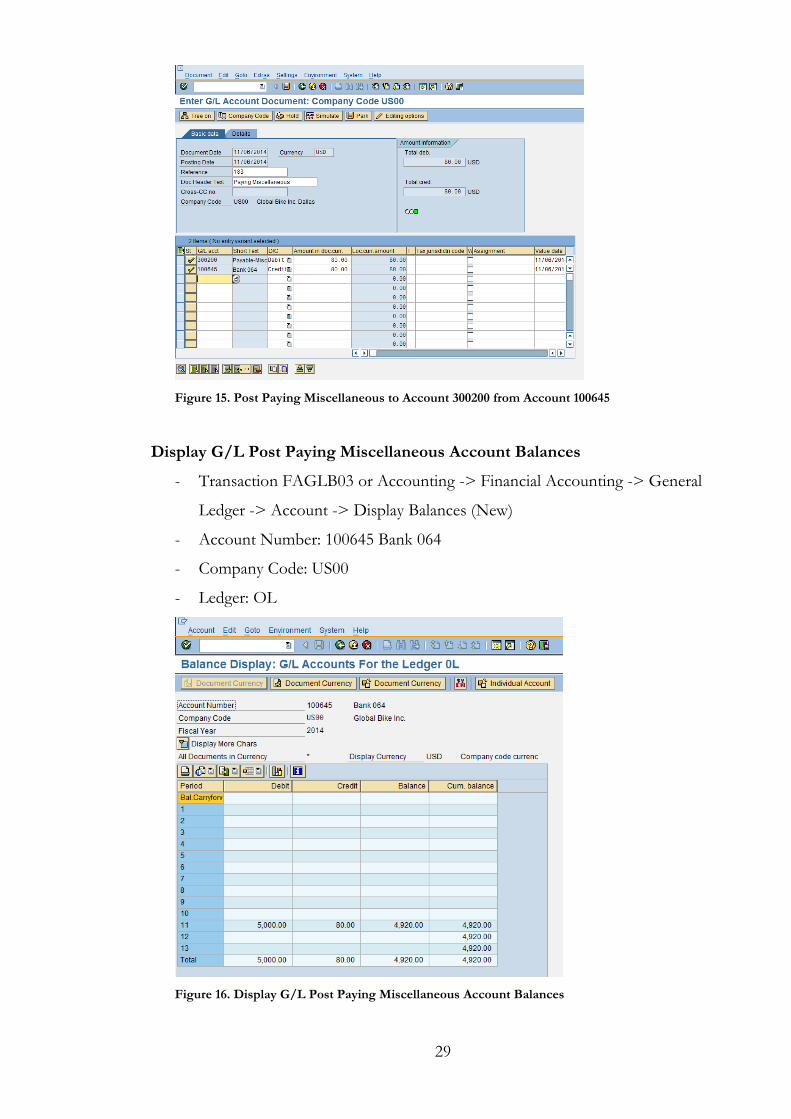
- Amounts: $80,00 and $80,00
- Document Number: 100000747
29
Figure 15. Post Paying Miscellaneous to Account 300200 from Account 100645
Display G/L Post Paying Miscellaneous Account Balances
- Transaction FAGLB03 or Accounting -> Financial Accounting -> General
Ledger -> Account -> Display Balances (New)
- Account Number: 100645 Bank 064
- Company Code: US00
- Ledger: OL
Figure 16. Display G/L Post Paying Miscellaneous Account Balances
30
Figure 15 and Figure 16 show the post paying miscellaneous transaction through gen-
eral ledger accounting that consist of debit and credit accounts. Account 300200 works
as the debit account while account 100645 works as the credit account and there is a
balance amount on each account, account 300200 has received the amount of $80,00
while account 100645 has a reduction of $80,00. To proof that the business transaction
has taken place, Figure 18 shows that the balance amount on account 300200 has been
reduced from $5.000,00 to $4.200,00 through a credit transaction of $80,00.
The last SAP ERP business transactions are change financial accounting document
from paying miscellaneous to paying bike transport and display changes to financial
accounting documents.
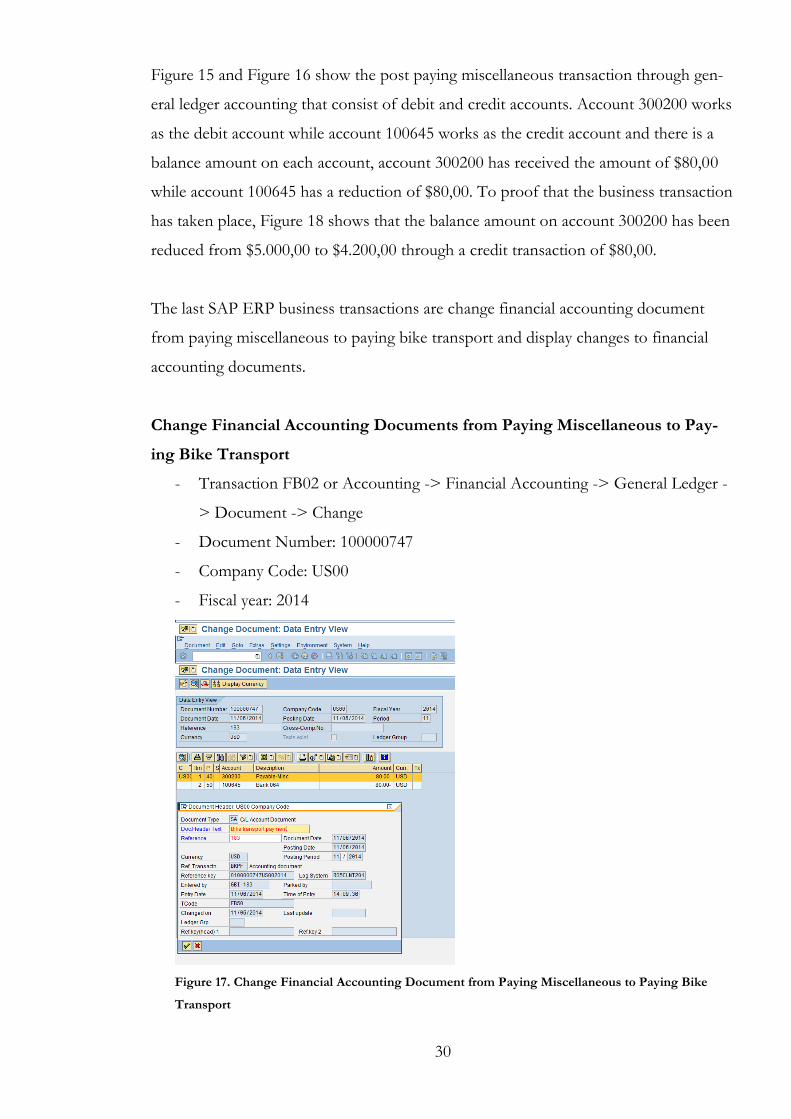
Change Financial Accounting Documents from Paying Miscellaneous to Pay-
ing Bike Transport
- Transaction FB02 or Accounting -> Financial Accounting -> General Ledger -
> Document -> Change
- Document Number: 100000747
- Company Code: US00
- Fiscal year: 2014
Figure 17. Change Financial Accounting Document from Paying Miscellaneous to Paying Bike
Transport
31
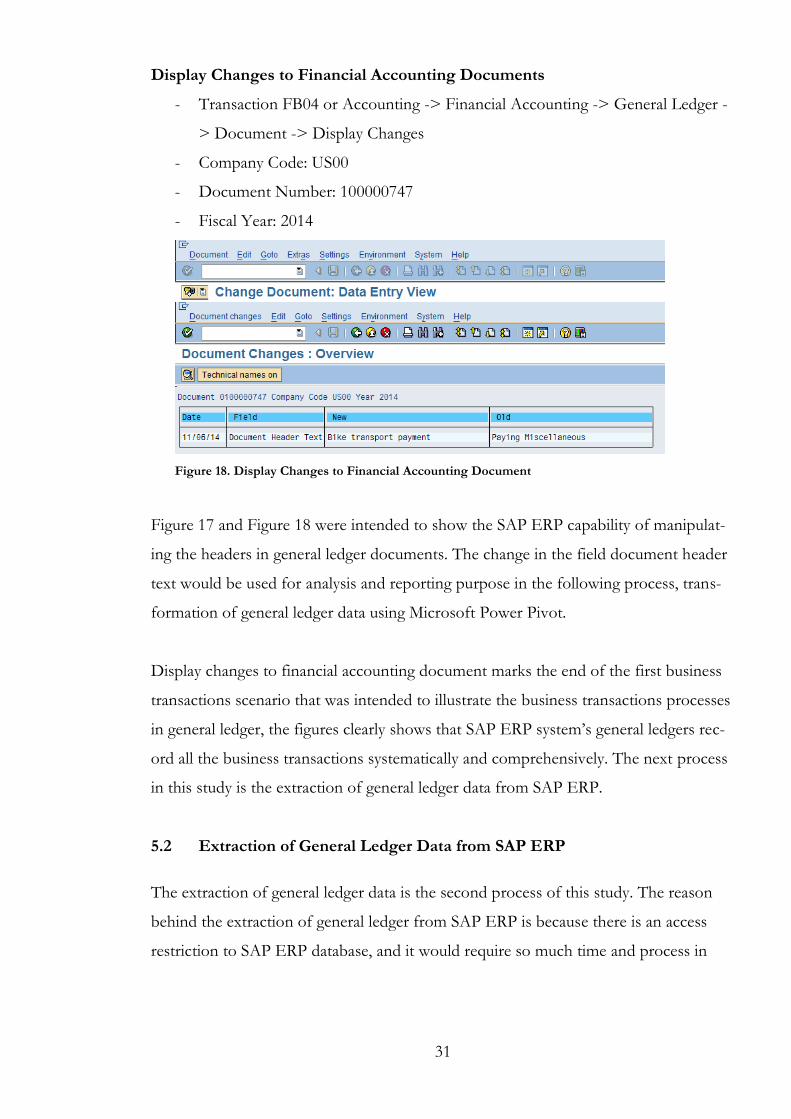
Display Changes to Financial Accounting Documents
- Transaction FB04 or Accounting -> Financial Accounting -> General Ledger -
> Document -> Display Changes
- Company Code: US00
- Document Number: 100000747
- Fiscal Year: 2014
Figure 18. Display Changes to Financial Accounting Document
Figure 17 and Figure 18 were intended to show the SAP ERP capability of manipulat-
ing the headers in general ledger documents. The change in the field document header
text would be used for analysis and reporting purpose in the following process, trans-
formation of general ledger data using Microsoft Power Pivot.
Display changes to financial accounting document marks the end of the first business
transactions scenario that was intended to illustrate the business transactions processes
in general ledger, the figures clearly shows that SAP ERP system’s general ledgers rec-
ord all the business transactions systematically and comprehensively. The next process
in this study is the extraction of general ledger data from SAP ERP.
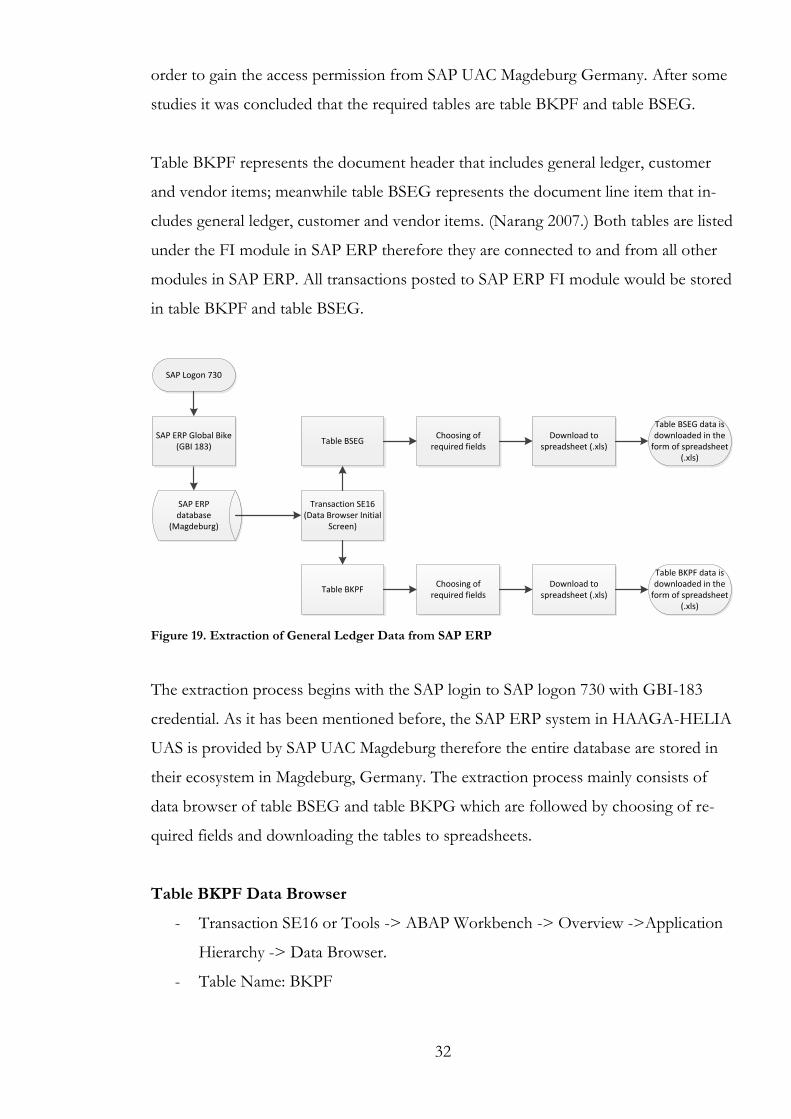
5.2 Extraction of General Ledger Data from SAP ERP
The extraction of general ledger data is the second process of this study. The reason
behind the extraction of general ledger from SAP ERP is because there is an access
restriction to SAP ERP database, and it would require so much time and process in
32
order to gain the access permission from SAP UAC Magdeburg Germany. After some
studies it was concluded that the required tables are table BKPF and table BSEG.
Table BKPF represents the document header that includes general ledger, customer
and vendor items; meanwhile table BSEG represents the document line item that in-
cludes general ledger, customer and vendor items. (Narang 2007.) Both tables are listed
under the FI module in SAP ERP therefore they are connected to and from all other
modules in SAP ERP. All transactions posted to SAP ERP FI module would be stored
in table BKPF and table BSEG.
SAP ERP database
(Magdeburg)
Transaction SE16 (Data Browser Initial
Screen)
SAP Logon 730
SAP ERP Global Bike (GBI 183)
Table BKPF
Table BSEGChoosing of
required fields
Choosing of required fields
Download to spreadsheet (.xls)
Download to spreadsheet (.xls)
Table BSEG data is downloaded in the
form of spreadsheet (.xls)
Table BKPF data is downloaded in the
form of spreadsheet (.xls)
Figure 19. Extraction of General Ledger Data from SAP ERP
The extraction process begins with the SAP login to SAP logon 730 with GBI-183
credential. As it has been mentioned before, the SAP ERP system in HAAGA-HELIA
UAS is provided by SAP UAC Magdeburg therefore the entire database are stored in
their ecosystem in Magdeburg, Germany. The extraction process mainly consists of
data browser of table BSEG and table BKPG which are followed by choosing of re-
quired fields and downloading the tables to spreadsheets.
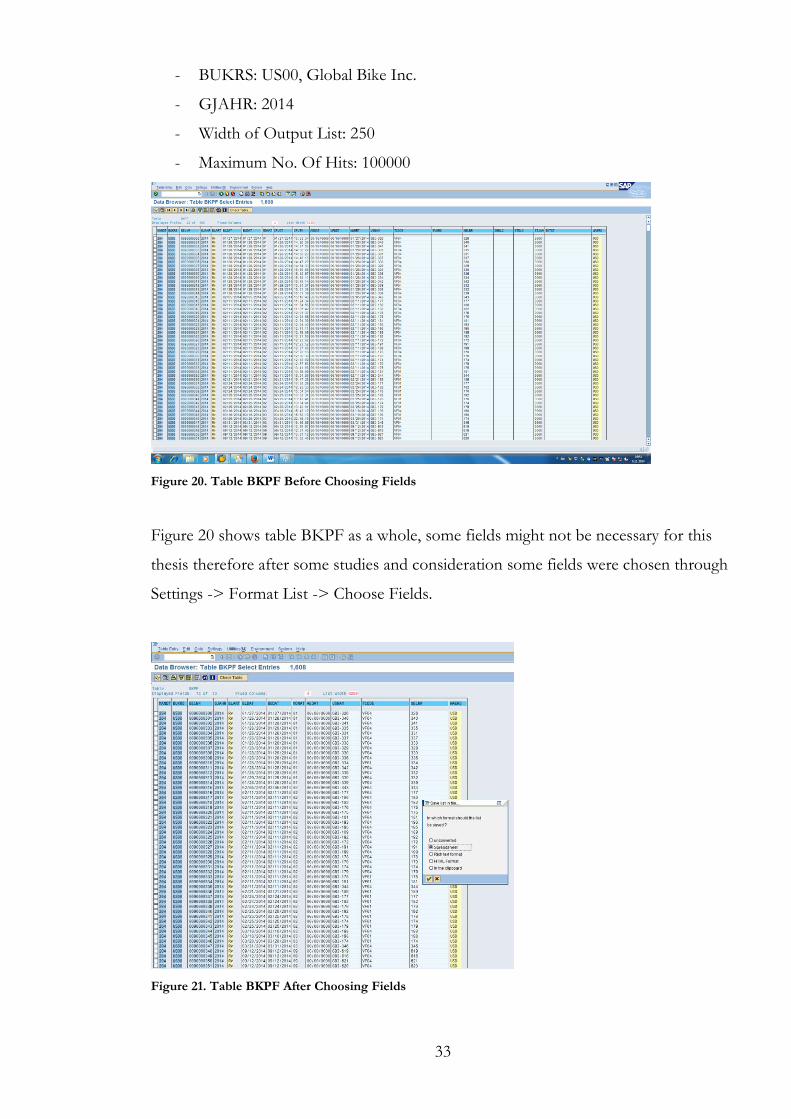
Table BKPF Data Browser
- Transaction SE16 or Tools -> ABAP Workbench -> Overview ->Application
Hierarchy -> Data Browser.
- Table Name: BKPF
33
- BUKRS: US00, Global Bike Inc.
- GJAHR: 2014
- Width of Output List: 250
- Maximum No. Of Hits: 100000
Figure 20. Table BKPF Before Choosing Fields
Figure 20 shows table BKPF as a whole, some fields might not be necessary for this
thesis therefore after some studies and consideration some fields were chosen through
Settings -> Format List -> Choose Fields.
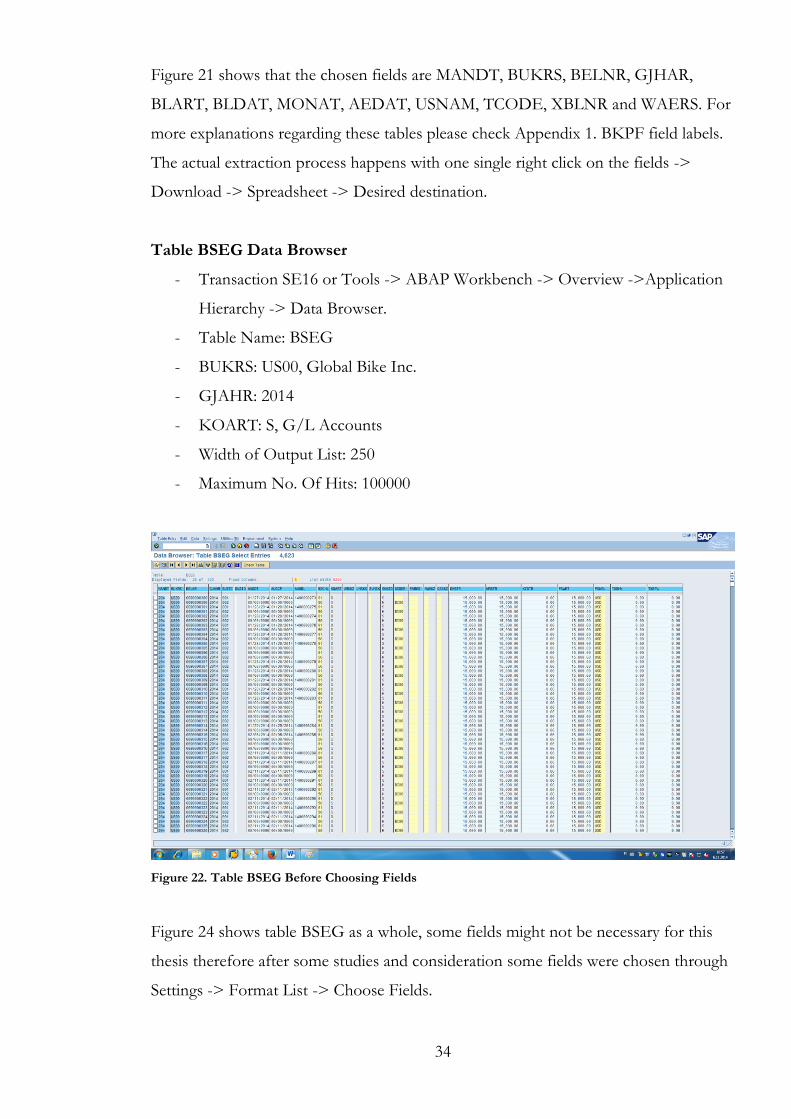
Figure 21. Table BKPF After Choosing Fields
34
Figure 21 shows that the chosen fields are MANDT, BUKRS, BELNR, GJHAR,
BLART, BLDAT, MONAT, AEDAT, USNAM, TCODE, XBLNR and WAERS. For
more explanations regarding these tables please check Appendix 1. BKPF field labels.
The actual extraction process happens with one single right click on the fields ->
Download -> Spreadsheet -> Desired destination.
Table BSEG Data Browser
- Transaction SE16 or Tools -> ABAP Workbench -> Overview ->Application
Hierarchy -> Data Browser.
- Table Name: BSEG
- BUKRS: US00, Global Bike Inc.
- GJAHR: 2014
- KOART: S, G/L Accounts
- Width of Output List: 250
- Maximum No. Of Hits: 100000
Figure 22. Table BSEG Before Choosing Fields
Figure 24 shows table BSEG as a whole, some fields might not be necessary for this
thesis therefore after some studies and consideration some fields were chosen through
Settings -> Format List -> Choose Fields.
35
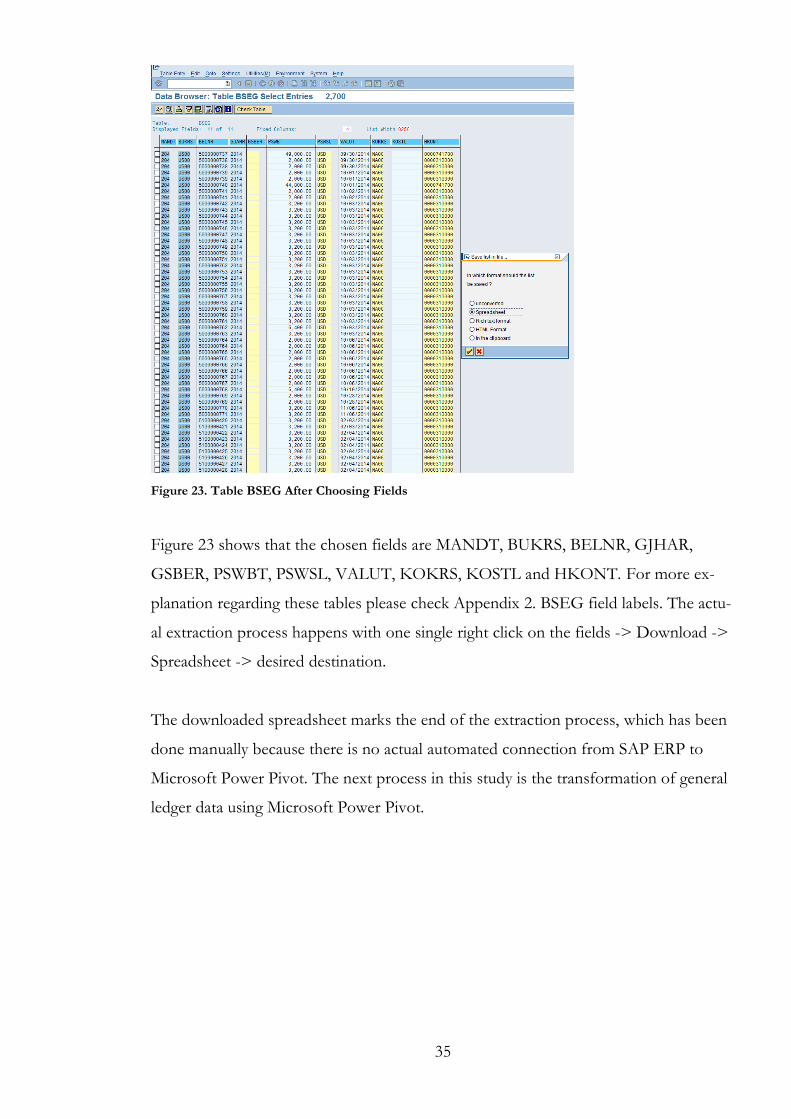
Figure 23. Table BSEG After Choosing Fields
Figure 23 shows that the chosen fields are MANDT, BUKRS, BELNR, GJHAR,
GSBER, PSWBT, PSWSL, VALUT, KOKRS, KOSTL and HKONT. For more ex-
planation regarding these tables please check Appendix 2. BSEG field labels. The actu-
al extraction process happens with one single right click on the fields -> Download ->
Spreadsheet -> desired destination.
The downloaded spreadsheet marks the end of the extraction process, which has been
done manually because there is no actual automated connection from SAP ERP to
Microsoft Power Pivot. The next process in this study is the transformation of general
ledger data using Microsoft Power Pivot.
36
5.3 Transformation of General Ledger Data using Microsoft Power Pivot
Table BKPF
Table BSEG
Checking table BKPF data structure
Checking table BSEG data structure
Formatting table BKPF structure and
format in Excel
Formatting table BSEG structure and
format in Excel
Creating table BKPF and BSEG as one Excel document
Importing Data into Microsoft Power
Pivot
Data Filtration
Creating Relationship
between table BKPF and table BSEF
Creating Dashboard
Dashboard created
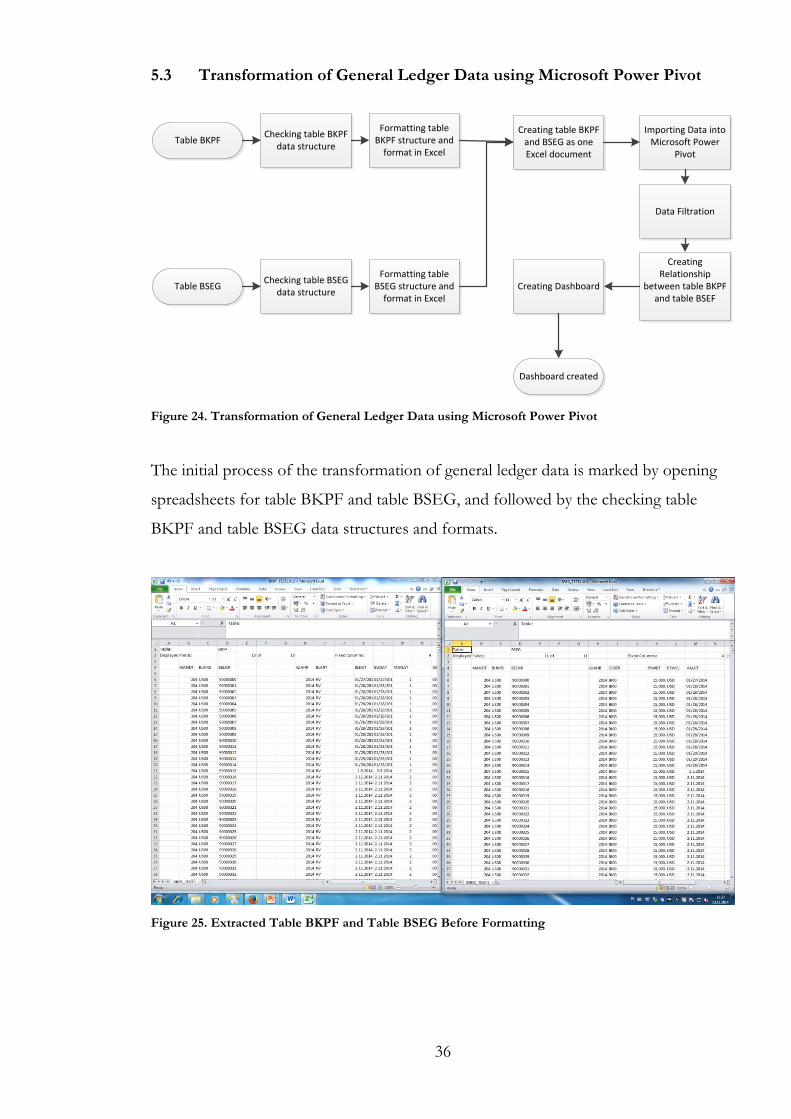
Figure 24. Transformation of General Ledger Data using Microsoft Power Pivot
The initial process of the transformation of general ledger data is marked by opening
spreadsheets for table BKPF and table BSEG, and followed by the checking table
BKPF and table BSEG data structures and formats.
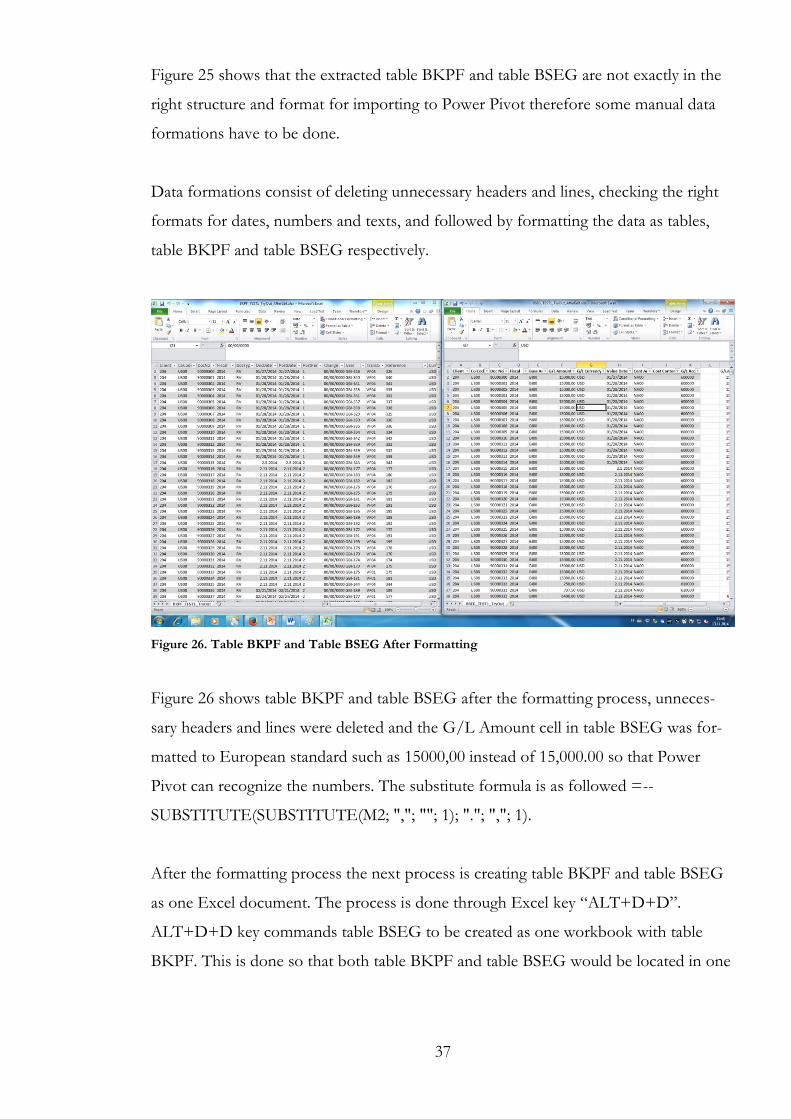
Figure 25. Extracted Table BKPF and Table BSEG Before Formatting
37
Figure 25 shows that the extracted table BKPF and table BSEG are not exactly in the
right structure and format for importing to Power Pivot therefore some manual data
formations have to be done.
Data formations consist of deleting unnecessary headers and lines, checking the right
formats for dates, numbers and texts, and followed by formatting the data as tables,
table BKPF and table BSEG respectively.
Figure 26. Table BKPF and Table BSEG After Formatting
Figure 26 shows table BKPF and table BSEG after the formatting process, unneces-
sary headers and lines were deleted and the G/L Amount cell in table BSEG was for-
matted to European standard such as 15000,00 instead of 15,000.00 so that Power
Pivot can recognize the numbers. The substitute formula is as followed =--
SUBSTITUTE(SUBSTITUTE(M2; ","; ""; 1); "."; ","; 1).
After the formatting process the next process is creating table BKPF and table BSEG
as one Excel document. The process is done through Excel key “ALT+D+D”.
ALT+D+D key commands table BSEG to be created as one workbook with table
BKPF. This is done so that both table BKPF and table BSEG would be located in one

38
Excel workbook in order to import the tables to Power Pivot and to create a relation-
ship between table BKPF and table BSEG.
Importing data into Microsoft Power Pivot is done through process Power Pivot Tab -
> Manage -> From Other Sources -> Excel File -> Excel File Path (Use first row as
column header) -> Choose Source Table -> Filter if needed -> Finish.
When both tables have been imported to Power Pivot, the first thing to remember is
to create relationship between tables. Create relationship is done through Power Pivot
Design Tab -> Create Relationship -> Choose table BKPF, Column DocNo and table
BSEG Column Doc No -> Create.
Doc No is the unique key in both tables because there is only one single document
number for each business transaction.
Figure 27. Table BKPF and Table BSEG Relationship Diagram
Figure 27 shows the relationship diagram between table BKPD and table BSEG. Fig-
ure 27 also shows the fields that are included in both table BKPF and table BSEG.
Table BKPF consists of Client, CoCode, DocNo, Fiscal, DocType, DocDate, Post-
Date, PostPeriod, Change, user, TransCode, Reference and Currency. Meanwhile table
39
BSEG consists of Client, CoCode, Doc No, Fiscal, Buss Area, GL Amount, GL Cur-
rency, Value Date, Cont Area, Cost Center and GL Acc.
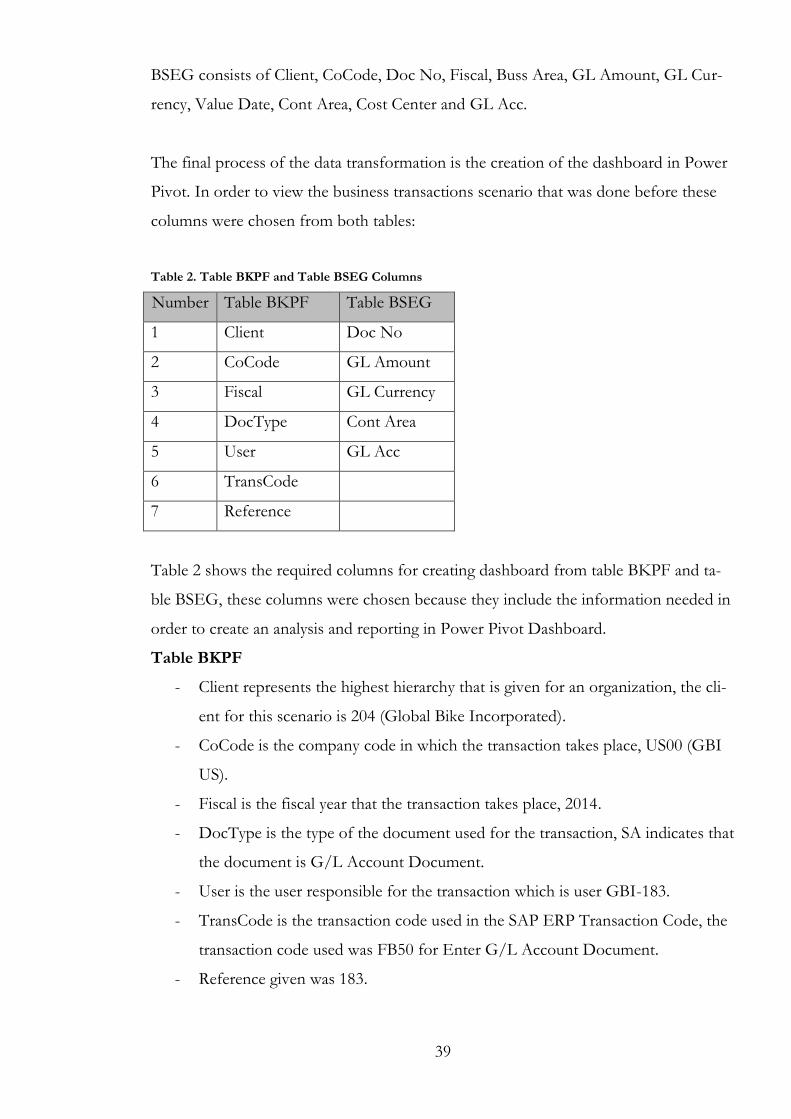
The final process of the data transformation is the creation of the dashboard in Power
Pivot. In order to view the business transactions scenario that was done before these
columns were chosen from both tables:
Table 2. Table BKPF and Table BSEG Columns
Number Table BKPF Table BSEG
1 Client Doc No
2 CoCode GL Amount
3 Fiscal GL Currency
4 DocType Cont Area
5 User GL Acc
6 TransCode
7 Reference
Table 2 shows the required columns for creating dashboard from table BKPF and ta-
ble BSEG, these columns were chosen because they include the information needed in
order to create an analysis and reporting in Power Pivot Dashboard.
Table BKPF
- Client represents the highest hierarchy that is given for an organization, the cli-
ent for this scenario is 204 (Global Bike Incorporated).
- CoCode is the company code in which the transaction takes place, US00 (GBI
US).
- Fiscal is the fiscal year that the transaction takes place, 2014.
- DocType is the type of the document used for the transaction, SA indicates that
the document is G/L Account Document.
- User is the user responsible for the transaction which is user GBI-183.
- TransCode is the transaction code used in the SAP ERP Transaction Code, the
transaction code used was FB50 for Enter G/L Account Document.
- Reference given was 183.
40
Table BSEG
- Doc No is the Document Number given by the SAP ERP system after the
transaction has been executed, there are two Document Numbers in this sce-
nario 100000742 for the post transfer of funds and 100000747 for post paying
bike transport.
- GL Amount is the amount of the General Ledger that is used for the transac-
tion, for document number 100000742 the amount is $ 5000,00 while for doc-
ument number 100000747 the amount is $80,00.
- GL Currency indicates the currency used for the transactions.
- Cont Area is the organizational unit that represents accounting component in
SAP ERP, in this transaction no controlling area was used
- GL Acc are the list of general ledger accounts that are involved in the transac-
tion, for document number 100000742 the general ledger accounts are 100645
and 100785 while for document number 100000747 the general ledger accounts
are 100645 and 300200.
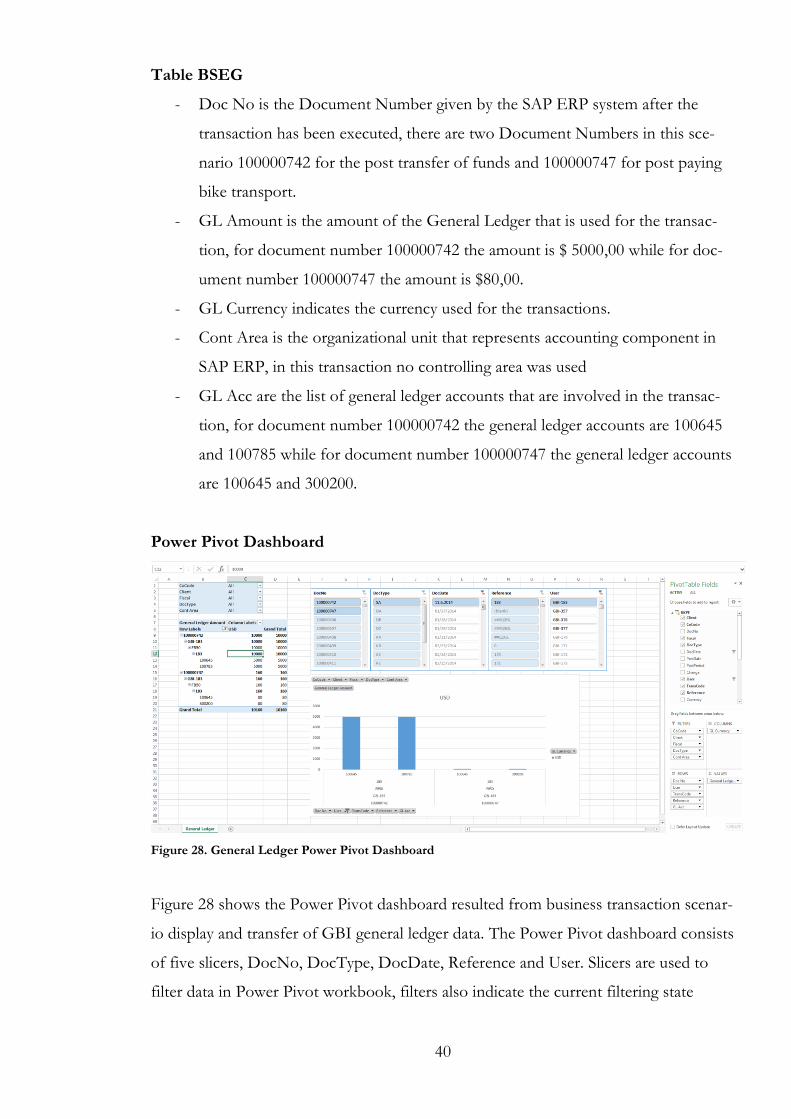
Power Pivot Dashboard
Figure 28. General Ledger Power Pivot Dashboard
Figure 28 shows the Power Pivot dashboard resulted from business transaction scenar-
io display and transfer of GBI general ledger data. The Power Pivot dashboard consists
of five slicers, DocNo, DocType, DocDate, Reference and User. Slicers are used to
filter data in Power Pivot workbook, filters also indicate the current filtering state
41
which makes is easy to understand what exactly is shown in a filtered PivotTable re-
port. (Microsoft Office Support 2014b.)
The dashboard shows the general ledger amount in USD for document number
100000742 and 100000747, it includes the reference, user responsible, SAP transaction
code and document date. Document number 100000742 consists of general ledger
account 100645 and 100785, while document number 100000747 consists of general
ledger account 100645 and 300200.
The dashboard shows that for both documents there is a balance in both debit and
credit accounts resulted from general ledger accounting. For document number
100000742, the debit amount is $5000,00 for account 100645 and the credit amount is
$5000,00 for account 100785. Meanwhile for document number 100000747, the debit
amount is $80,00 for account 300200 and the credit amount is $80,00 for account
100645.
5.4 Power View and Power BI
Power View
Power View is a feature for Office 365 and Excel 2013 that enables interactive data
exploration, visualization, and presentation experience that encourage intuitive ad-hoc
reporting. (Microsoft Office Support 2014c.) Power View works as a self-service alter-
native for BI visualization and presentation layers through the extension of charts, re-
ports and maps capabilities. Power View enables the users to display and present their
data in more stylish manners without eliminating the main idea of BI that is a fast and
simple data presentation for analysis and reporting.
42
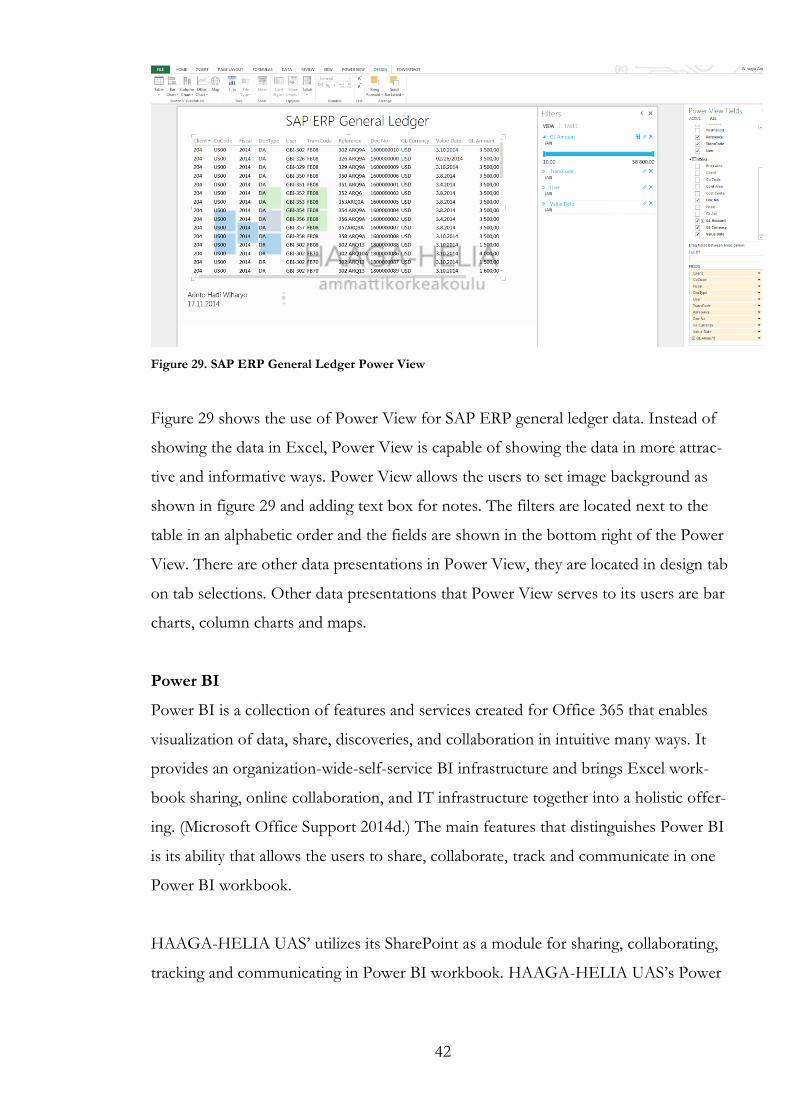
Figure 29. SAP ERP General Ledger Power View
Figure 29 shows the use of Power View for SAP ERP general ledger data. Instead of
showing the data in Excel, Power View is capable of showing the data in more attrac-
tive and informative ways. Power View allows the users to set image background as
shown in figure 29 and adding text box for notes. The filters are located next to the
table in an alphabetic order and the fields are shown in the bottom right of the Power
View. There are other data presentations in Power View, they are located in design tab
on tab selections. Other data presentations that Power View serves to its users are bar
charts, column charts and maps.
Power BI
Power BI is a collection of features and services created for Office 365 that enables
visualization of data, share, discoveries, and collaboration in intuitive many ways. It
provides an organization-wide-self-service BI infrastructure and brings Excel work-
book sharing, online collaboration, and IT infrastructure together into a holistic offer-
ing. (Microsoft Office Support 2014d.) The main features that distinguishes Power BI
is its ability that allows the users to share, collaborate, track and communicate in one
Power BI workbook.
HAAGA-HELIA UAS’ utilizes its SharePoint as a module for sharing, collaborating,
tracking and communicating in Power BI workbook. HAAGA-HELIA UAS’s Power
43
BI is a licensed based feature that is given for students or teachers by HAAGA-
HELIA UAS’ IT Help Desk.
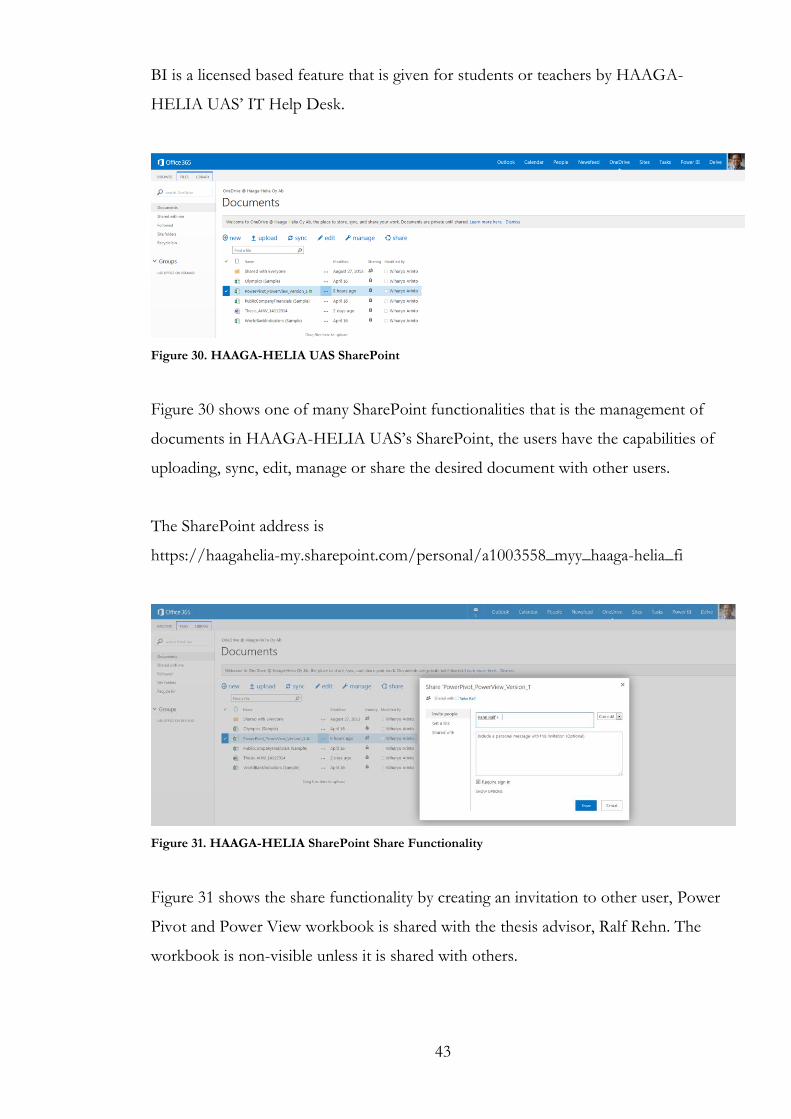
Figure 30. HAAGA-HELIA UAS SharePoint
Figure 30 shows one of many SharePoint functionalities that is the management of
documents in HAAGA-HELIA UAS’s SharePoint, the users have the capabilities of
uploading, sync, edit, manage or share the desired document with other users.
The SharePoint address is
https://haagahelia-my.sharepoint.com/personal/a1003558_myy_haaga-helia_fi
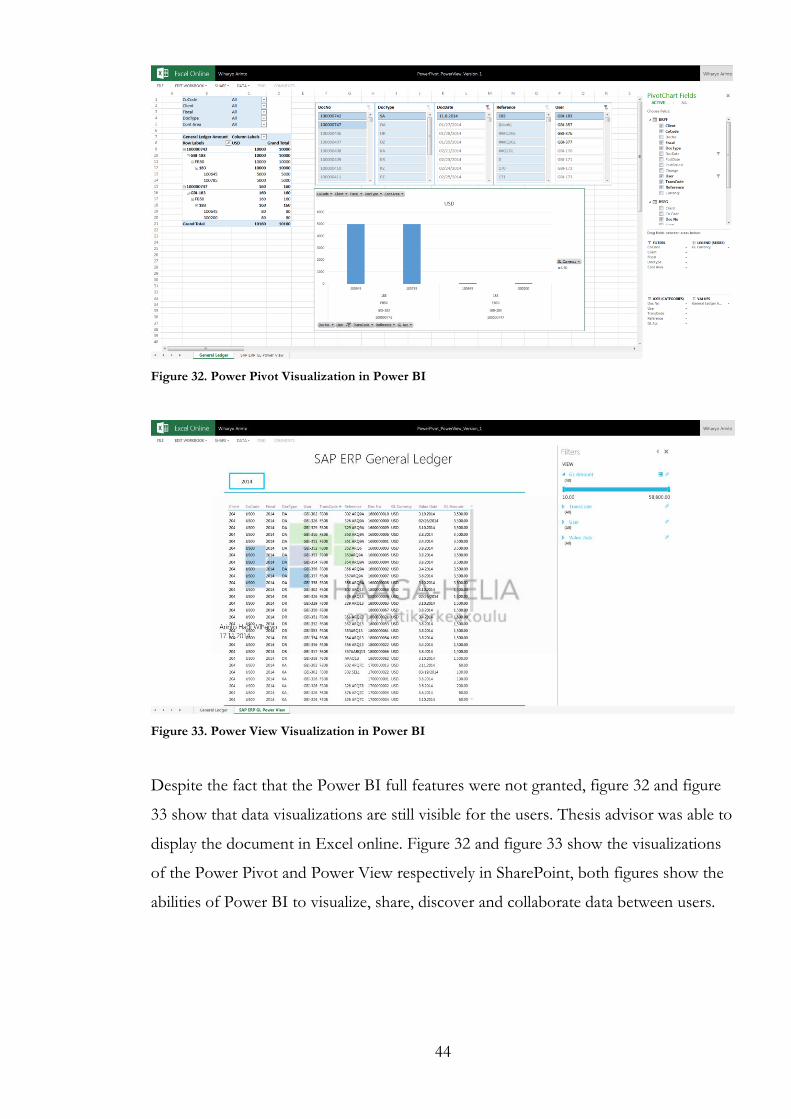
Figure 31. HAAGA-HELIA SharePoint Share Functionality
Figure 31 shows the share functionality by creating an invitation to other user, Power
Pivot and Power View workbook is shared with the thesis advisor, Ralf Rehn. The
workbook is non-visible unless it is shared with others.
44
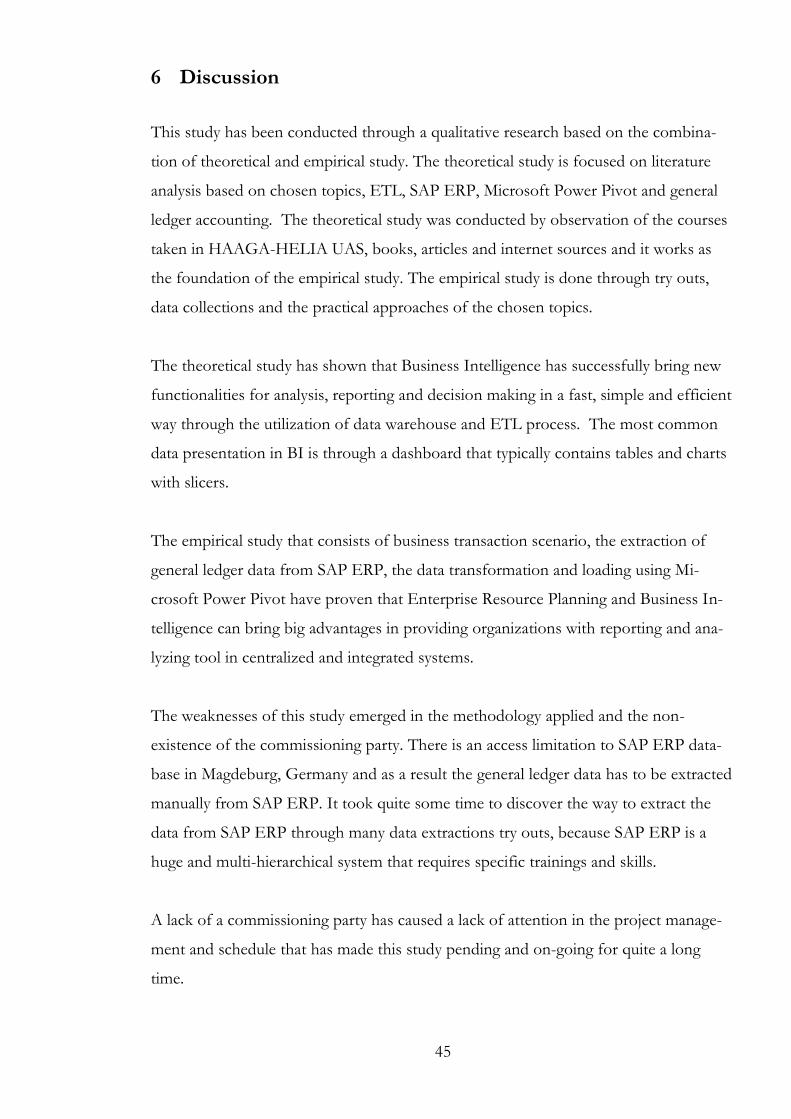
Figure 32. Power Pivot Visualization in Power BI
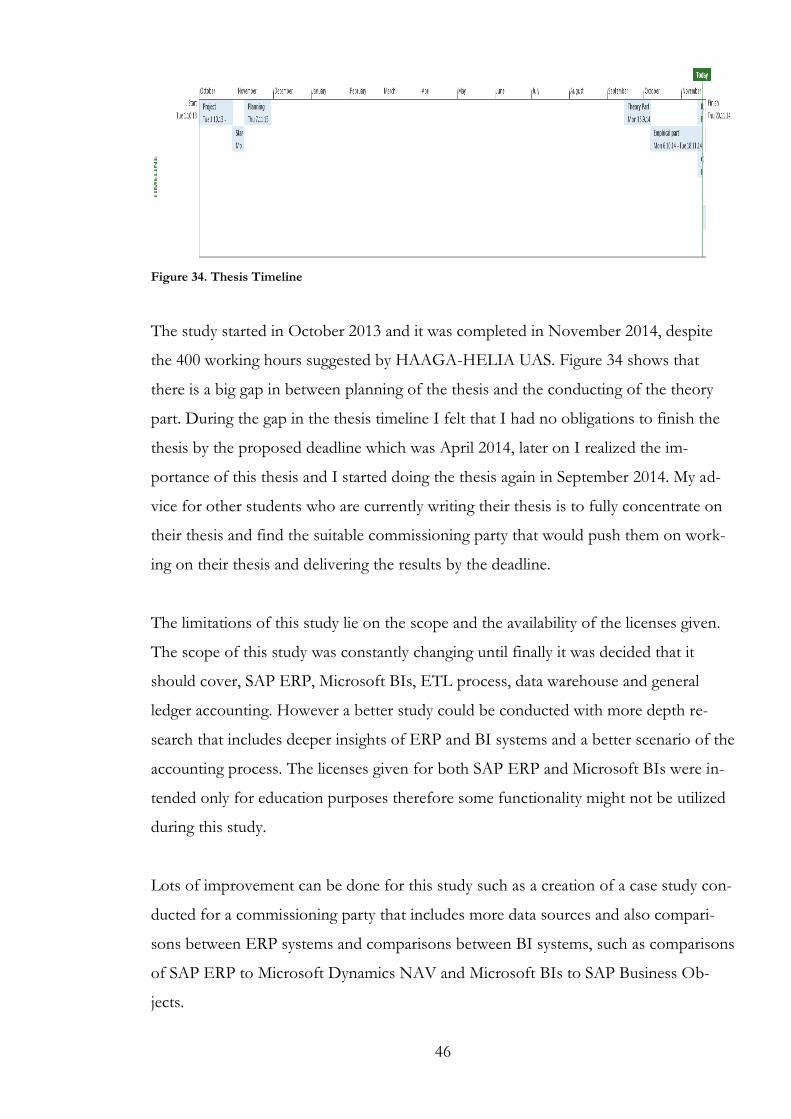
Figure 33. Power View Visualization in Power BI
Despite the fact that the Power BI full features were not granted, figure 32 and figure
33 show that data visualizations are still visible for the users. Thesis advisor was able to
display the document in Excel online. Figure 32 and figure 33 show the visualizations
of the Power Pivot and Power View respectively in SharePoint, both figures show the
abilities of Power BI to visualize, share, discover and collaborate data between users.
45
6 Discussion
This study has been conducted through a qualitative research based on the combina-
tion of theoretical and empirical study. The theoretical study is focused on literature
analysis based on chosen topics, ETL, SAP ERP, Microsoft Power Pivot and general
ledger accounting. The theoretical study was conducted by observation of the courses
taken in HAAGA-HELIA UAS, books, articles and internet sources and it works as
the foundation of the empirical study. The empirical study is done through try outs,
data collections and the practical approaches of the chosen topics.
The theoretical study has shown that Business Intelligence has successfully bring new
functionalities for analysis, reporting and decision making in a fast, simple and efficient
way through the utilization of data warehouse and ETL process. The most common
data presentation in BI is through a dashboard that typically contains tables and charts
with slicers.
The empirical study that consists of business transaction scenario, the extraction of
general ledger data from SAP ERP, the data transformation and loading using Mi-
crosoft Power Pivot have proven that Enterprise Resource Planning and Business In-
telligence can bring big advantages in providing organizations with reporting and ana-
lyzing tool in centralized and integrated systems.
The weaknesses of this study emerged in the methodology applied and the non-
existence of the commissioning party. There is an access limitation to SAP ERP data-
base in Magdeburg, Germany and as a result the general ledger data has to be extracted
manually from SAP ERP. It took quite some time to discover the way to extract the
data from SAP ERP through many data extractions try outs, because SAP ERP is a
huge and multi-hierarchical system that requires specific trainings and skills.
A lack of a commissioning party has caused a lack of attention in the project manage-
ment and schedule that has made this study pending and on-going for quite a long
time.
46
Figure 34. Thesis Timeline
The study started in October 2013 and it was completed in November 2014, despite
the 400 working hours suggested by HAAGA-HELIA UAS. Figure 34 shows that
there is a big gap in between planning of the thesis and the conducting of the theory
part. During the gap in the thesis timeline I felt that I had no obligations to finish the
thesis by the proposed deadline which was April 2014, later on I realized the im-
portance of this thesis and I started doing the thesis again in September 2014. My ad-
vice for other students who are currently writing their thesis is to fully concentrate on
their thesis and find the suitable commissioning party that would push them on work-
ing on their thesis and delivering the results by the deadline.
The limitations of this study lie on the scope and the availability of the licenses given.
The scope of this study was constantly changing until finally it was decided that it
should cover, SAP ERP, Microsoft BIs, ETL process, data warehouse and general
ledger accounting. However a better study could be conducted with more depth re-
search that includes deeper insights of ERP and BI systems and a better scenario of the
accounting process. The licenses given for both SAP ERP and Microsoft BIs were in-
tended only for education purposes therefore some functionality might not be utilized
during this study.
Lots of improvement can be done for this study such as a creation of a case study con-
ducted for a commissioning party that includes more data sources and also compari-
sons between ERP systems and comparisons between BI systems, such as comparisons
of SAP ERP to Microsoft Dynamics NAV and Microsoft BIs to SAP Business Ob-
jects.

47
This study has been conducted according to the scope however some things were left
out of scope in order to focus on the research questions. Scorecards, KPIs, and OLTP
and OLAP were left out scope despite the fact that they are part of the BI and bring
more knowledge to the readers; they were left out of scope in order to limit the num-
ber of pages as the deadline is approaching for this study. Power View and Power BI
are available for students and lecturers and they give more knowledge and skills to the
readers of this study, therefore both were explained in brief and short chapters.
Last but not least this study has given a vast amount of knowledge on the chosen top-
ics. Not only that this study has allowed me to conduct theoretical and empirical re-
searches despite all the limitations and challenges, this study has allowed me to explore
my knowledge and interest in financial accounting, ERP and BI systems. It is hoped
that this study would be useful for my future studies and career, and to all the readers.
48
References
Biere, M. 2010. The New Era of Enterprise Business Intelligence. 2nd ed. IBM
Press/Pearson Education. Massachusetts, USA.
Brinkmann, S & Zeilinger, A. 2001. SAP R/3 Financial Accounting, Making it work
for your business. 1st edition. SAP Press. USA.
Gartner. 2013a. Operational Data Store.
URL: http://www.gartner.com/it-glossary/ods-operational-data-store
Accessed: 20.12.2014
Gartner. 2013b. Data Warehouse.
URL: http://www.gartner.com/it-glossary/data-warehouse/
Accessed: 20.12.2014
Hocevar, B. & Jaklic, J. 2009. Assessing benefits of business intelligence systems – a
case study. Ljubljana, Slovenia.
IMC. 2011. ETL Process Management.
URL: http://www.imc.com/services/enterprise-data-warehousing/etl-process-
management
Accessed: 15.03.2014
Janus, P. & Misner, S. 2011. Building Integrated Business Intelligence Solutions with
SQL Server ® 2008 R2 & Office 2010. The McGraw-Hill Companies. USA
Laberge, R. 2011. The data warehouse mentor: Practical data warehouse and Business
Intelligence insights. The McGraw-Hill Companies. USA.
Magal, S & Word, J. 2012. Integrated Business Processes with ERP Systems. John
Wiley & Sons, Inc. USA.
49
Maxwell, J.A. 2005. Qualitative research design: An interactive approach. Applied
social methods series, volume 41. Sage Publications. Thousand Oaks California, USA.
Microsoft Office Templates. 2014. Sales revenue financial dashboard.
URL: http://office.microsoft.com/en-us/templates/sales-revenue-financial-
dashboard-TC010370181.aspx
Accessed: 31.10.2014
Microsoft Office Support. 2014a. Power Pivot Add-in.
URL: https://support.office.com/en-US/Article/Power-Pivot-Add-in-a9c2c6e2-cc49-
4976-a7d7-40896795d045?ui=en-US&rs=en-US&ad=US
Accessed: 03.11.2014
Microsoft Office Support. 2014b. Use slicers to filter PivotTable data.
URL: https://support.office.com/en-nz/article/Use-slicers-to-filter-PivotTable-data-
249f966b-a9d5-4b0f-b31a-12651785d29d?ui=en-US&rs=en-NZ&ad=NZ
Accessed: 17.11.2014
Microsoft Office Support. 2014c. Power View: Explore, visualize, and present your
data.
URL: https://support.office.com/en-NZ/Article/Power-View-Explore-visualize-and-
present-your-data-98268d31-97e2-42aa-a52b-a68cf460472e
Accessed: 17.11.2014
Microsoft Office Support. 2014d. Power BI for Office 365 – Overview and Learning.
URL: https://support.office.com/en-us/article/Power-BI-for-Office-365-Overview-
and-Learning-02730e00-5c8c-4fe4-9d77-46b955b71467?ui=en-US&rs=en-US&ad=US
Accessed: 17.11.2014
Microsoft SQL Server. 2014. Power Pivot Management Dashboard and Usage Data.
URL: http://technet.microsoft.com/en-us/library/ee210626(v=sql.110).aspx
Accessed: 21.09.2014
50
Narang, M. 2007. What is the diff bet BSID, BKPF & BSEG tables.
URL: http://scn.sap.com/thread/540903
Accessed: 13.11.2014
Ong, L., Siew. P.H., Wong. S.F. 2011. A five layered business intelligence architecture.
IBIMA Publishing.
URL: http://www.ibimapublishing.com/journals/CIBIMA/2011/695619/695619.pdf
Accessed: 10.02.2014
O’Reilly Radar Team. 2012. Planning for Big Data. 1st ed. O’Reilly Media. California.
Passioned Group. 2014. What is ETL, Extract Transform and Load?
URL: http://www.passionned.com/data-integration/etl-extract-transform-and-load/
Accessed: 05.03.2014
Rouse, M. 2010. Business Intelligence Architecture.
URL: http://searchbusinessanalytics.techtarget.com/definition/business-intelligence-
architecture
Accessed: 01.03.2014
SAP Help Portal. 2014. SAP Business Information Warehouse.
URL:http://help.sap.com/saphelp_nw04/helpdata/en/b2/e50138fede083de10000009
b38f8cf/content.htm
Accessed: 12.03.2014
SAP UA EMEA Portal. 2014. SAP University Alliances.
URL: https://portal.ucc.uni-
magdeburg.de/irj/portal/anonymous?NavigationTarget=navurl://1277051fe2f04e585
32f5d056c62d3a5&windowId=WID1415007523911
Accessed: 03.10.2014
SAP University Alliances. Task FI 1 to Task FI 9.

51
Strauss, A & Corbi, J. 1998. Basics of qualitative research: Techniques and procedures
for developing grounded theory. 2nd edition. Sage Publications. Thousand Oaks,
California.
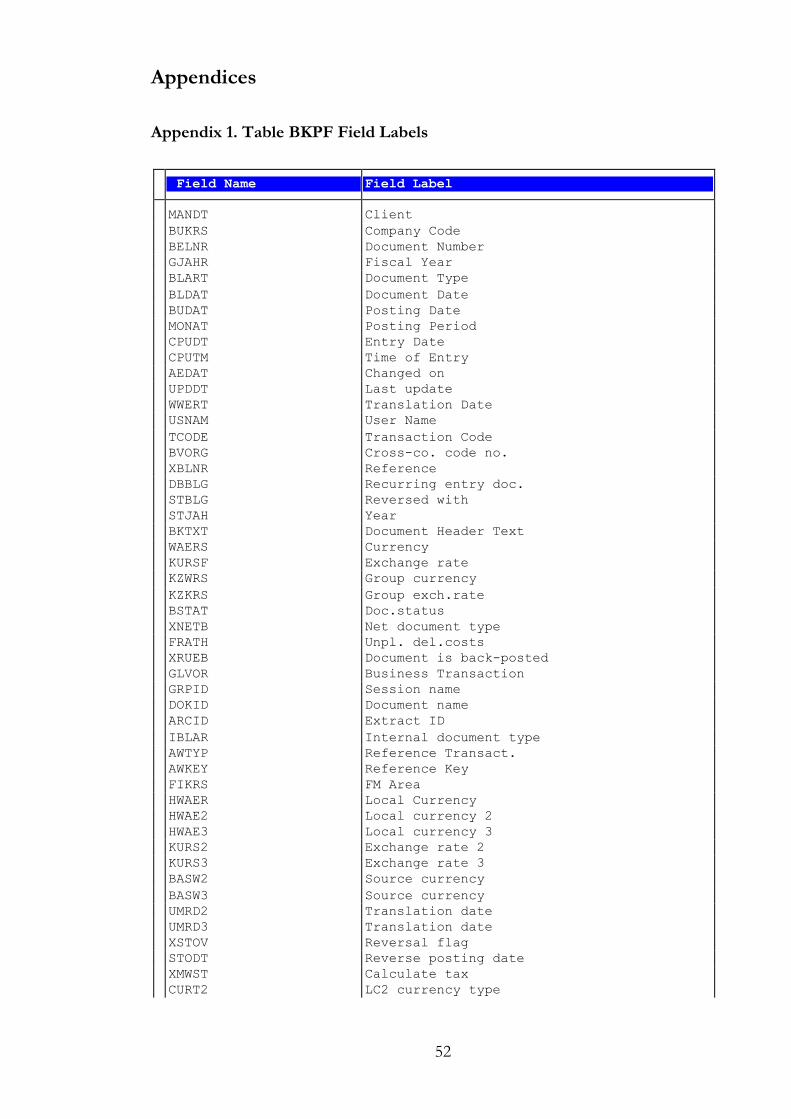
52
Appendices
Appendix 1. Table BKPF Field Labels
Field Name Field Label
MANDT Client
BUKRS Company Code
BELNR Document Number
GJAHR Fiscal Year
BLART Document Type
BLDAT Document Date
BUDAT Posting Date
MONAT Posting Period
CPUDT Entry Date
CPUTM Time of Entry
AEDAT Changed on
UPDDT Last update
WWERT Translation Date
USNAM User Name
TCODE Transaction Code
BVORG Cross-co. code no.
XBLNR Reference
DBBLG Recurring entry doc.
STBLG Reversed with
STJAH Year
BKTXT Document Header Text
WAERS Currency
KURSF Exchange rate
KZWRS Group currency
KZKRS Group exch.rate
BSTAT Doc.status
XNETB Net document type
FRATH Unpl. del.costs
XRUEB Document is back-posted
GLVOR Business Transaction
GRPID Session name
DOKID Document name
ARCID Extract ID
IBLAR Internal document type
AWTYP Reference Transact.
AWKEY Reference Key
FIKRS FM Area
HWAER Local Currency
HWAE2 Local currency 2
HWAE3 Local currency 3
KURS2 Exchange rate 2
KURS3 Exchange rate 3
BASW2 Source currency
BASW3 Source currency
UMRD2 Translation date
UMRD3 Translation date
XSTOV Reversal flag
STODT Reverse posting date
XMWST Calculate tax
CURT2 LC2 currency type
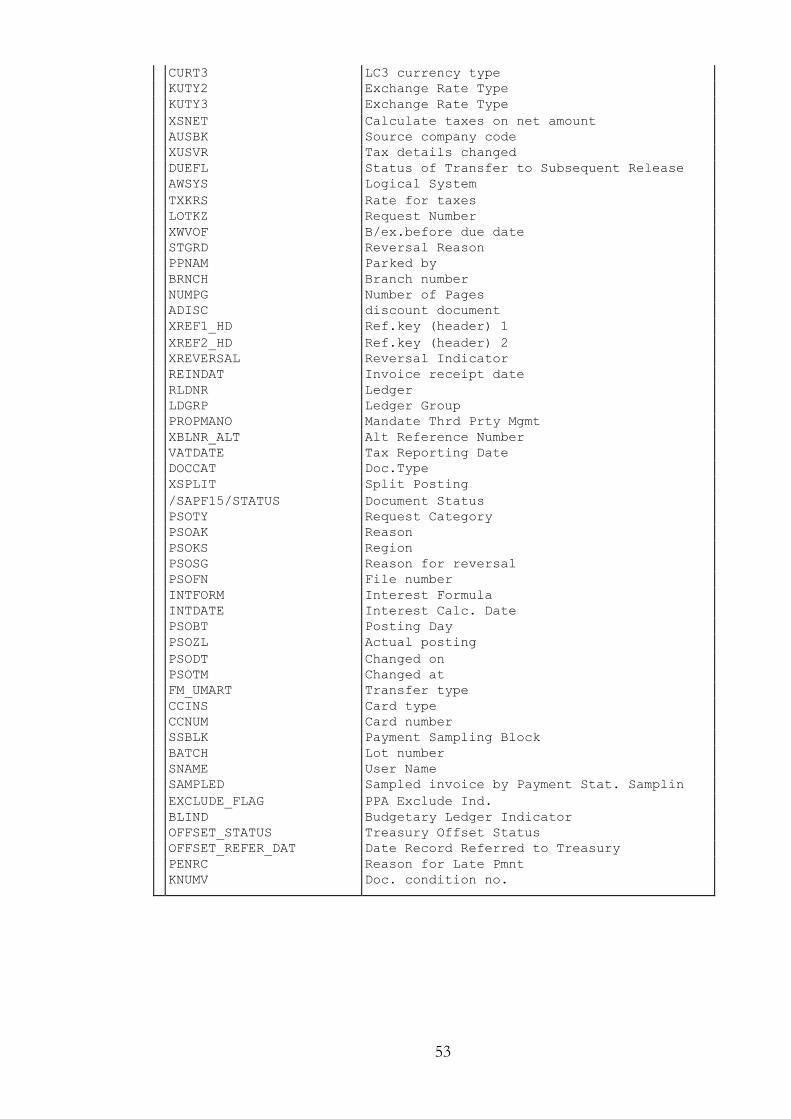
53
CURT3 LC3 currency type
KUTY2 Exchange Rate Type
KUTY3 Exchange Rate Type
XSNET Calculate taxes on net amount
AUSBK Source company code
XUSVR Tax details changed
DUEFL Status of Transfer to Subsequent Release
AWSYS Logical System
TXKRS Rate for taxes
LOTKZ Request Number
XWVOF B/ex.before due date
STGRD Reversal Reason
PPNAM Parked by
BRNCH Branch number
NUMPG Number of Pages
ADISC discount document
XREF1_HD Ref.key (header) 1
XREF2_HD Ref.key (header) 2
XREVERSAL Reversal Indicator
REINDAT Invoice receipt date
RLDNR Ledger
LDGRP Ledger Group
PROPMANO Mandate Thrd Prty Mgmt
XBLNR_ALT Alt Reference Number
VATDATE Tax Reporting Date
DOCCAT Doc.Type
XSPLIT Split Posting
/SAPF15/STATUS Document Status
PSOTY Request Category
PSOAK Reason
PSOKS Region
PSOSG Reason for reversal
PSOFN File number
INTFORM Interest Formula
INTDATE Interest Calc. Date
PSOBT Posting Day
PSOZL Actual posting
PSODT Changed on
PSOTM Changed at
FM_UMART Transfer type
CCINS Card type
CCNUM Card number
SSBLK Payment Sampling Block
BATCH Lot number
SNAME User Name
SAMPLED Sampled invoice by Payment Stat. Samplin
EXCLUDE_FLAG PPA Exclude Ind.
BLIND Budgetary Ledger Indicator
OFFSET_STATUS Treasury Offset Status
OFFSET_REFER_DAT Date Record Referred to Treasury
PENRC Reason for Late Pmnt
KNUMV Doc. condition no.
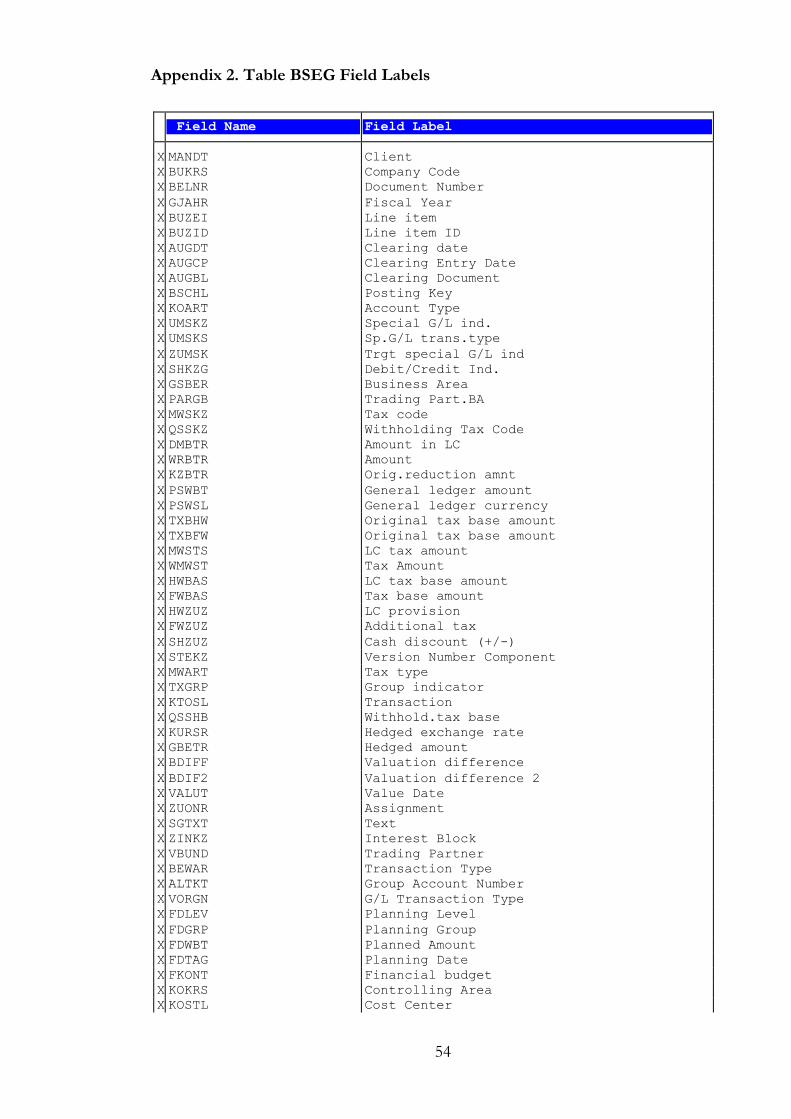
54
Appendix 2. Table BSEG Field Labels
Field Name Field Label
X MANDT Client
X BUKRS Company Code
X BELNR Document Number
X GJAHR Fiscal Year
X BUZEI Line item
X BUZID Line item ID
X AUGDT Clearing date
X AUGCP Clearing Entry Date
X AUGBL Clearing Document
X BSCHL Posting Key
X KOART Account Type
X UMSKZ Special G/L ind.
X UMSKS Sp.G/L trans.type
X ZUMSK Trgt special G/L ind
X SHKZG Debit/Credit Ind.
X GSBER Business Area
X PARGB Trading Part.BA
X MWSKZ Tax code
X QSSKZ Withholding Tax Code
X DMBTR Amount in LC
X WRBTR Amount
X KZBTR Orig.reduction amnt
X PSWBT General ledger amount
X PSWSL General ledger currency
X TXBHW Original tax base amount
X TXBFW Original tax base amount
X MWSTS LC tax amount
X WMWST Tax Amount
X HWBAS LC tax base amount
X FWBAS Tax base amount
X HWZUZ LC provision
X FWZUZ Additional tax
X SHZUZ Cash discount (+/-)
X STEKZ Version Number Component
X MWART Tax type
X TXGRP Group indicator
X KTOSL Transaction
X QSSHB Withhold.tax base
X KURSR Hedged exchange rate
X GBETR Hedged amount
X BDIFF Valuation difference
X BDIF2 Valuation difference 2
X VALUT Value Date
X ZUONR Assignment
X SGTXT Text
X ZINKZ Interest Block
X VBUND Trading Partner
X BEWAR Transaction Type
X ALTKT Group Account Number
X VORGN G/L Transaction Type
X FDLEV Planning Level
X FDGRP Planning Group
X FDWBT Planned Amount
X FDTAG Planning Date
X FKONT Financial budget
X KOKRS Controlling Area
X KOSTL Cost Center
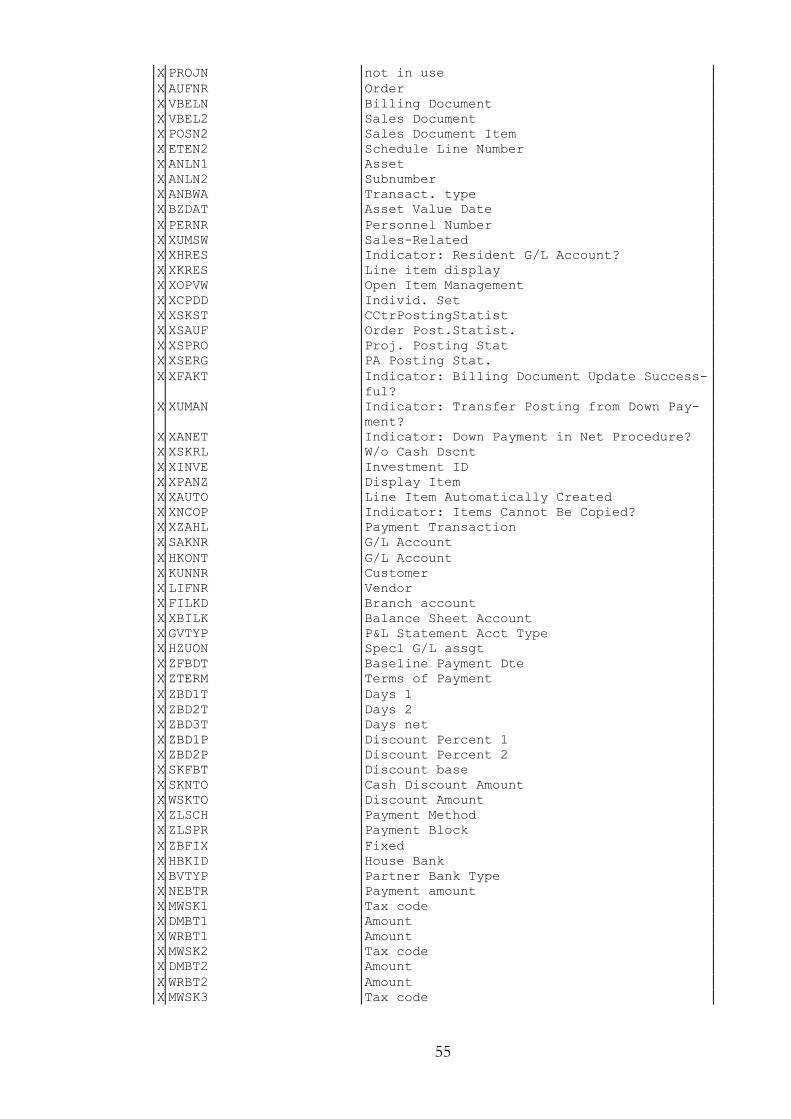
55
X PROJN not in use
X AUFNR Order
X VBELN Billing Document
X VBEL2 Sales Document
X POSN2 Sales Document Item
X ETEN2 Schedule Line Number
X ANLN1 Asset
X ANLN2 Subnumber
X ANBWA Transact. type
X BZDAT Asset Value Date
X PERNR Personnel Number
X XUMSW Sales-Related
X XHRES Indicator: Resident G/L Account?
X XKRES Line item display
X XOPVW Open Item Management
X XCPDD Individ. Set
X XSKST CCtrPostingStatist
X XSAUF Order Post.Statist.
X XSPRO Proj. Posting Stat
X XSERG PA Posting Stat.
X XFAKT Indicator: Billing Document Update Success-
ful?
X XUMAN Indicator: Transfer Posting from Down Pay-
ment?
X XANET Indicator: Down Payment in Net Procedure?
X XSKRL W/o Cash Dscnt
X XINVE Investment ID
X XPANZ Display Item
X XAUTO Line Item Automatically Created
X XNCOP Indicator: Items Cannot Be Copied?
X XZAHL Payment Transaction
X SAKNR G/L Account
X HKONT G/L Account
X KUNNR Customer
X LIFNR Vendor
X FILKD Branch account
X XBILK Balance Sheet Account
X GVTYP P&L Statement Acct Type
X HZUON Specl G/L assgt
X ZFBDT Baseline Payment Dte
X ZTERM Terms of Payment
X ZBD1T Days 1
X ZBD2T Days 2
X ZBD3T Days net
X ZBD1P Discount Percent 1
X ZBD2P Discount Percent 2
X SKFBT Discount base
X SKNTO Cash Discount Amount
X WSKTO Discount Amount
X ZLSCH Payment Method
X ZLSPR Payment Block
X ZBFIX Fixed
X HBKID House Bank
X BVTYP Partner Bank Type
X NEBTR Payment amount
X MWSK1 Tax code
X DMBT1 Amount
X WRBT1 Amount
X MWSK2 Tax code
X DMBT2 Amount
X WRBT2 Amount
X MWSK3 Tax code
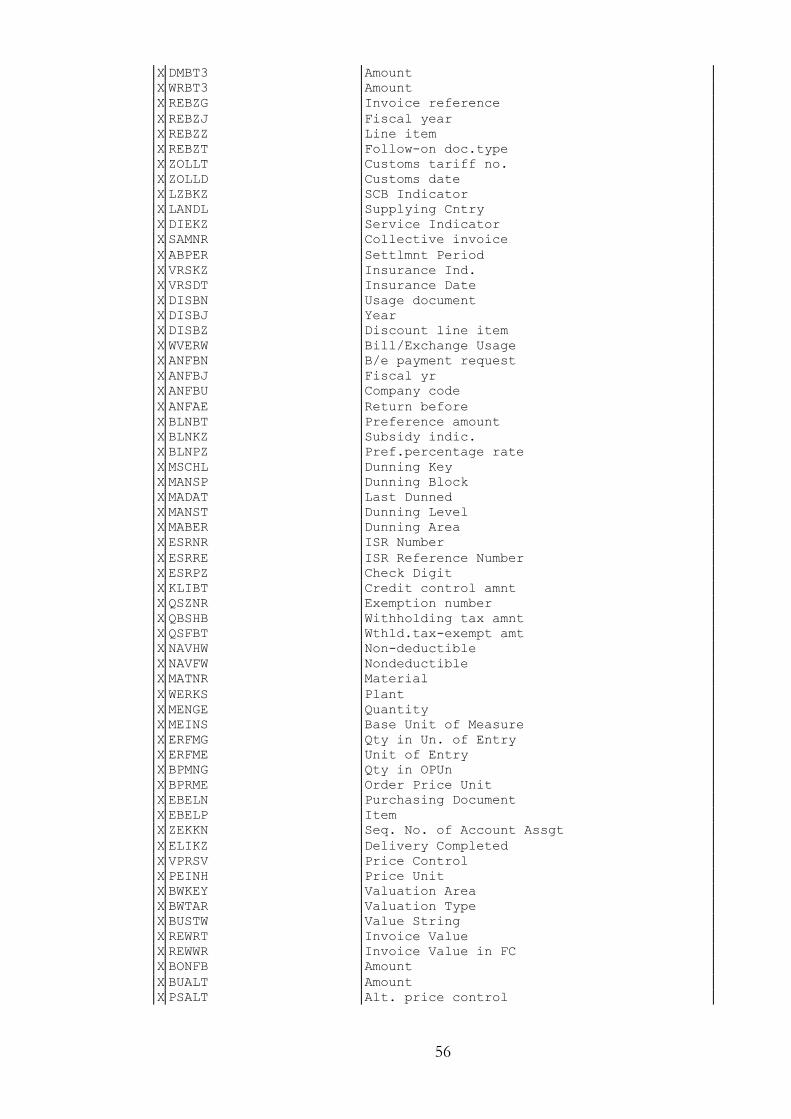
56
X DMBT3 Amount
X WRBT3 Amount
X REBZG Invoice reference
X REBZJ Fiscal year
X REBZZ Line item
X REBZT Follow-on doc.type
X ZOLLT Customs tariff no.
X ZOLLD Customs date
X LZBKZ SCB Indicator
X LANDL Supplying Cntry
X DIEKZ Service Indicator
X SAMNR Collective invoice
X ABPER Settlmnt Period
X VRSKZ Insurance Ind.
X VRSDT Insurance Date
X DISBN Usage document
X DISBJ Year
X DISBZ Discount line item
X WVERW Bill/Exchange Usage
X ANFBN B/e payment request
X ANFBJ Fiscal yr
X ANFBU Company code
X ANFAE Return before
X BLNBT Preference amount
X BLNKZ Subsidy indic.
X BLNPZ Pref.percentage rate
X MSCHL Dunning Key
X MANSP Dunning Block
X MADAT Last Dunned
X MANST Dunning Level
X MABER Dunning Area
X ESRNR ISR Number
X ESRRE ISR Reference Number
X ESRPZ Check Digit
X KLIBT Credit control amnt
X QSZNR Exemption number
X QBSHB Withholding tax amnt
X QSFBT Wthld.tax-exempt amt
X NAVHW Non-deductible
X NAVFW Nondeductible
X MATNR Material
X WERKS Plant
X MENGE Quantity
X MEINS Base Unit of Measure
X ERFMG Qty in Un. of Entry
X ERFME Unit of Entry
X BPMNG Qty in OPUn
X BPRME Order Price Unit
X EBELN Purchasing Document
X EBELP Item
X ZEKKN Seq. No. of Account Assgt
X ELIKZ Delivery Completed
X VPRSV Price Control
X PEINH Price Unit
X BWKEY Valuation Area
X BWTAR Valuation Type
X BUSTW Value String
X REWRT Invoice Value
X REWWR Invoice Value in FC
X BONFB Amount
X BUALT Amount
X PSALT Alt. price control
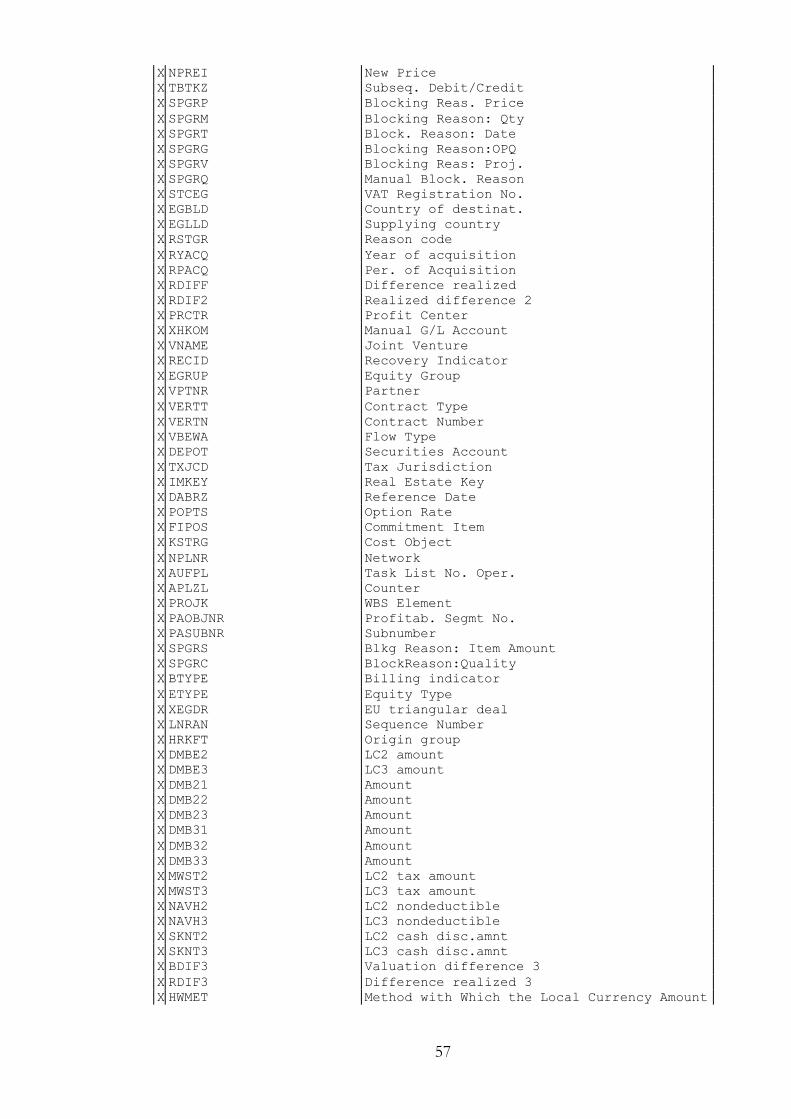
57
X NPREI New Price
X TBTKZ Subseq. Debit/Credit
X SPGRP Blocking Reas. Price
X SPGRM Blocking Reason: Qty
X SPGRT Block. Reason: Date
X SPGRG Blocking Reason:OPQ
X SPGRV Blocking Reas: Proj.
X SPGRQ Manual Block. Reason
X STCEG VAT Registration No.
X EGBLD Country of destinat.
X EGLLD Supplying country
X RSTGR Reason code
X RYACQ Year of acquisition
X RPACQ Per. of Acquisition
X RDIFF Difference realized
X RDIF2 Realized difference 2
X PRCTR Profit Center
X XHKOM Manual G/L Account
X VNAME Joint Venture
X RECID Recovery Indicator
X EGRUP Equity Group
X VPTNR Partner
X VERTT Contract Type
X VERTN Contract Number
X VBEWA Flow Type
X DEPOT Securities Account
X TXJCD Tax Jurisdiction
X IMKEY Real Estate Key
X DABRZ Reference Date
X POPTS Option Rate
X FIPOS Commitment Item
X KSTRG Cost Object
X NPLNR Network
X AUFPL Task List No. Oper.
X APLZL Counter
X PROJK WBS Element
X PAOBJNR Profitab. Segmt No.
X PASUBNR Subnumber
X SPGRS Blkg Reason: Item Amount
X SPGRC BlockReason:Quality
X BTYPE Billing indicator
X ETYPE Equity Type
X XEGDR EU triangular deal
X LNRAN Sequence Number
X HRKFT Origin group
X DMBE2 LC2 amount
X DMBE3 LC3 amount
X DMB21 Amount
X DMB22 Amount
X DMB23 Amount
X DMB31 Amount
X DMB32 Amount
X DMB33 Amount
X MWST2 LC2 tax amount
X MWST3 LC3 tax amount
X NAVH2 LC2 nondeductible
X NAVH3 LC3 nondeductible
X SKNT2 LC2 cash disc.amnt
X SKNT3 LC3 cash disc.amnt
X BDIF3 Valuation difference 3
X RDIF3 Difference realized 3
X HWMET Method with Which the Local Currency Amount
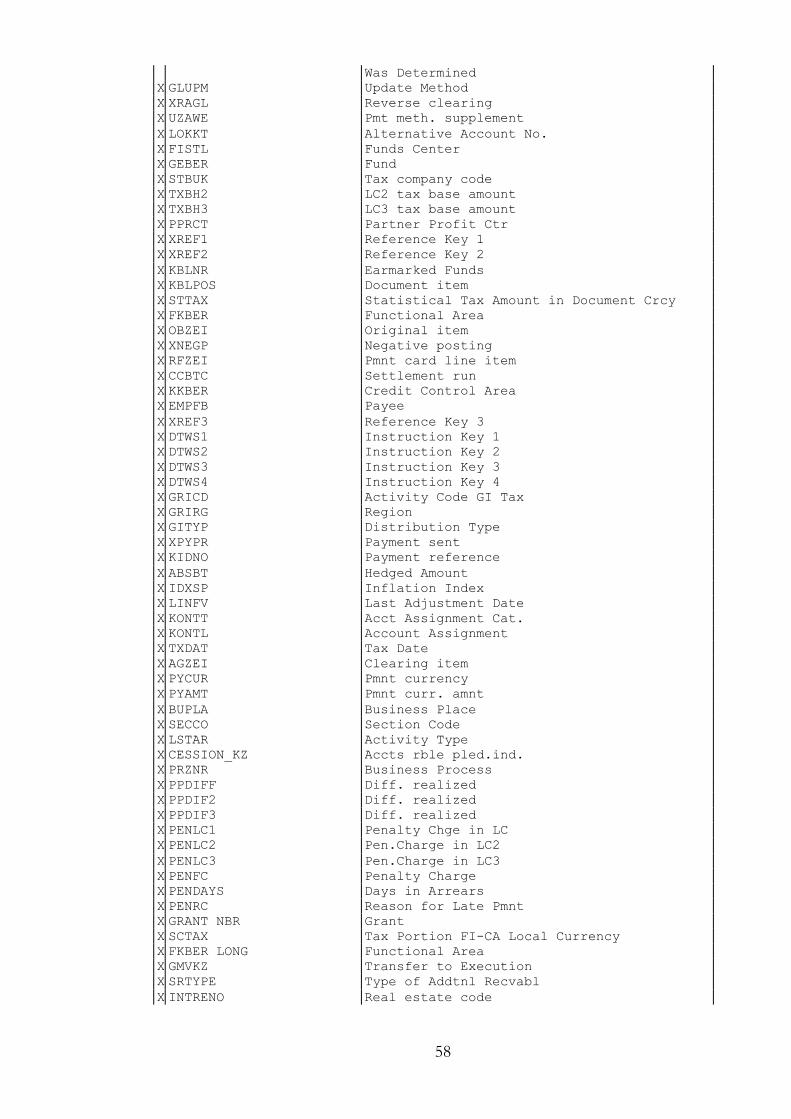
58
Was Determined
X GLUPM Update Method
X XRAGL Reverse clearing
X UZAWE Pmt meth. supplement
X LOKKT Alternative Account No.
X FISTL Funds Center
X GEBER Fund
X STBUK Tax company code
X TXBH2 LC2 tax base amount
X TXBH3 LC3 tax base amount
X PPRCT Partner Profit Ctr
X XREF1 Reference Key 1
X XREF2 Reference Key 2
X KBLNR Earmarked Funds
X KBLPOS Document item
X STTAX Statistical Tax Amount in Document Crcy
X FKBER Functional Area
X OBZEI Original item
X XNEGP Negative posting
X RFZEI Pmnt card line item
X CCBTC Settlement run
X KKBER Credit Control Area
X EMPFB Payee
X XREF3 Reference Key 3
X DTWS1 Instruction Key 1
X DTWS2 Instruction Key 2
X DTWS3 Instruction Key 3
X DTWS4 Instruction Key 4
X GRICD Activity Code GI Tax
X GRIRG Region
X GITYP Distribution Type
X XPYPR Payment sent
X KIDNO Payment reference
X ABSBT Hedged Amount
X IDXSP Inflation Index
X LINFV Last Adjustment Date
X KONTT Acct Assignment Cat.
X KONTL Account Assignment
X TXDAT Tax Date
X AGZEI Clearing item
X PYCUR Pmnt currency
X PYAMT Pmnt curr. amnt
X BUPLA Business Place
X SECCO Section Code
X LSTAR Activity Type
X CESSION_KZ Accts rble pled.ind.
X PRZNR Business Process
X PPDIFF Diff. realized
X PPDIF2 Diff. realized
X PPDIF3 Diff. realized
X PENLC1 Penalty Chge in LC
X PENLC2 Pen.Charge in LC2
X PENLC3 Pen.Charge in LC3
X PENFC Penalty Charge
X PENDAYS Days in Arrears
X PENRC Reason for Late Pmnt
X GRANT_NBR Grant
X SCTAX Tax Portion FI-CA Local Currency
X FKBER_LONG Functional Area
X GMVKZ Transfer to Execution
X SRTYPE Type of Addtnl Recvabl
X INTRENO Real estate code
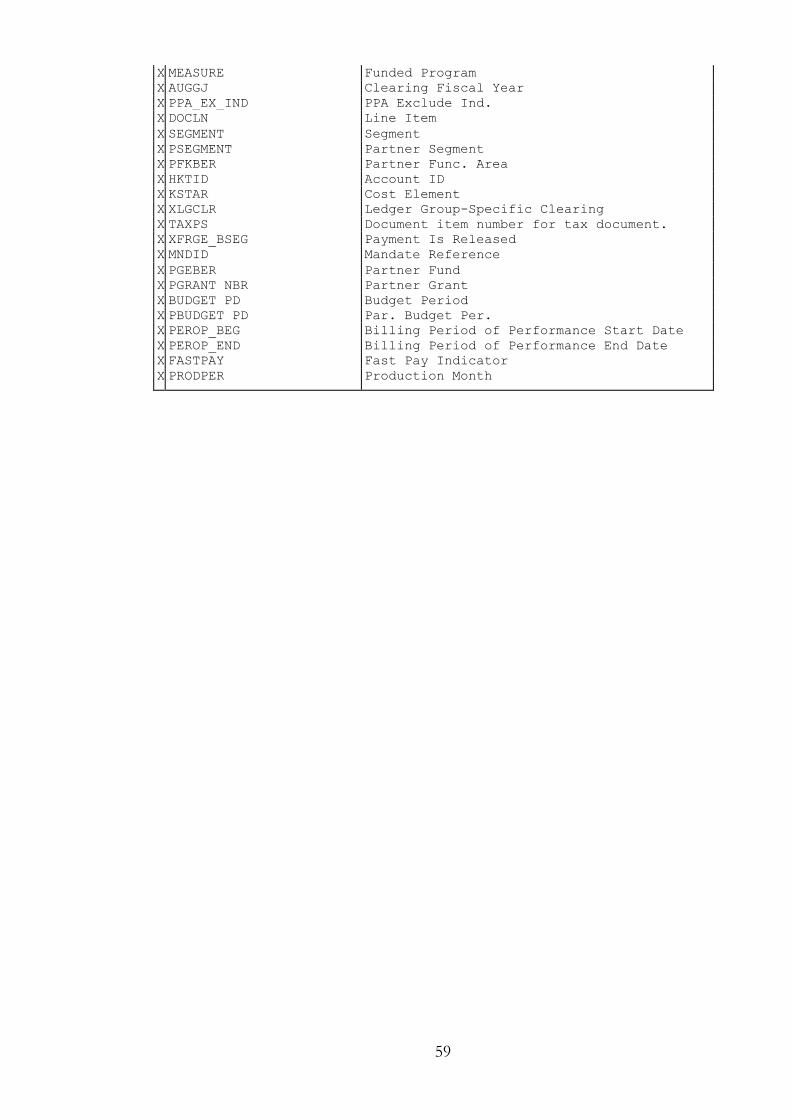
59
X MEASURE Funded Program
X AUGGJ Clearing Fiscal Year
X PPA_EX_IND PPA Exclude Ind.
X DOCLN Line Item
X SEGMENT Segment
X PSEGMENT Partner Segment
X PFKBER Partner Func. Area
X HKTID Account ID
X KSTAR Cost Element
X XLGCLR Ledger Group-Specific Clearing
X TAXPS Document item number for tax document.
X XFRGE_BSEG Payment Is Released
X MNDID Mandate Reference
X PGEBER Partner Fund
X PGRANT_NBR Partner Grant
X BUDGET_PD Budget Period
X PBUDGET_PD Par. Budget Per.
X PEROP_BEG Billing Period of Performance Start Date
X PEROP_END Billing Period of Performance End Date
X FASTPAY Fast Pay Indicator
X PRODPER Production Month
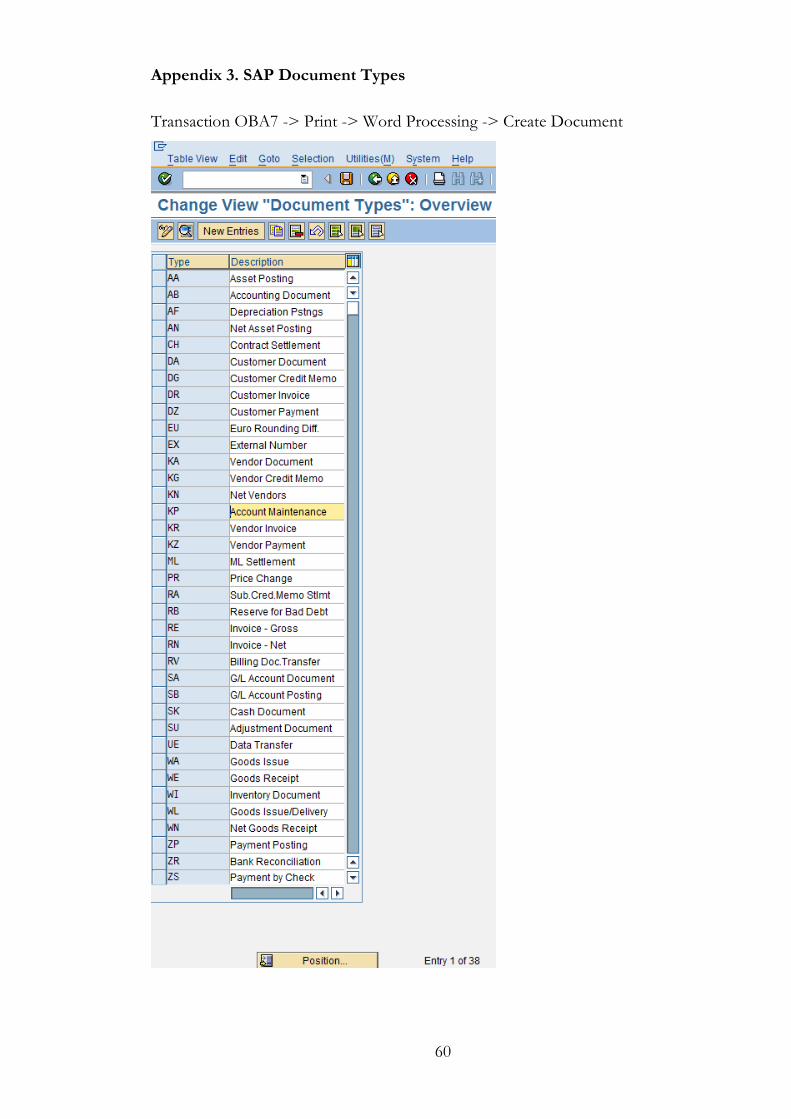
60
Appendix 3. SAP Document Types
Transaction OBA7 -> Print -> Word Processing -> Create Document
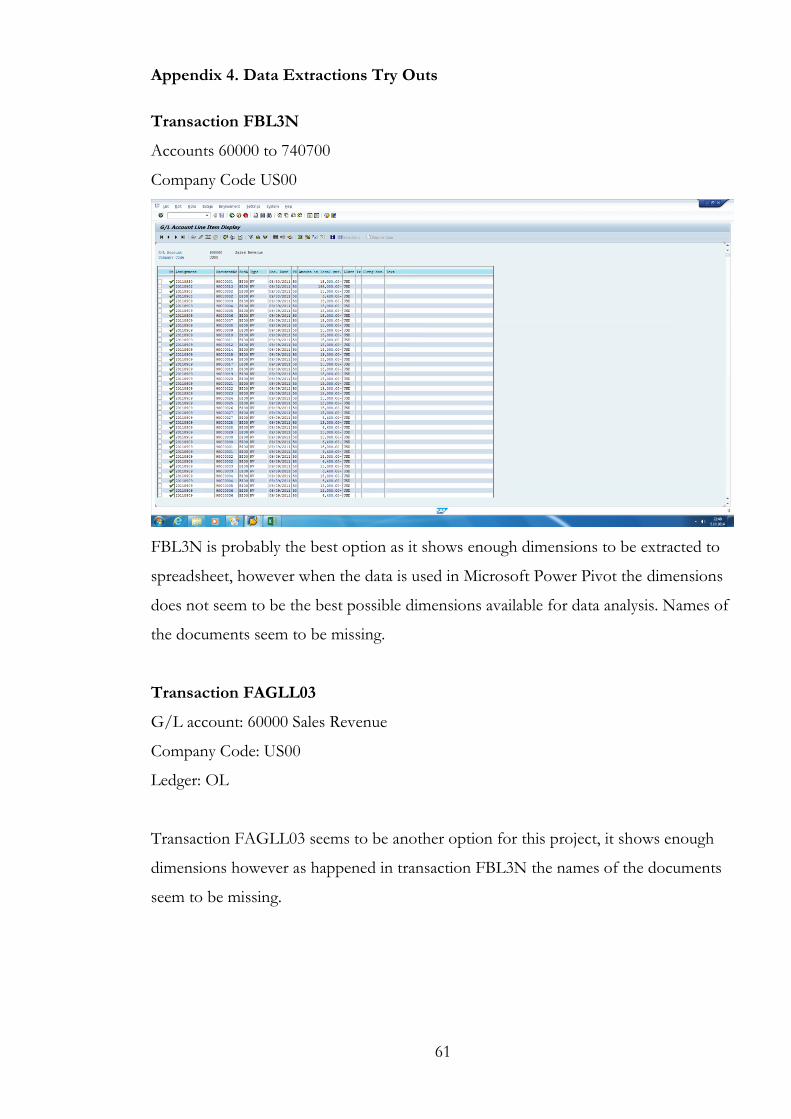
61
Appendix 4. Data Extractions Try Outs
Transaction FBL3N
Accounts 60000 to 740700
Company Code US00
FBL3N is probably the best option as it shows enough dimensions to be extracted to
spreadsheet, however when the data is used in Microsoft Power Pivot the dimensions
does not seem to be the best possible dimensions available for data analysis. Names of
the documents seem to be missing.
Transaction FAGLL03
G/L account: 60000 Sales Revenue
Company Code: US00
Ledger: OL
Transaction FAGLL03 seems to be another option for this project, it shows enough
dimensions however as happened in transaction FBL3N the names of the documents
seem to be missing.