Embed Size (px)
Citation preview

External Validity of theProfile Variability Index for theK-ABC, Stanford-Binet, and WISC-R:Another Cul-de-Sac
Rex B. Kline, Joseph Snyder, Sylvie Guilmette,and Maria Castellanos
Clinicians often attach interpretive significance to high variability among subtest scores in IQprofiles of adults and children. In this study we evaluated the extemal validity of a relativelynew measure of IQ subtest variability, the profile variability index (PVl). Within a sample ofreferred children, we administered the Kaufman Assessment Battery for Children, the FourthEdition Stanford-Binet, and the Wechsler Intelligence Scale for Children-Revised. We calcu-lated PVIs for each child from each test and correlated these values with achievement scoresand indexes of discrepancy between actual and predicted scholastic achievement. Againstthese extemal criteria, PVl information from all three cognitive-ability batteries had essentiallynil validity. We discuss implications of these findings for future research in this area.
C linicians have long been inter-ested in the interpretive signifi-cance of score variability in
cognitive-ability profiles of childrenand adults. The large body of literatxirein this area can be divided into twobroad areas of study: (a) discrepanciesbetween test summary scores, such asVerbal-Performance IQ differences onWechsler scales (e.g., Kaufman, 1976b;Matarazzo & Herman, 1985; Reynolds& Gutkin, 1981); and (b) variability ofsubtest scores, either within specificscales—for example, Wechsler AdultIntelligence Scale-Revised (WAIS-R)(Wechsler, 1981) Verbal scale—or acrossa whole test. Results of many studiesfrom the first area suggest that largesummary-score discrepancies often re-late to performance on nontest criteria.For example, large Wechsler Verbal-Performance IQ differences covarywith school achievement for children
(e.g., Longman, Inglis, & Lawson,1991; Richman & Lindgren, 1980) andcertain t3rpes of brain damage for adults(e.g., Kaufman, 1990; Lezak, 1983;Matarazzo, 1972).
Results of studies from the secondarea of study—variability among sub-test scores—have been much moreequivocal. At one time, clinical loreheld that high intersubtest variabilityindicated possible cognitive dysfunc-tion (e.g., learning disabilities, neuro-logical damage) or psychopathology.Researchers who studied base rates ofintersubtest variability found, how-ever, that high amounts of variabilityare present in IQ test profiles of non-disabled subjects. For example, aver-age subtest-score ranges (highest scoreminus lowest score) in the normativesamples of the WAIS-R, the WechslerIntelligence Scale for Children-Revised(WISC-R) (Wechsler, 1974), and the
Kaufman Assessment Battery for Chil-dren (K-ABC) (Kaufman & Kaufman,1983a, 1983b) are all about 7 scaledscore points (Chatman, Reynolds, &Willson, 1984; Kaufman, 1976b;Matarazzo, Daniel, Prifitera, & Her-man, 1988).
Although clinicians have had to ad-just their expectations upwards abouthow much intersubtest variability is"normal" since publication of theabove types of studies, there is actuallylittle empirical evidence about the diag-nostic significance of subtest variability.Among children, for example, the in-cremental validity of profile variabilityover simple average subtest scores(i.e., elevation) in predicting children'sscholastic skills has often been foundto be negligible (e.g.. Hale & Saxe,1983; Kline, Snyder, Guilmette, &Castellanos, 1992). Results of other re-cent studies with adults have indicatedthat the WAIS-R profiles of brain-damaged patients, nondisabled con-trols, and psychiatric patients (e.g.,with affective disorder, schizophre-nia, psychosis) (Piedmont, Sokolove,& Fleming, 1989; Ryan, Paolo, &Smith, 1992) have comparable amountsand types of intersubtest variability. Infact, the overall paucity of positivefindings in this area has led many re-viewers to caution clinicians against
JOURNAL OF LEARNING DISABILITIESVOLUME 26, NUMBER 8, OCTOBER 1993
PAGES 557-567

558 JOURNAL OF LEARNING DISABILITIES
over-interpreting intersubtest variabil-ity in IQ test profiles (e.g., Kramer,Henning-Stout, Ullman, & Schnellen-berg, 1987).
McLean, Reynolds, and Kaufman(1990) recently studied a relatively newprofile variability statistic, the profilevariability index (PVl) (Plake, Rey-nolds, & Gutkin, 1981). The PVl is thevariance of subtest scores around anexaminee's mean subtest score and hasbeen touted as potentially superior toalternative indices of scatter, such asthe range, which is based on only twosubtest scores. Within the WAIS-Rstandardization sample, McLean et al.reported PVl base rates by samplestratification variables (age, sex, race,region, urban-rural, education, occu-pation) and by IQ level (< 70, 80 to 89,90 to 109, 110 to 119, > 120). Althoughsuch information allows clinicians toidentify statistically ir\frequent amountsof profile variability, the authorsreported no data about the externalvalidity of the PVL For example, theymentioned the clinical lore regardinghigh variability among WAIS-R subtestscores perhaps being associated withadult learning problems, but theypresented no supportive evidence.
The purpose of the present studywas to extend the McLean et al. (1990)study by evaluating the external valid-ity of the PVl within a sample of re-ferred children administered threedifferent IQ batteries: the WISC-R,the K-ABC, and the Fourth EditionStanford-Binet Intelligence Scale (SB4)(Delaney & Hopkins, 1987; Thorndike,Hagen, & Sattler, 1986a, 1986b). Weused two methods of analysis to ad-dress this question. First, we calculatedPVIs for each child from each test andthen correlated PVl values with scoresfrom individually administered scho-lastic achievement tests. If the clinicallore about intersubtest variability weretrue, then negative correlations wouldbe expected: High profile variabilityshould be associated with lower aca-demic skills. We also studied whetherPVIs from the various cognitive-abilitymeasures related to degrees of learn-ing disability as indicated by dis-crepancies between children's actual
and predicted achievement levels. Thatis, we regressed the achievementscores of all children upon their IQscores to generate predicted achieve-ment scores, and we subtracted thesepredicted scores from children's actualachievement scores. We then corre-lated PVl values with actual-predictedachievement difference scores. If highintersubtest variability is predictive oflearning disabilities, then high variabil-ity should be associated with large,negative differences between chil-dren's actual and predicted achieve-ment levels (i.e., actual-predictedachievement <0).
Although the correlational analysesdescribed above retain all quantitativeinformation from PVl and achievementscores and indicate whether a linearrelation exists between these two typesof variables, clinicians often view pro-file variability in a dichotomous way.That is, they may classify the cognitive-ability profiles of individuals as havingeither normal or extreme levels of vari-ability using some operational defi-nition of "extreme." For example,McLean et al. (1990) reported PVl val-ues for the WAIS-R that identify themost extreme 1%, 2%, 5%, and 10% ofprofiles by different levels of Full ScaleIQ scores (see their Table 2, p. 291).After some definition of "extreme"was selected, clinicians could thenreadily identify WAIS-R profiles withunusual levels of intersubtest scatter.
In the present study, we classifiedchildren's IQ test profiles as havingeither high or normal levels of vari-ability based on the PVl (see Note 1).For each group, we identified the pro-portion of cases with low scores (i.e.,standard scores < 70) on the achieve-ment measures. We also identified theproportion of children with high- andnormal-variability IQ profiles whoseactual achievement levels were morethan 1 standard deviation (i.e., 15scaled score points) below their pre-dicted levels of achievement. Both ofthese classification analyses indicatedwhether children with higher levels ofIQ subtest variability were at greaterrisk for poor academic achievement orlearning disabilities.
Method
Subjects
The sample for the present studywas 146 children in public schools(seven schools within four school sys-tems) in eastern and western Canadawho were referred by their teachers forpsychological testing. These cases rep-resent all children in these schools whowere referred due to poor achievementover a 2-year period. Children referreddue to emotional-behavioral problemswere not included in this sample. Allchildren attended English-languageschools and resided in suburban, mid-dle class areas. The average age ofthe children was 9.3 years (SD = 1.9;range = 6 to I2V2 yrs.), most (71%)were boys, and almost all (96%) wereCaucasian (two children were African-Canadian, three were Native-Canadian,and one child was Oriental-Canadian).Three-quarters (75%) of these childrenwere not receiving special educationservices when they were tested andwere enrolled in regular classrooms.All but three of the remaining childrenwere receiving learning disabilityremedial services but were main-streamed in regular classes. A total ofthree children attended self-containedlearning disability classrooms. (Suchself-contained classrooms are uncom-mon in Canada. Most students withlearning disabilities receive part-timeservices and also attend regular class-es; see Wiener & Siegel, 1992). Read-ers should note that there was nocommon definition of "learning dis-ability" that was applied across all thechildren's schools (e.g., a single IQ-achievement discrepancy definition);thus, this subgroup of children is likelyto be very heterogeneous, apart fromtheir special education status. Al-though we will use the terms regularclassroom and leaming disability servicesto describe the placement status of chil-dren in this sample, readers shouldkeep these definitional issues in mind.The average WISC-R Full Scale IQscore of the entire sample was 95 {SD =15); 4% had Full Scale IQ scores in thementally impaired range (<70), 9%
VOLUME 26, NUMBER 8, OCTOBER 1993 559
had borderline (70 to 79), 29% had lowaverage (80 to 89), 42% had average (90to 109), 11% had high average (110 to119), and 6% had scores in the superioror very superior range (> 119). Thesechildren also had similar mean scoresand frequencies of scores within thesame ranges on the K-ABC and SB4.
Measures
We administered the K-ABC, theSB4, the WISC-R, and the Wide RangeAchievement Test-Revised (WRAT-R)(Jastak & Wilkinson, 1984) to eachchild. For each IQ test, we admin-istered all possible subtests for theage range of children in our sample.In data analyses, we did not usescores from two subtests of the K-ABCAchievement scale: the Faces andPlaces subtest and the Riddles subtest.Canadian children have difficulty withthe United States-specific content ofFaces and Places (e.g., pictures of theLiberty Bell, Betsy Ross), and Riddlesis more like a verbal reasoning test(e.g., the WISC-R Similarities subtest)than a traditional achievement mea-sure. Although it is beyond the scopeof this work to review the psycho-metric characteristics of the WISC-R,K-ABC, SB4, and WRAT-R, readers canconsult the following test critiques andreviews: WISC-R-Bortner (1985), Det-terman (1985), and Witt and Gresham(1985); K-ABC-Bracken (1985), Keith(1985), and Kamphaus and Reynolds(1987); SB4—Laurent, Swerdlik, andRyburn (1992), Sattler (1988, Chapter11), and Spruill (1987); WRAT-R—Reinehr (1987).
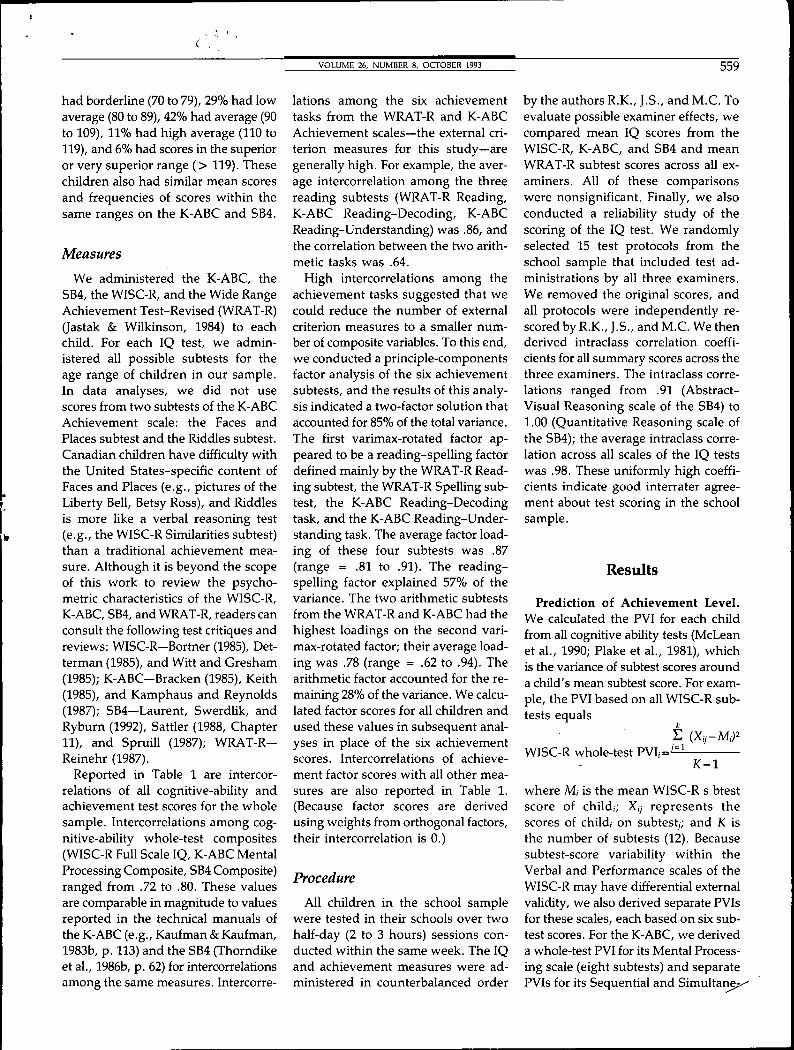
Reported in Table 1 are intercor-relations of all cognitive-ability andachievement test scores for the wholesample. Intercorrelations among cog-nitive-ability whole-test composites(WISC-R Full Scale IQ, K-ABC MentalProcessing Composite, SB4 Composite)ranged from .72 to .80. These valuesare comparable in magnitude to valuesreported in the technical manuals ofthe K-ABC (e.g., Kaufman & Kaufman,1983b, p. 113) and the SB4 (Thorndikeet al., 1986b, p. 62) for intercorrelationsamong the same measures. Intercorre-
lations among the six achievementtasks from the WRAT-R and K-ABCAchievement scales—the external cri-terion measures for this study—aregenerally high. For example, the aver-age intercorrelation among the threereading subtests (WRAT-R Reading,K-ABC Reading-Decoding, K-ABCReading-Understanding) was .86, andthe correlation between the two arith-metic tasks was .64.
High intercorrelations among theachievement tasks suggested that wecould reduce the number of externalcriterion measures to a smaller num-ber of composite variables. To this end,we conducted a principle-componentsfactor analysis of the six achievementsubtests, and the results of this analy-sis indicated a two-factor solution thataccounted for 85% of the total variance.The first varimax-rotated factor ap-peared to be a reading-spelling factordefined mainly by the WRAT-R Read-ing subtest, the WRAT-R Spelling sub-test, the K-ABC Reading-Decodingtask, and the K-ABC Reading-Under-standing task. The average factor load-ing of these four subtests was .87(range = .81 to .91). The reading-spelling factor explained 57% of thevariance. The two arithmetic subtestsfrom the WRAT-R and K-ABC had thehighest loadings on the second vari-max-rotated factor; their average load-ing was .78 (range = .62 to .94). Thearithmetic factor accounted for the re-maining 28% of the variance. We calcu-lated factor scores for all children andused these values in subsequent anal-yses in place of the six achievementscores. Intercorrelations of achieve-ment factor scores with all other mea-sures are also reported in Table 1.(Because factor scores are derivedusing weights from orthogonal factors,their intercorrelation is 0.)
Procedure
All children in the school samplewere tested in their schools over twohalf-day (2 to 3 hours) sessions con-ducted within the same week. The IQand achievement measures were ad-ministered in counterbalanced order
by the authors R.K., J.S., and M.C. Toevaluate possible examiner effects, wecompared mean IQ scores from theWISC-R, K-ABC, and SB4 and meanWRAT-R subtest scores across all ex-aminers. All of these comparisonswere nonsignificant. Finally, we alsoconducted a reliability study of thescoring of the IQ test. We randomlyselected 15 test protocols from theschool sample that included test ad-ministrations by all three examiners.We removed the original scores, andall protocols were independently re-scored by R.K., J.S., and M.C. We thenderived intraclass correlation coeffi-cients for all summary scores across thethree examiners. The intraclass corre-lations ranged from .91 (Abstract-Visual Reasoning scale of the SB4) to1.00 (Quantitative Reasoning scale ofthe SB4); the average intraclass corre-lation across all scales of the IQ testswas .98. These uniformly high coeffi-cients indicate good interrater agree-ment about test scoring in the schoolsample.
Results
Prediction of Achievement Level.We calculated the PVl for each childfrom all cognitive ability tests (McLeanet al., 1990; Plake et al., 1981), whichis the variance of subtest scores arounda child's mean subtest score. For exam-ple, the PVl based on all WISC-R sub-tests equals
EWISC-R whole-test
K-1
where M, is the mean WISC-R s btestscore of child,; X,y represents thescores of child, on subtest^; and K isthe number of subtests (12). Becausesubtest-score variability within theVerbal and Performance scales of theWISC-R may have differential externalvalidity, we also derived separate PVIsfor these scales, each based on six sub-test scores. For the K-ABC, we deriveda whole-test PVl for its Mental Process-ing scale (eight subtests) and separatePVIs for its Sequential and Si
560
Measure
WISC-R1.
2.
3.
VIQPIQ
FSIQ
K-ABC4.
5.6.
SB47.
8.9.
10.11 .
SEQSIM
MPC
VRAVR
QRSTM
Composite
WRAT-R12.
13.14.
ReadingSpelling
Arithmetic
K-ABC
15.16.17.
Read-DecodingRead-UnderstandingArithmetic
Achievement Factors18.19.
Reading-Spelling
Arithmetic
JOURNAL
Intercorrelations
OF LEARNING DISABILITIES
TABLEof IQ and
Cognitive-ability scaies
WiSC-R K-ABC
1 2 3 4 5 6
— 61 92 62 60 68— 88 57 73 75
— 66 74 80
- 55 80
— 95
—
7
84
5780
586067
—
<
8
466260
406361
44
1Achievement Scores
>B4
9
604760
45
5154
52
63
10
786680
756074
695760—
11
686375
63
6572
67
666778
—
Achievement tasks
WRAT-R
12
693460
554253
6337456459
—
13
613153
504049
5037495953
85—
14
693962
515157
5644616458
6972
—
K-ABC
15
632954
5141
51
583343
5651
85
7863
—
16
72
4065
5848
58
70 .4455
6362
84
70
61
88
—
17
765674
616370
70455564
58
57
4964
5961—
Achieve ii^^rit
factor'.
18
52
2042
4325
35
463039
4947
91
8857
88
8125
—
scores
19
6855
68
4957
61
5948595449
31
2662
324194
00
Note. WISC-R = Wechsler Intelligence Scale for Children-Revised; VIQ = Verbal IQ; PIQ = Performance IQ; FSIQ = Full Scale IQ; K-ABC = KaufmanAssessment Battery for Children; SEQ = Sequential Processing Composite; SIM = Simultaneous Processing Composite; MPC = Mental ProcessingComposite; SB4 = Stanford-Binet Fourth Edition; VR = Verbal Reasoning standard area score; AVR = Abstract-Visual Reasoning standard area score;QR = Quantitative Reasoning standard area score; STM = Short-Term Memory standard area score; WRAT-R = Wide Range Achievement Test-Revised.
OUS scales (respectively, three and fivesubtests). Finally, we calculated awhole-test PVI for the SB4 (11 subtests)and separate indexes for its Verbal(3 subtests). Abstract-Visual (3 sub-tests), and Short-Term Memory (4 sub-tests) scales. The SB4 has a fourth scale(Quantitative), but only one subtestfrom this scale can be administered tothe age range of children in our sam-ple; thus, we could not calculate PVIsfor this scale. In our statistical analyses,we used the square roots of PVI values,which are standard deviations.
For analyses in which we classifiedchildren's cognitive-abUity profiles ashaving high or normal amounts of vari-
ability, we used the following defini-tions: IQ test profiles were consideredto show high variability if their PVIswere greater than 1 standard deviationabove the sample mean value. Profileswith PVIs less than this value wereconsidered to have normal variability.Readers should note that this defini-tion of high variability (i.e., the upper16% of profiles) is somewhat conser-vative, but the application of stricterdefinitions of variability (e.g., the up-per 5% of profiles) was precluded bythe overall sample size of this study(N=146). A much larger sample sizewould be needed to classify reasonablenumbers of profiles for statistical anal-
yses using more exacting definitions ofhigh variability.
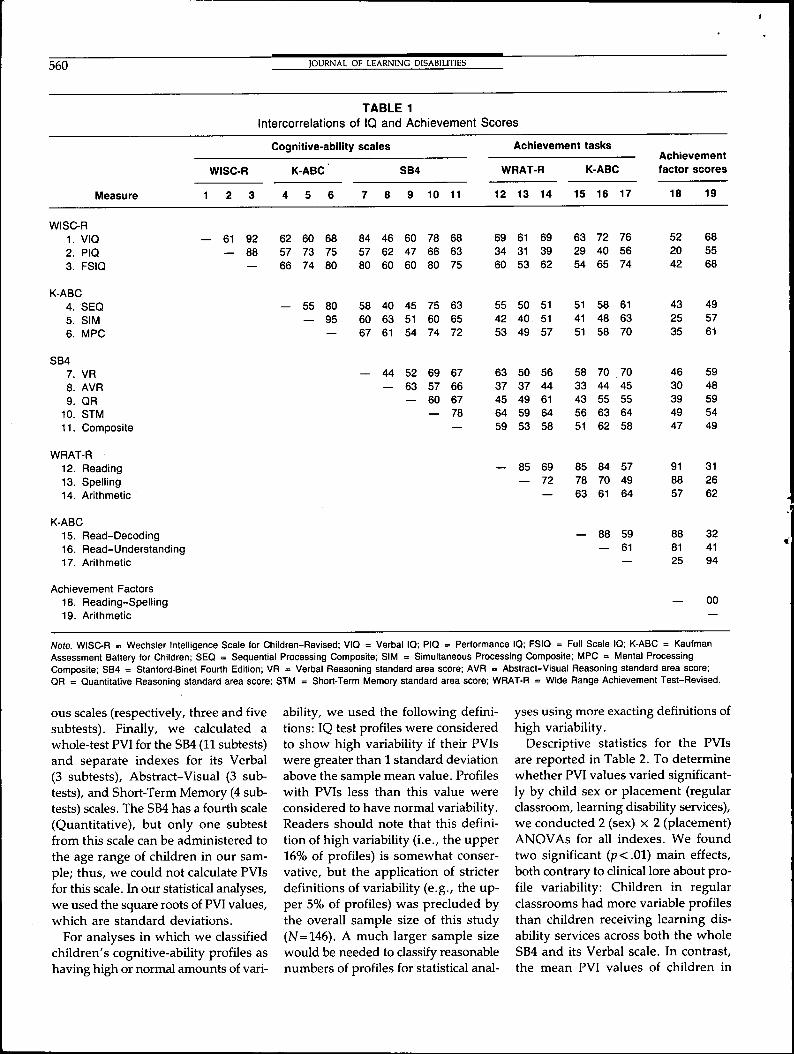
Descriptive statistics for the PVIsare reported in Table 2. To determinewhether PVI values varied significant-ly by child sex or placement (regularclassroom, learning disability services),we conducted 2 (sex) x 2 (placement)ANOVAs for all indexes. We foundtwo significant (p<.01) main effects,both contrary to clinical lore about pro-file variability: Children in regularclassrooms had more variable profilesthan children receiving learning dis-ability services across both the wholeSB4 and its Verbal scale. In contrast,the mean PVI values of children in
VOLUME 26, NUMBER 8. OCTOBER 1993 561
regular classroom and children receiv-ing learning disability services did notdiffer significantly on the WISC-R andthe K-ABC.
Reported in the bottom part ofTable 2 are intercorrelations among thePVIs (see Note 2). Profile variabilityacross the whole WISC-R and withinits Verbal scale covaried significantlywith variability across the whole SB4,but the magnitudes of these relationswere moderate (respectively, r=.28and r=.34). Although K-ABC profilevariability was positively related tovariability of WISC-R and SB4 profiles,
none of these correlations were signifi-cant. Overall, these PVI intercorrela-tions suggest low convergent validity:High variability of cognitive skills asindicated by one test is not necessar-ily corroborated by another test (seeNote 3).
Also reported in the bottom part ofTable 2 are correlations of PVIs withtheir respective overall or scale IQscores. For example, the first corre-lation (r=.O2) in the table is betweenWISC-R whole-test PVI values and FullScale IQ scores, and the fifth correla-tion (r= .03) is between K-ABC Sequen-
tial scale PVI values and Sequentialscale summary scores. In general, theamount of profile variability in chil-dren's test profiles covaried positivelywith their overall IQ levels, but thesizes of these relations were generallysmall. The only significant variability-IQ relation was for the SB4: Childrenwith higher Composite scores tendedto have more variable profiles acrossthe whole SB4 (r=.33) (see Note 4).
Reported in the left side of Table 3are correlations between the PVIs foreach cognitive-ability test and theachievement factor scores. All results
Group mean
PVI
differences
Descriptive
Wholesample
Statistics
Boys
TABLEfor Profile
Sex
2Variability
Girls
Indexes (PVI)
Regularclassroom
Placement
Learning disabilityservices
WISC-RWhole test M (SD)VerbalPerformance
K-ABCWhole testSequentialSimultaneous
SB4Whole testVerbalAbstract-VisualMemory
2.52.02.4
2.32.32.0
——5.14.8
(0.7)(0.7)(0.8)
(0.7)(1.3)(0.8)
(2.7)(2.1)
5.5 (1.6)4.1 (2.2)
4.32.8
(1.0)(1.8)
Intercorrelations of PVIs and correlations
PVI 1
1. WISC-R whole test -2. WISC-R Verbal scale3. WISC-R Performance scale4. K-ABC whole test5. K-ABC Sequential scale6. K-ABC Simultaneous scale7. SB4 whole test8. SB4 Verbal scale9. SB4 Abstract-Visual scale
10. SB4 Memory scale
with IQ scores
WISC-R PVIs
2 3
48* 58*— 05
—
4
150517—
K-ABC
5
061411
59—
PVIs
6
08010359*
- 0 8—
7
28*34*03090601—
SB4
8
11
08100915
- 0 740*—
PVIs
9
09080101
- 0 90560*16—
10
1118
- 0 601030164*0723*—
IQ scores
0215
- 0 420171633*130913
Note. Mean values are reported for the whole sample only if there were no significant (p<.01) sex or classroom differences. Decimals are omitted fromcorrelations. PVI = profile variability index; WISC-R = Wechsler Intelligence Scale for Children-Revised; K-ABC = Kaufman Assessment Battery for Children;SB4 = Stanford-Binet Fourth Edition.*p<.01.
562
Covariation
Correlational analyses
PVI
WISC-RWhole test
Verbal
Performance
K-ABCWhole test
Sequential
Simultaneous
SB4Whole test
Verbal
Abstract-Visual
Short-Term Memory
JOURNAL OF LEARNING DISABILITIES
TABLE 3Between Achievement Scores and Profile
Achievement
Reading-spelling
.01
.22
.07
.01
.18
- .16
.28*
.21
.07
.09
Arithmetic
.07
.17
.06
.18
.10
.18
.36*
.24*
.04
.17
PVIvarlabiiity
HighNormal
HighNormal
HighNormal
HighNormal
HighNormal
HighNormal
HighNormal
HighNormal
HighNormal
HighNormal
••
No. cases
20116
19121
19118
25120
19
126
25120
16120
23121
25120
20117
Variability indexes (PVi)
Ciassification anaiyses
% Poorreading
20%19%
6%2 1 %
13%19%
27%19%
17%21%
24%19%
7%2 1 %
6%23%
9%22%
0%23%
.02
1.95
.31
0.88
0.15
0.23
1.54
2.77
1.97
5.29
Achievement
Phi
.01
.12
.05
.08
.03
.04
.11
.15
.12
.21
% Poorarithmetic
10%13%
16%13%
5%14%
20%12%
16%13%
12%13%
6%13%
13%13%
8%14%
0%14%
x'd)
.14
.17
1.04
1.26
0.14
0.03
0.53
0.00
0.69
3.10
Phi
.03
.03
.09
.09
.03
.01
.06
.00
.07
.15
Note. For the classification analyses, the total number of cases differs due to missing data on some subtests.Wechsler Intelligence Scale for Children-Revised; K-ABC = Kaufman Assessment Battery for Children; SB4*p<.01.
PVI = profile variability index; WISC-R= Stanford-Binet Fourth Edition.
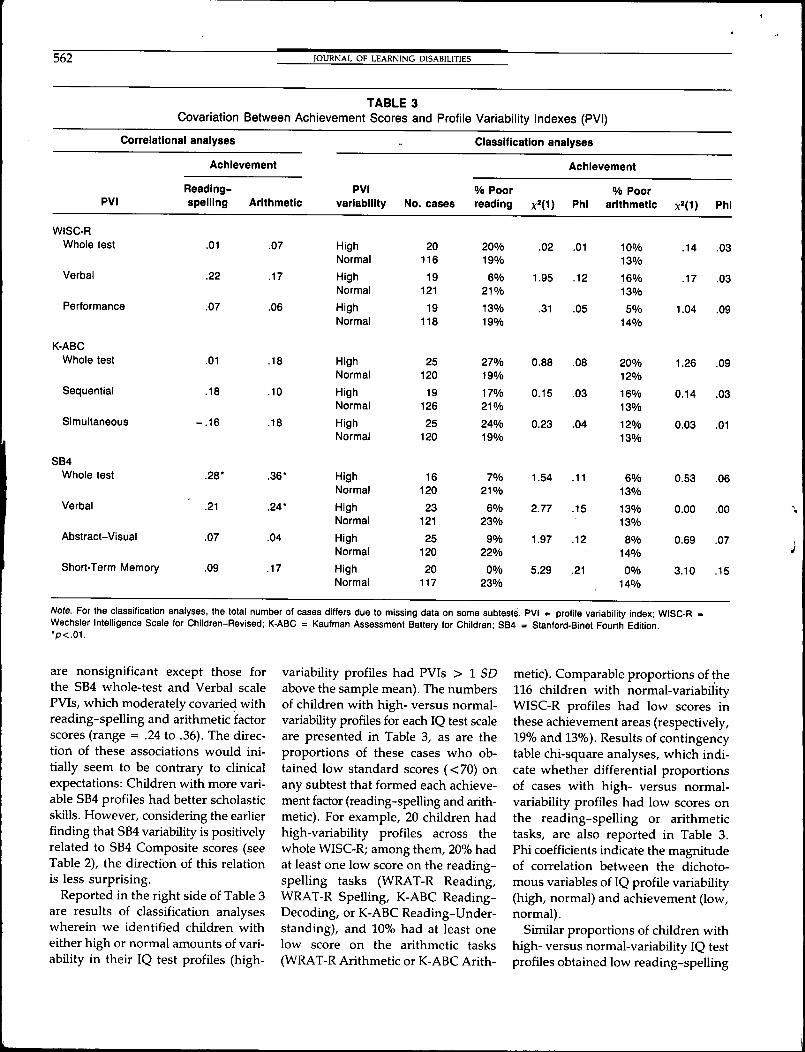
are nonsignificant except those forthe SB4 whole-test and Verbal scalePVIs, which moderately covaried withreading-spelling and arithmetic factorscores (range = .24 to .36). The direc-tion of these associations would ini-tially seem to be contrary to clinicalexpectations: Children with more vari-able SB4 profiles had better scholasticskills. However, considering the earlierfinding that SB4 variability is positivelyrelated to SB4 Composite scores (seeTable 2), the direction of this relationis less surprising.
Reported in the right side of Table 3are results of classification analyseswherein we identified children witheither high or normal amounts of vari-ability in their IQ test profiles (high-
variability profiles had PVIs > 1 SDabove the sample mean). The numbersof children with high- versus normal-variability profiles for each IQ test scaleare presented in Table 3, as are theproportions of these cases who ob-tained low standard scores (<70) onany subtest that formed each achieve-ment factor (reading-spelling and arith-metic). For example, 20 children hadhigh-variability profiles across thewhole WISC-R; among them, 20% hadat least one low score on the reading-spelling tasks (WRAT-R Reading,WRAT-R Spelling, K-ABC Reading-Decoding, or K-ABC Reading-Under-standing), and 10% had at least onelow score on the arithmetic tasks(WRAT-R Arithmetic or K-ABC Arith-
metic). Comparable proportions of tbe116 children witb normal-variabilityWISC-R profiles bad low scores intbese achievement areas (respectively,19% and 13%). Results of contingencytable cbi-square analyses, wbich indi-cate whether differential proportionsof cases with bigh- versus normal-variability profiles bad low scores onthe reading-spelling or arithmetictasks, are also reported in Table 3.Phi coefficients indicate tbe magnitudeof correlation between the dicboto-mous variables of IQ profile variability(higb, normal) and achievement (low,normal).
Similar proportions of children witbhigb- versus normal-variability IQ testprofiles obtained low reading-spelling

VOLUME 26, NUMBER 8, OCTOBER 1993 563
or arithmetic scores aaoss the WISC-R,K-ABC, and SB4. In fact, all chi-squaretests of the profile variability-achieve-ment relations were nonsignificant{p> .01), and the largest phi coefficientwas only .21. The latter result was forthe SB4 Short-Term Memory scale, andwas counter to clinical lore: Twenty-three percent of children with normal-variability profiles on this SB4 scalehad low reading-spelling scores, butnone of the cases with high-variabilityprofiles had low achievement scores.
Across both the correlational andclassification analyses, profile variabil-ity was moderately related to scholasticachievement only for the SB4. Resultsof another type of analysis, however,indicated that this apparent externalvalidity of SB4 profile variability wasdue almost entirely to the positive as-sociation between variability and over-all IQ scores. We conducted hierarchi-cal multiple regressions based on thethree significant correlational resultsfrom Table 3 (the relation of SB4whole-test variability to both achieve-ment areas and the relation of Verbalscale variability to arithmetic scores).For each analysis, the dependent vari-ables were the achievement factorscores. At Step 1 of each regression,we entered either the children's SB4Composite scores (for analyses withSB4 whole-test PVIs) or SB4 Verbalscale scores (for analyses with SB4 Ver-bal scale PVIs) as predictors and cal-culated their correlations with achieve-ment scores. At Step 2, we enteredeither SB4 whole-test PVIs or VerbalPVIs as predictors and calculated theoverall multiple correlations at thisstep.
Results of the hierarchical regressionanalyses are summarized in Table 4. AtStep 1 for all results. Composite andVerbal scale scores were highly corre-lated with achievement level (range =.47 to .59). Increases in the multiplecorrelations at Step 2 due to addingSB4 PVIs into the equations were,however, all small (range = .02 to .03).That is, SB4 profile variability informa-tion had essentially no incrementalvalidity over whole-test Composite or
Verbal scale scores in the prediction ofacademic achievement.
Prediction of Achievement Discrep-ancies. The above findings indicatethat K-ABC, WISC-R, and SB4 profilevariability information has limited ex-ternal validity in predicting level of aca-demic achievement. We evaluated herewhether profile variability predicts dis-crepancies between children's actualand predicted achievement skills. Inthe past, such discrepancies wererepresented by simple differencescores between children's achievementand IQ scores. Difference scores sub-stantially less than 0 were viewed asindicating "underachievement" (i.e.,a learning disability), and large positivevalues were thought to show "over-achievement." However, this simpledifference score method has manystatistical shortcomings. For example,intercorrelations between IQ andachievement tests (i.e., regression ef-fects) are not taken into account by thisindex (see Reynolds, 1984-1985, for amore complete discussion).
For this study we calculated differ-ences between children's actual andpredicted achievement levels, withpredicted achievement being based onthe children's summary IQ scores.For example, we regressed reading-spelling achievement factor scores onWISC-R Full Scale IQ scores to gener-ate predicted reading-spelling scoresfor each child. Then we subtracted pre-
dicted reading-spelling achievementscores from actual reading-spellingachievement scores (actual-predicted)to form our "learning disability" in-dexes. For these indexes, large neg-ative values indicated lower-than-expected achievement. We calculateda similar discrepancy score for thearithmetic achievement factor. Finally,we correlated these two discrepancyscores with WISC-R whole-test PVIs.We repeated this procedure usingK-ABC Mental Processing Compositescores and SB4 Composite scores (seeNote 5).
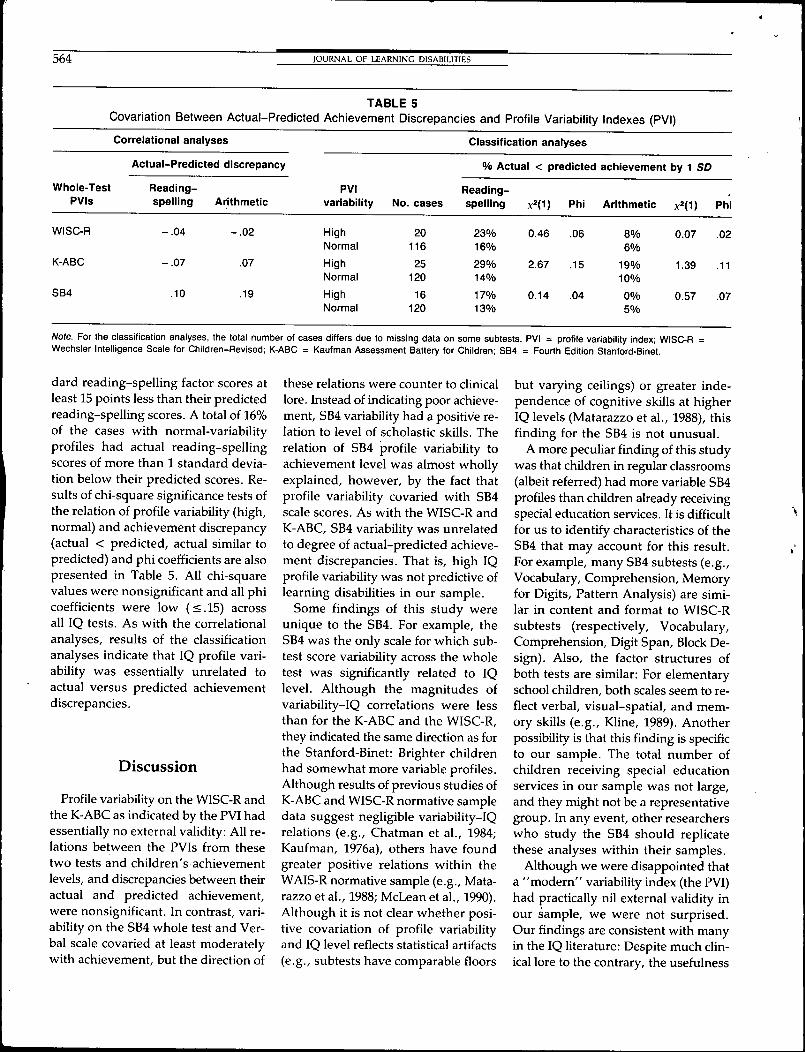
Reported in the left side of Table 5are correlations between all whole-testPVIs and actual-predicted achievementdiscrepancy scores. All results werenonsignificant; furthermore, the mag-nitudes of all correlations were low(range = -.07 to .19). Clearly, profilevariability information had little exter-nal validity as far as indicating whetherchildren's actual academic skills are be-low levels predicted by their overall IQscores.
Reported in the right side of Table 5are results of classification analyses; forchildren with high- versus normal-variability profiles, the proportions ofcases with actual achievement scoresthat were more than 15 standard scorepoints (i.e., 1 SD in the metric M =100, SD = 15) below their predictedachievement levels are presented. Forexample, 23% of children with high-variability WISC-R profiles had stan-
Step
12
12
TABLE 4Incremental Validity of Profile Variability
Predictors
CompositeComposite and whole-test PVI
Verbal scale scoreVerbal scale score and Verbal scale PVI
for the Stanford-Binet
Achievement ievei
Reading-speiiing Arithmetic
4750
—
4952
5961
Note. The above values are multiple correlations, decimals omitted. An empty cell means the analysiswas not conducted because the original result (see Table 3) was not significant at the .01 level.PVI = profile variability index.
564 JOURNAL OF LEARNING DISABILITIES
TABLE 5Covariation Between Actual-Predicted Achievement Discrepancies and Profile Variability Indexes (PVI)
Correlational analyses Classification analyses
Whole-TestPVIs
WISC-R
K-ABC
SB4
Actual-Predicted discrepancy
Reading-spelling
- .04
- .07
.10
Arithmetic
- .02
.07
.19
PVIvariability
HighNormal
HighNormal
HighNormal
No. cases
20116
25120
16120
% Actual < predicted
Reading-speliing
23%16%
29%14%
17%13%
0.46
2.67
0.14
Phi
.06
.15
.04
achievement
Arithmetic
8%6%
19%10%
0%5%
by 1 SD
x*(1)
0.07
1.39
0.57
Phi
.02
.11
.07
Note. For the classification anaiyses, the total number of cases differs due to missing data on some subtests. PVI = profile variability index; WISC-R =Wechsler Intelligence Scaie for Chiidren-Revised; K-ABC = Kaufman Assessment Battery for Chiidren; SB4 = Fourth Edition Stanford-Binet.
dard reading-spelling factor scores atleast 15 points less than their predictedreading-spelling scores. A total of 16%of the cases with normal-variabilityprofiles had actual reading-spellingscores of more than 1 standard devia-tion below their predicted scores. Re-sults of chi-square significance tests ofthe relation of profile variability (high,normal) and achievement discrepancy(actual < predicted, actual similar topredicted) and phi coefficients are alsopresented in Table 5. All chi-squarevalues were nonsignificant and all phicoefficients were low (<.15) acrossall IQ tests. As with the correlationalanalyses, results of the classificationanalyses indicate that IQ profile vari-ability was essentially unrelated toactual versus predicted achievementdiscrepancies.
Discussion
Profile variability on the WISC-R andthe K-ABC as indicated by the PVI hadessentially no external validity: All re-lations between the PVIs from thesetwo tests and children's achievementlevels, and discrepancies between theiractual and predicted achievement,were nonsignificant. In contrast, vari-ability on the SB4 whole test and Ver-bal scale covaried at least moderatelywith achievement, but the direction of
these relations were counter to clinicallore. Instead of indicating poor achieve-ment, SB4 variability had a positive re-lation to level of scholastic skills. Therelation of SB4 profile variability toachievement level was almost whollyexplained, however, by the fact thatprofile variability covaried with SB4scale scores. As with the WISC-R andK-ABC, SB4 variability was unrelatedto degree of actual-predicted achieve-ment discrepancies. That is, high IQprofile variability was not predictive oflearning disabilities in our sample.
Some findings of this study wereunique to the SB4. For example, theSB4 was the only scale for which sub-test score variability across the wholetest was significantly related to IQlevel. Although the magnitudes ofvariability-IQ correlations were lessthan for the K-ABC and the WISC-R,they indicated the same direction as forthe Stanford-Binet: Brighter childrenhad somewhat more variable profiles.Although results of previous studies ofK-ABC and WISC-R normative sampledata suggest negligible variability-IQrelations (e.g., Chatman et al., 1984;Kaufman, 1976a), others have foundgreater positive relations within theWAIS-R normative sample (e.g., Mata-razzo et al., 1988; McLean et al., 1990).Although it is not clear whether posi-tive covariation of profile variabilityand IQ level reflects statistical artifacts(e.g., subtests have comparable floors
but varying ceilings) or greater inde-pendence of cognitive skills at higherIQ levels (Matarazzo et al., 1988), thisfinding for the SB4 is not unusual.
A more peculiar finding of this studywas that children in regular classrooms(albeit referred) had more variable SB4profiles than children already receivingspecial education services. It is difficultfor us to identify characteristics of theSB4 that may account for this result.For example, many SB4 subtests (e.g..Vocabulary, Comprehension, Memoryfor Digits, Pattern Analysis) are simi-lar in content and format to WISC-Rsubtests (respectively. Vocabulary,Comprehension, Digit Span, Block De-sign). Also, the factor structures ofboth tests are similar: For elementaryschool children, both scales seem to re-flect verbal, visual-spatial, and mem-ory skills (e.g., Kline, 1989). Anotherpossibility is that this finding is specificto our sample. The total number ofchildren receiving special educationservices in our sample was not large,and they might not be a representativegroup. In any event, other researcherswho study the SB4 should replicatethese analyses within their samples.
Although we were disappointed thata "modern" variability index (the PVI)had practically nil external validity inour sample, we were not surprised.Our findings are consistent with manyin the IQ literature: Despite much clin-ical lore to the contrary, the usefulness

VOLUME 26, NUMBER 8, OCTOBER 1993 565
of profile variability per se as a diag-nostic indicator for children seems verylimited, especially compared to theclear external validity of overall IQscores.
Our findings raise some questions,which we discuss below, but first somelimitations of our study should behighlighted. Our overall sample sizewas not large, and this study shouldbe replicated with other groups of chil-dren. This would be especially cru-cial for children who are classified aslearning disabled. The children in oursample who were receiving learningdisability remedial services were notclassified by any single, common oper-ational definition. Thus, our findingsmay have limited generalizability tochildren enrolled in learning disabilityclassrooms who are classified by morerigorous, clearly defined criteria. Also,the academic tests we used here canonly be considered as screening mea-sures. More sophisticated, in-depthachievement batteries are available andshould be used in future studies. Final-ly, one of the IQ measures we used inthis study—the WISC-R—is now obso-lete. The WISC-III (Wechsler, 1991)was released in August 1991, after wetested the children in our sample. Thisstudy should also be replicated withthe WISC-III, as this new scale mayhave characteristics that yield differentresults. For example, although theWISC-R and WISC-III share manyitems—73% of WISC-R items appear inthe WISC-III in either original or modi-fied form—the latter may have a differ-ent factor structure than the WISC-R.According to the WISC-III manual,results of factor analyses of WISC-IIIsubtests conducted for various ageswithin the normative sample indicatea four-factor solution: Verbal Compre-hension and Perceptual Organization(both defined by the same subtests asfor the corresponding WISC-R factors),Freedom From Distractibility (definedby Arithmetic and Digit Span for allbut 6- and 7-year-olds), and Process-ing Speed (defined by Coding andSymbol Search, a new subtest). Ifthe cognitive skills measured by the
WISC-III differ from those tapped bythe WISC-R, then the external validityof WISC-III profile variability may bedifferent from that of the WISC-R.
The results of this study and thoseof many others conducted in this areapresent an obvious puzzle: Why doesthe external validity of IQ subtest scorevariability seem to be so limited? Wecan offer two possible reasons. First,correlations of overall IQ scores withachievement scores are already so highthat little residual variance may beavailable to be uniquely explained byother predictors, such as profile vari-ability. That is, there may be a "ceil-ing effect" that limits the usefulnessof other information beyond absolutelevel of performance on a cognitive-ability test.
Second, variability indexes like thePVl are insensitive to the specific pat-tern of subtest scores in a child's cogni-tive ability profile. That is, any subtestscore deviation from tbe mean contrib-utes to the PVl. We know, however,that some patterns of subtest scores areclearly associated with achievementproblems, including, for example, uni-formly low WISC-R Verbal scale scoresrelative to Performance scale scores(Kline et al., in press; Richman & Lind-gren, 1980). Other patterns may beless crucial. For example, high vari-ability among the scores of low "cog-nitive complexity" subtests—those thatmay tap what Jensen (1980) has called"Level I," or associative, abilities (rotememory, immediate stimulus recall),rather than "Level II," or cognitive,abilities (derivation of general princi-ples, concept formation)—may be un-related to achievement. If indexes likethe PVl reflect both "important" and"unimportant" variability, their exter-nal validity will be truncated.
We believe the first reason men-tioned above is more plausible than thesecond. The second possibility impliesthat profile variability may really haveexternal validity, but only for certaintypes of profiles. As mentioned, fewtypes of cognitive ability profiles areclearly associated with learning prob-lems. A pattern of poor verbal skills is
one profile, but few others reliably dis-criminate nondisabled children fromthose witb learning problems. Also,after decades of research and probablyhundreds of publications about thistopic, we are skeptical that researchershave simply been asking the wrongquestions about profile variability.
We feel obliged to raise another,more disturbing possibility: Consider-ing all the negative findings about theexternal validity of profile variability,why is there still so much interest inthis topic? Perhaps some aspects ofChapman and Chapman's (1969) con-cept of "illusory correlation" are oper-ating here. That is, sign-symptom as-sociations that are intuitively sensiblecan be resistant to change even in theface of empirical evidence to the con-trary. The clinical lore about profile vari-ability is quite old and well-establishedand makes conceptual sense (e.g.,inconsistent performance within acognitive-ability battery is a sign of un-evenly developed cognitive skills). Ifprofile variability information from IQtests in fact has no external validity,then all the aforementioned qualitieswill interfere with our ability to lay torest our myths in this area.
ABOUT THE AUTHORS
Rex B. Kline received his PhD in clinical psy-chology from Wayne State University and isassociate professor of psychology at ConcordiaUniversity, Montreal, Canada. Joseph Snyderreceived his PhD in measuranent and evaluationfrom Teachers College, Columbia University. Heis a former school psychologist who is currentlya part-time instructor at Concordia University.Sylvie Guilmette received her BA in psy-chology from Concordia University. MariaCastellanos received her MEd from McGillUniversity (Montreal) and is a school psy-chologist with ha Commission Scolaire Jerome-Le Royer, Montreal. Address: Rex B. Kline,Department of Psychology, Concordia Univer-sity, Montreal, Quebec, Canada H3C 1M8.
NOTES
1. We wish to thank anonymous revieiver C forsuggesting these analyses.
2. We conducted correlational analyses usingdata from both placement groups combined

566 JOURNAL OF LEARNING DISABILITIES
(regular classroom and leaming disabilityservices). As mentioned, we did not thinkthat the students receiving leaming disabil-ity services in our sample were a homogene-ous group. Also, the mean scores of childrenin regular classrooms were higher than thoseof children receiving leaming disability ser-vices across all of the IQ and achievementtests. Thus, interpretation of correlations cal-culated separately within each placementgroup would have been compromised by re-striction of range effects.
3. Other significant intercorrelations reportedin Table 2 are between whole-test and sepa-rate scale PVIs (e.g., WISC-R whole-test andVerbal scale PVIs), but these results are ex-pected, due to subtest overlap.
4. We thought that the positive correlation be-tween SB4 whole-test PVIs and overall Com-posite scores might account for the find-ing that children in regular classrooms hadgreater profile variability than childrenreceiving remedial services. The two groupsdiffered significantly (.01 level) in their meanSB4 Composite scores: regular classroom,M=93.5; remedial services, M = 80.7. Weconducted an analysis of covariance withclassroom placement as the independent vari-able, SB4 whole-test PVIs as the dependentvariables, and SB4 Composite scores as acovariate. The mean PVl values of the twoplacement groups were still significantlydifferent at the .01 level. Thus, group meandifferences in Composite scores did not ac-count for results reported in Table 2.
5. Because determination ofa leaming disabil-ity usually involves comparisons of whole-test IQ scores with achievement scores, wedid not conduct these analyses with the sep-arate scale PVIs.
REFERENCES
Bortner, M. (1985). Review of WechslerIntelligence Scale for Children-Revised.In J.V. Mitchell (Ed.), The ninth mentalmeasurements yearbook (Vol. 2, pp.1713-1714). Lincoln: Buros Institute ofMental Measurements of the Universityof Nebraska-Lincoln.
Bracken, B.A. (1985). A critical review of theKaufman Assessment Battery for Chil-dren. School Psychology Review, 14, 21-36.
Chapman, L.]., & Chapman, J.P. (1969).Illusory correlations as an obstacle to theuse of valid psychodiagnostic signs. Jour-nal of Abnormal Psychology, 74, 271-280.
Chatman, S.P., Reynolds, C.R., & Willson,V.L. (1984). Multiple indexes of test scat-
ter on the Kaufman Assessment Batteryfor Children. Joumal of Leaming Disabili-ties, 17, 523-531.
Delaney, E.A., & Hopkins, T.F. (1987).Examiner's handbook. Chicago: Riverside.
Detterman, D.K. (1985). Review of WechslerIntelligence Scale for Children-Revised.In J.V. Mitchell (Ed.), The ninth men-tal measurements yearbook (Vol. 2, pp.1715-1716). Lincoln: Buros Institute ofMental Measurements of the Universityof Nebraska-Lincoln.
Hale, R.L., & Saxe, J.E. (1983). ProfUe anal-ysis of the Wechsler Intelligence Scale forChildren-Revised. Joumal of Psychoeduca-tional Assessment, 1, 155-162.
Jastak, J., & Wilkinson, G.S. (1984). Widerange achievement test-revised. Wilmington,DE: Jastak Associates.
Jensen, A.R. (1980). Bias in mental testing.New York: The Eree Press.
Kamphaus, R.W., & Reynolds, C.R. (1987).Clinical and research applications of theK-ABC. Circle Pines, MN: AmericanGuidance Service.
Kaufman, A.S. (1976a). A new approach tothe interpretation of test scatter on theWISC-R. Joumal of Leaming Disabilities, 9,160-168.
Kaufman, A.S. (1976b). Verbal-performanceIQ discrepancies on the WISC-R. Joumalof Consulting and Clinical Psychology, 44,739-744.
Kaufman, A.S. (1990). Assessing adult andadolescent intelligence. Circle Pines, MN:American Guidance Service.
Kaufman, A.S., & Kaufman, N.L. (1983a).K-ABC administration and scoring manual.Circle Pines, MN: American GuidanceService.
Kaufman, A.S., & Kaufman, N.L. (1983b).K-ABC interpretive manual. Circle Pines,MN: American Guidance Service.
Keith, T.Z. (1985). Questioning the K-ABC:What does it measure? School PsychologyReview, 14, 9-20.
Kline, R.B. (1989). Is the Eourth EditionStanford-Binet a four-factor test? Con-firmatory factor analyses of alternativemodels for ages 2 through 23. Joumal ofPsychoeducational Assessment, 7, 4-13.
Kline, R.B., Snyder, J., Guilmette, S., &Castellanos, M. (in press). Relative use-fulness of elevation, variability, andshape information from WISC-R, K-ABC,and new Stanford-Binet profiles in pre-dicting achievement. Psychological As-sessment.
Kramer, J.J., Henning-Stout, M., Ullman,D.P., & Schnellenberg, R.P. (1987). Theviability of scatter analysis on the WISC-Rand the SBIS: Examining a vestige. Jour-nal of Psychoeducational Assessment, 5,37-47.
Laurent, J., Swerdlik, M., & Ryburn, M.(1992). Review of validity research on theStanford-Binet Intelligence Scale: Fourthedition. Psychological Assessment, 4,102-112.
Lezak, M.D. (1983). Neuropsychological as-sessment. New York: Oxford UniversityPress.
Longman, R.S., Inglis, J., & Lawson, J.S.(1991). WISC-R patterns of cognitive abil-ities in behavior disordered and learningdisabled children. Psychological Assess-ment, 33, 239-246.
Matarazzo, J.D. (1972). Wechsler's measure-ment and appraisal of adult intelligence: Fifthand enlarged edition. New York: OxfordUniversity Press.
Matarazzo, J.D., Daniel, M.H., Prifitera, A.,& Herman, D.O. (1988). Intersubtest scat-ter in the WAIS-R standardization sam-ple. Joumal of Clinical Psychology, 44,940-950.
Matarazzo, J.D., & Herman, D.O. (1985).Clinical uses of the WAIS-R: Base ratesof differences between VIQ and PIQ inthe WAIS-R standardization sample. InB.B. Wolman (Ed.), Handbook of intelligence(pp. 899-932). New York: Wiley.
McLean, J.E., Reynolds, C.R., & Kaufman,A.S. (1990). WAIS-R subtest scatter usingthe Profile Variability Index. Psychologi-cal Assessment, 2, 289-292.
Piedmont, R.L., Sokolove, R.L., & Fleming,M.Z. (1989). An examination of somediagnostic strategies involving theWechsler Intelligence scales. Psychologi-cal Assessment, 3, 181-185.
Plake, B.S., Reynolds, C.R., & Gutkin, T.B.(1981). A technique for comparison of theprofile variability between independentgroups. Joumal of Clinical Psychology, 37,142-146.
Reinehr, R.C. (1987). Wide Range Achieve-ment Test. In D.J. Keyser & R.C. Sweet-land (Eds.), Test critiques compendium (pp.583-586). Kansas City, MO: Test Corp.of America.
Reynolds, C.R. (1984-1985). Critical mea-surement issues in learning disabilities.The Joumal of Special Education, 18,451-476.
Reynolds, C.R., & Gutkin, T.B. (1981). Testscatter on the WPPSI: Normative anal-
VOLUME 26, NUMBER 8, OCTOBER 1993 567
yses of the WPPSI. Joumai of Leaming Dis-abilities, 14, 460-464,
Richman, L,C,, & Lindgren, S,D, (1980),Patterns of intellectual ability in childrenwith verbal deficits, Joumai of AbnormalChild Psychology, 8, 65-81,
Ryan, J,J,, Paolo, A,M., & Smith, A,J,(1992), Wechsler Adult Intelligence Scale-Revised intersubtest scatter in brain-damaged patients: A comparison withthe standardization sample. PsychologicalAssessment, 4, 63-66,
Sattler, J,M, (1988), Assessment of children'sabilities (3rd ed,), San Diego: Author,
Spruill, J, (1987), Stanford-Binet Intelligence
Scale, Fourth Edition, In D.J, Keyser &R,C, Sweetland (Eds,), Test critiques (Vol,6, pp. 544-559). Kansas City, MO: TestCorp. of America,
Thorndike, R,L., Hagen, E,P,, & Sattler,J.M, (1986a), Stanford-Binet IntelligenceScale: Guide for administering and scoring thefourth edition. Chicago: Riverside.
Thorndike, R.L,, Hagen, E,P,, & Sattler,J,M, (1986b), Stanford-Binet IntelligenceScale, Fourth Edition: Technical manual.Chicago: Riverside,
Wechsler, D, (1974), Manual for the Wechs-ler Intelligence Scale for Children-Revised.San Antonio, TX: Psychological Corp,
Wechsler, D, (1981), Wechsler adult intelli-gence scale-Revised. San Antonio, TX: Psy-chological Corp,
Wechsler, D, (1991), WISC-III manual. SanAntonio, TX: Psychological Corp,
Wiener, J,, & Siegel, L, (1992), A Canadianperspective on learning disabilities. Jour-nal of Leaming Disabilities, 25, 340-350,
Witt, J,C,, & Greshan, F,M, (1985), Reviewof Wechsler Intelligence Scale forChildren-Revised, In J,V, Mitchell (Ed,),The ninth mental measurements yearbook(Vol, 2, pp, 1716-1719), Lincoln: BurosInstitute of Mental Measurements of theUniversity of Nebraska-Lincoln.
(Continued from p. 523) - ,
Mather, N,, & Healy, W,C, (1990), Depos-ing aptitude-achievement discrepancy asthe imperial criterion for leaming disabil-ities, Leaming Disabilities: A Multidiscipli-nary Joumai, 1, 40-48,
Reynolds, C,R, (1985). Measuring the ap-titude-achievement discrepancy in learn-ing disability diagnosis. Remedial andSpecial Education, 6(2), 37-55.
Scmggs, T,E, (1988), Nature of leaming dis-abilities. In K,A, Kavale (Ed,), Leamingdisabilities: State of the art and practice (pp.
22-43), Boston: Little, Brown.Siegel, L.S, (1989), IQ is irrelevant to the
definition of learning disabilities, Joumaiof Leaming Disabilities, 22, 469-478, 486,
Stanovich, K,E. (1991a). Conceptual andempirical problems with discrepancydefinitions of reading disability. LeamingDisability Quarterly, 14, 269-280,
Stanovich, K,E, (1991b), Discrepancy defi-nitions of reading disability: Has intelli-gence led us astray? Reading ResearchQuarterly, 26, 7-29.
Wiederholt, J,L, (1974), Historical perspec-tives on the education of the learning dis-abled. In L, Mann & D. Sabatino (Eds,),The second review of special education (pp,103-152), Philadelphia: Joumai of SpecialEducation Press,
Ysseldyke, J., Algozzine, B., Shinn, M., &McGue, M, (1982), Similarities and dif-ferences between low achievers and stu-dents classified learning disabled. TheJoumai of Special Education, 16, 73-85,
(Continued from p. 544)
Pressley, M, (1986), The relevance of thegood strategy user model to the teachingof mathematics. Educational Psychologist,21, 139-161,
Remington, J, (1989), Introducing multipli-cation. Arithmetic Teacher, 37(3), 12-14,
Schuster, J,W,, & Griffen, A,K. (1990),Using time delay with task analyses.Teaching Exceptional Children, 22(4), 49-53,
Schuster, J,W,, Stevens, K,B,, & Doak, P,K,(1990). Using time delay to teach worddefirutions. The Joumai of Special Education,24, 306-318,
Sokol, S,M,, McCIoskey, M,, Cohen, N,J.,& Aliminosa, D. (1991). Cognitive repre-sentations and processes in arithmetic:Inferences from the performance of brain-
damaged subjects, Joumai of ExperimentalPsychology: Leaming, Memory, and Cogni-tion, 17, 355-376,
Stevens, K,B,, & Schuster, J,W. (1987), Ef-fects of a constant time delay procedureon the written spelling performance of alearning disabled student, Leaming Dis-ability Quarterly, 10, 9-16.
Stevens, K.B., & Schuster, J.W, (1988).Time delay: Systematic instruction foracademic tasks. Remedial and Special Edu-cation, 9(5), 16-21,
Tawney, J.W., & Gast, D.L, (1984), Singlesubject research in special education. Colum-bus, OH: Merrill,
Wechsler, D. (1974). Wechsler intelligencescale for children-Revised. San Antonio, TX:
Psychological Corp,Wolery, M,, Cybriwsky, C.A., Gast, D.L.,
& Boyle-Gast, K. (1991), Use of constanttime delay and attentional responses withadolescents. Exceptional Children, 57,462-474,
Wolery, M,, Holcombe, A,, Cybriwsky, C ,Doyle, P,M,, Schuster, J,W., Ault, M.J,,& Gast, D.L, (in press). Constant timedelay with discrete responses: A reviewof effectiveness and demographic, proce-dural, and methodological parameters.Research in Developmental Disabilities.
Woodward, J, (1991), Procedural knowl-edge in mathematics: The role of the cur-riculum, Joumai of Leaming Disabilities, 24,242-251,


![a c:] 5 ooÐ L B 10.5 1 - Microsoft Word Abc Abc Abc Abc Abc Abc Abc Abc Abc Abc Abc Abc 1 - Microsoft Word Abc Abc Abc 505 7ï—L Mic SmartArt 1 - Microsoft Word Aa MS B 10.5 (Ctrl+L)](https://img.pdfslide.us/doc/110x75/5b180d777f8b9a19258b6a1e/a-c-5-ood-l-b-105-1-microsoft-word-abc-abc-abc-abc-abc-abc-abc-abc-abc-abc.jpg)


![A smart artificial bee colony algorithm with distance-fitness-based …hebmlc.org/UploadFiles/201872983541770.pdf · 2018. 7. 29. · abc. [] abc abc abc [] abc [abc abc [] abc [abc](https://img.pdfslide.us/doc/110x75/5febef9cecac5951281b206e/a-smart-artificial-bee-colony-algorithm-with-distance-fitness-based-2018-7-29.jpg)