Embed Size (px)
Citation preview

• Extensive research identifying driver behaviors that impact driving performance (safety surrogate measures)
– Secondary task engagement increases lane deviations, missed red lights, late braking behavior, etc.
• Does a decrease in driving performance = increased crash risk?
• Reidelmeier & Tibshirani (1997)
– Driving with cell phone increased risk by 4 times
• Violanti (1998)
– Driving with a cell phone increases crash risk by 2 times.
• McEvoy, Stevenson, McCartt, Woodward, Haworth, Palamara, & Cercarelli (2005)
– Driving with a cell phone increases crash risk by 4 times that of an alert driver.
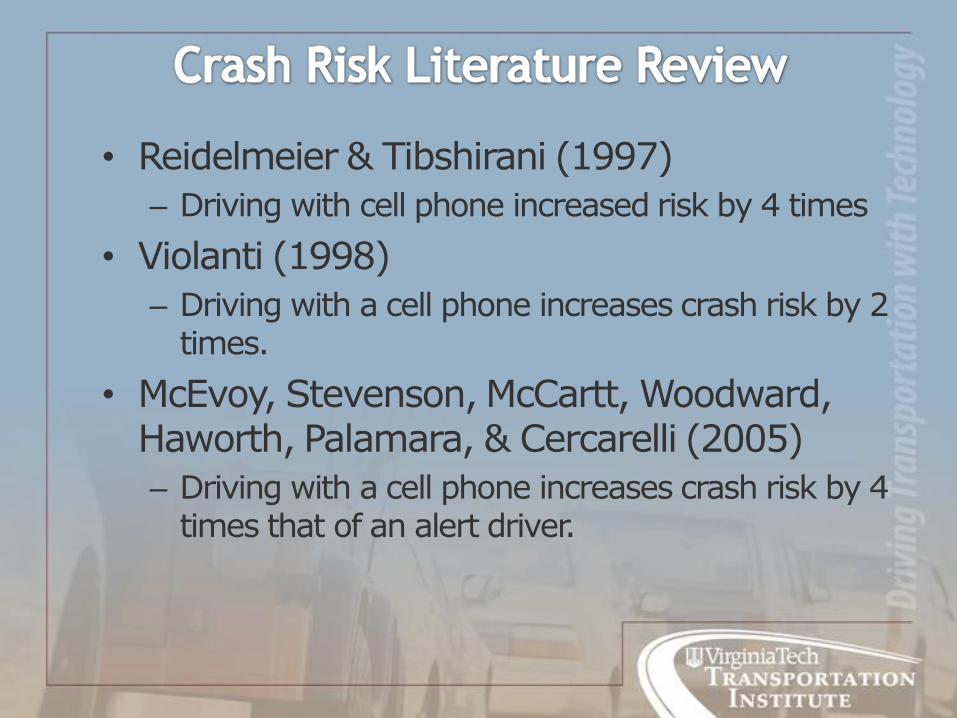
• Epidemiological Research– Analyses include thousands of actual crashes and/or police-
reported/injury crashes– Data is limited in that PARs are not accurate
– Victims may not be able to report or willing to report their actions
– Timing is difficult to assess
• Empirical Research– Precise data collection on safety surrogates (i.e. lane
deviations, speed deviations, etc.)– Little to no data on actual crashes
• Naturalistic Research– Analyses include hundreds of crashes and near-crashes– Driver behavior is captured in the seconds leading up to
crash/near-crash
4
• The ratio of the odds is a commonly employed measure of association between the presence of cases (crash and near-crash events) and the controls (baseline driving epochs).
• Odds ratios are used as an approximation of relative crash risk in case control designs. – This approximation is valid for evaluations
of rare events. • (Greenberg, Daniels, Flanders, Eley, & Boring,
2001).

• Odds = P(Event will occur)/P(Event will not occur)
• P(crash with inattention occurs)/P(crash occurs without inattention)
• OR= AD/BCB
Event Baseline
Inattention
No Inattention
A B
C D
• Trained data reductionists recorded driver behaviors under the following circumstances:
– Driver engaged in behavior within 5 seconds of onset of conflict or through the conflict
• Included both crashes and near-crashes
– To increase power
– Kinematic analysis indicated similarities between these two events and differences from incidents.
• Complex secondary tasks increased risk by 3.1 (CI:1.7, 5.5) times that of an alert driver.
• Moderate secondary tasks increased risk by 2.1 (CI: 1.6, 2.7) that of an alert driver.
• Simple secondary task did not increase risk. OR = 1.2 (CI: 0.9, 1.6)
• Eye glances less than 2s did not significantly increase risk
• Eye glances ≥ 2.0s increased risk by 2.3 times (CI: 1.8, 2.9) that of an alert driver
• How do various risky driving behaviors, in isolation and combination, impact crash/near crash risk?
– Calculated adjusted odds ratios (logistic regression) for risky driving behaviors since many are highly correlated with each other.
– First comparison of adjusted ORs and crude ORs.

Driver State or Driving Behavior Crude
Odds Ratio Adjusted
Odds Ratio
Drowsiness 3.17 2.90
Inappropriate Speed 3.52 2.90
Total Time EOR > 2 s 1.97 1.90
Close Proximity to Other Vehicle 0.56 0.40
Factors
Odds
Ratio
Lower
CI
Upper
CI
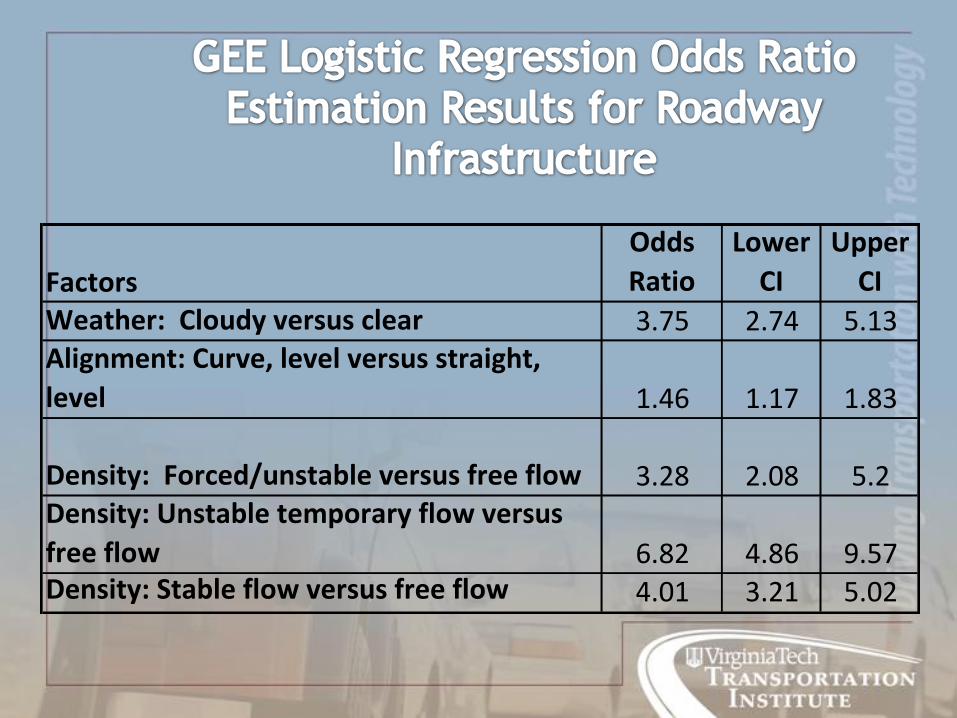
Weather: Cloudy versus clear 3.75 2.74 5.13Alignment: Curve, level versus straight,
level 1.46 1.17 1.83
Density: Forced/unstable versus free flow 3.28 2.08 5.2Density: Unstable temporary flow versus
free flow 6.82 4.86 9.57Density: Stable flow versus free flow 4.01 3.21 5.02

Exp
osu
re i
nfo
rmati
on
co
llecte
d
Control exposure Case Exposure Crash
Sample
exposure
immediate
before
crashes
Sample
exposure for
time interval
some period
before crash
• Driver ID
• GPS location (± 100 meters)
• Time of Day (± 2 hours)
• Day of week (weekday vs. weekend)
• Relation to junction
• Compare the crash/near-crash risk calculations from the case-control analysis to the case-crossover analysis.
– Assess the differences and compare to previous literature
– More power in the case-crossover and anticipate tighter confidence intervals which may make some of the previously calculated OR significantly different from 1.0.

• Naturalistic driving data are ideal for calculating crash/near-crash risks for driver behavior.
• While data are ideal, selecting baseline sample and type of baseline sample are complex issues.– Operationally defining event/baseline is tricky.– Larger scale studies may not have these
issues.
• Different approaches have their pros/cons. – The research questions regarding risk need to
drive decisions.

17