Embed Size (px)
Citation preview
RESEARCH Open Access
Extensive epigenetic reprogrammingduring the life cycle of MarchantiapolymorphaMarc W. Schmid1†, Alejandro Giraldo-Fonseca1†, Moritz Rövekamp1, Dmitry Smetanin1, John L. Bowman2
and Ueli Grossniklaus1*
Abstract
Background: In plants, the existence and possible role of epigenetic reprogramming has been questioned becauseof the occurrence of stably inherited epialleles. Evidence suggests that epigenetic reprogramming does occurduring land plant reproduction, but there is little consensus on the generality and extent of epigeneticreprogramming in plants. We studied DNA methylation dynamics during the life cycle of the liverwort Marchantiapolymorpha. We isolated thalli and meristems from male and female gametophytes, archegonia, antherozoids, aswell as sporophytes at early and late developmental stages, and compared their DNA methylation profiles.
Results: Of all cytosines tested for differential DNA methylation, 42% vary significantly in their methylation patternthroughout the life cycle. However, the differences are limited to few comparisons between specific stages of thelife cycle and suggest four major epigenetic states specific to sporophytes, vegetative gametophytes, antherozoids,and archegonia. Further analyses indicated clear differences in the mechanisms underlying reprogramming in thegametophytic and sporophytic generations, which are paralleled by differences in the expression of genes involvedin DNA methylation. Differentially methylated cytosines with a gain in methylation in antherozoids and archegoniaare enriched in the CG and CHG contexts, as well as in gene bodies and gene flanking regions. In contrast, gain ofDNA methylation during sporophyte development is mostly limited to the CHH context, LTR retrotransposons, DNAtransposons, and repeats.
Conclusion: We conclude that epigenetic reprogramming occurs at least twice during the life cycle ofM. polymorpha and that the underlying mechanisms are likely different between the two events.
Keywords: Bisulfite sequencing, DNA methylation, Epigenetics, Life cycle, Liverwort, Marchantia polymorpha,Reprogramming, Tissue specificity
BackgroundEpigenetic reprogramming refers to global changes inDNA methylation and histone modifications (togetherreferred to as the epigenome) between different stages ofdevelopment. For instance, the erasure of epigeneticmarks between one generation and the next removesmodifications that accumulated during the lifetime of anorganism and sets the stage for zygotic development.Thus, epigenetic reprogramming results in the existence
of epigenomes that are specific to different stages of thelife cycle, and which are not inherited from the previousstage, but actively set during transition from one stageto the next. As a consequence, the epigenomes of twodifferent individuals at the same developmental stage aremore similar to each other than the epigenomes of oneindividual at two different developmental stages. Com-pared to histone modifications, DNA methylation ismore accessible [1], such that whole-genome DNAmethylation profiling has been the method of choice tostudy epigenetic reprogramming [2]. In mammals,epigenetic reprogramming is associated with sexualreproduction and occurs in two major waves: during
* Correspondence: [email protected]†Equal contributors1Department of Plant and Microbial Biology and Zurich-Basel Plant ScienceCenter, University of Zurich, Zurich, SwitzerlandFull list of author information is available at the end of the article
© The Author(s). 2018 Open Access This article is distributed under the terms of the Creative Commons Attribution 4.0International License (http://creativecommons.org/licenses/by/4.0/), which permits unrestricted use, distribution, andreproduction in any medium, provided you give appropriate credit to the original author(s) and the source, provide a link tothe Creative Commons license, and indicate if changes were made. The Creative Commons Public Domain Dedication waiver(http://creativecommons.org/publicdomain/zero/1.0/) applies to the data made available in this article, unless otherwise stated.
Schmid et al. Genome Biology (2018) 19:9 DOI 10.1186/s13059-017-1383-z
primordial germ cell formation and in the zygote. Thereprogramming comprises an almost complete erasureof DNA methylation marks, followed by their re-es-tablishment [3, 4]. Given the extensive resetting ofepigenetic marks, transgenerational inheritance of epi-genetic variants (epialleles) is thought to be rare inmammals [5, 6].In contrast to mammals, land plants do not have a
predefined germline and follow a more complex lifecycle with an alternation between two heteromorphicand multicellular generations: the diploid sporophyteand the haploid gametophyte [7]. In the sporophyte, dis-tinct cells undergo meiosis and produce spores. Thesegive rise to multicellular gametophytes, which producethe male and female gametes through mitotic divisions.Fusion of a male gamete (sperm cell or antherozoid) anda female gamete (egg cell) results in a zygote, whichforms the sporophyte of the next generation. Thus, thegermline is not set aside early during development butforms only later when somatic cells are committed toform gametes. Epigenetic marks gained during develop-ment or induced by environmental conditions are thuspotentially heritable. Indeed, there are several examplesof stably inherited epialleles in plants [8, 9] and their ex-istence led to the hypothesis that epigenetic reprogram-ming might not exist in plants [2]. However, recentstudies provide direct or indirect evidence for dynamicchanges in histone modifications during sporogenesis[10], DNA methylation during gametogenesis [11–15],and DNA methylation during embryogenesis [16]. Thus,epigenetic reprogramming does also occur in plants, atleast to a certain extent [2, 10, 17, 18]. However, thesestudies focused on either male or female gametogenesisor embryogenesis of flowering plants and do not providea comprehensive view on the entire life cycle. Thus,there currently seems to be little consensus on the over-all extent of epigenetic reprogramming in plants [2, 9].Lastly, considering the different modes of sexualreproduction and different overall patterns of DNAmethylation across the plant kingdom [19], it is likelythat there are also differences in epigenetic reprogram-ming between species.To contribute to the understanding of the extent of epi-
genetic reprogramming in plants, we studied the DNAmethylation dynamics during the life cycle of the liverwortMarchantia polymorpha, a member of the probably mostbasal lineage of extant land plants [20, 21]. Due to its phylo-genetic context, simple life cycle, small genome size, the ab-sence of evidence for ancient polyploidization, and the lackof gene duplication, M. polymorpha has recently receivedincreasing attention as a model organism [22–24]. Incontrast to flowering plants, the gametophyte of M.polymorpha represents the dominant generation, while thesporophyte is a small and ephemeral structure that
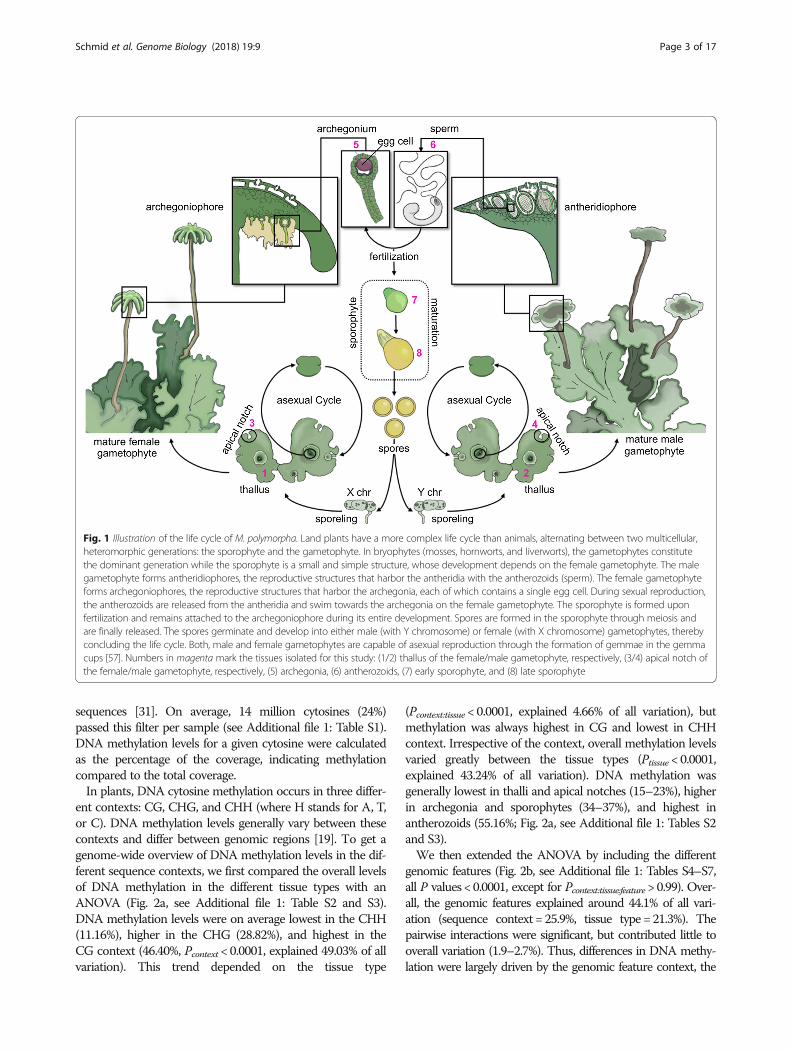
completely depends on the female gametophyte for itsdevelopment (Fig. 1). Recent efforts to sequence andannotate the genome of M. polymorpha have furtherrevealed that, based on the genes known in the modelplant Arabidopsis thaliana, it contains a completeDNA methylation machinery [25]. The genome of M.polymorpha codes for five DNA methyltransferasesbelonging to three different classes [25]: the DNAMETHYLTRANSFERASE family protein MpMET(maintains methylation in CG context [2]); the plant--specific CHROMOMETHYLASE family proteinsMpCMTa and MpCMTb (de novo methylation inCHG and CHH contexts [2]); and the DOMAINSREARRANGED METHYLTRANSFERASE family pro-teins MpDRMa and MpDRMb (de novo methylationin all contexts, including CHG and CHH sites notmethylated by CMT [2]). Given its phylogenetic pos-ition, the low complexity of its genome, and the pres-ence of maintenance and de novo methyltransferases,M. polymorpha is an attractive model system to studyDNA methylation dynamics throughout its life cycle.By sampling eight tissues from males and females, we
provide the most comprehensive dataset on tissue-specific methylation in plants to date and show that 42%of all assessed cytosines vary significantly in their methy-lation pattern throughout the M. polymorpha life cycle.We identified four distinct epigenetic landscapes amongthese tissues and show that epigenetic reprogrammingoccurs at least twice, once in both the gametophytic andsporophytic generation, with each event relying on a dis-tinct mechanism.
Results and discussionOverall DNA methylation levels show tissue-specificdifferences in M. polymorphaTo date, very little tissue-specific information ongenome-wide DNA methylation is available in plants[16, 26–29] and cell type-specific data are largely re-stricted to A. thaliana gametes [12–14] and root cells[30]. To characterize the DNA methylation dynamicsduring the life cycle of M. polymorpha, we isolated thalliand apical notches (i.e. gametophytic meristems) frommale and female gametophytes, archegonia (gametangiacontaining the egg cells), antherozoids (sperm), andsporophytes at two developmental stages (Fig. 1). Weisolated all samples from the same three male and fe-male individuals (gametophytic tissues, archegonia, andantherozoids) and three pairwise crosses between theseindividuals (sporophytes), resulting in three biological repli-cates per tissue type. Genome-wide DNA methylation levelswere determined by whole-genome bisulfite sequencing(WGBS). Cytosines with a total read coverage < 5 or > 100were excluded from all subsequent analyses to avoid a poten-tial bias originating from low coverage or poorly annotated
Schmid et al. Genome Biology (2018) 19:9 Page 2 of 17
sequences [31]. On average, 14 million cytosines (24%)passed this filter per sample (see Additional file 1: Table S1).DNA methylation levels for a given cytosine were calculatedas the percentage of the coverage, indicating methylationcompared to the total coverage.In plants, DNA cytosine methylation occurs in three differ-
ent contexts: CG, CHG, and CHH (where H stands for A, T,or C). DNA methylation levels generally vary between thesecontexts and differ between genomic regions [19]. To get agenome-wide overview of DNA methylation levels in the dif-ferent sequence contexts, we first compared the overall levelsof DNA methylation in the different tissue types with anANOVA (Fig. 2a, see Additional file 1: Table S2 and S3).DNA methylation levels were on average lowest in the CHH(11.16%), higher in the CHG (28.82%), and highest in theCG context (46.40%, Pcontext < 0.0001, explained 49.03% of allvariation). This trend depended on the tissue type
(Pcontext:tissue < 0.0001, explained 4.66% of all variation), butmethylation was always highest in CG and lowest in CHHcontext. Irrespective of the context, overall methylation levelsvaried greatly between the tissue types (Ptissue < 0.0001,explained 43.24% of all variation). DNA methylation wasgenerally lowest in thalli and apical notches (15–23%), higherin archegonia and sporophytes (34–37%), and highest inantherozoids (55.16%; Fig. 2a, see Additional file 1: Tables S2and S3).We then extended the ANOVA by including the different
genomic features (Fig. 2b, see Additional file 1: Tables S4–S7,all P values < 0.0001, except for Pcontext:tissue:feature> 0.99). Over-all, the genomic features explained around 44.1% of all vari-ation (sequence context = 25.9%, tissue type = 21.3%). Thepairwise interactions were significant, but contributed little tooverall variation (1.9–2.7%). Thus, differences in DNA methy-lation were largely driven by the genomic feature context, the
Fig. 1 Illustration of the life cycle of M. polymorpha. Land plants have a more complex life cycle than animals, alternating between two multicellular,heteromorphic generations: the sporophyte and the gametophyte. In bryophytes (mosses, hornworts, and liverworts), the gametophytes constitutethe dominant generation while the sporophyte is a small and simple structure, whose development depends on the female gametophyte. The malegametophyte forms antheridiophores, the reproductive structures that harbor the antheridia with the antherozoids (sperm). The female gametophyteforms archegoniophores, the reproductive structures that harbor the archegonia, each of which contains a single egg cell. During sexual reproduction,the antherozoids are released from the antheridia and swim towards the archegonia on the female gametophyte. The sporophyte is formed uponfertilization and remains attached to the archegoniophore during its entire development. Spores are formed in the sporophyte through meiosis andare finally released. The spores germinate and develop into either male (with Y chromosome) or female (with X chromosome) gametophytes, therebyconcluding the life cycle. Both, male and female gametophytes are capable of asexual reproduction through the formation of gemmae in the gemmacups [57]. Numbers in magenta mark the tissues isolated for this study: (1/2) thallus of the female/male gametophyte, respectively, (3/4) apical notch ofthe female/male gametophyte, respectively, (5) archegonia, (6) antherozoids, (7) early sporophyte, and (8) late sporophyte
Schmid et al. Genome Biology (2018) 19:9 Page 3 of 17
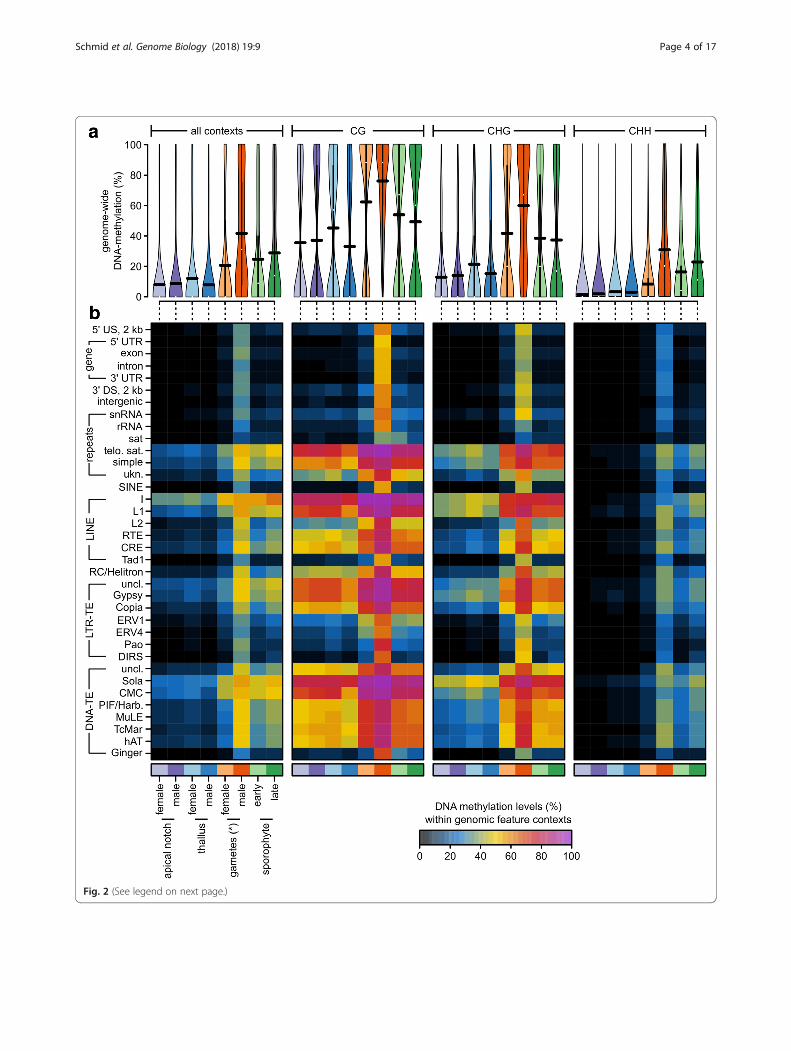
Fig. 2 (See legend on next page.)
Schmid et al. Genome Biology (2018) 19:9 Page 4 of 17
sequence context, and the tissue type. Averagedacross the different sequence contexts (Fig. 2b, seeAdditional file 1: Table S4), DNA methylation washighest in long interspersed nuclear elements (LINEs,up to 45.29%), DNA transposons (up to 38.02%), telo-meric satellite repeats (32.98%), LTR retrotransposons(up to 30.09%), and simple repeats (28.04%). In con-trast, DNA methylation was low in genes (8.26% inexons, 6.20% in introns), their flanking regions (eacharound 9%), ribosomal RNA (7.41%), and satellite re-peats (6.56%). The DNA methylation enrichment inrepetitive elements and the depletion in gene bodieswas overall consistent with a previous report usingdata from only vegetative gametophytic tissues [19].However, differences between the tissue typesreported above (antherozoids > sporophytes and arche-gonia > gametophytes) were largely consistent acrossthe different genomic features. For example, DNA methyla-tion was almost always highest in antherozoids irrespectiveof any sequence and genomic feature context (Fig. 2b, seeAdditional file 1: Table S5–S7). As a consequence, DNAmethylation in antherozoids within gene bodies (exons)reached 54.00% in the CG, 41.42% in the CHG, and 27.54%in the CHH context. Thus, unlike previously reported [19],M. polymorpha does not generally lack DNA methylationin gene bodies. Instead, it restricts it to specific stages of thelife cycle.DNA methylation in gene bodies (exons) in the archegonia
(gametangia containing the egg cells) were 14.38% in theCG, 10.36% in the CHG, and 5.19% in the CHH context andthus slightly increased compared to the gametophytes(~4.4%/~ 2.4%/~ 1.0% in the CG/CHG/CHH context, re-spectively). However, because the archegonia contain both,gametophytic tissues and egg cells, it was not possible to dis-tinguish whether the differences between the archegonia andthe antherozoids originate from differences between the eggcells and the antherozoids or if the differences were causedby the dilution of the egg cells with the gametophytic tissueof the archegonia.
Sex chromosomes and autosomes show distinct DNAmethylation patternsWe investigated whether sex chromosomes (Y and Xchromosomes in males and females, respectively) and
autosomes differ in their methylation patterns. Becausethe M. polymorpha genome is not assembled into chro-mosomes and consists of 2957 scaffolds, we comparedcytosine methylation between the autosomal scaffolds,the two scaffolds making up the Y chromosome, and thenine scaffolds constituting the X chromosome [25].Overall DNA methylation levels in sex chromosomes(80.20/55.48/16.88% in the CG/CHG/CHH context, re-spectively; Fig. 3a, see Additional file 1: Table S9) wereclearly higher than in autosomes (46.40/28.82/11.16% inthe CG/CHG/CHH context, respectively; Fig. 2b, seeAdditional file 1: Table S2). To normalize for differencesbetween different sequence contexts, genomic featurecontexts, and tissue types, we tested within each com-bination whether there was a difference in the averageDNA methylation level (in percent) between the sexchromosome(s) and autosomes (Fig. 3b, two-sided t-test,corrected for multiple testing, false discovery rate [FDR]< 0.05). In the CG context, DNA methylation levels ofsex chromosomes were significantly increased withingene bodies and their flanking regions, within unknowntypes of repeats, within LTR retrotransposons of theGypsy group (only some tissues), and some DNA trans-posons (MuLE and PIF/Harbinger). In a few cases, therewere differences between the X and the Y chromosome.For example, DNA methylation levels in introns wereincreased in the Y chromosome, but not the X chromo-some. Likewise, exon methylation levels in sporophyteswere more increased in the Y chromosomes than the Xchromosome (on average, 41/40/24% more methylationincrease in the CG/CHG/CHH contexts on the Ycompared to the X chromosome, two-sided t-test, allP < 0.02). This pattern was similar but weaker in theCHG context, and much weaker in the CHH context.In the latter, differences were almost exclusively foundin the sporophytes, which carry both sex chromo-somes. The general increase in gene body DNAmethylation in all tissue types could be explained bya spreading of DNA methylation from nearby trans-posons and repeats, which make up around 70% ofthe sex chromosomes [25, 32]. However, it is unclearwhether this alone could explain the even more pro-nounced increase in gene body DNA methylation insporophytes (especially on the Y chromosome), in
(See figure on previous page.)Fig. 2 a DNA methylation levels in percent at individual cytosines located in autosomes across all or within each individual sequence context(CG, CHG, CHH) for each tissue type used in this study shown as violin plots (see Additional file 1: Figure S1 for data from individual replicates).The horizontal black bars correspond to the means (see Additional file 1: Tables S2 and S3). b Average DNA methylation levels in percent for eachsequence context, genomic feature, and tissue type shown as a heatmap (see Additional file 1: Table S4, S5, S6, and S7). US/DS upstream/downstream of a gene, UTR untranslated region, snRNA small nucleolar RNA, rRNA ribosomal RNA, sat satellite repeat, telo. sat telomeric satelliterepeats, simple simple repeats, ukn. unknown/unclassified repeats, SINE short interspersed nuclear elements, LINE long interspersed nuclearelements, RC rolling circle transposon, LTR-TE retrotransposon with long terminal repeats, DNA-TE DNA transposon, uncl. not classified into a sub-family. *Note that for the “female gametes,” we sampled archegonia, which are entire gametangia that harbor the egg cells
Schmid et al. Genome Biology (2018) 19:9 Page 5 of 17
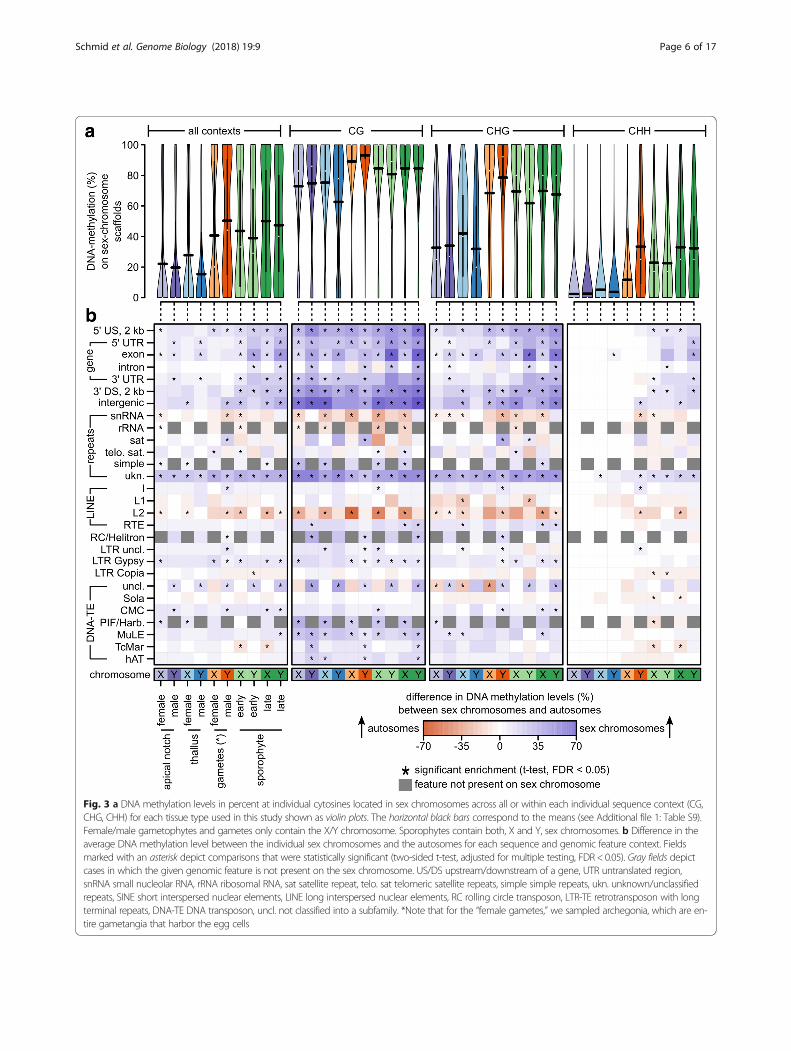
Fig. 3 a DNA methylation levels in percent at individual cytosines located in sex chromosomes across all or within each individual sequence context (CG,CHG, CHH) for each tissue type used in this study shown as violin plots. The horizontal black bars correspond to the means (see Additional file 1: Table S9).Female/male gametophytes and gametes only contain the X/Y chromosome. Sporophytes contain both, X and Y, sex chromosomes. b Difference in theaverage DNA methylation level between the individual sex chromosomes and the autosomes for each sequence and genomic feature context. Fieldsmarked with an asterisk depict comparisons that were statistically significant (two-sided t-test, adjusted for multiple testing, FDR < 0.05). Gray fields depictcases in which the given genomic feature is not present on the sex chromosome. US/DS upstream/downstream of a gene, UTR untranslated region,snRNA small nucleolar RNA, rRNA ribosomal RNA, sat satellite repeat, telo. sat telomeric satellite repeats, simple simple repeats, ukn. unknown/unclassifiedrepeats, SINE short interspersed nuclear elements, LINE long interspersed nuclear elements, RC rolling circle transposon, LTR-TE retrotransposon with longterminal repeats, DNA-TE DNA transposon, uncl. not classified into a subfamily. *Note that for the “female gametes,” we sampled archegonia, which are en-tire gametangia that harbor the egg cells
Schmid et al. Genome Biology (2018) 19:9 Page 6 of 17
which the two sex chromosomes co-occur. We hy-pothesized that imprinting or gene dosage regulationcould result in increased DNA methylation in genesthat are shared between the sex chromosomes. Thus,we expected genes shared between sex chromosomesto exhibit the largest increase in DNA methylation insporophytes compared to gametophytes.To investigate whether dosage compensation of genes
shared between the sex chromosomes caused the differ-ences between the X and Y chromosomes in sporophytes,we visualized the differences in average DNA methylationlevels in sex chromosome genes (exons and flankingregions) between the sex chromosomes in the sporophytesand the sex chromosomes in the gametophytes (seeAdditional file 1: Figure S2). We then sorted the averagedifferences and inspected whether genes shared betweenthe sex chromosomes [25] were among the ones with thelargest increase of DNA methylation. Overall, most genesshowed an increase in DNA methylation in the sporophytescompared to the gametophytes. However, in contrast to thehypothesis, genes shared between the sex chromosomeswere not among the top, but rather among the genes withthe weakest increase in DNA methylation. It is thereforeunlikely that dosage compensation of shared genes causedthe clear increase in gene body DNA methylation in thesex chromosomes of sporophytes. Thus, it may rather be ageneral differential regulation of sex chromosome genes inthe sporophyte, which results in the more pronouncedenrichment of DNA methylation in the sporophytic sexchromosomes compared to the sporophytic autosomes.
Four distinct epigenetic landscapes are found among M.polymorpha tissuesAs shown above, genome-wide DNA methylation pat-terns were clearly distinct between the different tissuetypes. However, to identify the extent of epigeneticreprogramming, it is necessary to identify epigenomesthat are specific to the different stages of the life cycle,i.e. there must be cytosines that are consistently moremethylated in one stage compared to the other. Also, ifepigenetic reprogramming is extensive, there should befew cytosines that are specific to a given individual andinvariant between the different stages of the life cycle ofthe given individual. We therefore tested for differentialcytosine methylation between the different tissue typesand sexes, as well as between different individuals.To this aim, we extracted all cytosines for which there
were data available from at least two out of three repli-cates from each tissue (sex chromosomes were excludedbecause they are not shared between all tissue types).We analyzed the variation at each individual cytosinewith a linear model and compared specific groups ofinterests to each other with linear contrasts. The advan-tage of this approach, compared to multiple pairwise
comparisons, is that each individual comparison is basedon the same data and the same residual estimates. Theresults of the different comparisons are therefore morecomparable to each other than a set of pairwise compar-isons (see “Methods” for details). P values for eachcomparison were adjusted for multiple testing to reflectFDRs and a cytosine was defined as differentially methyl-ated (DMC) if the FDR was < 0.001. In total, we testedaround 1 million cytosines for which there were enoughdata available. Compared to all cytosines in the M.polymorpha genome and random subsets of cytosineswith identical context frequencies, these positions exhib-ited enrichment in the CHH context and transposableelements (TEs; P < 0.01; see Additional file 1: Figure S3).It is therefore important to note that conclusions drawnfrom this analysis are slightly biased towards the CHHcontext and transposons.To estimate the fraction of cytosines with a DNA
methylation level specific to a certain individual, wecompared all individuals to each other using all haploidtissues of the individuals as replicates (i.e. everything ex-cept the sporophytes). On average, we found 373/6/5DMCs in the CG/CHG/CHH context, respectively, be-tween two different individuals. This corresponded to0.3%, 0.005%, and 0.0007% of all tested cytosines (seeAdditional file 1: Table S10). Thus, DNA methylationlevels at individual cytosines were almost never consist-ently inherited across the life cycle.To determine the cytosines with DNA methylation
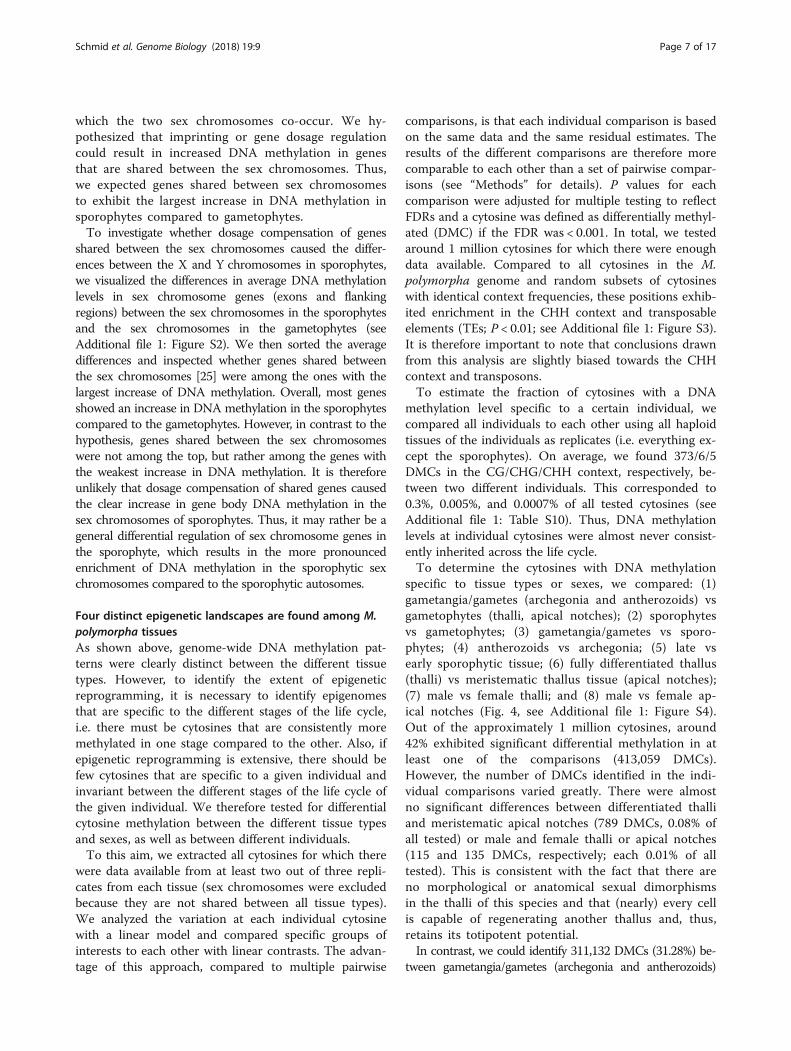
specific to tissue types or sexes, we compared: (1)gametangia/gametes (archegonia and antherozoids) vsgametophytes (thalli, apical notches); (2) sporophytesvs gametophytes; (3) gametangia/gametes vs sporo-phytes; (4) antherozoids vs archegonia; (5) late vsearly sporophytic tissue; (6) fully differentiated thallus(thalli) vs meristematic thallus tissue (apical notches);(7) male vs female thalli; and (8) male vs female ap-ical notches (Fig. 4, see Additional file 1: Figure S4).Out of the approximately 1 million cytosines, around42% exhibited significant differential methylation in atleast one of the comparisons (413,059 DMCs).However, the number of DMCs identified in the indi-vidual comparisons varied greatly. There were almostno significant differences between differentiated thalliand meristematic apical notches (789 DMCs, 0.08% ofall tested) or male and female thalli or apical notches(115 and 135 DMCs, respectively; each 0.01% of alltested). This is consistent with the fact that there areno morphological or anatomical sexual dimorphismsin the thalli of this species and that (nearly) every cellis capable of regenerating another thallus and, thus,retains its totipotent potential.In contrast, we could identify 311,132 DMCs (31.28%) be-
tween gametangia/gametes (archegonia and antherozoids)
Schmid et al. Genome Biology (2018) 19:9 Page 7 of 17
and gametophytes, 200,001 DMCs (20.11%) between sporo-phytes and gametophytes, 130,583 DMCs (13.13%) betweengametangia/gametes and sporophytes, 178,165 DMCs(17.91%) between antherozoids and archegonia, and 15,751DMCs (1.58%) between early and late sporophytic tissues.Interestingly, most of the comparisons were strongly biasedtowards one side having a high level of methylation com-pared to the other (Fig. 4, see Additional file 1: Figure S4).For example, almost all DMCs (99.98%) between gametan-gia/gametes and gametophytes had increased methylation inthe gametangia/gametes. Likewise, almost all DMCs(99.87%) between sporophytes and gametophytes had in-creased methylation in the sporophytes. In a similar way,DNA methylation was mostly higher in late compared toearly sporophytes (98.74%) and in antherozoids compared toarchegonia (99.96%). Only in the comparison between gam-etangia/gametes and sporophytes, both groups containedDMCs with higher levels of DNA methylation (78.50% ingametangia/gametes, 21.50% in sporophytes). Overall, DMCsof all comparisons were most often found in LTR retrotran-sposons (Copia and Gypsy), unknown types of repeats, genesand their flanking regions, LINEs (RTE), and DNA transpo-sons (hAT; see Additional file 1: Figure S4).
Taken together, these results suggest the existence offour major epigenetic landscapes, which are specific tosporophytes, vegetative gametophytic tissues, anthero-zoids, and archegonia. DNA methylation levels are gen-erally low in the gametophytes and differences betweentissue types were largely driven by a gain of DNA methy-lation in antherozoids and archegonia, a loss in (early)sporophytes compared to the gametangia/gametes, andanother gain during sporophyte development.
Distinct mechanisms of epigenetic reprogramming occurduring reproductive and sporophytic development of M.polymorphaTo test whether there is complete reprogramming of theDNA methylation pattern, it would be best to trackDNA methylation levels of all cytosines over several gen-erations. However, this would require a higher sequen-cing coverage (saturation) to evaluate the entire genomeand more generations. Given the limited sequencingcoverage and the single generation analyzed, we insteadfocused on specific subsets of cytosines that we considerstrong indicators of epigenetic reprogramming. Giventhat a gain of DNA methylation is always an active
Fig. 4 Schematic representation of the comparisons performed during the analysis of differential cytosine methylation. Variation in DNAmethylation at each individual cytosine was analyzed with a linear model according to a design with a single factor comprising all differentexperimental groups [14]. Specific groups were then compared with linear contrasts. Percentages of cytosines with significant (FDR < 0.001)differences in DNA methylation are given for each comparison (total number of cytosines tested: 994,696). In addition, there is a histogram withthe differences in DNA methylation at the individual DMCs for each comparison (the sizes are not proportional to the number of DMCs found inthe comparison). The x-axis of the histogram ranges from – 100% to + 100% and the vertical line is at 0. The orientation of the x-axis is such that ahigher density in the left/right side of the histogram corresponds to higher methylation in the group at the left/right side of the arrow depictingthe comparison. For example, almost all DMCs identified in the comparison “gametophyte vs sporophyte” have increased methylation levels inthe sporophytes compared to the gametophytes. See Additional file: Figure S4 for differences in DNA methylation for each individual sequenceand genomic feature context
Schmid et al. Genome Biology (2018) 19:9 Page 8 of 17
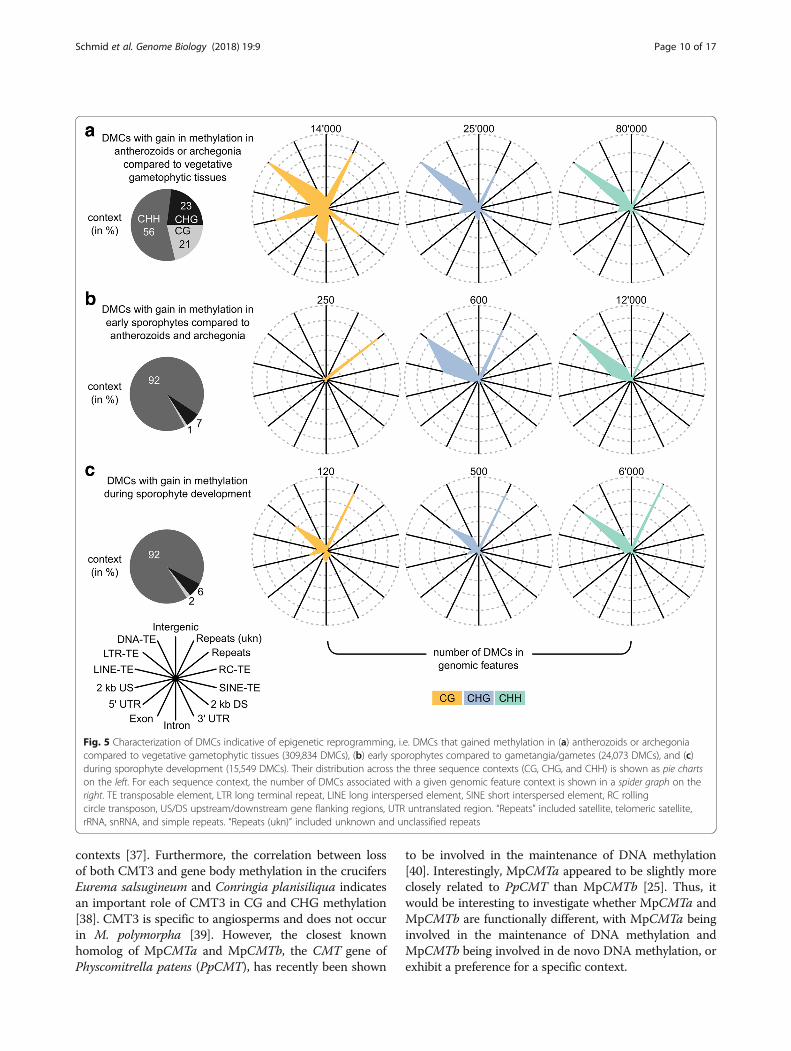
process (as opposed to loss of DNA methylation whichcan occur passively through cell division), we focused onDMCs that clearly gained methylation in: (1) anthero-zoids or archegonia compared to vegetative gameto-phytic tissues (309,834 DMCs); (2) early sporophytescompared to gametangia/gametes (24,073 DMCs); and(3) during sporophyte development from early to latestages (15,549 DMCs).To investigate the mechanisms underlying these
changes in DNA methylation, we characterized the threesets in terms of their sequence context and their distri-bution across genomic features (Fig. 5). The DMCs insets (2) and (3) were similar to each other, with mostDMCs being in the CHH context (92% in both), and lo-cated in LTR retrotransposons, DNA transposons, andunknown repeats (Fig. 5b, c). The main difference wasthat DMCs in set (2) were more often found in LINEretrotransposons and LTR retrotransposons but less fre-quently in unknown repeats than the DMCs from set (3)(all P < 0.0001, see Additional file 1: Tables S11–S13 forenrichment analyses of all features and contexts).However, given the relatively low number of DMCs inthe two sets, it is unclear whether this reflects real bio-logical differences.The DMCs in set (1) were clearly different from sets (2)
and (3). They frequently occurred in all sequence contexts(21%/23%/56% in the CG/CHG/CHH context, respectively)and showed enrichment in the CG and CHG contexts com-pared to the background (i.e. among 1 million tested Cs, +5% in the CG, + 9% in the CHG, – 15% in the CHH context,respectively; see Additional file 1: Figure S3A, “tested”).Similar to the DMCs in sets (2) and (3), the DMCs of set (1)in the CHG and CHH context were most often found inLTR retrotransposons, DNA transposons, and unknown re-peats (Fig. 5a). However, many were also located in genes(CHG=11.1%, CHH=5.9%) and gene flanking regions (2 kbupstream and downstream, CHG=17.3%, CHH=15.6%).The enrichment in genes and gene flanking regions was evenmore pronounced for the DMCs in the CG context (genes= 21.0%, flanking regions = 26.7%). Interestingly, < 20% of theDMCs located in genes were also located in TEs or repeats(i.e. regions where genes and transposons or repeats overlap,CG= 14.0%, CHG=16.9%, CHH=22.4%). This trend wasless pronounced for the DMCs in gene flanking re-gions where up to 55% were also located in TEs orrepeats (CG = 30.0%, CHG = 41.8%, CHH = 54.7%).Nonetheless, these results clearly suggest that the en-richment of DMCs in genes and gene flanking regionswas not solely caused by TEs or repeats interspersedbetween genes and their flanking regions.The enrichment in the CG and CHG contexts and the
gene bodies and gene flanking regions of the DMCs inset (1) compared to the DMCs in sets (2) and (3)suggests a difference in the mechanism underlying
reprogramming in gametangia/gametes compared to theone acting in the sporophyte. To explain these differ-ences, we analyzed the expression of genes involved inDNA methylation and DNA demethylation, RNA-directed DNA methylation (RdDM), and siRNA process-ing in publicly available datasets (see Additional file 1:Figure S5, data from [25]). Since these data were col-lected using entire gametophores instead of archegoniaand antherozoids, we analyzed the expression of DNAmethyltransferases in the same tissues that we used inour analysis of DNA methylation (see Additional file 1:Figure S6).The expression pattern of all genes involved in DNA
methylation in the archegoniophores (the structurecarrying the archegonia) closely resembled the ones ingametophytic thalli. In general, the DNA methyltransfer-ases are relatively lowly expressed in these tissues, yetthe isolated archegonia exhibited a clear increase inexpression of MpDRMb compared to the gametophytictissues (see Additional file 1: Figure S6). Genes with anincreased expression in the antheridiophore encoded theDNA methyltransferases MpMET and MpCMTa, thePIWI-domain containing proteins MpPIWIa and MpPI-WIb (siRNA processing), and the RNA methyltransferaseMpHEN (RdDM). MpDRMa and MpCMTa were highlyexpressed in both antheridiophores and antherozoids,whereas MpDRMb showed only high expression inantherozoids, indicating differential regulation. In youngsporophytes, all DNA methyltransferases were expressed,characterized by high expression of MpDRMb and apreferential expression MpCMTb (see Additional file 1:Figure S6). Interestingly, mature sporophytes exhibit DNAmethyltransferase expression levels similar to gameto-phytic tissues, even though an increase in DNA methyla-tion in the CHH context is observed at this stage (seeAdditional file 1: Figure S6).Thus, the occurrence of DNA methylation in gene bod-
ies and the enrichment of the CG and CHG context in theantherozoids may be explained by an antherozoid-specificRdDM machinery (reflected by the very high expressionof MpHEN) and the high expression levels of all the genesencoding the DNA methyltransferases, with MpMETlikely enforcing the high levels of DNA methylation in theCG context. Likewise, the elevated levels of DNA methyla-tion in the CHG context might be explained throughmaintenance by MpCMTa, MpCMTb, and the DRMmethyltransferases MpDRMa and MpDRMb. However,this remains speculative because the CMTs inM. polymor-pha belong to a clade distinct from those in A. thaliana[25] and only a few CMTs were experimentally shown tobe capable of maintaining DNA methylation. In A. thali-ana, CMT3 is required for CHG methylation [33, 34] andCMT2 was found to be associated with CHH methylation[35, 36] and de novo methylation in the CHG and CHH
Schmid et al. Genome Biology (2018) 19:9 Page 9 of 17
contexts [37]. Furthermore, the correlation between lossof both CMT3 and gene body methylation in the crucifersEurema salsugineum and Conringia planisiliqua indicatesan important role of CMT3 in CG and CHG methylation[38]. CMT3 is specific to angiosperms and does not occurin M. polymorpha [39]. However, the closest knownhomolog of MpCMTa and MpCMTb, the CMT gene ofPhyscomitrella patens (PpCMT), has recently been shown
to be involved in the maintenance of DNA methylation[40]. Interestingly, MpCMTa appeared to be slightly moreclosely related to PpCMT than MpCMTb [25]. Thus, itwould be interesting to investigate whether MpCMTa andMpCMTb are functionally different, with MpCMTa beinginvolved in the maintenance of DNA methylation andMpCMTb being involved in de novo DNA methylation, orexhibit a preference for a specific context.
Fig. 5 Characterization of DMCs indicative of epigenetic reprogramming, i.e. DMCs that gained methylation in (a) antherozoids or archegoniacompared to vegetative gametophytic tissues (309,834 DMCs), (b) early sporophytes compared to gametangia/gametes (24,073 DMCs), and (c)during sporophyte development (15,549 DMCs). Their distribution across the three sequence contexts (CG, CHG, and CHH) is shown as pie chartson the left. For each sequence context, the number of DMCs associated with a given genomic feature context is shown in a spider graph on theright. TE transposable element, LTR long terminal repeat, LINE long interspersed element, SINE short interspersed element, RC rollingcircle transposon, US/DS upstream/downstream gene flanking regions, UTR untranslated region. “Repeats” included satellite, telomeric satellite,rRNA, snRNA, and simple repeats. “Repeats (ukn)” included unknown and unclassified repeats
Schmid et al. Genome Biology (2018) 19:9 Page 10 of 17
Interestingly, increasing DNA methylation in the CHHcontext during sporophyte development in M. polymor-pha resembles the pattern found in A. thaliana, inwhich CHH methylation increases during embryo (i.e.sporophyte) development [16]. This increase in CHH(and CHG) methylation, specifically in TEs, was ex-plained by the activity of CMT2 and the RdDM pathway[16]. Intriguingly, in M. polymorpha, MpCMTb seems tobe preferentially expressed in young sporophytes (seeAdditional file 1: Figures S6) and almost all genes of theRdDM pathway and most DNA methyltransferases areexpressed as well at a higher level in young sporophytescompared to vegetative gametophytic tissue and oldsporophytes (see Additional file 1: Figures S5). It wouldbe fascinating to see whether this mechanism is con-served in plants.Also unresolved remains the contribution of MpROS1a,
for which the A. thaliana homolog ROS1 acts as DNAdemethylase with a preference for a non-CG context [41,42]. It reaches its highest expression in antheridiophoresand sporophytes. However, DNA methylation levels in theantherozoids seem largely unaffected by it. Aside thepossibility that the high expression observed in antheridio-phores is not reflected in the antherozoids, it is also pos-sible that activity of MpROS1a is delayed in theantherozoids and starts only after fertilization (e.g. by de-layed translation). This would therefore provide an ex-planation for the strong decrease in DNA methylation insporophytes compared to the gametangia/gametes.
However, it remains to be shown that MpROS1a acts in-deed like its A. thaliana homolog ROS1.
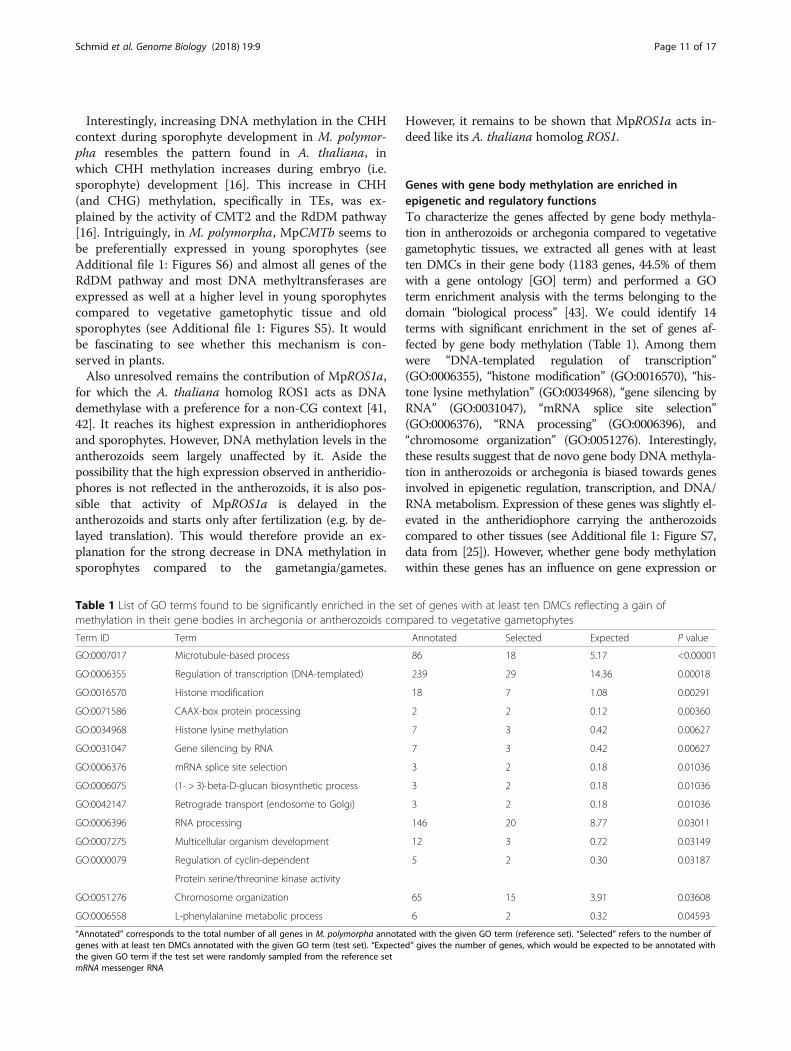
Genes with gene body methylation are enriched inepigenetic and regulatory functionsTo characterize the genes affected by gene body methyla-tion in antherozoids or archegonia compared to vegetativegametophytic tissues, we extracted all genes with at leastten DMCs in their gene body (1183 genes, 44.5% of themwith a gene ontology [GO] term) and performed a GOterm enrichment analysis with the terms belonging to thedomain “biological process” [43]. We could identify 14terms with significant enrichment in the set of genes af-fected by gene body methylation (Table 1). Among themwere “DNA-templated regulation of transcription”(GO:0006355), “histone modification” (GO:0016570), “his-tone lysine methylation” (GO:0034968), “gene silencing byRNA” (GO:0031047), “mRNA splice site selection”(GO:0006376), “RNA processing” (GO:0006396), and“chromosome organization” (GO:0051276). Interestingly,these results suggest that de novo gene body DNA methyla-tion in antherozoids or archegonia is biased towards genesinvolved in epigenetic regulation, transcription, and DNA/RNA metabolism. Expression of these genes was slightly el-evated in the antheridiophore carrying the antherozoidscompared to other tissues (see Additional file 1: Figure S7,data from [25]). However, whether gene body methylationwithin these genes has an influence on gene expression or
Table 1 List of GO terms found to be significantly enriched in the set of genes with at least ten DMCs reflecting a gain ofmethylation in their gene bodies in archegonia or antherozoids compared to vegetative gametophytes
Term ID Term Annotated Selected Expected P value
GO:0007017 Microtubule-based process 86 18 5.17 <0.00001
GO:0006355 Regulation of transcription (DNA-templated) 239 29 14.36 0.00018
GO:0016570 Histone modification 18 7 1.08 0.00291
GO:0071586 CAAX-box protein processing 2 2 0.12 0.00360
GO:0034968 Histone lysine methylation 7 3 0.42 0.00627
GO:0031047 Gene silencing by RNA 7 3 0.42 0.00627
GO:0006376 mRNA splice site selection 3 2 0.18 0.01036
GO:0006075 (1- > 3)-beta-D-glucan biosynthetic process 3 2 0.18 0.01036
GO:0042147 Retrograde transport (endosome to Golgi) 3 2 0.18 0.01036
GO:0006396 RNA processing 146 20 8.77 0.03011
GO:0007275 Multicellular organism development 12 3 0.72 0.03149
GO:0000079 Regulation of cyclin-dependent 5 2 0.30 0.03187
Protein serine/threonine kinase activity
GO:0051276 Chromosome organization 65 15 3.91 0.03608
GO:0006558 L-phenylalanine metabolic process 6 2 0.32 0.04593
“Annotated” corresponds to the total number of all genes in M. polymorpha annotated with the given GO term (reference set). “Selected” refers to the number ofgenes with at least ten DMCs annotated with the given GO term (test set). “Expected” gives the number of genes, which would be expected to be annotated withthe given GO term if the test set were randomly sampled from the reference setmRNA messenger RNA
Schmid et al. Genome Biology (2018) 19:9 Page 11 of 17
is a by-product of active transcription remains an openquestion [38, 39, 44].
ConclusionTo determine the DNA methylation dynamics duringthe life cycle of M. polymorpha, we isolated severaltissues at various developmental stages. We first charac-terized the DNA methylation patterns of the individualtissue types separately (Fig. 2) and then focused on theidentification of DMCs to characterize the extent ofDNA methylation dynamics during the M. polymorphalife cycle. DNA methylation varied greatly between thedifferent tissue types with 42% of all tested positions be-ing identified as DMCs. However, the differences wereclearly limited to a few comparisons and suggested fourmajor epigenetic landscapes specific to the sporophytes,the gametophytes, the antherozoids, and the archegonia(Fig. 4). DNA methylation was generally low in the ga-metophytes and DNA methylation dynamics during thelife cycle were largely driven by a gain of DNA methyla-tion in antherozoids and archegonia, a loss in the (early)sporophyte compared to the antherozoids and the arche-gonia before fertilization, and another gain during sporo-phyte development.Characterization of three sets of DMCs indicative of
epigenetic reprogramming, based on the fact that a gainin DNA methylation requires an active process, suggeststhat distinct mechanisms underlie reprogramming at dif-ferent stages of M. polymorpha development (Fig. 5).DMCs with a gain in methylation in antherozoids andarchegonia relative to the gametophytes showed a clearenrichment in the CG and CHG contexts and the genebodies and gene flanking regions. In contrast, gain ofDNA methylation during sporophyte development wasmostly found in the CHH context, LTR retrotranspo-sons, DNA transposons, and repeats, which partiallyresembled the CHH methylation pattern dynamicsobserved during early A. thaliana sporophyte develop-ment [16]. Some of the differences could be explainedwith previously published expression data [25], leadingto the speculation that at least one of the CMTs presentin M. polymorpha might act as a maintenance methyl-transferase. However, the exact mechanisms underlyingepigenetic reprogramming in the gametes and the sporo-phyte remain to be elucidated.We do not know whether resetting of DNA methyla-
tion is complete or if certain positions evade erasure. Anexperiment including more generations and a sequen-cing depth reaching saturation would be required to an-swer these questions. Nonetheless, our study clearlydemonstrates that there is extensive reprogramming inM. polymorpha and that distinct mechanisms are in-volved in this process in the gametophytic and thesporophytic generation. Finally, our datasets provide
valuable information for in-depth studies of DNAmethylation at specific genes of interest, further expand-ing the genomic resources of the emerging model systemM. polymorpha.
MethodsPlant material and growth conditionsMale (Tak-1) and female (Tak-2) M. polymorpha strainswere originally obtained from T. Kohchi (Kyoto University)and J. Haselhoff (University of Cambridge) in 2012 (de-scribed in [45]). The M. polymorpha reference genome isbased on Tak-1 [25]. To avoid a bias caused by differentalignment efficiencies or strain-specific methylation patters,strains were crossed repeatedly to equalize the genomicbackground. Plants were grown from spores on sterile half-strength Gamborg B5 basal medium (PhytoTechnologyLaboratories) in a growth chamber at 22 °C under fluores-cent light under long-day conditions (16 h light, 8 h dark)for six weeks. Plants were then transferred to soil (“Einheit-serde D73,” Universalerde mixed in a 1:1 ratio with sand).Positions in the growth chamber were randomized twice aweek. Sexual reproduction was induced two weeks aftertransfer to soil by supplementing with far-red light(740 nm, GreenPower LED module HF far-red,#929000464503, Philips). Fertilization was carried outmanually. To isolate antherozoids (sperms), a drop of sterilewater (around 15 μL) was placed on top of the male game-tophore. Sperms were then released into the water inapproximately 1 min and the droplet containing the anther-ozoids was collected. The droplet was deposited at the ven-tral side of the female receptacle. We used three male andthree female individuals for the entire study and each indi-vidual was used once in a cross.
Tissue harvestingMale and female thalli and apical notches, antherozoids,archegonia, and sporophytes were collected at distinctdevelopmental stages using different isolation methods.Thalli and apical notches were isolated just before induc-tion of sexual reproduction on the same day and at asimilar time. Male and female thalli and apical notcheswere perforated and collected with straight cylindrictubes with diameters of 5 mm and 3 mm, respectively.Three/five pieces were collected from different lobes ofone individual for each thallus/apical notch sample. Theobtained thallus samples contained some rhizoids at-tached to the ventral surface, but no gemma cups.Antherozoids were isolated as described above for themanual fertilization procedure. For each sample, wecollected and pooled antherozoids from about threeantheridiophores (total volume of 45 μL). Archegoniawere collected by dissecting the entire archegoniophore,followed by manual isolation of the archegonia under adissecting scope (LEICA MZ 6, Leica Microsystems
Schmid et al. Genome Biology (2018) 19:9 Page 12 of 17
AG). For each sample we collected at least 600 archegoniafrom about 12 different archegoniophores from one indi-vidual. Early and late sporophytes were collected two andfour weeks after fertilization, respectively. Sporophyteswere collected by dissecting the female gametophore,followed my manual isolation of the developing sporo-phyte. We isolated around ten sporophytes per sample.All tissues were snap-frozen in liquid nitrogen and storedat – 80 °C until further use. Each tissue was collected fromall three available individuals or crosses, resulting in a totalof 24 samples (see Fig. 1 for an overview).
Whole-genome bisulfite sequencingDNA was extracted from frozen plant material using theMasterPure™ DNA purification kit (Epicentre) followingthe protocol “Plant Leaf DNA Purification Protocols”with a customized tissue-grinding step. To ensurehomogenous grinding of each sample, we added fiveglass beads (2 mm diameter) to the tubes with frozenplant material, snap-froze the tissue again in liquid ni-trogen, and ground the tissue three times for 12 s in aSilamat S6 mixer mill (Ivoclar Vivadent). Isolation andpurification of DNA was followed by the fragmentationof the samples to an average sequencing library insertsize of 350 bp using the Covaris S2 system (Covaris).Sequencing libraries were produced individually per tis-sue and replicate from the fragmented DNA, using theHTP Library Preparation Kit for Illumina platforms, fol-lowing the corresponding protocol (Kapa Biosystems). Inorder to assess the DNA methylation status of the sam-ples, we included an additional bisulfite treatment in theKAPA KTP library preparation protocol. The bisulfiteconversion was carry out using the EpiTect Bisulfite Kit(Qiagen) and performed after DNA adapter ligation butbefore the amplification of the libraries. Samples wereindividually barcoded using the Illumina-compatibleSeqCap adapter Kits A and B (Roche). Quality of thesequencing libraries was assessed on an Agilent 2100Bioanalyzer instrument (Agilent). Libraries were paired-end sequenced (2 × 125 bp) on the Illumina HiSeq 2500system (24 libraries on three lanes). Short reads were de-posited at SRA (SRP101412, [46]).
Alignment of WGBS readsReads were quality-checked with FastQC (bioinformatics.-babraham.ac.uk/projects/fastqc). Following removal ofadaptor sequences and low-quality bases with TrimGalore(version 0.4.1 with the parameters –illumina –paired–clip_R2 2, www.bioinformatics.babraham.ac.uk/projects/trim_galore), reads were aligned to the M. polymorpha refer-ence genome (v3.1 from Phytozome 11, [25, 47]) usingBismark (version 0.16.3 [48]) in conjunction with Bowtie 2(version 2.3.0 [49]) with the parameters –bowtie2 –seedmms1. Clonal reads with identical sequences resulting from
possible over-amplification during sample preparation weremarked with Picard (version 2.3.0, broadinstitute.github.io/picard). Methylated and unmethylated read counts for all cy-tosines in the CG, CHG, and CHH context were finally ob-tained with PileOMeth (github.com/dpryan79/PileOMeth).Cytosines with a coverage < 5 or > 100 were removed toavoid a potential bias originating from low coverage orpoorly annotated sequences [31]. The number of cytosinespassing this filter and coverage statistics are given inSupplemental Table S1. Bisulfite conversion rates were onaverage 98.5% as assessed from unmethylated plastid ge-nomes (see Additional file 1: Table S1).
Gene annotation and identification of TEs and repeatsWe used the annotation available from Phytozome (v 3.1,[47]). Given that we could only use the annotation with thegenes (the file with the repeats contained identifiers thatcould not be assigned to repeat or transposon families), weidentified TE and repeat regions with RepeatModeler (ver-sion 1.0.8 [50]) and RepeatMasker (version 4.0.6 [51]), andmerged the resulting annotation with the gene annotation(available online [52]). For Fig. 5 we summarized the TEand repeat classes into a few distinct groups: (1) DNAtransposon; (2) LTR transposon; (3) LINE transposon; (4)SINE transposon; (5) RC/Helitron transposon; (6) repeats(comprises satellite, telomeric satellite, simple, rRNA, andsnRNA repeats); and (7) unknown repeats (comprises un-classified and unknown repeats). It is noteworthy that wefound some transposons belonging to LINE families otherthan L1 and RTE. To the best of our knowledge, there havebeen no previous reports of transposons belonging to theseLINE families in plants. In the reference genome paper[25], only LINE L1 and RTE are mentioned. We verifiedour repeat analysis with the A. thaliana reference genome(arabidopsis.org) and an assembly of Boechera divaricarpa(data not shown). In both cases, we could only identify theLINE-L1 and LINE-RTE groups (LINE-RTE only in B.divaricarpa). Thus, it is unlikely that the results from M.polymorpha were exclusively false positives.
Mapping of genomic positions to local genetic contextGenomic positions (e.g. DMCs with a gain in methyla-tion during sporophyte development) were mapped totheir local feature context using the annotation contain-ing genes, gene-flanking regions (2 kb upstream anddownstream), TEs, and repeats. Regions without annota-tion were defined as intergenic. Genes were furtherbroken down into exons, introns, 5' UTRs, and 3' UTRs.For methylation statistics (e.g. Fig. 5), annotations weregiven equal priorities (except for unknown and unclassi-fied repeats, which were given lower priorities) and theirscore was increased by the fraction of the number of fea-tures that mapped to the position.
Schmid et al. Genome Biology (2018) 19:9 Page 13 of 17
Comparison of genome-wide DNA methylation levelsVariation in average genome-wide methylation levels(see Additional file 1: Table S3 and S8) in fractions (per-centage/100) was analyzed with a general linear modelin R [53], according to crossed factorial designs with thetwo/three explanatory factors “sequence context,” “tissuetype,” and “feature,” and all interactions between them.The factor “feature” was only included in the secondanalysis (see Additional file 1: S8). The model was fittedwith the glm() function using the “quasibinomial” distri-bution (i.e. binomial with over-dispersion) and the“logit” link. Such a model is similar to a model using thebeta-binomial distribution except for the over-dispersionbeing a constant instead of a linear function of the num-ber of individuals included in the model [54]. The modelwas then tested for significance with an analysis of devi-ance [54] (which is the same as an ANOVA but usingdeviances instead of variances).
Determination of DMCs across all conditionsFor the analysis of differential methylation, we only usedcytosines that were sequenced in at least two out ofthree replicates across all tissue types (1,005,661 in total,994,696 without X and Y chromosome scaffolds, whichwe excluded given that they do not occur in all tissuetypes). Variation in DNA methylation at each individualcytosine was then analyzed with a linear model in R [53]with the package DSS (version 2.24.0; [14]), according toa design with a single factor comprising all different ex-perimental groups (similar to the approach described forRNA-sequencing [55]). Specific groups were comparedwith linear contrasts and P values were adjusted formultiple testing (Benjamini–Hochberg, i.e. FDR).Cytosines with an adjusted P value (FDR) < 0.001 wereconsidered to be differentially methylated and termedDMCs. Differences in DNA methylation levels at indi-vidual cytosines were calculated as the difference be-tween the average methylation levels between the twogroups. If a group contained more than one tissue type(e.g. early sporophyte compared to antherozoids andarchegonia), we generally used the average across aver-age methylation levels within this group to calculate thedifference in DNA methylation (Fig. 4, see Additionalfile 1: Figure S4). However, for the analysis of DMCswith a clear gain in DNA methylation (Fig. 5), we usedthe highest average methylation level within the groupsto calculate the difference in DNA methylation and fil-tered for a minimal gain of 10%. We chose this ap-proach, favoring loss over gain, because we wereinterested in identifying DMCs that unambiguouslygained DNA methylation (Fig. 5, see Additional file 1:Figures S11–S13).The key advantage of the approach using a single
model and all data, compared to multiple separate
pairwise comparisons, is that all tests are performedon the same data with the same residual estimates. Itthereby grants a more balanced (same positions, sameresidual estimates) and more powerful (residualestimates are always based on all available samples)analysis. In contrast, multiple pairwise comparisonsuse different data and residual estimates in each indi-vidual comparison. The data used for a given test de-pends on the comparison, because a given positionmust have data in all conditions used in the test. Ifgenome coverage is not saturated (like in this study),the size of the dataset used in a comparison will de-crease as the number of conditions increases. In par-allel, the residual estimates are more reliable withmore samples. Thus, in a pairwise comparison withmany samples (e.g. gametes vs gametophytes with atotal of 18 individuals), there will be few tests with ahigh statistical power. In contrast, a pairwise compari-son with few samples (e.g. antherozoids compared toarchegonia using only six individuals) will performmore tests with less statistical power. Consideringthat corrections for multiple testing depend on thenumber of tests performed, the differences betweenthe two pairwise comparisons will be further in-creased. Interpretation of a collection of pairwisecomparisons is therefore difficult and probablystrongly driven by the imbalance between the com-parisons. Thus, even though the approach with a sin-gle linear model will only use positions for whichdata is available in all conditions, the results are morecomparable to each other, thereby allowing for a bet-ter interpretation of global patterns of differentialDNA methylation.
GO enrichmentTo functionally characterize the genes containingDMCs, we tested for enrichment of GO terms withtopGO (version 2.26 [43]) in conjunction with theGO annotation available from Phytozome [47].Analysis was based on gene counts (genes with DMCscompared to all annotated genes) using the “weight”algorithm with Fisher’s exact test (both implementedin topGO). A term was identified as significant if theP value was < 0.05.
Droplet digital polymerase chain reaction (ddPCR) forexpression analysis of DNA methyltransferasesFor RNA extraction, M. polymorpha tissue sampleswere harvested using the same methods as for DNAextraction. Three biological replicates were harvestedfrom plants cultured simultaneously or at a differenttime-point but under identical conditions as for DNAextraction. Archegonia (around 400 per replicate) andantherozoid samples (extracted from five or more
Schmid et al. Genome Biology (2018) 19:9 Page 14 of 17
antheridiophores) were pooled from two or moreplants. Total RNA extraction and DNAse treatmentwas performed using the Direct(-zol)TM RNA Mini-Prep (ZymoResearch) with TRIzolTM Reagent(Ambion), according to manufacturer’s protocol. RNAconcentrations were measured using the Qubit RNAHS Assay Kit (Invitrogen) and a Qubit 3.0Fluorometer (Invitrogen). All antherozoid sampleswere measured with the 4200 TapeStation system (Agi-lent), as their corresponding RNA concentrationswere below the limit of detection of the Qubitfluorometer. Sample concentration measurements andtotal RNA input material used in downstream reac-tions are listed in Additional file 1: Table S14. AfterRNA extraction and measurement, all samples wereconverted to cDNA using 200 units of SuperScript® IIReverse Transcriptase (Invitrogen) according to the man-ufacturer’s protocol in a 25-uL reaction, using 20-μg/mLOligo(dT)12-18 primers. All samples were controlled inparallel for genomic DNA contamination with RT(–) reac-tions, in which SuperScript® II Reverse Transcriptase wasreplaced with nuclease-free water.Two genes, MpAPT3 and MpACT7, reported to be
evenly expressed across different M. polymorpha de-velopmental stages [56], were used as reference genes.All primers to amplify DNA methyltransferase geneswere designed using the CLC Main Workbench (Qia-gen) software. The primer sequences used for theanalysis are listed in Additional file 1: Table S15. Allprimers were tested and validated for optimal concen-tration; primer efficiency was assessed for the fivenewly designed primers (see Additional file 1: TableS16). Primers were tested in a 7500 Applied Biosys-tem Fast quantitative Real-Time PCR System andlater validated on a QX200 Droplet Digital PCR Sys-tem (Bio-Rad) for the ddPCR assay. Reactions forreal-time PCR were performed in total volumes of20 μL containing 10 μL 2X SYBR-green Supermix(SsoAdvanced™ Universal SYBR®). For the ddPCR ana-lysis, individual PCR reactions were performed in atotal volume of 25 μL, using 1× ddPCR EvaGreenSupermix, with droplets generated according to man-ufacturer’s recommendations. Reading of the PCR-amplified droplets was carried out by the QX200Droplet Reader (Bio-Rad) and analyzed by the Quan-taSoft™ Software (v1.4, Bio-Rad).Raw data are provided in Additional file 1: Table S16.
To compare the expression of the studied genes betweenthe different tissues, we calculated log2 ratios betweenthe test genes and the reference genes. To this aim,RT(+) counts of the test genes and the reference geneswere first log2(x + 1) transformed and the value of thereference genes was then subtracted from the value ofthe test gene (resulting in two datasets, one with
MpAPT3 and the other with MpACT7 as reference). Tis-sues were compared with two-sided t-tests. For eachgene, P values were adjusted for multiple testing.Adjusted P values (FDR) < 0.05 were considered to besignificant. Even though the primer pair of the MpACT7reference gene did not span an intron (thus potentiallyamplifying genomic DNA if present), results were similarto the ones obtained with MpAPT3 as reference gene(see Additional file 1: Figure S6).
Additional file
Additional file 1: Supplemental figures and tables. This PDF filecontains all supplemental figures and tables. (PDF 7269 kb)
AbbreviationsDMC: Differentially methylated cytosine; FDR: False discovery rate; LTR: Longterminal repeat; LINE: Long interspersed elements; RC: Rollingcircle transposon; RdDM: RNA-directed DNA methylation; SINE: Shortinterspersed elements; TE: Transposable element, transposon
AcknowledgementsWe thank our colleagues at the JGI for providing the reference genome,annotation, and expression data; Vimal Rawat (University of Zurich) fordiscussions; Valeria Gagliardini for help with ddPCR; and ChristofEichenberger, Arturo Bolaños, Daniela Guthörl, Anja Frey, and Peter Kopf(University of Zurich) for general laboratory support.
FundingWork on the M. polymorpha genome, conducted by the U.S. Departmentof Energy’s (DOE) Joint Genome Institute (JGI), a DOE Office of ScienceUser Facility, was supported by the Office of Science of the U.S. DOEunder contract DE-AC02-05CH11231. The work on tissue specific DNAmethylation was supported by the University of Zurich and, in part, bygrants from Swiss National Science Foundation and the EuropeanResearch Council to UG.
Availability of data and materialsShort reads were deposited at the NCBI Sequence Read Archive (SRA) andare available through accession number SRP101412 [46]. Transposableelement and repeat annotation generated during this study are availableonline [51].
Authors’ contributionsUG conceived and supervised the project. AGF performed theexperiments. MWS performed the bulk of the data analysis with somehelp from AGF. DS annotated transposons and repeats. MR and JLBprovided know-how and unpublished data. MWS and UG wrote themanuscript with input from the other authors. All authors read andapproved the final manuscript.
Ethics approval and consent to participateNot applicable.
Consent for publicationNot applicable.
Competing interestsThe authors declare that they have no competing interests.
Publisher's NoteSpringer Nature remains neutral with regard to jurisdictional claims in publishedmaps and institutional affiliations.
Schmid et al. Genome Biology (2018) 19:9 Page 15 of 17
Author details1Department of Plant and Microbial Biology and Zurich-Basel Plant ScienceCenter, University of Zurich, Zurich, Switzerland. 2Biological Sciences, MonashUniversity, Clayton, VIC, Australia.
Received: 11 August 2017 Accepted: 21 December 2017
References1. Schmid MW, Schmidt A, Grossniklaus U. The female gametophyte: An
emerging model for cell type-specific systems biology in plantdevelopment. Front Plant Sci. 2015;6:907.
2. Kawashima T, Berger F. Epigenetic reprogramming in plant sexualreproduction. Nat Rev Genet. 2014;15:613–24.
3. Kota SK, Feil R. Epigenetic transitions in germ cell development and meiosis.Dev Cell. 2010;19:675–86.
4. Hajkova P. Epigenetic reprogramming in the germline: Towards the groundstate of the epigenome. Philos T R Soc B. 2011;366:2266–73.
5. Grossniklaus U, Kelly WG, Ferguson-Smith AC, Pembrey M, Lindquist S.Transgenerational epigenetic inheritance: How important is it? Nat RevGenet. 2013;14:228–35.
6. Miska EA, Ferguson-Smith AC. Transgenerational inheritance: Models andmechanisms of non-DNA sequence-based inheritance. Science. 2016;354:59–63.
7. Bower FO. Origin of a land flora: A theory based on the facts of alternation.London: Macmillan, Co.; 1908.
8. Hauser M-T, Aufsatz W, Jonak C, Luschnig C. Transgenerational epigeneticinheritance in plants. Biochim Biophys Acta. 2011;1809:459–68.
9. Quadrana L, Colot V. Plant transgenerational epigenetics. Annu Rev Genet.2016;50:467–91.
10. She W, Baroux C. Chromatin dynamics during plant sexual reproduction.Front Plant Sci. 2014;5:354.
11. Jullien PE, Susaki D, Yelagandula R, Higashiyama T, Berger F. DNAmethylation dynamics during sexual reproduction in Arabidopsis thaliana.Curr Biol. 2012;22:1825–30.
12. Calarco JP, Borges F, Donoghue MTA, Van Ex F, Jullien PE, Lopes R, et al.Reprogramming of DNA methylation in pollen guides epigeneticinheritance via small RNA. Cell. 2012;151:194–205.
13. Ibarra CA, Feng X, Schoft VK, Hsieh T-F, Usawa R, Rodrigues JA, et al. ActiveDNA demethylation in plant companion cells reinforces transposonmethylation in gametes. Science. 2012;337:1360–4.
14. Park K, Kim MY, Vickers M, Park J-S, Hyun Y, Okamoto T, et al. DNAdemethylation is initiated in the central cells of Arabidopsis and rice. ProcNatl Acad Sci U S A. 2016;113:15138–43.
15. Ingouff M, Selles B, Michaud C, Vu TM, Berger F, Schorn AJ, et al. Live-cellanalysis of DNA methylation during sexual reproduction in Arabidopsisreveals context and sex-specific dynamics controlled by noncanonicalRdDM. Gene Dev. 2017;31:72–83.
16. Bouyer D, Kramdi A, Kassam M, Heese M, Schnittger A, Roudier F, et al. DNAmethylation dynamics during early plant life. Genome Biol. 2017;18:179.
17. Baroux C, Raissig MT, Grossniklaus U. Epigenetic regulation andreprogramming during gamete formation in plants. Curr Opin Genet Dev.2011;21:124–33.
18. Gutierrez-Marcos JF, Dickinson HG. Epigenetic reprogramming in plantreproductive lineages. Plant Cell Physiol. 2012;53:817–23.
19. Takuno S, Ran J-H, Gaut BS. Evolutionary patterns of genic DNA methylationvary across land plants. Nat Plants. 2016;2:15222.
20. Qiu Y, Li L, Wang B, Chen Z, Knoop V, Groth-Malonek M, et al. The deepestdivergences in land plants inferred from phylogenomic evidence. Proc NatlAcad Sci U S A. 2006;103:15511–6.
21. Bowman JL. Walkabout on the long branches of plant evolution. Curr OpinPlant Biol. 2013;16:70–7.
22. Bowman JL, Araki T, Kohchi T. Marchantia: Past, present and future. PlantCell Physiol. 2016;57:205–9.
23. Berger F, Bowman JL, Kohchi T. Marchantia. Curr Biol. 2016;26:R186–7.24. Ishizaki K, Nishihama R, Yamato KT, Kohchi T. Molecular genetic tools and
techniques for Marchantia polymorpha research. Plant Cell Physiol. 2016;57:262–70.
25. Bowman JL, Kohchi T, Yamato KT, Jenkins J, Shu S, et al. Insights into landplant evolution garnered from the Marchantia polymorpha genome. Cell.2017;171:287–304.
26. Hsieh TF, Ibarra CA, Silva P, Zemach A, Eshed-Williams L, Fischer RL, etal. Genome-wide demethylation of Arabidopsis endosperm. Science.2009;324:1451–4.
27. Zemach A, McDaniel IE, Silva P, Zilberman D. Genome-wide evolutionaryanalysis of eukaryotic DNA methylation. Science. 2010;328:916–9.
28. Waters AJ, Makarevitch I, Eichten SR, Swanson-Wagner RA, Yeh CT, Xu W, etal. Parent-of-origin effects on gene expression and DNA methylation in themaize endosperm. Plant Cell. 2011;23:4221–33.
29. Widman N, Feng S, Jacobsen SE, Pellegrini M. Epigenetic differencesbetween shoots and roots in Arabidopsis reveals tissue-specific regulation.Epigenetics. 2014;9:236–42.
30. Kawakatsu T, Stuart T, Valdes M, Breakfield N, Schmitz RJ, Nery JR, et al.Unique cell-type-specific patterns of DNA methylation in the root meristem.Nat Plants. 2016;2:16058.
31. Ahmed I, Sarazin A, Bowler C, Colot V, Quesneville H. Genome-wideevidence for local DNA methylation spreading from small RNA-targetedsequences in Arabidopsis. Nucleic Acids Res. 2011;39:6919–31.
32. Yamato KT, Ishizaki K, Fujisawa M, Okada S, Nakayama S, Fujishita M, et al.Gene organization of the liverwort Y chromosome reveals distinct sexchromosome evolution in a haploid system. Proc Natl Acad Sci U S A. 2007;104:6472–7.
33. Bartee L, Malagnac F, Bender J. Arabidopsis cmt3 chromomethylasemutations block non-CG methylation and silencing of an endogenousgene. Genes Dev. 2001;15:1753–8.
34. Lindroth AM, Cao X, Jackson JP, Zilberman D, McCallum CM, Henikoff S, etal. Requirement of CHROMOMETHYLASE3 for maintenance of CpXpGmethylation. Science. 2001;292:2077–80.
35. Shen X, De Jonge J, Forsberg SK, Pettersson ME, Sheng Z, Hennig L, et al.Natural CMT2 variation is associated with genome-wide methylationchanges and temperature seasonality. PLoS Genet. 2014;10:e1004842.
36. Dubin MJ, Zhang P, Meng D, Remigereau M-S, Osborne EJ, Casale FP, et al.DNA methylation in Arabidopsis has a genetic basis and shows evidence oflocal adaption. Elife. 2015;4:e05255.
37. Stroud H, Do T, Du J, Zhong X, Feng S, Johnson L, et al. Non-CGmethylation patterns shape the epigenetic landscape in Arabidopsis. NatStruct Mol Biol. 2014;21:64–72.
38. Bewick AJ, Schmitz RJ. Gene body DNA methylation in plants. Curr OpinPlant Biol. 2017;36:103–10.
39. Bewick AJ, Ji L, Niederhuth CE, Willing EM, Hofmeister BT, Shi X, et al. Onthe origin and evolutionary consequences of gene body methylation. ProcNatl Acad Sci U S A. 2016;113:9111–6.
40. Dangwal M, Kapoor S, Kapoor M. The PpCMT chromomethylase affects cellgrowth and interacts with the homolog of LIKE HETEROCHROMATINPROTEIN1 in the moss Physcomitrella patens. Plant J. 2014;77:589–603.
41. Gong Z, Morales-Ruiz T, Ariza RR, Roldan-Arjona T, David L, Zhu JK. ROS1, arepressor of transcriptional gene silencing in Arabidopsis, encodes a DNAglycosylase/lyase. Cell. 2001;111:803–14.
42. Zhu J, Kapoor A, Sridhar VV, Agius F, Zhu JK. The DNA glycosylase/lyaseROS1 functions in pruning DNA methylation patterns in Arabidopsis. CurrBiol. 2007;17:54–9.
43. Alexa A, Rahnenführer J, Lengauer T. Improved scoring of functional groupsfrom gene expression data by decorrelating GO graph structure.Bioinformatics. 2006;22:1600–7.
44. Zilberman D. An evolutionary case for functional gene body methylation inplants and animals. Genome Biol. 2017;18:87.
45. Flores-Sandoval E, Eklund DM, Bowman JL. A simple auxin transcriptionalresponse system regulates multiple morphogenetic processes in theliverwort Marchantia polymorpha. PLoS Genet. 2015;11:e1005207.
46. Schmid MW, Giraldo-Fonseca A, Rövekamp M, Smetanin D, Bowman JL,Grossniklaus U. Short read data from this study. Short Reads Archive.https://www.ncbi.nlm.nih.gov/sra/?term=SRP101412 .
47. Phytozome 11, The Plant Genomics Resource. https://phytozome.jgi.doe.gov/pz/portal.html.
48. Krueger F, Andrews SR. Bismark: A flexible aligner and methylation caller forbisulfite-seq applications. Bioinformatics. 2011;27:1571–2.
49. Langmead B, Salzberg SL. Fast gapped-read alignment with Bowtie 2. NatMethods. 2012;9:357–9.
50. Smit AFA, Hubley R. RepeatModeler Open-1.0. 2008–2015. http://www.repeatmasker.org/.
51. Smit AFA, Hubley R, Green P. RepeatMasker Open-4.0. 2013–2015. http://www.repeatmasker.org/.
Schmid et al. Genome Biology (2018) 19:9 Page 16 of 17
52. Schmid MW, Giraldo-Fonseca A, Rövekamp M, Smetanin D, Bowman JL,Grossniklaus U. Data from: Extensive epigenetic reprogramming during thelife cycle of Marchantia polymorpha. Zenodo. https://doi.org/10.5281/zenodo.1117842 .
53. R Core Team. R: A language and environment for statistical computing.Vienna, Austria: R Foundation for Statistical Computing; 2014. http://www.R-project.org/.
54. McCullagh P, Nelder JA. Generalized linear models. 2nd ed. London:Chapman & Hall; 1989.
55. Schmid MW. RNA-Seq data analysis protocol: Combining in-house andpublicly available data. In: Schmidt A, editor. Plant germline development:Methods and protocols. New York, NY: Springer New York; 2017. p. 309–35.
56. Saint-Marcoux D, Proust H, Dolan L, Langdale JA. Identification of referencegenes for real-time quantitative PCR experiments in the liverwortMarchantia polymorpha. PLoS One. 2015;10:e0118678.
57. Shimamura M. Marchantia polymorpha: Taxonomy, phylogeny andmorphology of a model system. Plant Cell Physiol. 2016;57:230–56.
• We accept pre-submission inquiries
• Our selector tool helps you to find the most relevant journal
• We provide round the clock customer support
• Convenient online submission
• Thorough peer review
• Inclusion in PubMed and all major indexing services
• Maximum visibility for your research
Submit your manuscript atwww.biomedcentral.com/submit
Submit your next manuscript to BioMed Central and we will help you at every step:
Schmid et al. Genome Biology (2018) 19:9 Page 17 of 17


![RESEARCH Open Access Epigenetic reprogramming of breast ...mouse blastocyst resulting in normal tissue derived from tumour cells in chimeric mice [9]. Tumorigenicity of metastatic](https://img.pdfslide.us/doc/110x75/5f8a9cf5f9b6054e73143744/research-open-access-epigenetic-reprogramming-of-breast-mouse-blastocyst-resulting.jpg)