Embed Size (px)
Citation preview
Purdue UniversityPurdue e-PubsInternational High Performance BuildingsConference School of Mechanical Engineering
2012
Extensive Comparative Analysis Of Two BuildingEnergy Simulation Codes For Southern EuropeClimates: Heating And Cooling Energy Needs andPeak Loads Calculation In TRNSYS AndEnergyPlusAndrea [email protected]
Giovanni Pernigotto
Follow this and additional works at: http://docs.lib.purdue.edu/ihpbc
This document has been made available through Purdue e-Pubs, a service of the Purdue University Libraries. Please contact [email protected] foradditional information.Complete proceedings may be acquired in print and on CD-ROM directly from the Ray W. Herrick Laboratories at https://engineering.purdue.edu/Herrick/Events/orderlit.html
Gasparella, Andrea and Pernigotto, Giovanni, "Extensive Comparative Analysis Of Two Building Energy Simulation Codes ForSouthern Europe Climates: Heating And Cooling Energy Needs and Peak Loads Calculation In TRNSYS And EnergyPlus" (2012).International High Performance Buildings Conference. Paper 89.http://docs.lib.purdue.edu/ihpbc/89
3556, Page 1
International High Performance Buildings Conference at Purdue, July 16-19, 2012
Extensive Comparative Analysis Of Two Building Energy Simulation Codes
For Southern Europe Climates: Heating And Cooling Energy Needs and Peak Loads
Calculation In TRNSYS And EnergyPlus
Andrea GASPARELLA
2, Giovanni PERNIGOTTO
1*
1University of Padova, Dept. of Management and Engineering, Vicenza, Italy
Phone +39 +39 0444 998753, Fax +39 0444 998889, [email protected]
2Free University of Bolzano, Faculty of Science and Technology, Bolzano, Italy
Phone +39 0471 017200, Fax +39 0471 017009, [email protected]
* Corresponding Author
ABSTRACT
In order to evaluate the energy performance of buildings, both in heating and in cooling periods, the simulation
codes can be used. Moreover, in accordance with the technical Standard EN ISO 13790:2008, the simulation codes
can be employed for refining the steady-state methods, and particularly the utilization factors estimations, in
accordance with the procedure proposed.
As the various simulation codes implement different capabilities and refer to different mathematical models and
calculation assumptions, the necessary validation steps which are used for diagnostic purposes are not enough to
ensure the agreement of the results over a wider range of configurations and conditions. The main dynamic
simulation codes have been generally evaluated according to the Standard ANSI/ASHRAE 140:2007 (BESTEST).
By this approach the user can choose a software among those successfully tested, giving acceptable deviations
between the computed output and the reference values for a selected number of reference buildings defined in the
Standard. However the number of those reference building configurations is limited and the considered features are
not representative of the common building stock present for instance in Southern Europe. Moreover, as those
configurations were selected for diagnostic purposes, they are expected to produce unacceptable biasing when
considered with statistical approaches in order to improve the quasi steady state approaches as the one proposed in
the technical standard EN ISO 13790:2008.
In this work a procedure to identify the main causes of deviation has been developed and has been applied to two
well-known dynamic simulation software: TRNSYS (version 16.1) and EnergyPlus (version 7). The approach is
based on a factorial plan of comparison aimed to investigate the main variables related to the envelope of the
building and its behavior: variations in geometry and boundary conditions (dimensions and orientation of the
glazing, amount of dispersing surface) envelope characteristics (walls insulation and heat capacity, insulation and
solar transmittance of glazings) internal gains. From the combination of the values of the above variables, more than
1600 different configurations have been obtained for two Italian climatic conditions, each of which providing
monthly values for heating and cooling needs and for heating and cooling peak loads.
Thanks to the large number of configurations, the monthly heating and cooling energy needs and peak loads have
been analysed with inferential statistics, which allowed to evaluate the agreement between the outputs and to
characterize the weight of the different variables in causing the deviations found.
1. INTRODUCTION
A strong recourse to building simulation codes has allowed the definition, tuning and revision of different simplified
methods (van Dijk and Arkesteijn, 1987), among which the quasi-steady state approach of the standard EN ISO
3556, Page 2
International High Performance Buildings Conference at Purdue, July 16-19, 2012
13790:2008 that is used in the calculation of energy performance of buildings for energy labelling and certification.
Even if some of the most widespread ones, such as HVACSIM+, TRNSYS, EnergyPlus and its precursors BLAST
and DOE2, implement quite similar approaches, in particular for the calculation of the dynamic behaviour of the
opaque envelope, there is no certainty of a convergence of the results over a wide range of configurations. Often
small details regarding the implemented components and algorithms or different approaches in the definition of the
boundary conditions, of the buildings and plants configuration and in the management of the output can make the
difference. Moreover, it is of capital importance that the degrees of freedom allowed for the user´s choices are
correctly used in order to avoid large discrepancies between the results which would lead to misleading outcomes.
Starting from the early works in the ´80s which indicated the need for validation methodologies, many efforts have
been done in order to improve the agreement and accuracy of software tools. Describing the results of validation
activities at the Solar Energy Research Institute (now National Renewable Energy Laboratory), Judkoff (1988)
introduced a three step approach based on analytical verification (validation against simple analytical test cases),
empirical verification (comparison to the available data of empirical cases) and code-to-code comparison (evaluation
of several different codes with different thermal solution approaches in a variety of representative cases). He gave
also some indication on the empirical validation tests performed by the Solar Energy Research Institute in
cooperation with the International Energy Agency and other partners.
Analyzing the validation procedure defined within the PASSYS Project of the European Commission DGXII for
Science Research and Development of the European Commission, Jensen (1995) described a validation
methodology which adds to a whole model validation approach (comprising the three steps of sensitivity analysis,
empirical validation and comparative validation) a parallel validation of each single process or element of the model.
Describing the PASSYS whole model empirical validation, he emphasized the importance of parametric sensitivity
statistical analysis and residual statistical analysis when comparing results from different sources, such as the
different statistical sensitivity analysis techniques considered by Lomas and Eppel (1992).
As regards the comparative approaches, the Department of Energy (DOE), by means of the National Renewable
Energy Laboratory (NREL), the IEA and the American Society of Heating, Refrigerating and Air-Conditioning
Engineers (ASHRAE) have been cooperating in order to develop standard methods of test (validation and diagnosis)
for computer software.
Those procedures, called BESTEST, were developed under IEA Tasks 8, 12, 22 and 34. ASHRAE recently
published the updated ANSI/ASHRAE Standard 140-2007 Standard Method of Test for the Evaluation of Building
Energy Analysis Computer Programs, which parallels many of the tests in the first IEA BESTEST.
The BESTEST is a whole model comparison validation method with a marked diagnostic worth. The BESTEST
procedure requires to evaluate the simulation code on some building configurations of different and increasing detail
and complexity. Different BESTEST configurations have been developed to evaluate the envelope simulation, the
ground contact cases and the HVAC plants, as synthesized by Judkoff and Neymark (2008). Acceptability ranges for
the results are supplied. In particular the envelope BESTEST considers a specific reference climate and is based on
the evaluation of the seasonal energy requirement and peak loads.
In the present paper two well known simulation codes, TRNSYS and EnergyPlus, both evaluated according to the
BESTEST approach in particular as regards the envelope (Bradley et al., 2004, Henninger and Wittel, 2010), have
been compared over a wide range of configurations of a building module composed by a single-storey thermal zone
with 100 m2 floor area. A parametric approach has been assumed in order to extend the range of configurations in
which the two programs are compared. On one hand this complements the BESTEST validation process with a kind
of sensitivity analysis over a larger number of conditions. On the other hand it gives very important information
about the reliability of the results obtained with any of the considered simulation codes when used for energy
certification of buildings on an extended field of applications or when tuning the simplified or quasi steady state
approaches such as the one proposed by the technical standards by means of those simulation codes.
Some possible causes of differences such as the thermal exchange of envelope elements in touch with the ground
were neglected. Some alternative or control parameters under the user´s choice, as the one considered by the
different models for managing the external long wave radiation exchange towards the sky vault, have been assumed
in a coherent way. All the possible causes of disagreement originated by the algorithms and by the models applied
by the two software and not directly and completely under the user´s control were left in accordance with the
software default options.
The effects of 7 variables (amount of surface exposed to the external conditions, opaque envelope base material,
level of insulation, windows orientation, windows area, kind of glazing, presence of internal gains) on determining
the differences between the two simulation codes were considered. The set of variables investigated is different from
the one analysed in a previous work (Gasparella and Pernigotto, 2012). The shape of the floor and the distribution of
the windows on different walls did not show significant impact and have been substituted by the amount of exposed

3556, Page 3
International High Performance Buildings Conference at Purdue, July 16-19, 2012
surface (by using partly adiabatic envelope) and by the kind of glazings. The windows are now disposed on a single
orientation. Moreover, three different base materials for the opaque envelope have been considered in the analysis in
with different heat capacity and various levels of internal gain have been added, also with a radiant quote.
From the combination of the values of the variables, 1620 different configurations have been obtained, each of
which providing 12 monthly values for heating and cooling needs and for heating and cooling peaks for each of the
two considered climatic conditions (Milan and Messina). Thanks to this large number, the results have been
analysed with inferential statistical approaches, which allowed to evaluate the agreement between the outputs and to
characterize the weight of the different variables on the deviations found.
Version 16.1 and version 7 have been considered respectively for TRNSYS and EnergyPlus as they do not differ
significantly from those validated in the references and in the meantime are quite aligned each other.
2. REFERENCE BUILDING MODULE AND SET OF CONFIGURATIONS
The set of configurations required in the comparative analysis are variations on a reference building, a single-storey
module with 100 m2 of floor area.
The whole opaque envelope is composed by a two layers structure. The internal layer is made of one of the 3
considered base materials (timber, clay block or concrete) with a thickness chosen to give always the same thermal
resistance of 0.8 m2 K W
-1 as 0.2 m of clay block.
An insulation layer, whose thickness has been varied in accordance with the established simulation plan is applied
on the external side. The thermophysical characteristics of the materials used are reported in Table 1.
The external solar absorptances of the walls and for the roof (when not adiabatic) are respectively 0.3 and 0.6 while
the internal one is 0.3 for both. The floor external absorptance is 0 when exposed to the external ambient (i.e., the
solar radiation component on this surface is equal to zero) and the internal one is 0.6.
The windows are considered as positioned on a unique vertical wall and orientation, in order to emphasize the
consequences of the solar radiation distribution during the day. The wall opposed to the windows is assumed to be
adiabatic. The window frame is metallic without thermal break (Uf = 3.2 W m-2
K-1
) with a frame area covering
about the 20% of the whole window area.
For the ventilation, a constant rate of 0.3 ach/h of outside air has been imposed, in accordance to what the Italian
standard UNI/TS 11300-1 prescribes for residential buildings.
To define the different cases, the following variables (factors) of interest have been selected:
1. the amount of surface exposed to the external conditions (expressed by the ratio between the surface itself
and the volume)
2. the base material of the opaque envelope (the material of the internal layer)
3. the level of insulation added to the internal layer
4. the percentage ratio of glazings Agl to floor area Af
5. the orientation of the windowed wall
6. the kind of glazings
7. the presence of internal gains
8. the climatic conditions
For each of the above factor, a certain number of alternatives (levels), were considered as reported in Table 2.
The factor 1 (amount of exposed surface) permits to consider buildings with different exposed surface but equal
volumes and the presence of adiabatic components (3 combinations).
The variables 2 and 3 (base material and insulation level) allow to consider the different thermal dynamic behavior
of the opaque envelope (9 combinations).
The factors 4, 5 and 6 (window percentage area, window orientation and kind of glazings) allow to examine the
effect of window insulation and solar control properties under different solar radiation profile (30 combinations).
The variables 7 (internal gains) permits to analyze the presence of internal partially radiant loads (2 combinations).
Table 1: Opaque Envelope thermal properties
Timber Clay block Concrete
Thermal Conductivity (W m-1
K-1
) 0.13 0.25 0.37
Density (kg m-3
) 399 893 1190
Specific heat (J kg-1
K-1
) 1880 840 840

3556, Page 4
International High Performance Buildings Conference at Purdue, July 16-19, 2012
Table 2: Variables (factors) and alternatives (levels) in the simulation plan.
1) Exposed surface
ratio
a one wall, the floor and the ceiling adiabatic; S/V=0.30
b one wall and the floor adiabatic; S/V=0.63
c one wall adiabatic; S/V=0.97
2) Base material for
the internal layer
a Timber 0.10 m – R = 0.8 m2 K W
-1; area specific heat capacity 75 kJ m
-2 K
-1
b Clayblock 0.20 m – R = 0.8 m2 K W
-1; area specific heat capacity 150 kJ m
2 K
-1
c Concrete 0.30 m – R = 0.8 m2 K W
-1; area specific heat capacity 300 kJ m
2 K
-1
3) Insulation
thickness
a 5 cm – U = 0.45 W m-2
K-1
b 10 cm – U = 0.29 W m-2
K-1
c 15 cm – U = 0.21 W m-2
K-1
4) Ratio Agl/Af a 11.7%
b 23.4%
5) Orientation of Agl a East
b South
c West
6) Kind of glazing a (S) single glass 5 cm – Ugl = 5.68 W m-2
K-1
SHGC = 0.855
b (DH) double glazing high solar transmittance – Ugl = 1.140 W m-2
K-1
, SHGC = 0.608
c (DL) double glazing low solar transmittance – Ugl = 1.099 W m-2
K-1
, SHGC = 0.352
d (TH) triple glazing high solar transmittance – Ugl = 0.613 W m-2
K-1
, SHGC = 0.575
e (TL) triple glazing low solar transmittance – Ugl = 0.602 W m-2
K-1
, SHGC = 0.343
7) Internal gains a 0 W m-2
of floor surface
c 4 W m-2
of floor surface (50% by convection and 50% by radiation)
8) Climatic
conditions
a Messina – HDD20: 707 K d
c Milan – HDD20: 2404 K d
The variable 8 (climatic conditions) allows to evaluate the effect of different temperature and radiation climatic
conditions over an extremely differentiated sample of Italian climates (2 combinations).
3. ASSUMPTIONS FOR THE SIMULATION
In order to carry on the comparison between the two simulation software the input data and the calculation
hypotheses should be coherently defined. This has been pursued with regard to the outside surface exchanges, to the
inside surface exchanges and selecting the appropriate models for the conduction heat exchanges within the
envelope components, as described below.
The air heat balance approach implemented by both codes:
dτ
dθCΦΦΦΦ i
isysicvic, (1)
The wall conduction term Фc,i is determined by imposing the surface heat balance equations on the external and on
the internal surfaces, which per unit of area are expressed as:
0qqqq ot,oc,oIR,osol, (2)
0qqqqqq it,ic,ilwriIR,iswrisol, (3)
Some of the terms showed in the balances can be estimated in different ways. The main aspects are summarised in
the following paragraphs.
3.1 External surface exchanges
3.1.1 Climatic conditions and solar radiation on the horizontal and on tilted surfaces: in accordance with the aims of
this study, it was decided to rebuild hourly profiles compatible with the mean monthly data reported in the Italian
3556, Page 5
International High Performance Buildings Conference at Purdue, July 16-19, 2012
standard UNI 10349 (Ente Nazionale di Unificazione UNI, 1994) using the TRNSYS subroutine Type 54.
The Type 54 allows to generate hourly weather data for a whole year in a chosen location from the monthly average
values of global horizontal solar radiation, temperature, humidity and, in case, wind speed (neglected in this work).
The subroutine allows to split the horizontal radiation into the direct and diffuse components in accordance with
Erbs´ algorithm (Erbs et al., 1982).
The Perez algorithm (Perez et al., 1990) implemented in EnergyPlus has been selected in this study to evaluate the
radiation on tilted surfaces. An albedo coefficient of 0.2 has been considered. The elaborated profiles of dry and dew
temperature, relative humidity, global, direct and diffuse radiation on a horizontal surface and on the principal
orientations for vertical surfaces have been used as input to EnergyPlus and TRNSYS.
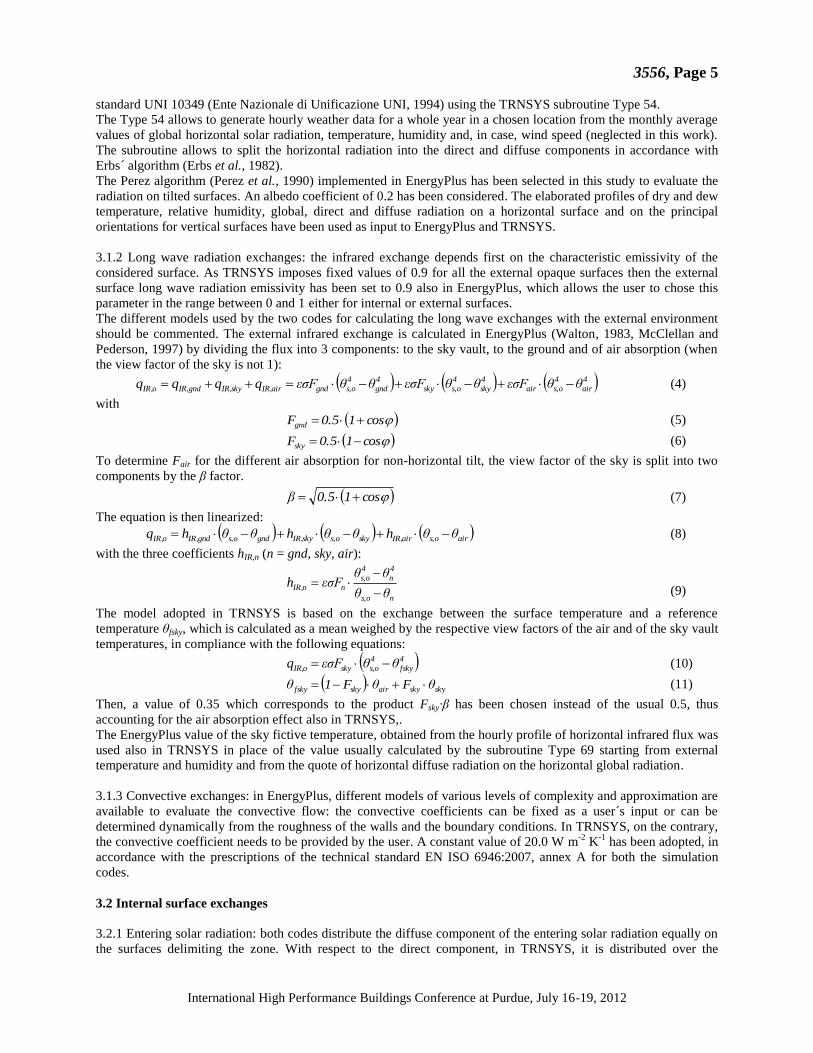
3.1.2 Long wave radiation exchanges: the infrared exchange depends first on the characteristic emissivity of the
considered surface. As TRNSYS imposes fixed values of 0.9 for all the external opaque surfaces then the external
surface long wave radiation emissivity has been set to 0.9 also in EnergyPlus, which allows the user to chose this
parameter in the range between 0 and 1 either for internal or external surfaces.
The different models used by the two codes for calculating the long wave exchanges with the external environment
should be commented. The external infrared exchange is calculated in EnergyPlus (Walton, 1983, McClellan and
Pederson, 1997) by dividing the flux into 3 components: to the sky vault, to the ground and of air absorption (when
the view factor of the sky is not 1):
4
air
4
os,air
4
sky
4
os,sky
4
gnd
4
os,gndairIR,skyIR,gndIR,oIR, θθεσFθθεσFθθεσFqqqq (4)
with
cos10.5Fgnd (5)
cos10.5Fsky (6)
To determine Fair for the different air absorption for non-horizontal tilt, the view factor of the sky is split into two
components by the β factor.
cos10.5β (7)
The equation is then linearized:
airos,airIR,skyos,skyIR,gndos,gndIR,oIR, θθhθθhθθhq (8)
with the three coefficients hIR,n (n = gnd, sky, air):
nos,
4
n
4
os,
nnIR,θθ
θθεσFh
(9)
The model adopted in TRNSYS is based on the exchange between the surface temperature and a reference
temperature θfsky, which is calculated as a mean weighed by the respective view factors of the air and of the sky vault
temperatures, in compliance with the following equations:
4
fsky
4
os,skyoIR, θθεσFq (10)
yskskyairskyfsky θFθF1θ (11)
Then, a value of 0.35 which corresponds to the product Fsky∙β has been chosen instead of the usual 0.5, thus
accounting for the air absorption effect also in TRNSYS,.
The EnergyPlus value of the sky fictive temperature, obtained from the hourly profile of horizontal infrared flux was
used also in TRNSYS in place of the value usually calculated by the subroutine Type 69 starting from external
temperature and humidity and from the quote of horizontal diffuse radiation on the horizontal global radiation.
3.1.3 Convective exchanges: in EnergyPlus, different models of various levels of complexity and approximation are
available to evaluate the convective flow: the convective coefficients can be fixed as a user´s input or can be
determined dynamically from the roughness of the walls and the boundary conditions. In TRNSYS, on the contrary,
the convective coefficient needs to be provided by the user. A constant value of 20.0 W m-2
K-1
has been adopted, in
accordance with the prescriptions of the technical standard EN ISO 6946:2007, annex A for both the simulation
codes.
3.2 Internal surface exchanges
3.2.1 Entering solar radiation: both codes distribute the diffuse component of the entering solar radiation equally on
the surfaces delimiting the zone. With respect to the direct component, in TRNSYS, it is distributed over the

3556, Page 6
International High Performance Buildings Conference at Purdue, July 16-19, 2012
different surfaces by a proper fraction called geosurf which is defined by the user for each surface. In EnergyPlus,
more detailed algorithms consider also the reflections of the direct radiation entering into the zone.
A compromise between these two approaches has been to adopt in EnergyPlus the FullExterior choice, which
establishes that all the direct radiation transmitted falls on the floor and possible reflections are added to the diffuse
components, and, in TRNSYS to set the geosurf to 1 for the floor and to 0 for the remaining walls.
3.2.2 Long wave radiation: in TRNSYS 16.1 the calculations are based on Seem’s star-network algorithm (1987),
which parallels the radiative and convective exchanges from each internal surface in a single heat flux towards a
fictive temperature node θstar. In turn, the fictive node exchanges with the air of the zone through a suitable thermal
resistance a thermal power equivalent to the sum of the convective exchanges at the internal surface. As regards the
long wave radiation, TRNSYS assumes the internal surfaces as black.
In contrast, EnergyPlus implements a detailed algorithm based on the view factor calculations between the surfaces,
considered as grey (Hottel and Sarofim, 2007), for which an internal long wave radiation emissivity of 0.999 has
been chosen.
3.2.3 Convective exchanges: constant values were assumed also for the internal convection heat transfer coefficient.
In accordance with the prescriptions of the EN ISO 6946:2007, appendix A, the selected values are 5.0 W m-2
K-1
for vertical ascending flux, 0.7 W m-2
K-1
for vertical descending and 2.5 W m-2
K-1
for horizontal flux.
3.3 Conduction thermal flow in the opaque envelope components
Among the 4 possible models offered by EnergyPlus to calculate the thermal flux transmitted through the opaque
envelope, the transfer functions model TFM was selected to compare with the equivalent method used by TRNSYS.
It should be said that the two TFM models implemented are different: TRNSYS refers to the Direct Root Finding
(DRF) model while EnergyPlus applies the State-Space Method (SS).
As is known, the TFM method is based on the evaluation of a time series of terms which depend on the boundary
conditions and on the solution calculated for the previous period of time. The coefficients of the series are calculated
on a reference period of time that is called wall timebase. Following the ASHRAE suggestions for stability reasons,
a wall timebase of 1 hour have been selected for the kind of walls considered in this study. In EnergyPlus, instead, a
wall timebase equal to the simulation time step is always assumed (10 minutes is suggested). The simulation time
step proposed by EnergyPlus has been used for both simulation codes.
4. RESULTS
The differences between the monthly energy needs obtained with EnergyPlus and with TRNSYS have been plotted
against the energy needs calculated with TRNSYS (Figure 1). The heating and cooling results are plotted
respectively only for Milan and Messina, as the general trends are the same, even if for different the values. In
particular the maximum heating energy need in Messina is only 7.2 GJ while in Milan it is 17.6 GJ, and the
maximum cooling energy need in Milan is 6.6 GJ while in Messina it is 7.5 GJ.
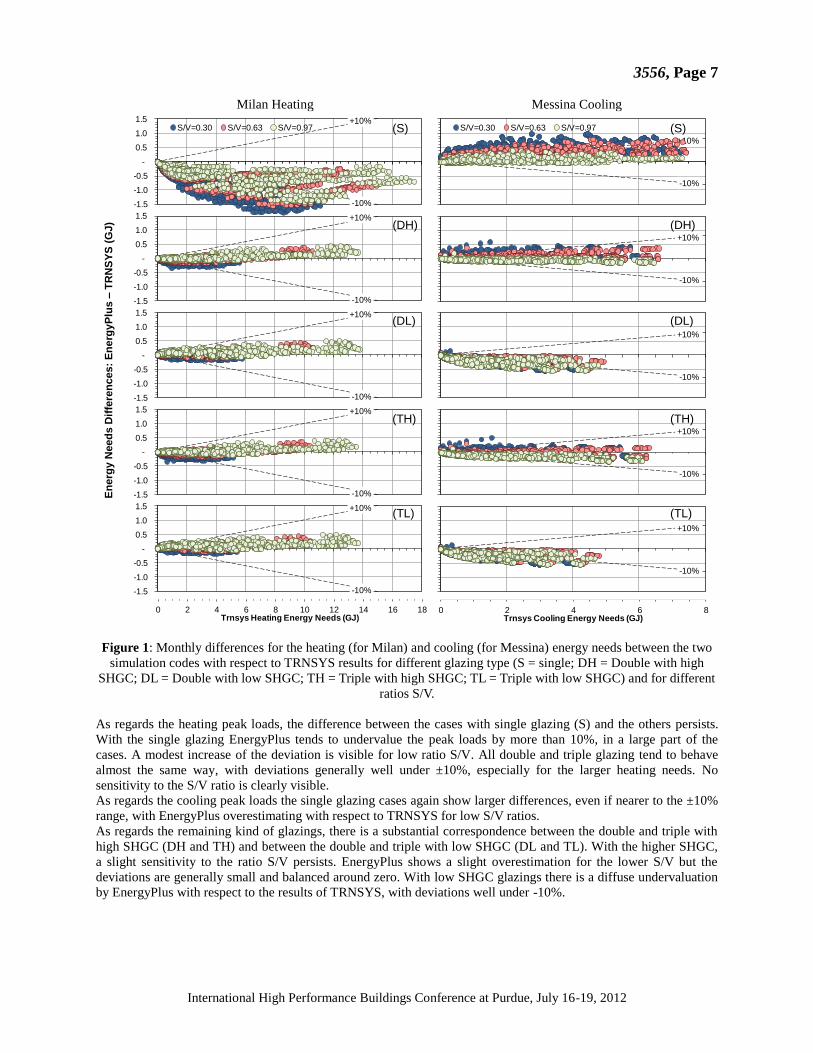
As regards the heating energy needs, there is an important difference between the cases with single glazing (S) and
the others. Whereas with the single glazing EnergyPlus tends to undervalue the needs in many cases by more than
10%, increasing the deviations for low ratio S/V, all double and triple glazings tend to behave almost the same way.
For all those glazings the deviations are generally well under ±10%, especially for the larger heating needs. Low
S/V ratios in those cases tend to lead to negative deviations for heating needs under 6 GJ.
As regards the cooling energy needs the single glazing cases again show the most important differences (but nearer
to the ±10% range), with EnergyPlus overestimating with respect to TRNSYS, especially for low S/V ratios.
As concerns the remaining kind of glazings, there is a substantial correspondence between the double and triple with
high SHGC (DH and TH) and between the double and triple with low SHGC (DL and TL). While with the higher
SHGC, results are still sensitive to the ratio S/V, EnergyPlus showing a slight underestimation for the highest S/V,
with low SHGC glazings there is a uniform undervaluation by EnergyPlus with respect to TRNSYS, with deviations
even under -10%.
The differences between the monthly peak loads obtained with EnergyPlus and with TRNSYS have been plotted
against the peak loads calculated with TRNSYS (Figure 2).
Again the heating and cooling results are plotted respectively only for Milan and Messina, as the general
consideration are the same. In particular the maximum heating peak load in Messina is only 7.6 kW while in Milan
it is 11 kW, and the maximum cooling peak load in Milan is 10.5 kW while in Messina it is 11.1 kW.
3556, Page 7
International High Performance Buildings Conference at Purdue, July 16-19, 2012
En
erg
y N
eed
s D
iffe
ren
ces:
En
erg
yP
lus –
TR
NS
YS
(G
J)
Milan Heating
Messina Cooling
Figure 1: Monthly differences for the heating (for Milan) and cooling (for Messina) energy needs between the two
simulation codes with respect to TRNSYS results for different glazing type (S = single; DH = Double with high
SHGC; DL = Double with low SHGC; TH = Triple with high SHGC; TL = Triple with low SHGC) and for different
ratios S/V.
As regards the heating peak loads, the difference between the cases with single glazing (S) and the others persists.
With the single glazing EnergyPlus tends to undervalue the peak loads by more than 10%, in a large part of the
cases. A modest increase of the deviation is visible for low ratio S/V. All double and triple glazing tend to behave
almost the same way, with deviations generally well under ±10%, especially for the larger heating needs. No
sensitivity to the S/V ratio is clearly visible.
As regards the cooling peak loads the single glazing cases again show larger differences, even if nearer to the ±10%
range, with EnergyPlus overestimating with respect to TRNSYS for low S/V ratios.
As regards the remaining kind of glazings, there is a substantial correspondence between the double and triple with
high SHGC (DH and TH) and between the double and triple with low SHGC (DL and TL). With the higher SHGC,
a slight sensitivity to the ratio S/V persists. EnergyPlus shows a slight overestimation for the lower S/V but the
deviations are generally small and balanced around zero. With low SHGC glazings there is a diffuse undervaluation
by EnergyPlus with respect to the results of TRNSYS, with deviations well under -10%.
-10%
+10%
-1.5
-1.0
-0.5
-
0.5
1.0
1.5
0 2 4 6 8 10 12 14 16 18Trnsys Heating Energy Needs (GJ)
-10%
+10%
-1.5
-1.0
-0.5
-
0.5
1.0
1.5
-10%
+10%
-1.5
-1.0
-0.5
-
0.5
1.0
1.5
-10%
+10%
-1.5
-1.0
-0.5
-
0.5
1.0
1.5
-10%
+10%
-1.5
-1.0
-0.5
-
0.5
1.0
1.5
S/V=0.30 S/V=0.63 S/V=0.97
-10%
+10%
-1.5
-1.0
-0.5
-
0.5
1.0
1.5
0 2 4 6 8Trnsys Cooling Energy Needs (GJ)
-10%
+10%
-1.5
-1.0
-0.5
-
0.5
1.0
1.5
-10%
+10%
-1.5
-1.0
-0.5
-
0.5
1.0
1.5
-10%
+10%
-1.5
-1.0
-0.5
-
0.5
1.0
1.5
-10%
+10%
-1.5
-1.0
-0.5
-
0.5
1.0
1.5
S/V=0.30 S/V=0.63 S/V=0.97(S)
(DH)
(DL)
(TH)
(TL)
(S)
(DH)
(DL)
(TH)
(TL)

3556, Page 8
International High Performance Buildings Conference at Purdue, July 16-19, 2012
Peak L
oad
Dif
fere
nc
es:
En
erg
yP
lus –
TR
NS
YS
(kW
) Milan Heating
Messina Cooling
Figure 2: Monthly differences for the heating (for Milan) and cooling (for Messina) peak loads between the two
simulation codes with respect to TRNSYS results for different glazing type (S = single; DH = Double with high
SHGC; DL = Double with low SHGC; TH = Triple with high SHGC; TL = Triple with low SHGC) and for different
ratios S/V.
5. STATISTICAL ANALYSIS AND CONCLUSIONS
A statistical analysis of the deviations between the two software has been performed. This technique allowed us to
confirm the findings of the descriptive statistics and to evaluate the weight of each variable in introducing the
differences. The inferential statistical technique applied is the multivariate linear regression with a confidence level
of 95% and the variables considered in the regression model have been selected through the stepwise algorithm.
For the deviations of heating and cooling energy needs, the examined variables are the following:
1. The opaque envelope thermal properties: the area weighed mean thermal transmittance of the opaque
components Uenv [W m-2
K-1
], periodic thermal transmittance Yie,env [W m-2
K-1
] and timeshift Δtie,env [h]; and
the product of the total opaque envelope area multiplied by its internal heat capacity Δκi∙Atot [kJ K
-1] ,
determined in accordance with the EN ISO 13786:2007 detailed approach; 2. The transparent envelope thermal properties: the thermal transmittance of the windows Uwin [W m
-2 K
-1]
and the solar heat gain coefficient SHGC [-];
3. The envelope areas: the external-exposed opaque envelope area Aenv [m2] and the windows area Awin [m
2];
0 2 4 6 8 10 12Trnsys Heating Peak Loads (kW)
+10%
-10%
-2
-1
-
1
2 S/V=0.30 S/V=0.63 S/V=0.97
+10%
-10%
-2
-1
-
1
2
+10%
-10%
-2
-1
-
1
2
+10%
-10%
-2
-1
-
1
2
+10%
-10%
-2
-1
-
1
2
0 2 4 6 8 10 12Trnsys Cooling Peak Loads (kW)
+10%
-10%
-2
-1
-
1
2 S/V=0.30 S/V=0.63 S/V=0.97
+10%
-10%
-2
-1
-
1
2
+10%
-10%
-2
-1
-
1
2
+10%
-10%
-2
-1
-
1
2
+10%
-10%
-2
-1
-
1
2
(S)
(DH)
(DL)
(TH)
(TL)
(S)
(DH)
(DL)
(TH)
(TL)

3556, Page 9
International High Performance Buildings Conference at Purdue, July 16-19, 2012
4. The boundary conditions: the total solar radiation received by the opaque envelope Henv and the windows
Hwin [MJ] per month; the mean monthly external temperature θair [°C]; the internal gains qi [W m-2
].
For the deviations of heating and cooling peaks, the considered variables are the same with the exception of the
boundary conditions:
1. for the heating peaks deviations, instead of the mean value, the outdoor temperature monthly minimum has
been considered θair, min [°C] and the solar gains have been completely neglected;
2. for the cooling peaks deviations, in place of the total radiation received, two variables have been selected:
the monthly horizontal solar radiation for the location examined Hhor [MJ m-2
] and the monthly peak of the
2-days rolling cumulated solar radiation incident on the windows [MJ].
In this analysis only the main factors have been considered, neglecting the interactions between them. The
regression models found after the statistical analysis have been reported in Table 3, for the heating and the cooling
deviations respectively. Those models have not a predictive aim, so getting the largest value of the determination
coefficient R2adj was not the main goal and only the standardized coefficients have been reported. The weight of each
different variable can be related to the respective standardized coefficient, which is the product of non standardized
coefficient and ratio between the standard deviations of the independent variable and that of the dependent one. The
larger the standardized coefficient, the larger is the relative impact of both the variability and the correlation of the
independent variable on the dependent one.
The statistical models, although adding further details, allow to confirm what described in the results:
As regards the heating needs deviations, the most influent factors are the windows thermal transmittance,
whose standardized coefficient is negative (probably explaining the behavior of the single glazing shown in
Figure 1), the opaque envelope area (which is directly related to the S/V ratio) and the transparent envelope
one. Other significant parameters are related to the environmental conditions (the incident radiation and the
external temperature) and the SHGC.
In the cooling needs deviations model the main variables are the SHGC, the opaque envelope area, its
thermal transmittance and that of the windows. In general, the environmental conditions appear to be not so
relevant for both models, while the windows properties and secondly the opaque areas (and so the S/V
ratio) are significant for describing the deviations variability. This confirms what was already seen in
Figure 1.
Referring to the peak loads analysis, in the heating context the main factor is again the windows thermal
transmittance - the higher, the lower are the deviations (probably explaining the single glazings behavior in
Figure 2), followed by the opaque envelope and the windows area. This last one has a negative correlations,
similarly to the windows thermal transmittance while the former have a positive correlation (in agreement
with the effect of the S/V in Figure 2).
For the cooling peak loads, the main factor is the SHGC, with a strong positive correlation with the cooling
peak loads, followed by the windows and the opaque envelope areas, the windows thermal transmittance
and the 2-days rolling cumulated solar radiation incident on the windows. The peak loads regressions
confirm what observed in Figure 2: the main variables affecting the deviations are those related to the
windows behavior, followed by the S/V ratios.
Table 3: Regression model for the deviation of the heating energy needs (in MJ)
Heating needs deviations Cooling needs deviations Heating peaks deviations Cooling peaks deviations
R2adj=0.617 R
2adj=0.541 R
2adj=0.736 R
2adj=0.591
Uwin -0.592 SHGC 0.574 Uwin -0.798 SHGC 0.794
θair 0.168 Aenv -0.237 Aenv 0.192 -0.350
Aenv 0.216 Uenv 0.233 Awin -0.174 Awin 0.216
Awin -0.223 θair -0.062 Uenv 0.057 Aenv -0.115
Hwin 0.173 Uwin 0.121 qi -0.041 Hhor -0.097
SHGC -0.148 qi 0.058 θair, min -0.035 Uwin -0.137
Henv 0.106 Yie,env -0.075 Δtie,env -0.022 Uenv 0.106
Uenv 0.036 Henv 0.063 Δtie,env -0.080
Δκi∙Atot 0.027 Hwin -0.109 qi 0.054
qi -0.016 Awin 0.098 θair -0.150

3556, Page 10
International High Performance Buildings Conference at Purdue, July 16-19, 2012
NOMENCLATURE
Symbols Subscripts
A surface area (m2) IR surface long wave radiation
C heat capacity (J kg-1
K-1
) air air absorption or external air node
h surface heat transfer coefficient (W m-2
K-1
) c convective
F radiation view factor f floor
HDD20 heating degree days with ref. to 20 °C (K d) fsky fictive sky vault q specific thermal flux (W m
-2) gnd ground
U thermal transmittance (W m-2
K-1
) i internal side (surface) or internal air node
Ф thermal power (W) ic internal gain convective component
β sky view factor splitting coefficient ilwr internal gain long wave radiation
ε long wave radiation wall emissivity iswr internal gain short wave radiation
θ absolute temperature (K) o external side (wall surface)
σ Stefan-Boltzmann constant: 5.67 10-8
(W m-2
K-4
) s Surface
φ tilt angle of the wall with the horizontal (rad) sky sky vault
sol solar radiation
star fictive Seem´s star network model
sys heating/cooling system
t wall transmission
v ventilation and/or infiltration
win Window
REFERENCES
Bradley, D.E., Kummert, M., McDowell, T.P., 2004, Experiences with and interpretation of standard test methods of
building energy analysis tools, in Proceedings of IBPSA-Canada Bi-Annual Conference eSIM, Vancouver,
Canada, 10th
-11th
June.
Erbs, D.G., Klein S.A., Duffie, J.A., 1982, Estimation of the diffuse radiation fraction of hourly, daily, and monthly-
average global radiation, Sol. Energy, vol. 28: p. 293-302.
Henninger, R.H., Witte, M.J., 2010, Energyplus testing with building thermal envelope and fabric load tests from
ANSI/ASHRAE Standard 140-2007, U.S. Department of Energy Energy Efficiency and Renewable Energy
Office of Building Technologies Washington, D.C.
Hottel, H.C., Sarofim, A.F., 2007, Radiative Transfer, McGraw-Hill, New York.
Jensen, S.O., 1995, Validation of building energy simulation programs: a methodology, Energy Build., vol. 22: p.
133-144.
Judkoff, R., Neymark, J., 2008, Testing and validation of building energy simulation tools, IEA SHC Task 34/IEA
ECBCS Annex 43.
Judkoff, R.D., 1988, Validation of building energy analysis simulation programs at the solar energy research
institute, Energy Build., vol. 10: p. 221-239.
Lomas, K.J., Eppel, H., 1992, Sensitivity analysis techniques for building thermal simulation programs, Energy
Build., vol. 19: p. 21-44.
McClellan, T.M., Pedersen, C.O., 1997, Investigation of Outside Heat Balance Models for Use in a Heat Balance
Cooling Load Calculation, ASHRAE Trans., vol. 103, no. 2: p. 469-484.
Neymark, J., Girault, P., Guyon, G., Judkoff, R., LeBerre, R., Ojalvo, J., Reimer, P., 2005, The “ETNA BESTEST”
empirical validation data set, in Proceedings of Building Simulation 2005, Montréal, Canada, 15th
-18th
August:
p. 839-846.
Perez, R., Ineichen, P., Seals, R., Michalsky, J., Stewart, R., 1990, Modeling daylight availability and irradiance
components from direct and global irradiance, Sol. Energy, vol. 44: p. 271-289.
Seem, J.E., 1987, Modeling of Heat in Buildings, Thesis (PhD), University of Wisconsin, Madison, WI.
van Dijk, H.A.L., Arkesteijn, C.A.M., 1987, Windows and space heating requirements; Parameter studies leading
to a simplified calculation method, The Netherland national report on activities within step 5, TNO Institute of
Applied Physics, Delft, Netherlands.
Walton, G.N., 1983, Thermal Analysis Research Program Reference Manual, NBSSIR 83-2655, National Bureau of
Standards, Gaithersburg, MD.


![Comparative Study of Sawtooth Physics and Alfvén Waves via 2 … · 2010. 11. 9. · In previous references [11, 12], an extensive comparative study with the theoretical models including](https://img.pdfslide.us/doc/110x75/60e1f752e5285e39643ac9ad/comparative-study-of-sawtooth-physics-and-alfvn-waves-via-2-2010-11-9-in.jpg)


![Building a Strategic Framework For Comparative ... · [Type text] DRAFT – DO NOT CIRCULATE [Type text] Building a Strategic Framework For Comparative Effectiveness Research in Oncology](https://img.pdfslide.us/doc/110x75/5e77ab68c8dab72c2a002d9f/building-a-strategic-framework-for-comparative-type-text-draft-a-do-not.jpg)