Embed Size (px)
Citation preview

Extension Summer Outlook Conference | Connecting Cows, Cooperatives, Capitol Hill, & Consumers | August 2015
C o n n e c t i n g C o w s , C o o p e r a t i v e s , C a p i t o l H i l l , & C o n s u m e r s
National Milk Producers Federation
Extension Summer Outlook Conference
Dairy Market Outlook
John [email protected]
@New10_AgEcon

19
80
19
85
19
90
19
95
20
00
20
05
20
10
20
15$8
$12
$16
$20
$24
M-W, BFP, and Class III Milk Price Dairy Support Price
M-W
, B
FP
, C
las
s I
II M
ilk
, a
nd
Su
pp
ort
P
ric
e i
n $
/hu
nd
red
we
igh
t
2015 Extension Summer Outlook Conference August 2015
2
Record High U.S. Milk Prices in 2014Dairy Product Support Price Ineffective Since 2010
Source: USDA AMS, FSA, and author’s calculations

2015 Extension Summer Outlook Conference August 2015
3
Forecast Annual Milk Production Growth Rates Big-5 Exporters
Source: USDEC. 2015 includes USDEC forecasts
EU-28 US NZ Australia Argentina0%
5%
2.2%
0.9%
2.5%
3.4%
0.6%
Projected 2015 Milk Production Growth(EU-28,U.S., New Zealand, Australia, Argentina)
%
Current YTD U.S. Milk Production Growth Rate at 1.4% Based on USDA NASS

2015 Extension Summer Outlook Conference August 2015
4
Milk Production Forecast Higher in 2015 Following Record Prices of 2014
2007 2008 2009 2010 2011 2012 2013 2014 2015F -
50,000
100,000
150,000
200,000
250,000
300,000
350,000
Milk Production from Major Exporters(EU-28,U.S., New Zealand, Australia, Argentina)
EU-28 US NZ Australia Argentina
(00
0 M
T)
Source: USDEC. 2015 includes USDEC forecasts
Total: 633 Billion Lbs.
+0.9% +0.4% +1.5% +3.0% +1.8% +0.1% +3.7% +1.8%

2015 Extension Summer Outlook Conference August 2015
5
Demand Missing, China and Russia Imports Needed to Offset Overhanging Supply
2011 2012 2013 2014 2015700
1,100
1,500
1,900
2,300
China imports(rolling 12 months)
(000
MT
)
2011 2012 2013 2014 20151,000
1,075
1,150
1,225
1,300
Southeast Asia-5 imports(rolling 12 months)
(000
MT
)
2011 2012 2013 2014 2015100
200
300
400
500
600
Russia imports(rolling 12 months)
(000
MT
)
Source: USDEC, GTIS. Southeast Asia-5 includes Indonesia, Philippines, Malaysia, Thailand and Singapore.

2014 Jan - Jun 2015 Jan - Jun0
500
1,000
1,500
2,000
2,500
3,000
3,500
4,000
4,500
Non-Fat Dry Milk WheyCheese And Curd Other Dairy Products
Exp
orts
in M
illio
n U
SD
-26.9% YTD
2014 Jan - Jun 2015 Jan - Jun0
200
400
600
800
1,000
1,200
1,400
Non-Fat Dry Milk WheyCheese And Curd Other Dairy Products
Exp
orts
in T
hous
and
Met
ric T
ons
-10.6% YTD
2015 Extension Summer Outlook Conference August 2015
6
YTD U.S. Dairy Exports Down in 2015When Will China Return and Duration of Russian Ban Are Major Unknowns.
Source: USDA FAS GATS
U.S. Dairy Exports by ValueU.S. Dairy Exports by Volume
Value reduction driven by lower dairy
commodity prices

2015 Extension Summer Outlook Conference August 2015
7
Projections for Export Share of U.S. Milk Production is Flat in 2015-2016
Source: USDA NASS and WASDE. Export share based on author’s calculations.
96 97 98 99 00 01 02 03 04 05 06 07 08 09 10 11 12 13 14 15* 16*140
150
160
170
180
190
200
210
220
U.S. Milk Production and Volume Exported
Domestic use Exports
Bil
lio
n P
ou
nd
s

2015 Extension Summer Outlook Conference August 2015
8
Ample Supplies Weigh on Markets and Competition is Aggressive in Powders
Source: USDA AMS
1/5
/20
13
2/1
3/2
01
33
/24
/20
13
5/2
/20
13
6/1
0/2
01
37
/19
/20
13
8/2
7/2
01
31
0/5
/20
13
11
/13
/20
13
12
/22
/20
13
1/3
0/2
01
43
/10
/20
14
4/1
8/2
01
45
/27
/20
14
7/5
/20
14
8/1
3/2
01
49
/21
/20
14
10
/30
/20
14
12
/8/2
01
41
/16
/20
15
2/2
4/2
01
54
/4/2
01
55
/13
/20
15
6/2
1/2
01
5
$1.00
$1.50
$2.00
$2.50
$3.00
$3.50
US Butter Oceania Butter
$/lb
1/5
/20
13
2/1
2/2
01
33
/22
/20
13
4/2
9/2
01
36
/6/2
01
37
/14
/20
13
8/2
1/2
01
39
/28
/20
13
11
/5/2
01
31
2/1
3/2
01
31
/20
/20
14
2/2
7/2
01
44
/6/2
01
45
/14
/20
14
6/2
1/2
01
47
/29
/20
14
9/5
/20
14
10
/13
/20
14
11
/20
/20
14
12
/28
/20
14
2/4
/20
15
3/1
4/2
01
54
/21
/20
15
5/2
9/2
01
57
/6/2
01
5
$1.25
$1.75
$2.25
$2.75
US Cheese Oceania Cheese
$/lb
1/5
/20
13
2/1
3/2
01
33
/24
/20
13
5/2
/20
13
6/1
0/2
01
37
/19
/20
13
8/2
7/2
01
31
0/5
/20
13
11
/13
/20
13
12
/22
/20
13
1/3
0/2
01
43
/10
/20
14
4/1
8/2
01
45
/27
/20
14
7/5
/20
14
8/1
3/2
01
49
/21
/20
14
10
/30
/20
14
12
/8/2
01
41
/16
/20
15
2/2
4/2
01
54
/4/2
01
55
/13
/20
15
6/2
1/2
01
5
$0.60
$1.10
$1.60
$2.10
$2.60
$3.10
US Nonfat Oceania SMP
$/lb
1/5
/20
13
2/1
2/2
01
33
/22
/20
13
4/2
9/2
01
36
/6/2
01
37
/14
/20
13
8/2
1/2
01
39
/28
/20
13
11
/5/2
01
31
2/1
3/2
01
31
/20
/20
14
2/2
7/2
01
44
/6/2
01
45
/14
/20
14
6/2
1/2
01
47
/29
/20
14
9/5
/20
14
10
/13
/20
14
11
/20
/20
14
12
/28
/20
14
2/4
/20
15
3/1
4/2
01
54
/21
/20
15
5/2
9/2
01
57
/6/2
01
5
$0.30
$0.40
$0.50
$0.60
$0.70
$0.80
US Whey Europe Dry Whey
$/lb
CheeseButter
Dry WheyNonfat and SMP

2015 Extension Summer Outlook Conference August 2015
9
Butter and Cheese Prices Stabilizing, Nonfat Continues Slide
Source: USDA AMS
1/8
/20
11
2/1
9/2
01
14
/2/2
01
15
/14
/20
11
6/2
5/2
01
18
/6/2
01
19
/17
/20
11
10
/29
/20
11
12
/10
/20
11
1/2
1/2
01
23
/3/2
01
24
/14
/20
12
5/2
6/2
01
27
/7/2
01
28
/18
/20
12
9/2
9/2
01
21
1/1
0/2
01
21
2/2
2/2
01
22
/2/2
01
33
/16
/20
13
4/2
7/2
01
36
/8/2
01
37
/20
/20
13
8/3
1/2
01
31
0/1
2/2
01
31
1/2
3/2
01
31
/4/2
01
42
/15
/20
14
3/2
9/2
01
45
/10
/20
14
6/2
1/2
01
48
/2/2
01
49
/13
/20
14
10
/25
/20
14
12
/6/2
01
41
/17
/20
15
2/2
8/2
01
54
/11
/20
15
5/2
3/2
01
57
/4/2
01
5$0.50
$1.00
$1.50
$2.00
$2.50
$3.00U.S. Dairy Commodity Price Trends
Butter Cheddar Nonfat
$/lb
.
NFDM Prices At Old Price Support Levels of $0.80/lb

2015 Extension Summer Outlook Conference August 2015
10
Other Cheese
American-Type Cheese
Nonfat and Skim Milk Powders
Butter
Long Run Trends For All Products Show Increasing Consumption, But Butter Showing Short Run Decline
2006
2007
2008
2009
2010
2011
2012
2013
2014
2015
100
120
140
160
180 Export 12-Mo MA
Domestic 12-Mo MA
Mil
lio
n P
ou
nd
s
2006
2007
2008
2009
2010
2011
2012
2013
2014
2015
-
40
80
120
160
200
240 Export 12-Mo MA
Domestic 12-Mo MA
Mil
lio
n P
ou
nd
s
2006
2007
2008
2009
2010
2011
2012
2013
2014
2015
300
340
380
420 Export 12-Mo MA
Domestic 12-Mo MA
Mil
lio
n P
ou
nd
s
2006
2007
2008
2009
2010
2011
2012
2013
2014
2015
400
440
480
520
560
600
640 Export 12-Mo MA
Domestic 12-Mo MA
Mil
lio
n P
ou
nd
s
Source: USDA ERS

2015 Extension Summer Outlook Conference August 2015
11
Source: USDA NASS
2015 Butter Production YTD is Down 1.5% While Cheese and Nonfat Remain Firm Over Prior Year Levels
Nonfat Dry Milk
Dry WheyTotal Cheese
Butter
2006
2007
2008
2009
2010
2011
2012
2013
2014
2015
80
120
160
200
Butter Production 12-Mo Moving Avg
Mil
lio
n P
ou
nd
s
2006
2007
2008
2009
2010
2011
2012
2013
2014
2015
700
750
800
850
900
950
1,000
1,050
Cheese Production 12-Mo Moving Avg
Mil
lio
n P
ou
nd
s
2006
2007
2008
2009
2010
2011
2012
2013
2014
2015
507090
110130150170190210
Nonfat Production 12-Mo Moving Avg
Mil
lio
n P
ou
nd
s
2006
2007
2008
2009
2010
2011
2012
2013
2014
2015
60
70
80
90
100
110
120
Dry Whey Production 12-Mo Moving Avg
Mil
lio
n P
ou
nd
s
2015 Extension Summer Outlook Conference August 2015
12
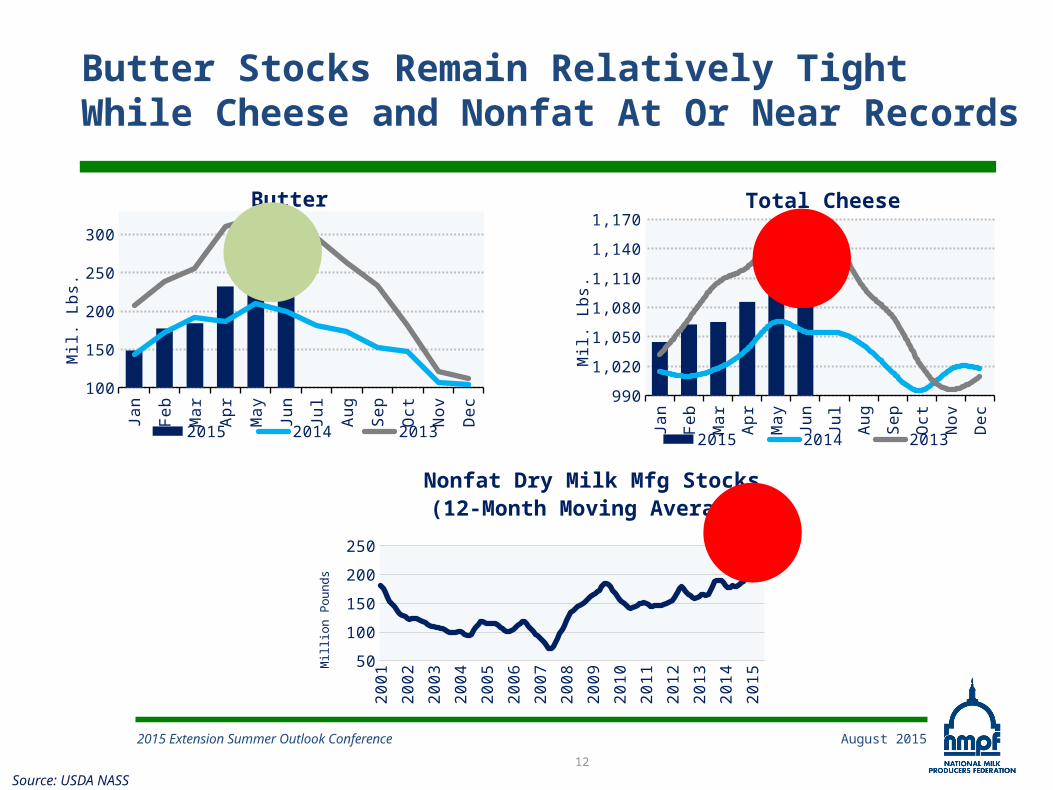
Jan
Fe
b
Ma
r
Ap
r
Ma
y
Jun
Jul
Au
g
Se
p
Oct
No
v
De
c
100
150
200
250
300
Butter
2015 2014 2013
Mil.
Lb
s.
Jan
Fe
b
Ma
r
Ap
r
Ma
y
Jun
Jul
Au
g
Se
p
Oct
No
v
De
c
990
1,020
1,050
1,080
1,110
1,140
1,170Total Cheese
2015 2014 2013
Mil.
Lb
s.
20
01
20
02
20
03
20
04
20
05
20
06
20
07
20
08
20
09
20
10
20
11
20
12
20
13
20
14
20
1550
100
150
200
250
Nonfat Dry Milk Mfg Stocks(12-Month Moving Average)
Mill
ion
Po
un
ds
Butter Stocks Remain Relatively Tight While Cheese and Nonfat At Or Near Records
Source: USDA NASS

2015 Extension Summer Outlook Conference August 2015
13
Many U.S. Farmers Responded to Record 2014 Prices by Expanding Herd/Milk Output (U.S. +50K Head Through Jun YOY)
Source: USDA NASS
California milk production is down 85 Lbs/cow YOY

2015 Extension Summer Outlook Conference August 2015
14
Ample Supplies and Demand Slowdown in U.S. Pulling Milk Prices Down
Source: USDA NASS
2015 Extension Summer Outlook Conference August 2015
15
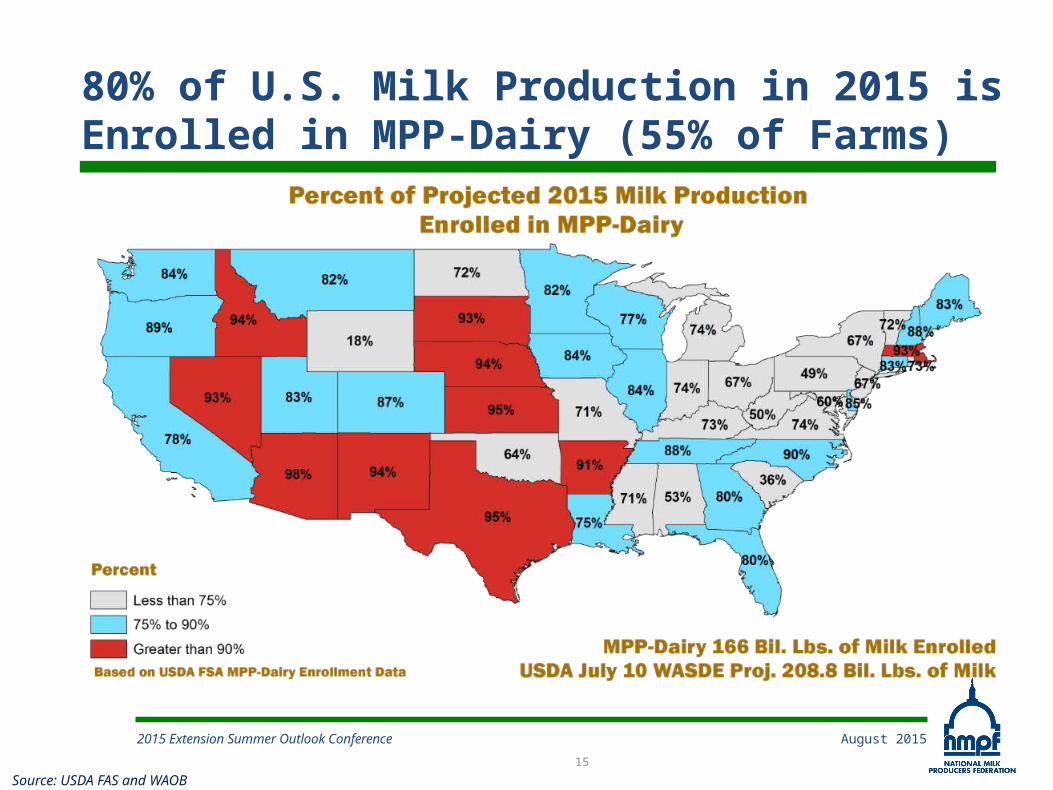
Source: USDA FAS and WAOB
80% of U.S. Milk Production in 2015 is Enrolled in MPP-Dairy (55% of Farms)

2015 Extension Summer Outlook Conference August 2015
16
Source: USDA FAS and author’s calculations
Cumulative Percent of Projected Milk Production Enrolled in MPP-Dairy
$4.00 $4.50 $5.00 $5.50 $6.00 $6.50 $7.00 $7.50 $8.000.0%
10.0%
20.0%
30.0%
40.0%
50.0%
60.0%
70.0%
80.0%
90.0%80.1%
33.0% 32.7%29.6% 28.2%
13.9%
3.0% 2.5% 0.5%
MPP-Dairy Coverage Level
Pe
rce
nt
Higher coverage levels had higher premium rates
Weighted Average: $4.82/cwt

2015 Extension Summer Outlook Conference August 2015
17
Source: USDA FAS and author’s calculations
Estimate: $60 Million USD Collected in MPP-Dairy Premiums in 2015
Admin $4.00 $4.50 $5.00 $5.50 $6.00 $6.50 $7.00 $7.50 $8.000
5
10
15
20
25
30
$2.5
$0.0 $0.1$1.9 $1.4
$26.3
$15.9
$1.3
$7.0
$3.2
Estimate of MPP-Dairy Premiums and Administrative Fees Collected by Coverage Level, 2015 CY
MPP-Dairy Coverage Level and Administrative Fee
Mill
ion
Do
llars
Only $8 Has Triggered
MPP-Payments to Holders of $8 Coverage
Jan-Feb: $4,336Mar-Apr: $482,134May-Jun: $4,530

2015 Extension Summer Outlook Conference August 2015
18
U.S. Milk Prices Down Nearly 40% from 2014 Highs, Down 27% YOY
Source: USDA NASS

2015 Extension Summer Outlook Conference August 2015
19
Source: USDA NASS and author’s calculations
The Tale of Two Corn BeltsFavorable Weather in W. Corn Belt May Offset Yield/Acreage Losses in E. Corn Belt
168.8 BPA Corn is Only 2.2 BPA Less than 2014 RecordAbove 2014 Yields in W. Corn Belt

10 11 12 13 14 15* 16*2
4
6
8
10
12
14
16
MPP-Dairy Margin
$/c
wt.
2015 Extension Summer Outlook Conference August 2015
20
Low Feed Prices Keeps MPP Margin Near Historical Average Despite Milk Price Fall
*NMPF/USDA Forecast
Payments Possible Through 2016
25% Lower Bound
75% Upper Bound
Average
Source: USDA NASS, AMS, FSA. Forecast based on author’s calculations as of August 11, 2015.

2015 Extension Summer Outlook Conference August 2015
21
MPP-Dairy Outperforming MILC as a Dairy Farm Safety Net
Source: USDA NASS, FSA and author’s calculations.
8 9 10 11 12 13 14 15$0
$5
$10
$15
$20
$25
$30Milk Income Loss Contract Payments and Trigger
MILC Payment MILC Reference Price Boston Class I
Va
lue
in $
/hu
nd
red
we
igh
t
MPP-Dairy Has Been in Payment Status For All of 2015,MILC Would Not Have Triggered
C o n n e c t i n g C o w s , C o o p e r a t i v e s , C a p i t o l H i l l , & C o n s u m e r s
National Milk Producers Federation
John NewtonSenior Director of Economic Research
Extension Summer Outlook Conference | Connecting Cows, Cooperatives, Capitol Hill, & Consumers | August 2015

2015 Extension Summer Outlook Conference August 2015
23
Global Milk Production is Increasing YOY in All Major Export Markets
Source: USDEC. 2015 includes USDEC forecasts
11 12 13 14 15* (1,350)
(900)
(450)
-
450
900
1,350
YOY Change in Milk Production from Major Exporters(EU-28,U.S., New Zealand, Australia, Argentina)
(00
0 M
T)
Forecast