Embed Size (px)
Citation preview
Extension of TES NH3 and CO algorithms to CrIS
Karen Cady-Pereira1, Helen Worden2, Mark Shephard3, Jean-Luc Moncet1, Alan Lipton1, Richard Lynch1,
Vivienne Payne4, and Matt Alvarado1
1Atmospheric and Environmental Research 2National Center for Atmospheric Research
3Environment Canada 4Jet Propulsion Laboratory, California Institute of Technology
Copyright 2014, Government sponsorship acknowledged.

• NH3 and CO are important trace gases
• TES and MOPITT observations are used to optimize NH3 and CO emissions and investigate their atmospheric impacts
• Both instruments are past their design lifetimes
• CrIS could monitor global NH3 and CO for many more years
9/26/14 2
Motivation
April
July
October
Constraining NH3 emissions with TES:. Zhu et al., JGR, 2013.
Apr.
July
Oct.
Base OpBmized ln(opt/base)

• Will use the same optimal estimation approach and constraints adopted for TES NH3, TES CO, and MOPITT CO.
• This approach: – Allows easy comparison with
model output (via AKs) – Provides error estimates for
the retrieved profiles – Builds a consistent record
from 1999 for CO and from 2004 for NH3 to beyond 2022!
• CrIS’s large coverage could provide more information for constraining sources.
9/26/14 3
Extending the EOS NH3 and CO Records with CrIS
ParBal column averaging kernels (AK) for satellite TIR CO measurements (from George et al., 2009).
• Flexible, modular software infrastructure that will: – Facilitate algorithm component comparisons
and validation – Include advanced treatments of clouds,
radiative transfer, surface emissivity/reflectivity, background data, and the atmospheric profile
• Primary products will include Tatm, Tsurf, H2O, cloud fraction, and cloud top T and P
• Secondary products could include O3, NH3, CO, LWP/IWP, and MW and IR surface emissivity/reflectivity.
9/26/14 4
Enhanced AER CrIS/ATMS Algorithm (PI Moncet, NASA S-NPP Science Team)

• Treatment of clouds adapts to conditions – Cloud Clearing as in AIRS Science Team and NUCAPS
algorithm • Estimate clear-sky spectrum from multiple adjacent cloudy
spectra – Hole Hunting
• Identify clear-sky gaps in cloudy areas – Simultaneous Cloud Property Retrieval from EUMETSAT
IASI algorithm • Algorithm operates on cloudy radiances while retrieving
cloud parameters • Fast and accurate radiative transfer
– Baseline is Optimal Spectral Sampling (OSS) – Molecular absorption from AER’s MonoRTM and LBLRTM
models, including Non-LTE and Zeeman splitting of O2 lines – Flexible structure allows alternative fast models, like SARTA
9/26/14 5
Enhanced AER CrIS/ATMS Algorithm
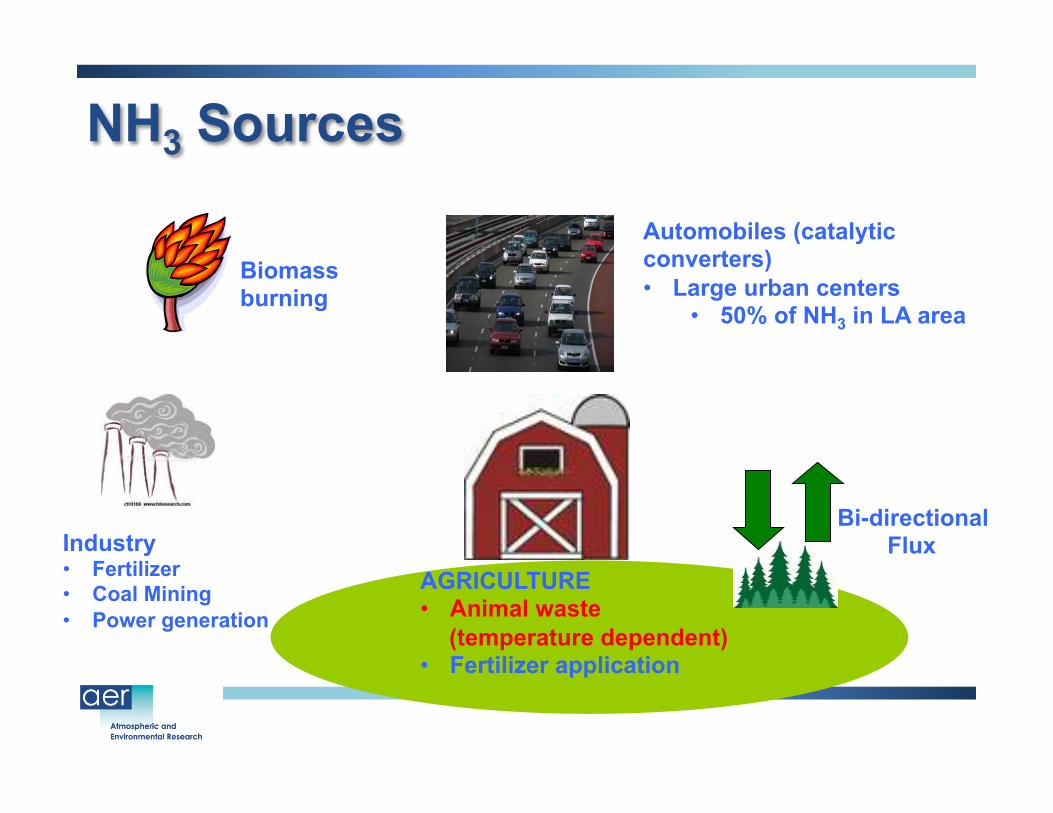
NH3 Sources
Bi-directional Flux
AGRICULTURE • Animal waste
(temperature dependent) • Fertilizer application
Industry • Fertilizer • Coal Mining • Power generation
Biomass burning
Automobiles (catalytic converters) • Large urban centers
• 50% of NH3 in LA area
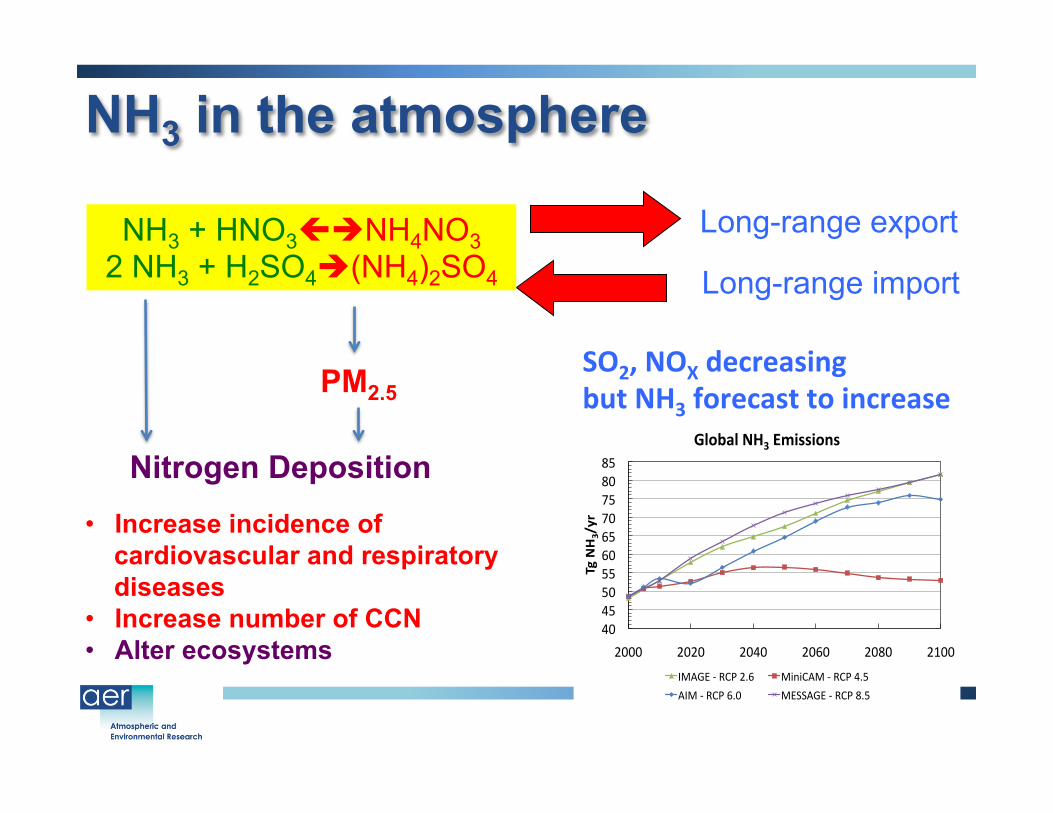
NH3 in the atmosphere
Long-range import
Long-range export
PM2.5
NH3 + HNO3çèNH4NO3 2 NH3 + H2SO4è(NH4)2SO4
• Increase incidence of cardiovascular and respiratory diseases
• Increase number of CCN • Alter ecosystems
40#45#50#55#60#65#70#75#80#85#
2000# 2020# 2040# 2060# 2080# 2100#
Tg#NH3/yr#
Global#NH3#Emissions#
IMAGE#/#RCP#2.6# MiniCAM#/#RCP#4.5#
AIM#/#RCP#6.0# MESSAGE#/#RCP#8.5#
SO2, NOX decreasing but NH3 forecast to increase
Nitrogen Deposition

9/26/14 8
NH3 signal from TES and CrIS Simulated spectra and NH3 signal
18 ppbv at surface
• Detectability is ~1 ppbv under ideal condiBons
• But thermal contrast also plays a role
TES
CrIS
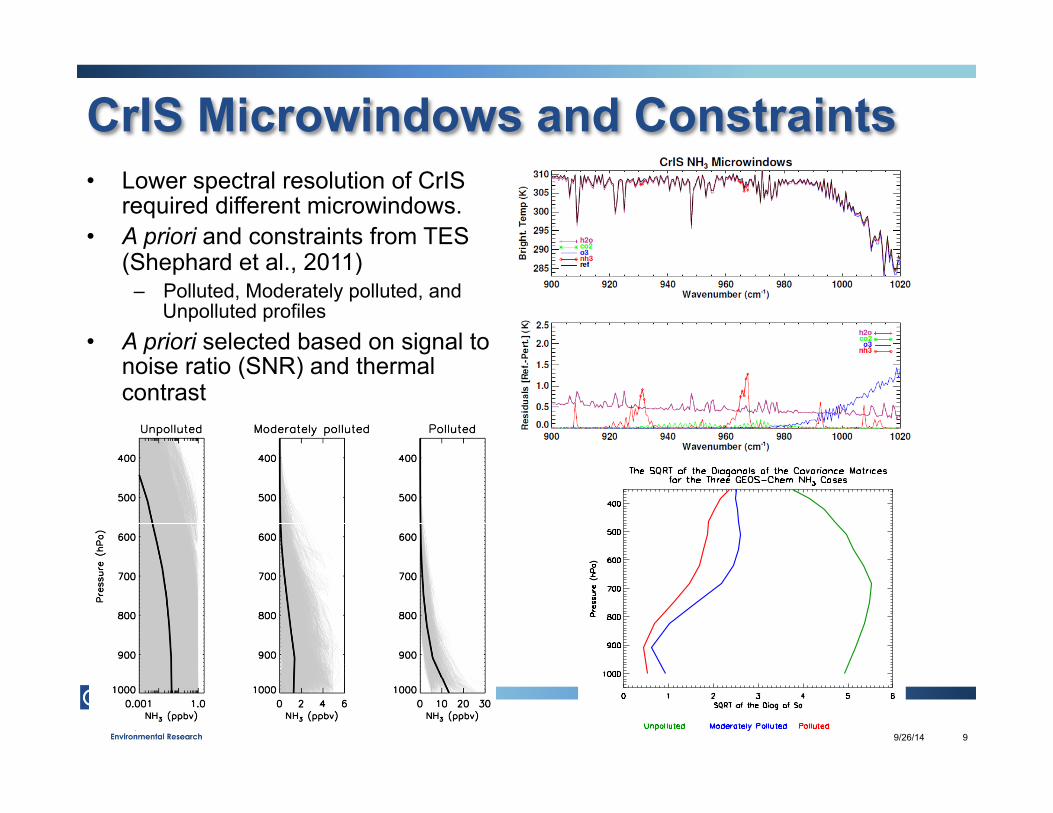
• Lower spectral resolution of CrIS required different microwindows.
• A priori and constraints from TES (Shephard et al., 2011)
– Polluted, Moderately polluted, and Unpolluted profiles
• A priori selected based on signal to noise ratio (SNR) and thermal contrast
9/26/14 9
CrIS Microwindows and Constraints
10748 M. W. Shephard et al.: TES ammonia retrieval strategy
Copernicus Publications Bahnhofsallee 1e 37081 Göttingen Germany Martin Rasmussen (Managing Director) Nadine Deisel (Head of Production/Promotion)
Contact [email protected] http://publications.copernicus.org Phone +49-551-900339-50 Fax +49-551-900339-70
Legal Body Copernicus Gesellschaft mbH Based in Göttingen Registered in HRB 131 298 County Court Göttingen Tax Office FA Göttingen USt-IdNr. DE216566440
Page 2/3
Figure 2: Three sets of atmospheric NH3 monthly mean profiles (gray) from GEOS-Chem 2005 global model simulations. The mean profile for each set is shown in black. These three mean NH3 profiles constitute the TES NH3 retrieval a priori profiles.
Fig. 3. Three sets of atmospheric NH3 monthly mean profiles (gray)from GEOS-Chem 2005 global model simulations. The mean pro-file for each set is shown in black. These three mean NH3 profilesconstitute the TES NH3 retrieval a priori profiles.
Fig. 4. The square root (SQRT) of the diagonals of the three covari-ance matrices derived from the GEOS-Chem NH3 global monthlymean profiles (unpolluted, moderately polluted, and polluted), inlnVMR, plotted as functions of pressure.
– polluted profiles are usually detectable (85%);
– unpolluted profiles rarely are detectable;
– thermal contrast increases detectability;
– the TES minimum level of detectability is for a profilethat contains a peak level value of ⇤1 ppbv.
The distribution of points with SNR greater than 1 sug-gests that the minimum detectability level will be influenced
Fig. 5. Scatter plot of SNR over the TES NH3 band versus the ther-mal contrast (surface temperature – air temperature at the bottomof the profile) for unpolluted (blue), moderately polluted (green),and polluted (red) NH3 profiles. The straight lines are linear fits tothe results for each profile type. The two horizontal dashes lines(yellow) correspond to the SNR of ±1.
Fig. 6. Scatter plot of the maximum NH3 VMR in each profile asa function of thermal contrast for the same simulated data set usedin Fig. 5. The filled circles indicate spectra with NH3 SNR⇥ 1whereas the open circles correspond to NH3 SNR< 1. The colorscorrespond to unpolluted (blue), moderately polluted (green), andpolluted (red) NH3 profiles. Also provided are the percentage ofcases for each polluted condition that meet the SNR> 1 criteria.
by a number of factors such as the altitude of the peak NH3concentration and the thermal structure of the atmosphere.For example, if the thermal contrast is low (in general lessthan 5K) it is difficult to reach the minimum detectabilitylevel of a profile with a peak value of 1 ppbv.
Atmos. Chem. Phys., 11, 10743–10763, 2011 www.atmos-chem-phys.net/11/10743/2011/
9/26/14 10
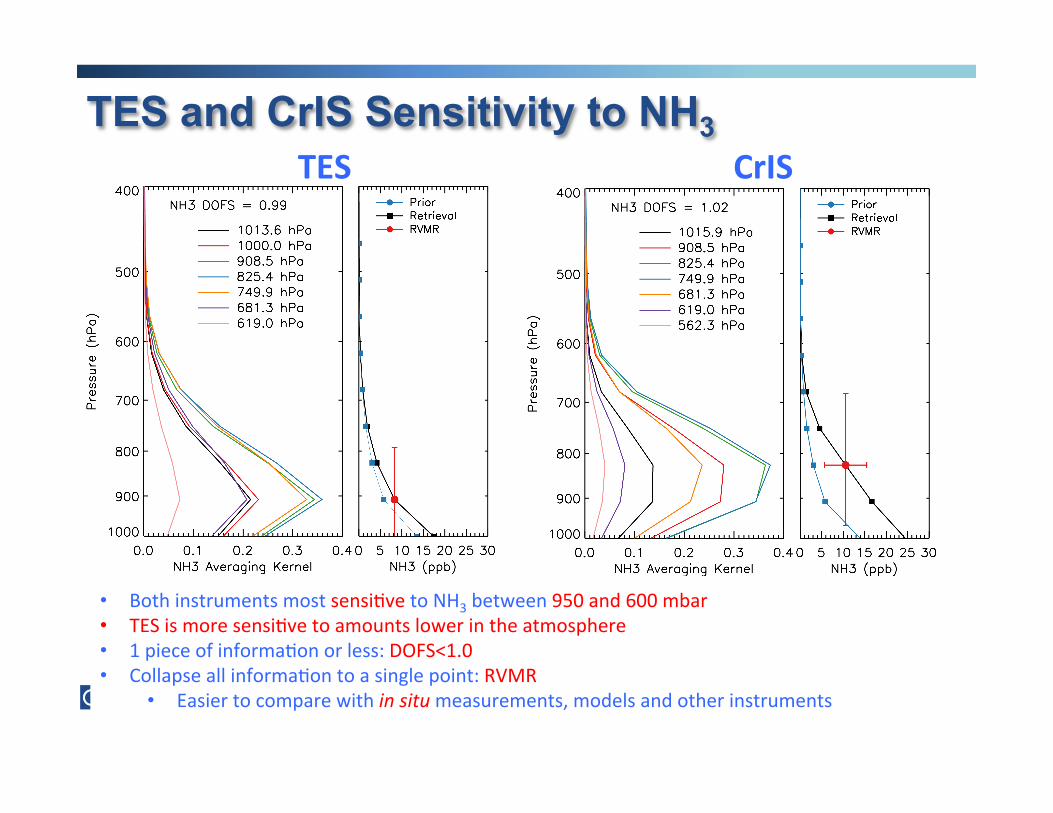
TES and CrIS Sensitivity to NH3
• Both instruments most sensiBve to NH3 between 950 and 600 mbar • TES is more sensiBve to amounts lower in the atmosphere • 1 piece of informaBon or less: DOFS<1.0 • Collapse all informaBon to a single point: RVMR
• Easier to compare with in situ measurements, models and other instruments
TES CrIS
9/26/14 11
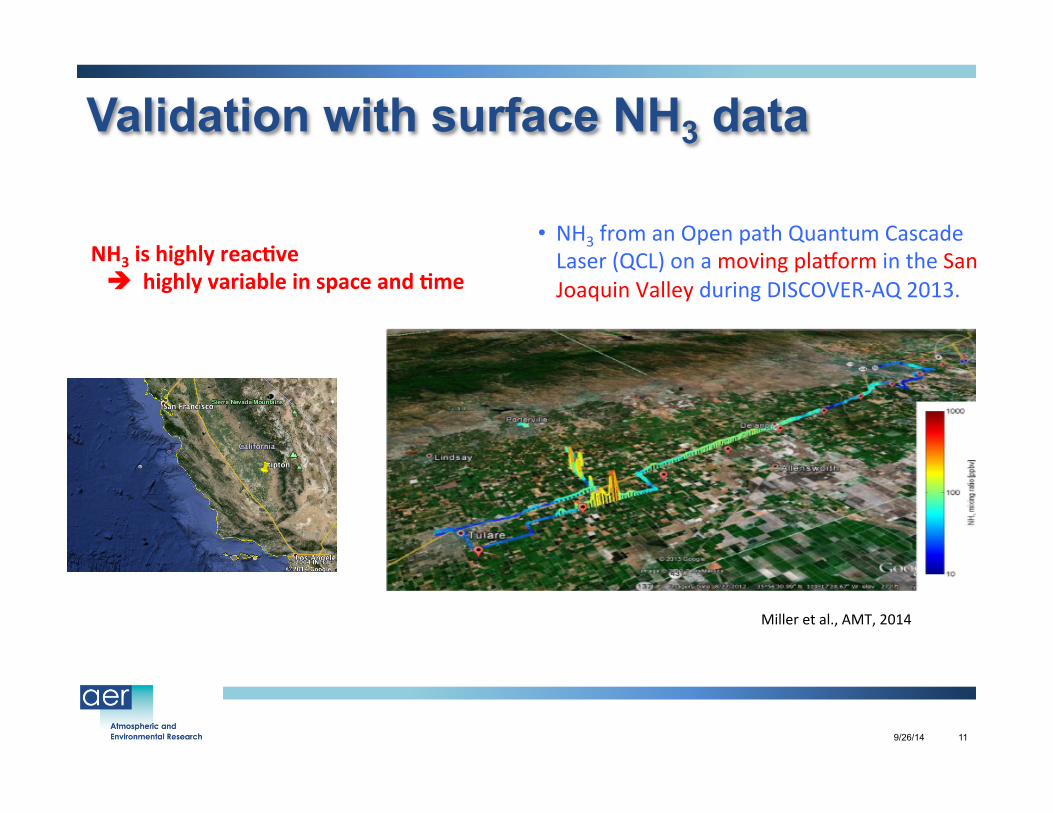
Validation with surface NH3 data
NH3 is highly reacCve è highly variable in space and Cme
• NH3 from an Open path Quantum Cascade Laser (QCL) on a moving pla`orm in the San Joaquin Valley during DISCOVER-‐AQ 2013.
Miller et al., AMT, 2014
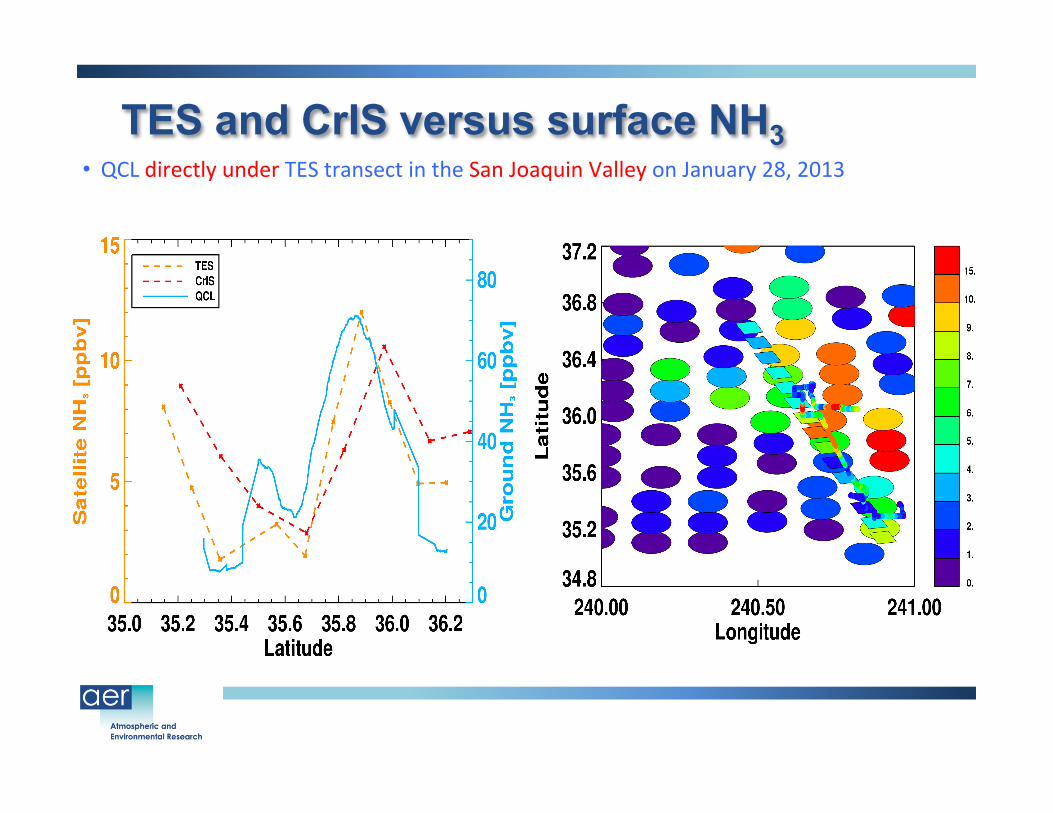
TES and CrIS versus surface NH3 • QCL directly under TES transect in the San Joaquin Valley on January 28, 2013

• Validate against SENEX, FRAPPE, and other field NH3 measurements.
• Use CMAQ adjoint to test ability of CrIS to optimize NH3 emissions.
• Incorporate NH3 into AER CrIS/ATMS algorithm and deliver to NASA SIPS
• Incorporate into NUCAPS?
9/26/14 13
Future Work on CrIS NH3 Retrieval
NH3 mixing raBos (ppbv) measured by the NOAA WP-‐3 aircrae during SENEX 2013. (Figure courtesy of Jesse Bash, US EPA NERL.)
• A prototype NH3 retrieval for CrIS, based on the TES algorithm, has been built and tested – LOD ~ 1 ppb, DOFS < 1.0, sensitive slightly higher in
atmosphere than TES – Algorithm performs well for simulated spectra – Qualitatively similar to surface data from DISCOVER-AQ – Further validation needed (e.g., SENEX and FRAPPE)
• A similar CrIS CO algorithm, based on the MOPITT and TES approaches, is planned
• Both algorithms will be incorporated into the enhanced AER CrIS/ATMS algorithm for delivery to NASA SIPS
9/26/14 14
Summary
• NOAA CPO AC4 Program • TES Science Team • NASA Suomi-NPP Science Team
9/26/14 15
Acknowledgements

9/26/14 16
CrIS NH3 Retrieval: Simulated Spectra


![[Co(NH3 6]Cl3](https://img.pdfslide.us/doc/110x75/62c22d2ed6734555b0515e2f/conh3-6cl3.jpg)