Embed Size (px)
Citation preview

CEPS Working Documents are intended to give an indication of work being conducted within CEPS’ research programmes and to stimulate reactions from other experts in the field. The views expressed in this paper are those of the authors and do not necessarily represent any institution with which they are affiliated.
ISBN 978-94-6138-369-3
Available for free downloading from the CEPS website (http://www.ceps.eu) © Nicolas Contreras, Elisa Martellucci and Anna-Elisabeth Thum, 2013
EXTENDING WORKING LIFE IN BELGIUM NICOLAS CONTRERAS, ELISA MARTELLUCCI
AND ANNA-ELISABETH THUM
CEPS WORKING DOCUMENT NO. 386
NOVEMBER 2013
Abstract
This report aims at understanding how persons aged 50 years and older are and can be integrated into the working society in Belgium. We are interested in how people in this age group can be induced to engage in various forms of employment and lifelong learning. Based on secondary literature, descriptive databases as well as interviews with experts and focus groups, we find that the discussion on active ageing in Belgium is well advanced with numerous contributions by academics, stakeholders, social partners, the public administration and interest groups. The wish to retire at 60 is widely shared but at the same time the majority of Belgium’s elderly are able and would be willing to work under specific conditions. Therefore, we recommend that Belgium should invest in more flexible systems including a revision of the tax scheme, such as the part-time retirement system proposed by the insurance company Delta Lloyd. An equally relevant recommendation would be to ensure that public employment agencies, employers and agencies that provide training encourage all workers to work and learn regardless of their age.
Research for this paper was conducted as part of MoPAct, a four year project funded by the European Commission under the 7th Framework Programme to provide the research and practical evidence upon which Europe can begin to make longevity an asset for social and economic development. The paper is also published on the MoPAct website (www.mopact.group.shef.ac.uk) as input to Deliverable D 3.1. See the website and the penultimate page of this paper for more information of the project.

Contents
1. Introduction ..............................................................................................................................1 2. General assessment of the labour market and lifelong learning situation for older workers .............................................................................................................................................2
2.1 Demographic trends in Belgium .....................................................................................2 2.1.1 Overview ...................................................................................................................2 2.1.2 Possible consequences ..............................................................................................4
2.2 Employment of older workers .........................................................................................5 2.2.1 Full-time, part-time and temporary employment ..................................................8 2.2.2 Labour Market Status ............................................................................................. 12 2.2.3 Engagement in alternative forms of (un)paid activities ....................................... 13 2.2.4 Methods used by unemployed older workers to search for work ...................... 16 2.2.5 Duration of unemployment ................................................................................... 17
2.3 Lifelong learning of the elderly in Belgium .................................................................. 18 2.4 Summary ......................................................................................................................... 22
3. Active ageing in Belgium: Underlying issues for designing successful national policies and innovative practices ................................................................................................................ 23
3.1 Active ageing and older workers aged 50-64 ............................................................... 24 3.1.1 Supply side: Personal resources ............................................................................. 25
3.1.1.1 Health ................................................................................................................... 25 3.1.1.2 Skills and lifelong learning ................................................................................. 27 3.1.1.3 Willingness to work and underlying reasons ................................................... 31
3.1.2 Demand side: Work demands................................................................................ 33 3.1.2.1 Age management and management's views on active ageing ........................ 33 3.1.2.2 Workplace stereotypes and career perspective ................................................. 35 3.1.2.3 Working conditions and job quality .................................................................. 36 3.1.2.4 Are older workers too expensive? Ageing, costs and productivity ................ 37
3.1.3 Labour market interactions .................................................................................... 39 3.1.4 Self-employment and older workers ..................................................................... 39
3.2 Active ageing past retirement age ................................................................................. 41 3.2.1 Enabling factors ....................................................................................................... 42
3.2.1.1 Health ................................................................................................................... 42 3.2.2 Paths, motivations and obstacles ........................................................................... 45
3.2.2.1 Employment and retirement in Belgium ........................................................... 45 3.2.2.2 Lifelong learning ................................................................................................. 48 3.2.2.3 Other (un-) paid activities................................................................................... 49
4. Conclusion .............................................................................................................................. 50 5. Bibliography ........................................................................................................................... 51 6. Appendix ................................................................................................................................ 56
List of Boxes, Figures and Tables Box 1. Barco's training schemes .................................................................................................... 29 Box 2. Proviron's knowledge management tool .......................................................................... 30 Box 3. Daikin's seasonal older workers ........................................................................................ 47 Figure 1. Employment rate of older workers (55-64) 5 Figure 2. Employment rate of older workers by age and gender (%) ..........................................6 Figure 3. Employment rate of older workers by age and education (55-64) (%).........................6 Figure 4. Average effective age of retirement versus the official age, 2012 .................................7 Figure 5. Part-time employment as percentage of total employment of older workers by gender (55-64) ...................................................................................................................................8 Figure 6. Full-time employment rate of older workers by gender (55-64) ..................................8 Figure 7. Hours worked by age and education .............................................................................9 Figure 8. Reasons for part-time work by age and gender (%) .................................................... 10 Figure 9. Temporary work by age and gender (%) ..................................................................... 11 Figure 10. Temporary work by age and education (%) ............................................................... 11 Figure 11. Reasons for temporary work by age (%) .................................................................... 12 Figure 12. Inactive people – Other activities by age and gender (%) ......................................... 14 Figure 13.Inactive people – Other activities by age and education (%) ..................................... 15 Figure 14.Inactive people – Care activities by age and gender (%) ............................................ 16 Figure 15. Inactive people – Care activities by age and education (%) ...................................... 16 Figure 16. Duration of unemployment by age and education (%) ............................................. 18 Figure 17. Education by age group and gender (%) .................................................................... 18 Figure 18. Participation in formal education by age and education (%) ................................... 19 Figure 19. Participation in non-formal education by age and education (%) ............................ 19 Figure 20. Participation in non-formal education by age and labour status (%)....................... 20 Figure 21. Purpose of non-formal education by age and gender ............................................... 20 Figure 22. Purpose of non-formal education by age and education .......................................... 21 Figure 23. Participation in Informal learning by age (%) ............................................................ 22 Figure 24. The work ability model ................................................................................................ 24 Figure 25. Labour mismatch: distribution of education levels among the unemployed (supply) and employed (demand) population by age group ..................................................... 28 Figure 26. Share of workers thinking about or involved in early stage start-up activities (%) 40 Figure 27. General health by country and age ............................................................................. 43 Figure 28. Disability / Long-term illness by country and age.................................................... 43 Figure 29. Participation in non-formal education by country and age ...................................... 49 Table 1. Demographic trends in Belgium .......................................................................................3 Table 2. Demographic trends across regions .................................................................................3 Table 3. Ageing in Belgium, neighbouring countries and Europe, 2012 .....................................4 Table 4. Labour Market Status by age and gender (%) ............................................................... 13 Table 5. Labour Market Status by age and education (%) .......................................................... 13 Table 6. Methods to search for work (%)...................................................................................... 17


1
Extending Working Lives in Belgium Nicolas Contreras, Elisa Martellucci and
Anna-Elisabeth Thum*
CEPS Working Document No. 386 / November 2013
1. Introduction ‘Active ageing’ is a concept that is gaining relevance in the context of an ageing society and simultaneous budgetary pressures on social security systems. Policy-makers therefore have started to seek measures to extend the number of working years, raise employment rates of older workers and enhance lifelong learning and other forms of paid activity. Such measures range from the creation of incentives to take part in training classes for older workers to postponing the legal retirement age. A wide variety of practices and policies can be subsumed under the term ‘active ageing’. According to the World Health Organization (2002), the term ‘active ageing’ implies continuing to participate in social, economic, cultural, spiritual and civic affairs during the course of one’s life. The term ‘active’ therefore goes beyond participation in the labour force. Indeed, within the MOPACT project, active ageing is seen as a new paradigm for making longevity an asset rather than amiability. More concretely, this means to improve the capacity to make full use of the economic contribution of seniors by encouraging them to engage in paid employment (part-time/full-time, permanent or temporary schemes), (un-)paid activities – such as family care or civic engagement – and/or lifelong learning.
In this report we aim to understand how persons aged 50 years and older are and can be integrated in the working society in Belgium: We are interested in how people in this age group can be induced to engage in various forms of employment1 and to participate in lifelong learning.2 The report contributes to a series of country reports that are being used to design a conceptual framework for developing standards for identifying innovative, effective, sustainable and transferable strategies in age-related employment and lifelong learning. Approaches from different countries to overcome known limitations of individual initiatives will be integrated. Employer and employee involvement is seen as a key to
* Nicolas Contreras is a master student at the University of Paris-Sorbonne, Elisa Martellucci is Project Officer and Anna-Elisabeth Thum is Research Fellow at CEPS. They would like to thank Miroslav Beblavy for very useful inputs during his peer review, Mikkel Barslund for valuable discussions, all participants of the focus groups and expert interviews as well as Service Senior Bruxelles Ville. 1 In particular paid work, informal/undeclared work (paid activity that is lawful as regards its nature but not declared to the public authorities; it can include civic engagement, family care and others), black/grey work, full-time work and other forms of employment are researched. 2 We propose the following working definition of lifelong learning: Lifelong learning can be of three different types (see for instance Field 2005:3): formal (‘planned and organized instruction in designated institutions’), informal (‘education that is provided by bodies whose main purpose is something other than education, such as trade-unions, voluntary associations and companies’) or non-formal (‘all those forms of learning that take place as a result of an individual’s life experiences [...such as] visiting a library, seeking advice or surfing the internet’; also termed ‘incidental learning’). We propose to focus on vocational learning (formal or informal learning) but also to include a wider form of learning such as non-formal learning.

2 CONTRERAS, MARTELLUCCI & THUM
successful active ageing strategies. In researching practices to achieve active ageing in Belgium a special focus is put on practices that can be grouped under the term ‘social innovation’.3
We rely on secondary literature, descriptive data bases as well as interviews with expert and focus groups. The experts interviewed were drawn from several different institutions: a company (A. Schulman), a public body working for the employment of older workers (Fonds de l’Expérience Professionnelle, FEP), a lobby for the promotion of employment in old age (Senior Flex) and a trade union (Fédération Générale du Travail de Belgique, FGTB). The focus groups were conducted with older workers and learners older than 50.4
The report is split into two main sections: one section analyses the labour market and lifelong learning situation quantitatively and the second section analyses policies and practices to motivate seniors to be active in the way described above. The remainder of the report is organised as follows: section 2 provides a general assessment of the labour market and lifelong learning situation for older workers – in particular we assess descriptive statistics on demographics, employment and lifelong learning; section 3 assesses policies and practices with regard to active ageing in Belgium – in particular we will cover the various dimensions of work ability in older working-age and the determinants of participation in post-retirement life in Belgium as well as related innovative practices. Section 4 offers conclusions.
2. General assessment of the labour market and lifelong learning situation for older workers
In this section we provide an overview of the situation of older workers on the labour market and in terms of lifelong learning. We will start by outlining the demographic context in Belgium. We then analyse employment, labour market status and lifelong learning of the elderly.
2.1 Demographic trends in Belgium
2.1.1 Overview Belgium's population is getting older, with average age increasing from 41 in 2012 to a projected 44.6 in 2060. Stagnating birth rate, increasing life expectancy and shrinking international immigration are indeed skewing the age distribution towards a higher proportion of individuals aged 65 or more, from 17.4% in 2012 to a projected 25.8% for 2060.
As a consequence the old-age dependency ratio5 is also expected to increase from 26.6% in 2012 to 44.4% in 2060. Conversely the number of working-age individuals per older citizens will shrink from 3.8 in 2012 to a projected 2.3 in 2060 (BFP-DGSIE, 2013).
3 Social innovations are new ideas (products, services and models) aiming at meeting social needs and creating new social relationships or collaborations. Compared to regular innovation, social innovations are driven by an extra motive: a social mission, and a will to create shared value, at once economic and social. In general, they respond to the following characteristics (European Commission, 2013): Openness as regards ownership of knowledge; Multi-disciplinary and integrated approach; Participative and user-based design; Demand-led; Tailored to specific situations. 4 The participants have been contacted via the Brussels senior services. Thus, the sample analyzed is more likely to include people that have already been involved in training and post-retirement activities. 5 Number of people aged 65 or more expressed as a percentage of the working-age population (15-64 years-old).
EXTENDING WORKING LIVES IN BELGIUM 3
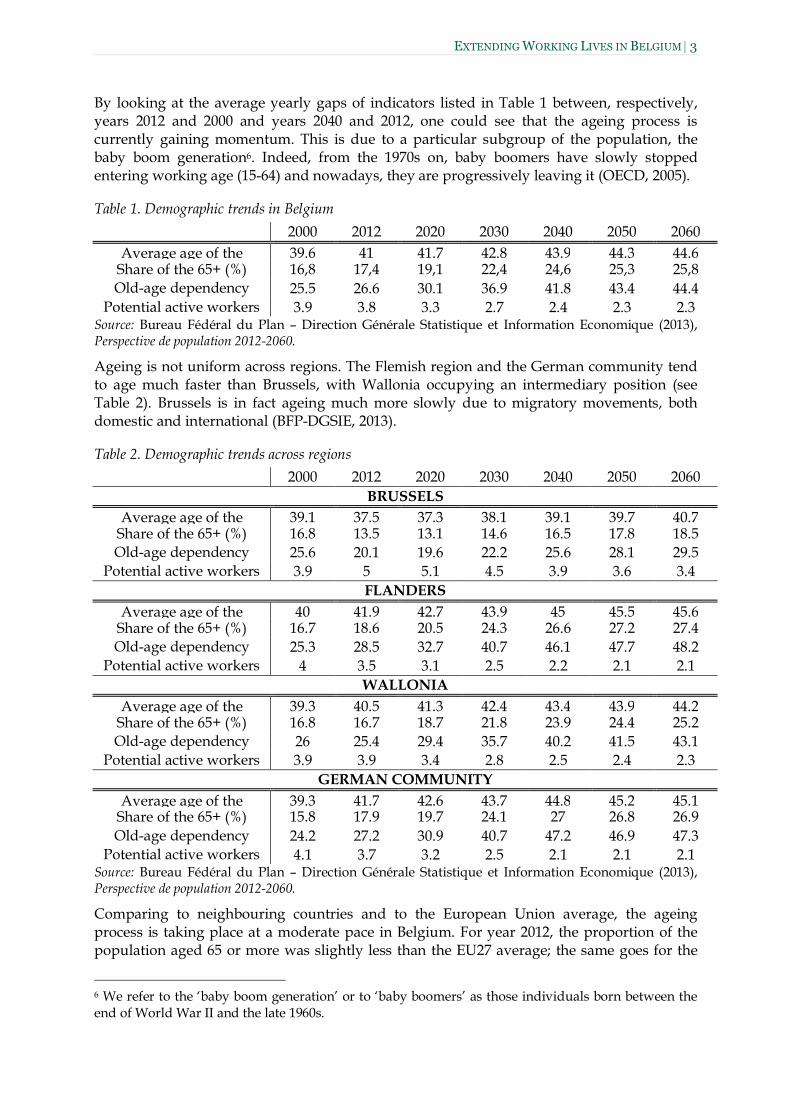
By looking at the average yearly gaps of indicators listed in Table 1 between, respectively, years 2012 and 2000 and years 2040 and 2012, one could see that the ageing process is currently gaining momentum. This is due to a particular subgroup of the population, the baby boom generation6. Indeed, from the 1970s on, baby boomers have slowly stopped entering working age (15-64) and nowadays, they are progressively leaving it (OECD, 2005).
Table 1. Demographic trends in Belgium 2000 2012 2020 2030 2040 2050 2060
Average age of the 39.6 41 41.7 42.8 43.9 44.3 44.6 Share of the 65+ (%) 16,8 17,4 19,1 22,4 24,6 25,3 25,8 Old-age dependency
ratio (%) 25.5 26.6 30.1 36.9 41.8 43.4 44.4
Potential active workers per retirees
3.9 3.8 3.3 2.7 2.4 2.3 2.3 Source: Bureau Fédéral du Plan – Direction Générale Statistique et Information Economique (2013), Perspective de population 2012-2060.
Ageing is not uniform across regions. The Flemish region and the German community tend to age much faster than Brussels, with Wallonia occupying an intermediary position (see Table 2). Brussels is in fact ageing much more slowly due to migratory movements, both domestic and international (BFP-DGSIE, 2013).
Table 2. Demographic trends across regions 2000 2012 2020 2030 2040 2050 2060
BRUSSELS Average age of the 39.1 37.5 37.3 38.1 39.1 39.7 40.7
Share of the 65+ (%) 16.8 13.5 13.1 14.6 16.5 17.8 18.5 Old-age dependency
ratio (%) 25.6 20.1 19.6 22.2 25.6 28.1 29.5
Potential active workers per retirees
3.9 5 5.1 4.5 3.9 3.6 3.4 FLANDERS
Average age of the 40 41.9 42.7 43.9 45 45.5 45.6 Share of the 65+ (%) 16.7 18.6 20.5 24.3 26.6 27.2 27.4 Old-age dependency
ratio (%) 25.3 28.5 32.7 40.7 46.1 47.7 48.2
Potential active workers per retirees
4 3.5 3.1 2.5 2.2 2.1 2.1 WALLONIA
Average age of the 39.3 40.5 41.3 42.4 43.4 43.9 44.2 Share of the 65+ (%) 16.8 16.7 18.7 21.8 23.9 24.4 25.2 Old-age dependency
ratio (%) 26 25.4 29.4 35.7 40.2 41.5 43.1
Potential active workers per retirees
3.9 3.9 3.4 2.8 2.5 2.4 2.3 GERMAN COMMUNITY
Average age of the 39.3 41.7 42.6 43.7 44.8 45.2 45.1 Share of the 65+ (%) 15.8 17.9 19.7 24.1 27 26.8 26.9 Old-age dependency
ratio (%) 24.2 27.2 30.9 40.7 47.2 46.9 47.3
Potential active workers per retirees
4.1 3.7 3.2 2.5 2.1 2.1 2.1 Source: Bureau Fédéral du Plan – Direction Générale Statistique et Information Economique (2013), Perspective de population 2012-2060.
Comparing to neighbouring countries and to the European Union average, the ageing process is taking place at a moderate pace in Belgium. For year 2012, the proportion of the population aged 65 or more was slightly less than the EU27 average; the same goes for the
6 We refer to the ‘baby boom generation’ or to ‘baby boomers’ as those individuals born between the end of World War II and the late 1960s.

4 CONTRERAS, MARTELLUCCI & THUM
old-age dependency ratio. The Netherlands is ageing more slowly compared to Belgium and EU27, while Germany’s population is getting greyer at a faster rate (Eurostat, 2013).
Table 3. Ageing in Belgium, neighbouring countries and Europe, 2012
Belgium France Netherlands Germany EU27 Share of the 65+ (%) 17.3 17.1 16.2 20.6 17.8 Old-age dependency
ratio (%) 26.4 26.6 24.4 31.2 26.7
Source: Eurostat (2013).
2.1.2 Possible consequences An ageing population can threaten wealth creation in the long run. Indeed, although cohort effects7 have played an important role in keeping the labour force growing in Belgium, principally due to increasing female participation rates across generations, it will play a more moderate role in the future as the gender gap in labour participation rates closes. Therefore, with such demographic trends, unchanged employment rates would eventually cause the labour force supply to decline, hence a negative contribution of labour supply to growth (OECD 2005).
Additional consequences of the current ageing process are to be found in the newer generations of ‘older’ people: population as a whole is not only changing quantitatively in its structure, but also qualitatively.
Firstly, in addition to getting older, baby boomers are also facing increased financial pressure as compared to previous generations:
‘Not only are people commonly having children later in life – so that older people may still have children to educate, financially help to buy a home and so on – but also, the parents of baby boomers are more likely to still be alive and if they are, their health care costs are likely to be greater and last longer.’ (Shacklock et al., 2007: p. 153).
Shacklock et al. (2007) also note that this new generation of elderly is keener to remain economically active, albeit not under the same modalities as during their younger days, for non-economic reasons (e.g. feeling part of group, symbolic reward of contributing to a project, etc.). This characteristic of the baby boomer generation was also stressed by participants in the first focus group. Having known full-employment, increased female labour participation and social protest (cf. the 1960s for example), they consider themselves as more proactive in the way they run their lives than previous generations. Also, participants in the second focus groups stressed the contrast between what they expected from retirement (i.e. a period in one's life where he/she has plenty of time to enjoy) and what they actually experienced. However, all experts who were interviewed warned us against generalization when it came to older people, as they have experienced a myriad of different life-paths and thus are far from forming a homogeneous group.
Secondly, ageing also implies feminizing. In fact, men are more likely to die than women at any point in life; hence the increasing proportion of women as one goes up the age pyramid. Putting this in perspective with the ageing process, this means that an ageing society is also a feminizing society (DGSIE, 2012; WHO, 2002). Therefore, it is particularly important to consider the gender divide when reflecting on active ageing.
7 ‘Cohort effects (...) reflect the replacement of older cohorts by younger cohorts with different lifetime participation characteristics’ (OECD, 2005: p. 22)
EXTENDING WORKING LIVES IN BELGIUM 5
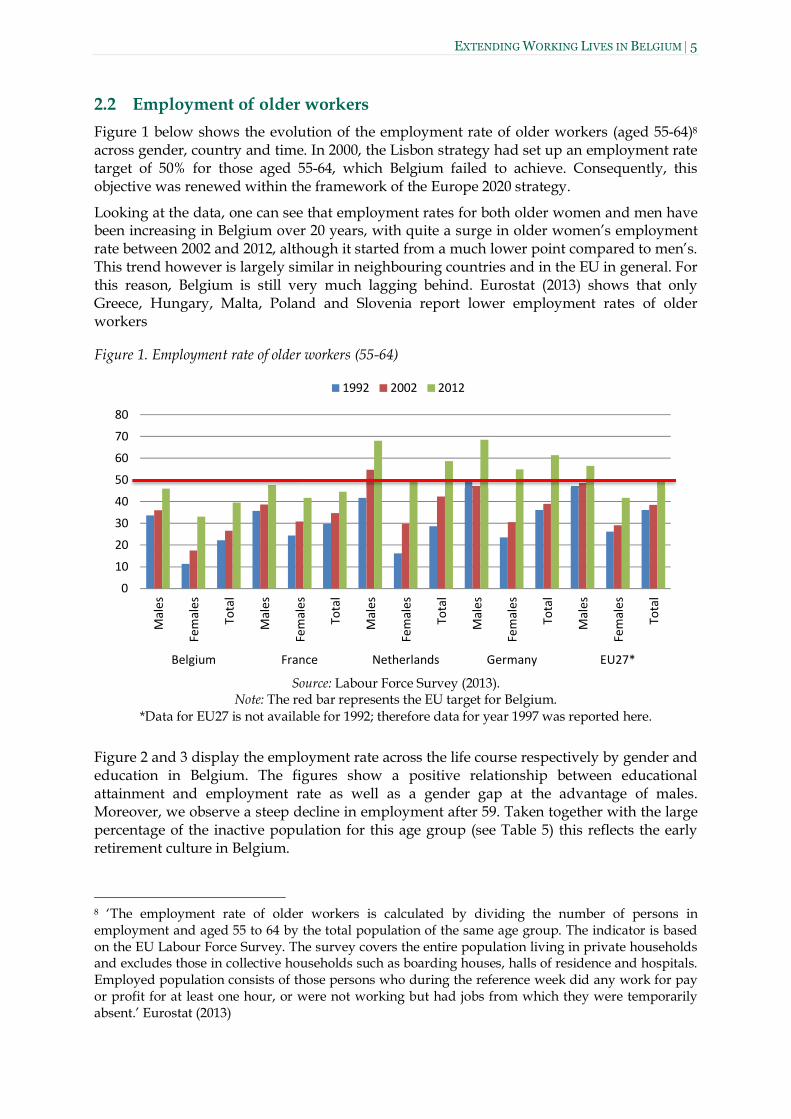
2.2 Employment of older workers Figure 1 below shows the evolution of the employment rate of older workers (aged 55-64)8 across gender, country and time. In 2000, the Lisbon strategy had set up an employment rate target of 50% for those aged 55-64, which Belgium failed to achieve. Consequently, this objective was renewed within the framework of the Europe 2020 strategy.
Looking at the data, one can see that employment rates for both older women and men have been increasing in Belgium over 20 years, with quite a surge in older women’s employment rate between 2002 and 2012, although it started from a much lower point compared to men’s. This trend however is largely similar in neighbouring countries and in the EU in general. For this reason, Belgium is still very much lagging behind. Eurostat (2013) shows that only Greece, Hungary, Malta, Poland and Slovenia report lower employment rates of older workers
Figure 1. Employment rate of older workers (55-64)
Source: Labour Force Survey (2013).
Note: The red bar represents the EU target for Belgium. *Data for EU27 is not available for 1992; therefore data for year 1997 was reported here.
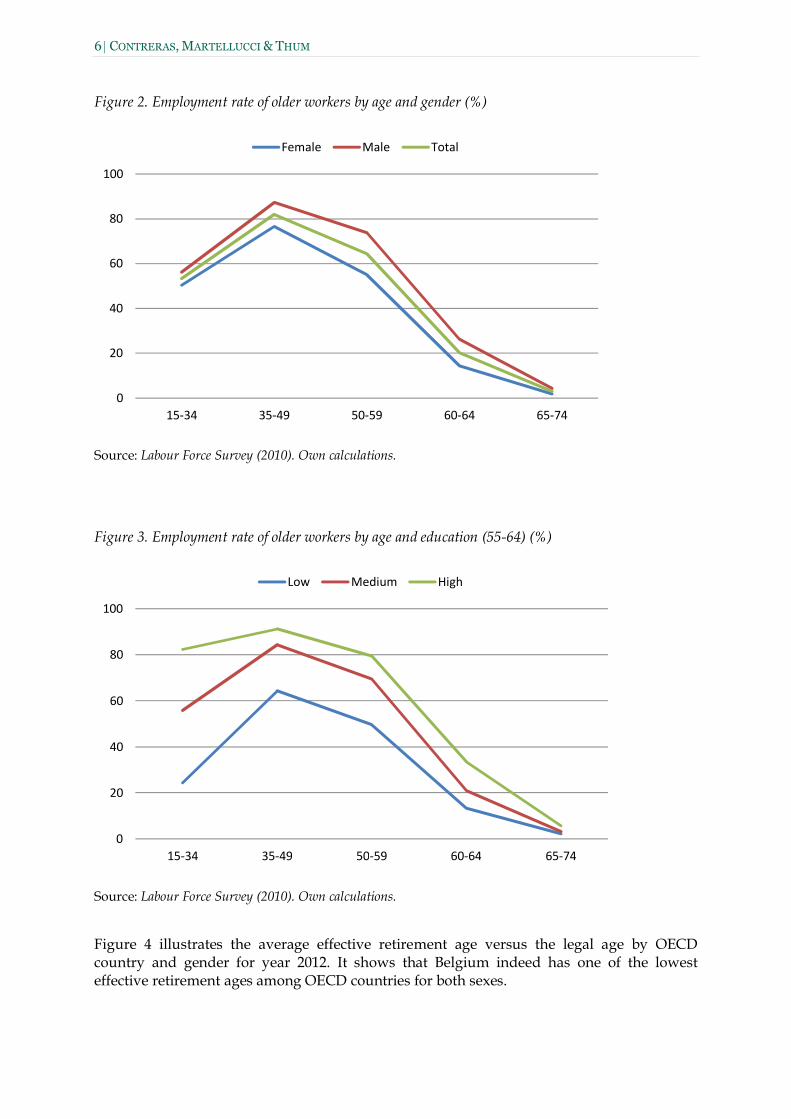
Figure 2 and 3 display the employment rate across the life course respectively by gender and education in Belgium. The figures show a positive relationship between educational attainment and employment rate as well as a gender gap at the advantage of males. Moreover, we observe a steep decline in employment after 59. Taken together with the large percentage of the inactive population for this age group (see Table 5) this reflects the early retirement culture in Belgium.
8 ‘The employment rate of older workers is calculated by dividing the number of persons in employment and aged 55 to 64 by the total population of the same age group. The indicator is based on the EU Labour Force Survey. The survey covers the entire population living in private households and excludes those in collective households such as boarding houses, halls of residence and hospitals. Employed population consists of those persons who during the reference week did any work for pay or profit for at least one hour, or were not working but had jobs from which they were temporarily absent.’ Eurostat (2013)
0
10
20
30
40
50
60
70
80
Mal
es
Fem
ales
Tota
l
Mal
es
Fem
ales
Tota
l
Mal
es
Fem
ales
Tota
l
Mal
es
Fem
ales
Tota
l
Mal
es
Fem
ales
Tota
lBelgium France Netherlands Germany EU27*
1992 2002 2012
6 CONTRERAS, MARTELLUCCI & THUM
Figure 2. Employment rate of older workers by age and gender (%)
Source: Labour Force Survey (2010). Own calculations.
Figure 3. Employment rate of older workers by age and education (55-64) (%)
Source: Labour Force Survey (2010). Own calculations.
Figure 4 illustrates the average effective retirement age versus the legal age by OECD country and gender for year 2012. It shows that Belgium indeed has one of the lowest effective retirement ages among OECD countries for both sexes.
0
20
40
60
80
100
15-34 35-49 50-59 60-64 65-74
Female Male Total
0
20
40
60
80
100
15-34 35-49 50-59 60-64 65-74
Low Medium High

EXTENDING WORKING LIVES IN BELGIUM 7
Figure 4. Average effective age of retirement versus the official age, 2012
Source: OECD, Ageing and Employment Policies - Statistics on average effective age of retirement. Notes: Official retirement age is shown for 2010. For Belgium and France, workers can retire at age 60 with 40 years of contributions; for Greece, at age 58 with 35 years of contributions; and for Italy, at 57 (56 for manual workers) with 35 years of contributions.
Nonetheless, the employment rate as an indicator has been criticized, mostly on the basis that it does not provide any information with regards to the type of employment one might have. For instance, Moulaert and Leonard (2011: p.25) note that employment rates can increase as more people get part-time jobs, which can then create an overestimated picture of activity among given populations. For this reason, the next development looks at types of employment in terms of full-time vs. part-time and temporary vs. non-temporary employment.
50
55
60
65
70
75
Mex
ico
Kore
aJa
pan
Icel
and
Chile
Isra
elSw
eden
Port
ugal
New
…Sw
itzer
land
Uni
ted …
Aust
ralia
Esto
nia
Nor
way
Cana
daU
nite
d …N
ethe
rland
sDe
nmar
kTu
rkey
Irela
ndCz
ech …
Spai
nG
erm
any
Gre
ece
Finl
and
Slov
enia
Pola
ndIta
lySl
ovak
…Au
stria
Hung
ary
Belg
ium
Fran
ceLu
xem
bour
g
OEC
D-34
…
Effective (↘) Official
Men
50
55
60
65
70
75
Turk
eyM
exic
oKo
rea
Chile
Japa
nN
ew …
Icel
and
Port
ugal
Uni
ted …
Swed
enN
orw
ayIs
rael
Switz
erla
ndIre
land
Spai
nAu
stra
liaEs
toni
aCa
nada
Uni
ted …
Net
herla
nds
Finl
and
Ger
man
yDe
nmar
kG
reec
eFr
ance
Pola
ndIta
lyCz
ech …
Belg
ium
Hung
ary
Luxe
mbo
urg
Aust
riaSl
oven
iaSl
ovak
…
OEC
D-34
…
Women
8 CONTRERAS, MARTELLUCCI & THUM
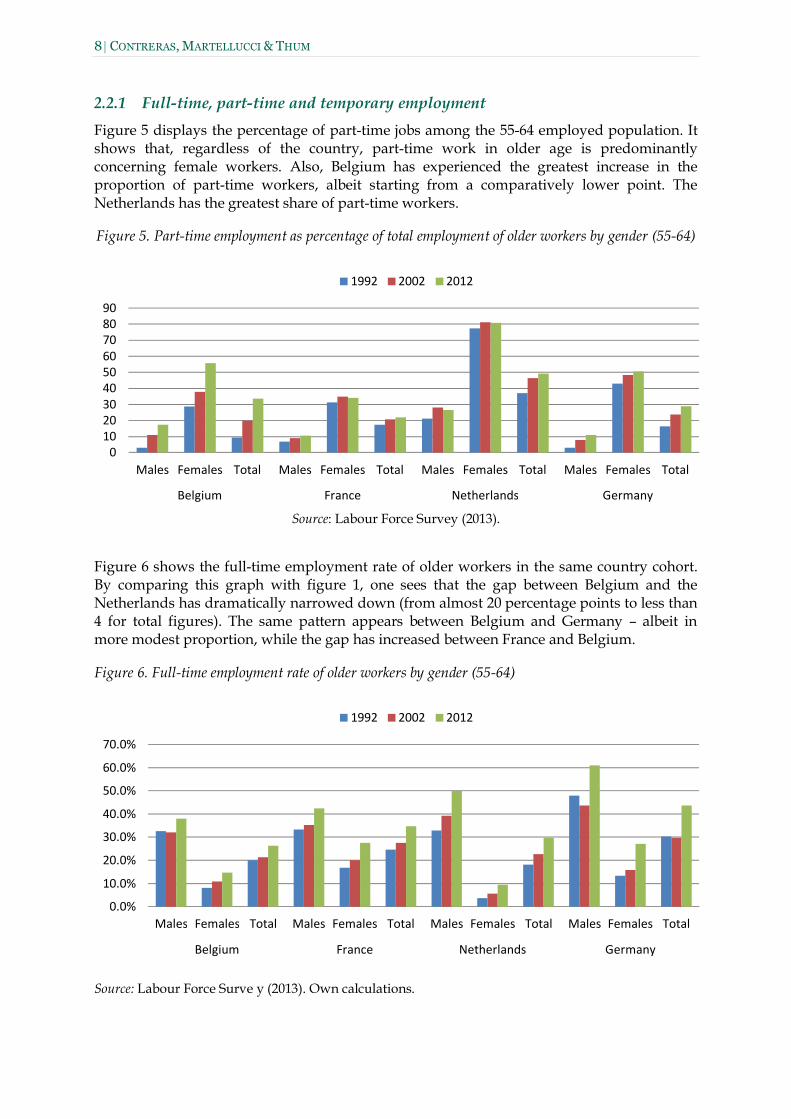
2.2.1 Full-time, part-time and temporary employment Figure 5 displays the percentage of part-time jobs among the 55-64 employed population. It shows that, regardless of the country, part-time work in older age is predominantly concerning female workers. Also, Belgium has experienced the greatest increase in the proportion of part-time workers, albeit starting from a comparatively lower point. The Netherlands has the greatest share of part-time workers.
Figure 5. Part-time employment as percentage of total employment of older workers by gender (55-64)
Source: Labour Force Survey (2013).
Figure 6 shows the full-time employment rate of older workers in the same country cohort. By comparing this graph with figure 1, one sees that the gap between Belgium and the Netherlands has dramatically narrowed down (from almost 20 percentage points to less than 4 for total figures). The same pattern appears between Belgium and Germany – albeit in more modest proportion, while the gap has increased between France and Belgium.
Figure 6. Full-time employment rate of older workers by gender (55-64)
Source: Labour Force Surve y (2013). Own calculations.
0102030405060708090
Males Females Total Males Females Total Males Females Total Males Females Total
Belgium France Netherlands Germany
1992 2002 2012
0.0%
10.0%
20.0%
30.0%
40.0%
50.0%
60.0%
70.0%
Males Females Total Males Females Total Males Females Total Males Females Total
Belgium France Netherlands Germany
1992 2002 2012

EXTENDING WORKING LIVES IN BELGIUM 9
We now look at the average work intensity of part-time jobs in Belgium. Figure 7 shows the number of hours usually worked per week for part-time workers across age and education. The pattern shows that more highly educated people tend to work more hours even when doing part-time job. It is not consistent with the last age group distribution, but this might be due to the restricted size of the sample for this group. Also, as age increases, so does the share of employment corresponding to the least amount of weekly worked hours (between 11 and 20 or less than 10 hours per week9).
Figure 7. Hours worked by age and education
Source: Labour Force Survey (2010). Own calculations. * Low reliability due to small number of observations.
This negative correlation between number of hours worked per week and the age group one belongs to could indicate that as people age they tend to prefer lighter working schedules10. In fact, working part-time can be a good way to improve work-life balance and therefore maintain older people at work. For this reason, full-time employment rate cannot be considered as a panacea when looking at activity in older age
To assess this claim, we are interested in whether the part-time employed workers would on average work full-time if they had a chance. Figure 8 gives some indications on the reasons for working part time and shows that only a small fraction of the part-time workers has chosen this employment scheme because they could not find a full-time job. This fraction even shrinks with age. Also, we see that the importance of ‘other reasons’ increases after 50.
9 Here, we assume that the first age-group has low comparability with the others as it also contains students working in part-time jobs but for whom being employed is not their main occupation. 10 We also see from the EU LFS data that part-time employment as such is more widespread across older age groups. This result is however pretty well documented already, which is why we do not display data here.
0
20
40
60
80
100
Low
Med
ium
High
Low
Med
ium
High
Low
Med
ium
High
Low
Med
ium
High
Low
Med
ium
High
15-34 35-49 50-59 60-64 65-74*
<10 11-20 21-30 31+
10 CONTRERAS, MARTELLUCCI & THUM
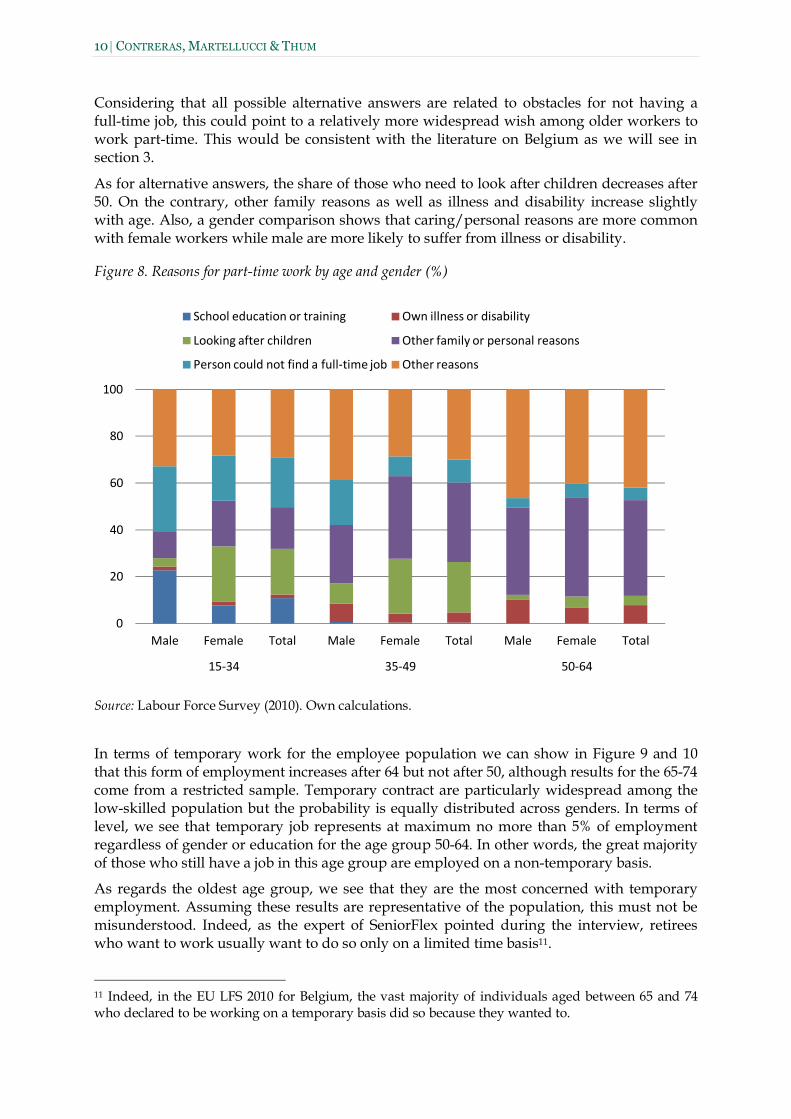
Considering that all possible alternative answers are related to obstacles for not having a full-time job, this could point to a relatively more widespread wish among older workers to work part-time. This would be consistent with the literature on Belgium as we will see in section 3.
As for alternative answers, the share of those who need to look after children decreases after 50. On the contrary, other family reasons as well as illness and disability increase slightly with age. Also, a gender comparison shows that caring/personal reasons are more common with female workers while male are more likely to suffer from illness or disability.
Figure 8. Reasons for part-time work by age and gender (%)
Source: Labour Force Survey (2010). Own calculations.
In terms of temporary work for the employee population we can show in Figure 9 and 10 that this form of employment increases after 64 but not after 50, although results for the 65-74 come from a restricted sample. Temporary contract are particularly widespread among the low-skilled population but the probability is equally distributed across genders. In terms of level, we see that temporary job represents at maximum no more than 5% of employment regardless of gender or education for the age group 50-64. In other words, the great majority of those who still have a job in this age group are employed on a non-temporary basis.
As regards the oldest age group, we see that they are the most concerned with temporary employment. Assuming these results are representative of the population, this must not be misunderstood. Indeed, as the expert of SeniorFlex pointed during the interview, retirees who want to work usually want to do so only on a limited time basis11.
11 Indeed, in the EU LFS 2010 for Belgium, the vast majority of individuals aged between 65 and 74 who declared to be working on a temporary basis did so because they wanted to.
0
20
40
60
80
100
Male Female Total Male Female Total Male Female Total
15-34 35-49 50-64
School education or training Own illness or disability
Looking after children Other family or personal reasons
Person could not find a full-time job Other reasons

EXTENDING WORKING LIVES IN BELGIUM 11
Figure 9. Temporary work by age and gender (%)
Source: Labour Force Survey (2010). Own calculations. * Low reliability due to limited number of observations.
Figure 10. Temporary work by age and education (%)
Source: Labour Force Survey (2010). Own calculations. * Low reliability due to limited number of observations.
0
5
10
15
20
25
Male Female Total Male Female Total Male Female Total Male Female Total
15-34 35-49 50-64 65-74*
0
5
10
15
20
25
30
35
Low
Med
ium
High
Low
Med
ium
High
Low
Med
ium
High
Low
Med
ium
High
15-34 35-49 50-64 65-74*
12 CONTRERAS, MARTELLUCCI & THUM
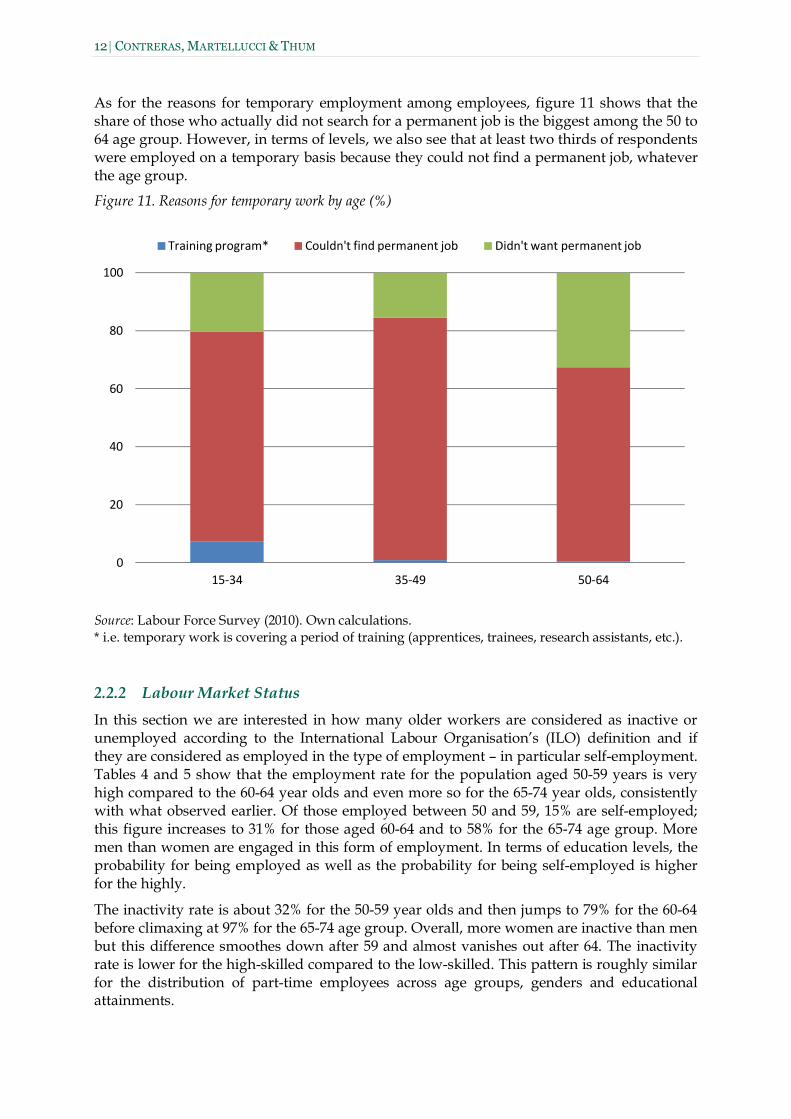
As for the reasons for temporary employment among employees, figure 11 shows that the share of those who actually did not search for a permanent job is the biggest among the 50 to 64 age group. However, in terms of levels, we also see that at least two thirds of respondents were employed on a temporary basis because they could not find a permanent job, whatever the age group.
Figure 11. Reasons for temporary work by age (%)
Source: Labour Force Survey (2010). Own calculations. * i.e. temporary work is covering a period of training (apprentices, trainees, research assistants, etc.).
2.2.2 Labour Market Status In this section we are interested in how many older workers are considered as inactive or unemployed according to the International Labour Organisation’s (ILO) definition and if they are considered as employed in the type of employment – in particular self-employment. Tables 4 and 5 show that the employment rate for the population aged 50-59 years is very high compared to the 60-64 year olds and even more so for the 65-74 year olds, consistently with what observed earlier. Of those employed between 50 and 59, 15% are self-employed; this figure increases to 31% for those aged 60-64 and to 58% for the 65-74 age group. More men than women are engaged in this form of employment. In terms of education levels, the probability for being employed as well as the probability for being self-employed is higher for the highly.
The inactivity rate is about 32% for the 50-59 year olds and then jumps to 79% for the 60-64 before climaxing at 97% for the 65-74 age group. Overall, more women are inactive than men but this difference smoothes down after 59 and almost vanishes out after 64. The inactivity rate is lower for the high-skilled compared to the low-skilled. This pattern is roughly similar for the distribution of part-time employees across age groups, genders and educational attainments.
0
20
40
60
80
100
15-34 35-49 50-64
Training program* Couldn't find permanent job Didn't want permanent job

EXTENDING WORKING LIVES IN BELGIUM 13
Table 4. Labour Market Status by age and gender (%)
Age group and Gender
50-59 60-64 65-74
Male Female Total Male Female Total Male Female Total
Labo
ur s
tatu
s
Unemployed 4 3 4 1 1 1 0 0 0
Employed 74 55 64 26 14 20 4 2 3 Full-time employee
68 38 55 49 32 43 10 8 10 Part-time employee
13 49 28 12 41 23 20 28 22
Family worker 0 3 1 1 7 3 6 17 10
Self-employed 19 9 15 38 20 31 63 47 58
Inactive 22 42 32 73 85 79 96 98 97
Total 100 100 100 100 100 100 100 100 100 Source: Labour Force Survey (2010). Own calculations.
Table 5. Labour Market Status by age and education (%)
Age group and Education
50-59 60-64 65-74
Low Medium High Low Medium High Low Medium High
Labo
ur s
tatu
s
Unemployed 5 4 3 1 0 1 0 0 0
Employed 50 69 79 13 21 33 2 3 6 Full-time employee
53 55 59 36 41 51 7 5 17 Part-time employee
34 30 22 29 24 17 24 26 18
Family worker 1 2 1 4 4 2 14 12 4
Self-employed 11 14 19 32 32 31 55 58 61 Inactive 46 27 18 86 79 66 98 97 94
Total 100 100 100 100 100 100 100 100 100 Source: Labour Force Survey (2010). Own calculations.
Being inactive according to the ILO definition does not necessarily mean staying idle at home. Likewise, inactive older workers might be engaging in informal paid/unpaid activities – in particular in family care or religious / civic engagement. We explore this claim in the next section.
2.2.3 Engagement in alternative forms of (un)paid activities To investigate engagement in alternative forms of (un)paid activities, we use non-weighted SHARE data12 for 2010 for Belgian individuals aged over 50 who declared to be either retired and not working whatsoever or homemakers.
12 The Survey of Health, Ageing and Retirement in Europe; available at http://www.share-project.org/
14 CONTRERAS, MARTELLUCCI & THUM
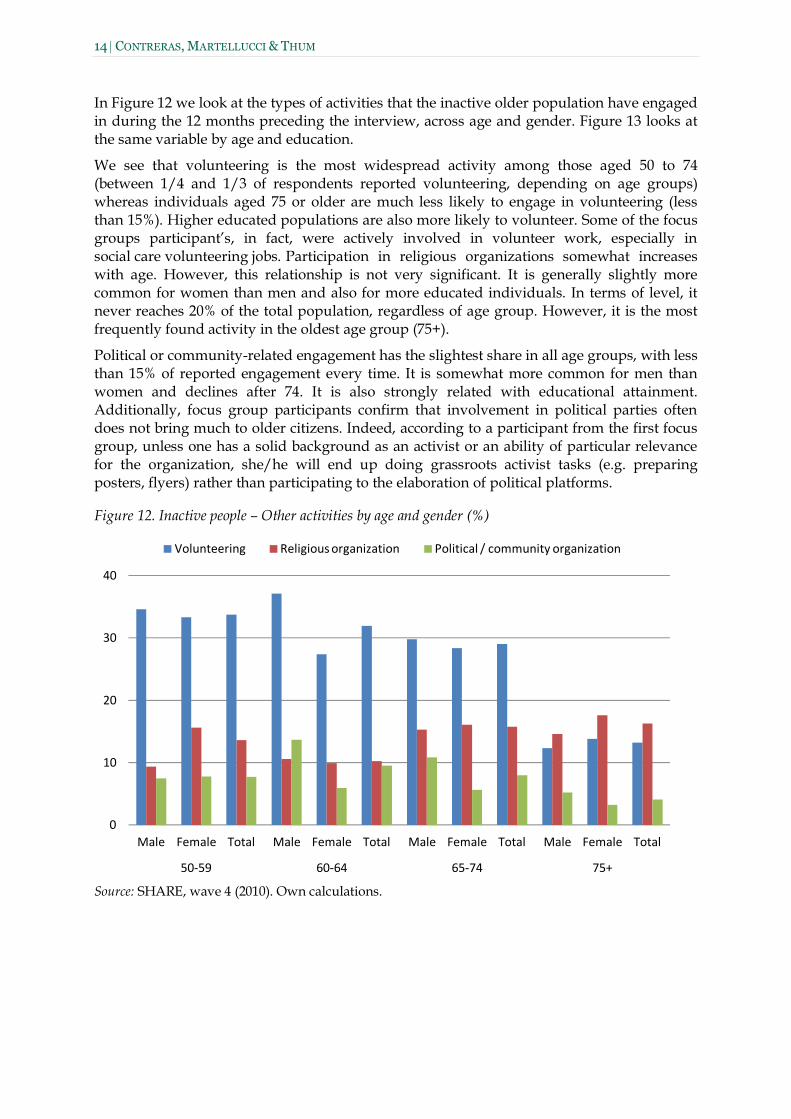
In Figure 12 we look at the types of activities that the inactive older population have engaged in during the 12 months preceding the interview, across age and gender. Figure 13 looks at the same variable by age and education.
We see that volunteering is the most widespread activity among those aged 50 to 74 (between 1/4 and 1/3 of respondents reported volunteering, depending on age groups) whereas individuals aged 75 or older are much less likely to engage in volunteering (less than 15%). Higher educated populations are also more likely to volunteer. Some of the focus groups participant’s, in fact, were actively involved in volunteer work, especially in social care volunteering jobs. Participation in religious organizations somewhat increases with age. However, this relationship is not very significant. It is generally slightly more common for women than men and also for more educated individuals. In terms of level, it never reaches 20% of the total population, regardless of age group. However, it is the most frequently found activity in the oldest age group (75+).
Political or community-related engagement has the slightest share in all age groups, with less than 15% of reported engagement every time. It is somewhat more common for men than women and declines after 74. It is also strongly related with educational attainment. Additionally, focus group participants confirm that involvement in political parties often does not bring much to older citizens. Indeed, according to a participant from the first focus group, unless one has a solid background as an activist or an ability of particular relevance for the organization, she/he will end up doing grassroots activist tasks (e.g. preparing posters, flyers) rather than participating to the elaboration of political platforms.
Figure 12. Inactive people – Other activities by age and gender (%)
Source: SHARE, wave 4 (2010). Own calculations.
0
10
20
30
40
Male Female Total Male Female Total Male Female Total Male Female Total
50-59 60-64 65-74 75+
Volunteering Religious organization Political / community organization

EXTENDING WORKING LIVES IN BELGIUM 15
Figure 13.Inactive people – Other activities by age and education (%)
Source: SHARE, wave 4 (2010). Own calculations.
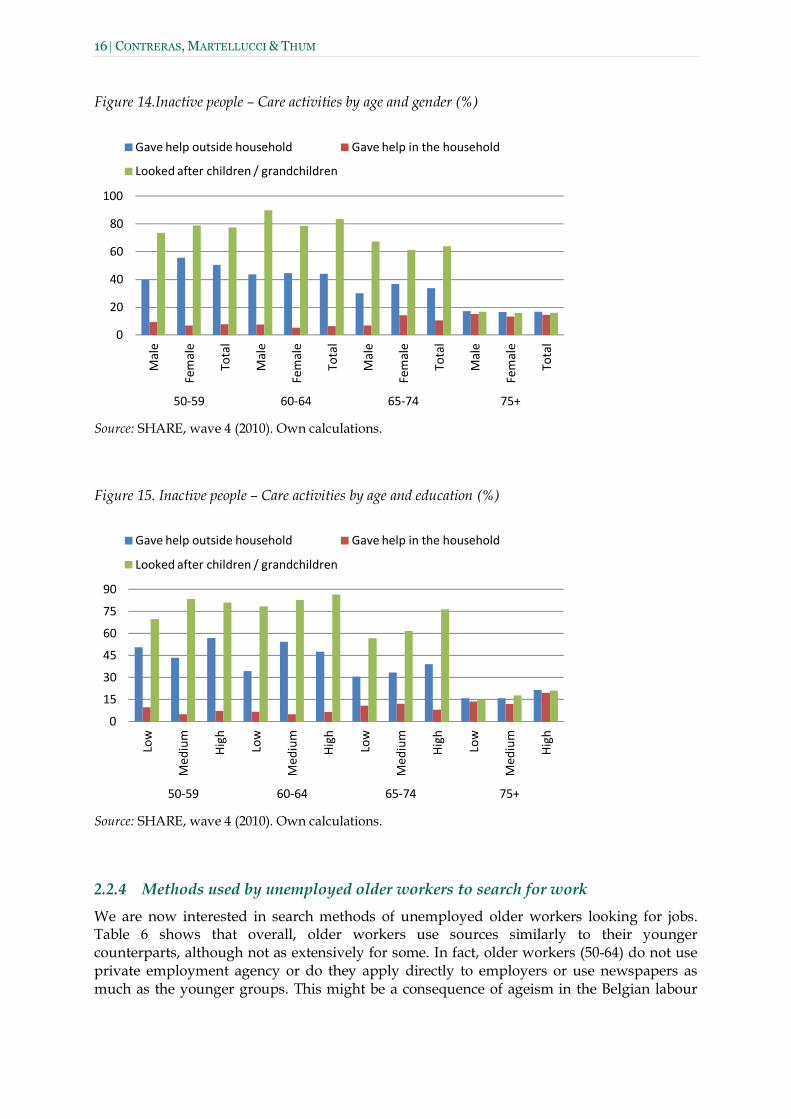
Figure 14 and 15 display the proportion of individuals who engaged in care activities (giving help to someone outside/in the household and looking after children) within the last 12 months before the interview by, respectively, age and gender and age and education.
Giving help to someone outside the household is relatively widespread (around 40% of the 50-74) albeit it occurs on a much reduced basis after 74. It is also more common for women than for men and is somewhat positively related to education.
Helping a household member is the least encountered caring activity. It however increases with age, eventually reaching levels comparable to other types of activity after age 74. It displays no clear relationship with education or gender.
Taking care of children or grandchildren is the most frequent care activity. It occurs even more commonly after 59 but not after 64 when its share starts to decrease before collapsing after 74. Surprisingly, men are found to take care of children more often in two age groups (60-64 and 65-74). Also, highly educated parents/grandparents tend to look after their descendants more than those with a lower educational background.
As a conclusive remark, it is important to distinguish the effect of age from that of generation (Service Public Fédéral Emploi, Travail et Concertation Sociale, 2009). Indeed, the lower participation of the 75+ in activities other than employment might be due to the fact that this generation was born before World War II. Conversely, the 50-74 cohorts comprise mostly baby boomers. The relatively high levels of participation in activities alternative to employment confirms the vision of this generation established in the demographic section.
0
15
30
45
60
Low
Med
ium
High
Low
Med
ium
High
Low
Med
ium
High
Low
Med
ium
High
50-59 60-64 65-74 75+
Volunteering Religious organization Political / community organization
16 CONTRERAS, MARTELLUCCI & THUM
Figure 14.Inactive people – Care activities by age and gender (%)
Source: SHARE, wave 4 (2010). Own calculations.
Figure 15. Inactive people – Care activities by age and education (%)
Source: SHARE, wave 4 (2010). Own calculations.
2.2.4 Methods used by unemployed older workers to search for work We are now interested in search methods of unemployed older workers looking for jobs. Table 6 shows that overall, older workers use sources similarly to their younger counterparts, although not as extensively for some. In fact, older workers (50-64) do not use private employment agency or do they apply directly to employers or use newspapers as much as the younger groups. This might be a consequence of ageism in the Belgian labour
0
20
40
60
80
100
Mal
e
Fem
ale
Tota
l
Mal
e
Fem
ale
Tota
l
Mal
e
Fem
ale
Tota
l
Mal
e
Fem
ale
Tota
l
50-59 60-64 65-74 75+
Gave help outside household Gave help in the household
Looked after children / grandchildren
0
15
30
45
60
75
90
Low
Med
ium
High
Low
Med
ium
High
Low
Med
ium
High
Low
Med
ium
High
50-59 60-64 65-74 75+
Gave help outside household Gave help in the household
Looked after children / grandchildren

EXTENDING WORKING LIVES IN BELGIUM 17
market; making older workers less likely to confront employers directly, or reflect the non-constraining aspect of the activation system for older unemployed workers (see section 3.).
In terms of level, most of the workers in age group 50-64 still use public employment agencies, followed by newspapers and asking friends.
The SeniorFlex expert argued that networking should be taught to older workers, so they have access to the ‘hidden’ labour market and to job offers that are not yet public, and therefore not as toughly disputed.
Table 6. Methods to search for work (%)
Age group
15-34 35-49 50-64 65-74
Met
hods
use
d to
sea
rch
for w
ork
Public employment office 54 49 52 9
Private employment agency 36 32 28 10
Applied to employer 30 26 23 22
Asked friends, relatives, trade unions 32 32 33 32
Inserted / answered ads in newspapers 19 18 16 0
Studied ad in newspapers 52 51 46 31
Took a test, interview / exam 12 11 9 0
Looked for land, premises, equipment 0 0 0 0
Looked for permits, licenses, financial resources 1 1 0 0
Other 3 4 4 0
Source: Labour Force Survey (2010). Own calculations
2.2.5 Duration of unemployment We now consider the duration of unemployment across ages. During the interview, the SeniorFlex representative insisted on the difficulty for older unemployed workers to find a new employer once they lose their job. Moreover, older individuals have lived longer than their younger peers. We therefore expect duration of unemployment to increase with age.
Figure 16 breaks duration of unemployment by age and education. As was expected, the duration of unemployment is longer for the older age group as approximately two thirds of the 50-64 unemployed have been looking for employment for more than a year. Figure 16 also shows that duration of unemployment is correlated with education though the relationship wears off as individuals get older. Overall these data confirm the Senior Flex’ experts claim, indicating that the vast majority of older unemployed are actually long-term unemployed, regardless of education level.

18 CONTRERAS, MARTELLUCCI & THUM
Figure 16. Duration of unemployment by age and education (%)
Source: Labour Force Survey (2010). Own calculations.
2.3 Lifelong learning of the elderly in Belgium In this section we study the lifelong learning situation in Belgium. Lifelong learning is usually classified in three different forms (Field 2005): formal, informal and non-formal learning. Formal learning refers to learning taking place in an institution designated for education; non-formal education refers to training in a formal class but not given by an institution designated at education (for example a trade union) and informal learning refers to learning through experiences during the daily course of life (for example reading a book).
First, we analyse education levels by age group and gender and find – as Figure 17 shows – that younger cohorts are more educated than their older counterparts (see also for example OECD 2010). We observe that the educational gender gap has reversed over time: in the oldest age group, men are definitely better educated, but the levels even out for the 50-64. Then, as we go towards younger age group, females are increasingly better educated than men.
Figure 17. Education by age group and gender (%)
Source: Labour Force Survey (2010). Own calculations.
0
20
40
60
80
100
Low Medium High Low Medium High Low Medium High
15-34 35-49 50-64
Less than 6 months 6-11 months 1 year or more
0
20
40
60
80
100
Male Female Male Female Male Female Male Female
15-34 35-49 50-64 65-74
Low Medium High
EXTENDING WORKING LIVES IN BELGIUM 19
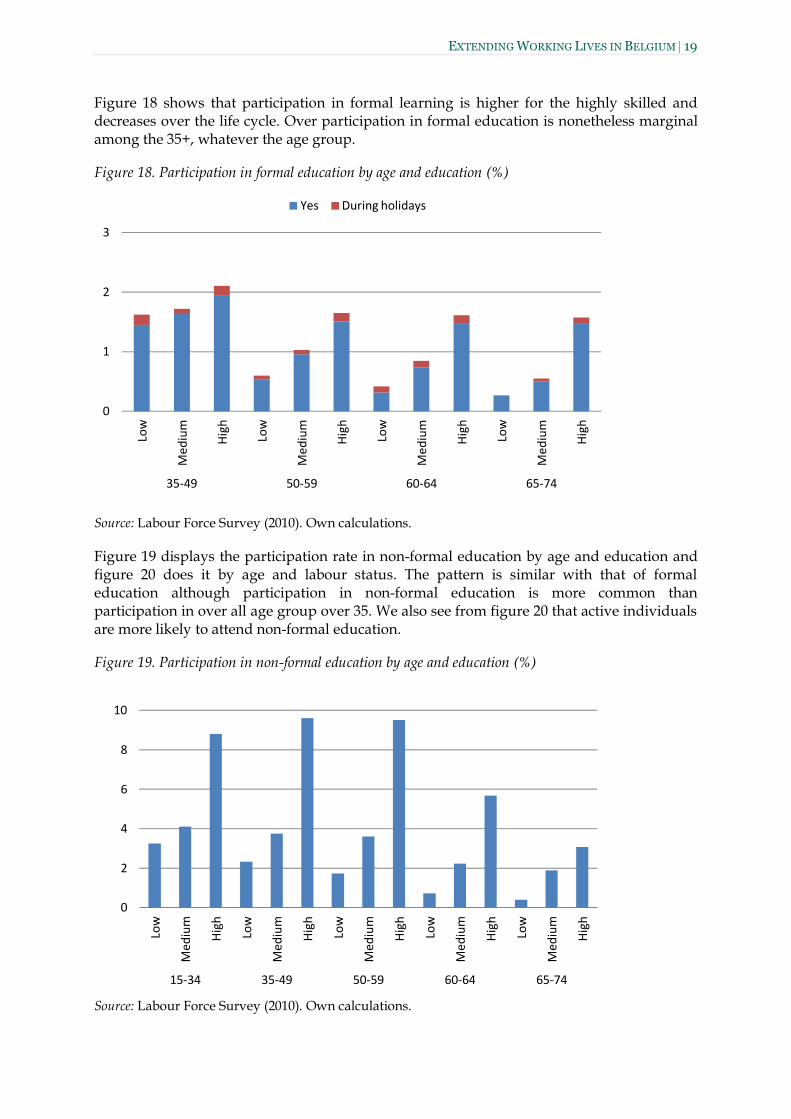
Figure 18 shows that participation in formal learning is higher for the highly skilled and decreases over the life cycle. Over participation in formal education is nonetheless marginal among the 35+, whatever the age group.
Figure 18. Participation in formal education by age and education (%)
Source: Labour Force Survey (2010). Own calculations.
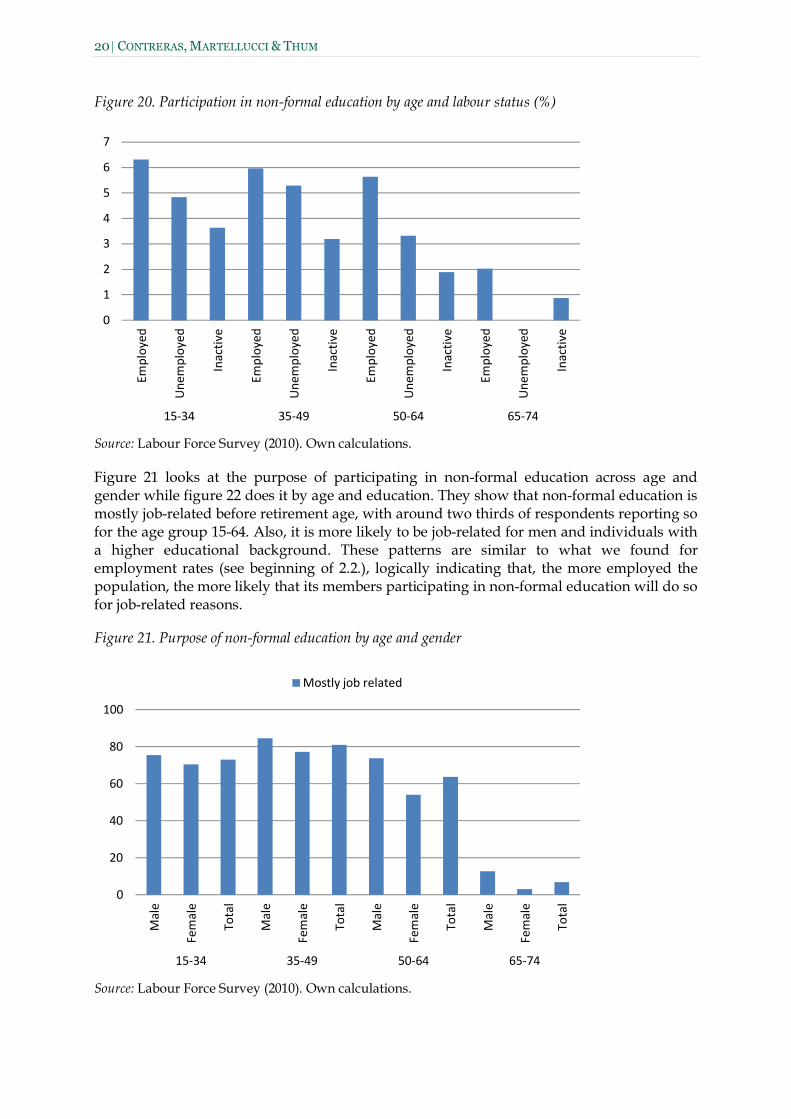
Figure 19 displays the participation rate in non-formal education by age and education and figure 20 does it by age and labour status. The pattern is similar with that of formal education although participation in non-formal education is more common than participation in over all age group over 35. We also see from figure 20 that active individuals are more likely to attend non-formal education.
Figure 19. Participation in non-formal education by age and education (%)
Source: Labour Force Survey (2010). Own calculations.
0
1
2
3
Low
Med
ium
High
Low
Med
ium
High
Low
Med
ium
High
Low
Med
ium
High
35-49 50-59 60-64 65-74
Yes During holidays
0
2
4
6
8
10
Low
Med
ium
High
Low
Med
ium
High
Low
Med
ium
High
Low
Med
ium
High
Low
Med
ium
High
15-34 35-49 50-59 60-64 65-74
20 CONTRERAS, MARTELLUCCI & THUM
Figure 20. Participation in non-formal education by age and labour status (%)
Source: Labour Force Survey (2010). Own calculations.
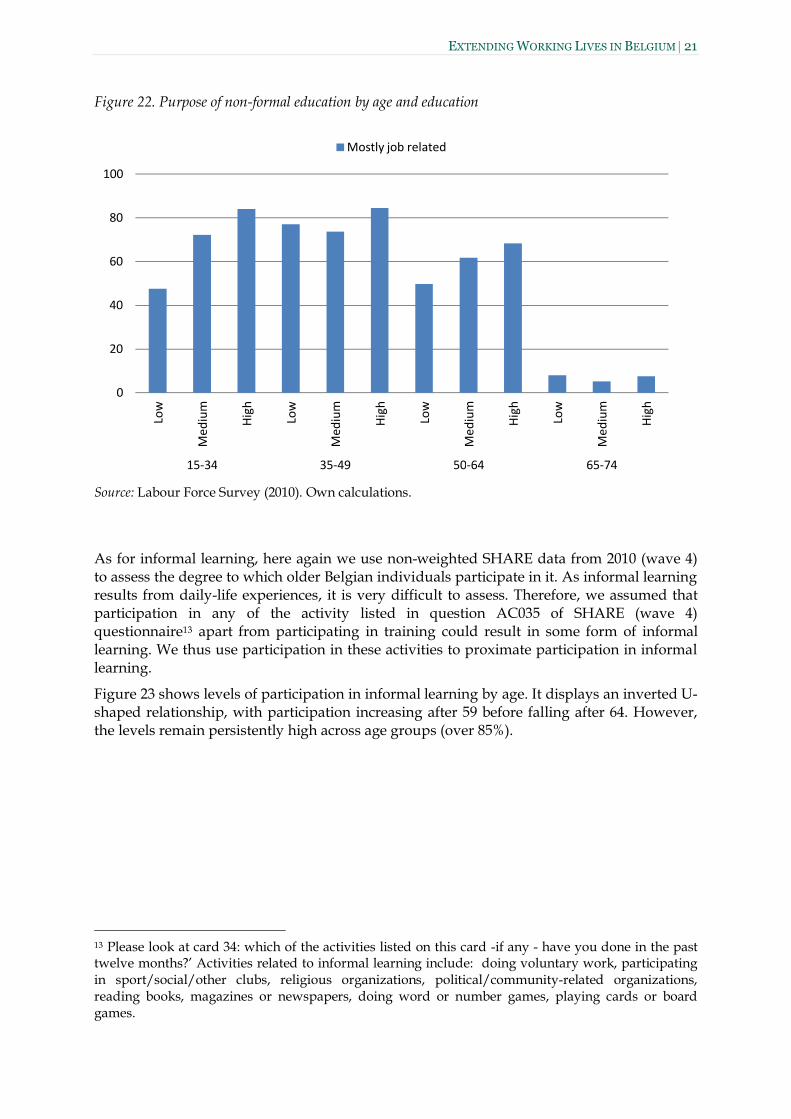
Figure 21 looks at the purpose of participating in non-formal education across age and gender while figure 22 does it by age and education. They show that non-formal education is mostly job-related before retirement age, with around two thirds of respondents reporting so for the age group 15-64. Also, it is more likely to be job-related for men and individuals with a higher educational background. These patterns are similar to what we found for employment rates (see beginning of 2.2.), logically indicating that, the more employed the population, the more likely that its members participating in non-formal education will do so for job-related reasons.
Figure 21. Purpose of non-formal education by age and gender
Source: Labour Force Survey (2010). Own calculations.
0
1
2
3
4
5
6
7Em
ploy
ed
Une
mpl
oyed
Inac
tive
Empl
oyed
Une
mpl
oyed
Inac
tive
Empl
oyed
Une
mpl
oyed
Inac
tive
Empl
oyed
Une
mpl
oyed
Inac
tive
15-34 35-49 50-64 65-74
0
20
40
60
80
100
Mal
e
Fem
ale
Tota
l
Mal
e
Fem
ale
Tota
l
Mal
e
Fem
ale
Tota
l
Mal
e
Fem
ale
Tota
l
15-34 35-49 50-64 65-74
Mostly job related
EXTENDING WORKING LIVES IN BELGIUM 21
Figure 22. Purpose of non-formal education by age and education
Source: Labour Force Survey (2010). Own calculations.
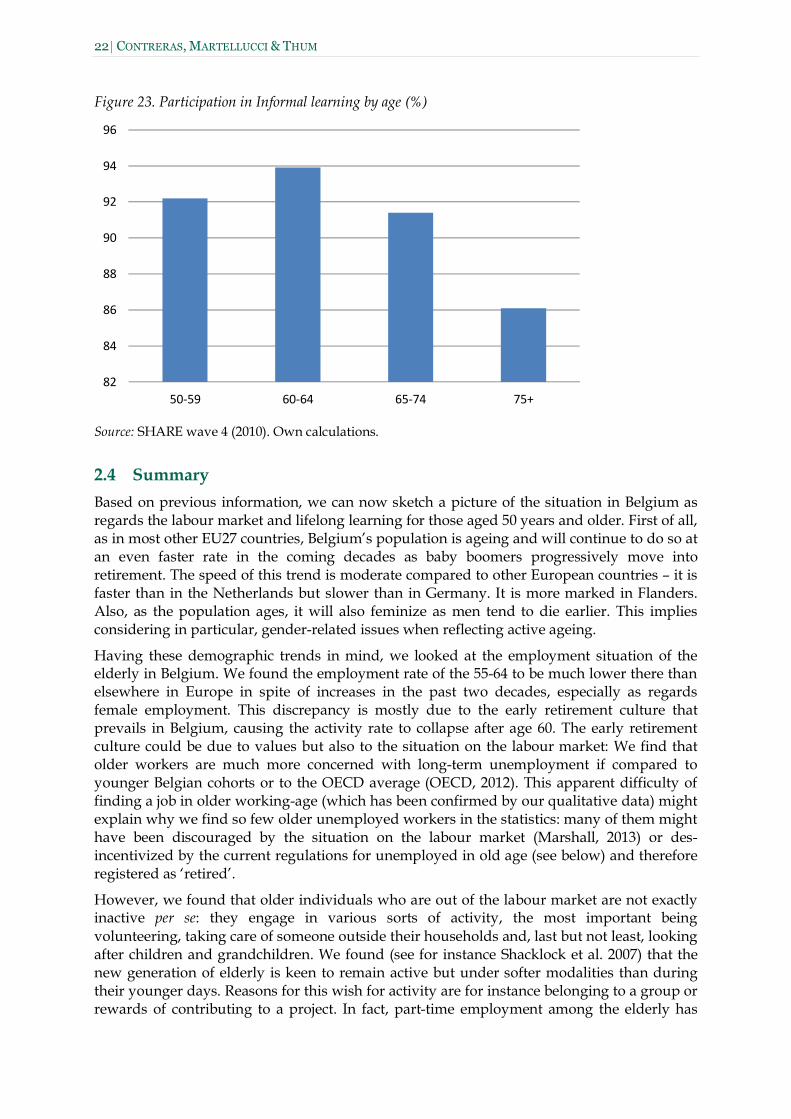
As for informal learning, here again we use non-weighted SHARE data from 2010 (wave 4) to assess the degree to which older Belgian individuals participate in it. As informal learning results from daily-life experiences, it is very difficult to assess. Therefore, we assumed that participation in any of the activity listed in question AC035 of SHARE (wave 4) questionnaire13 apart from participating in training could result in some form of informal learning. We thus use participation in these activities to proximate participation in informal learning.
Figure 23 shows levels of participation in informal learning by age. It displays an inverted U-shaped relationship, with participation increasing after 59 before falling after 64. However, the levels remain persistently high across age groups (over 85%).
13 Please look at card 34: which of the activities listed on this card -if any - have you done in the past twelve months?’ Activities related to informal learning include: doing voluntary work, participating in sport/social/other clubs, religious organizations, political/community-related organizations, reading books, magazines or newspapers, doing word or number games, playing cards or board games.
0
20
40
60
80
100Lo
w
Med
ium
High
Low
Med
ium
High
Low
Med
ium
High
Low
Med
ium
High
15-34 35-49 50-64 65-74
Mostly job related
22 CONTRERAS, MARTELLUCCI & THUM
Figure 23. Participation in Informal learning by age (%)
Source: SHARE wave 4 (2010). Own calculations.
2.4 Summary Based on previous information, we can now sketch a picture of the situation in Belgium as regards the labour market and lifelong learning for those aged 50 years and older. First of all, as in most other EU27 countries, Belgium’s population is ageing and will continue to do so at an even faster rate in the coming decades as baby boomers progressively move into retirement. The speed of this trend is moderate compared to other European countries – it is faster than in the Netherlands but slower than in Germany. It is more marked in Flanders. Also, as the population ages, it will also feminize as men tend to die earlier. This implies considering in particular, gender-related issues when reflecting active ageing.
Having these demographic trends in mind, we looked at the employment situation of the elderly in Belgium. We found the employment rate of the 55-64 to be much lower there than elsewhere in Europe in spite of increases in the past two decades, especially as regards female employment. This discrepancy is mostly due to the early retirement culture that prevails in Belgium, causing the activity rate to collapse after age 60. The early retirement culture could be due to values but also to the situation on the labour market: We find that older workers are much more concerned with long-term unemployment if compared to younger Belgian cohorts or to the OECD average (OECD, 2012). This apparent difficulty of finding a job in older working-age (which has been confirmed by our qualitative data) might explain why we find so few older unemployed workers in the statistics: many of them might have been discouraged by the situation on the labour market (Marshall, 2013) or des-incentivized by the current regulations for unemployed in old age (see below) and therefore registered as ‘retired’.
However, we found that older individuals who are out of the labour market are not exactly inactive per se: they engage in various sorts of activity, the most important being volunteering, taking care of someone outside their households and, last but not least, looking after children and grandchildren. We found (see for instance Shacklock et al. 2007) that the new generation of elderly is keen to remain active but under softer modalities than during their younger days. Reasons for this wish for activity are for instance belonging to a group or rewards of contributing to a project. In fact, part-time employment among the elderly has
82
84
86
88
90
92
94
96
50-59 60-64 65-74 75+

EXTENDING WORKING LIVES IN BELGIUM 23
actually risen in recent times in Belgium – in particular among the female population – and Belgium is closing the gap with respect to this issue to neighbouring countries Germany and Netherlands.
Finally, we looked at the situation regarding lifelong learning. A first observation is that younger generations are better educated than older ones. Not less important is the fact that the educational gender gap progressively reverses for younger age groups, with women eventually being better educated than men. We also found attendance to formal education to be marginal among the 35+ population in Belgium, whatever the age. On the other hand, non-formal education is somewhat more widespread, especially among the medium- and highly-educated individuals. It is also closely linked to employment. Although we cannot determine it from the data, it is possible to assume that the causality goes both ways: updating skills improves employability, but employed individuals are more likely to participate in non-formal learning (Riedel and Hofer 2013). Finally, informal learning is definitely the most widespread form of education in older age, as it concerns more than 80% of all age groups after 50. This hints already at a readiness among the elderly to actively age.
3. Active ageing in Belgium: Underlying issues for designing successful national policies and innovative practices
Before going on further with discussions on active ageing policies and practices in Belgium, it is worth reviewing briefly the evolution of careers and life-courses in general over the last half-century. When designing policies and practices to promote active ageing, two issues should receive consideration: (1) a new vision of the life-course which accounts for flexibility between periods of learning, working and leisure and (2) the balance of activity in society.
In the second half of the 20th century, scholars had a tripartite vision of the life-course, based on age (see for instance Kohli, 1986): young age was supposed to be dedicated to training, prime-age to working and old age to retiring. Nevertheless, the radical mutation of the world economy which occurred from the 1980s on has led to the emergence of a New Employment Relationship (Cappelli, 1999) where risks and related responsibility are passed on from the management to workers in order to maintain a structure that is flexible enough to sustain the wind of competition (Marshall, 2013; Hansez et al., 2011; Salazar-Xirinachs, 2012; Securex, 2012). Training, working and leisure/inactivity periods therefore intertwine in non-linear ways and we speak of a ‘des-institutionalization’ of life-courses
Furthermore, the extension of working-lives might conflict with social roles other than working, such as that of care giver or family member. The baby boomers are increasingly called upon to both work longer and take care of the younger and older generations.
Based on these trends, we can already set a partial basis for active ageing in Belgium: Firstly, lifelong learning in the context of active ageing should not be restricted to adult and job-related learning only. Secondly, active ageing policies should give the possibility to individuals to manage their different social roles: if, for a given age group, the accent is put on a social role (e.g. working) at the expense of another (e.g. taking care of a relative), then comprehensive active ageing strategies should address the subsequent imbalances.
In the remainder of this section we review current policies and practices enhancing active ageing in Belgium based on a review of the literature and a set of expert interviews as well as two focus groups. As mentioned in the introduction, the interviews were conducted with experts from a company (A. Schulman), a public body working for the employment of older workers (Fonds de l’Expérience Professionnelle, FEP), a lobby for the promotion of employment
24 CONTRERAS, MARTELLUCCI & THUM
in old age (SeniorFlex) and a trade union (Fédération Générale du Travail de Belgique, FGTB). The focus groups were conducted with older workers and learners older than 5014.
Based on the interview with the FGTB representative and on the results derived from the descriptive statistics in section 2, we split the following discussion between two age groups: We first address active ageing with regards to older workers, aged 50 to 64, and then with regard to those older than 65, the legal retirement age in Belgium.
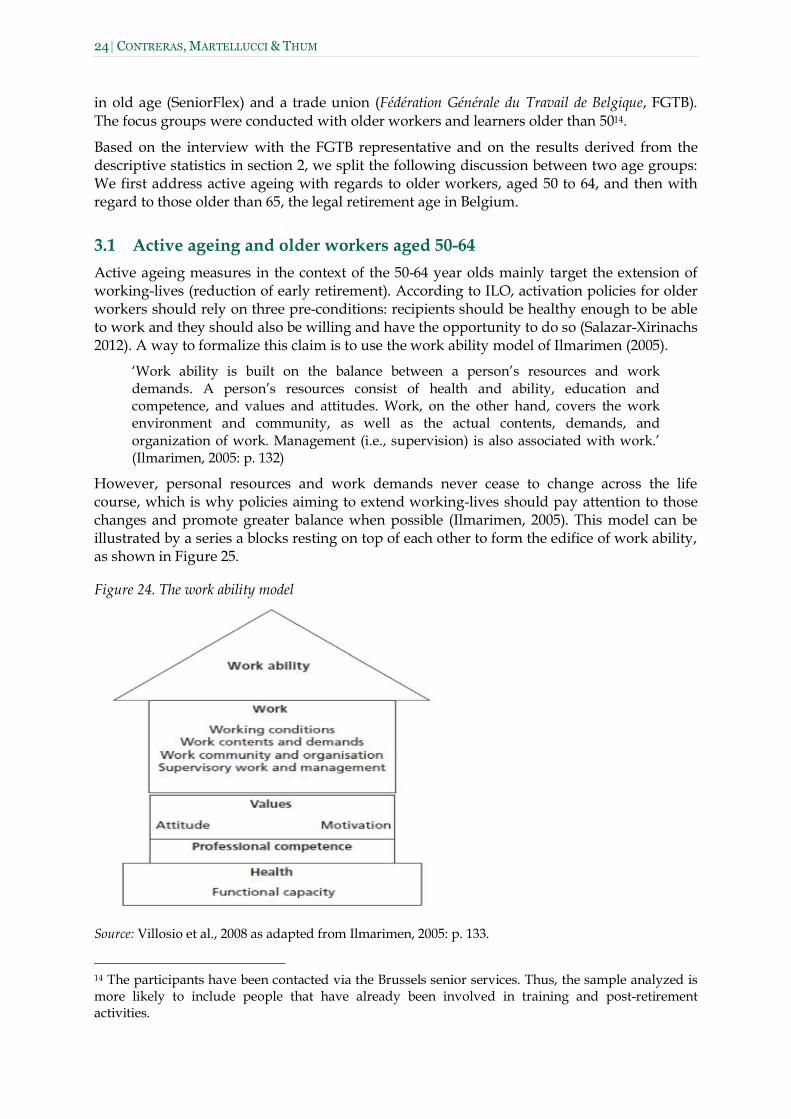
3.1 Active ageing and older workers aged 50-64 Active ageing measures in the context of the 50-64 year olds mainly target the extension of working-lives (reduction of early retirement). According to ILO, activation policies for older workers should rely on three pre-conditions: recipients should be healthy enough to be able to work and they should also be willing and have the opportunity to do so (Salazar-Xirinachs 2012). A way to formalize this claim is to use the work ability model of Ilmarimen (2005).
‘Work ability is built on the balance between a person’s resources and work demands. A person’s resources consist of health and ability, education and competence, and values and attitudes. Work, on the other hand, covers the work environment and community, as well as the actual contents, demands, and organization of work. Management (i.e., supervision) is also associated with work.’ (Ilmarimen, 2005: p. 132)
However, personal resources and work demands never cease to change across the life course, which is why policies aiming to extend working-lives should pay attention to those changes and promote greater balance when possible (Ilmarimen, 2005). This model can be illustrated by a series a blocks resting on top of each other to form the edifice of work ability, as shown in Figure 25.
Figure 24. The work ability model
Source: Villosio et al., 2008 as adapted from Ilmarimen, 2005: p. 133.
14 The participants have been contacted via the Brussels senior services. Thus, the sample analyzed is more likely to include people that have already been involved in training and post-retirement activities.

EXTENDING WORKING LIVES IN BELGIUM 25
Accordingly, the following development will first deal with the personal resources of older working-age (50-64) individuals in Belgium and related good practices. We first focus on health at work and then look at life-long (vocational) learning and skills. Subsequently, we address willingness to work among older workers and underlying reasons. Finally, we provide a discussion of the impact of the pension system on willingness to work. In a second step we analyse work demands, starting with a general review of age management in Belgium. We also give some insights in management's views about the extension of working lives. Then, we discuss workplace stereotypes and their impact on values and attitudes of older workers. Finally, we look at working conditions and job quality. Thereafter, we address the extension of working lives and the intensification of lifelong learning from an employer's perspective. In particular we discuss if the evolution of work ability throughout the life course is problematic for the employment and the training of older workers (50-64). In the fourth part, we discuss some interactions in the labour market that are relevant for active ageing in general and for the extension of working-lives in particular. Finally, the first part of this section concludes with a review of entrepreneurship in old working-age in Belgium, starting from the observations formulated by the SeniorFlex expert and the importance of self-employment among older workers (cf. descriptive statistics above).
3.1.1 Supply side: Personal resources
3.1.1.1 Health
As reported by focus groups participant’s health is the key to staying active throughout life. Increasing the employment rate of older workers first requires more people to be able to work. As Riedel and Hofer (2013) put it:
‘In the literature, one of the most discussed determinants of an individual’s retirement decision is health. According to economic theory, a poorer health status decreases the probability of continued work due to several reasons: increased disutility from work, reduced return from work via lower wages and entitlement to benefits contingent on not working.’ (Riedel and Hofer, 2013: p. 4)
In order to review the situation as regards general health and health at work in Belgium, we use two main sources, unless indicated otherwise. The first one is an analysis of the impact of work on health in Belgium by Hansez (2013) based on data from the European Working Condition Survey for 2010. We also refer to an information note from the FGTB, year 2012, that reports and analyses data on disabilities for year 2011. These data come from the Fond des Accidents du Travail's (Work Accident Fund) annual statistics.
The most common work-related health problems in Belgium in 2010 were musculoskeletal disorders (backache and muscular pains) and headaches and fatigue. Moreover, over the past few years, Belgium has known a dramatic increase in work-related disabilities, amounting to +42% in 10 years (RTBF, 2013). In relative terms, 8% of the 50-64 were disabled in 2011 compared to 6.5% in 2000 (OECD, 2012). This surge can be attributed to multiple sources. First, higher levels of disability are reported in the statistics for women in all age group but particularly for the 60-64. In fact, as the early retirement conditions for female workers are getting more restrictive (see below), women are increasingly registering as disabled rather than retired when reaching the 60-64 age group, hence the increase in the proportion of disabled (OECD, 2012). As for the increase in absolute terms, the national institute in charge of disability benefits, the INAMI, claims it is mostly due to labour force growth and to the development of psychological pathologies, notably burn-outs. They also note that not only have the incidence of psychological diseases increased in the labour force
26 CONTRERAS, MARTELLUCCI & THUM
over the years, but they are also better taken in charge and therefore more reported than in the past (RTBF, 2013).
In Belgium, the main determinants of psychological and physical health are found to be those variables related to social relations (presence and degree of harassment, supportive management and social support), career opportunities, emotional pressure, speed pressure and environmental risks.
Also, it is possible to isolate vulnerable groups. For instance, men are in general psychologically better off but physically worse off than women. In 2011, more than 70% of work accidents concerned male workers. Also, a work accident is more likely to result in permanent disability for men than women, and the quasi-totality of lethal accidents concerns men. Education is also found to be a significant determinant of general health. However, no clear statistical relationship is found between educational attainment and psychological health. As for age, both physical and psychological health decrease as individuals get older, but more than 50% of disability-inducing incident happens before the age of 50.
Workers fitting the ISCO categories craft and related trades, plant and machine operators and assemblers and elementary occupation are the most exposed to poor physical health. When looking at disabilities, factory workers, administrative staffs and interim workers are the most vulnerable occupation groups.
In terms of sector, frequency and gravity of disabilities are the most important for construction, employment-related organizations (interim agencies), storage, transport, metal crafting, and water treatment. Also social workers are particularly concerned by problems in psychological health. The same sectors also perform badly in terms of general health.
Patterns also exist depending on the size of the employer. Notably, self-employed worker working alone (i.e. who have no employee) are significantly worse-off in terms of physical health. Likewise, in 2011, about a third of work accidents and more than 58% of lethal accidents happened in small and medium enterprises (SMEs), that is, firms hiring less than 50 employees. Also, around 46% of work accidents causing permanent disability happens in SMEs. Simply put, working conditions seem to be particularly bad in smaller firms.
The FGTB’ expert summarized these different situations in terms of health across individual and organizational characteristics by highlighting the fact that, although life expectancy has increased over time for the general population as a whole, it has done so at difference paces for different types of workers.
Consequently, active ageing strategies should implement relevant differentiations, especially with regards to working-life extension. According to the FEP expert, the Fund for Professional Experience has the possibility to set up collaboration protocols with sectors of industry, where the objectives and related actions and means are collectively discussed. They can follow three types of objectives: raising awareness and promoting/spreading good practices; developing measurement/diagnosis tools; and set up a framework to subsidize older workers shifting from team night work to regular day work (Service Public Fédéral Emploi, 2013). According to the FEP’s expert, to date, the FPE has running protocols with the transport, wood, and constructions sectors. We discuss the actions and methodology of the FPE in more details in the section on working conditions.
Another useful approach to promote healthy ageing, notably at work, is to adopt a life-cycle perspective. Indeed, as the FGTB’ representative noticed during the interview, working conditions should be optimized for all age groups, during the whole duration of careers so that when workers reach older age they are in better health and thus more able to continue working. We will come back to this point further down in this section.
EXTENDING WORKING LIVES IN BELGIUM 27
Furthermore, health is not only determined by work-related factors, but also by lifestyle choices, hence the importance to promote healthy behaviours across the whole life course to maximise individuals' work ability. Besides, as work accidents also happen on the way to work, ensuring safe traffic conditions regardless of the transportation mode is essential promote healthy ageing (WHO, 2002).
Finally, it is important to note that inactivity can be more detrimental to health than work, in old age, but also throughout life. Indeed long-term unemployed of the youth has been shown to affect their health. SeniorFlex’ expert stressed the link between inactivity and depression, stating that feeling useful and recognized as a valuable member of society, notably in the context of work, were essential for healthy ageing. This issue came out as well during the two focus groups, where most of the participants were willing to keep their lives active to reduce as well the occurrence of aging related diseases, such as the Alzheimer. The belief that activity is positively related to health is confirmed by a vast literature (cf. Leopold, L. and H. Engelhardt 2011 and 2012; Aichberger, Busch, Reichies, Stroehle, Heinz, Rapp 2010). We discuss this relationship further below.
3.1.1.2 Skills and lifelong learning
As was observed earlier, individuals are better educated with each new generation, especially women, and this trend should be very positive for the extension of working lives and active ageing in general. Nevertheless, the literature provides mixed results as regards the relationship between retirement age and education. On the one hand, a better education usually translates into higher wages and therefore makes early retirement more affordable. On the other hand, highly educated individuals also enter the labour force later and have to compensate for the forgone years of contributions to pension plans. Also, highly educated workers have in general healthier working conditions, and even if they suffer from ill-health, they will not be as much impacted as they are less likely to be working in physically demanding jobs (Riedel and Hofer, 2013).
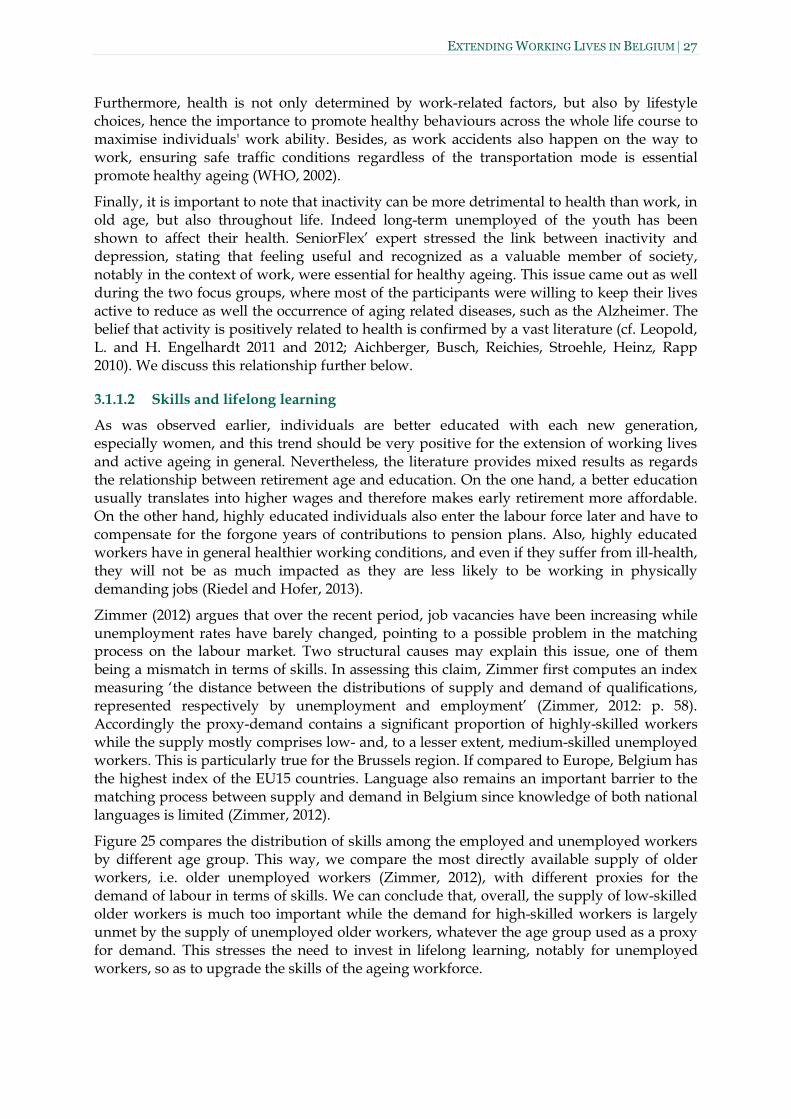
Zimmer (2012) argues that over the recent period, job vacancies have been increasing while unemployment rates have barely changed, pointing to a possible problem in the matching process on the labour market. Two structural causes may explain this issue, one of them being a mismatch in terms of skills. In assessing this claim, Zimmer first computes an index measuring ‘the distance between the distributions of supply and demand of qualifications, represented respectively by unemployment and employment’ (Zimmer, 2012: p. 58). Accordingly the proxy-demand contains a significant proportion of highly-skilled workers while the supply mostly comprises low- and, to a lesser extent, medium-skilled unemployed workers. This is particularly true for the Brussels region. If compared to Europe, Belgium has the highest index of the EU15 countries. Language also remains an important barrier to the matching process between supply and demand in Belgium since knowledge of both national languages is limited (Zimmer, 2012).
Figure 25 compares the distribution of skills among the employed and unemployed workers by different age group. This way, we compare the most directly available supply of older workers, i.e. older unemployed workers (Zimmer, 2012), with different proxies for the demand of labour in terms of skills. We can conclude that, overall, the supply of low-skilled older workers is much too important while the demand for high-skilled workers is largely unmet by the supply of unemployed older workers, whatever the age group used as a proxy for demand. This stresses the need to invest in lifelong learning, notably for unemployed workers, so as to upgrade the skills of the ageing workforce.

28 CONTRERAS, MARTELLUCCI & THUM
Figure 25. Labour mismatch: distribution of education levels among the unemployed (supply) and employed (demand) population by age group
Source: Labour Force Survey (2010). Own calculations. Note: The demand is represented by the distribution of skills across the employed population. It is therefore assumed that employers make perfect choice and in particular that no employee is over-qualified. Three different age groups are used as a proxy. Assuming no signalisation effect, the distribution of education levels for the 25-34 employed age groups can be interpreted as employer's expectations in terms of skills for the newest jobs.
According to the expert of Schulman, training represents an important aspect to tackle aging and enhance employability. The company in fact provides training modules for the different management levels in which various generations of employees are mixed together.
The human capital theory (cf. Becker 1964) considers lifelong learning as an investment where returns consist in accrued productivity. The sooner a worker leaves the employer that invested in her training, the lower the return. Consequently, it is logical that participation in vocation learning activities decreases with age (Ruzik-Sierdzinska et al., 2013).This has been confirmed during the interview with the executive of Schulman which reported that a company normally prefers to invest in training for younger generations which can grow and develop within the firm, rather than on workers in a later stage of their career.
Additionally, there exist aggravating factors: educational attainment, organization size and socio-professional category are also important determinants of lifelong learning. Therefore, strategies aiming at intensifying lifelong learning, notably in the perspective of extending working-lives, must not solely be based on age. They should take into account the professional background of each employee and promote the participation of all categories of workers, regardless of age, education or socio-professional category (Hansez et al., 2011).
Also, the view of lifelong learning as an investment has been criticized as not being sufficient. To begin with, Hansez et al. (2011) note that the relation between remaining time at work and participation in vocational learning is bidirectional: workers who are not given the possibility to sharpen existing skills or develop new ones are more prone to retire early.
0
10
20
30
40
50
60
50-64 25-34 50-64 Total
Supply Demand
Low Medium High

EXTENDING WORKING LIVES IN BELGIUM 29
Likewise, the investment view tends to reduce lifelong learning to company-specific training, although the FGTB’s expert, for instance, insisted on the necessity for employers to provide trainings based on workers' needs, not only on the workstation. In other words, lifelong learning should include transversal trainings, i.e. teach workers transferable skills, so as to maximise their work ability. In this regard, Securex (ibidem) insists on the importance for employers to develop the external employability of workers15, since it also generates positive externalities for the company through better management of uncertainty, increased satisfaction and better health (see for instance Berntson and Marklund, 2007).
A widely cited Belgian company in terms of providing employees with transversal trainings is Barco, a firm operating in the development and sales of electronics as displayed in Box 1.
Box 1. Barco's training schemes
‘Barco employees are encouraged to take part in different training programmes, where they are exposed to considerable technical knowledge and skills that are not directly connected to their job at that time. Broad training initiatives such as these have helped prevent early burnout of employees, as well as preparing them for future changes in their job. Another positive effect is that training stimulates employees to search for solutions outside the confines of their present job and their common daily knowledge and skills. Training given after working hours is undertaken on a voluntary basis. Employees can subscribe online for a training package of their choice, thus allowing management to follow employees’ training efforts. Both temporary and permanent staff can take part in training programmes. The lessons are highly practical, concise and goal-oriented and the ‘students’ are encouraged to actively participate. In addition, employees have a say in the selection of the training module topics. The broad nature of the training programme – as opposed to going into different topics in depth – is still being debated at company level. However, the preventive approach has proved to be beneficial, and has enabled staff members to cope with the changes in their job more easily. In the last three years, a competencies database has been under development. Within the research and development department and laboratory, functions have been screened and the required technical competencies added to the database. In the laboratory, people were asked about the importance of each registered skill at that particular time and its importance in the future. Based on this brainstorming exercise, the priority skills for the future were highlighted. This exercise also provided the basis for determining training needs and developing a training programme. In addition, the level of importance of such skills for the future was added to the competencies database. A similar exercise is currently being planned for other departments.’
Source: Quoted from Eurofound (2005), Barco, Belgium: Flexible Working practices
Another solution pointed out by Hansez et al. (2011) refers to internal mobility. Workers should be able to learn and develop in new functions within the same organization to keep adapting their skills to both the needs of the employer and that of the market. Hansez et al. also insist on the importance of taking into accounts workers' needs and aspirations and to develop a culture of learning and mobility from early on in careers whenever possible. As pointed out by a member of staff of Schulman, elderly employees should work on their flexibility in terms of adaptability to new working situations. For example, the company is
15 The external employability refers to the odds of finding and keeps employment outside one’s current employer organization.
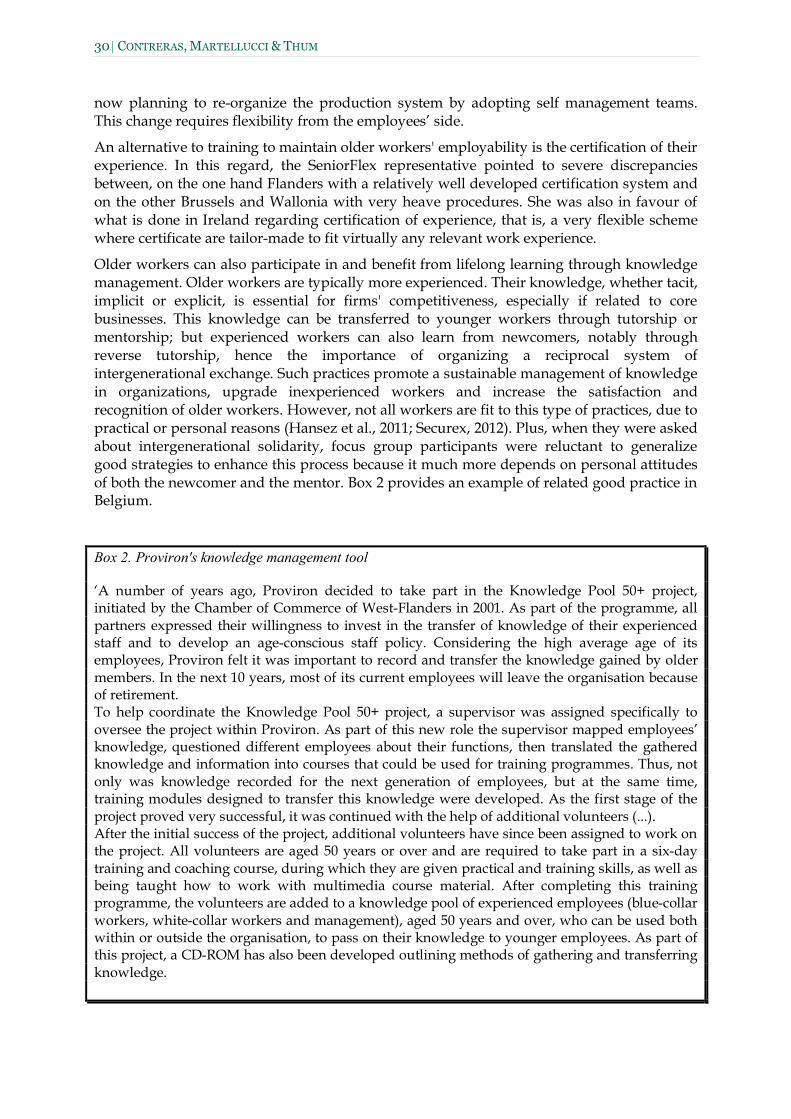
30 CONTRERAS, MARTELLUCCI & THUM
now planning to re-organize the production system by adopting self management teams. This change requires flexibility from the employees’ side.
An alternative to training to maintain older workers' employability is the certification of their experience. In this regard, the SeniorFlex representative pointed to severe discrepancies between, on the one hand Flanders with a relatively well developed certification system and on the other Brussels and Wallonia with very heave procedures. She was also in favour of what is done in Ireland regarding certification of experience, that is, a very flexible scheme where certificate are tailor-made to fit virtually any relevant work experience.
Older workers can also participate in and benefit from lifelong learning through knowledge management. Older workers are typically more experienced. Their knowledge, whether tacit, implicit or explicit, is essential for firms' competitiveness, especially if related to core businesses. This knowledge can be transferred to younger workers through tutorship or mentorship; but experienced workers can also learn from newcomers, notably through reverse tutorship, hence the importance of organizing a reciprocal system of intergenerational exchange. Such practices promote a sustainable management of knowledge in organizations, upgrade inexperienced workers and increase the satisfaction and recognition of older workers. However, not all workers are fit to this type of practices, due to practical or personal reasons (Hansez et al., 2011; Securex, 2012). Plus, when they were asked about intergenerational solidarity, focus group participants were reluctant to generalize good strategies to enhance this process because it much more depends on personal attitudes of both the newcomer and the mentor. Box 2 provides an example of related good practice in Belgium.
Box 2. Proviron's knowledge management tool
‘A number of years ago, Proviron decided to take part in the Knowledge Pool 50+ project, initiated by the Chamber of Commerce of West-Flanders in 2001. As part of the programme, all partners expressed their willingness to invest in the transfer of knowledge of their experienced staff and to develop an age-conscious staff policy. Considering the high average age of its employees, Proviron felt it was important to record and transfer the knowledge gained by older members. In the next 10 years, most of its current employees will leave the organisation because of retirement. To help coordinate the Knowledge Pool 50+ project, a supervisor was assigned specifically to oversee the project within Proviron. As part of this new role the supervisor mapped employees’ knowledge, questioned different employees about their functions, then translated the gathered knowledge and information into courses that could be used for training programmes. Thus, not only was knowledge recorded for the next generation of employees, but at the same time, training modules designed to transfer this knowledge were developed. As the first stage of the project proved very successful, it was continued with the help of additional volunteers (...). After the initial success of the project, additional volunteers have since been assigned to work on the project. All volunteers are aged 50 years or over and are required to take part in a six-day training and coaching course, during which they are given practical and training skills, as well as being taught how to work with multimedia course material. After completing this training programme, the volunteers are added to a knowledge pool of experienced employees (blue-collar workers, white-collar workers and management), aged 50 years and over, who can be used both within or outside the organisation, to pass on their knowledge to younger employees. As part of this project, a CD-ROM has also been developed outlining methods of gathering and transferring knowledge.
EXTENDING WORKING LIVES IN BELGIUM 31
All of the courses have been developed by experienced employees and are highly practical and useful for training young employees. The quality of the courses is high and low-skilled and unskilled workers particularly profit from this way of working. In addition, older employees win greater respect for their work and efforts, and their job is more diversified. This, in turn, increases their motivation to stay at work instead of considering early retirement. In general, the training courses help to reduce the gap between the older, unskilled (but experienced) blue-collar workers and young, skilled blue-collar workers.’
Source: Quoted from Eurofound (2009), Proviron, Belgium: redeployment, training and development.
3.1.1.3 Willingness to work and underlying reasons
We now look at attitudes and motivations, and more specifically at willingness to work and underlying reasons.
Delta Lloyd conducts yearly survey on pensions in Belgium (Delta Lloyd, 2013). They show that Belgian workers are not very thrilled at the idea of extending working-life. In fact, while the legal pension age is 65, the average age at which participants said they would like to retire is 61. Also, 38% of them do not want to work until 65. This proportion goes up to 49% for civil servants and to 52% for factory workers and reaches as much as 55% for older respondents (50-64). These results are consistent with those of Securex (2012) and with the sharp fall in employment after 60 we observed earlier with LFS data. It also corroborates the average effective age of retirement in Belgium as computed by the OECD for year 2011 (OECD, 2013).
Even so, the age at which one would like and expect to retire depends on various determinants. Securex (2012) find that, on average, older employed workers (45+) are willing to work longer than their younger peers. This might seem contradictory with the results found by Delta Lloyd; however Securex’s survey concerns only the employed population. Therefore this pattern might reflect a selection effect. Men, more highly educated workers and those employed on a non-temporary basis also want to remain active for a longer period. Finally, blue-collars want to retire earlier than white-collars on average. However, they often start working at a younger age in addition to performing physically demanding jobs.
Delta Lloyd (2013) also observed that 32% of participants declared they were eager to retire (+7 percentage points compared to 2012). However this is not due to a radical rejection of work but rather to the positive image of retirement. Indeed, it is associated with a better ability to enjoy life, a reduced stress, more time for family and friends, etc. It is worth noting however that ‘Physically too demanding work’ ranked fourth as a reason for willing to retire, pointing to the fact that for a significant share of workers (here, 40% of respondents), working conditions are indeed too hard for them to want to continue working.
Among those willing to work, the main motivations are to remain active (55%), have social contacts (39%) and be useful (37%) even though financial determinants are still strong: 44% of respondents willing to work until 65 wanted to do so to improve their financial situation while 35% estimated it was a ‘financial necessity’ for them to work until 65.
When asked about the type of measures that would encourage them to work longer, 52% of participants have chosen reduced working-hours/more holidays while 51% also advocated higher pension benefits. Other high-ranking answers include being able to autonomously organize the workload of the job and benefiting from financial incentives. Also, whether they were ready and willing to work until 65 or not, 63% of respondents argued that employers should implement age management policies.
32 CONTRERAS, MARTELLUCCI & THUM
However, in spite of these relatively high demands, 83% of participants would not be ready to work until a later age if it meant lowering their pays. This could result from a greater exposure to poverty among older generations (see above) or from the fact that Belgian workers are in favour of a seniority-based wage system (see below) or from both, the former potentially explaining the latter.
To summarize, one could say that values and attitudes within the Belgian workforce as regards late careers are oriented towards a higher preference for free-time, leisure and increased work-life balance and autonomy. In fact, these aspects were mentioned during focus group discussions. Participants were willing to be active and engage themselves in training and leisure programmes. Older-age has been described as time of life when individuals can take care of and decide for themselves. Additionally, financial ease remains particularly important in older working-age. Some HR managers and the interview partner of the FGTB as well as focus group participants confirmed the attachment of Belgian worker to higher pay checks in older age.
The SeniorFlex expert also insisted on the importance to tell older workers that they do not have do to the same job for their whole life. In fact, she said that, when willing to work, older workers hardly were able to imagine doing something else than what they had worked for during their whole career. This is why SeniorFlex works with older unemployed workers to try and propose them with the widest possible array of options.
In the next few paragraphs, we address the influence of the pension system and other social security schemes on attitudes and values as regards the extension of working-lives.
Pension system, paths to retirement and the extension of working-lives in Belgium
According to the literature, the pension system influences retirement decisions of workers through three different channels: its generosity, its degree of actuarial neutrality and finally the early exit possibilities it comprises (Riedel and Hofer, 2013).
The generosity of a pension system can be measured using replacement rates, i.e. the extent to which pension benefits replace the main source of income before retirement, or pension wealth, which is the sum of pension benefits one is entitled to. Here the literature provides evidence for a positive relationship, indicating that more generous benefits prompt workers to retire earlier (Riedel and Hofer, 2013). However, Belgian pension's replacement rates is already among the lowest of the OECD (OECD, 2011), therefore, further decreasing its generosity might worsen the situation of older workers in terms of risk of poverty or social exclusion even further.
The generosity of the pension system is partly based on the way benefits are computed, which can be done with various degrees of actuarial neutrality (or fairness). Actuarial neutrality refers to ‘the present value of expected lifetime contributions [equalizing] the present value of expected lifetime benefits’ (Ridel and Hofer, 2013: p. 10). Therefore, the related question is: does another year of paid employment and contribution to social security increase the total pension benefit one is entitled to or does it reduce it? If it inflates it, then there is actually a subsidy to continuation of work while there is an implicit tax on continued work in the opposite scenario. Here the literature has documented that a higher degree of actuarial neutrality (i.e. minimizing the implicit tax rate on continued work) participates to longer working-lives (Ridel and Hofer, 2013). In Belgium however, early retirement possibilities which were set-up in the 1970s to push older workers out of the labour market under a context a restructuring economy have created a rather strong implicit taxation, hence the OECD advocating that Belgium gives-up its early retirement culture (OECD, 2012).

EXTENDING WORKING LIVES IN BELGIUM 33
To reduce this implicit taxation, Delta Lloyd (2011) propose to implement a moderating factor that would take into account the remaining years for which pension payments are due based on average life expectancy and legal retirement age. Accordingly, for workers retiring at 65, the moderating factor would be 100%, but less before 65 and more after it, so as to financially encourage work continuation. Delta Lloyd however note that it is important to differentiate between different types of occupations since some workers have different working conditions and eventually, different life expectancies, as underlined by the FGTB expert.
The Belgian government has also introduced and then adapted a measure aiming at lowering the implicit taxation on work continuation: the ‘pension bonus’. Under certain conditions, workers who continue to work until the legal retirement age instead of leaving the labour force early see their effort rewarded by an extra lump-sum added to their legal pension benefit plan (Dekkers 2008).
As for early exist possibilities, they refer to early retirement but not only. In fact, Duval (2003) notes that social transfer programmes destined to the elderly can actually serve as alternative routes for early retirement, notably unemployment or disability benefits.
Consequently, Belgium is making conditions to access early retirement in terms of age and career duration increasingly restrictive over the years for both men and women. However, according to the FGTB representative, restricting the access to early retirement will have little effect on the duration of working-lives if the prospects for employment in older working-age are limited. Rather, it will worsen the financial stress of older workers. If put in parallel with the discussion on risk, this provides a fine example: restricting the access to early retirement increases individual risk (e.g. unemployment) so as to try and reduce the collective (macro-) risk associated with population ageing. In fact Maes (2011) showed that restricting early retirement would be particularly detrimental for the older blue-collar workers working in traditional industries in terms of unemployment. Consequently, the FGTB expert argued that instead of restricting early retirement possibilities, employers should be made more responsible in the way they use these schemes. Accordingly, the government has set up various measures to keep older workers on the labour force in case of restructuring or dismissal, ranging from mandatory outplacement procedures to the respect of the organization's age pyramid in case of collective redundancies.
Also, the government has set up various measures aiming to make sure that working in older age is financially interesting. For instance, workers who where under the regime of unemployment with company supplement16 (UCS - formerly conventional early retirement) can keep the company supplement in addition to their new wage if they find a new job. An outplacement procedure with specific characteristics for older workers (e.g. registering is mandatory for six months) has also been set up (Eurofound 2002).
3.1.2 Demand side: Work demands
3.1.2.1 Age management and management's views on active ageing
Hansez et al. (2011) have studied age management practices in 45 Belgian organizations pertaining to various sectors of the economy. They find that proactive age management remains scarce in Belgian organizations. Indeed, most of what is done by companies stands
16 Under certain conditions, employers can dismiss older workers using UCS. If so, then the employer has to provide the concerned worker with a complementary income representing 50% of the difference between the dismissed employee’s last wage and the unemployment benefits he/she receives.
34 CONTRERAS, MARTELLUCCI & THUM
within the border of legislation and regulation. Few original initiatives are taken. This point was raised by the FGTB’s expert during the interview. According to him, companies tend not to see age management as an investment but as a (costly) charge, unless it opens rights to government subsidies, in which case he claims the lack of monitoring sometimes leads to abuse. This accusation of lack of follow-up has also been directed to the FPE (Léonard, 2012). However, when considering the limited implementation of age management strategies in Belgian organizations, one must remember that it is a concept linked to the ageing phenomenon, and as such is quite recent (Hansez et al., 2011).
Nonetheless, Securex (2011) has surveyed a non-representative sample of managers from several organizations and found that they showed very limited enthusiasm about older workers working till a later age. This is particularly troublesome as managers are the key to implement age management policies since they are the link with the workers and greatly influence job contents and job demands. When asked about measures that could encourage older workers to work longer, the great majority of managers goes for adaptation of working or employment conditions, not for career or skill development. This can be seriously detrimental for older workers as it can feed age-related stereotypes. It is also non-optimal, as both types of practices contribute to maintain older workers in employment and under better conditions. Indeed Securex (ibidem) finds a positive correlation between both adaptation and development practices and various indicators relevant to active ageing, including: self-reported productivity and perceived external and internal employability, desired age of retirement, wish to stay with the company, psychological and physical well-being, satisfaction, intrinsic motivation and lower job demands.
Our interview partner of Schulman reported that the company does not currently have any specific active aging policy or Lifelong learning programme targeted for over 50 workers. However, the HR managers expressed concern about the future age distribution of the company.
The fact that existing practices tend to promote compliance with government regulation rather than age management per se nevertheless underlines the role of governments in Belgium in terms of generating impetus for age management in the private sector. Accordingly, the Collective Bargaining Agreement n°104 (‘CBA n°104’) was recently adopted, making it mandatory for companies with more than 20 employees to produce a yearly plan on how to main older workers in employment and how to hire new ones (Service Public Fédéral Emploi, 2012). Also, in addition to its ability to steer the private sector through regulation, the State is also the biggest employer in Belgium. As such, it is all the more concerned with age management and active ageing in general (Delta Lloyd, 2012). However, public sector workers are more easily riddled when it comes to extending working-lives (see above), making it potentially more difficult to define and implement practices endorsed by all stakeholders. Also, the issues faced by organizations depend on an array of internal (e.g. size or sector) and external (e.g. the socio-economic context) factors that make it impossible to elaborate one -fits-all policies (Hansez et al., ibidem).
Consequently, age management policies need to be designed through a negotiated and participative process, i.e. with a bottom-up approach. Not only does it make it easier to implement but, since age management needs to relate the age of stakeholders to their contexts, no one but them is more able to identify individual- and organization-specific problems and potential solutions (Hansez et al., ibidem; Securex 2012). However, Hansez et al. (ibidem) also note that age management must not be restricted to short-term issues, but also need to consider longer time-span so as to adopt a genuine life-cycle and preventive perspective. This is nevertheless difficult due to the subordination of human management temporality to that of organizational strategy, which is getting much shorter in companies
EXTENDING WORKING LIVES IN BELGIUM 35
due to increasing competition. Also they stress the necessity to implement integrated strategies. A single approach, say working-time adjustment, might not give optimal results if not coupled with, for instance a corresponding adaptation of working-conditions.
Hansez et al. (2011) advocate a series of steps for age management policies in organizations: make a diagnosis of the situation, elaborate a corresponding action plan, implement it and, finally, monitor and evaluate the implementation to adjust if need be. They also note the importance of involving the upper management so as to legitimize age management and make communication and awareness raising more efficient within the organization. This dynamic process is expected to make age management easily adaptable to internal and external factors' evolutions.
Age management pertains to an individual perspective of labour relations. However, the tradition of labour relations in Belgium is that of collective bargaining and equality of treatment. Such tradition is the raison d’être of trade unions, since they are based on the idea that workers are better able negotiate with their employers collectively rather than individually. Against such an issue, Securex (Ducheyne, 2012) promotes the generalization of mass career customization and idiosyncratic deals (or, simply I-deals). I-deals refer to individually negotiated deals between workers and employers (for a more detailed review, see respectively: Benko and Weisberg, 2007; and Hornung and Rousseau, 2008).
In this new context, trade union (and collective bargaining bodies in general) could be concerned with setting up the framework within which mass customization and I-deals should take place as Securex proposes. Even so, unions might not be the best qualified actors to address this question. In Germany for instance, a private company proposes ‘perspective coaching’, i.e. a service for employers to integrate the perspective of their older workers within the organizational setting (Ashoka-Changemakers, 2013).
3.1.2.2 Workplace stereotypes and career perspective
Discriminatory attitudes towards the elderly, also referred to as ageism (Butler, 1969), have found a fertile ground in Western modern societies. In fact, in traditional cultures, the elderly benefit from a positive image due to their role of knowledge keepers. However, in a society that promotes perpetual youth and gives a significant importance to performance and profitability, ageism is able to thrill (CAPA, 2006).
Age itself is a social construct and can be defined according to four dimensions. There is the chronological age which relates to the year of birth and is the basis for ageism. There is also the biological and psychological age. These definitions build on the biological and psychological condition of a person at a given point in time. Finally, age has a social dimension as well: the social age of a person depends on the quantity and types of relations someone has and the role that they play within their environment (CAPA, 2006).
As a social construct, different ages are associated with specific representations and expectations which individuals may identify with on varying degrees (Moulaert, 2011). In other words, the chronological age serves as a basis to assess the biological, psychological and social age.
Gaillard and Desmette (2008) have demonstrated that the degree to which Belgian workers aged 45 to 59 identify with the expression ‘Older workers’ is positively related to early retirement plans. Conversely, in another article (Gaillard and Desmette 2010) they show that presenting older workers with positive stereotypes about themselves was delaying their desire to retire and reinforcing their will to learn and develop their careers.
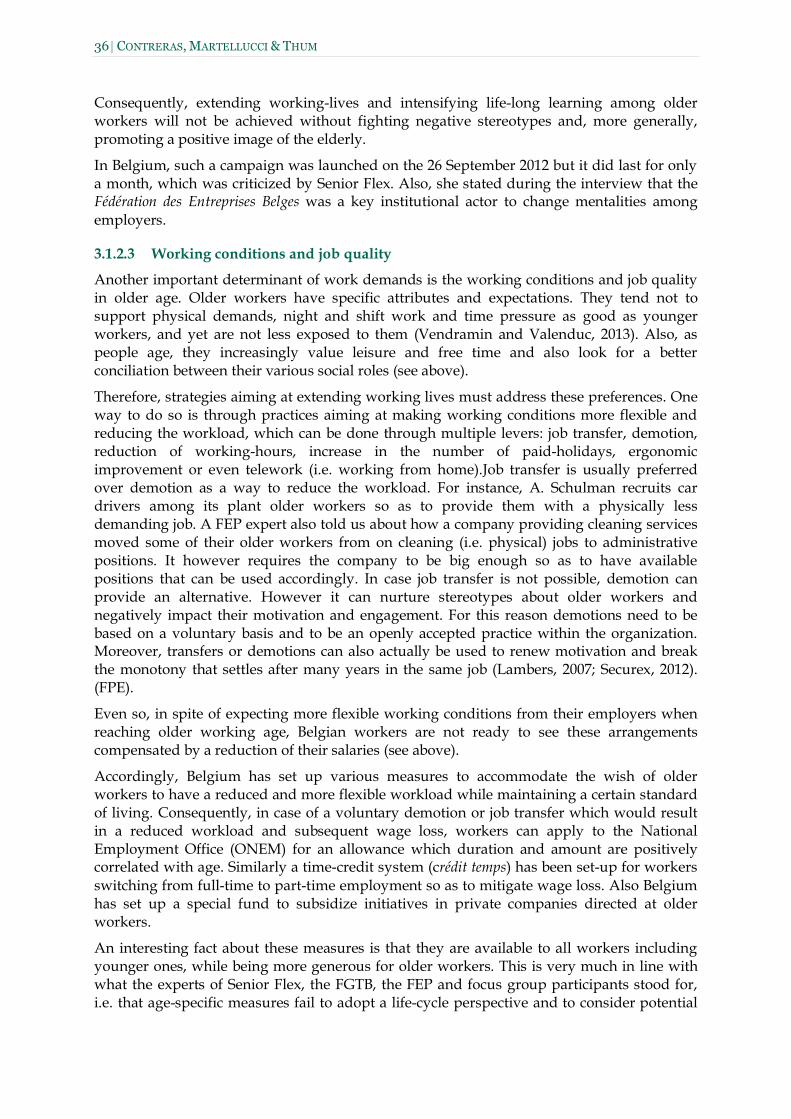
36 CONTRERAS, MARTELLUCCI & THUM
Consequently, extending working-lives and intensifying life-long learning among older workers will not be achieved without fighting negative stereotypes and, more generally, promoting a positive image of the elderly.
In Belgium, such a campaign was launched on the 26 September 2012 but it did last for only a month, which was criticized by Senior Flex. Also, she stated during the interview that the Fédération des Entreprises Belges was a key institutional actor to change mentalities among employers.
3.1.2.3 Working conditions and job quality
Another important determinant of work demands is the working conditions and job quality in older age. Older workers have specific attributes and expectations. They tend not to support physical demands, night and shift work and time pressure as good as younger workers, and yet are not less exposed to them (Vendramin and Valenduc, 2013). Also, as people age, they increasingly value leisure and free time and also look for a better conciliation between their various social roles (see above).
Therefore, strategies aiming at extending working lives must address these preferences. One way to do so is through practices aiming at making working conditions more flexible and reducing the workload, which can be done through multiple levers: job transfer, demotion, reduction of working-hours, increase in the number of paid-holidays, ergonomic improvement or even telework (i.e. working from home).Job transfer is usually preferred over demotion as a way to reduce the workload. For instance, A. Schulman recruits car drivers among its plant older workers so as to provide them with a physically less demanding job. A FEP expert also told us about how a company providing cleaning services moved some of their older workers from on cleaning (i.e. physical) jobs to administrative positions. It however requires the company to be big enough so as to have available positions that can be used accordingly. In case job transfer is not possible, demotion can provide an alternative. However it can nurture stereotypes about older workers and negatively impact their motivation and engagement. For this reason demotions need to be based on a voluntary basis and to be an openly accepted practice within the organization. Moreover, transfers or demotions can also actually be used to renew motivation and break the monotony that settles after many years in the same job (Lambers, 2007; Securex, 2012). (FPE).
Even so, in spite of expecting more flexible working conditions from their employers when reaching older working age, Belgian workers are not ready to see these arrangements compensated by a reduction of their salaries (see above).
Accordingly, Belgium has set up various measures to accommodate the wish of older workers to have a reduced and more flexible workload while maintaining a certain standard of living. Consequently, in case of a voluntary demotion or job transfer which would result in a reduced workload and subsequent wage loss, workers can apply to the National Employment Office (ONEM) for an allowance which duration and amount are positively correlated with age. Similarly a time-credit system (crédit temps) has been set-up for workers switching from full-time to part-time employment so as to mitigate wage loss. Also Belgium has set up a special fund to subsidize initiatives in private companies directed at older workers.
An interesting fact about these measures is that they are available to all workers including younger ones, while being more generous for older workers. This is very much in line with what the experts of Senior Flex, the FGTB, the FEP and focus group participants stood for, i.e. that age-specific measures fail to adopt a life-cycle perspective and to consider potential
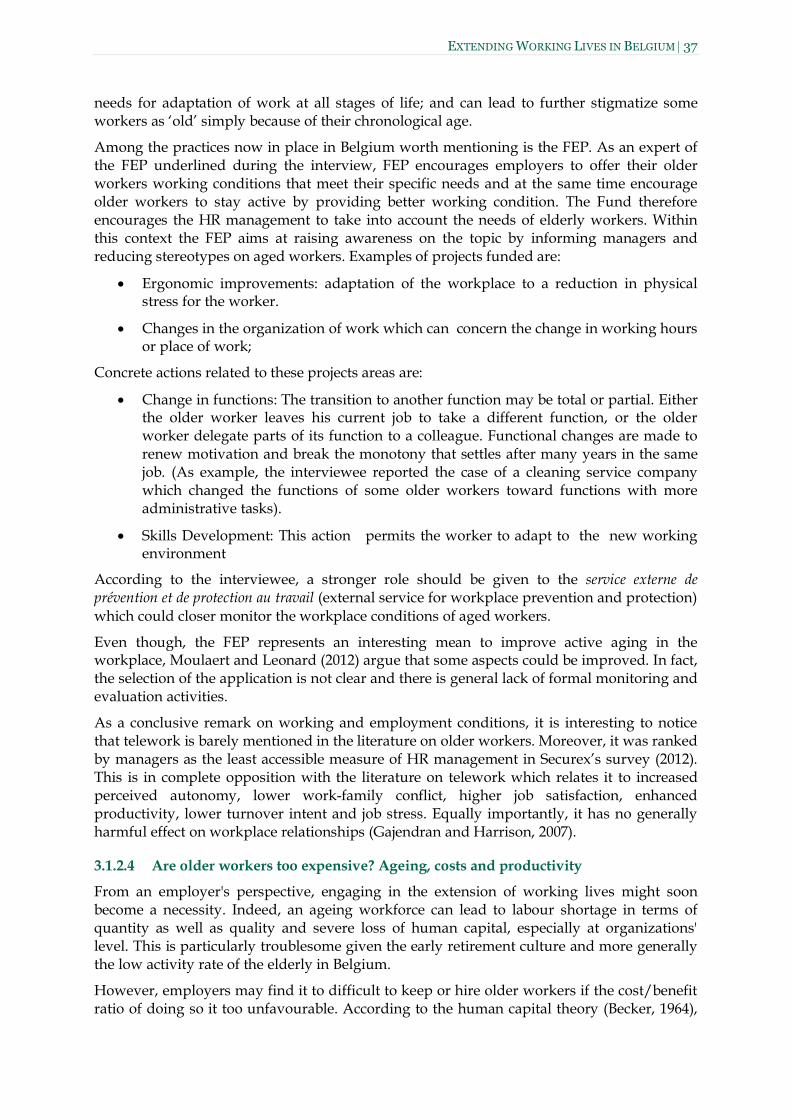
EXTENDING WORKING LIVES IN BELGIUM 37
needs for adaptation of work at all stages of life; and can lead to further stigmatize some workers as ‘old’ simply because of their chronological age.
Among the practices now in place in Belgium worth mentioning is the FEP. As an expert of the FEP underlined during the interview, FEP encourages employers to offer their older workers working conditions that meet their specific needs and at the same time encourage older workers to stay active by providing better working condition. The Fund therefore encourages the HR management to take into account the needs of elderly workers. Within this context the FEP aims at raising awareness on the topic by informing managers and reducing stereotypes on aged workers. Examples of projects funded are:
Ergonomic improvements: adaptation of the workplace to a reduction in physical stress for the worker.
Changes in the organization of work which can concern the change in working hours or place of work;
Concrete actions related to these projects areas are:
Change in functions: The transition to another function may be total or partial. Either the older worker leaves his current job to take a different function, or the older worker delegate parts of its function to a colleague. Functional changes are made to renew motivation and break the monotony that settles after many years in the same job. (As example, the interviewee reported the case of a cleaning service company which changed the functions of some older workers toward functions with more administrative tasks).
Skills Development: This action permits the worker to adapt to the new working environment
According to the interviewee, a stronger role should be given to the service externe de prévention et de protection au travail (external service for workplace prevention and protection) which could closer monitor the workplace conditions of aged workers.
Even though, the FEP represents an interesting mean to improve active aging in the workplace, Moulaert and Leonard (2012) argue that some aspects could be improved. In fact, the selection of the application is not clear and there is general lack of formal monitoring and evaluation activities.
As a conclusive remark on working and employment conditions, it is interesting to notice that telework is barely mentioned in the literature on older workers. Moreover, it was ranked by managers as the least accessible measure of HR management in Securex’s survey (2012). This is in complete opposition with the literature on telework which relates it to increased perceived autonomy, lower work-family conflict, higher job satisfaction, enhanced productivity, lower turnover intent and job stress. Equally importantly, it has no generally harmful effect on workplace relationships (Gajendran and Harrison, 2007).
3.1.2.4 Are older workers too expensive? Ageing, costs and productivity
From an employer's perspective, engaging in the extension of working lives might soon become a necessity. Indeed, an ageing workforce can lead to labour shortage in terms of quantity as well as quality and severe loss of human capital, especially at organizations' level. This is particularly troublesome given the early retirement culture and more generally the low activity rate of the elderly in Belgium.
However, employers may find it to difficult to keep or hire older workers if the cost/benefit ratio of doing so it too unfavourable. According to the human capital theory (Becker, 1964),
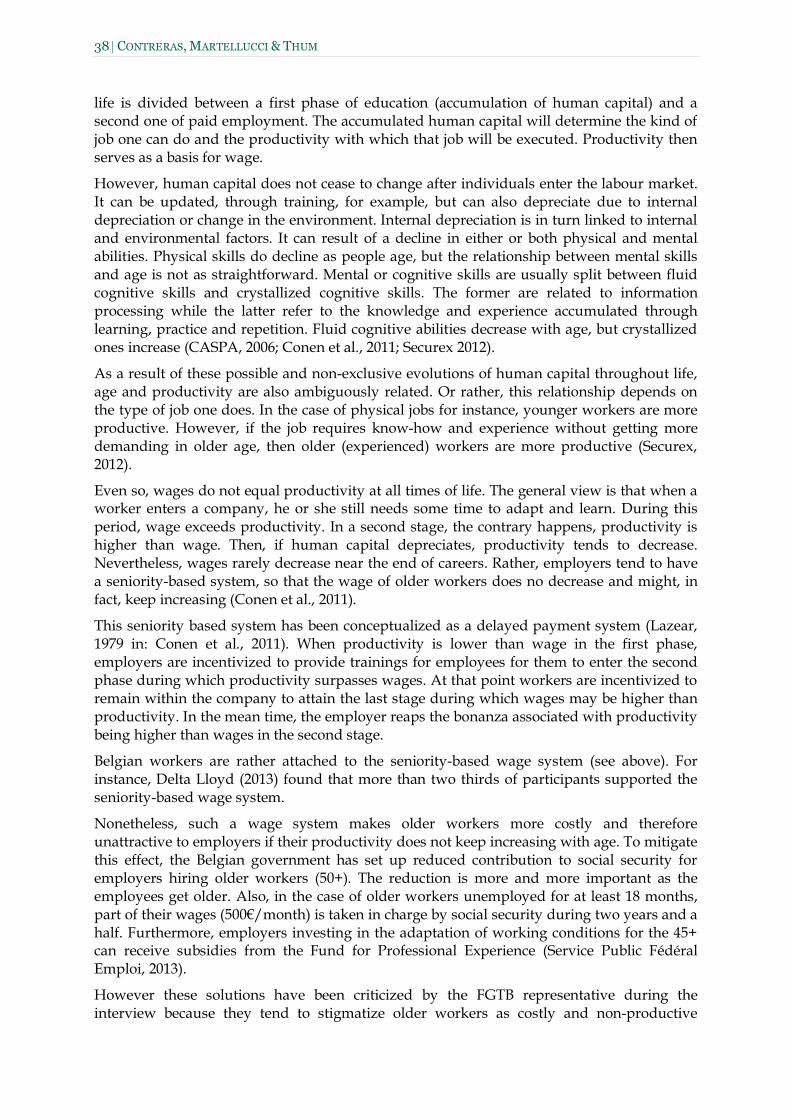
38 CONTRERAS, MARTELLUCCI & THUM
life is divided between a first phase of education (accumulation of human capital) and a second one of paid employment. The accumulated human capital will determine the kind of job one can do and the productivity with which that job will be executed. Productivity then serves as a basis for wage.
However, human capital does not cease to change after individuals enter the labour market. It can be updated, through training, for example, but can also depreciate due to internal depreciation or change in the environment. Internal depreciation is in turn linked to internal and environmental factors. It can result of a decline in either or both physical and mental abilities. Physical skills do decline as people age, but the relationship between mental skills and age is not as straightforward. Mental or cognitive skills are usually split between fluid cognitive skills and crystallized cognitive skills. The former are related to information processing while the latter refer to the knowledge and experience accumulated through learning, practice and repetition. Fluid cognitive abilities decrease with age, but crystallized ones increase (CASPA, 2006; Conen et al., 2011; Securex 2012).
As a result of these possible and non-exclusive evolutions of human capital throughout life, age and productivity are also ambiguously related. Or rather, this relationship depends on the type of job one does. In the case of physical jobs for instance, younger workers are more productive. However, if the job requires know-how and experience without getting more demanding in older age, then older (experienced) workers are more productive (Securex, 2012).
Even so, wages do not equal productivity at all times of life. The general view is that when a worker enters a company, he or she still needs some time to adapt and learn. During this period, wage exceeds productivity. In a second stage, the contrary happens, productivity is higher than wage. Then, if human capital depreciates, productivity tends to decrease. Nevertheless, wages rarely decrease near the end of careers. Rather, employers tend to have a seniority-based system, so that the wage of older workers does no decrease and might, in fact, keep increasing (Conen et al., 2011).
This seniority based system has been conceptualized as a delayed payment system (Lazear, 1979 in: Conen et al., 2011). When productivity is lower than wage in the first phase, employers are incentivized to provide trainings for employees for them to enter the second phase during which productivity surpasses wages. At that point workers are incentivized to remain within the company to attain the last stage during which wages may be higher than productivity. In the mean time, the employer reaps the bonanza associated with productivity being higher than wages in the second stage.
Belgian workers are rather attached to the seniority-based wage system (see above). For instance, Delta Lloyd (2013) found that more than two thirds of participants supported the seniority-based wage system.
Nonetheless, such a wage system makes older workers more costly and therefore unattractive to employers if their productivity does not keep increasing with age. To mitigate this effect, the Belgian government has set up reduced contribution to social security for employers hiring older workers (50+). The reduction is more and more important as the employees get older. Also, in the case of older workers unemployed for at least 18 months, part of their wages (500€/month) is taken in charge by social security during two years and a half. Furthermore, employers investing in the adaptation of working conditions for the 45+ can receive subsidies from the Fund for Professional Experience (Service Public Fédéral Emploi, 2013).
However these solutions have been criticized by the FGTB representative during the interview because they tend to stigmatize older workers as costly and non-productive

EXTENDING WORKING LIVES IN BELGIUM 39
labourers and give a disproportionate importance to labour costs in the debate regarding competitiveness, at the expense of innovation.
3.1.3 Labour market interactions Here we discuss labour market interactions relevant for active ageing. We first look at possible impacts of promoting part-time work in older age and then focus on the relationship between youth unemployment and employment of older workers.
Promotion of part-time work in older age: a cure worse than the disease?
As we saw previously, promoting part-time work in older age is a relatively popular measure to activate the supply of older workers. However, it can actually backfire: the extent to which measures subsidizing part-time work in older age increase the supply of older workers depends on 1) the number of new workers they attract to the labour market (positive effect); and 2) the extent to which individuals already working on a full-time basis will be incentivized to substitute a part-time employment to their current situation (negative effect). As a result, promoting part-time employment in older age can actually decrease the supply of older workers. For this reason they need to be carefully monitored (Graf et al., 2009). The High Council for Employment in Belgium actually openly questioned the measure in its annual report for 2012, stating that it was mostly used by the 50-59, not by the 60-64 who are the primary target group (CSE, 2012).
Are activation policies destined to the elderly detrimental to youth employment?
A popular argument against activation policies targeted to the elderly is that promoting employment in older age makes it more difficult for younger individuals to find a job. As a result, active ageing would be particularly irrelevant in Belgium due to its high youth unemployment rate17. Such a view was raised during focus groups18 and also by the trade union representative. This vision assumes that there is a fixed amount of jobs on the labour market, which is why it is also called the lump of labour theory. It has been used to argue against immigration or free-trade and related off-shoring but also to promote the eviction of older workers from the labour market through early retirement schemes.
This view is also often referred to as the lump of labour fallacy. Indeed, it is ill-grounded. First of all, workers are not perfectly substitutable, meaning that if an older worker retires, a younger one will not necessarily be able to replace him/her. Additionally, shocks in the labour supply (i.e. change in the number of individuals able and ready to work) do not leave the demand side unchanged. For instance, lowering labour costs by hiring migrant workers can generate extra profit and thus foster investment and further employment. Conversely, early retirement policies have failed to generate more jobs for younger workers, not only in Belgium (Porter, 2013; Munnel and Wu, 2012; Salazar-Xirinachs, 2012; Hansez et al., 2011; ITC-ILO, 2011; Jousten and Lefevbre 2008).
3.1.4 Self-employment and older workers As shown at the beginning of the report, the share of self-employed among the employed population increases with age. This may point to two possible scenarios which are not necessarily exclusive: either workers find it especially difficult to find an employer in older age so that they have to become self-employed to remain active; or employees retire earlier 17 In 2012, it reached 19.8% (Eurostat, 2013). 18 When asked about whether having a job in older age meant taking one away from young people, no participants argued against the idea of the lump of labour. Some even pointed out to it (‘If I take this job, then somebody else won’t be able to anymore!’).

40 CONTRERAS, MARTELLUCCI & THUM
than self-employed workers, leading to an overrepresentation of the latter group within the older employed population. We know that self-employed workers are on average willing to have longer working-lives as compared to employees (see above). However, this probably isn’t enough to fully account for the increasing share of self-employed as one goes up the age ladder.
In any case, if careers are longer when being self-employed, then it makes sense to promote entrepreneurship so as to extend working-lives. This is all the more urgent if considering the impact of population ageing in terms of swelling the number of business succession, on which depends both part of the available employment19 at a given time and retirement income for retiring entrepreneurs. Also, self-employment can provide older workers with the flexibility they need to keep on working after a certain age. Finally, Belgium has the greatest improvement margin as regards the share of workers who will potentially engage in entrepreneurship when compared to its neighbours, as shown In Figure 26 (OECD/EC, 2012).
Figure 26. Share of workers thinking about or involved in early stage start-up activities (%)
Source: OECD/EC, 2012.
The idea of promoting entrepreneurship in late careers is also partly based on the idea that older workers have certain advantages compared to younger one when it comes to give a try to entrepreneurship. First of all, older workers have accumulated a longer technical (and sometimes managerial) experience and established, on average, wider and stronger networks20. Finally, they also tend to have more assets that can be used as collaterals or invested directly (OECD/EC, 2012).
However, just like in the case of paid employment, self-employment in older age has several barriers related to ageing, stereotypes and lack of information about entrepreneurship and the opportunities it can bring. Moreover, a strong financial position in old age can encourage inactivity rather than entrepreneurship. Finally, starting a business is a time-intensive 19 The OECD and the EC (2012) however notes that businesses held by the 40+ create less employment compared to businesses owned by younger entrepreneurs. 20 However, both human and social capital can become progressively obsolete when out of the labour market (e.g. in the case of long-term unemployment, one doesn’t practice his skills nor has the occasion to see his former colleagues as often as before).
0
10
20
30
40
Belgium France Netherlands Germany
Prime age (20-49) Older age (50-64)

EXTENDING WORKING LIVES IN BELGIUM 41
process, and we know that workers increasingly want to enjoy their time as they age (OECD/EC, 2012).
This last issue relates to the age at which entrepreneurship should be promoted to increase self-employment among older workers. According to the OECD and the European Commission (2012), when it comes to older workers, most of those who seriously consider starting their own businesses are at least already engaged in the early stages of business development. Also, as we just saw, the opportunity cost of time increases with age and starting a business is very time-consuming. For all these reasons, it makes more sense to promote entrepreneurship in prime age rather than in older age. This is consistent with the feedbacks we received from focus groups, when participants claimed to be too old to start their own business.
Having determined when to promote entrepreneurship, we must now look at how this can be done. First, we remind that here, we only deal with non-retired individuals. This being said, the available tools are rather classic. For instance, Delta Lloyd (2012) proposes to set up financial incentives for business angels and venture capitalists investing in organizations owned and managed by older workers. They also argue that the government could also set up public loans with advantageous conditions for older entrepreneur and provide support and know-how from qualified professionals as well as training for entrepreneurship-related skills (e.g. basic accounting or marketing courses). Awareness raising campaigns can also make the opportunity self-employment offers more acute to older workers and contribute to reduce stereotypes (OECD/EC, 2012).
The OECD and the European Commission (2012) also note that such policies should take into account the diversity of situations prime and older workers can encounter. Indeed, difficulty to access to finance, obsolescence of human and social capital are mostly concerns of long-term unemployed older workers, and therefore policies aiming at remedying these issues should target this group in priority. Moreover, they insist on highlighting acquisition of existing businesses rather than only creation as it is less time-consuming, less risky and may help some self-employed to retire.
An interesting practice is found in Germany with ‘50+ Entrepreneurs’ (Gründer 50plus) due to its bottom-up approach. This non-profit organization provides advice and assistance to the 50+ willing to be self-employed; especially those who wish to do so out of financial difficulties. In addition to being targeted directly at the 50+, it is based on a social franchise system for its expansion.
In Belgium, older unemployed workers (50+) willing to start their own business can sign a convention with a particular public body (cooperative d’activité) under relatively easier conditions compared to those aged under 50. Signing this convention allow unemployed workers not to fulfill some obligations related to their status (accepting a job offer, being available to work and registering as an unemployed worker). Signing the convention also opens right to counseling for the set-up of the business project and also provides some advantages in terms of unemployment benefits amount and duration (FGTB/ONEM, 2013).
3.2 Active ageing past retirement age Here, we will discuss active ageing in Belgium after the legal retirement age, 65. As reminded in the introduction, the WHO defines active ageing as ‘the process of optimizing opportunities for health, participation and security in order to enhance quality of life as people age’ (WHO, 2002: p. 12). We assume a definition of security that includes protection from poverty and social exclusion.
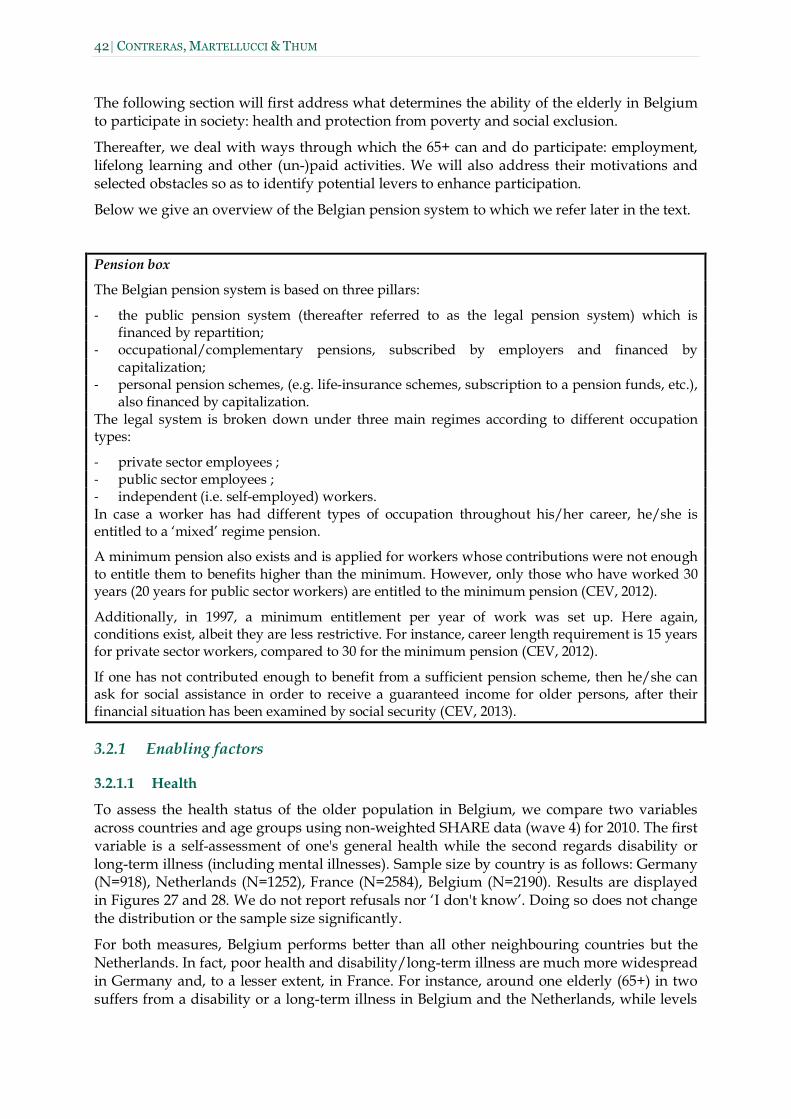
42 CONTRERAS, MARTELLUCCI & THUM
The following section will first address what determines the ability of the elderly in Belgium to participate in society: health and protection from poverty and social exclusion.
Thereafter, we deal with ways through which the 65+ can and do participate: employment, lifelong learning and other (un-)paid activities. We will also address their motivations and selected obstacles so as to identify potential levers to enhance participation.
Below we give an overview of the Belgian pension system to which we refer later in the text.
Pension box
The Belgian pension system is based on three pillars:
- the public pension system (thereafter referred to as the legal pension system) which is financed by repartition;
- occupational/complementary pensions, subscribed by employers and financed by capitalization;
- personal pension schemes, (e.g. life-insurance schemes, subscription to a pension funds, etc.), also financed by capitalization.
The legal system is broken down under three main regimes according to different occupation types:
- private sector employees ; - public sector employees ; - independent (i.e. self-employed) workers. In case a worker has had different types of occupation throughout his/her career, he/she is entitled to a ‘mixed’ regime pension.
A minimum pension also exists and is applied for workers whose contributions were not enough to entitle them to benefits higher than the minimum. However, only those who have worked 30 years (20 years for public sector workers) are entitled to the minimum pension (CEV, 2012).
Additionally, in 1997, a minimum entitlement per year of work was set up. Here again, conditions exist, albeit they are less restrictive. For instance, career length requirement is 15 years for private sector workers, compared to 30 for the minimum pension (CEV, 2012).
If one has not contributed enough to benefit from a sufficient pension scheme, then he/she can ask for social assistance in order to receive a guaranteed income for older persons, after their financial situation has been examined by social security (CEV, 2013).
3.2.1 Enabling factors
3.2.1.1 Health
To assess the health status of the older population in Belgium, we compare two variables across countries and age groups using non-weighted SHARE data (wave 4) for 2010. The first variable is a self-assessment of one's general health while the second regards disability or long-term illness (including mental illnesses). Sample size by country is as follows: Germany (N=918), Netherlands (N=1252), France (N=2584), Belgium (N=2190). Results are displayed in Figures 27 and 28. We do not report refusals nor ‘I don't know’. Doing so does not change the distribution or the sample size significantly.
For both measures, Belgium performs better than all other neighbouring countries but the Netherlands. In fact, poor health and disability/long-term illness are much more widespread in Germany and, to a lesser extent, in France. For instance, around one elderly (65+) in two suffers from a disability or a long-term illness in Belgium and the Netherlands, while levels
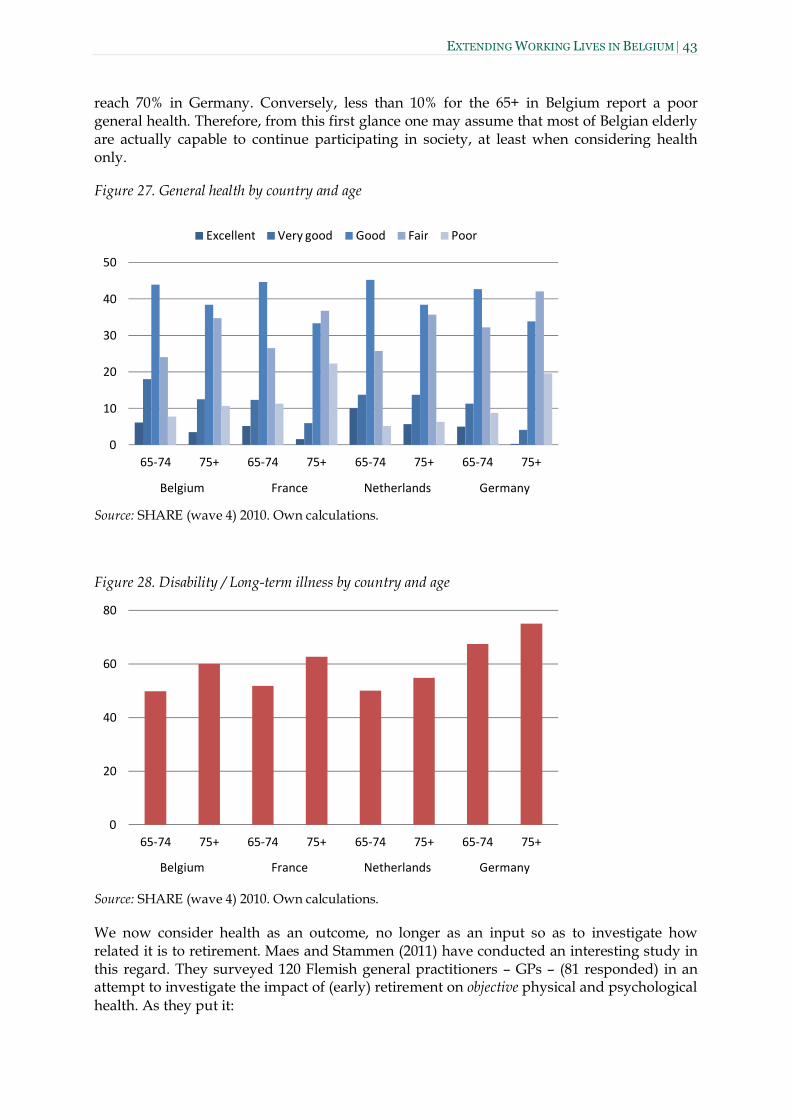
EXTENDING WORKING LIVES IN BELGIUM 43
reach 70% in Germany. Conversely, less than 10% for the 65+ in Belgium report a poor general health. Therefore, from this first glance one may assume that most of Belgian elderly are actually capable to continue participating in society, at least when considering health only.
Figure 27. General health by country and age
Source: SHARE (wave 4) 2010. Own calculations.
Figure 28. Disability / Long-term illness by country and age
Source: SHARE (wave 4) 2010. Own calculations.
We now consider health as an outcome, no longer as an input so as to investigate how related it is to retirement. Maes and Stammen (2011) have conducted an interesting study in this regard. They surveyed 120 Flemish general practitioners – GPs – (81 responded) in an attempt to investigate the impact of (early) retirement on objective physical and psychological health. As they put it:
0
10
20
30
40
50
65-74 75+ 65-74 75+ 65-74 75+ 65-74 75+
Belgium France Netherlands Germany
Excellent Very good Good Fair Poor
0
20
40
60
80
65-74 75+ 65-74 75+ 65-74 75+ 65-74 75+
Belgium France Netherlands Germany

44 CONTRERAS, MARTELLUCCI & THUM
‘Theoretically, the impact of retirement on physical health is unclear. On the one hand, one may expect that more leisure allows the retired to invest more time in maintaining and improving their health status through increased physical activities. On the other hand, the absence of the daily discipline inherent in the rhythm and routine of a working life might reduce the incentive to invest in health-preserving behaviour and, especially if the food consumption during retirement is not reduced following lower consumption needs, result in obesity and cardiovascular diseases. Similarly, as far as mental health is concerned, the decision to retire gives the retired more leisure time that could be spent on social networks and that could relieve them of the stress of a working environment. Conversely, retirement may isolate the retired from social life if social networks were strongly related to their previous employment. Due to this theoretical ambiguity, the impact of retirement on subsequent health becomes an empirical question.’ (Maes and Stammen, 2011: p. 1-2)
They found that (early) retirement has a negative impact on objective health. In particular, GPs almost unanimously confirmed that the diminution of physical exercise coupled with excessive intake of food were the most important factors linked to retirement to negatively impact physical health. In comparison, psychological and physical stress in the last job was cited by less than two thirds of the GPs. Consequently, the most frequent physical health problems among retirees are, according to the GPs, cardiovascular diseases and obesity or overweight (ibid.).
As for psychological health, almost half of the surveyed GPs indicated that early retirement (defined by Maes and Stammen as retiring before 60, whatever the way) was particularly detrimental to psychological health during retirement. Quasi-universally cited factors linked to retirement and negatively impacting psychological health included living alone and the lack of social contacts. Lack of physical and professional activities were also mentioned by more than half of participating GPs. The most frequent psychological pathology among retirees according to all surveyed GPs were depression and the deterioration of cognitive capacities (ibid.).
Although their sample was limited in size, the findings of Maes and Stammen (2011) point to two main conclusions. Firstly, there is a major discrepancy between subjective and objective health for the retired population21, hence serious measurement issues. Secondly, the main health problems arising from retirement according to surveyed GPs are mostly the result of lifestyle choices, not of an ineluctable process of degeneration. This means that, if policy makers are able to help individuals adapting their lifestyle and maintaining/developing social networks during retirement, there is considerable scope to extend healthy ageing among the elderly population in Belgium and, in fine promote active ageing.
However, according to the FGTB, the current cuts in social security and health care in particular (see Belgian House of Representatives, 2013) are going against the promotion of healthy ageing. Nonetheless, while the OECD acknowledges Belgium’s accessible healthcare system, it also claims that it could be adapted in order to cope with population ageing more efficiently, especially as regards costs (Sorbe, 2013). In other words, cuts are not necessarily harmful to healthy ageing, depending on their design.
In any case, the FGTB expert was primarily in favour of a strong prevention policy. He insisted on the importance of regular health check-ups, including before 65 and more generally on the lower cost of preventing degeneration rather than fighting it. In particular, he also mentioned the importance of providing a safe environment for the elderly and
21 68% of GPs reported their patient self-assessed retirement as being (very) good for their health. Only 10% of GPs indicated their patients thought the contrary (Maes and Stammen, 2011).
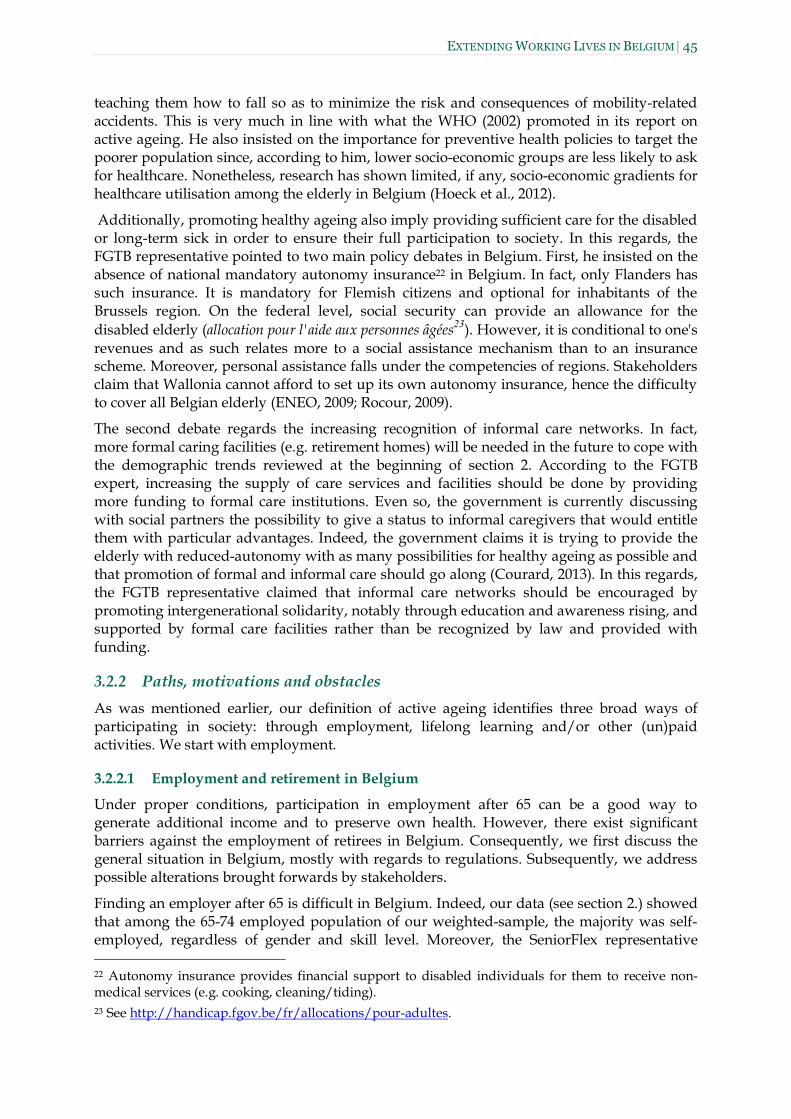
EXTENDING WORKING LIVES IN BELGIUM 45
teaching them how to fall so as to minimize the risk and consequences of mobility-related accidents. This is very much in line with what the WHO (2002) promoted in its report on active ageing. He also insisted on the importance for preventive health policies to target the poorer population since, according to him, lower socio-economic groups are less likely to ask for healthcare. Nonetheless, research has shown limited, if any, socio-economic gradients for healthcare utilisation among the elderly in Belgium (Hoeck et al., 2012).
Additionally, promoting healthy ageing also imply providing sufficient care for the disabled or long-term sick in order to ensure their full participation to society. In this regards, the FGTB representative pointed to two main policy debates in Belgium. First, he insisted on the absence of national mandatory autonomy insurance22 in Belgium. In fact, only Flanders has such insurance. It is mandatory for Flemish citizens and optional for inhabitants of the Brussels region. On the federal level, social security can provide an allowance for the disabled elderly (allocation pour l'aide aux personnes âgées23). However, it is conditional to one's revenues and as such relates more to a social assistance mechanism than to an insurance scheme. Moreover, personal assistance falls under the competencies of regions. Stakeholders claim that Wallonia cannot afford to set up its own autonomy insurance, hence the difficulty to cover all Belgian elderly (ENEO, 2009; Rocour, 2009).
The second debate regards the increasing recognition of informal care networks. In fact, more formal caring facilities (e.g. retirement homes) will be needed in the future to cope with the demographic trends reviewed at the beginning of section 2. According to the FGTB expert, increasing the supply of care services and facilities should be done by providing more funding to formal care institutions. Even so, the government is currently discussing with social partners the possibility to give a status to informal caregivers that would entitle them with particular advantages. Indeed, the government claims it is trying to provide the elderly with reduced-autonomy with as many possibilities for healthy ageing as possible and that promotion of formal and informal care should go along (Courard, 2013). In this regards, the FGTB representative claimed that informal care networks should be encouraged by promoting intergenerational solidarity, notably through education and awareness rising, and supported by formal care facilities rather than be recognized by law and provided with funding.
3.2.2 Paths, motivations and obstacles As was mentioned earlier, our definition of active ageing identifies three broad ways of participating in society: through employment, lifelong learning and/or other (un)paid activities. We start with employment.
3.2.2.1 Employment and retirement in Belgium
Under proper conditions, participation in employment after 65 can be a good way to generate additional income and to preserve own health. However, there exist significant barriers against the employment of retirees in Belgium. Consequently, we first discuss the general situation in Belgium, mostly with regards to regulations. Subsequently, we address possible alterations brought forwards by stakeholders.
Finding an employer after 65 is difficult in Belgium. Indeed, our data (see section 2.) showed that among the 65-74 employed population of our weighted-sample, the majority was self-employed, regardless of gender and skill level. Moreover, the SeniorFlex representative 22 Autonomy insurance provides financial support to disabled individuals for them to receive non-medical services (e.g. cooking, cleaning/tiding). 23 See http://handicap.fgov.be/fr/allocations/pour-adultes.
46 CONTRERAS, MARTELLUCCI & THUM
argued that mentalities were still very much against employment during retirement. In particular she claimed that both employers and employment services (private or public) did not give much attention to retirees as they are considered to be out of the labour force.
Moreover, there are very limited financial incentives to keep working after 65 in Belgium, in particular after retirement. In fact, retirees are only allowed to earn a limited income in addition to their public pension. These earning ceilings are the same whatever the amount of pension benefits or whether one actually has a complete career (45 years - see pension box) or not. In case a retiree earns more than what the ceiling allows, two possibilities apply. Either the extra-earnings represent less than 25% of the upper limit in which case public pension benefits are reduced in equivalent proportion; or the extra-earnings stand for more than 25% of the limit and the legal pension benefits are suspended for the whole year.
In addition to restrictions in terms of combining wages and pension benefits, focus group participants have also claimed that financial incentives to extend working-lives were also minimized by the current taxation system. In fact, pension incomes benefit from a specific tax cut (Réduction d'impôt pour revenus de remplacement) that vary from full to partial exoneration. However, this only applies when no other type of income24 is earned. If such is not the case, then the tax cut will only be applied proportionally to the importance of the replacement income (i.e. pension benefits) within total incomes (FGTB, 2012).
The social contribution system is also particularly detrimental to self-employed retirees. As the SeniorFlex expert explained, the current system of contribution to social security for independent worker has been designed for full-time, long-term self-employed workers. However, retirees do not want to work full-time and do not have yet many more decades to live.
According to the SeniorFlex expert, the combination of a relatively high exposure to poverty and social exclusion among the elderly and limited scope to work during retirement creates significant incentives for retirees willing to work to do so informally. Not only does this bring fewer revenues to social security and create an unfair competition with formal workers, but it also creates a great risk for the informal workers themselves. In fact, the SeniorFlex expert insisted that retirees working informally who get caught by the tax authorities are asked to pay back, cannot and therefore end up relying on social assistance. A major challenge for active ageing during retirement is therefore to set a frame that is flexible enough to minimise informal work and tax/contribution evasion in older age. We review current reforms and possible adaptations in the next few paragraphs.
Recent reforms and possible adaptations
On 11 January 2013, the Belgian government declared to be in favour of work during retirement and announced measures to promote it. Among others, the upper limits for complementary professional revenues have been increased and indexed. Also, under certain conditions, workers aged 65 or more who have worked at least 42 years can now cumulate wages and pension benefits without any limit. The SeniorFlex expert noted that the reach of this adjustment has been considerably reduced by the career length condition, since most of those who actually need to work for financial reasons have incomplete careers. Additionally, civil servants are now allowed to work past 65. Belgium has also set up a pension bonus that adds a lump-sum to pension benefits per day of work after 62 year-old or 44 years of work so as to discourage workers from retiring early.
24 By other type, we mean incomes that are not replacement incomes. Replacement incomes include pension benefits but also, for instance, unemployment or disability benefits.
EXTENDING WORKING LIVES IN BELGIUM 47
According to SeniorFlex’ expert, these measures do not go far enough. She argued that flexicurity was the most adapted solutions for retirees willing to work, since they are not after stable or permanent jobs anymore. In particular, she advocated interim agencies as bridgeheads for the elderly to find employment but regretted that Belgian agencies were not very much interested in older workers. An interim agency specially dedicated to older workers is nonetheless currently under development in Belgium25. Also, she insisted that employment contract needed to be very supple for working retirees. For instance, dismissal notices should not be due too much in advance.
Regarding self-employed workers, she declared to be in favour of a system similar to what is done in France with autoentrepreneurs, i.e. that contributions to social security be more proportional to business revenues and null in case no revenue is made. To conclude, the SeniorFlex expert claimed that disincentives had to be removed before setting up any new incentive.
The situation at Daikin Europe NV represents a fine example of a situation where flexibility creates a win-win situation between an employer and older workers, as described in Box 3.
Box 3. Daikin's seasonal older workers
‘Daikin Europe NV manufactures and sells air conditioning systems. (...)
Because of the nature of the product, employment at Daikin Europe is sensitive to seasonal influences. Each year, between February and July, 300 extra temporary staff are required. Most of these temporary recruits are aged 50 years and over.
The human resources policy towards older workers is specific and positive. One HR manager has been assigned responsibility for the recruitment, training and employment of these older temporary workers, who are considered necessary to help cope with the seasonal rush. (...)
Although the situation at Daikin is very much dependent on seasonal requirements, its experience in this area is transferable to other organisations. Overall, the most important success factors of the initiative have included: training (adjusted to the target group); an accessible procedure; intense follow-up of the target group (even when they are not at work); offering a broad range of flexible options; and maintaining a focus on the needs of the target group. Addressing all these issues can require a significant amount of manpower (a HR manager, an in-house temping agency, training instructors); however, in the long run it has proved to be a valuable solution for the company’s organisational needs.’
Source: Quoted from Eurofound (2005), Daikin Europe, Belgium: flexible working practices.
Another interesting initiative was launched by Delta Lloyd in 2013. It is entitled ‘Stage sans âge’26 (Internship without age) and get retirees to be interns in occupations that had attracted them in the past while having nothing to do with their former career. For instance, a former policeman is currently doing an internship in the movie theatre.
Delta Lloyd has drawn conclusion from this experience in terms of what could be done to promote the participation in employment after retirement (Delta Lloyd, 2013). For instance, they argue that since retirees are no longer eligible for part of the insurances social security provides (such as unemployment insurance for instance), their contributions should be reduced adequately, thus increasing their disposable wage and making them more competitive in terms of labour costs for employers.
25 cf. http://www.mldinterim.com/. 26 http://www.stagesansage.be/

48 CONTRERAS, MARTELLUCCI & THUM
They also propose a significant adaptation of the current Belgian pension system. Firstly, they advocate getting rid of the career unity principle (see above), so that workers can keep contributing towards their pension as long as they work. Likewise, in order to encourage them to retire later than 65, Delta Lloyd also support the inclusion of a moderating factor in the computation of pension benefits27. Last but not least, they argue in favour of the coexistence between work and retirement. In other words, a worker shouldn't be able to accumulate both her wages and her pension benefits. However, she should be able to retire part-time and start earning part of her pension benefit, while she reduces her working-hours and still contribute to her pension. We provide tables adapted from this scenario in appendix.
3.2.2.2 Lifelong learning
All focus group participants agreed to say that there is no age to stop learning, as did interviewees. However, as we mentioned earlier, learning can be either, formal, non-formal or informal, and each one of them tends to be exclusively dedicated to specific times of life (i.e., youth, prime-age and old-age). Moreover, the way learning takes place, either (non)-formally or informally, strongly determines its purpose.
The purposes of lifelong learning can be broken down into a functional and cultural dimension. The former refers to it as an instrument to foster competitiveness and innovation, and to enhance/maintain workers’ employability. On the other hand, the cultural dimension reflects the general human appetite for knowledge and learning, i.e. education as a consumption good, and its positive externalities; in particular as regards social outcomes. The functional dimension has, however, gained considerable importance over the second half of the 20th century, concurrently with the formulation of the employability discourse. Meanwhile, the cultural dimension was reduced to an adaptative basis for further vocational (i.e. functional) learning. Within this framework, the retired population has been relatively ignored in discussions on lifelong learning. In fact, education after the legal retirement age was mostly reduced to a personal and cultural matter. This was especially true when early retirement policies were set up, partly to allow for restructurings, hence the relative uselessness of vocational learning for ageing workers (Chamahian, 2012).
Consequently, the main issue regarding lifelong learning after 65 is the difficulty for seniors to gain access to functional education without having to bear all the cost on their own. For instance, the SeniorFlex expert noted that, in Belgium, training vouchers (i.e. subsidized vocational education) were mostly granted to unemployed workers, and retirees are not considered as unemployed. Consequently, according to SeniorFlex, public employment services have a limited offer, if any, for the 65+ in terms of training, especially in Wallonia. Also, focus group participants commended the Universités Tous Âges (all-age universities) but insisted that the price was rather unaffordable. In other words, having no access to subsidized trainings; retirees have to turn towards the full-price private offer, which often is financially out of reach.
However, if we compare the situation of Belgian elderly with their peers from neighbouring countries in terms of participation in non-formal education, we see that Belgium does in fact relatively good, especially for the 65-74 age groups.
27 If legal retirement age is 65 and life expectancy 80, then the regular duration of a pension should be 15 years. If one retires at 60, he will earn his pension during 20 years. Therefore the moderating factor would be: 15/20 = 75%. Conversely, retiring at 70 would bring the moderating factor up to 15/10 = 150%.
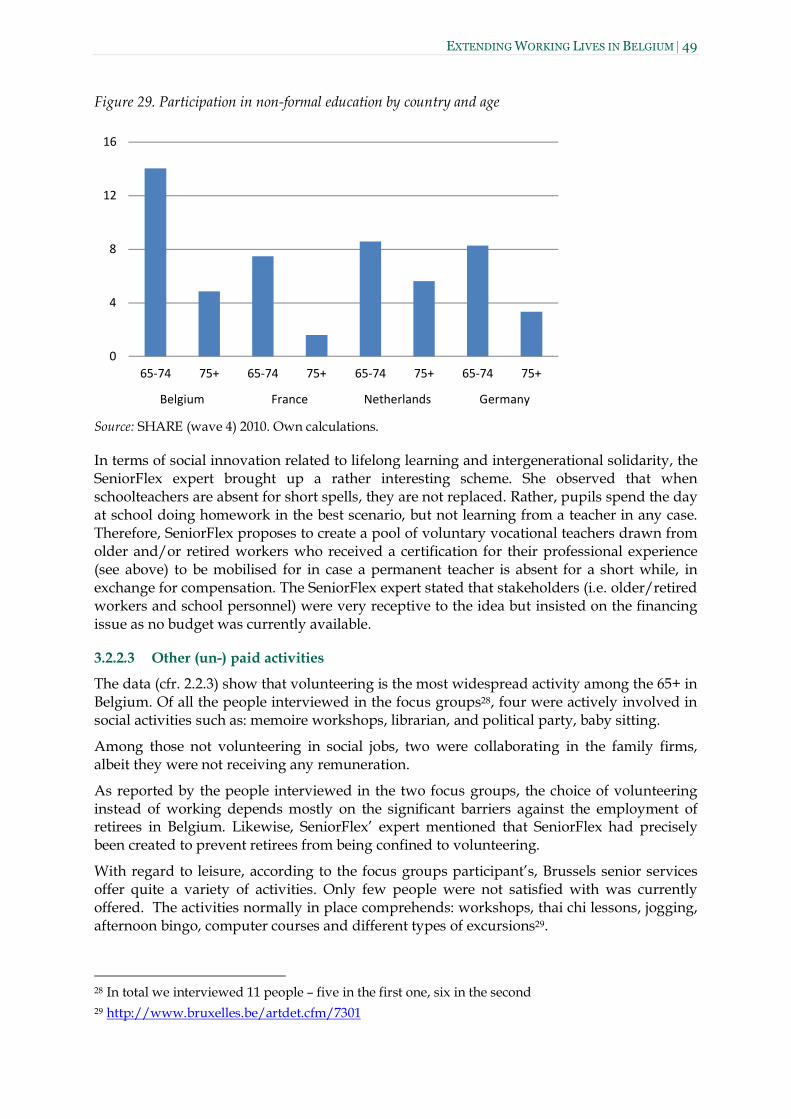
EXTENDING WORKING LIVES IN BELGIUM 49
Figure 29. Participation in non-formal education by country and age
Source: SHARE (wave 4) 2010. Own calculations.
In terms of social innovation related to lifelong learning and intergenerational solidarity, the SeniorFlex expert brought up a rather interesting scheme. She observed that when schoolteachers are absent for short spells, they are not replaced. Rather, pupils spend the day at school doing homework in the best scenario, but not learning from a teacher in any case. Therefore, SeniorFlex proposes to create a pool of voluntary vocational teachers drawn from older and/or retired workers who received a certification for their professional experience (see above) to be mobilised for in case a permanent teacher is absent for a short while, in exchange for compensation. The SeniorFlex expert stated that stakeholders (i.e. older/retired workers and school personnel) were very receptive to the idea but insisted on the financing issue as no budget was currently available.
3.2.2.3 Other (un-) paid activities
The data (cfr. 2.2.3) show that volunteering is the most widespread activity among the 65+ in Belgium. Of all the people interviewed in the focus groups28, four were actively involved in social activities such as: memoire workshops, librarian, and political party, baby sitting.
Among those not volunteering in social jobs, two were collaborating in the family firms, albeit they were not receiving any remuneration.
As reported by the people interviewed in the two focus groups, the choice of volunteering instead of working depends mostly on the significant barriers against the employment of retirees in Belgium. Likewise, SeniorFlex’ expert mentioned that SeniorFlex had precisely been created to prevent retirees from being confined to volunteering.
With regard to leisure, according to the focus groups participant’s, Brussels senior services offer quite a variety of activities. Only few people were not satisfied with was currently offered. The activities normally in place comprehends: workshops, thai chi lessons, jogging, afternoon bingo, computer courses and different types of excursions29.
28 In total we interviewed 11 people – five in the first one, six in the second 29 http://www.bruxelles.be/artdet.cfm/7301
0
4
8
12
16
65-74 75+ 65-74 75+ 65-74 75+ 65-74 75+
Belgium France Netherlands Germany
50 CONTRERAS, MARTELLUCCI & THUM
Two people reported the participation in senior Memoir workshops. The aim of these types of meetings is to conserve memory or enhance intellectual and physical independence of the elderly. By stimulating the memory and resources of the person, they strengthen its identity and increase its capacity of being autonomous30.
4. Conclusion The report shows that the discussion on active ageing in Belgium is well advanced with numerous contributions by academics, stakeholders (such as the insurance company Delta Lloyd), social partners (such as activities by the Federation des Enterprises de Belgique; Commissions by trade unions on late careers and retirement), the public administration (such as High Council for Employment; Study Committee on Ageing and FOREM) and interest groups (such as SeniorFlex).
Furthermore, the report provides insight into the desires of the ageing population in Belgium. The wish to retire at 60 is widely shared within this age group, but at the same time we observed a strong wish to stay active in the labour market. We also see that Belgium is doing well according to health indicators but its record is not so positive in alleviating poverty. The elderly are healthy but they need more income.
Life courses have individualized progressively with the emergence of new labour relationships. In other words, the collective approach that prevailed when contemporary social security systems were set up in Europe after World War II is no longer applicable to todays' workers. Or rather, it needs to be adapted so as to be flexible enough to fit workers' expectations. Also, inactivity, learning and work are not incompatible; they can actually coexist, which is why, for instance, vocational learning should not stop at 65.
To summarise, the majority of Belgiium’s elderly are able and willing to work, albeit under specific conditions, and they need additional income. Therefore a recommendation for Belgium would be to invest in removing obstacles to employment at later age and especially after retirement. Furthermore, public employment agencies, employers and agencies providing training should encourage workers to work. Also, more flexible systems, such as the part-time retirement system proposed by the insurance company Delta Lloyd, would be a highly recommended policy innovation.
Active ageing, however, should not be used as a pretext for passing on the risk to the elderly. Rather, it should aim to find solutions to allow for more individualised paths of ageing while accounting for the specials needs and vulnerability of the elderly.
30 http://www.aide-soignant.com/
EXTENDING WORKING LIVES IN BELGIUM 51
5. Bibliography Aichberger, M., M. Busch, F. Reischies, A. Stroehle, A. Heinz and M. Rapp (2010), “Effect of
physical inactivity on cognitive performance after 2.5 years of follow-up” GeroPsych 23(1):7-15.
Ashoka-Changemakers (2013), Perspective Coaching – Actively shaping the final phase of work and life afterwards, award-winning social innovation (http://www.changemakers.com/node/159837/comments#sthash.lhwHJaDQ.dpuf).
Becker, G. (1964), Human Capital: A Theoretical and Empirical Analysis, with Special Reference to Education, Chicago, IL: University of Chicago Press.
Benko, C. and A.C. Weisberg (2007), Mass Career Customization: Aligning the Workplace with Today’s Nontraditional Workforce; Boston, MA: Harvard Business School Press.
Berntson, E. and S. Marklund(2007), The relationship between perceived employability and subsequent health; Work and Stress, Vol. 31, No. 3, pp. 279-292.
Bureau Fédéral du Plan and Direction Générale Statistique Information Economique (BFP-DGSIE) (2013), Perspective de Population 2012-2060, Brussels : BFP.
Bryman A. (2012), Social Research Methods, Oxford: Oxford University Press.
CAPA (2006), Réponses aux stéréotypes concernant le travailleur plus âgé; Service Public Fédéral Emploi (2012).
Cappelli, P. (1999), The new deal at work: Managing the market-driven workforce; Boston, MA: Harvard Business School Press.
Comité d’Etude sur le Vieillissement (CEV) (2012), Rapport Annuel, Brussels: CEV.
Comité d’Etude sur le Vieillissement (CEV) (2013), Rapport Annuel, Brussels: CEV.
Chamahian, A. (2012), “Vieillissement actif et enjeux de la formation dans le temps de retraite” Lien social et Politiques No. 62: 59-69.
Conseil Supérieur de l'Emploi (CSE) (2012), Rapport 2012, Brussels: CSE (http://www.emploi.belgique.be/publicationDefault.aspx?id=36948).
Conen, W., H. van Dalen, K. Henkens and J. Schippers (2011), “Activating Senior Potential in Ageing Europe: an Employers’ Perspective”, ASPA integrative report, The Hague: NIDI.
Delta Lloyd (2011), Evaluation du projet « Stage Sans Age », Delta Lloyd Life SA, Brussels.
Delta Lloyd (2013): “Résultats de l’enquête nationale 2013 sur les pensions, Peut-on vraiment fixer un âge de la retraite ? Qu’en est-il de la politique de fin de carrière?”, Press release 4.6.2013 (http://www.deltalloydlife.be/Images/04062013_Dossierpresse_ sousembargojusquau4juin_13h_tcm22-41546.pdf).
Dekkers, G. (2008), “The pension bonus in the first-pillar pension system for employees in Belgium: simulations with the model MEP”, Paper prepared for the conference “Dag van de Sociologie 2008”, Leuven, May 29th, 2008 (http://soc.kuleuven.be/ceso/ dagvandesociologie/papers/DvdS_may_08_Dekkers.pdf).
Direction Générale Statistique et Information Economique (DGSIE) (2012), Chiffres Clés - Aperçu Statistique de la Belgique (http://statbel.fgov.be/fr/binaries/Chiffres_cles_2012 _tcm326-188881.pdf).

52 CONTRERAS, MARTELLUCCI & THUM
Eurofound (2002), “Agreement on outplacement for older workers” European Industrial Relations Observatory Online (http://www.eurofound.europa.eu/eiro/2002/08/ inbrief/be0208301n.htm).
European Commission (EC) (2013), Guide to social innovation, Brussels: European Commission (http://s3platform.jrc.ec.europa.eu/documents/10157/47822/Guide%20to%20Social%20Innovation.pdf).
Eurostat (2013), Population statistics (http://epp.eurostat.ec.europa.eu/portal/page/portal/ population/data/main_tables).
Fédération Générale du Travail de Belgique and Office National de l’Emploi (FGTB/ONEM) (2012), Guide Fiscal 2012, Brussels: FGTB (http://www.fgtb.be/c/document _library/get_file?uuid=3502c59a-1ff0-4910-9f08-1da01402346b&groupId=10134).
Fédération Générale du Travail de Belgique and Office National de l’Emploi (FGTB/ONEM) (2013), “Feuille info – travailleurs. Vous voulez conclure une convention avec une coopérative d'activités en tant que candidat entrepreneur?”.
Field, J. (2005): Social capital and learning, Bristol: The University Press.
Gaillard, M. and D. Desmette (2008), “When a ‘‘worker’’ becomes an ‘‘older worker’’: The effects of age-related social identity on attitudes towards retirement and work” Career Development International Vol. 13: 168–185.
Gaillard, M and D. Desmette (2010), “(In)validating Stereotypes About Older Workers Influences Their Intentions to Retire Early and to Learn and develop” Basic and Applied Social Psychology Vol. 32: 86–98.
Gajendran, R. and D. Harrison (2007), “The Good, the Bad, and the Unknown About Telecommuting: Meta-Analysis of Psychological Mediators and Individual Consequences” Journal of Applied Psychology Vol. 92 (6): 1524–1541.
Hansez, I., D. Faulx, A. Angenot, N. Burnay, F. Lurkin, L. Braeckman, M. van Risseghem (2011), “La gestion des âges dans les entreprises belges”, Brussels: Service Public Fédéral Emploi (www.emploi.belgique.be/WorkArea/DownloadAsset.aspx?id= 37060).
Hansez, I. (2013), “Impact of work on health” in: Vandenbrande et al. (eds.), Quality of Work and Employment in Belgium, Dublin: European Foundation for the Improvement of Living and Working Conditions.
Hoeck, S., G. Francois, J. Geerts, J. Van der Heyen, M. Vandewoude, G. Van Hal (2012), “Health-care and home-care utilization among frail elderly persons in Belgium”, European Journal of Public Health Vol. 22 (5): 671-677.
Hornung, S., D. M. Rousseau and J. Glaser (2008), “Creating flexible work arrangements through idiosyncratic deals” Journal of Applied Psychology Vol. 93: 655-664.
Ilmarimen, J. (2005), “Towards a longer worklife! Ageing and the quality of worklife in the European Union”, Finnish Institute of Occupational Health (FIOH), Helsinki (..
Jousten, A. and M. Lefevbre (2008), “Retirement Incentives in Belgium: Estimations and Simulations Using SHARE Data” De Economist (2013) 161: 253–276.
Kohli, M. (1986), “The world we forgot: A historical review of the life course” in: V. W. Marshall (eds.), Later life: The social psychology of ageing, Beverly Hills, CA: Sage.
EXTENDING WORKING LIVES IN BELGIUM 53
Lambers, M. (2007), “Employment and labour market policies for an ageing workforce and initiatives at the workplace - National overview report: Belgium”, Leuven: Higher Institute of Labour Studies (HIVA).
Lazear, E. P. (1979), “Why is There Mandatory Retirement?” The Journal of Political Economy Vol. 87 (6): 1261-1284.
Leonard, D. (2012), “L’entreprise, au centre du “vieillissement actif” ?, Les enseignements de la Belgique” in: Les Politiques Sociales: Le vieillissement actif - Regards pluriels Vol. 73.
Leopold, L. and H. Engelhardt (2011), “Bildung und Gesundheitsungleichheit im Alter: Divergenz, Konvergenz oder Kontinuität? Eine Längsschnittuntersuchung mit SHARE” Kölner Zeitschrift für Soziologie und Sozialpsychologie Vol. 63 (2): 207-236.
Leopold, L. and H. Engelhardt (2012), “Education and physical health trajectories in old age, Evidence from the Survey of Health, Ageing and Retirement in Europe (SHARE)” International Journal of Public Health Vol. 58 (1): 23-31.
Maes, M. (2011), “Will the Dismantlement of Early Retirement Schemes Increase Older Unemployment? A Competing-risk Analysis for Belgium” Labour Vol. 25 (2): 252–267.
Maes, M. and B. Stammen (2011), “The impact of (early) retirement on the subsequent physical and mental health of the retired: a survey among general practitioners in Belgium” HUB Research Paper Economics and Management 2011/03, Hogeschool-Universiteit Brussel, Brussels.
Marshall, V. (2013): “The Life Course and the Life Course Perspective Evolving”, Keynote address to the symposium “Paid Work Beyond Retirement Age in International Perspective”, Hanse‐Wissenschaftskolleg, Demenhorst: April 11‐12, 2013.
Moulaert, T. and D. Leonard (2012), “Le vieillissement actif – Presentation” Les politiques socials: Le vieillissement actif - Regards pluriels, Vol. 73.
Moulaert T. and D. Leonard (2011), “Le vieillissement actif sur la scène européenne”, Courrier hebdomadaire du CRISP, 2011/20 n° 2105, p. 5-33.
Moulaert T., Fusulier, B. and Tremblay, D.-G. (2009) , “Les fins de carrière à travers le prisme de la transaction sociale: une comparaison Belgique et Québec” Louvain: Université Catholique de Louvain (http://www.uclouvain.be/cps/ucl/doc/demo/documents/Moulaert.pdf).
Munnel, A. H. and R. A. Y. Wu (2012), “Are Aging Baby Boomers Squeezing Young Workers Out of Jobs?” Issues in Brief, Center for Retirement Research (http://crr.bc.edu/briefs/are-aging-baby-boomers-squeezing-young-workers-out-of-jobs/).
Organisation for Economic Cooperation and Development (OECD) (2005), “The Policy Challenge: Preparing for Population Ageing” in OECD Economic Surveys : Belgium 2005, Paris: OECD Publishing.
Organisation for Economic Cooperation and Development (OECD) (2010), EDUCATION AT A GLANCE, Paris: OECD Publishing.
Organisation for Economic Cooperation and Development (OECD) (2011): ???
Organisation for Economic Cooperation and Development (OECD) (2012), “OECD thematic follow-up review of policies to improve labour market prospects for older workers: Belgium” Paris: OECD Publishing.

54 CONTRERAS, MARTELLUCCI & THUM
Organisation for Economic Cooperation and Development (OECD) (2013), “Assessment and recommendations” in OECD Economic Surveys: Belgium 2013, Paris: OECD Publishing.
Organisation for Economic Cooperation and Development and European Commission (OECD/EC) (2012), “Policy Brief on Senior Entrepreneurship. Entrepreneurial activities in Europe” Luxembourg: Publications Office of the European Union.
Porter (2013): The payoff in delaying retirement, The New York Times March 5th 2013, http://www.nytimes.com/2013/03/06/business/the-payoff-in-retiring-a-few-years-later.html?_r=0
Riedel, M. and H. Hofer (2013), “Determinants of the transition from work into retirement” NEUJOBS working paper No. 17.1 (http://www.neujobs.eu/sites/default/files/NEUJOBS_Del.17.1.pdf).
Rosenfeldt, M. (2011), “Le viellissement de la population est-il une catastrophe pour le financement de la securite sociale?”; CEPAG Centre d’Education Populaire (http://www.fgtb-wallonne.be/sites/default/files/fichiers/petitions/vieillissement_population_-_12_878s_.pdf).
Radio et Télévision Belge Fédéral (RTBF) (2013), “Le nombre d’invalides ne cesse pas d’augmenter L’INAMI s’en inquiète” (http://www.rtbf.be/info/societe/detail_le-nombre-d-invalides-ne-cesse-d-augmenter-le-phenomene-inquiete-l-inami?id=8046830).
Salazar-Xirinachs, J. (2012), “Promoting longer life and ensuring work ability” Remarks at UNECE Ministerial Conference on Ageing, September 19., 2012, Vienna, Austria (http://www.ilo.org/employment/about/executive-director-office/statements-speeches/WCMS_190915/lang--en/index.htm).
Securex (2012), “Comment inciter les gens à travailler plus longtemps? Deux leviers d’actions « développer et ménager » pour une politique efficace” Securex Whitepaper.
Service Public Fédéral Emploi, Travail et Concertation Sociale (2009), “Outils pour comprendre le vieillissement du travail” in CAPA "Evolution des capacités physiques et physiologiques en fonction de l’âge dans la population au travail" (http://benhur.teluq.uquebec.ca/SPIP/aruc/IMG/pdf_CAPA_Brochure_Belgique.pdf).
Shacklock, K., L. Fulop, and L. Hort (2007), “Managing older worker exit and re-entry practices: A ‘revolving door’?” Asia Pacific Journal of Human Resources Vol. 45(2): 151-167.
Service Public Fédéral Emploi (2012), “Poursuivre ou reprendre une activite professionnelle apres 50 ans”, Brussels: SPF EmPloi, Travail et Concertation sociale, Direction générale Humanisation du travail.
Service Public Fédéral Emploi (2013), “La gestion des âges en enterprise”, Brussels : SPF Emploi, Travail et Concertation sociale. Direction générale Humanisation du travail.
Van Gorp, K. and J. Berghman (2013), “Note argentée” Recommandation politique pour un pays vieillissant”, Brussels: Delta Lloyd Life SA.
Vendramin, P. and G. Valenduc (2013), “Older workers and Work Sustainability” in Quality of Work and Employment in Belgium (www.vub.ac.be/SOCO/demo/papersonline/ R1456a_en.pdf).
Villosio, C., D. Di Pierro, A. Giordanengo, P. Pasqua and M. Richiardi (2008), “Working conditions of an ageing workforce”, Dublin: Eurofound.

EXTENDING WORKING LIVES IN BELGIUM 55
World Health Organisation (WHO) (2002), “Active Ageing. A Policy Framework”, WHO/NMH/NPH/02.8, Geneva: World Health Organisation.
Zimmer, H. (2012), “Labour Market Mismatches” NBB Economic Review, Brussels: National Bank of Belgium (http://www.nbb.be/doc/ts/publications/EconomicReview/2012/ ecorevII2012.pdf).

56 CONTRERAS, MARTELLUCCI & THUM
6. Appendix Background information for expert interviews and focus groups Schulman is an International company which employs approximately 3,000 people and has over 30 manufacturing and support facilities in North and South America, Europe and the Asia-Pacific region. The Company's principal product lines consist of plastic compounds, color concentrates and additives. Headquartered in Akron, Ohio, Schulman Belgium is located in Bornem (Office, Plant,Technology center) , Londerzeel (Office) and Opglabbeek (plant) . The interview took place in Londerzeel and concerned specifically the situation of the Belgian branch.
Le Fonds de l’expérience professionnelle (FEP) is a budgetary fund established in Belgium in the wake of the Lisbon agenda to increase the employment rate of older workers. It had its first execution on January 30, 2003. The team (around 10 people) of the FEP - established in 2004 -is responsible of the promotion and subvention of grants aiming at improving the working conditions, work organization and job opportunities of workers over 45 years old. Beneficiaries of the FEP are mostly private employers. The fund provides as well free advice on the preparation of the grant application. Since 2004, the FEP has received in total 1400 applications (Moulaert and Leonard, 2012). In 2011, the Fund received 188 grant applications. 146 (78%) requests came from Flanders, 33 (18%) from Wallonia and 9 (5%) from Brussels.
FGTB is the one of the two main trade unions in Belgium with more than 1.5 million members. It is a left-wing organization.
SeniorFlex is a Belgian NGO founded in 2003 that aims at promoting and defending those among the 45+ who want to find employment. Therefore, their target audience comprises unemployed workers as well as early retirees, retirees and disabled individuals. Seniorflex follows 4 general objectives: raising awareness against age discrimination, lobbying for the suppression of all obstacles to the employment of older citizens, creating and promoting a flexible legal framework for the employment of older people and finally, promoting a system of EVC based notably on what exists in Ireland (program TRED).
Focus group members were retrieved via ‘Belgium Senior Services’. We initially contacted the following associations for seniors: Seniorennet, Service Seniors - Bruxelles Ville, Service Seniors - Forest Ville, Coordination des associations de seniors, Espace Seniors asbl, Amicale des séniors 50+ (syndicat libéral). Service senior - Brussels and Amicale des séniors 50+, were the only one responsive association. They forwarded a description with scope and objective of the focus group to their mailing list. Interested parties contacted us directly to be informed on date and place of the meeting. We follow Bryman (2012) in conducting and setting up the focus groups.

MOPACT is a four year project funded by the European Commission under the Seventh Framework Programme to provide the research and practical evidence upon which Europe can begin to make longevity an asset for social and economic development.
o achieve this aim, MOPACT concentrates the highest possible quality of scientific analyses into the development of
innovative policies and approaches that can assist public authorities and other key actors, at all levels in Europe.
MOPACT starts from the conviction that Europe requires a new paradigm of ageing if it is to respond successfully to the challenges of demographic change. Ageing is currently understood as a time of decline, frailty and dependence and policy responses to it still reflect the historical era when retirement took place for a majority at state pension ages and post-retirement years were relatively short. Changes in the labour market and social behaviour coupled with a remarkable extension in longevity have transformed the experience of later life. The boundaries of frailty are being pushed back and, for a growing number of older Europeans, 70 is the new 50.
A multi-disciplinary team will target the key challenges of ageing:
• The continuing longevity revolution • A shrinking and ageing labour force • The fiscal sustainability of pensions, welfare
systems and health care • The structural lag between changes in society
and subsequent changes in societal institutions and attitudes
• The rising need for long-term care • Changing social and political roles
MOPACT brings together 29 partners from 13 countries across Europe in a unique collaboration of leading researchers to address the grand challenge of ageing.
The MOPACT project aims:
• To conduct the most comprehensive review to date of the social and economic challenges of ageing
• To collect and analyse social innovations and policy initiatives
• To map the steps required to realise active ageing in Europe and to propose innovative ways of doing so
• To involve key end-users and stakeholders, such as policy-makers, practitioners, product producers, designers and older people in all project activities
• To undertake the wide and effective knowledge transfer and dissemination of the work of MOPACT
MOPACT’s core theme is focused on realising active and healthy ageing as an asset. This will be support by eight scientific themes:
• Economic consequences of ageing: Understanding and alleviating the economic effects of population ageing
• Extending working lives: Raising the employment of older workers, aided by lifelong learning
• Pension systems, savings and financial education: Ensuring pension adequacy and pension system sustainability
• Health and well-being: Driving healthy life expectancy and the social engagement of older people
• Biogerontology: Delaying the onset of frailty, dependence and age related diseases
• Built and technological environment: Shaping housing, mobility, transport and ICT to support an ageing population
• Social support and long term care: Matching supply and demand for long-term care and social support
• Enhancing active citizenship: Enhancing the political participation of senior citizens and improving the capacity for adapting to societal change
T
Contact us:
University of Sheffield Department of Sociological Studies
Northumberland Road, Sheffield, S10 2TU, UK T: +44 (0)114 222 6417 F: +44 (0)114 276 8125
Email: [email protected] Website: www.mopact.group.shef.ac.uk

CENTRE FOR EUROPEAN POLICY STUDIES, Place du Congrès 1, B‐1000 Brussels, Belgium Tel: 32 (0)2 229 39 11 • Fax: 32 (0)2 219 41 51 • www.ceps.eu • VAT: BE 0424.123.986
ABOUT CEPS Founded in Brussels in 1983, the Centre for European Policy Studies (CEPS) is widely recognised as the most experienced and authoritative think tank operating in the European Union today. CEPS acts as a leading forum for debate on EU affairs, distinguished by its strong in-house research capacity, complemented by an extensive network of partner institutes throughout the world.
Goals • Carry out state-of-the-art policy research leading to innovative solutions to the challenges
facing Europe today, • Maintain the highest standards of academic excellence and unqualified independence • Act as a forum for discussion among all stakeholders in the European policy process, and • Provide a regular flow of authoritative publications offering policy analysis and
recommendations,
Assets • Multidisciplinary, multinational & multicultural research team of knowledgeable analysts, • Participation in several research networks, comprising other highly reputable research
institutes from throughout Europe, to complement and consolidate CEPS’ research expertise and to extend its outreach,
• An extensive membership base of some 132 Corporate Members and 118 Institutional Members, which provide expertise and practical experience and act as a sounding board for the feasibility of CEPS policy proposals.
Programme Structure In-house Research Programmes Economic and Social Welfare Policies
Financial Institutions and Markets Energy and Climate Change
EU Foreign, Security and Neighbourhood Policy Justice and Home Affairs Politics and Institutions
Regulatory Affairs Agricultural and Rural Policy
Independent Research Institutes managed by CEPS European Capital Markets Institute (ECMI) European Credit Research Institute (ECRI)
Research Networks organised by CEPS European Climate Platform (ECP)
European Network for Better Regulation (ENBR) European Network of Economic Policy
Research Institutes (ENEPRI) European Policy Institutes Network (EPIN)