Embed Size (px)
Citation preview

www.elsevier.com/locate/rseRemote Sensing of Environment 88 (2003) 144–156
Extending satellite remote sensing to local scales: land and water resource
monitoring using high-resolution imagery
Kali E. Sawaya*, Leif G. Olmanson, Nathan J. Heinert, Patrick L. Brezonik, Marvin E. Bauer
Department of Forest Resources, University of Minnesota, 1530 N. Cleveland Avenue St. Paul, MN 55108-6112, USA
Received 22 May 2002; received in revised form 19 March 2003; accepted 24 April 2003
Abstract
The potential of high-resolution IKONOS and QuickBird satellite imagery for mapping and analysis of land and water resources at local
scales in Minnesota is assessed in a series of three applications. The applications and accuracies evaluated include: (1) classification of lake
water clarity (r2 = 0.89), (2) mapping of urban impervious surface area (r2 = 0.98), and (3) aquatic vegetation surveys of emergent and
submergent plant groups (80% accuracy). There were several notable findings from these applications. For example, modeling and estimation
approaches developed for Landsat TM data for continuous variables such as lake water clarity and impervious surface area can be applied to
high-resolution satellite data. The rapid delivery of spatial data can be coupled with current GPS and field computer technologies to bring the
imagery into the field for cover type validation. We also found several limitations in working with this data type. For example, shadows can
influence feature classification and their effects need to be evaluated. Nevertheless, high-resolution satellite data has excellent potential to
extend satellite remote sensing beyond what has been possible with aerial photography and Landsat data, and should be of interest to resource
managers as a way to create timely and reliable assessments of land and water resources at a local scale.
D 2003 Elsevier Inc. All rights reserved.
Keywords: IKONOS; Remote sensing; High resolution imagery; Lake clarity; Aquatic vegetation; Impervious surface
1. Introduction
Although high-resolution imagery in the form of aerial
photography has been available for many years, the launch of
the IKONOS-2 by Space Imaging in September 1999 has
signaled a new era in satellite remote sensing. With multi-
spectral digital imagery approaching that of small to medium
scale photography, we are in a new period of applications
development. Our objective has been to evaluate high-reso-
lution satellite imagery in a variety of applications involving
monitoring of land and water resources. We approach each of
three applications at a ‘‘local’’ scale and address a pertinent
aspect of water quality in Minnesota. Each application
utilizes a single-date scene of IKONOS or QuickBird imag-
ery covering approximately 11�11 km areas.
To demonstrate the potential of the imagery, these
applications each take a closer look at digitally classifying
a particular aspect of monitoring and mapping land and
0034-4257/$ - see front matter D 2003 Elsevier Inc. All rights reserved.
doi:10.1016/j.rse.2003.04.0006
* Corresponding author. Tel.: +1-612-624-2202; fax: +1-612-625-
5212.
E-mail address: [email protected] (K. Sawaya).
water resources. We include: (1) the classification of lake
water clarity, (2) the determination of urban impervious
surface area, and (3) aquatic vegetation surveys of emer-
gent and submergent plant groups. Each application
attempts to take advantage of the increased spatial resolu-
tion and the multispectral properties of the data to digitally
classify aspects of the environment that have not been
possible to this degree of detail with satellite imagery in
the past. The first two applications take advantage of
existing methodologies for moderate resolution Landsat
data that have been modified for use with high-resolution
satellite data. These applications seem to make a smooth
transition to the new imagery type and should provide an
‘‘out of the box’’ solution to resource managers.
Throughout the paper we address several considerations
common to applications development with high-resolution
satellite imagery including:
1. Imagery acquisition parameters. Appropriate acquisition
windows for each type of application are identified and
the challenges inherent in working with large geographic
extents of high-resolution satellite data are discussed.

K. Sawaya et al. / Remote Sensing of Environment 88 (2003) 144–156 145
2. Field data sampling. Considerations for working with
point and polygon field data, preferred characteristics of
field reference data for use with high-resolution data, and
alternative approaches when ideal characteristics are not
available are discussed.
3. Spectral confusion. Instances of spectral confusion
associated with cover type classifications and how we
have amended our methods to account for them are
described.
4. Shadows. The effects of shadows on image classification
and ways these errors can be accounted for or avoided are
discussed.
5. Accuracy assessments. Approaches to modeling and
assessing the accuracy of output maps using various field
data sets, Landsat data of a similar date, and aerial photo
interpretation are discussed.
The paper is organized into three individual sections,
each reporting on a separate application and approach. A
concluding section revisits and synthesizes the above
considerations.
2. Lake water clarity classification
2.1. Background
Lakes are important recreational and aesthetic resources
that add to economic stability and quality of life. Protecting
and monitoring lake water quality is a major concern for
many local and state agencies. However, because of expense
and time requirements for ground-based monitoring, it is
impractical to monitor more than a small fraction of lakes by
conventional field methods. High-resolution satellite remote
sensing is another tool that can potentially be applied to
gather information needed for water clarity assessments in
lake-rich areas like Minnesota.
Results from several studies (e.g., Kloiber, Brezonik, &
Bauer, 2002; Kloiber, Brezonik, Olmanson, & Bauer, 2002;
Lillesand, Johnson, Deuell, Lindstrom, & Meisner, 1983)
have demonstrated a strong relationship between Landsat
Multispectral Scanner (MSS) or Thematic Mapper (TM)
data and ground observations of water clarity and chloro-
phyll a. In Minnesota, Olmanson, Bauer, and Brezonik
(2002) have developed a water clarity image processing
methodology and completed statewide assessments of over
10,500 lakes for thef 1990 and f 2000 time periods using
Landsat imagery. In this statewide assessment, water clarity
was evaluated for lakes over 8 ha (20 acres) in size, while
the smaller lakes and ponds were excluded due to the
relatively low spatial resolution of the Landsat imagery.
IKONOS imagery has four multispectral bands similar to
Landsat TM bands 1–4 and high spatial resolution, making
it a good candidate for applying previous methods to the
assessment of smaller lakes and ponds. In this study, we
used a September 4, 2001 IKONOS high-resolution satellite
image to assess the water clarity of smaller lakes and ponds
for a city scale analysis of water quality. These results are
compared to a lake water clarity classification using an
August 30, 2001 Landsat TM image. Assessment of smaller
lakes and ponds is important since they tend to be more
susceptible to impacts than larger lakes.
The overall objective of our research was to estimate
variables related to key management indicators, such as the
trophic state indices of Carlson (1977). The three common
water quality variables that indicate lake trophic state are
total phosphorus (TP), chlorophyll a (chla), and Secchi disk
transparency (SDT). Lake management agencies and organ-
izations use these variables for measurements, along with
various transformations such as the trophic state indices
(TSI). SDT is the most consistently collected trophic state
indicator, and it is strongly correlated with the responses in
the blue and red bands of Landsat TM/ETM+ data (Kloiber,
Brezonik, & Bauer, 2002; Kloiber, Brezonik, Olmanson et
al., 2002). Therefore, most of our research to date has
involved calibrating Landsat TM data with ground-based
SDT measurements and estimating SDT for all lakes in an
image from the regression equation developed in the cali-
bration step. The results then can be mapped directly as
distributions of SDT in the lakes, or the estimated SDT can
be converted to Carlson’s trophic state index based on
transparency: TSI(SDT) = 60–14.41 ln(SDT).
It is important to recognize that other factors besides
algal turbidity (as indicated by chlorophyll levels) may
affect SDT in lakes. Most important of these (non-trophic-
state) factors are humic color and non-algal turbidity (in-
cluding soil-derived clays and suspended sediment). For this
reason, we report our results based on SDT calibrations as
satellite-estimated SDT or TSI(SDT), which clearly identi-
fies the value as an index based on transparency, rather than
the generic term, TSI.
The specific objective for this study was to perform an
assessment of TSI(SDT) for the City of Eagan, MN. This
area was particularly well suited for this study since it has
375 small lakes, ponds, and wetlands and a well-established
lake monitoring program.
2.2. Methods
We used methods developed by Olmanson (1997) and
continued in subsequent studies (e.g., Kloiber, Brezonik, &
Bauer, 2002; Kloiber, Brezonik, Olmanson et al., 2002;
Olmanson et al., 2002) to apply Landsat imagery to regional
scale assessments of lake water clarity. We made minor
modifications including the addition of a lake polygon layer
to minimize spectral confusion between open water, shad-
ows and asphalt features to make these methods compatible
with high-resolution satellite imagery.
2.2.1. Satellite imagery and lake reference data
Images for water clarity assessment were selected from a
late summer index period (July 15–September 15, with a

K. Sawaya et al. / Remote Sensing of Environment 88 (2003) 144–156146
preference for August). This period was found to be the best
index period for remote sensing of water clarity in Minne-
sota (Kloiber, Brezonik, Olmanson et al., 2002). There are at
least two major advantages to using images from this
period: (1) short-term variability in lake water clarity is at
a seasonal minimum, and (2) most lakes have their mini-
mum water clarity during this period. In addition, it is
preferable to have images from near anniversary dates for
change detection.
We acquired two satellite images, August 30, 2001
Landsat TM (path 27, rows 29 and 30) and September 4,
2001 IKONOS of Eagan, MN for this assessment. Both
images were of high quality and free of haze, clouds and sun
glint. It is critical to avoid IKONOS images displaying
specular reflection, or ‘‘sun glint’’ effects from lakes for this
application. Certain combinations of IKONOS view azi-
muths and zenith angles can result in bidirectional reflec-
tance that saturates the sensor, making the data unusable for
this and other water related applications. Although the
imagery used in this analysis was suitable, specular reflec-
tance effects have created problems for some of the other
images we acquired for lake water clarity assessments
between 1999 and 2001. We did not perform atmospheric
correction or normalization of the imagery for the regression
method used.
The availability of lake reference data was excellent due
to the City of Eagan’s Water Resources program and
volunteer participation in the Citizen Lake Monitoring
Program. The programs provided 94 SDT lake reference
points for the Landsat image taken within three days of the
image acquisition and 13 SDT lake reference points for the
IKONOS image taken within seven days of the image
acquisition. The SDT data were distributed over a wide
range of water quality.
2.2.2. Classification procedures
This section summarizes our image classification proce-
dures; more detail is provided by Olmanson et al. (2002),
and the rationale for the procedures is described by Kloiber,
Brezonik, Olmanson et al. (2002). We used ERDAS Imag-
ine image processing software, and ArcView geographical
information system (GIS) software, for the image processing
steps. Acquiring a representative image sample from each
lake used for calibration or accuracy assessment was our
primary objective. Ideally, the sample should represent the
center portion of the lake in at least five meters of water (or
twice the SDT measurement) where reflectance from veg-
etation, the shoreline, or the lake bottom do not affect the
spectral response. It was also critical to avoid shadowed
portions of lakes, which would lead to unnaturally clear lake
estimations.
We produced a ‘‘water-only’’ image by performing an
unsupervised classification in ERDAS Imagine. Because
water features tend to have very different spectral charac-
teristics from terrestrial features, water was put into one or
more distinct classes that we could easily identify. We then
masked out terrestrial features creating a water-only image.
This method worked well for the Landsat imagery; how-
ever, with IKONOS imagery this clustering also included
pixels from shadows, asphalt, and other dark features.
Therefore, we created a lake polygon layer to help mask
the non-water dark features on the IKONOS image. Then
we performed a second unsupervised classification on the
water-only image and generated spectral signatures of each
class. We used these signatures, along with the location
where the pixels occur, to differentiate classes containing
clear water, turbid water, and shallow water (where sedi-
ment and/or macrophytes affect spectral response). Based
on this analysis, we recoded classes to avoid shadow,
vegetation, bottom, and terrestrial effects when selecting
lake sample locations. Digital number values from the
imagery were obtained to develop relationships with mea-
sured SDT. For this assessment, we used a polygon layer,
described in Olmanson et al. (2002), to help automate the
process. We used the signature editor in ERDAS Imagine
to extract the spectral data from the image for each sample
location.
We calibrated the Landsat image using the 94 SDT
measurements collected within three days of the image
acquisition date. Using log-transformed SDT data as the
dependent variable and Landsat Thematic Mapper band 1
(TM1) and the TM1/TM3 ratio as independent variables, we
performed a multiple regression. The regression model, with
r2 = 0.76 and SEE = 0.39, for prediction of SDT from the
Landsat TM data was:
lnðSDTÞ ¼ 1:493*ðTM1:TM3Þ � 0:035ðTM1Þ � 1:956 ð1Þ
Once we developed the model for the Landsat image, we
used another polygon layer with all of Eagan’s lakes, ponds,
and wetlands 0.08 ha and larger to extract data from all
possible water-bodies with enough unaffected pixels to
predict water clarity. Forty-eight of Eagan’s lakes and ponds
had a sample of at least eight unaffected pixels that we used
to predict water clarity. We used the model above, devel-
oped from the entire Landsat image, to predict water clarity
for 48 of Eagan’s lakes and ponds. For this assessment, the
smallest pond that we were able to predict water clarity for
using the Landsat TM image was 1.5 ha.
We then calibrated the IKONOS image using two differ-
ent datasets. The first dataset was 13 SDT measurements
collected within seven days of the image acquisition date.
The other dataset was 48 water clarity measurements
extracted from the Landsat image. We used this dataset to
compare the compatibility of the IKONOS imagery with
Landsat TM imagery and to explore an optional calibration
method if sufficient ground observations were not available
for a given scene. We performed a multiple regression using
log-transformed SDT data as the dependent variable and
IKONOS band 1 (IK1) and the IK1:IK3 ratio as independent
variables.
K. Sawaya et al. / Remote Sensing of Environment 88 (2003) 144–156 147
Lake water clarity maps can then be created from the
regression model by two methods. The first method
applies the model to each individual water pixel. This
method creates a pixel-level lake map. With this map, all
water pixels are classified and intra-lake variability can be
evaluated. The second method uses the digital numbers
collected from the sample of each lake to calculate an
average water clarity estimate. The data can then be
linked to a lake polygon layer to create a lake-level water
clarity map. This latter method has the advantage of
generating a single water clarity number for each lake
that can be used in other analyses or included in a water
clarity database.
2.3. Results and discussion
This assessment showed strong relationships between
both water clarity datasets (TM-derived and SDT-derived)
and the spectral-radiometric response of the IKONOS
data. The regression model (n = 48, r2 = 0.94, SEE = 0.15)
for prediction of SDT from the IKONOS data using the
water clarity data derived from the Landsat TM image
was:
lnðSDTÞ ¼ 1:958*ðIK1:IK3Þ � 0:004ðIK1Þ � 2:957 ð2Þ
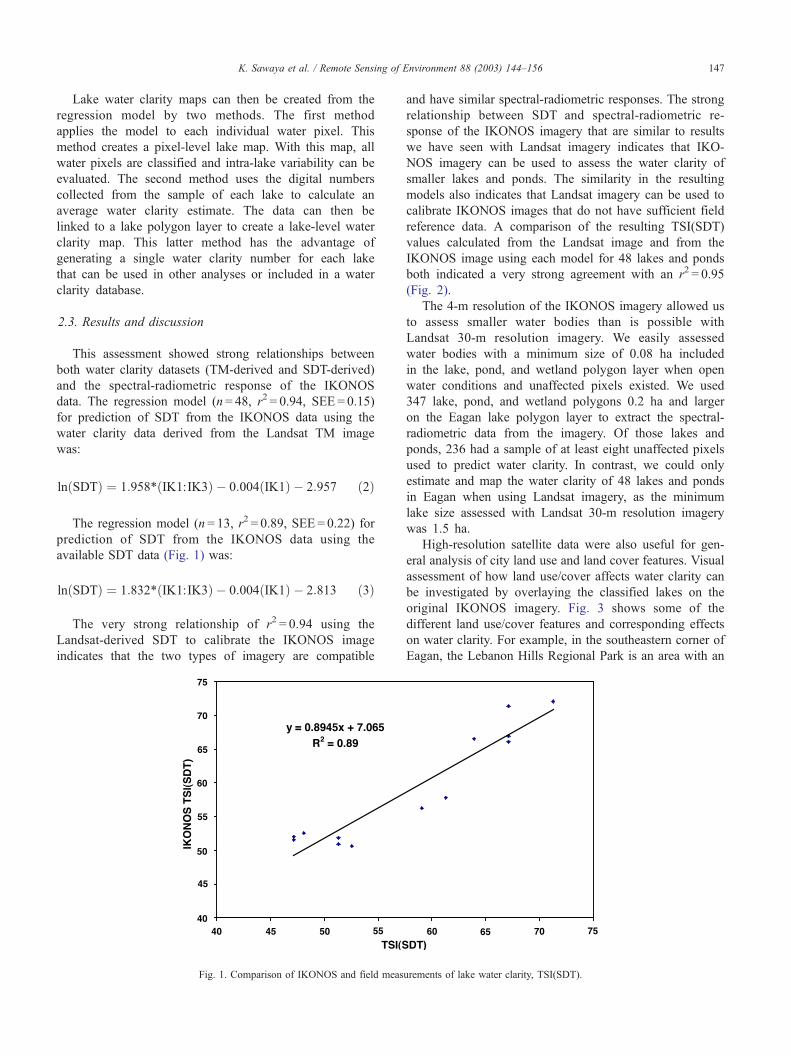
The regression model (n = 13, r2 = 0.89, SEE = 0.22) for
prediction of SDT from the IKONOS data using the
available SDT data (Fig. 1) was:
lnðSDTÞ ¼ 1:832*ðIK1:IK3Þ � 0:004ðIK1Þ � 2:813 ð3Þ
The very strong relationship of r2 = 0.94 using the
Landsat-derived SDT to calibrate the IKONOS image
indicates that the two types of imagery are compatible
Fig. 1. Comparison of IKONOS and field meas
and have similar spectral-radiometric responses. The strong
relationship between SDT and spectral-radiometric re-
sponse of the IKONOS imagery that are similar to results
we have seen with Landsat imagery indicates that IKO-
NOS imagery can be used to assess the water clarity of
smaller lakes and ponds. The similarity in the resulting
models also indicates that Landsat imagery can be used to
calibrate IKONOS images that do not have sufficient field
reference data. A comparison of the resulting TSI(SDT)
values calculated from the Landsat image and from the
IKONOS image using each model for 48 lakes and ponds
both indicated a very strong agreement with an r2 = 0.95
(Fig. 2).
The 4-m resolution of the IKONOS imagery allowed us
to assess smaller water bodies than is possible with
Landsat 30-m resolution imagery. We easily assessed
water bodies with a minimum size of 0.08 ha included
in the lake, pond, and wetland polygon layer when open
water conditions and unaffected pixels existed. We used
347 lake, pond, and wetland polygons 0.2 ha and larger
on the Eagan lake polygon layer to extract the spectral-
radiometric data from the imagery. Of those lakes and
ponds, 236 had a sample of at least eight unaffected pixels
used to predict water clarity. In contrast, we could only
estimate and map the water clarity of 48 lakes and ponds
in Eagan when using Landsat imagery, as the minimum
lake size assessed with Landsat 30-m resolution imagery
was 1.5 ha.
High-resolution satellite data were also useful for gen-
eral analysis of city land use and land cover features. Visual
assessment of how land use/cover affects water clarity can
be investigated by overlaying the classified lakes on the
original IKONOS imagery. Fig. 3 shows some of the
different land use/cover features and corresponding effects
on water clarity. For example, in the southeastern corner of
Eagan, the Lebanon Hills Regional Park is an area with an
urements of lake water clarity, TSI(SDT).

Fig. 2. Comparison of Landsat and IKONOS estimates based on Landsat modeling of lake water clarity, TSI(SDT).
K. Sawaya et al. / Remote Sensing of Environment 88 (2003) 144–156148
abundance of forest and wetland areas and limited devel-
opment in the form of parking lots and pavilions for park
visitors. This area has relatively high lake water clarity with
TSI(SDT) of around 50 and SDT of f 2 m. In many of the
residential and commercially developed areas, stormwater
is directed into lakes using them as convenient reservoirs.
The increase in impervious surface area and direct connec-
tion to the stormwater system has dramatically changed the
hydrology of many water bodies in Eagan. These changes
Fig. 3. Lake water clarity classification of IKONOS multispectral data ove
of increased watershed size, amount of runoff and quality
of runoff water have impacted many of Eagan’s water
bodies. These impacts can be seen in Fig. 3 where water
clarity of lakes and ponds in many of the developed areas is
generally TSI(SDT) 65–70 and SDT of f 0.5 m due to
eutrophication.
This study showed the usefulness of high-resolution
satellite imagery for water clarity assessments at a city
scale. This type of information can be very useful in city
rlaid on panchromatic land image. (Imageryn Space Imaging L.P.).

K. Sawaya et al. / Remote Sensing of Environment 88 (2003) 144–156 149
planning and lake management to help monitor and protect
water clarity at a local scale.
3. Impervious surface mapping
3.1. Background
Impervious surfaces, or areas impenetrable by water,
negatively affect the natural environment. These built envi-
ronments—including roads, rooftops, sidewalks and parking
lots—increase the rate of stormwater runoff, which transport
surface pollutants to receiving lakes and ponds. Thus,
impervious surfaces threaten water quality (Barnes, Morgan,
& Roberge, 2000; Sleavin, Civco, Prisloe, & Giannatti,
2000). In addition, Estes, Gorsevski, Russel, Quattrochi,
and Luvall (1999) suggest that impervious surfaces are
related to energy balances, urban heat island effects, habitat
fragmentation, and poor landscape aesthetics. To monitor
these impacts, resource managers have quantified the de-
gree, extent, and spatial distribution of impervious surface
areas using various methods including ground surveys,
aerial photography interpretation, and satellite remote sens-
ing. Satellite imagery, particularly Landsat TM and ETM+,
has recently emerged as an approach with the capability to
effectively estimate the percentage of impervious cover in
urban areas (Bauer, Doyle, & Heinert, 2002; Civco & Hurd,
1997; Ridd, 1995).
Previous research using Landsat TM data acquired in
1986, 1991, 1998, and 2000 across the Twin Cities Metro-
politan Area suggests that a strong relationship (correlation
f 0.9) exists between the Landsat spectral-radiometric
response and percent impervious surface area calculated
from measurements of digital orthophoto quadrangle
(DOQs) imagery (Bauer et al., 2002). In this study, we
Fig. 4. Sample areas delineated over Digital Orthophoto Quadrangles (DOQs)
calibration and evaluation.
investigate whether a similar method is suitable for high-
resolution IKONOS imagery at a local scale for the City of
Eagan, MN. Eagan is located southwest of St. Paul, MN and
covers 89 km2. In the 1990s, Eagan’s population growth
increased 33%, reaching 63,557 in 2000. The landscape
consists mostly of single/multi-family residential, commer-
cial/industrial, parks and recreational areas, vacant and
agricultural lands, and numerous small lakes and ponds.
3.2. Methods
We performed several background tests to determine
which spectral transformation provided the strongest rela-
tionship to percent impervious surface area. For IKONOS
data, a correlation of 0.90–0.95 suggested that the normal-
ized difference vegetation index (NDVI) provided the best
relationship. Other transformations considered were IR/red
ratio and principal components. The ratio had a correlation
of 0.93 and the second principal component had a correla-
tion of 0.86 with percent impervious. The ratio and the
NDVI had similar results, but we selected NDVI due to its
familiarity. In past research with Landsat TM imagery, we
used tasseled cap greenness (Bauer et al., 2002), but this
was not possible since the coefficients for a tasseled cap
transformation of IKONOS data have not been determined.
IKONOS digital imagery of the study area was acquired
on September 4, 2001. The imagery was clear and cloud-
free; therefore, no atmospheric correction was necessary.
Using 270 ground control points, we rectified and registered
the imagery to DOQs covering the same area, with an RMS
error of 1.24 m.
We began our image processing by performing a general
land cover classification using a supervised, maximum
likelihood approach in ERDAS Imagine. Due to spectral
confusion among some water features and asphalt, we hand
used to calculate varying degrees of impervious surface area for model
K. Sawaya et al. / Remote Sensing of Environment 88 (2003) 144–156150
digitized open water and wetland areas using heads up
digitization from the IKONOS imagery. Due to spectral
confusion between bare areas and concrete, we also hand
digitized bare fields and extraction areas. Using these
techniques, we were able to achieve an overall classification
accuracy of 93% for urban, vegetation, bare areas, and
water. Pixels from the urban class were retained for the
determination of percent imperviousness. Vegetation and
bare classes were recoded as 0% impervious.
Using DOQs, we then selected well distributed samples
across the study area to represent varying degrees of
imperviousness. The objective was to obtain a complete
range of percent imperviousness with at least two samples
for each 10% interval. Sample areas ranged in size from 300
to 2400 pixels. We used ArcView 3.2 to digitize the
boundaries around each impervious feature and calculate
the impervious surface percentage for that individual sample
area (Fig. 4).
After calculating and attributing the percent impervious-
ness for each sample area, we determined the mean NDVI
value for each sample area by overlaying the sample onto
the NDVI transformed IKONOS image. We then created a
second order polynomial regression equation with the mean
NDVI value as the independent variable and percent imper-
vious surface area as the dependent variable. With this
regression equation, we estimated impervious surface per-
cent for each image pixel and rescaled the output values
from 0% to 100%. To evaluate classification accuracy, we
compared 25 additional independent samples of impervious
surface area determined from the DOQs to the IKONOS
map of imperviousness.
4. Results and discussion
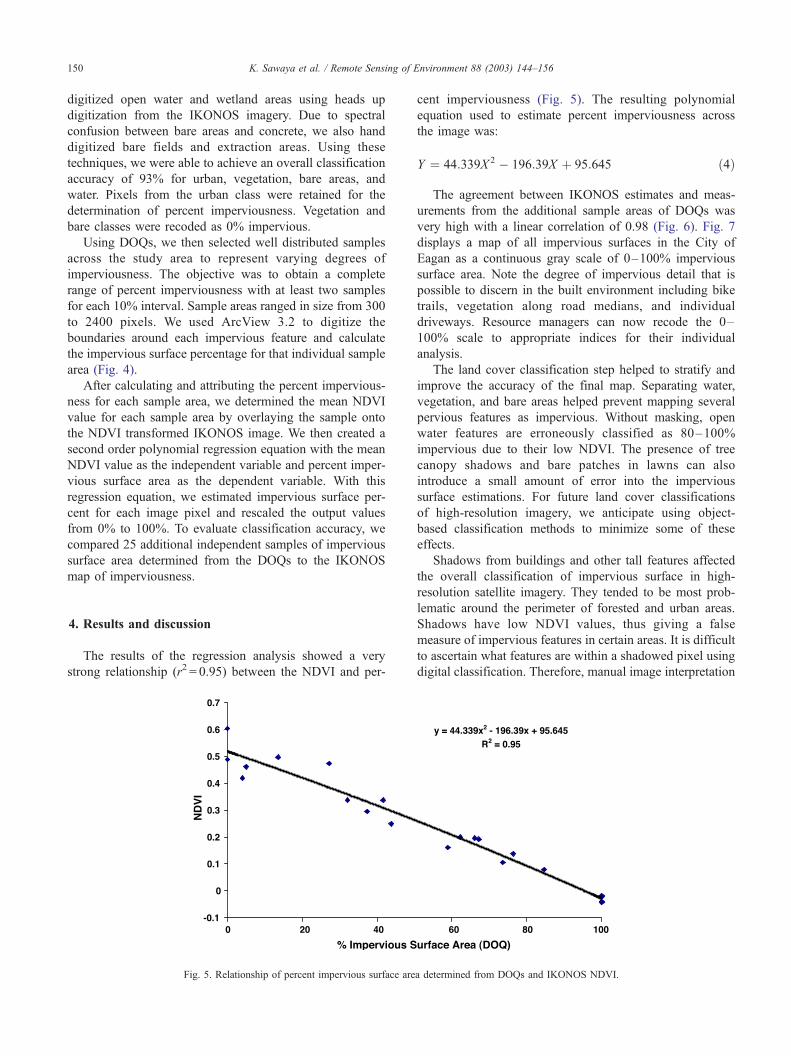
The results of the regression analysis showed a very
strong relationship (r2 = 0.95) between the NDVI and per-
Fig. 5. Relationship of percent impervious surface are
cent imperviousness (Fig. 5). The resulting polynomial
equation used to estimate percent imperviousness across
the image was:
Y ¼ 44:339X 2 � 196:39X þ 95:645 ð4Þ
The agreement between IKONOS estimates and meas-
urements from the additional sample areas of DOQs was
very high with a linear correlation of 0.98 (Fig. 6). Fig. 7
displays a map of all impervious surfaces in the City of
Eagan as a continuous gray scale of 0–100% impervious
surface area. Note the degree of impervious detail that is
possible to discern in the built environment including bike
trails, vegetation along road medians, and individual
driveways. Resource managers can now recode the 0–
100% scale to appropriate indices for their individual
analysis.
The land cover classification step helped to stratify and
improve the accuracy of the final map. Separating water,
vegetation, and bare areas helped prevent mapping several
pervious features as impervious. Without masking, open
water features are erroneously classified as 80–100%
impervious due to their low NDVI. The presence of tree
canopy shadows and bare patches in lawns can also
introduce a small amount of error into the impervious
surface estimations. For future land cover classifications
of high-resolution imagery, we anticipate using object-
based classification methods to minimize some of these
effects.
Shadows from buildings and other tall features affected
the overall classification of impervious surface in high-
resolution satellite imagery. They tended to be most prob-
lematic around the perimeter of forested and urban areas.
Shadows have low NDVI values, thus giving a false
measure of impervious features in certain areas. It is difficult
to ascertain what features are within a shadowed pixel using
digital classification. Therefore, manual image interpretation
a determined from DOQs and IKONOS NDVI.

Fig. 6. Comparison of measured and IKONOS estimates of percent impervious surface area.
K. Sawaya et al. / Remote Sensing of Environment 88 (2003) 144–156 151
may be necessary if it is crucial to know the composition of
shadowed pixels. The high radiometric resolution option
(11-bit for IKONOS) may also provide a means to resolve
and characterize ground features within shadowed areas and
will be evaluated in future studies. Though the presence of
shadows can affect accuracy in this application, they tend to
affect individual pixels or small groups of pixels. Most
environmental models would analyze numerous pixels to-
gether (watershed, municipality, etc.), minimizing this error
across the landscape.
The September 4, 2001 imagery represented a time of
leaf-on conditions where tree crowns and other vegetation
could potentially obscure some impervious features. Our
Fig. 7. Maps of percent impervious surface area deriv
work with Landsat data indicates that these conditions
introduce a statistically insignificant amount of error. We
have recently acquired leaf-off IKONOS imagery (Novem-
ber 2002) to determine differences or advantages between
using leaf-on, leaf-off, or a combination of the two with
high resolution satellite imagery.
We believe this approach to mapping impervious surface
is superior to assigning an assumed impervious value to a
land cover type of an existing map. We suggest that a pixel-
by-pixel approach is more accurate and better represents the
gradation of impervious values across features in neighbor-
hoods and industrial areas. This application takes advantage
of the increased spatial resolution of the high-resolution
ed from classification of IKONOS NDVI data.

K. Sawaya et al. / Remote Sensing of Environment 88 (2003) 144–156152
satellite imagery and should be of interest to natural
resource and city managers who need to evaluate storm-
water runoff, heat island effects, the protection of green
corridors, and other types of assessments quantifying built
environments.
5. Aquatic vegetation surveys
5.1. Background
While lakes are well known for their recreational and
aesthetic value, traditionally, society has considered wet-
lands as nuisances and problems that need to be cleaned
up. Statewide, Minnesota has drained over half of the
original wetlands (around 4.5 million hectares) for agricul-
tural and development purposes, and many of the remain-
ing wetlands are degraded. A frequent cause of wetland
degradation is increased storm water discharge resulting
from changes such as increases in impervious surface area
or installation of storm water systems in urban and subur-
ban areas, as well as tiling and ditching systems in
agricultural areas. Changes in hydrology affect the water
quality and quantity, and may severely impact the function
of wetlands (Daily, 1997). When too many wetland plants
are removed or impacted, water quality, wildlife, and fish
populations can suffer (Mitsch & Gosselink, 1993). These
plants are important because they help protect water
quality, provide habitat for fish and wildlife, and provide
economic and aesthetic opportunities (Barbier, Burgess, &
Folke, 1994).
Aquatic plants in lakes and wetlands are beginning to
be recognized as important ecosystem features in need of
protection. As a result of this greater appreciation for
aquatic plants in wetland and lake environments, aquatic
plant surveys and assessments are becoming part of routine
monitoring efforts conducted by consultants, citizen
groups, and state and local agencies. Aquatic plant diver-
sity and abundance are important indicators of lake or
wetland health, but accurate maps and data are difficult to
acquire. Because ground-based mapping requires much
time and human resources, only a small fraction of this
large resource has been mapped by natural resource
agencies.
The principal objective of this study was to evaluate the
capability of high-resolution satellite imagery to map and
classify aquatic plant groups for use by resource manage-
ment agencies. To do the evaluation using IKONOS imag-
ery, we conducted an aquatic plant survey on Swan Lake in
Nicollet County, MN. Swan Lake is a large (>3600 ha),
‘‘type-4’’ wetland meaning it is classed as a deep fresh water
marsh with standing water and abundant aquatic vegetation.
To evaluate the use of QuickBird imagery for assessment of
aquatic plants in open water lakes, we conducted aquatic
plant surveys of three lakes south of Lake Minnetonka. The
lakes include Christmas Lake (104 ha) mostly in Hennepin
County, and West Auburn (55 ha) and Shutz (38 ha) Lakes
in Scott County, MN.
5.2. Methods
We adapted methods typically used for land cover clas-
sification (Lillesand et al., 1998) and developed for water
clarity assessments (Olmanson et al., 2002) to do the
evaluation. The aquatic plant classification methods con-
sisted of two procedures: separation of image features into
discrete units and classification of the pixels in each unit.
5.2.1. Satellite image data
For this study, we used an IKONOS image acquired on
September 1, 2001 of the Swan Lake area and a QuickBird
image acquired on July 28, 2002 of the Lake Minnetonka
area. An acquisition window of July 15 through September
15 captures the presence of aquatic vegetation in Minnesota.
The images were of high quality with only minor cloud
cover over the southern portion of the IKONOS image. We
applied a resolution enhancement of the multispectral bands
using the panchromatic band. Atmospheric correction or
normalization of the imagery was not necessary for the
methods used in this study.
5.2.2. Aquatic vegetation reference data
Due to the size of Swan Lake and the abundance of
aquatic plants in the lake, the collection of reference data
would be very difficult without the aid of modern technol-
ogy. We used Global Positioning System (GPS) technology
and the advanced GPS tracking software in ERDAS Imag-
ine 8.5. We collected field reference data shortly after
acquiring the imagery using a Fujitsu pen computer. While
in the field, we identified different types of aquatic vegeta-
tion and located them directly on the IKONOS image using
the field computer. Being able to accurately identify specific
locations on the image while in the field was especially
useful on this large wetland. Having the image available
quickly after its acquisition for use in reference data
collection was also a significant advantage in field sampling
because we could identify unique areas with different
spectral-radiometric responses on the image and target them
for field identification. We targeted emergent vegetation for
the evaluation, but also noted the location of submerged
vegetation appearing at the surface.
For the three lakes south of Lake Minnetonka the
Minnesota Department of Natural Resources collected the
field data. For this study the field data specifically targeted
submerged plants using an echo sounder equipped with a
GPS unit. The hydroacoustic survey collected data pertain-
ing to lake depth and plant depth at thousands of points in
the shallower portions of the lakes where aquatic plants
were present but not at the surface. General point survey
data were collected in areas where the submerged plants
were topped at the surface or where there were floating or
emergent plants.

K. Sawaya et al. / Remote Sensing of Environment 88 (2003) 144–156 153
5.2.3. Classification procedures
The first step for the Swan Lake IKONOS image was to
separate wetland features from terrestrial features by digi-
tizing the aquatic terrestrial boundary around the entire
wetland and all islands. We identified this boundary using
spectral-radiometric differences and spatial patterns visible
on the image. We then subset the image with the wetland
polygon to mask out all terrestrial features and create a
wetland-only image.
Swan Lake has a maximum depth of 2 m, clear water
throughout, and an abundance of aquatic vegetation. Con-
sequently, we assumed that aquatic vegetation was present
throughout the wetland. An aquatic vegetation survey con-
ducted by Tyler and Madsen (personal communication), in
which the presence or absence of 27 species of aquatic
plants at 118 evenly distributed sample points on the lake
was recorded, verified this assumption. The next step was to
stratify the wetland into emergent and submergent vegeta-
tion by performing an unsupervised classification specifying
10 classes. Emergent vegetation had very different spectral
characteristics from most submerged vegetation and were
put into distinct classes easily identified from the locations
where they occurred. We masked out submerged vegetation
features to create an emergent vegetation image, and con-
ducted a second unsupervised classification on the emergent
image using 100 classes. Because of the difficulty in
separating some emergent plant types and our finding that
some areas with very thick submergent plant mats floating
on the surface were included in the image, we conducted
further ‘‘cluster busting’’ by stratifying the image further
Fig. 8. IKONOS image classification of aquatic vegetation of Swan
into two emergent images and a thick submergent image.
We performed a third level of unsupervised classifications
using 100 classes for the emergent vegetation images and 10
classes for the thick submergent vegetation image. Using the
field reference data, we identified five different emergent
classes on the emergent vegetation images and recoded the
images to create an emergent vegetation map. We repeated
this procedure for the thick submerged vegetation image and
identified two submerged classes.
Next, we created a submerged vegetation image by
masking the emergent vegetation features. We clustered
the submergent vegetation image into 10 classes to identify
different types of submergent aquatic vegetation. Using a
graph of the spectral-radiometric signatures of the different
classes and the reference data, we identified classes of
different aquatic plant densities. Assuming that water clarity
is similar throughout the wetland and that aquatic plants are
located throughout the wetland, we attributed the differences
in spectral response to differences in submerged aquatic
plant depth and densities. We identified classes with higher
radiometric response as areas where the submerged vegeta-
tion was highly dense and appeared at the surface, and areas
with lower radiometric response as areas where submerged
vegetation was deeper or thinner. We created the submerged
vegetation map by combining the two submerged plant
images and recoding the map into four different submerged
plant density classes. Finally, we created an aquatic plant
classification map by overlaying the submerged aquatic
plant map and the emergent aquatic plant map over the
panchromatic image (Fig. 8).
Lake in Nicollet County, MN (Imageryn Space Imaging L.P.).

Table 2
Accuracy of IKONOS image classification of aquatic vegetation for Swan
Lake, MN
Classified Reference data
dataCattail Sedge Sedge,
dead
Bulrush Lily Submerged Users
accuracy
(%)
Cattail 24 3 88.9
Sedge 4 2 66.7
Sedge,
dead
5 100.0
Bulrush 7 100.0
Lily 13 1 92.9
Submerged 4 3 4 13 54.2
Producers
Accuracy (%)
100.0 36.4 62.5 53.8 100.0 92.9 79.5
K. Sawaya et al. / Remote Sensing of Environment 88 (2003) 144–156154
We followed similar procedures for the three lakes south
of Lake Minnetonka with the exception of also stratifying
the open water areas before classification of the submerged
and emergent/floating aquatic plants.
Stratification and unsupervised classification of the res-
olution-enhanced multispectral high-resolution imagery pro-
vided us with high-resolution maps that identify different
aquatic vegetation groups throughout the Swan Lake and
three lakes. The accuracy evaluation of the lake assessments
is ongoing and will be included in subsequent papers. To
evaluate the accuracy of the Swan Lake aquatic vegetation
map, we had two datasets available. The first is the field
data we collected and used to classify the imagery. Unfor-
tunately, these locations were not random and are biased by
our prior knowledge of the aquatic vegetation types.
The other dataset, collected by Tyler and Madsen (un-
published), has 118 evenly distributed data points for which
they identified the presence or absence of 27 species of
aquatic plants. In reviewing the locations of these data, it
became clear that some points were not accurately posi-
tioned on the map. For example, the GPS coordinates of
some aquatic plant points were in forested areas at least 50
m away from the nearest aquatic plants. Therefore, instead
of using this survey for an accuracy assessment, we used it
to compare the statistical distribution of plant species in
Swan Lake.
5.3. Results and discussion
The final classification map for Swan Lake with five
classes of emergent and four classes of submerged aquatic
vegetation is shown in Fig. 8. Qualitative comparison to the
field observations that were initially acquired with the
imagery indicate that the classes of vegetation have been
mapped quite accurately. There was strong agreement be-
tween the field survey of plant distribution by Tyler and
Madsen and the IKONOS classification (Table 1). We also
have quantified the accuracy in an error matrix for the
emergent classes and the submerged class as a whole (Table
2). The overall accuracy was 79.5%, with producers and
users accuracies from 36% to 100% for the individual
classes. The highest accuracies occurred with plants that
grow in homogeneous dense beds such as cattail and water
lily/floating leaf pondweed. Plants that tend to have sparse
growing characteristics and areas with more heterogeneous
Table 1
Comparison of IKONOS and field survey estimates of the distribution of
aquatic vegetation diversity in Swan Lake, MN
IKONOS (%) Field survey a (%)
Submerged plants 63.6 58.5
Cattail 28.1 23.7
Sedge and dead sedge 2.5 5.1
Bulrush 1.6 6.8
Water lily and FLPW 4.2 5.9
a Tyler and Madsen, unpublished data.
plant communities were more difficult to classify accurately.
Ideally, the image would be taken back into the field after
classification, shortly after image acquisition, to verify the
classification using the GPS tracking software. Being able to
accurately identify specific locations on the classified image
while in the field would be especially useful for accuracy
assessments and for improving the classification.
Preliminary review of the aquatic plant assessments of
the three lakes south of Lake Minnetonka indicates that
submerged plants can be separated from open water areas
and classified to a plant top depth of around 2 m. It also
appears that submerged plants with more dense growing
characteristics like Eurasian watermilfoil (an exotic to
Minnesota lakes) can be separated from other submerged
plants that tend to have less dense growing characteristics.
Ozesmi and Bauer (2002), in their review of the methods
and results of satellite remote sensing of wetlands, primarily
with Landsat and SPOT data, found that accurately mapping
wetlands is a challenging task. However, this study indicates
that the use of IKONOS and QuickBird imagery for aquatic
plant surveys is promising. Stratification and unsupervised
classification of pan-sharpened multispectral high-resolution
imagery provided a map identifying different aquatic veg-
etation groups throughout a large type-4 wetland and three
lakes. The high spatial resolution of the imagery enables the
assessment of aquatic vegetation variation within lakes and
wetlands that cannot be obtained from Landsat data and the
multispectral data enable classification beyond what is
commonly done with aerial photography. Future work will
include object-based approaches to classification.
6. Conclusions
Through our experiences with these three projects, we
have identified a number of considerations for applications
development using high resolution satellite imagery. First,
we have had the most success applying high-resolution
imagery to local or city scale analyses. When imagery is
acquired over large geographic areas, scene differences can

K. Sawaya et al. / Remote Sensing of Environment 88 (2003) 144–156 155
and do exist due to different acquisition dates, view angles,
sun angles, and atmospheric conditions. Because of this
reality, we believe that this form of satellite data is best
suited to analyses of relatively small geographic areas (i.e.,
single images), or potentially north–south oriented areas
that could fall along a single path. In addition, the cost of
high-resolution imagery may be prohibitively expensive for
large area assessments, but it is likely affordable for many
cities since the imagery cost can be shared between depart-
ments and used for several applications.
It has become clear that point data is often insufficient
field reference to calibrate high-resolution imagery. Due to
differences in GPS coordinates and rectification accuracy,
assigning a single field reference point to a pixel is difficult.
However, improved global positioning technology has been
a timely and valuable asset in the acquisition of field
reference data for use with high-resolution imagery. It is
now possible using field computers with GPS capability and
GIS and image processing software, to take high-resolution
satellite imagery into the field and capture points and
polygon reference areas directly correlated with the imagery.
High levels of precision for both the GPS and the imagery
are imperative for this work. The clarity of the imagery also
provides for more visual interpretation than has been previ-
ously possible, allowing the analyst greater certainty in
some field referencing.
While the spatial detail of high-resolution imagery is
impressive, the problem of spectral-radiometric similarity
between certain classes is, if anything, compounded. Mixed
pixels are still present and the variability within classes may
be greater. We have identified a number of incidences of
spectral confusion along the range of digital number values
as a result of these three applications. Dark feature con-
fusions include open water, asphalt and shadows, mid-range
confusions include wetlands, shadows and forest damage
and bright feature confusions include concrete, bare fields
and recreational fields.
The presence of shadows that are readily resolved has
been a problem in virtually every application. Shadowed
portions of lakes in clarity assessments can lead to unnat-
urally clear lake estimations. Shadows from tall buildings in
an impervious surface analysis can skew estimates to greater
amounts of imperviousness than actually exist. The high
radiometric resolution of the data may provide a means to
extract information from areas that would otherwise be
obscured by shadows, but we have not yet had an oppor-
tunity to investigate this possibility. In some cases it may be
possible to obtain imagery at dates close to the summer
solstice to minimize shadows.
One of the challenges of accuracy assessment of high-
resolution classification is to match the resolution of the
reference data and the classification. As suggested above,
this can be especially challenging at the pixel level and is
one of the reasons we are interested in the use of segmen-
tation and object-based classification approaches. Reference
data that might be appropriate for evaluating moderate
resolution classifications (e.g., Landsat TM, ETM+) may
be inadequate for high-resolution imagery when individual
features within a class are being resolved.
Similar spectral relationships exist between Landsat TM
and high-resolution IKONOS and QuickBird data for appli-
cations involving continuous variables such as lake water
clarity and impervious surface area. This is a great benefit to
the development of high-resolution satellite applications as
it can build on past research. This similarity also allows an
analyst to create and apply a modeled relationship from a
similar date of Landsat data and field data surrounding or
just outside of the IKONOS or QuickBird image itself. This
ability opens new possibilities for resource assessments at
different scales and for places where it is difficult to gather
field data.
In addition to the considerations and limitations previ-
ously mentioned, we believe that applications utilizing high-
resolution satellite imagery have several advantages over
other mapping methods. While traditional methods of land
cover mapping can produce high-resolution maps, their
production is expensive and time consuming. The high-
resolution imagery classification methods provide uniform
results over a local scale at high resolution with minimal
time and effort. By mapping variables, such as lake clarity
and impervious surface area, as continuous variables, the
high-resolution satellite imagery approach provides a highly
customizable set of classes. In addition, new software
options can easily make the conversion between raster and
vector formats. High-resolution satellite imagery is GIS-
ready for additional analysis. We are also encouraged by the
potential for repeat image acquisition and processing, mak-
ing change detection possible for all three of these applica-
tions. These advantages make a high-resolution satellite
imagery-based approach to mapping and monitoring natural
resources affordable, time efficient, repeatable, and reliable.
In addition, several characteristics of satellite acquired high-
resolution data, including similarity in many aspects to
aerial photography with the added advantages of digital
format, multitemporal sequences, and multispectral imagery,
should make it attractive to natural resource managers.
The initial U.S. high-resolution commercial observation
satellites are now providing a steady source of high-resolu-
tion panchromatic and multispectral imagery data for a
broad range of commercial and government customers.
Resource managers are developing interest in utilizing
high-resolution satellite imagery to aid in their management
activities. The City of Eagan, the site of our lake water
clarity and impervious surface area research, is one example
of a promising, early participant. Obviously not every local
government unit will have the capabilities to process its own
satellite imagery, but these products will no doubt provide
impetus for commercial data distributors or value-added
companies to supply the environmental information services
such as these and others for local scale mapping and
monitoring. With increasing availability of high-resolution
satellite imagery, these approaches are feasible for local land

K. Sawaya et al. / Remote Sensing of Environment 88 (2003) 144–156156
and water resource managers who need detailed and accu-
rate monitoring information.
Acknowledgements
We gratefully acknowledge the support of the NASA
Science Data Purchase for providing IKONOS images, the
Upper Great Lakes Regional Earth Science Applications
Center (NASA grant NAG-13-99002), and the University of
Minnesota Agricultural Experiment Station. We also
appreciate the interest and cooperation of the City of Eagan,
Metropolitan Council, Minnesota Pollution Control Agency
and Minnesota Department of Natural Resources. Melanie
Tyler and John D. Madsen, Biological Sciences Department,
Minnesota State University, Mankato, provided the aquatic
vegetation survey field data. We also thank the reviewers
whose comments helped us improve this paper. Finally, we
thank Sarah Finley for her help in compiling and editing this
manuscript.
References
Barbier, E. B., Burgess, J. C., & Folke, C. (1994). Paradise lost? The
ecological economics of biodiversity. London: Earthscan Publications,
267 pp.
Barnes, K. B., Morgan, J. M., & Roberge, M. C. (2000). Impervious
surfaces and the quality of natural and built environments. Baltimore,
MD: Department of Geography and Environmental Planning, Towson
University.
Bauer, M. E., Doyle, J. K., & Heinert, N. J. (2002). Impervious surface
mapping using satellite remote sensing. Proceedings, IEEE Geoscience
and Remote Sensing Symposium, Toronto, Canada, June 24–28, Un-
paginated CD ROM, 3 pp.
Carlson, R. E. (1977). A trophic state index for lakes. Limnology and
Oceanography, 22, 361–369.
Civco, D. L., & Hurd, J. D. (1997). Impervious surface mapping for the
state of Connecticut. Proceedings, 1997 ASPRS/ACSM Annual Conven-
tion. Seattle, WA, April 7–10 ( pp. 124–135).
Daily, G. C. (Ed.). (1997). Nature’s services: Societal dependence on nat-
ural ecosystems. Washington, DC: Island Press, 392 pp.
Estes, M. G., Gorsevski, V., Russel, C., Quattrochi, D., & Luvall, J. (1999).
The urban heat island phenomenon and potential mitigation strategies.
Proceedings, 1999 National Planning Conference: Approaching the
Millennium, Seattle, WA.
Kloiber, S. M., Brezonik, P. L., & Bauer, M. E. (2002). Application of
Landsat imagery to regional-scale assessments of lake clarity. Water
Research, 36, 4330–4340.
Kloiber, S. M., Brezonik, P. L., Olmanson, L. G., & Bauer, M. E. (2002). A
procedure for regional lake water clarity assessment using Landsat
multispectral data. Remote Sensing of Environment, 82(1), 38–47.
Lillesand, T., Chipman, J., Nagel, D., Reese, H., Bobo, M., & Goldman, R.
(1998). Upper Midwest gap analysis program image processing proto-
col. Report prepared for the U.S. Geological Survey, Environmental
Management Technical Center, Onalaska, Wisconsin, EMTC 98-
G001. 25 pp.+Appendixes A–C.
Lillesand, T. M., Johnson, W. L., Deuell, R. L., Lindstrom, O. M., &
Meisner, D. E. (1983). Use of Landsat data to predict the trophic state
of Minnesota lakes. Photogrammetric Engineering and Remote Sens-
ing, 49, 219–229.
Mitsch, W. J., & Gosselink, J. G. (1993). Wetlands (2nd ed.). New York:
Van Nostrand Reinhold, 722 pp.
Olmanson, L. G. (1997). Satellite remote sensing of the trophic state con-
ditions of the lakes in the Twin Cities Metropolitan Area. M.S. Paper,
Water Resources Science, University of Minnesota, St. Paul, MN. 28 pp.
Olmanson, L. G., Bauer, M. E., & Brezonik, P. L. (2002). Water quality
monitoring of 10,000 Minnesota Lakes: statewide classification of lake
water clarity using Landsat imagery. Proceedings, 15th William T. Pe-
cora Memorial Remote Sensing Symposium. November 8–15, Denver,
Colorado, unpaginated CD ROM, 5 pp.
Ozesmi, S. L., & Bauer, M. E. (2002). Satellite remote sensing of wetlands.
Wetlands Ecology and Management, 10(5), 381–402.
Ridd, M. K. (1995). Exploring a V-I-S (vegetation-impervious surface-soil)
model for urban ecosystem analysis through remote sensing: compara-
tive anatomy for cities. International Journal of Remote Sensing,
16(12), 2165–2185.
Sleavin, W. J., Civco, D. L., Prisloe, S., & Giannattti, L. (2000). Measuring
impervious surfaces for non-point source pollution modeling. Proceed-
ings, 2000 ASPRS Annual Conference. May 22–26, Washington, DC,
11 pp.


![Remote Sensing Time Series for Modeling Invasive Species ... Sensing...tamarisk distribution on small scales often using high spatial resolution [Ge et al. 2006] or hyperspectral data](https://img.pdfslide.us/doc/110x75/5ff95f17c0053c722927d77d/remote-sensing-time-series-for-modeling-invasive-species-sensing-tamarisk.jpg)


![HANGING SCALES/CRANE SCALES - Aviga HFO 159 page 166 1020,-from € Hanging scales/Crane scales Lisa Mayer Product specialist Hanging scales/Crane scales Tel. +49 [0] 7433 9933 - 219](https://img.pdfslide.us/doc/110x75/5afd22507f8b9a68498c727e/hanging-scalescrane-scales-hfo-159-page-166-1020-from-hanging-scalescrane.jpg)