Embed Size (px)
Citation preview
EXTENDED METHODS
Plasmids
HA-Sin1-N (aa 1-137), HA-Sin1-CRIM (aa 138-266) and HA-Sin1-RBD (aa 267-376) were constructed by
cloning the corresponding cDNAs into pSuper-HA-cDNA3 vector via BamHI/BglII and EcoRI sites.
HA-Sin1-PH (aa 377-522) or CMV-GST-Sin1-PH was constructed by cloning the corresponding cDNAs
into pSuper-HA-cDNA3, pGEX-4T-1 or pCMV-GST vector via BamHI/BglII and XhoI/SalI sites.
HA-mTOR-KD and Flag-mTOR-KD (aa 2180-2431) were constructed by cloning the corresponding
cDNAs into pcDNA3-HA or pcDNA3-Flag vector via BamHI and EcoRI sites. pCMV-GST-mTOR
fragments were constructed by cloning the corresponding cDNAs into pCMV-GST vector through BamHI
and XhoI sites, except mTOR-HEAT was cloned using SalI and NotI sites. The chimeric
pcDNA3-HA-Sin1-PH-Akt1-WT was constructed by ligating Sin1-PH PCR products into the
pcDNA3-HA-Akt1-ΔPH construct through BamHI/BglII and EcoRI sites. pGEX-4T-1-Sin1-N, CRIM,
RBD and PH constructs are as described previously (1). pGEX-4T-1-PLCδ-PH was constructed by
subcloning BamHI/EcoRI digested PLCδ-PH PCR products into pGEX-4T-1 vector. pCMV-GST-RPL26
was constructed by cloning BamHI/SalI cut RPL26 PCR products into pCMV-GST vector. Various Sin1
mutants were generated using the QuikChange XL Site-Directed Mutagenesis Kit (Stratagene) according to
the manufacturer’s instructions. shSin1-resistant mutants were generated with specific primer sequences
listed below to generate the silent mutations :
5’-CGCAAATTGACATAGCCACCGTGCAAGATATGCAAGATATGCTTAGCAGCC-3’ (sense) and
5’-GGCTGCTAAGCATATCTTGCACGGTGGCTATGTCAATTTGCG-3’ (antisense). The CAAX
versions of Sin1 constructs were generated by the following PCR primers: forward
(5’-GCATAGATCTCGATCTGAGAACTTCAGG-3’) and reverse (5’-GCATGAATTCTTACATAAT
TACACACTTTGTCTTTGACTTCTTTTTCTTCTTTTTGCCGCCCTGCTGCCCGGATTTCTTC-3’.

2
Details of plasmid constructions will be provided upon request.
shRNAs
shRNA vectors to deplete endogenous human PIKFYVE were purchased from GE Dharmacon
(RHS4533-EG200576). shRNA vectors to deplete endogenous human PIK3CA were also purchased from
GE Dharmacon (RHS4533-EG5290). To generate the lenti-viral shRNA construct against human Sin1, the
following sequences were cloned into the pLKO-hygro-lenti-viral vectors (sense:
5’-GCCACAGTACAGGATATGCTT-3’; anti-sense: 5’-AAGCATATCCTGTACTGTGGC-3’).
Cell Fractionation
Cell fractionation was performed using the fractionation kit purchased from Cell Signaling Technology
(9018) according to manufacture’s instructions.
The MST Analysis
The determination of the binding affinity between GST-Akt1-PH (aa 1-107) or GST-Sin1-PH (aa 1-137)
and IP4 was performed by MST according to manufacturer’s instructions with 60% LED power and 40%
MST power (Nano Temper, Monolith NT.115). Fluorescently labeled GST-Akt1-PH proteins or
GST-Sin1-PH proteins were used as tracer. The final concentrations of peptides ranged from 122 nM to
2 mM.
Colony Formation Assays
Cells were seeded in 6-well plates (300 or 600 cells/well) and left for 8-12 days until formation of visible

3
colonies. Colonies were washed with PBS and fixed with 10% acetic acid/10% methanol for 20 min, then
stained with 0.4% crystal violet/20% ethanol for 20 min. After staining, the plates were washed with
distilled water and air-dried.
Cell Viability Assays
Cells were plated at 3,000 per well in 96-well plates, and incubated with complete DMEM medium
containing different concentrations of etoposide (Sigma, E1383), cisplatin (Selleck S1166), doxorubicin
(Sigma, D1515) or Taxol (Sigma T7191) for 24 or 48 hr as indicated. Assays were performed with
CellTiter-Glo Luminescent Cell Viability Assay Kit according to the manufacturer’s instructions
(Promega).
Soft Agar Assays
The anchorage independence cell growth assays were performed as described previously (2). Briefly, the
assays were preformed using 6-well plates and the solid medium consists of two layers. The bottom layer
contains 0.8% noble agar and the top layer contains 0.4% agar. 1x10⁵ cells were plated in the top layer. 500
µL complete DMEM medium was added every 3 days to keep the top layer moistured and 4 weeks later the
cells were stained with iodonitrotetrazolium chloride for colony visualization and counting. Three
independent experiments were performed to generate the error bar.

4
SUPPLEMENTAL REFERENCES 1. Liu P, Gan W, Inuzuka H, Lazorchak AS, Gao D, Arojo O, et al. Sin1 phosphorylation impairs
mTORC2 complex integrity and inhibits downstream Akt signalling to suppress tumorigenesis. Nat Cell Biol. 2013;15:1340-50.
2. Liu P, Begley M, Michowski W, Inuzuka H, Ginzberg M, Gao D, et al. Cell-cycle-regulated activation of Akt kinase by phosphorylation at its carboxyl terminus. Nature. 2014;508:541-5.

5
A
mTOR!
1! 1380! 2549!
HEAT (23)!
2000!
FAT/TRD! KD!
2001! 2114! 2549!
FRB!
2518!
FATC!
2258! 2298!
LBE!N! C!
KD-L!(kinase domain-long)!
2001! 2114!
FRB!FRB!
2114! 2518!2258! 2298!
LBE!N! C!N-FATC!
2549!
FATC!
2114! 2258! 2298!
LBE!N! C!
KD (kinase domain)!
2518!
2114! 2258! 2298!
LBE!N!N-LBE!
2298!
C!
2518!
C!
2258! 2298!
LBE!LBE!
2180! 2431!
FRB+KD-L!
2258! 2298!
LBE!
IB: GST!
IB: GST!
EV!
Sin
1!R
icto
r!R
apto
r!GβL!
HA!
IB: HA!
IB: HA!
GS
T p
ull
do
wn!
WC
L!
CMV-GST-mTOR-C!D
1! 137! 266! 279! 353! 376! 486! 522!
CRIM! RBD! PH!
MEKK2!JNK!
Ras!
N!
mSin1.1!B C E
F! G
H
IB: GST!
IB: GST!
IP:
HA!
WC
L!
IB: HA!
IB: HA!
EV!
FR
B!
N-F
AT
C!
+! +! +!
CMV-GST-mTOR!HA-Sin1-PH!
Figure S1, related to Figure 1!
IB: GST!
IB: GST!
EV!
Sin
1!R
icto
r!
Rap
tor!
GβL!
HA-constructs!
IB: HA!
IB: HA!
IP:
HA!
WC
L!
CMV-GST-mTOR-KD-L!
EV!
IB: GST!
IB: GST!
IB: HA!
IB: HA!E
V!
HE
AT!
FAT!
KD
L!
CMV-GST-mTOR!
HA-Sin1-PH!
IP:
HA!
WC
L!
J!
GST-Sin1-N!
GST!
γ32P-Akt!
GST-Akt1-tail!
mTOR!
GST-Sin1-N!
-! +! -! +! +! +!GST!
GST-Akt1-tail (409-480)!
I!OVCAR5!
HA-Sin1-PH!
0 2 4!IB: Akt-pS473!
HA-Sin1-N!
0 1 2 4!
IB: Akt-pT308!
IB: Akt1!
IB: HA!
PC3!
0 1 2 4!
IB: Akt-pS473!
IB: Akt-pT308!
HA-Sin1-N!
0 1 2 4!
IB: Akt1!
IB: HA!
HA-Sin1-PH!
IB: Akt-pS473!
N! CRIM! RBD! PH!HA-Sin1!
IB: Akt-pT308!
IB: Akt1!
IB: HA!
293T!
IB: pS6!
IB: S6!
IB: Tubulin!
IB: Akt-pS473!
IB: S6K-pT389!
IB: Akt-pT308!
IB: S6K1!
IB: Akt-total!
IB: HA!
IB: Tubulin!
HA-Sin1!WT! ΔPH!
U2OS!
IB: Akt-pS473!
IB: S6K-pT389!
IB: Akt-pT308!
IB: S6K!
IB: Akt-total!
IB: HA!
IB: Tubulin!
HA-Sin1!WT! ΔPH!
SK-MEL-28!
IB: Akt-pS473!
IB: S6K-pT389!
IB: Akt-pT308!
IB: S6K1!
IB: Akt-total!
IB: HA!
IB: Tubulin!
HA-Sin1!WT! ΔPH!
PC3!
IB: Akt-pS473�
IB: Akt-pT308�
HA-Sin1-PH�
293T�
IB: Akt1�
IB: HA�
IB: Tubulin�
IB: S6K-pT389�
IB: S6K1�
IB: Akt-pS473�
IB: Akt-pT308�
IB: Akt1�
IB: HA�
IB: Tubulin�
HA-Sin1-PH�
OVCAR5�
IB: PKC-pS657�
IB: S6K-pT389�
IB: S6K1�
IB: NDRG-pT346�
IB: Akt-pS473�
293�
N� ΔN�HA-Sin1�
IB: Akt-pT308�
IB: Akt1�
IB: S6K-pT389�
IB: S6K�
IB: Tubulin�
IB: HA�
IB: Akt-pS473�
231�
N� ΔN�HA-Sin1�
IB: Akt-pT308�
IB: Akt1�
IB: S6K-pT389�
IB: S6K�
IB: Tubulin�
IB: HA�
IB: GST!
IB: HA!
EV!
N-F
AT
C!
KD
-L!
KD
-L!
C!
LB
E!
IP:
HA!
WC
L!
IB: HA!
IB: GST!
+! +! +! +! +! +!
CMV-GST-mTOR!HA-Sin1-PH!
IP:
HA!
WC
L!
IB: GST!
IB: HA!
IB: GST!
IB: HA!
+! +! +! HA-Sin1-PH!
EV!
KD
-L!
KD!
CMV-GST-mTOR!
IB: Flag!
IB: HA!
IB: Flag!
EV!
WT!
ΔP
H!
+! +! +! Flag-mTOR!HA-Sin1!
IP:
HA!
WC
L!
IB: HA!
IP:
Fla
g!W
CL!
EV!
WT!
ΔP
H!
+! +! +! Flag-mTOR-KD!HA-Sin1!
IB: HA!
IB: Flag!
IB: HA!
IB: Flag!
V W
IB: Flag!
IB: Flag!
IB: HA-Sin1-PH!
IB: HA-Rictor!
IB: HA-Sin1-PH!
IB: HA-RIctor!
IP:
Fla
g!
WC
L!
HA-Sin1-PH!+! +! +! +! HA-Rictor!+! +! +! +! Flag-mTOR!
X
KD! PH!PH!
GßL!
Rictor!Sin1!
mTOR!
T! US
Figure S1, related to Figure 1!
R
EV!
N-F
AT
C!
KD
-L!
N-L
BE!
IB: GST!
IB: GST!
IB: HA!
IB: HA!
IP:
HA!
WC
L!
+! +! +! +!
CMV-GST-mTOR!HA-Sin1-PH!
J! K
L! M N O P Q
IB: HA�
IB: Flag�
IB: Flag�
IB: HA�
IP:
HA!
WC
L!
EV�
N�
CR
IM�
RB
D�
PH�
WT�
ΔP
H�
ΔN�
HA-Sin1�+! +! +! +! +! +! +!+! Flag-mTOR�
Y

6
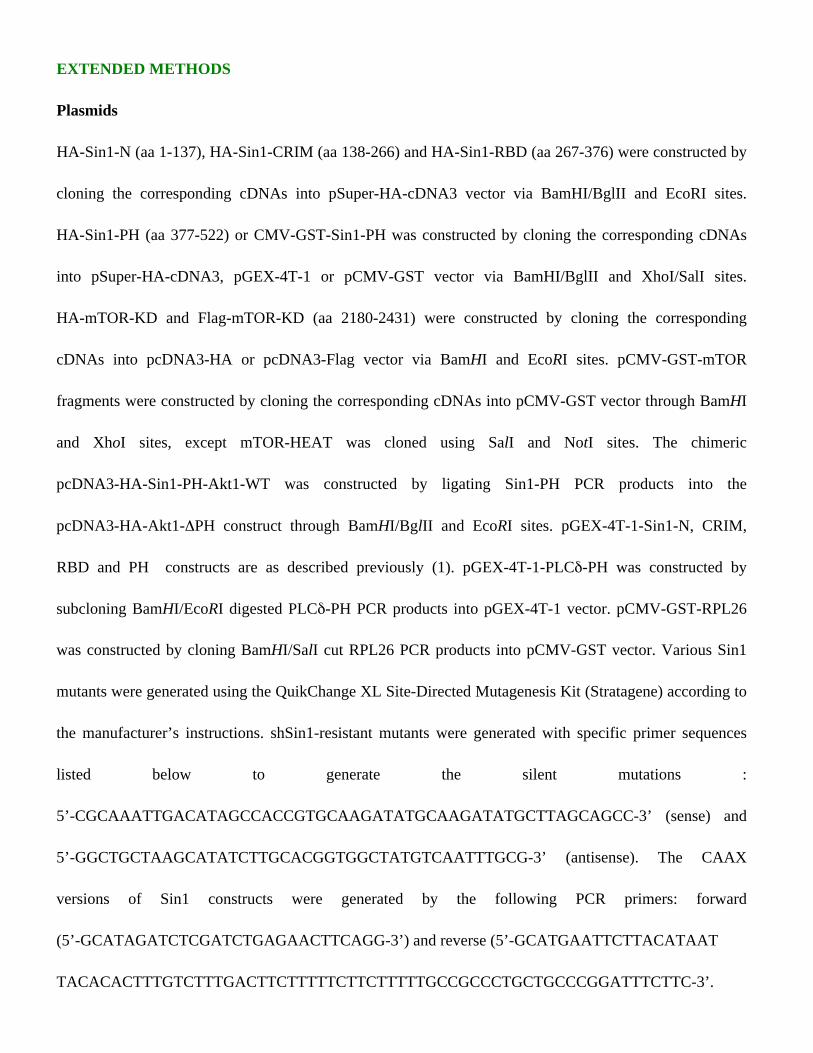
Figure S1. The Sin1-PH domain binds the mTOR kinase domain to inhibit mTOR kinase activity, Related to Figure 1. A, A schematic illustration of the mTOR truncations used in this study. B, The kinase domain (KD-L, aa 2115-2518) of the mTOR kinase mainly interacts with Sin1 and GβL.
Immunoblot (IB) analysis of whole cell lysates (WCLs) and HA-immunoprecipitates (IP) derived from HEK293T cells transfected with CMV-GST-mTOR-KD-L and indicated HA tagged mTORC2 subunits.
C, The C-loop (aa 2298-2518) of the mTOR kinase domain (KD) mainly interacts with Sin1, but not other mTORC2 components. IB analysis of whole cell lysates (WCLs) and GST pull downs derived from HEK293T cells transfected with CMV-GST-mTOR-C and indicated HA tagged mTORC2 subunits.
D, A schematic illustration of Sin1 interaction domains with indicated enzymes. E, In vitro kinase assays to demonstrate that addition of increasing doses of bacterially purified
GST-Sin1-N proteins did not significantly interfere with active mTOR to phosphorylation Akt in vitro. F-G, Sin1-PH motif, but not Sin1-N terminus, suppresses mTORC2 to phosphorylate Akt-S473 in cells. IB
analysis of WCLs derived from PC3 (F) or OVCAR5 (G) cells transfected with increasing doses of HA-Sin1-PH.
H-I, Expression of Sin1-PH leads to reduced mTORC2, but not mTORC1 activity in cells. IB analysis of WCLs derived from OVCAR5 (H) or 293T (I) cells transfected with increasing doses of HA-Sin1-PH construct.
J, Expression of Sin1-PH, but not other domains of Sin1 leads to reduced Akt-pS473 in cells. IB analysis of WCLs derived from 293T cells transfected with increasing doses of HA-Sin1 constructs.
K-M, Expression of full-length Sin1, but not PH domain truncated Sin1 leads to reduced mTORC2, but not mTORC1 activity in cells. IB analysis of WCLs derived from U2OS (K), SK-MEL-28 (L) or PC3 (M) cells transfected with increasing doses of HA-Sin1 constructs.
N-O, Expression of N-terminus truncated Sin1, but not N-terminus itself leads to reduced Akt-pS473, but not mTORC1 activity in cells. IB analysis of WCLs derived from HEK293 (N) or MDA-MB-231 (O) cells transfected with increasing doses of HA-Sin1 constructs.
P, Sin1-PH interacts with mTOR kinase domain (mTOR-KDL), but not the mTOR-HEAT or FAT domain in cells. IB analysis of WCLs and HA-IPs derived from HEK293T cells transfected with indicated constructs.
Q, Sin1-PH interacts with mTOR-N-FATC, but not mTOR-FRB domain in cells. IB analysis of WCLs and HA-IPs derived from HEK293T cells transfected with indicated constructs.
R, The C-loop of the mTOR catalytic region is critical for mTOR interaction with Sin1-PH. IB analysis of WCLs and HA-IPs derived from HEK293T cells transfected with indicated constructs.
S, mTOR-C-loop but not mTOR-LBE domain binds Sin1-PH in cells. IB analysis of WCLs and HA-IPs derived from HEK293T cells transfected with indicated constructs.
T, mTOR-KD-L and mTOR-KD have similar affinity towards binding Sin1-PH in cells. IB analysis of WCLs and HA-IPs derived from HEK293T cells transfected with indicated constructs.
U, The mTOR kinase domain mainly interacts with Sin1-PH motif. IB analysis of WCLs and Flag-IPs derived from HEK293T cells transfected with GST-mTOR-KD-L and indicated HA-Sin1 constructs.
V, Full-length mTOR interacts with Sin1 through motifs including, but not restricted to, the Sin1-PH motif. IB analysis of WCLs and HA-IPs derived from HEK293T cells transfected with Flag-mTOR and indicated HA-Sin1 constructs.

7
W, Sin1-PH motif does not interfere with Rictor and mTOR interaction. IB analysis of WCLs and Flag-IPs derived from HEK293T cells transfected with indicated constructs.
X, Various Sin1 truncation mutants remain contacts with full-length mTOR. IB analysis of WCLs and HA-IPs derived from HEK293T cells transfected with indicated Sin1 constructs with Flag-mTOR.
Y, A schematic illustration of how Sin1-PH motif blocks Sin1 interaction with mTOR-KD.

8
Figure S2. The PH domain is a unique and physiological functional PH domain, Related to Figure 2. A-B, Only Sin1-PH, but not Akt1-PH, nor PDK1-PH, suppresses mTORC2 to phosphorylate Akt-S473 in
cells. IB analysis of WCLs derived from HEK293T cells transfected with indicated HA-Sin1-PH/HA-Akt1-PH (A) or GST-Sin1-PH/GST-PDK1-PH (B) constructs.
C, Deletion of the PH domain of Akt1 leads to attenuated Akt phosphorylation in cells. IB analysis of WCLs or HA-IPs derived from 293 cells transfected with indicated HA-Akt1 constructs.
IB: Akt-pS473!
CMV-GST-Sin1-PH!
CMV-GST-PDK1-PH!
IB: Akt1!
IB: GST! IP:
HA!
WC
L!
0! 5! 10!
15!
30!
60!
IB: Akt-pT308!
WT!
IB: Akt-pS473!
IB: HA-Akt1!
IB: HA-Akt1!
IB: Vinculin!
HA-Akt1!ΔPH!
Insulin (min)!0! 5! 10!
15!
30!
60!
Figure S2, related to Figure 2!
A B C
IB: Akt-pT308�
IB: Akt-pS473�
IB: Akt1�
IB: HA-Akt1-PH�
IB: GST-PDK1-PH�
IB: Tubulin�
HA-Akt1-PH� GST-PDK1-PH�

9
F!G!
LED: 60% MST Power: 40%! Fit Kd !F
no
rm [
1/10
00]!
Concentration!
Data Analysis Thermophoresis + T-Jump!
500!510!
520!
530!540!
550!560!
10-1!10-2! 100! 101! 102! 103!
Kd=20.6+3.27!
GST-Sin1-PH and IP4!
Kd=48.2+8.27!
103!
LED: 60% MST Power: 40%! Fit Kd !
Fn
orm
[1/
1000
]!
Concentration!
Data Analysis Thermophoresis + T-Jump!
730!732!734!736!738!740!742!
10-1!10-2! 100! 101! 102!
GST-Akt1-PH and IP4!
Kd=20.6+3.27!
IB: Akt-pS473!
0! 15!
30!
45!
15!
30!
45!
15!
30!
45!
IB: Akt-pT308!
IB: Akt1!
DMSO! LY! YM!
insulin (min)!
IB: p-FOXO!
IB: FOXO!
IB: Tubulin!
Med
ium!
DM
SO!
Sta
rved!
LY!
pp
242!
AK
TV
III!
S6K
1-I!
IB: Akt-pS473!
IB: Akt-pT308!
IB: HA-Akt1!
IB: HA-Akt1!
IB: S6K-pT389!
IB: Tubulin!
IP:
HA!
WC
L!
A B C
GF
P!
#2!
#4!
PIK3CA!
IB: Akt-pS473!
shRNA!
IB: Akt-pT308!
IB: Akt1!
IB: p-FOXO!
IB: FOXO!
IB: Tubulin!
IB: PIK3CA!
IB: Akt-pT450!
IB: Akt-pS473!
shRNA!
PIKFYVE!
IB: Akt-pT308!
IB: Akt1!
IB: p-FOXO!
IB: FOXO!
IB: Tubulin!
IB: PIKFYVE!
GF
P!
H2!
H4!
H5!
D
E
Figure S3, related to Figure 3!
shGFP+ insulin!
shPIK3CA2+ insulin!
shPIKFYVE + insulin!
GFP-SIn1-PH! DAPI! Merged!
H
IB: Sin1!
IB: Rictor!
IB: Akt-pS473!
IB: Akt1!
IB: Tubulin!
Sin1 MEFs!+/+ -/- +/+ -/- +/+ -/-!
�
WCL! Ctrl! PIP3!
pull down!
IB: Akt-pS473!
IB: GST-Akt1-tail!
ctrl!
PI(
3,5)
P2!
PI(
3,4,
5)P
3!
ctrl!
PI(
3,5)
P2!
PI(
3,4,
5)P
3!
PIP beads pull down!
EV! HA-Sin1!I!
beads!
J!
IB: Akt-pS473!
DM
SO!
Tori
n1!
pp
242!
rap
amyc
in!
Crt
l !P
IP3!
Crt
l !
Sin1-/-!
Sin1+/+!
IB: GST-Akt1-tail!
PIP3 beads pull down!
GS
T-A
kt1-
tail
on
ly! Rictor! DAPI! Merged!
Sin1+/+!
Sin1-/-!
Sin1+/+ +BKM!
Rictor-/-!Rictor+/+!
Ric
tor
(CS
T)!
K
L!

10
Figure S3. PI(3,4,5)P3 binds the Sin1-PH motif to activate mTORC2, Related to Figure 3.
A, Inhibition of PI3K, but not PIKFYVE, leads to reduced Akt-pS473 in cells. Immunoblot (IB) analysis of whole cell lysates (WCLs) derived from HeLa cells with indicated treatments. Where indicated, HeLa cells were serum starved for 24 h, treated with indicated inhibitors for 1 h (LY2940002: 1 µM and YM201636: 500 nM) and stimulated with 100 nM insulin at the indicated time periods before harvest for IB analysis.
B, IB analysis and HA-IPs of WCLs derived from Sin1-/- MEFs transfected with HA-Akt1 and indicated treatments. Where indicated, cells were serum starved for 24 h, treated with indicated inhibitors for 1 h (LY2940002: 10 µM, pp242: 1 µM, AktVIII: 10 µM and S6K1-I: 10 µM) and stimulated with 100 nM insulin at the indicated time periods before harvest for IB analysis.
C-D, Depletion of endogenous PIK3CA (C), but not endogenous PIKFYVE (D), leads to reduced Akt-pS473 in cells. IB of WCLs derived from HeLa cells infected with shPIK3CA (C) or shPIKFYVE (D) lenti-viruses. 72 hrs post-puromycin selection (1 µg/ml), cells were harvested for IB analysis.
E-F, MicroScale Thermophoresis (MST) analysis determined the Kd of GST-Akt1-PH (aa 1-107) (E) interaction with IP4 in vitro to be 20.6 µM. The Kd value of the interaction between GST-Sin1-PH (aa 1-137) (F) was determined to be 48.2 µM in vitro.
G, PIP3 beads pull down Rictor mainly through Sin1. IB analysis of WCLs and Ctrl or PIP3 beads pull downs in RIPA buffer with 1% TritonX-100 in Sin1+/+ or Sin1-/- MEFs.
H-I, PIP3 beads pull down active mTORC2 complex in CHAPS buffer conditions. In vitro kinase assays indicating that PIP3 beads pull-down mTORC2 complexes are active in phosphorylating Akt-S473. Where indicated, Torin (1 µM), pp242 (1 µM) and rapamycin (20 nM) were added to cell culture medium for 4 hrs before harvesting cells for PIP3 pull-down.
J, Representative confocal images illustrating that depletion of PI3KCA, but not PIKFYVE, leads to attenuated Sin1-PH plasma membrane proximity localization.
K, Representative immuno-florescent images to illustrate endogenous Rictor could be in part enriched on the plasma membrane upon insulin stimulation in Sin1+/+, but not Sin1-/- MEFs, nor Sin1+/+ MEFs treated with PIK3CA inhibitor BKM120. Cells were serum starved for 24 hr before adding insulin (100 nM) for 15 min. Where indicated, BKM120 (100 nM) were added in cells for 2 hr before insulin stimulation.
L, Representative immuno-florescent images to illustrate that the Rictor antibody used in (K) mainly detects specific Rictor-derived signals in Rictor+/+, but not Rictor-/- MEFs.

11
Figure S4. The presence of PIP3 species leads to attenuated Sin1-PH domain interaction with mTOR-KD, Related to Figure 4. A, EGF stimulation attenuates the Sin1-PH interaction with mTOR-KD. Immunoblot (IB) analysis of
whole cell lysates (WCLs) and HA-immunoprecipitates (IP)s derived from 293 cells transfected with indicated constructs. Where indicated, cells were serum starved for 24 hrs and stimulated by 100 ng/ml EGF for the indicated time periods before harvesting.
B, PTEN loss leads to a reduced Sin1-PH domain interaction with mTOR-KD. IB analysis of GST-pulldowns and WCLs derived from HCT116 cells with indicated PTEN status transfected with indicated constructs.
Figure S4, related to Figure4!
WC
L! IB: Flag!
IB: HA!
0 8 16 24 32!
IB: HA!
EGF (min)!
+! +! +! +! +!+! +! +! +! +!
HA-Sin1-PH!Flag-mTOR-KD!
IB: Flag!IP:
Fla
g!
GS
T-p
ulld
ow
n!
IB: GST!
WC
L!
IB: GST!
IB: HA!
IB: HA!
IB:PTEN!
-! +! -! +!+! +! +! +! CMV-GST-mTOR-KD-C!
HA-Sin1-PH!
HCT116!
A B

12
A
LED: 60% MST Power: 40%! Fit Kd !
Fn
orm
[1/
1000
]!
Concentration!
Data Analysis Thermophoresis + T-Jump!
500!510!520!530!540!550!560!
10-1! 100! 101! 102! 103!
Kd=365+18.9!
GST-Sin1-CAA-PH and IP4!
+! +! +! +!
IB: Akt-pS473!
IB: Akt-pT308!
IB: Akt1!
IB: HA!
IB: p-FOXO!
insulin!HA-Sin1!
+! +! +!
IB: FOXO3a!
IB: Tubulin!
+! IB: Rictor!
IB: GβL!
IB: mTOR!
IB: HA!
EV!
WT!
R39
3C!
K46
4A!
HA-Sin1!R39
5C!
K42
8A!
IB: Rictor!
IB: GβL!
IP:
HA!
WC
L!
IB: mTOR!
IB: HA!
CA
A!B C
D
0 816 24 32 40 0 816 24 32 40 !IB: Akt-pS473!
EGF (min)!
Akt/Sin1-PH-WT!
Akt/Sin1-PH-CAA!
IB: Akt-pT308!
IB: HA!
IP:
HA!
HA!
F!
G
GFP! DAPI! Merged!
GFP-PLCδ-PH!
GFP-Sin1-PH-WT!
GFP-Sin1-PH-CAA!
GFP-Sin1-PH-CAAX-WT!
GFP-Sin1-PH-CAAX-CAA!
IB: HA!
0 5 0 5 0 5 0 5 0 5 0 5 EGF (min) !
WCL! Mem! Cyto!WT! CAA! WT! CAA! WT! CAA! HA-Sin1!
Fractionation!
IB: Akt-pS473!
IB: Akt1!
IB: Tubulin!
IB: EGFR!
Sin1-/-!
Figure S5, related to Figure 5 !
0!20!40!60!80!
100!120!
0! 1! 2! 5! 10!
Rel
ativ
e vi
abili
ty (
%)!
Doxorubicin (µM)!
WT!CAA!
0!20!40!60!80!
100!120!
0! 5! 10! 20! 40!
Rel
ativ
e vi
abili
ty (
%)!
Cisplatin (µM)!
WT!CAA!
IB: Akt-pS473!IB: Akt-pT308!
EV!
WT!
CA
A!E
V!
WT!
CA
A!
EV!
WT!
CA
A!
DMSO! Dox! Cisplatin!
OVCAR5-shSin1!
MSCV-Sin1-HA!
IB: Akt1!
IB: Vinculin!
J! K! L!
IB: Akt-pS473�
0 10 30 0 10 30�
WT� CAA�
IB: Akt-pT308�
OVCAR5-shSin1�
IB: Tubulin�
IB: Akt1�
IB: Sin1�
insulin (min)�HA-Sin1�
IB: Akt-pS473!
IGF-1 (min)!
Akt/Sin1-PH-WT!
Akt/Sin1-PH-CAA!
IB: Akt-pT308!
IB: HA!
IP:
HA!
HA! 0 816 24 32 40 0 816 24 32 40 !
IB: Akt total!
IB: Akt-pS473!
IB: Akt-pT308!
IB: Tubulin!0! 10!
100!
Sin1+/+! Sin1-/-! WT! CAA!
insulin (nM)!0! 10!
100!
0! 10!
100!
0! 10!
100!
Sin1-/-!
MSCV-Sin1-HA!
IB: Sin1!
IB: p-NDRG1!
IB: HA�
IB: GST�
IB: GST�
WC
L!
IP:
HA!
GS
T p
ulld
ow
n!CMV-GST-RPL26 �
EV�
WT�
CA
A�
WT-
CA
AX�
CA
A-C
AA
X�
IB: HA�
IB: HA�
IB: GST�
HA-Sin1�
H!
I!
M
N
IB: Akt-pS473�
IB: GST-Akt1-tail�
PIP3some�WT� CAA�
HA-Rictor�CMV-GST-GβL�Flag-mTOR�
+! +! +! +! +! +! +! +! +!+!+! +! GST-Akt1-tail�
IB: Flag-Sin1�
IB: HA-Rictor�
IB: GST-GβL�
+! +! +! +! +! +! +! +! +!+!_! _!+! +! +! +! +! +! +! +! +!+!_! _!+! +! +! +! +! +! +! +! +!+!_! _!Flag-Sin1�
E

13
Figure S5. The Sin1-PH motif mainly interacts with PI(3,4,5)P3 through three critical residues including R393, K428 and K464, Related to Figure 5. A, The Sin1-R393A/K428A/K464A mutant is deficient in promoting Akt-S473 phosphorylation in cells.
Immunoblot (IB) analysis of whole cell lysates (WCLs) derived from Sin1-/- MEFs transfected with indicated HA-Sin1 constructs. Where indicated, 24 hr post-transfection, cells were serum starved for 24 hr before adding insulin (100 nM) for 30 min.
B, Sin1-CAA is deficient in activating Akt-S473 phosphorylation in an insulin dose-dependent manner. HAP1-Sin1-/- cells (#002) were infected with MSCV-Sin1-HA-WT or CAA retroviruses and recovered for 24 hr before splited for serum starvation for an additional 24 hr. Subsequently, resulting cells were treated with indicated doses of insulin for 40 min before harvested for IB analysis.
C, All Sin1 mutants examined maintain binding ability to other mTORC2 components. IB analysis of WCLs and HA-IPs derived from HEK293T cells transfected with indicated HA-Sin1 constructs.
D, PIP3polysomes promote Sin1-WT, but not Sin1-CAA containing mTORC2 complex activation in vitro. Indicated mTORC2 component constructs were transfected into Sin1-/- MEFs and inactive mTORC2 complexes were immune-precipitated against HA-Rictor after 48 hr serum starvation. Increasing amounts of PIP3-polysomes were added to the inactive precipitates and incubated for 30 min before other kinase reaction components were added. The kinase reactions were carried out at 30 oC for 1 hr and terminated by addition of SDS sample buffers.
E, RPL26 retains its interaction with Sin1-CAA to a comparable level to Sin1-WT in cells. IB analysis of WCLs and HA-IPs or GST pulldowns derived from HEK293T cells transfected with indicated HA-Sin1 constructs together with GST-PRL26.
F, MicroScale Thermophoresis (MST) analysis determined the Kd of the interaction between GST-Sin1-PH-CAA (aa 1-137) and IP4 was determined to be 365 µM in vitro.
G-H, The Sin1-PH-CAA mutant is deficient in Akt phosphorylation in cells in response to EGF (G) or IGF-1 (H). IB analysis of HA-IPs derived from HeLa cells transfected with indicated chimeric constructs. Where indicated, cells were serum starved for 24 hr before addition of EGF (100 ng/ml) for 10 min or IGF-1 (100 ng/ml) for 30 min.
I, Sin1-WT, but not Sin1-CAA, could be in part enriched on the plasma membrane upon stimulation by EGF (100 ng/ml) for 5 min. Please refer to the method section for detailed cell fractionation protocol.
J, Representative immuno-florescent images to illustrate that GFP-Sin1-PH-WT, but not GFP-Sin1-PH-CAA, is in part enriched on plasma membrane upon stimulation by insulin (100 nM) for 15 min.
K, Sin1-CAA is deficient in activating Akt in cells. IB analysis of WCLs derived from Sin1 depleted OVCAR5 cells stably expressing either MSCV-Sin1-WT-HA or MSCV-Sin1-CAA-HA via retro-viral infections. Where indicated, cells were serum starved for 36 hr before insulin (100 nM) was added for the indicated time periods before cell collection.
L-M, The endogenous Sin1-depleted OVCAR5 cell lines stably expressing either MSCV-Sin1-HA-WT or MSCV-Sin1-HA-CAA were cultured in 10% FBS-containing medium with the indicated concentrations of doxorubicin (L) or cisplatin (M) for 24 hrs before performing the cell viability assays. Data was shown as mean + SD for three independent experiments. No statistical significance was observed between WT and CAA at each drug concentration (Student’s t-test).
N, Doxorubicin or cisplatin treatment leads to elevated Akt phosphorylation in cells. Indicated cells were treated with 5 µM doxorubicin or 20 µM cisplatin for 24 hr and harvested for IB analysis.

14
Figure S6, related to Figure 6!
A C
E F!
H
1! 137! 266!279! 353!376! 486! 522!
CRIM! RBD! PH!
R15
Q!
V30
I!L
31V!
D37
G!
Q55
H!
G59
C!
R81
T!
S84
L! R94
Q!
I101
M!
R14
5C!
P15
6S!
S16
1C!
Y18
0C!
G20
8W!
T21
5C!
S21
6I!
219L!
H23
3Y!
R28
2Q!
F28
9L!
L29
1I!
R31
1Q!
D36
0G!
D41
2G!
S44
9I!
T45
6M!
K50
1E!
G52
0R!
Human Sin1.1!
A20
1T!
L40
2P!
A47
2T!
A45
1E!
R49
4L!
K51
7N!
IB: Akt-pT308!
IB: Akt1!
IB: HA!
IB: Tubulin!
EV!
WT!
D41
2G!
IB: Akt-pS473!
MSCV-Sin1-HA!
OVCAR5-shSin1!
IB: p-FOXO!
IB: FOXO3a!
EV!
WT!
D41
2G!
EV!
WT!
D41
2G!
EV!
WT!
D41
2G!Starved! insulin!
IB: Akt-pS473!
IB: GST-Akt1-tail!
Medium!
0!
20!
40!
60!
80!
100!
120!
0! 1! 2! 5! 10!
Rel
ativ
e vi
abili
ty (
%)!
Doxoubicin (µM) 24hr!
WT!
D412G!
I!
****
0!
20!
40!
60!
80!
100!
120!
0! 5! 10! 15! 20!
Rel
ativ
e vi
abili
ty (
%)!
Etoposide (µM) 48hr!
WT!D412G!
*! *!
0 !20 !40 !60 !80 !
100 !120 !140 !
0! 5! 10! 15! 20!
Rel
ativ
e vi
abili
ty (
%)!
Taxol (µM)!
WT!
D412G! *! *!
EV!
WT!
IB: GST-Sin1-PH!
IB: HA-mTOR-KD!
D41
2G!
L40
2P!
S44
9I!
A45
1E!
T45
6M!
A47
2T!
CA
A!
IB: GST-Sin1-PH!
IB: HA-mTOR-KD!
CMV-GST-Sin1-PH!HA-mTOR-KD!+! +! +! +! +! +! +!+! +!
GS
T-p
ulld
ow
n!
WC
L!
G
WT!
D412G!
KJ!
EV! WT! ΔPH!+! +! +! +!+!_! _! _! _! _! +! +! +!+!_! _! _! _!
IB: HA!
IB: Akt-pS473!
IB: Akt-pT308!
IB: Akt1!
insulin!HA-Sin1!
+! +! +!
IB: HA!
HA-Sin1-PH!CMV-GST-mTOR-KD-L!
IB: GST!
IB: HA!IP:
HA!
PIP3 pulldown!
WC
L! IB: HA!
IB: GST!
B
IB: Akt1!
IB: Akt2!
IB: Tubulin!
IB: Tubulin!
GF
P!
Akt
1!G
FP!
Akt
2!
shRNA!
shRNA!
0!
20!
40!
60!
80!
100!
120!
1! 2! 5! 10! 0!
Rel
ativ
e vi
abili
ty (
%)!
Cisplatin (µM)!
WT!shAkt1!shAkt2!
0!
20!
40!
60!
80!
100!
120!
0! 1! 2! 5! 10!
Rel
ativ
e vi
abili
ty (
%)!
Dox (µM)!
WT!shAkt1!shAkt2!
R T! U
S
*!*!*!*!*! *!*!
shGFP! shAkt1! shAkt2!shGFP! shAkt1! shAkt2! WV
0!
10!
20!
30!
40!
50!
60!
shGFP! shAkt1! shAkt2!
Co
lon
y n
um
ber!
*!*!
0!50!
100!150!200!250!300!350!
shGFP! shAkt1! shAkt2!
*!*!
Co
lon
y n
um
ber!
CAA!G0G1: 55.70 % !G2M: 18.39 % !S-Phase: 25.91 %!
D412G!G0G1: 50.78 % !G2M: 25.84 !S-Phase: 23.39 %!
WT!G0G1: 51.33 % !G2M: 24.89 % !S-Phase: 23.77 %!
X Y
Z!
Figure S6, related to Figure 6!
IB: Akt-pT308�
IB: HA�
IB: Tubulin�
EV�
WT�
D41
2G�
S44
9I�
A45
1E�
T45
6M�
L40
2P�
A47
2T�
Sin1-/-�
HA-Sin1�
IB: Akt-pS473�
IB: Akt1�
+! +! +! +! +! +! +!+! IGF-1�
IB: Akt-pT308�
IB: Akt1�
0 10 20 30 40 60 0 10 20 30 40 60� insulin (min)�
WT� S449I�
IB: Akt-pS473�
IB: Tubulin�
WT� S449I� T456M�
OVCAR5-shSin1�
MSCV-Sin1-HA�
IB: Akt-pT308�
IB: Akt-pS473�
IB: Akt total�
IB: HA-Sin1�
IB: Tubulin�
WT� A451E� T456M�
0�30�60�0�30�60� 0�30�60� insulin (min)�
MSCV-Sin1-HA�
OVCAR5-shSin1�
OVCAR5-shSin1�
WT� A451E� T456M�
WT� A451E� T456M�
D
L! M N
% c
olo
ny
#�
0!50!
100!150!200!250!
WT� S449I� T456M�
% c
olo
ny
#�
0 !
50 !
100 !
150 !
200 !
250 !%
co
lon
y #�
0 !50 !
100 !150 !200 !250 !
*!*!
*! *!
*! *!
0 !50 !
100 !150 !200 !250 !
% c
olo
ny
#� *! *!O
P
Q
MSCV-Sin1-HA�

15
Figure S6. The cancerous Sin1-PH mutant lose binding with the mTOR-kinase domain, leading to elevated Akt-S473 phosphorylation and enhanced oncogenic activities, Related to Figure 6. A, PIP3 competes with mTOR-KD-L to bind Sin1-PH. Immunoblot (IB) analysis of whole cell lysates
(WCLs), PIP3 pulldowns, and HA-IPs derived from 293T cells transfected with indicated constructs. B, A schematic illustration of currently identified cancer patient-derived Sin1 mutations from cBio and
Cosmic databases. C, Most of the Sin1-PH cancer derived mutations lead to reduced Sin1-PH interactions with mTOR-KD in
cells. IB analysis of WCLs and GST-pull downs derived from 293T cells transfected with indicated constructs.
D-E, Sin1-D412G leads to increased Akt-S473 phosphorylation in cells. IB analysis of WCLs derived from Sin1-/- MEFs transfected with indicated HA-Sin1 constructs. Where indicated, 24 hr post-transfection, cells were serum starved for 24 hr before adding IGF-1 (100 ng/ml) for 30 min (D) or insulin (100 nM) for 30 min (E).
F, Sin1-D412G-containing mTORC2 complexes displays elevated kinase activity to phosphorylation Akt in vitro. HEK293 cells expressing various HA-Sin1 constructs were maintained in normal medium or serum starved or adding 100 nM insulin as indicated were harvested in CHAPs buffer following HA-Sin1 immunoprecipitations, which were used as the kinase source to phosphorylate GST-Akt1-tail (aa 209-280) in vitro.
G, IB analysis of endogenous Sin1-depleted OVCAR5 cells stably expressing either MSCV-Sin1-HA-WT or MSCV-Sin1-HA-D412G.
H-J, The OVCAR5 cell lines generated in (G) were cultured in 10% FBS-containing medium with the indicated concentrations of etoposide (H), doxorubicin (I), or taxol (J) for 24 hrs before performing the cell viability assays. Data was shown as mean + SD for three independent experiments. * indicates p<0.05 (Student’s t-test).
K, 3x10⁶ of the generated cells in (F) were injected into nude mice (n=10 for each group) and monitored for tumor formation.
L-M, Compared to WT-Sin1, stable expression of the Sin1-S449I, A451E or T456M mutant leads to an elevated Akt activation upon insulin stimulation. IB of WCLs derived from endogenous Sin1-depleted OVCAR5 cells stably expressing indicated Sin1 constructs. Where indicated, cells were serum starved for 36 hr before insulin (100 nM) was added for the indicated time periods.
N-Q, Compared to WT-Sin1, indicated Sin1-PH mutant expressing cells display enhanced colony formation (N, P) and soft-agar growth abilities (O, Q). Data was shown as mean + SD for three independent experiments. * indicates p<0.05 (student’s t-test).
R-S, Immuno-blot (IB) analysis of OVCAR5 cells generated in (Figure S6F) depleted of endogenous Akt1 (R) or Akt2 (S) via lenti-viral infections.
T-U, Depletion of either Akt1 or Akt2 sensitizes OVCAR5-D412G cells to chemotherapeutic agents. The OVCAR5 cell lines generated in (R-S) were cultured in 10% FBS-containing medium with the indicated concentrations of cisplatin (T) or doxorubicin (U) for 24 hrs before performing the cell viability assays. Data was shown as mean + SD for three independent experiments. * indicates p<0.05 (Student’s t-test).
V, Depletion of Akt1 or Akt2 leads to attenuated colony formation abilities. 400 cells generated in (R and S) were plated on 6 well plates. 14 days later formed colonies were visualized and counted.
W, Depletion of Akt1 or Akt2 leads to attenuated anchorage-independent growth ability in soft agar. 1x10⁵

16
cells generated in (R and S) were plated on top layer of agar in 6 well plates. 22 days later formed colonies were visualized and counted.
X-Z, FACS analyses of cell cycle distribution profiles by Modfit indicated that expression of indicated Sin1 mutant dose not significantly alter cell cycle profiles, compared with Sin1-WT expressing cells.

17
A
WT-
CA
AX!
Sin
1+/+!
CA
A!
CA
A-C
AA
X!
EV!
WT! HA-Sin1!
Sin1-/-!
+ + + + + + !HA-Akt1-E17K!IB: Akt-pS473!IB: Akt-pT308!
IB: Akt1!
IB: HA!
IB: Tubulin!
Figure S7, related to Figure 7!
IB: Akt-pS473!
_! +! _! +! _! +! _! +! _! +! _! +! insulin!
EV!
WT!
WT
-CA
AX!
CA
A!
CA
A-C
AA
X!
Sin
1+/+!
Sin1-/-!
HA-Sin1!
IB: HA-Sin1!
IB: Akt1!
IB: Tubulin!
E
C
WT-
CA
AX
st
arve
d!
WT-
CA
AX
+in
sulin!
HA-Sin1! DAPI! Merged!
CA
A-C
AA
X
star
ved!
CA
A-C
AA
X
+in
sulin!
HA-Sin1! DAPI! Merged!D
F!
IB: HA!
DM
SO!
LY!
WO
RT!
YM!
DM
SO!
LY!
WO
RT!
YM!
IB: Akt-pS473!
WT! WT-CAAX! WT! WT-CAAX!
Medium! insulin!
HA-Sin1!
IB: Akt-pT308!
IB: Akt1!
HA-Akt1-E17K!
B
IB: HA!
IB: HA!
IB: Vinculin!
IB: Akt-pS473!
IP:
HA!
WC
L!
WT! WT-CAAX!
0 8 16 24 32 40! 0 8 16 24 32 40! EGF (min)!
G
Case Set: Tumors with sequencing and CNA data: All tumor samples that have CNA and sequencing data (311 samples)!Altered in 22 (7%) of cases !
Ovarian Serous Cystadenocarcinoma (TCGA, Provisional)/Tumors with sequencing and CNA data: (311)/User-defined List/2genes.!
Odds Ratio: <0.000001 [strong tendency toward mutual exclusivity]!95% Confidence Interval: <0.000001 - NaN!p-value: 0.726473 [Fisher's Exact Test]!
M APKAP1 2%
AKT1 5%
R81T! D412G!
Case Set: Tumors with sequencing and CNA data: All tumor samples that have CNA and sequencing data (311 samples)!Altered in 4 (1%) of cases !
Ovarian Serous Cystadenocarcinoma (TCGA, Provisional)/Tumors with sequencing and CNA data: (311)/User-defined List/2genes!
Odds Ratio: <0.000001 [strong tendency toward mutual exclusivity]!95% Confidence Interval: <0.000001 - NaN!p-value: 0.987159 [Fisher's Exact Test]!
M APKAP1 1%
PIK3 CA 1%
R81T! D412G!
H1047R!E545K!
H
I!
HA-Akt1!
DM
SO!
LY!
WO
RT!
YM!
DM
SO!
LY!
WO
RT!
YM!
EV!
WT!
Myr
-WT!
CA
A!
CA
AX
-CA
A!
WT!
CA
AX
-WT!
IB: Akt-pS473!
IB: GST!
GST-Akt1-tail !
HA-Sin1!

18
Figure S7. C-terminal tagging of KRas-CAAX to Sin1 could partially rescue the deficiency of the Sin1-CAA mutant in membrane recruitment and mTORC2 activation, Related to Figure 7. A, C-terminal addition of KRas-CAAX sequence in part rescues Sin1-CAA in phosphorylating Akt-S473
in cells. Immuno-blot (IB) analysis of whole cell lysates (WCLs) derived from Sin1-/- MEFs transfected with indicated Sin1 constructs. Where indicated, 24 hr post-transfection, cells were serum starved for 24 hr and 100 nM insulin was added to culture medium for 30 min before cell collection.
B, In vitro kinase assay indicating that in-frame addition of C-terminal KRas-CAAX sequence could in part rescue the Sin1-CAA mutant in phosphorylating Akt-S473 in vitro.
C, Representative immuno-florescent (IF) images to illustrate that the C-terminal addition of KRas-CAAX sequence enables part of Sin1-WT-CAAX molecules to localize to plasma membrane even under serum starved conditions. Where indicated, cells transfected with HA-Sin1 were serum starved for 24 hr before addition of 100 nM insulin for 15 min. Cells were then fixed and stained as indicated.
D, Representative immuno-florescent (IF) images to illustrate that the C-terminal addition of KRas-CAAX sequence rescues part of Sin1-CAA-CAAX molecules to localize to plasma membrane under insulin stimulation conditions. Where indicated, cells transfected with HA-Sin1 were serum starved for 24 hr before addition of 100 nM insulin for 15 min. Cells were then fixed and stained as indicated.
E, Addition of a C-terminal CAAX tag mostly abolishes Akt phosphorylation in cells. IB analysis of WCLs and HA-IPs derived from HeLa cells tranfected with indicated HA-Akt1 constructs. Where indicated, cells were serum starved for 24 hrs and stimulated by 100 ng/ml EGF for the indicated periods before harvesting.
F-G, A C-terminal addition of KRas-CAAX sequence in Sin1 leads to elevated Akt-pS473 signals in Akt1-E17K in cells. IB of WCLs derived from Sin1-/- MEFs transfected with HA-Akt1-E17K and indicated HA-Sin1 constructs. Where indicated, 24 hr post-transfection, cells were serum starved for 24 hr before addition of 100 nM insulin for 30 min.
H, Sin1 mutations and Akt amplifications are mutually exclusive in ovarian serous cystadenocarcinoma patient samples (from cBio database).
I, Sin1 and p110α/PIK3CA mutations are mutually exclusive in ovarian serous cystadenocarcinoma patient samples (from cBio database).


![mTOR signaling in kidney diseases...Sep 03, 2020 · The mTOR pathway regulates cell growth, proliferation, survival and metabolism [4]. Dysregulation of mTOR signaling disrupts renal](https://img.pdfslide.us/doc/110x75/608faa7a471c847b5d397b8c/mtor-signaling-in-kidney-diseases-sep-03-2020-the-mtor-pathway-regulates.jpg)