Embed Size (px)
Citation preview
1
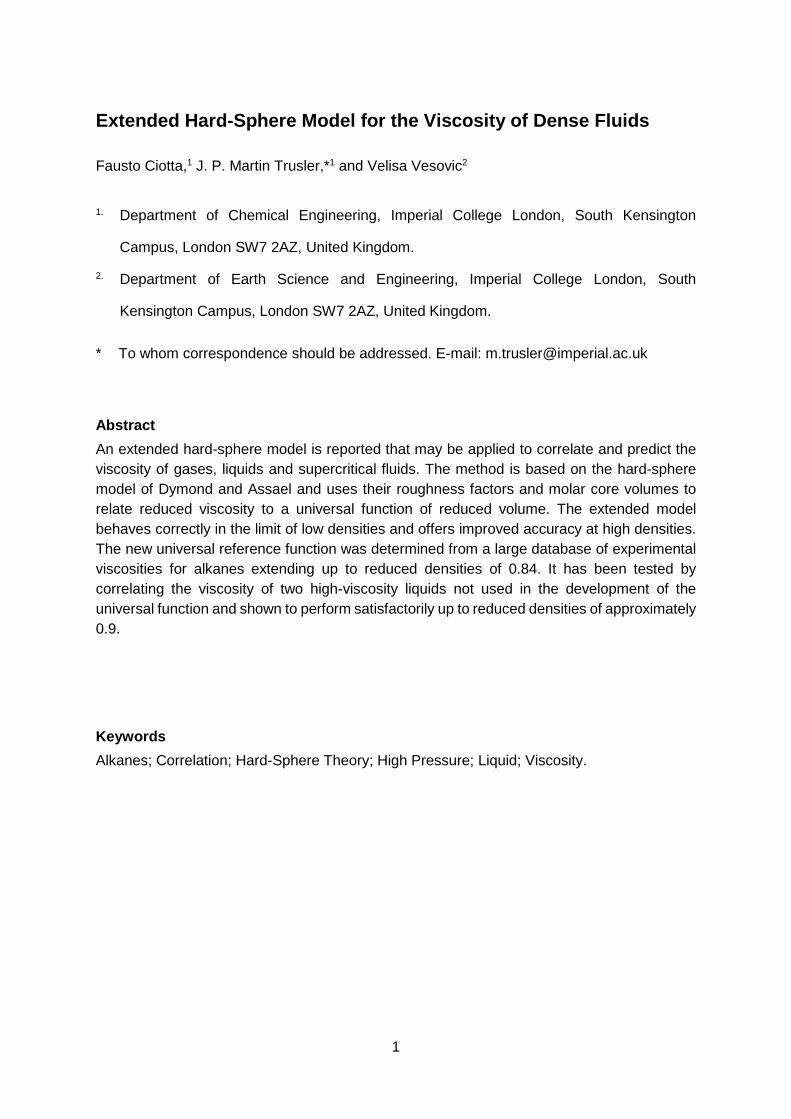
Extended Hard-Sphere Model for the Viscosity of Dense Fluids Fausto Ciotta,1 J. P. Martin Trusler,*1 and Velisa Vesovic2 1. Department of Chemical Engineering, Imperial College London, South Kensington
Campus, London SW7 2AZ, United Kingdom.
2. Department of Earth Science and Engineering, Imperial College London, South
Kensington Campus, London SW7 2AZ, United Kingdom. * To whom correspondence should be addressed. E-mail: [email protected]
Abstract An extended hard-sphere model is reported that may be applied to correlate and predict the viscosity of gases, liquids and supercritical fluids. The method is based on the hard-sphere model of Dymond and Assael and uses their roughness factors and molar core volumes to relate reduced viscosity to a universal function of reduced volume. The extended model behaves correctly in the limit of low densities and offers improved accuracy at high densities. The new universal reference function was determined from a large database of experimental viscosities for alkanes extending up to reduced densities of 0.84. It has been tested by correlating the viscosity of two high-viscosity liquids not used in the development of the universal function and shown to perform satisfactorily up to reduced densities of approximately 0.9.
Keywords Alkanes; Correlation; Hard-Sphere Theory; High Pressure; Liquid; Viscosity.
2
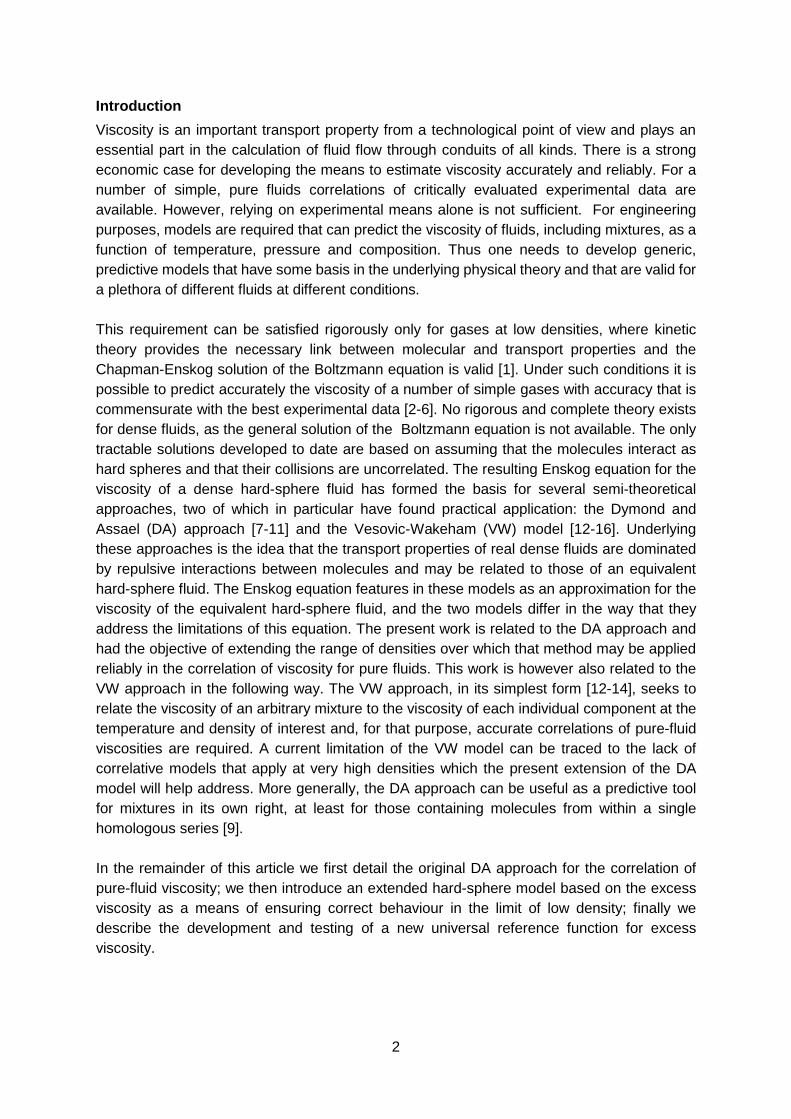
Introduction Viscosity is an important transport property from a technological point of view and plays an essential part in the calculation of fluid flow through conduits of all kinds. There is a strong economic case for developing the means to estimate viscosity accurately and reliably. For a number of simple, pure fluids correlations of critically evaluated experimental data are available. However, relying on experimental means alone is not sufficient. For engineering purposes, models are required that can predict the viscosity of fluids, including mixtures, as a function of temperature, pressure and composition. Thus one needs to develop generic, predictive models that have some basis in the underlying physical theory and that are valid for a plethora of different fluids at different conditions. This requirement can be satisfied rigorously only for gases at low densities, where kinetic theory provides the necessary link between molecular and transport properties and the Chapman-Enskog solution of the Boltzmann equation is valid [1]. Under such conditions it is possible to predict accurately the viscosity of a number of simple gases with accuracy that is commensurate with the best experimental data [2-6]. No rigorous and complete theory exists for dense fluids, as the general solution of the Boltzmann equation is not available. The only tractable solutions developed to date are based on assuming that the molecules interact as hard spheres and that their collisions are uncorrelated. The resulting Enskog equation for the viscosity of a dense hard-sphere fluid has formed the basis for several semi-theoretical approaches, two of which in particular have found practical application: the Dymond and Assael (DA) approach [7-11] and the Vesovic-Wakeham (VW) model [12-16]. Underlying these approaches is the idea that the transport properties of real dense fluids are dominated by repulsive interactions between molecules and may be related to those of an equivalent hard-sphere fluid. The Enskog equation features in these models as an approximation for the viscosity of the equivalent hard-sphere fluid, and the two models differ in the way that they address the limitations of this equation. The present work is related to the DA approach and had the objective of extending the range of densities over which that method may be applied reliably in the correlation of viscosity for pure fluids. This work is however also related to the VW approach in the following way. The VW approach, in its simplest form [12-14], seeks to relate the viscosity of an arbitrary mixture to the viscosity of each individual component at the temperature and density of interest and, for that purpose, accurate correlations of pure-fluid viscosities are required. A current limitation of the VW model can be traced to the lack of correlative models that apply at very high densities which the present extension of the DA model will help address. More generally, the DA approach can be useful as a predictive tool for mixtures in its own right, at least for those containing molecules from within a single homologous series [9]. In the remainder of this article we first detail the original DA approach for the correlation of pure-fluid viscosity; we then introduce an extended hard-sphere model based on the excess viscosity as a means of ensuring correct behaviour in the limit of low density; finally we describe the development and testing of a new universal reference function for excess viscosity.
3
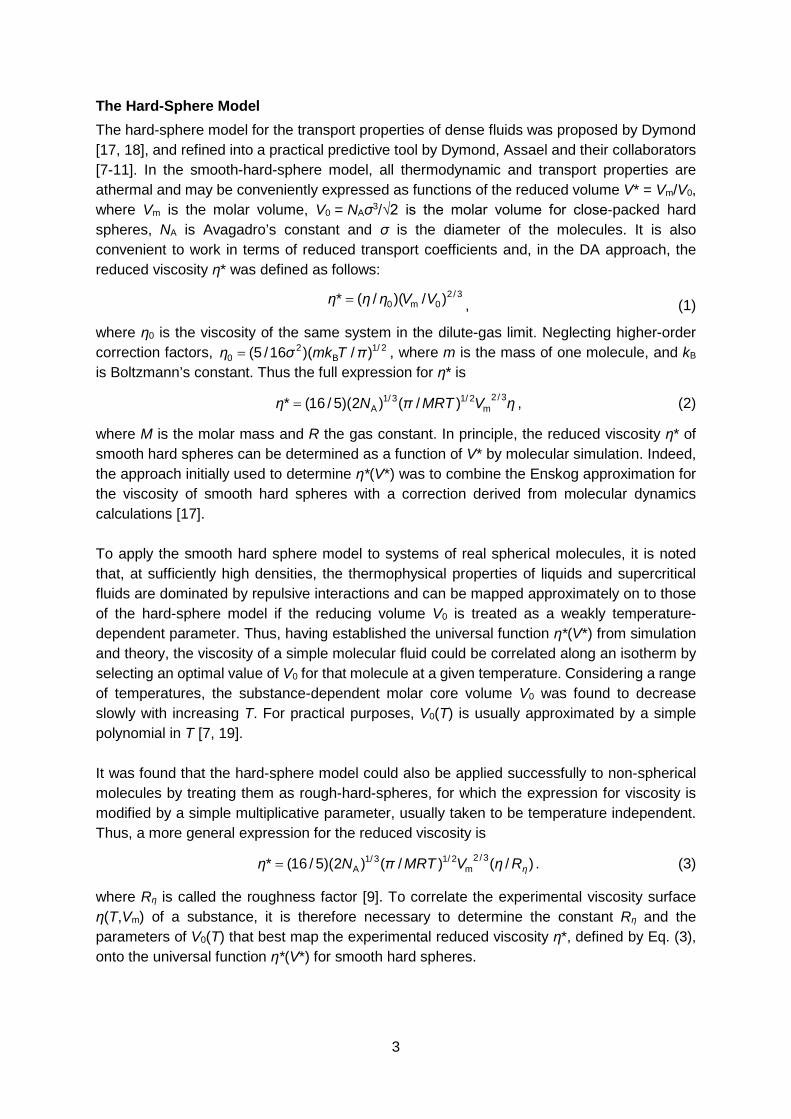
The Hard-Sphere Model The hard-sphere model for the transport properties of dense fluids was proposed by Dymond [17, 18], and refined into a practical predictive tool by Dymond, Assael and their collaborators [7-11]. In the smooth-hard-sphere model, all thermodynamic and transport properties are athermal and may be conveniently expressed as functions of the reduced volume V* = Vm/V0, where Vm is the molar volume, V0 = NAσ3/√2 is the molar volume for close-packed hard spheres, NA is Avagadro’s constant and σ is the diameter of the molecules. It is also convenient to work in terms of reduced transport coefficients and, in the DA approach, the reduced viscosity η* was defined as follows:
3/2
0m0 )/)(/(* VVηηη = , (1)
where η0 is the viscosity of the same system in the dilute-gas limit. Neglecting higher-order correction factors, 2/1
B2
0 )/)(16/5( πTmkση = , where m is the mass of one molecule, and kB is Boltzmann’s constant. Thus the full expression for η* is
ηVMRTπNη 3/2m
2/13/1A )/()2)(5/16(* = , (2)
where M is the molar mass and R the gas constant. In principle, the reduced viscosity η* of smooth hard spheres can be determined as a function of V* by molecular simulation. Indeed, the approach initially used to determine η*(V*) was to combine the Enskog approximation for the viscosity of smooth hard spheres with a correction derived from molecular dynamics calculations [17]. To apply the smooth hard sphere model to systems of real spherical molecules, it is noted that, at sufficiently high densities, the thermophysical properties of liquids and supercritical fluids are dominated by repulsive interactions and can be mapped approximately on to those of the hard-sphere model if the reducing volume V0 is treated as a weakly temperature-dependent parameter. Thus, having established the universal function η*(V*) from simulation and theory, the viscosity of a simple molecular fluid could be correlated along an isotherm by selecting an optimal value of V0 for that molecule at a given temperature. Considering a range of temperatures, the substance-dependent molar core volume V0 was found to decrease slowly with increasing T. For practical purposes, V0(T) is usually approximated by a simple polynomial in T [7, 19]. It was found that the hard-sphere model could also be applied successfully to non-spherical molecules by treating them as rough-hard-spheres, for which the expression for viscosity is modified by a simple multiplicative parameter, usually taken to be temperature independent. Thus, a more general expression for the reduced viscosity is
)/()/()2)(5/16(* 3/2m
2/13/1A ηRηVMRTπNη = . (3)
where Rη is called the roughness factor [9]. To correlate the experimental viscosity surface η(T,Vm) of a substance, it is therefore necessary to determine the constant Rη and the parameters of V0(T) that best map the experimental reduced viscosity η*, defined by Eq. (3), onto the universal function η*(V*) for smooth hard spheres.
4
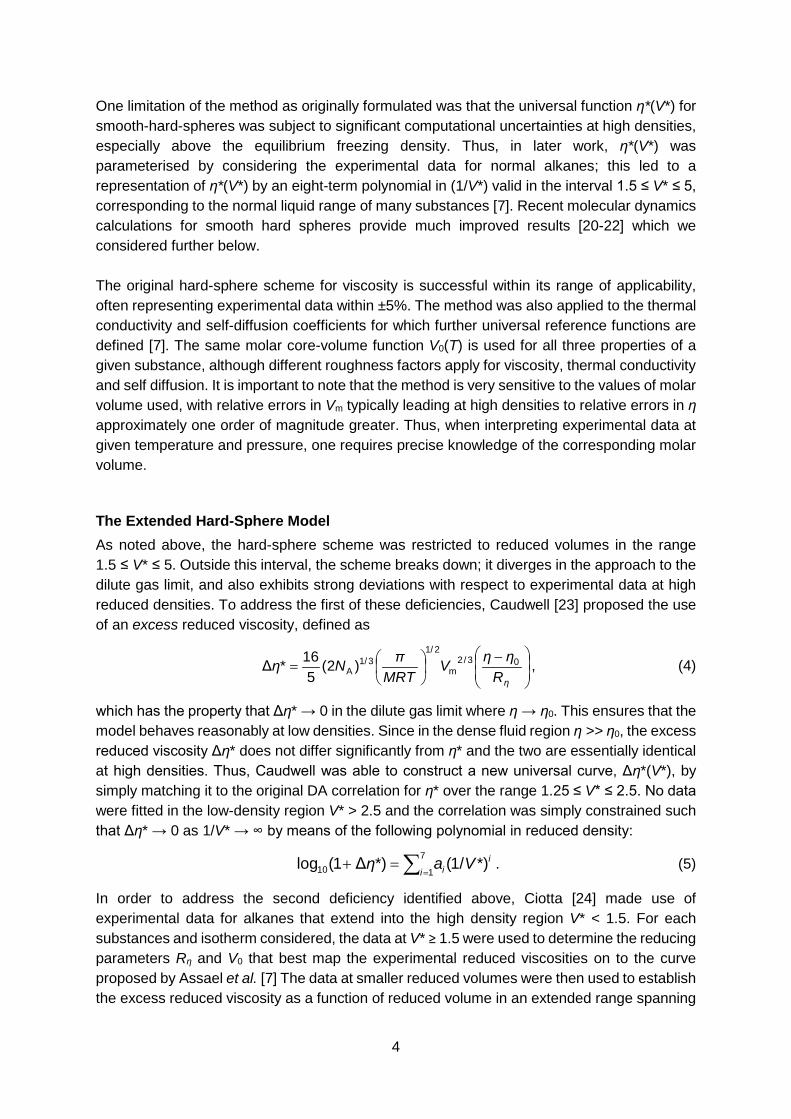
One limitation of the method as originally formulated was that the universal function η*(V*) for smooth-hard-spheres was subject to significant computational uncertainties at high densities, especially above the equilibrium freezing density. Thus, in later work, η*(V*) was parameterised by considering the experimental data for normal alkanes; this led to a representation of η*(V*) by an eight-term polynomial in (1/V*) valid in the interval 1.5 ≤ V* ≤ 5, corresponding to the normal liquid range of many substances [7]. Recent molecular dynamics calculations for smooth hard spheres provide much improved results [20-22] which we considered further below. The original hard-sphere scheme for viscosity is successful within its range of applicability, often representing experimental data within ±5%. The method was also applied to the thermal conductivity and self-diffusion coefficients for which further universal reference functions are defined [7]. The same molar core-volume function V0(T) is used for all three properties of a given substance, although different roughness factors apply for viscosity, thermal conductivity and self diffusion. It is important to note that the method is very sensitive to the values of molar volume used, with relative errors in Vm typically leading at high densities to relative errors in η approximately one order of magnitude greater. Thus, when interpreting experimental data at given temperature and pressure, one requires precise knowledge of the corresponding molar volume.
The Extended Hard-Sphere Model As noted above, the hard-sphere scheme was restricted to reduced volumes in the range 1.5 ≤ V* ≤ 5. Outside this interval, the scheme breaks down; it diverges in the approach to the dilute gas limit, and also exhibits strong deviations with respect to experimental data at high reduced densities. To address the first of these deficiencies, Caudwell [23] proposed the use of an excess reduced viscosity, defined as
−
=
ηRηηV
MRTπNη 03/2
m
2/13/1
A )2(5
16*Δ , (4)
which has the property that Δη* → 0 in the dilute gas limit where η → η0. This ensures that the model behaves reasonably at low densities. Since in the dense fluid region η >> η0, the excess reduced viscosity Δη* does not differ significantly from η* and the two are essentially identical at high densities. Thus, Caudwell was able to construct a new universal curve, Δη*(V*), by simply matching it to the original DA correlation for η* over the range 1.25 ≤ V* ≤ 2.5. No data were fitted in the low-density region V* > 2.5 and the correlation was simply constrained such that Δη* → 0 as 1/V* → ∞ by means of the following polynomial in reduced density:
∑==+
7
110 *)/1(*)Δ1(logi
ii Vaη . (5)
In order to address the second deficiency identified above, Ciotta [24] made use of experimental data for alkanes that extend into the high density region V* < 1.5. For each substances and isotherm considered, the data at V* ≥ 1.5 were used to determine the reducing parameters Rη and V0 that best map the experimental reduced viscosities on to the curve proposed by Assael et al. [7] The data at smaller reduced volumes were then used to establish the excess reduced viscosity as a function of reduced volume in an extended range spanning
5
1.25 ≤ V* ≤ 1.5. Ciotta [24] developed a correlation for Δη*(V*) in the form of Eq. (5) by fitting these new data and by matching to the original scheme in the region 1.5 ≤ V* ≤ 2.5.
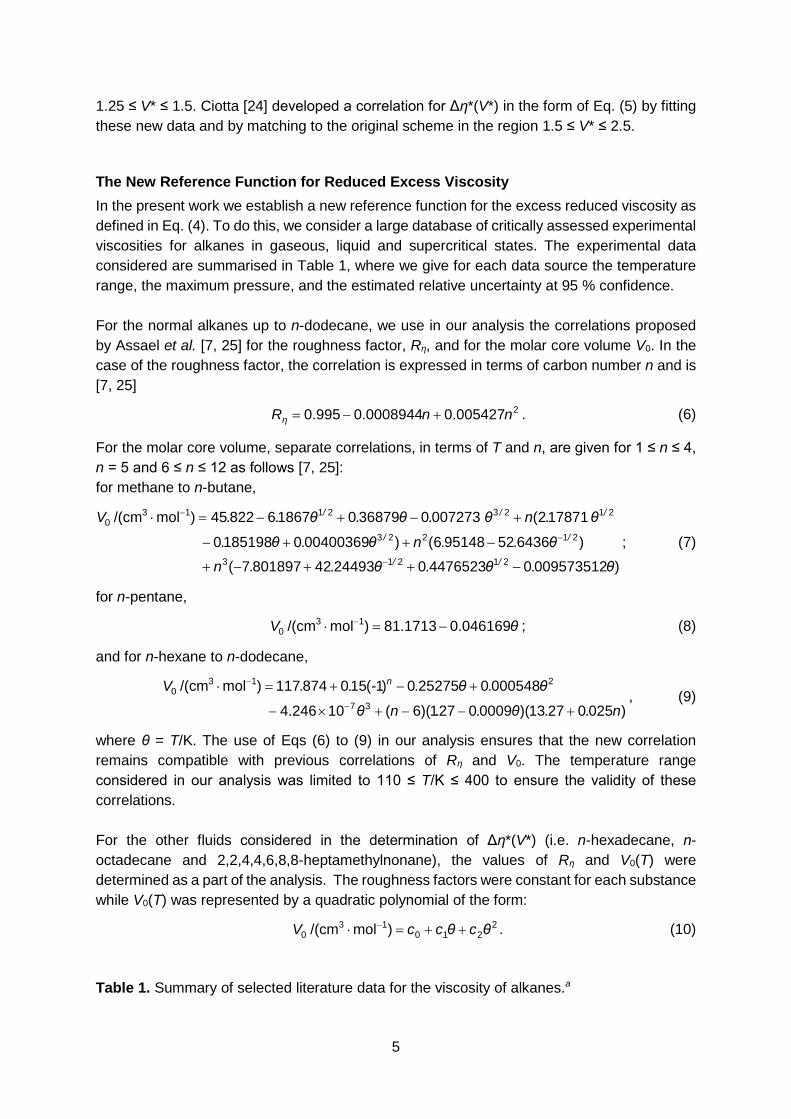
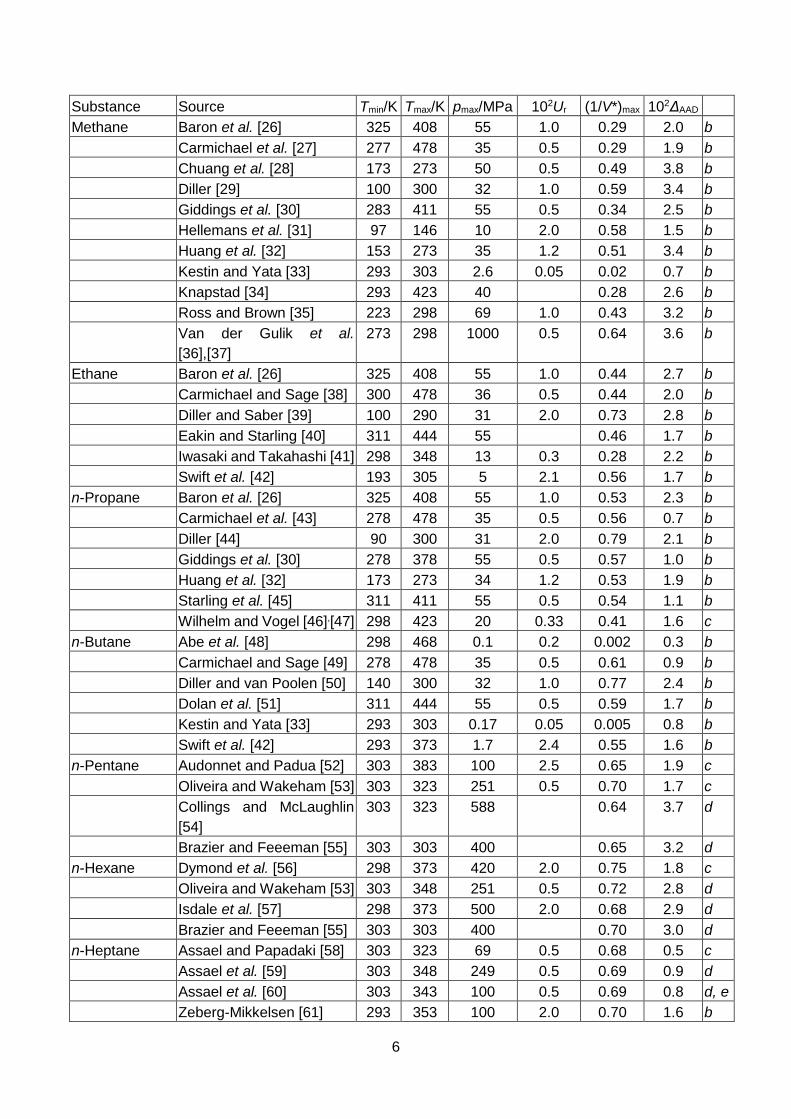
The New Reference Function for Reduced Excess Viscosity In the present work we establish a new reference function for the excess reduced viscosity as defined in Eq. (4). To do this, we consider a large database of critically assessed experimental viscosities for alkanes in gaseous, liquid and supercritical states. The experimental data considered are summarised in Table 1, where we give for each data source the temperature range, the maximum pressure, and the estimated relative uncertainty at 95 % confidence. For the normal alkanes up to n-dodecane, we use in our analysis the correlations proposed by Assael et al. [7, 25] for the roughness factor, Rη, and for the molar core volume V0. In the case of the roughness factor, the correlation is expressed in terms of carbon number n and is [7, 25]
2005427.00008944.0995.0 nnRη +−= . (6)
For the molar core volume, separate correlations, in terms of T and n, are given for 1 ≤ n ≤ 4, n = 5 and 6 ≤ n ≤ 12 as follows [7, 25]: for methane to n-butane,
)00957351204476523024493428018977()643652951486()0040036901851980
178712(00727303687901867682245)molcm/(
21213
21223
212321130
θ.θ.θ..n
θ..nθ.θ.
θ.n θ.θ.θ..V
//
//
///
−++−+
−++−
+−+−=⋅
−
−
−
; (7)
for n-pentane,
θV 046169.01713.81)molcm/( 130 −=⋅ − ; (8)
and for n-hexane to n-dodecane,
)02502713)(00090271)(6(10246.4
0005480252750)1(150874117)molcm/(37
2130
n..θ..nθ
θ.θ.-..V n
+−−+×−
+−+=⋅−
−
, (9)
where θ = T/K. The use of Eqs (6) to (9) in our analysis ensures that the new correlation remains compatible with previous correlations of Rη and V0. The temperature range considered in our analysis was limited to 110 ≤ T/K ≤ 400 to ensure the validity of these correlations. For the other fluids considered in the determination of Δη*(V*) (i.e. n-hexadecane, n-octadecane and 2,2,4,4,6,8,8-heptamethylnonane), the values of Rη and V0(T) were determined as a part of the analysis. The roughness factors were constant for each substance while V0(T) was represented by a quadratic polynomial of the form:
2210
130 )molcm/( θcθccV ++=⋅ − . (10)
Table 1. Summary of selected literature data for the viscosity of alkanes.a
6
Substance Source Tmin/K Tmax/K pmax/MPa 102Ur (1/V*)max 102ΔAAD Methane Baron et al. [26] 325 408 55 1.0 0.29 2.0 b Carmichael et al. [27] 277 478 35 0.5 0.29 1.9 b Chuang et al. [28] 173 273 50 0.5 0.49 3.8 b Diller [29] 100 300 32 1.0 0.59 3.4 b Giddings et al. [30] 283 411 55 0.5 0.34 2.5 b Hellemans et al. [31] 97 146 10 2.0 0.58 1.5 b Huang et al. [32] 153 273 35 1.2 0.51 3.4 b Kestin and Yata [33] 293 303 2.6 0.05 0.02 0.7 b Knapstad [34] 293 423 40 0.28 2.6 b Ross and Brown [35] 223 298 69 1.0 0.43 3.2 b Van der Gulik et al.
[36],[37] 273 298 1000 0.5 0.64 3.6 b
Ethane Baron et al. [26] 325 408 55 1.0 0.44 2.7 b Carmichael and Sage [38] 300 478 36 0.5 0.44 2.0 b Diller and Saber [39] 100 290 31 2.0 0.73 2.8 b Eakin and Starling [40] 311 444 55 0.46 1.7 b Iwasaki and Takahashi [41] 298 348 13 0.3 0.28 2.2 b Swift et al. [42] 193 305 5 2.1 0.56 1.7 b n-Propane Baron et al. [26] 325 408 55 1.0 0.53 2.3 b Carmichael et al. [43] 278 478 35 0.5 0.56 0.7 b Diller [44] 90 300 31 2.0 0.79 2.1 b Giddings et al. [30] 278 378 55 0.5 0.57 1.0 b Huang et al. [32] 173 273 34 1.2 0.53 1.9 b Starling et al. [45] 311 411 55 0.5 0.54 1.1 b Wilhelm and Vogel [46],[47] 298 423 20 0.33 0.41 1.6 c n-Butane Abe et al. [48] 298 468 0.1 0.2 0.002 0.3 b Carmichael and Sage [49] 278 478 35 0.5 0.61 0.9 b Diller and van Poolen [50] 140 300 32 1.0 0.77 2.4 b Dolan et al. [51] 311 444 55 0.5 0.59 1.7 b Kestin and Yata [33] 293 303 0.17 0.05 0.005 0.8 b Swift et al. [42] 293 373 1.7 2.4 0.55 1.6 b n-Pentane Audonnet and Padua [52] 303 383 100 2.5 0.65 1.9 c Oliveira and Wakeham [53] 303 323 251 0.5 0.70 1.7 c Collings and McLaughlin
[54] 303 323 588 0.64 3.7 d
Brazier and Feeeman [55] 303 303 400 0.65 3.2 d n-Hexane Dymond et al. [56] 298 373 420 2.0 0.75 1.8 c Oliveira and Wakeham [53] 303 348 251 0.5 0.72 2.8 d Isdale et al. [57] 298 373 500 2.0 0.68 2.9 d Brazier and Feeeman [55] 303 303 400 0.70 3.0 d n-Heptane Assael and Papadaki [58] 303 323 69 0.5 0.68 0.5 c Assael et al. [59] 303 348 249 0.5 0.69 0.9 d Assael et al. [60] 303 343 100 0.5 0.69 0.8 d, e Zeberg-Mikkelsen [61] 293 353 100 2.0 0.70 1.6 b
7
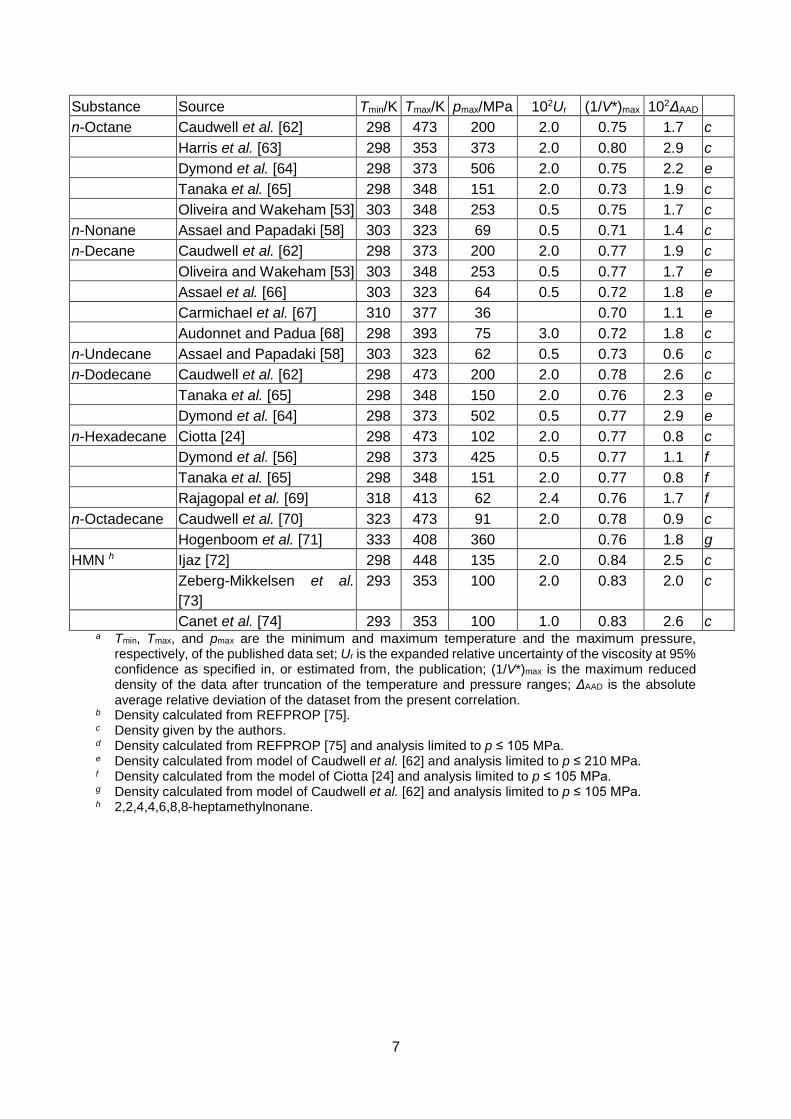
Substance Source Tmin/K Tmax/K pmax/MPa 102Ur (1/V*)max 102ΔAAD n-Octane Caudwell et al. [62] 298 473 200 2.0 0.75 1.7 c Harris et al. [63] 298 353 373 2.0 0.80 2.9 c Dymond et al. [64] 298 373 506 2.0 0.75 2.2 e Tanaka et al. [65] 298 348 151 2.0 0.73 1.9 c Oliveira and Wakeham [53] 303 348 253 0.5 0.75 1.7 c n-Nonane Assael and Papadaki [58] 303 323 69 0.5 0.71 1.4 c n-Decane Caudwell et al. [62] 298 373 200 2.0 0.77 1.9 c Oliveira and Wakeham [53] 303 348 253 0.5 0.77 1.7 e Assael et al. [66] 303 323 64 0.5 0.72 1.8 e Carmichael et al. [67] 310 377 36 0.70 1.1 e Audonnet and Padua [68] 298 393 75 3.0 0.72 1.8 c n-Undecane Assael and Papadaki [58] 303 323 62 0.5 0.73 0.6 c n-Dodecane Caudwell et al. [62] 298 473 200 2.0 0.78 2.6 c Tanaka et al. [65] 298 348 150 2.0 0.76 2.3 e Dymond et al. [64] 298 373 502 0.5 0.77 2.9 e n-Hexadecane Ciotta [24] 298 473 102 2.0 0.77 0.8 c Dymond et al. [56] 298 373 425 0.5 0.77 1.1 f Tanaka et al. [65] 298 348 151 2.0 0.77 0.8 f Rajagopal et al. [69] 318 413 62 2.4 0.76 1.7 f n-Octadecane Caudwell et al. [70] 323 473 91 2.0 0.78 0.9 c Hogenboom et al. [71] 333 408 360 0.76 1.8 g HMN h Ijaz [72] 298 448 135 2.0 0.84 2.5 c Zeberg-Mikkelsen et al.
[73] 293 353 100 2.0 0.83 2.0 c
Canet et al. [74] 293 353 100 1.0 0.83 2.6 c a Tmin, Tmax, and pmax are the minimum and maximum temperature and the maximum pressure,
respectively, of the published data set; Ur is the expanded relative uncertainty of the viscosity at 95% confidence as specified in, or estimated from, the publication; (1/V*)max is the maximum reduced density of the data after truncation of the temperature and pressure ranges; ΔAAD is the absolute average relative deviation of the dataset from the present correlation.
b Density calculated from REFPROP [75]. c Density given by the authors. d Density calculated from REFPROP [75] and analysis limited to p ≤ 105 MPa. e Density calculated from model of Caudwell et al. [62] and analysis limited to p ≤ 210 MPa. f Density calculated from the model of Ciotta [24] and analysis limited to p ≤ 105 MPa. g Density calculated from model of Caudwell et al. [62] and analysis limited to p ≤ 105 MPa. h 2,2,4,4,6,8,8-heptamethylnonane.
8
Since the method is very sensitive to the values of density used, careful attention was paid to this point. The method followed to obtain the molar density is indicated in Table 1 for each dataset. In some cases, the choice of density model necessitated the exclusion of viscosity data at pressures beyond the specified limits for that model, although extrapolation by up to 5% of the maximum pressure was allowed to prevent exclusion of points only just above the nominal maximum pressure for the selected density model. For the light alkanes up to n-butane [76-79], densities were calculated from reference-quality equations of state (EoS) available in the REFPROP database [75]; exceptionally, the isochoric data of Wilhelm et al. [46, 47] for propane were analysed with the densities reported by the authors. For n-pentane to n-dodecane one of three methods was selected for each dataset as follows: (i) densities specified by the authors; (ii) the EoS of Span and Wagner [80]; (iii) the correlations of Caudwell et al. [62, 70]. For n-hexadecane, the correlation of Ciotta [24] was used; for n-octadecane, the correlation of Caudwell et al. [70] was used; and for 2,2,4,4,6,8,8-heptamethylnonane, we used the densities reported by the authors. The dilute-gas viscosity η0(T) was also required for each substance. For methane to n-octane, this was taken from the correlations available in the REFPROP database [75]. For the other substances, η0 was actually negligible compared with the experimental viscosities considered but, for sake of completeness, Vicharelli’s [81] analytical approximation for the Lennard-Jones (12,6) potential was used with parameters estimated from the critical temperature and pressure [82]. Following restriction of the dataset to temperatures between 110 K and 400 K and to pressures at which reliable densities were available, approximately 2700 data points remained covering the 15 substances at reduced densities (1/V*) up to approximately 0.84. For methane to n-dodecane, Eqs (6) to (9) apply for V0 and Rη allowing Δη* to be computed from the experimental data (supplemented, where noted in Table 1, by a model for the density). The results are plotted in Figure 1 over the entire range of reduced densities considered (1/V* ≤ 0.8). At high densities, the data fall onto a single curve irrespective of temperature and substance. Also shown in Figure 1 are the molecular dynamics results of Sigurgeirsson and Heyes [20] for dense hard spheres; these are seen to be in fair agreement with the universal curve determined from experimental data. The experimental data at reduced densities below 0.5, show some dispersion but nevertheless also conform approximately to a universal curve. The term Vm
2/3 in Eq. (4) has the effect of amplifying small experimental errors as 1/V* → 0 and is responsible for the deviations from a universal curve seen near the origin in Figure 1(a). Initial values for the roughness factor and the molar core volume at each temperature for n-hexadecane, n-octadecane and 2,2,4,4,6,8,8-heptamethylnonane were determined by matching the data for these substances to the universal curve defined by the other alkane data (n ≤ 12 and1/V* ≤ 0.8). Applying the values of the roughness factor and the molar core volume to the viscosity data at higher densities, then permitted the universal curve to be extended up to 1/V* = 0.84, as shown in Figure 1(b). Initial estimates of the parameters ai, in Eq. (5), and also of ci, in eq. (10), were obtained as a starting point for the subsequent non-linear optimisation by fitting the results of this analysis.

9
The final parameters ai in Eq. (5) for the new universal curve Δη* were determined so as to minimise a weighted objective function χ2 defined as follows:
{ }∑ ∑= =
−=
15
1 1
2exp,,calc,,exp,,
2 /)()1(i
N
jjijijii
i
ηηηNχ . (11)
Here, ηi,j,exp is the jth experimental datum for substance i, ηi,j,calc is the corresponding value calculated from the model, and Ni is the number of data points considered for substance i. This objective function places equal weight on each substance and is designed to achieve the best possible fit to the raw viscosity data. In the process, the parameters Rη and ci (i = 1 to 3) were also adjusted for n-hexadecane, n-octadecane and 2,2,4,4,6,8,8-heptamethylnonane. The parameters so determined are given in Tables 2 and 3.

10
Table 2. Parameter in Eq. (5) for the universal curve. i 1 2 3 4 5 6 7 ai 6.26871 -48.4793 243.447 -653.257 974.312 -763.616 251.193
Table 3. Roughness factors Rη and parameters ci in the correlation of the molar core volume. Substance Rη c1 c2 c3 n-Hexadecane 2.008 2.9228×10² -3.3615×10⁻¹ 3.1128×10⁻⁴ HMN 1.060 2.7126×10² -2.1219×10⁻¹ 1.9798×10⁻⁴ Octadecane 2.232 2.8364×10² -1.2633×10⁻¹ 0 DIDP 2.333 5.8329×10² -9.0877×10⁻¹ 9.1493×10⁻⁴ DEHP 3.077 5.4565×10² -1.0936×100 1.2590×10⁻³
Table 4. Goodness of fit statistics for the determination of the universal curve. Substance 102ΔAAD 102ΔMAD 102Δbias Methane 2.9 11.8 -1.8 Ethane 2.3 9.6 1.7 n-Propane 1.4 6.3 0.3 n-Butane 1.7 7.5 1.0 n-Pentane 1.9 7.7 0.6 n-Hexane 2.5 5.3 1.0 n-Heptane 0.9 2.9 0.3 n-Octane 2.1 8.0 -1.6 n-Nonane 1.4 2.5 -1.4 n-Decane 1.7 4.5 -0.5 n-Undecane 0.6 1.8 -0.2 n-Dodecane 2.6 8.5 1.1 n-Hexadecane 1.2 3.9 0.0 2,2,4,4,6,8,8-Heptamethylnonane 2.4 9.7 0.1 n-Octadecane 1.1 3.8 0.0 DIDP 1.3 5.6 0.0 DEHP 4.8 11.7 0.3
11
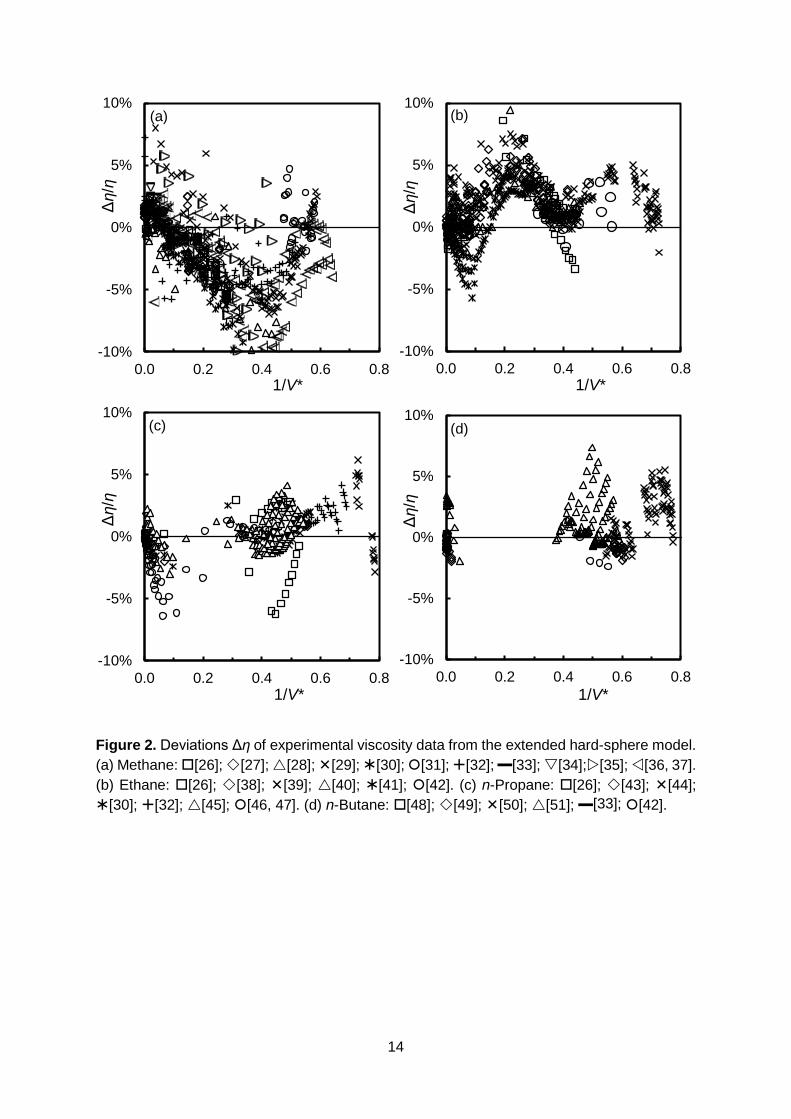
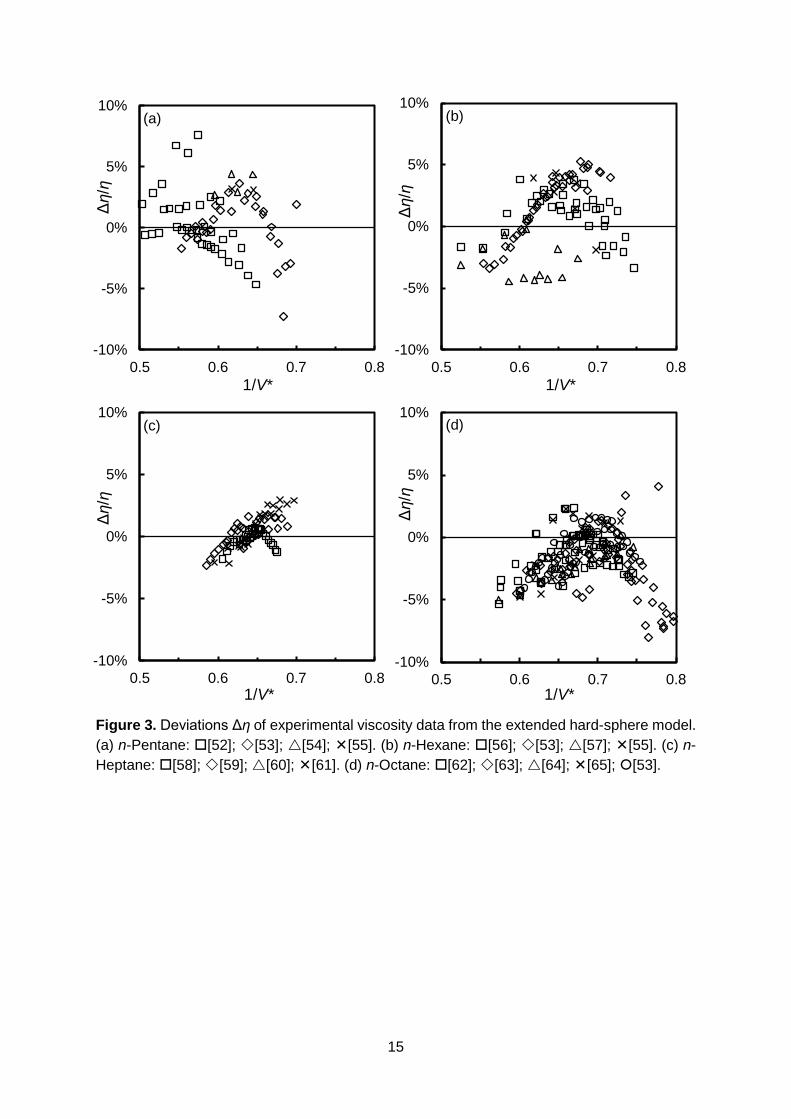
Comparison with Experimental Data Table 4 details the goodness of fit on a substance-by-substance basis in terms of the average absolute relative deviation ΔAAD, the maximum absolute relative deviation ΔMAD, and the average relative deviation, or bias, Δbias. We also give in Table 1 the average absolute relative deviation for each individual dataset from the present correlation; these figures may be compared with the estimated relative uncertainties Ur, given in the same table, which mostly fall between (0.5 and 2.0) %. The performance of the model in comparison with the data used in the determination of the new reference function is illustrated in Figures 2 to 4. Figure 2 shows the data for methane to n-butane. For methane, the extended hard-sphere model performs slightly less well than the original scheme at intermediate reduced densities, with significant negative deviations for reduced densities 1/V* between 0.3 and 0.5, but at higher densities, the model performs as well as the original (for comparison, the original scheme correlates the data at 1/V* ≥ 0.2, with ΔAAD = 2.6 % and ΔMAD = 8.7 %). It is notable that the data for van der Gulik [36] at T = 298.15 K, which extends up to p = 1000 MPa, are represented with relative deviations of between +3% and -6%, whereas van der Gulik’s [37] data at T = 273 K show generally larger deviations of between +2% and -12%. The deviations for ethane, seen in Figure 2(b), also show some dependence on 1/V* but are generally satisfactory at all densities. For propane and butane, the deviations are mostly within ±5% with less evidence of systematic behaviour. Figure 3 shows the results for n-pentane to n-octane. These cover the range 0.5 ≤ 1/V* ≤ 0.8 and the vast majority of these data fall within ±5%. The deviations for n-heptane are especially small with ΔAAD < 1 %. Figures 4(a) and 4(b), for n-nonane to n-dodecane, show the remaining data covered by the V0 correlation of Assael et al. [7] and again the deviations are mostly within ±5%. Figures 4(c) and 4(d) show that the data for n-hexadecane, n-octadecane and the hexadecane isomer 2,2,4,4,6,8,8-heptamethylnonane are all represented by the correlation in a satisfactory way. Overall, more than 97% of the 2700 viscosity data points fall within ±5% of the correlation and the maximum absolute relative deviation is 12%. As a further test of the new universal curve in the region of high reduced density, we consider the available high-pressure experimental viscosity data for diisodecyl phthalate (DIDP) [83-85] and bis(2-ethylhexyl) phthalate (DEHP) [85], which together span a range of viscosities from approximately 5 mPa·s to 2500 mPa·s. For these two substances, we made the approximation η0 ≈ 0. For DIDP, all densities were calculated from the equation of state of Peleties et al. [86]. In the case of DEHP, the densities were those reported by the author based on measurements at p = 0.1 MPa and literature data for the compressibility of the liquid. It is notable that the data for DEHP cover reduced densities up to 1/V* = 0.90. The parameters Rη and ci (i = 1 to 3) were optimised for each of these liquids in a fit to the extended hard-sphere model and the results are given in Tables 3 and 4. For DIDP, the data from the three different sources considered are represented remarkably well with relative deviations mostly within ±5%. In contrast, deviation spanning ±40% are found when the original hard-sphere scheme was applied to these data. The viscosity deviations found for DEHP are larger but mostly within ±10%, whereas deviations spanning ±75% were found with the original hard-sphere scheme. Thus, the present model is seen to be a marked improvement for high-viscosity liquids.
12
Conclusion The extended hard-sphere model developed in this work significantly improves the performance of the DA method at high densities, allowing data to be correlated at reduced densities up to approximately 0.9. The method also behaves reasonably in the approach to zero density and thus the approximation is valid over almost the entire fluid range. The extended hard-sphere model does require more information, namely the values of zero-density viscosity for a given temperature. For highly viscous fluids this term can be neglected, while for other fluids correlations or estimation methods are available in literature. The proposed model retains the correlations of V0 and Rη developed in earlier work for n-alkanes smaller than tridecane. As with the original DA approach, the method developed here is very sensitive to density and an accurate equation of state is needed if density is to be determined from specified values of temperature and pressure. We suggest that a similar methodology could be developed for thermal conductivity and self diffusion. As in the development of the original DA scheme, simultaneous analysis of viscosity, thermal conductivity and self diffusion may be advantageous in terms of obtaining extended universal curves that permit all three properties to be correlated with the same molar core volume function, V0(T), for a given substances. Acknowledgement: this work was supported in part by a grant from the Engineering and Physical Sciences Research Council (grant reference EP/E007031).

13
Figure 1 (color online). Reduced excess viscosities Δη* determined from the experimental data from the alkanes listed in Table 1 (crosses) and from molecular simulation (circles).
0
2
4
6
8
10
0.0 0.1 0.2 0.3 0.4 0.5
Δη*
1/V*
10
100
1000
0.5 0.6 0.7 0.8
Δη*
1/V*
14
Figure 2. Deviations Δη of experimental viscosity data from the extended hard-sphere model. (a) Methane: [26]; [27]; [28]; [29]; [30]; [31]; [32]; ▬[33]; [34];[35]; [36, 37]. (b) Ethane: [26]; [38]; [39]; [40]; [41]; [42]. (c) n-Propane: [26]; [43]; [44]; [30]; [32]; [45]; [46, 47]. (d) n-Butane: [48]; [49]; [50]; [51]; ▬[33]; [42].
-10%
-5%
0%
5%
10%
0.0 0.2 0.4 0.6 0.8
Δη/η
1/V*
(a)
-10%
-5%
0%
5%
10%
0.0 0.2 0.4 0.6 0.8
Δη/η
1/V*
(b)
-10%
-5%
0%
5%
10%
0.0 0.2 0.4 0.6 0.8
Δη/η
1/V*
(c)
-10%
-5%
0%
5%
10%
0.0 0.2 0.4 0.6 0.8
Δη/η
1/V*
(d)
15
Figure 3. Deviations Δη of experimental viscosity data from the extended hard-sphere model. (a) n-Pentane: [52]; [53]; [54]; [55]. (b) n-Hexane: [56]; [53]; [57]; [55]. (c) n-Heptane: [58]; [59]; [60]; [61]. (d) n-Octane: [62]; [63]; [64]; [65]; [53].
-10%
-5%
0%
5%
10%
0.5 0.6 0.7 0.8
Δη/η
1/V*
(a)
-10%
-5%
0%
5%
10%
0.5 0.6 0.7 0.8
Δη/η
1/V*
(b)
-10%
-5%
0%
5%
10%
0.5 0.6 0.7 0.8
Δη/η
1/V*
(c)
-10%
-5%
0%
5%
10%
0.5 0.6 0.7 0.8
Δη/η
1/V*
(d)

16
Figure 4. Deviations Δη of experimental viscosity data from the extended hard-sphere model. (a) n-Nonane, n-decane and n-undecane: [58]; [62]; [53]; [66]; [67]; [68]; [58]. (b) n-Dodecane: [70]; [65]; [64]. (c) n-Hexadecane: [24]; [56]; [65]; [69]. (d) n-Octadecane and 2,2,4,4,6,8,8-hexamethylnonane: [70]; [71]; [72]; [73]; [74].
-10%
-5%
0%
5%
10%
0.55 0.65 0.75 0.85
Δη/η
1/V*
(a)
-10%
-5%
0%
5%
10%
0.55 0.65 0.75 0.85
Δη/η
1/V*
(b)
-10%
-5%
0%
5%
10%
0.55 0.65 0.75 0.85
Δη/η
1/V*
(c)
-10%
-5%
0%
5%
10%
0.55 0.65 0.75 0.85
Δη/η
1/V*
(d)

17
Figure 5. Deviations Δη of experimental viscosity data from the extended hard-sphere model. (a) DIDP: [83]; [84]; [84]. (b) DEHP: [85].
-10%
-5%
0%
5%
10%
0.75 0.80 0.85 0.90
Δη/η
1/V*
-10%
-5%
0%
5%
10%
0.75 0.80 0.85 0.90
Δη/η
1/V*
18
References [1] F.R.W. McCourt, J.J.M. Beenakker, W.E. Köhler, I. Kučšer, Nonequilibrium Phenomena in Polyatomic Gases, Clarendon Press, Oxford, 1990. [2] S. Bock, E. Bich, E. Vogel, A.S. Dickinson, V. Vesovic, Calculation of the transport properties of carbon dioxide. I. Shear viscosity, viscomagnetic effects, and self-diffusion, J. Chem. Phys., 117 (2002) 2151-2160. [3] R. Hellmann, E. Bich, E. Vogel, A.S. Dickinson, V. Vesovic, Calculation of the transport and relaxation properties of methane. I. Shear viscosity, viscomagnetic effects, and self-diffusion, J. Chem. Phys., 129 (2008). [4] R. Hellmann, E. Bich, E. Vogel, A.S. Dickinson, V. Vesovic, Calculation of the transport and relaxation properties of dilute water vapor, J. Chem. Phys., 131 (2009). [5] R. Hellmann, E. Bich, E. Vogel, V. Vesovic, Ab initio intermolecular potential energy surface and thermophysical properties of hydrogen sulfide, PCCP, 13 (2011) 13749-13758. [6] R. Hellmann, Ab initio potential energy surface for the nitrogen molecule pair and thermophysical properties of nitrogen gas, Mol. Phys., 111 (2013) 387-401. [7] M.J. Assael, J.H. Dymond, M. Papadaki, P.M. Patterson, Correlation and Prediction of Dense Fluid Transport-Coefficients .1. Normal-Alkanes, Int. J. Thermophys., 13 (1992) 269-281. [8] M.J. Assael, J.H. Dymond, M. Papadaki, P.M. Patterson, Correlation and Prediction of Dense Fluid Transport-Coefficients .2. Simple Molecular Fluids, Fluid Phase Equilib., 75 (1992) 245-255. [9] M.J. Assael, J.H. Dymond, M. Papadaki, P.M. Patterson, Correlation and Prediction of Dense Fluid Transport-Coefficients .3. Normal-Alkane Mixtures, Int. J. Thermophys., 13 (1992) 659-669. [10] M.J. Assael, J.H. Dymond, P.M. Patterson, Correlation and Prediction of Dense Fluid Transport-Coefficients .4. A Note on Diffusion, Int. J. Thermophys., 13 (1992) 729-733. [11] M.J. Assael, J.H. Dymond, P.M. Patterson, Correlation and Prediction of Dense Fluid Transport-Coefficients .5. Aromatic-Hydrocarbons, Int. J. Thermophys., 13 (1992) 895-905. [12] V. Vesovic, W.A. Wakeham, The Prediction of the Viscosity of Dense Gas-Mixtures, Int. J. Thermophys., 10 (1989) 125-132. [13] V. Vesovic, W.A. Wakeham, Prediction of the Viscosity of Fluid Mixtures over Wide Ranges of Temperature and Pressure, Chem. Eng. Sci., 44 (1989) 2181-2189. [14] D.D. Royal, V. Vesovic, J.P.M. Trusler, W.A. Wakeham, Prediction of the viscosity of dense fluid mixtures, Mol. Phys., 101 (2003) 339-352. [15] A.S. de Wijn, V. Vesovic, G. Jackson, J.P.M. Trusler, A kinetic theory description of the viscosity of dense fluids consisting of chain molecules, J. Chem. Phys., 128 (2008). [16] A.S. de Wijn, N. Riesco, G. Jackson, J.P.M. Trusler, V. Vesovic, Viscosity of liquid mixtures: The Vesovic-Wakeham method for chain molecules, J. Chem. Phys., 136 (2012). [17] J.H. Dymond, Transport Properties of Dense Fluids, in: P.E. Liley (Ed.) Sixth Symposium on Thermophysical Properties, The American Society of Mechanical Engineers, Atlanta, Georgia, U.S.A., 1973, pp. 143-157. [18] J.H. Dymond, Interpretation of transport-coefficients on basis of Van der Waals model.1. Dense fluids, Physica, 75 (1974) 100-114. [19] J. Millat, J.H. Dymond, C.A. Nieto de Castro, Transport properties of fluids : their correlation, prediction, and estimation, Cambridge University Press, New York, 1996. [20] H. Sigurgeirsson, D.M. Heyes, Transport coefficients of hard sphere fluids, Mol. Phys., 101 (2003) 469-482. [21] D.M. Heyes, A.C. Branka, Transport coefficients of soft repulsive particle fluids, J Phys-Condens Mat, 20 (2008). [22] D.M. Heyes, A.C. Branka, Self-diffusion coefficients and shear viscosity of inverse power fluids: from hard- to soft-spheres, PCCP, 10 (2008) 4036-4044. [23] D.R. Caudwell, Viscosity of Dense Fluid Mixtures, PhD Thesis, University of London, 2004. [24] F. Ciotta, Viscosity of Asymmetric Liquid Mixtures under Extreme Conditions, PhD Thesis, Imperial College London, 2010. [25] M.J. Assael, J.P.M. Trusler, T.F. Tsolakis, Thermophysical Properties of Fluids, Imperial College Press, 1996.
19
[26] J.D. Baron, J.G. Roof, F.W. Wells, Viscosity of Nitrogen, Methane, Ethane and Propane at Elevated Temperature and Pressure, J. Chem. Eng. Data, 4 (1959) 283-288. [27] L.T. Carmichael, V.M. Berry, B.H. Sage, Viscosity of Hydrocarbons. Methane, J. Chem. Eng. Data, 10 (1965) 57-61. [28] S.Y. Chuang, P.S. Chappelear, R. Kobayashi, Viscosity of Methane, Hydrogen, and 4 Mixtures of Methane and Hydrogen from -100degreesc to 0degreesc at High-Pressures, J. Chem. Eng. Data, 21 (1976) 403-411. [29] D.E. Diller, Measurements of the Viscosity of Compressed Gaseous and Liquid Methane, Physica A, 104 (1980) 417-426. [30] J.G. Giddings, J.T.F. Kao, R. Kobayashi, Development of a High-Pressure Capillary-Tube Viscometer and its Application to Methane, Propane and Their Mixtures in the Gaseous and Liquid Regions, J. Chem. Phys., 45 (1966) 578-586. [31] J. Hellemans, H. Zink, O. Van Paemal, The Viscosity of Liquid Argon and Liquid Methane along Isotherms as a Function of Pressure, Physica, 46 (1970) 395-410. [32] E.T.S. Huang, G.W. Swift, F. Kurata, Viscosities of Methane and Propane at Low Temperatures and High Pressures, AIChE J., 12 (1966) 932-936. [33] J. Kestin, J. Yata, Viscosity and Diffusion Coefficient of Six Binary Mixtures, J. Chem. Phys., 49 (1968) 4780-4791. [34] B. Knapstad, Viscosity of n-Decane - Methane at Elevated Temperature and Pressure, PhD Thesis, Universitetet i Trondheim, 1986. [35] J.F. Ross, G.M. Brown, Viscosities of Gases at High Pressures, Ind. Eng. Chem., 49 (1957) 2026-2033. [36] P.S. van der Gulik, R. Mostert, H.R. Vandenberg, The Viscosity of Methane at 25 °C up to 10 Kbar, Physica A, 151 (1988) 153-166. [37] P.S. van der Gulik, R. Mostert, H.R. Vandenberg, The Viscosity of Methane at 273 K up to 1 GPa, Fluid Phase Equilib., 79 (1992) 301-311. [38] L.T. Carmichael, B.H. Sage, Measurements of the Viscosity of Compressed Gaseous and Liquid Ethane, Physica A, 108 (1963) 143-152. [39] D.E. Diller, J.M. Saber, Measurements of the Viscosity of Compressed Gaseous and Liquid Ethane, Physica A, 108 (1981) 143-152. [40] B.E. Eakin, K.E. Starling, Liquid, Gas and Dense Fluid Viscosity of Ethane, J. Chem. Eng. Data, 7 (1962) 33-36. [41] H. Iwasaki, M. Takahashi, Viscosity of Carbon-Dioxide and Ethane, J. Chem. Phys., 74 (1981) 1930-1943. [42] G.W. Swift, J. Lohrenz, F. Kurata, Liquid Viscosities Above the Normal Boiling Point for Methane, Ethane, Propane and n-Butane, AIChE J., 6 (1960) 415-419. [43] L.T. Carmichael, V.M. Berry, B.H. Sage, Viscosity of Hydrocarbons. Propane, J. Chem. Eng. Data, 9 (1964) 411-415. [44] D.E. Diller, Measurements of the Viscosity of Saturated and Compressed Liquid Propane, J. Chem. Eng. Data, 27 (1982) 240-243. [45] K.E. Starling, B.E. Eakin, R.T. Ellington, Liquid, Gas and Dense-Fluid Viscosity of Propane, AIChE J., 6 (1960) 438-442. [46] J. Wilhelm, E. Vogel, Viscosity Measurements on Gaseous Argon, Krypton, and Propane, Int. J. Thermophys., 21 (2000) 301-318. [47] J. Wilhelm, E. Vogel, Viscosity Measurements on Gaseous Propane: Re-evaluation (vol 46, pg 1467, 2001), J. Chem. Eng. Data, 56 (2011) 1722-1729. [48] Y. Abe, J. Kestin, H.E. Khalifa, W.A. Wakeham, Viscosity of Normal Butane, Isobutane and Their Mixtures, Physica A, 97 (1979) 296-305. [49] L.T. Carmichael, B.H. Sage, Viscosity of Hydrocarbons. n-Butane, J. Chem. Eng. Data, 8 (1963) 612-616. [50] D.E. Diller, L.J. Vanpoolen, Measurements of the Viscosities of Saturated and Compressed Liquid Normal Butane and Isobutane, Int. J. Thermophys., 6 (1985) 43-62. [51] J.P. Dolan, K.E. Starling, A.L. Lee, B.E. Eakin, R.T. Ellington, Liquid, Gas and Dense Fluid Viscosity of n-Butane, J. Chem. Eng. Data, 8 (1963) 396-399. [52] F. Audonnet, A.A.H. Padua, Simultaneous measurement of density and viscosity of n-pentane from 298 to 383 K and up to 100 MPa using a vibrating-wire instrument, Fluid Phase Equilib., 181 (2001) 147-161.

20
[53] C.M.B.P. Oliveira, W.A. Wakeham, The Viscosity of 5 Liquid Hydrocarbons at Pressures up to 250 MPa, Int. J. Thermophys., 13 (1992) 773-790. [54] A.F. Collings, E. McLaughlin, Torsional Crystal Technique for the Measurement of Viscosities of Liquids at High Pressures, Trans. Faraday Soc., 67 (1971) 340-352. [55] D.W. Brazier, G.R. Freeman, The effects of pressure on the density, dielectric constant, and viscosity of several hydrocarbons and other organic liquids, Can. J. Chem., 47 (1969) 893-899. [56] J. Dymond, K.J. Young, J.D. Isdale, Transport Properties of Nonelectrolyte Liquid Mixtures. II. Viscosity Coefficients for the n-Hexane - n-Hexadecane System at Temperatures from 25 to 100 C at Pressures up to the Freezing Pressure or 500 MPa, Int. J. Thermophys., 1 (1980) 345-373. [57] J.D. Isdale, J. Dymond, T.A. Brawn, Viscosity and Density of n-Hexane-Cyclohexane Mixtures Between 25 and 100 C up to 500 MPa, High Temperature Science, 11 (1979) 571-580. [58] M.J. Assael, M. Papadaki, Measurements of the Viscosity of n-Heptane, n-Nonane, and n-Undecane at Pressures up to 70 MPa, Int. J. Thermophys., 12 (1991) 801-810. [59] M.J. Assael, C.P. Oliveira, M. Papadaki, W.A. Wakeham, Vibrating-Wire Viscometers for Liquids at High-Pressures, Int. J. Thermophys., 13 (1992) 593-615. [60] M.J. Assael, E. Charitidou, J.H. Dymond, M. Papadaki, Viscosity and Thermal-Conductivity of Binary Normal-Heptane + Normal-Alkane Mixtures, Int. J. Thermophys., 13 (1992) 237-249. [61] C.K. Zeberg-Mikkelsen, G. Watson, A. Baylaucq, G. Galliero, C. Boned, Comparative experimental and modeling studies of the viscosity behavior of ethanol+C7 hydrocarbon mixtures versus pressure and temperature, Fluid Phase Equilib., 245 (2006) 6-19. [62] D.R. Caudwell, J.P.M. Trusler, V. Vesovic, W.A. Wakeham, Viscosity and Density of Five Hydrocarbon Liquids at Pressures up to 200 MPa and Temperatures up to 473 K, J. Chem. Eng. Data, 54 (2009) 359-366. [63] K.R. Harris, R. Malhotra, L.A. Woolf, Temperature and density dependence of the viscosity of octane and toluene, J. Chem. Eng. Data, 42 (1997) 1254-1260. [64] J.H. Dymond, J. Robertson, J.D. Isdale, Transport Properties of Nonelectrolyte Liquid Mixtures - 3. Viscosity Coefficients for n-Octane, n-Dodecane, and Equimolar Mixtures Of n-Octane + n-Dodecane and n-Hexane + n-Dodecane From 25 to 100 ◦C at Pressures up to the Freezing Pressure or 500 MPa, Int. J. Thermophys., 2 (1981) 133-154. [65] Y. Tanaka, H. Hosokawa, H. Kubota, T. Makita, Viscosity and Density of Binary-Mixtures of Cyclohexane with N-Octane, N-Dodecane, and N-Hexadecane under High-Pressures, Int. J. Thermophys., 12 (1991) 245-264. [66] M.J. Assael, J.H. Dymond, M. Papadaki, Viscosity Coefficients of Binary N-Heptane+N-Alkane Mixtures, Fluid Phase Equilib., 75 (1992) 287-297. [67] L.T. Carmichael, V.M. Berry, B.H. Sage, Viscosity of Hydrocarbons. n-Decane, J. Chem. Eng. Data, 14 (1969) 27-31. [68] F. Audonnet, A.A.H. Padua, Viscosity and density of mixtures of methane and n-decane from 298 to 393 K and up to 75 MPa, Fluid Phase Equilib., 216 (2004) 235-244. [69] K. Rajagopal, L.L.P.R. Andrade, M.L.L. Paredes, High-Pressure Viscosity Measurements for the Binary System Cyclohexane plus n-Hexadecane in the Temperature Range of (318.15 to 413.15) K, J. Chem. Eng. Data, 54 (2009) 2967-2970. [70] D.R. Caudwell, J.P.M. Trusler, V. Vesovic, W.A. Wakeham, The Viscosity and Density of N-Dodecane and N-Octadecane at Pressures up to 200 MPa and Temperatures up to 473 K, Int. J. Thermophys., 25 (2004) 1339-1352. [71] D.L. Hogenboom, W. Webb, J.A. Dixon, Viscosity of Several Liquid Hydrocarbons as a Function of Temperature, Pressure, and Free Volume, J. Chem. Phys., 46 (1967) 2586-2598. [72] F. Ijaz, Measurement and Prediction of the Viscosity of Hydrocarbon Mixtures and Crude Oils, PhD Thesis, Imperial College London, 2011. [73] C.K. Zeberg-Mikkelsen, M. Barrouhou, A. Baylaucq, C. Boned, Measurements of the viscosity and density versus temperature and pressure for the binary system methylcyclohexane+2,2,4,4,6,8,8-heptamethylnonane, High Temp-High Press, 34 (2002) 591-601. [74] X. Canet, P. Dauge, A. Baylaucq, C. Boned, C.K. Zeberg-Mikkelsen, S.E. Quinones-Cisneros, E.H. Stenby, Density and viscosity of the 1-methylnaphthalene + 2,2,4,4,6,8,8-
21
heptamethylnonane system from 293.15 to 353.15 K at pressures up to 100 MPa, Int. J. Thermophys., 22 (2001) 1669-1689. [75] E.W. Lemmon, M.L. Huber, M.O. McLinden, NIST Standard Reference Database 23: Reference Fluid Thermodynamic and Transport Properties-REFPROP, in, National Institute of Standards and Technology, Gaitherburg, 2013. [76] U. Setzmann, W. Wagner, A New Equation of State and Tables of Thermodynamic Properties for Methane Covering the Range from the Melting Line to 625-K at Pressures up to 1000-Mpa, J. Phys. Chem. Ref. Data, 20 (1991) 1061-1155. [77] D. Bucker, W. Wagner, A reference equation of state for the thermodynamic properties of ethane for temperatures from the melting line to 675 K and pressures up to 900 MPa, J. Phys. Chem. Ref. Data, 35 (2006) 205-266. [78] D. Bucker, W. Wagner, Reference equations of state for the thermodynamic properties of fluid phase n-butane and isobutane, J. Phys. Chem. Ref. Data, 35 (2006) 929-1019. [79] E.W. Lemmon, M.O. McLinden, W. Wagner, Thermodynamic Properties of Propane. III. A Reference Equation of State for Temperatures from the Melting Line to 650 K and Pressures up to 1000 MPa, J. Chem. Eng. Data, 54 (2009) 3141-3180. [80] R. Span, W. Wagner, Equations of state for technical applications. II. Results for nonpolar fluids, Int. J. Thermophys., 24 (2003) 41-109. [81] P.A. Vicharelli, Analytic Parametrization of Transport-Coefficients of Lennard-Jones (N,6) Fluids, J Appl Phys, 62 (1987) 2250-2255. [82] R.S. Brokaw, NASA Technical Report R-81, in, Washington D.C., 1960. [83] F. Peleties, J.P.M. Trusler, Viscosity of Liquid Di-isodecyl Phthalate at Temperatures Between (274 and 373) K and at Pressures up to 140 MPa, J. Chem. Eng. Data, 56 (2011) 2236-2241. [84] K.R. Harris, S. Bair, Temperature and pressure dependence of the viscosity of diisodecyl phthalate at temperatures between (0 and 100) degrees C and at pressures to 1 GPa, J. Chem. Eng. Data, 52 (2007) 272-278. [85] K.R. Harris, Temperature and Pressure Dependence of the Viscosities of 2-Ethylhexyl Benzoate, Bis(2-ethylhexyl) Phthalate, 2,6,10,15,19,23-Hexamethyltetracosane (Squalane), and Diisodecyl Phthalate, J. Chem. Eng. Data, 54 (2009) 2729-2738. [86] F. Peleties, J.J. Segovia, J.P.M. Trusler, D. Vega-Maza, Thermodynamic properties and equation of state of liquid di-isodecyl phthalate at temperature between (273 and 423) K and at pressures up to 140 MPa, J Chem Thermodyn, 42 (2010) 631-639.