Embed Size (px)
Citation preview

Chemistry (2007) Sample assessment instrument and student response
Extended experimental investigation: The effect of sunlight on the chlorine levels in pools This sample is intended to inform the design of assessment instruments in the senior phase of learning. It highlights the qualities of student work and the match to the syllabus standards.
Criteria assessed • Knowledge and conceptual understanding
• Investigative processes
• Evaluating and concluding
Assessment instrument The response presented in this sample is in response to an assessment task.
This is an extended experimental investigation (EEI) in the context of swimming pool equilibrium. A brief summary of the task provided by the school is presented below. The task sheet has not been included. Refer to the syllabus 7.4.1 for the requirements of EEIs. Task: Design an experiment to explore an aspect of swimming pool equilibrium. Time: 4 weeks. The following has not been included:
• all calculations • risk assessment of the use of the chemicals in the investigation • MSDS sheets • details of making a particular concentration of each solution.

Queensland Studies Authority June 2013 | 2
Instrument-specific criteria and standards Student responses have been matched to instrument-specific criteria and standards; those criteria and standards that best describe the student work in this sample are shown below. For more information about the syllabus dimensions and standards descriptors, see www.qsa.qld.edu.au/1952.html#assessment.
Standard A
Knowledge and conceptual understanding
The student work has the following characteristics:
• reproduction and interpretation of complex and challenging equilibrium concepts
• comparison and explanation of complex concepts, processes and phenomena
• linking and application of algorithms, concepts and theories to find solutions in complex and challenging equilibrium situations.
Investigative processes
The student work has the following characteristics:
• formulation of justified significant hypotheses which inform effective and efficient design, refinement and management of investigations
• safe selection and adaptation of equipment, and appropriate application of technology to gather, record and process valid data
• systematic analysis of primary and secondary data to identify relationships between patterns, trends, errors and anomalies.
Evaluating and concluding
The student work has the following characteristics:
• analysis and evaluation of complex scientific interrelationships
• exploration of scenarios and possible outcomes with justification of conclusions/recommendations
• discriminating selection, use and presentation of scientific data and ideas to make meaning accessible to intended audiences through innovative use of range of language, diagrams, tables and graphs.
Note: Colour highlights have been used in the table to emphasise the qualities that discriminate between the standards.
Queensland Studies Authority June 2013 | 3
Student response — Standard A The annotations show the match to the instrument-specific standards.
reproduction and interpretation of complex and challenging concepts
comparison and explanation of complex processes
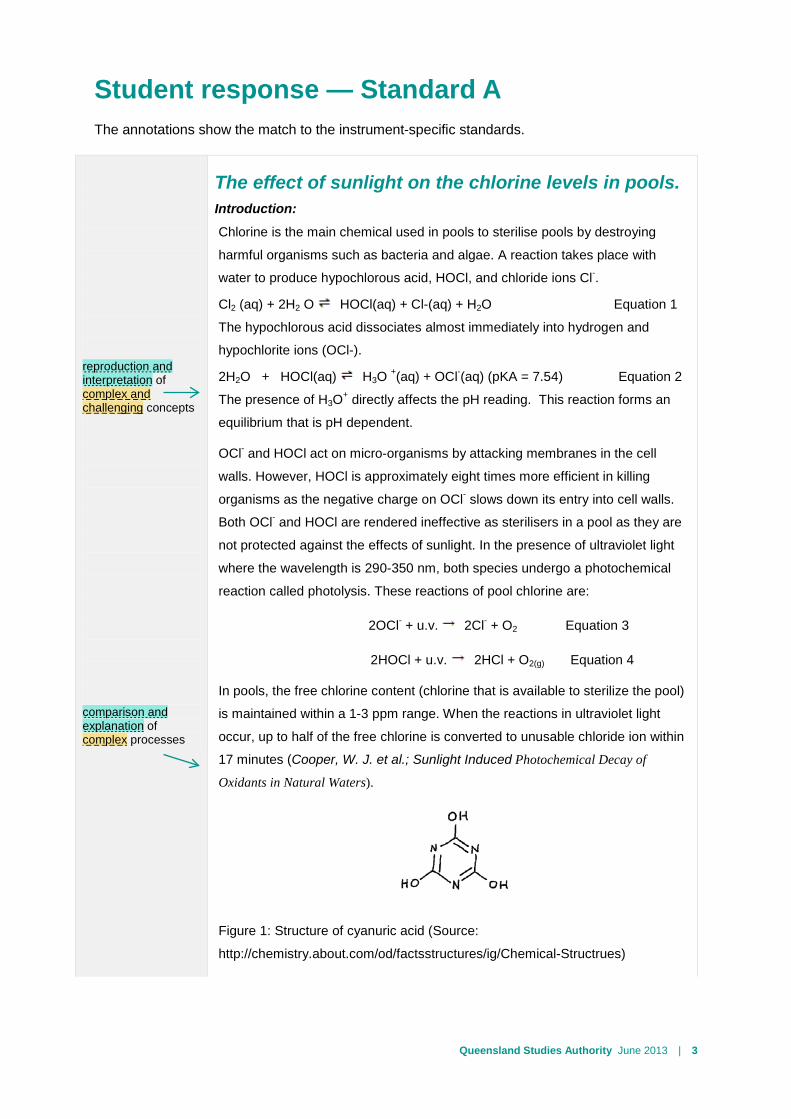
The effect of sunlight on the chlorine levels in pools. Introduction:
Chlorine is the main chemical used in pools to sterilise pools by destroying
harmful organisms such as bacteria and algae. A reaction takes place with
water to produce hypochlorous acid, HOCl, and chloride ions Cl-.
Cl2 (aq) + 2H2 O HOCl(aq) + Cl-(aq) + H2O Equation 1
The hypochlorous acid dissociates almost immediately into hydrogen and
hypochlorite ions (OCl-).
2H2O + HOCl(aq) H3O +(aq) + OCl-(aq) (pKA = 7.54) Equation 2
The presence of H3O+ directly affects the pH reading. This reaction forms an
equilibrium that is pH dependent.
OCl- and HOCl act on micro-organisms by attacking membranes in the cell
walls. However, HOCl is approximately eight times more efficient in killing
organisms as the negative charge on OCl- slows down its entry into cell walls.
Both OCl- and HOCl are rendered ineffective as sterilisers in a pool as they are
not protected against the effects of sunlight. In the presence of ultraviolet light
where the wavelength is 290-350 nm, both species undergo a photochemical
reaction called photolysis. These reactions of pool chlorine are:
2OCl- + u.v. 2Cl- + O2 Equation 3
2HOCl + u.v. 2HCl + O2(g) Equation 4
In pools, the free chlorine content (chlorine that is available to sterilize the pool)
is maintained within a 1-3 ppm range. When the reactions in ultraviolet light
occur, up to half of the free chlorine is converted to unusable chloride ion within
17 minutes (Cooper, W. J. et al.; Sunlight Induced Photochemical Decay of
Oxidants in Natural Waters).
Figure 1: Structure of cyanuric acid (Source:
http://chemistry.about.com/od/factsstructures/ig/Chemical-Structrues)

Queensland Studies Authority June 2013 | 4
comparison and explanation of complex processes
linking and application of theories to find solutions in complex and challenging situation
Cyanuric acid (1,3,5 triazine 2,4,6 triol) (C3N3O3H3) is added to swimming pools
to reduce photochemical decomposition of the free available chloride ion. This is
accomplished by the formation of choroisocyanurates that do not absorb UV
light. It has biological activity as a herbicide and health regulations require that
levels are kept below 200 ppm. (Source: de la Matter, D.; Swimming Pool
Chemistry).
Tests (Nelson 1967) on samples exposed to sunlight of chlorine demand-free
swimming pool water at pH 7, 84-900F (29 – 320C) containing 2.5 ppm av Cl
and 0, 25, 50 and 100 ppm cyanuric acid show that cyanuric acid greatly
reduces the photochemical decomposition of available chlorine (Wojtowicz
2004). The results showed little difference in stabilization from 25 to 100 ppm
cyanuric acid. There was an initial drop of 12-20% over the first half hour and
then a slow linear loss of about 10% over the next 3 hours.
Data from a Phoenix area pool has shown that in bather-free stabilized water
the average chlorine loss is approximately the same under outdoor and indoor
conditions, indicating that photochemical decomposition is very low (1-2% per
day). This is consistent with the fact that over 99% of the chlorine is in the form
of chloroisocyanurates which are not affected by UV radiation. Virtually all of the
decomposition (about 14% per day) observed in a bather-free pool in the
summer time is due to thermal decomposition of chloroisocyanurates, i.e.
oxidation of cyanuric acid by chlorine, (Wojtowicz 2004).
The reaction of dichloroisocyanuric acid with hypochlorite ion is as follows:
C3O3N3H3 + 2OCl-(aq) 2OH-(aq) + C3O3N3Cl2H Equation 5
cyanuric acid dichloroisocyanuric acid
This means that both equilibrium constants, Q and Keq are equal [𝑂𝐻−]2[𝐶3𝑂3𝑁3𝐶𝑙2𝐻][𝑂𝐶𝑙−]2[𝐶3𝑂3𝑁3𝐻3]
.
Due to this reaction, there is a loss of OCl- in the pool. The equilibrium will shift
to compensate for the losses of OCl- according to Le Chatelier’s Principle, (p.
352; Blackman et al.; Chemistry (2008)).
The concentration range of cyanuric acid within a functional and healthy
swimming pool is 25-50ppm. It is within this range that equilibrium between the
cyanuric acid and hypochlorite ion is established.

Queensland Studies Authority June 2013 | 5
reproduction and interpretation of complex and challenging equilibrium concepts
analysis and evaluation of complex scientific interrelationships
If extra cyanuric acid is added to the equilibrium solution, according to Le
Chatelier’s Principle, the reaction will adjust. The reaction adjusts itself by
shifting to the right to counteract this excess level of cyanuric acid. Therefore
the concentrations of OH- and C3O3N3Cl2H, will increase, and the
concentrations of C3O3N3H3 and OCl- decrease.
This will cause the ability for the pool to disinfect to decrease. Considering
Equation 6 below, since the concentration of OCl- has decreased the equation
will shift to the right decreasing the amount of HOCl.
2H2O + HOCl(aq) H3O+(aq) + OCl-(aq) Equation 6
It is HOCl that provides for the majority of the sterilization of the pool. Excess
cyanuric acid is therefore a hindrance in pool systems as it reduces the amount
of sterilizing HOCl and OCl- in the water. Excess cyanuric acid also decreases
the pH of a pool system.
Figure 1 The effect of pH on the concentrations of HOCl and OCl-
Source: de la Matter, D.; Swimming Pool Chemistry
Figure 1 shows that effect of pH on the OCl-/HOCl balance.
HOCl has an acidic nature, whereas OCl- is basic. The following equation
illustrates how HOCl is acidic (see Equation 7).
2H2O + HOCl(aq) H3O+(aq) + OCl-(aq) Equation 7
As HOCl is more effective in ridding unwanted organisms, it would be
reasonable to decrease the pH so there is more HOCl present to sterilise. (see
Figure 1)
However, a low pH can cause corrosion and irritation while a high pH can also
have negative effects on a pool. (p.20; Smith, D. et al, Chemistry in Use 2
(2006)). Therefore, pools have a sensitive and specific pH range, which is
between 7.2-7.8 (p.20; Smith, D. et al, Chemistry in Use 2 (2006)) This range
allows for effective sterilisation without causing damage.

Queensland Studies Authority June 2013 | 6
exploration of scenarios and possible outcomes with justification of conclusions/ recommendations
formulation of justified significant hypotheses which inform effective and efficient design, refinement and management of this investigation
Not only can pH be affected by the level of each species of chlorine steriliser, but the
addition of chemicals from bodily wastes and other materials alters pH. Using buffers,
pH can remain relatively the same as any change is absorbed.
Figure 2: Diagram showing the structure of the urea molecule.
Tests have been conducted on the effect of cyanuric acid at different temperatures in
pools. The results show that the loss at 55-600F(13-15.5 0C) were 1.9% per day but rose
to 12.55% per day at 80-850F(26.6-29.40C). This means that the chlorine loss increases
by a factor of 2 for every 100F(5.60C) rise in temperature (Wojtowicz 2004).
Urea, CO(NH2)2,can be introduced into pools via urine and sweat. Urea does not appear
to affect sterilisation but should be destroyed in pools as it is a nutrient for bacteria and
algae. Oxidation of urea by free chlorine is a slow process that gives rise to transient
ammonia chloramines (e.g. di- and trichloramine) (De Laat et al (2011). Urine contains
approximately 9.3g/L of urea. This was the reason for the choice of the concentration
used in this investigation.
Investigations in outdoor pools showed that with a urine input of 150mL.day in very
large pools the loss of chlorine increased from 14 to 26 % per day (Wojtowicz 2004).
Hypothesis:
It is hypothesized that pool water with cyanuric acid added will be more effective in
maintaining the chlorine level in the water than water without it when exposed to
sunlight. It is hypothesized that urea and increased temperature will affect the
stabilization of the pool water by the cyanuric acid when exposed to sunlight.

Queensland Studies Authority June 2013 | 7
formulation of justified significant hypotheses which inform effective and efficient design, refinement and management of the investigation
Method:
A summary of the method is as follows:
Simulated pool samples were exposed to sunlight. It was thought that all samples would
absorb a similar amount of heat if exposed to the sunlight in the same position each day
(school verandah) for the three hours from 11am to 2pm. The days were similar with
maximum temperatures of about 30 0C.
• A sample was made containing 2.0L of water, 0.180g of pH buffer and 0.004g of
pool chlorine. This was tested initially to determine the general levels of pH,
hardness, total alkalinity and chlorine. This was divided into four samples of
500mL each and cyanuric acid added; 100mg was added to one sample, 50mg
was added to another sample, and 25 mg to another and the last sample had
none added. The samples were at an initial room temperature of 20 0C before
being exposed to the sunlight.
• A redox titration involving sodium thiosulfate solution (Na2S2O3.H2O) was carried
out with the samples to determine the initial level of hypochlorite ions (and
essentially, chlorine) within the sample. The four samples were positioned in
direct sunlight. After one hour, two hours and three hours exposure, a titration
was performed to determine the levels of OCl- in each sample.
• Data was collected from the titrations, summarized into a table and then
graphed.
• The procedure was repeated with two sets of samples. One set was heated to
an initial temperature of 30 0C and maintained at that temperature when being
exposed to sunlight. The samples were maintained in a water bath with the
water at 30 0C. The other set was at room temperature of 20 0C.
• The procedure was repeated with urea, the chemical in human urine, being
added to each sample. Human urine has a concentration of 9.3g/L of urea.
18.6g of urea was added to the initial 2.0L sample. The samples were at an
initial room temperature of 20 0C before being exposed to the sunlight.

Queensland Studies Authority June 2013 | 8
safe selection and adaptation of equipment, and appropriate application of technology to gather, record and process valid data
discriminating selection, use and presentation of scientific data and ideas to make meaning accessible to intended audiences through innovative use of range of language, diagrams, tables and graphs
Results
The results from the titrations were tabulated in Tables 1-4 and then graphed in graphs 1-4. The samples were labelled as follows: sample 1, 0 ppm cyanuric acid; sample 2, 25 ppm cyanuric acid; sample 3, 50 ppm cyanuric acid; sample 4, 100 ppm cyanuric acid.
Sample 1 0 ppm cyanuric
acid
Sample 2 25 ppm cyanuric acid
Sample 3 50 ppm cyanuric acid
Sample 4 100 ppm cyanuric
acid
Time in
hours
[OCl-] (ppm)
% Cl
remaining
[OCl-] (ppm)
% Cl
remaining
[OCl-] (ppm)
% Cl
remaining
[OCl-] (ppm)
% Cl
remaining
0 2.5 2.5 2.5 2.5
0.5 1.4 56 2.3 92 2.4 96 2.4 96
1.0 0.63 25 2.05 82 2.15 86 2.25 90
1.5 0.43 17 1.9 76 2.0 80 2.1 84
2.0 0.25 10 1.87 75 1.96 78 2.05 82
2.5 0.14 6 1.74 70 1.9 76 2.0 80
3.0 0.08 3 1.7 68 1.89 76 1.98 79
Table 1: OCl- concentration in samples after exposure to sunlight.
Graph 1: OCl- concentration in samples after exposure to sunlight.
0
0.5
1
1.5
2
2.5
3
0 1 2 3 4
OC
l- co
ncen
trat
ion
ppm
Time in hours
Chlorine concentrations
0 ppm
25 ppm
50 ppm
100 ppm

Queensland Studies Authority June 2013 | 9
safe selection and adaptation of equipment, and appropriate application of technology to gather, record and process valid data
discriminating selection, use and presentation of scientific data and ideas to make meaning accessible to intended audiences through innovative use of range of language, diagrams, tables and graphs
Sample 1 0 ppm cyanuric acid
Sample 2 25 ppm cyanuric
acid
Sample 3 50 ppm cyanuric
acid
Sample 4 100 ppm cyanuric
acid
Time in
hours
[OCl-] (ppm)
% Cl
remaining
[OCl-] (ppm)
% Cl
remaining
[OCl-] (ppm)
% Cl
remaining
[OCl-] (ppm)
% Cl
remaining
0 2.5 2.5 2.5 2.5
0.5 1.2 48 2.2 88 2.27 91 2.35 94
1.0 0.4 16 1.9 76 2.1 84 2.2 88
1.5 0.15 6 1.8 72 1.95 78 2.1 84
2.0 0.05 2 1.7 68 1.85 74 2 80
2.5 0 0 1.6 64 1.8 72 1.85 74
3.0 0. 0 1.5 60 1.73 69 1.8 72
Table 2: OCl- concentration in samples with initial heating after exposure to sunlight.
Graph 2: OCl- concentration in samples with initial heating after exposure to sunlight.
-0.5
0
0.5
1
1.5
2
2.5
3
0 1 2 3 4
OC
l- co
ncen
trat
ion
ppm
Time in hours
Chlorine concentration when heated initially
0 ppm
25 ppm
50 ppm
100 ppm

Queensland Studies Authority June 2013 | 10
safe selection and adaptation of equipment, and appropriate application of technology to gather, record and process valid data
discriminating selection, use and presentation of scientific data and ideas to make meaning accessible to intended audiences through innovative use of range of language, diagrams, tables and graphs
Table 3: OCl- concentration in samples with urea added after exposure to sunlight.
Sample 1 0 ppm cyanuric acid
Sample 2 25 ppm cyanuric
acid
Sample 3 50 ppm cyanuric
acid
Sample 4 100 ppm cyanuric
acid
Time in hours
[OCl-] (ppm)
% Cl
remaining
[OCl-] (ppm)
% Cl
remaining
[OCl-] (ppm)
% Cl
remaining
[OCl-] (ppm)
% Cl
remaining
0 2.5 2.5 2.5 2.5
0.5 0.6 24 1.9 76 1.95 78 2.1 85
1.0 0.2 8 1.3 52 1.6 65 1.8 73
1.5 0 0 1.1 44 1.35 54 1.62 65
2.0 0 0 0.98 39 1.15 46 1.45 58
2.5 0 0 0.9 36 0.98 39 1.3 51
3.0 0. 0 0.75 30 0.9 36 1.1 43
Graph 3: OCl- concentration in samples with urea added after exposure to sunlight.
-0.5
0
0.5
1
1.5
2
2.5
3
0 1 2 3 4
OC
l- co
ncen
trat
ion
ppm
Time in hours
Chlorine concentration with urea added
0 ppm
25 ppm
50 ppm
100 ppm

Queensland Studies Authority June 2013 | 11
systematic analysis of primary and secondary data to identify relationships between patterns, trends, errors and anomalies
discriminating selection, use and presentation of scientific data and ideas to make meaning accessible to intended audiences through innovative use of range of language, diagrams, tables and graphs
A comparison was done with the 50 ppm sample under the three conditions. 50ppm is closest to the recommended dosage of cyanuric acid in a pool.
50 ppm exposed to sunlight
50 ppm exposed to sunlight and heated
50 ppm exposed to sunlight with urea added
Time in hours
[OCl-] (ppm)
% Cl
remaining
[OCl-] (ppm)
% Cl
remaining
[OCl-] (ppm)
% Cl
remaining
0 2.5 2.5 2.5
0.5 2.4 96 2.27 91 1.95 78
1.0 2.15 86 2.1 84 1.6 65
1.5 2.0 80 1.95 78 1.35 54
2.0 1.96 78 1.85 74 1.15 46
2.5 1.9 76 1.8 72 0.98 39
3.0 1.89 76 1.73 69 0.9 36
Table 4: A comparison of the results for the 50 ppm sample.
Graph 4: OCl- concentration in the 50 ppm samples
0
0.5
1
1.5
2
2.5
3
0 1 2 3 4
OC
l- co
ncen
trai
on p
pm
Time in hours
50 ppm sample
exposed to sunlight
heated to a highertemperature whenexposedurea added andexposed to sunlight

Queensland Studies Authority June 2013 | 12
systematic analysis of primary and secondary data to identify relationships between patterns, trends, errors and anomalies
reproduction and interpretation of complex and challenging equilibrium concepts
Discussion:
Table 1 results show that when all samples of pool water are exposed to sunlight the
chlorine level decreases over the time period of three hours for all concentrations of
cyanuric acid. The chlorine level for 0 ppm cyanuric acid sample decreases to just 3%
over three hours. The OCl- concentration drops quickly in the first hour and then
continues to decrease over the next two hours suggesting that the overall reaction
follows an exponential decay model. This is consistent with chemical reactions of this
type. For the other concentrations of cyanuric acid, there is little difference in the
decrease of chlorine, particularly for the 50 ppm and 100 ppm cyanuric acid samples.
The recommended amount of cyanuric acid is within the range of 25-50 ppm.
76% of chlorine remains in the 50 ppm sample after three hours and 79 % for the 100
ppm sample. These results are consistent with previous investigations cited (Nelson
1967). These investigations were conducted at 840F or 280C. There is a very large
decrease in chlorine in the first hour of exposure in this investigation in the 0 ppm
sample. This may have been due to the fact there was no equilibrium already
established in this sample.
The initial drop of 44% and then 31% of the chlorine in the 0 ppm sample in the first
hour is consistent with Equations 3 and 4. The OCl- and HOCl are undergoing
photolysis by UV light. In contrast in the 25 ppm sample the initial loss in the first hour is
only 18%. Similarly, the loss is 14% for the 50 ppm sample in the first hour. The 100
ppm sample has excess cyanuric acid but in such a small sample as used in this
investigation it is impossible to see other side effects. For example, the pH levels were
not monitored for the samples. The results are higher than would be expected if the
system was at equilibrium. The concentration of OCl- decreases as per Equation 6. It is
not possible in the timeframe of this investigation to know whether or not equilibrium has
been re-established. The loss in the 100 ppm sample in the first hour is 10%.
Table 2 results show similar trends to Table 1. However, the chlorine is lost more quickly
when the 0 ppm sample is at the higher temperature. All chlorine is almost gone from the
0 ppm sample in the first two hours. The difference in the chlorine remaining in the other
samples was not significantly different from the results at the lower temperature but was
lower e.g. 69% against 76% for the 50 ppm sample. Although the initial temperatures of
the samples were the same, the temperatures of the samples exposed to sunlight
throughout the day were not recorded. The water bath was maintained at the same
temperature throughout. It was only the chlorine concentration that was measured.
Further investigations could be done whereby the temperature was monitored. It was
assumed for this investigation that the same amount of heat was absorbed by each
sample as they were in the same situation for the same amount of time.

Queensland Studies Authority June 2013 | 13
exploration of scenarios and possible outcomes with justification of conclusions/ recommendations
reproduction and interpretation of complex and challenging equilibrium concepts
The effect on the chlorine level was more evident when the urea was added. This is
shown in Table 3. All chlorine was gone from the 0ppm sample by the end of one and a
half hours. For the 3 hour period only 30 % was left in the 25 ppm sample, 36% for the
50 ppm sample and 43% for the 100 ppm sample. The amount of urea added to each
sample was probably unrealistic. When urine enters a pool it is very quickly diluted
when added to a very large volume.
The experiment could be repeated with a smaller concentration of urea to simulate a
more realistic pool situation. It was still considered necessary to continue to test a
sample with 0 ppm under all conditions even though the initial sample tested had only
3% chlorine left after 4 hours.
Table 4 compares the data for the 50 ppm samples. These samples are closest to the
recommended maximum amount of cyanuric acid in a pool. For this investigation it is
considered that the sample is at equilibrium. The concentration of the chlorine via
titration is probably more accurate in these samples. The loss in chlorine in the sample
exposed to sunlight does not show an even trend but is probably exponential. Even
though the trends are the same for the 100 ppm sample it is impossible with such small
samples to see if there are any other influences on the sample. The pool samples were
small in comparison to the average volume of a pool.
The concentrations of all chemicals needed to be exact. Human error may have added
to inaccuracy, particularly in the titrations. The titrations were not repeated as there was
only a small volume of water to deal with.
With the experimental design, the main concern was the lack of analysis of other areas
within the pool. Such areas include the pH levels, buffer systems and temperature. This
would have been beneficial to investigate the effects of sunlight and cyanuric acid on the
whole pool system, and not just on chlorine levels.

Queensland Studies Authority June 2013 | 14
exploration of scenarios and possible outcomes with justification of conclusions/ recommendations
Conclusion
It was hypothesized that pool water with cyanuric acid added to it will be
more effective in maintaining the chlorine level in the water than water
without it when exposed to sunlight. It was hypothesized that urea and
increased temperature will affect the stabilization of the pool water by the
cyanuric acid when exposed to sunlight.
The results supported the hypothesis that water with cyanuric acid added
to it will maintain its chlorine level more effectively than water without it
when exposed to sunlight. A higher temperature of the pool sample
decreased the chlorine level when exposed to sunlight. The results
suggested that when urea was added the chlorine levels drop more
quickly, although this experiment was considered not to simulate realistic
pool water.
Queensland Studies Authority June 2013 | 15
linking and application of concepts to find solutions in complex and challenging equilibrium situations
linking and application of algorithms to find solutions in complex and challenging equilibrium situations
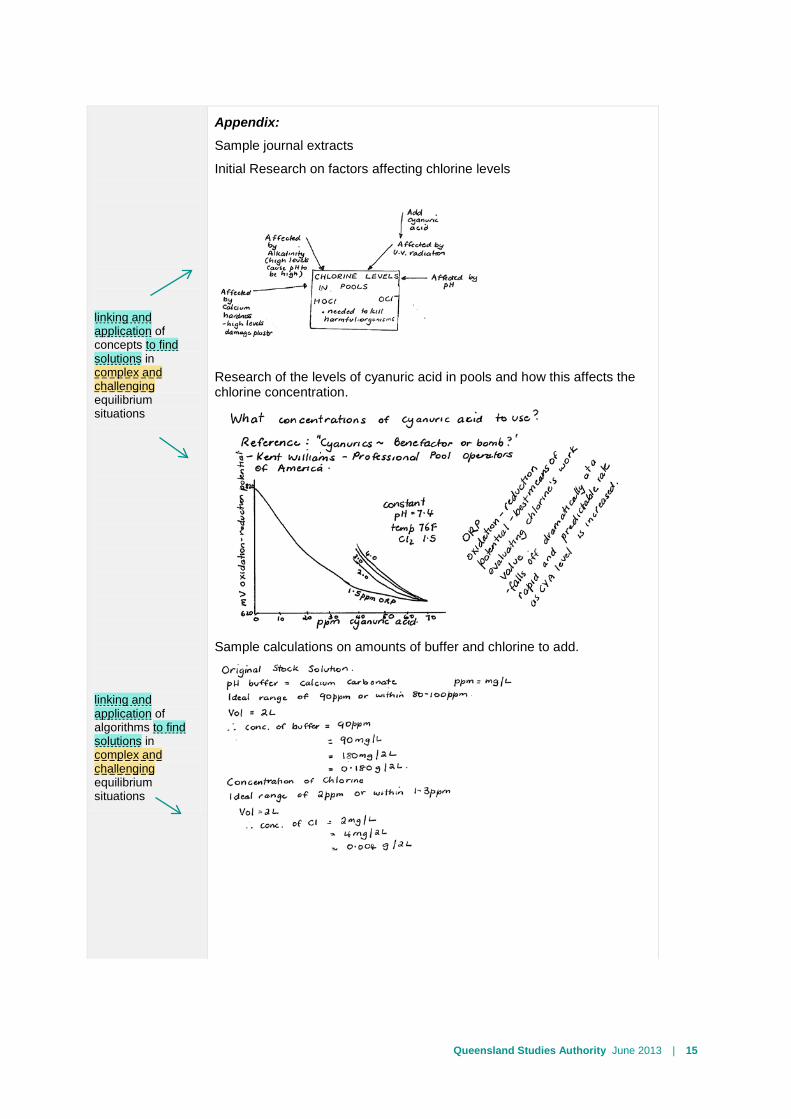
Appendix:
Sample journal extracts
Initial Research on factors affecting chlorine levels
Research of the levels of cyanuric acid in pools and how this affects the chlorine concentration.
Sample calculations on amounts of buffer and chlorine to add.
Queensland Studies Authority June 2013 | 16
Bibliography
Blackman, A., Bottle, S. E., Schmid, S., Mocerino, M., Willie, H.; (2008). Chemistry. John Wiley and Sons.
Cooper, W. J., Jones A.C., Whitehead, R. F., Zika R.G.; (2007). “Sunlight-Induced Photochemical Decay of Oxidants in Natural Waters: Implications in Ballast Water Treatment”. American Chemical Society
De Laat, J., Feng, W., Freyfer, D, A., Dossier-Berne, F., (2001). “Concentration levels of urea in swimming pool water and reactivity of chlorine with urea”. Water Research, Vol 45, Issue 3, pp1139-1146.
de la Matter, D.; “Swimming Pool Chemistry”
Wojtowicz, J. A., “Effect of Cyanuric Acid on Swimming Pool Maintenance” 2004, Journal of swimming Pool and Spa industry Vol 5, No 1, pp15-19