Embed Size (px)
Citation preview

______ ___ ___ __ W PS2OskPoi-icY RESEARCH WORKING PAPER 208 8
Expropriation of Minority In nine East Asian countries,higher cash-flow rights al e
Shareholders associated with a higher
market valuation and higu-er-
Evidence from East Asia control rights with a Sowervaluation, especially whern
cash-flow rights are low and
Stijn Claessens control rights are high. This
Simteonz Djankov suggests the expropriation of
Josepb P. H. Fan minority shareholders by
Larry H. P. Lang controlling shareholders. Fii
risk of expropriation is the-
chief principal-agent probleryr
for large publicly traded
corporations.
The World Bank
Financial Operations Vice Presidency
Financial Econiomilcs Unit
March 1999
Pub
lic D
iscl
osur
e A
utho
rized
Pub
lic D
iscl
osur
e A
utho
rized
Pub
lic D
iscl
osur
e A
utho
rized
Pub
lic D
iscl
osur
e A
utho
rized
Pub
lic D
iscl
osur
e A
utho
rized
Pub
lic D
iscl
osur
e A
utho
rized
Pub
lic D
iscl
osur
e A
utho
rized
Pub
lic D
iscl
osur
e A
utho
rized

I ICY RESE,ARCH WORKING PAPER 2088
Summary findings
AS many East Asian countries plunged into economic In contrast, deviations of control from cash-flow rightsdecline, the structure of concentrated ownership and -- through the use of dual-class shares, pyramiding, andassociated corporate governance, along with weak cross-holdings - are associated with lower marketcorporate performance, have been blamed for the crisis. values. This is especially true for corporations underThere is little empiricai evidence, however, of the nature famiky control and, in Japan, tinder the control of widelyof ownership structures in East Asia and their held financial institutions.relationship to corporate performance in the typical East They conclude that the risk of expropriation is theAsian environment (where inefficient judicial systems, major principal-agent problem for large corporationls, asand weak property and shiareholder rights are common). suggested by La Porta and colleagues (1999).
Claessens, Djankov, Fan, and Lang examine evidence The degree to which certain ownership structures areof the expropriation of minority shareholders for 2,658 associated with expropriation depends on country-corporations in nine East Asian countries in 1996. They specific circumstances. These may include the quality ofdistinguish control from cash-flow r ights. They also banking systemns, the legal and judicial protection ofdistinguish betveen various rtpes of ultimate owners, individual shareholders, and the degree of financialincluding family, state, widely held corporations, and disclosure required.widely held financial institutions.
Higher cash-flow rights are associated with highermarket values, consistent with Jensen and Meckling(I 976).
IThis paper - a product of the Financial Economics Unit, Financial Operations Vice Presidency -is part of a larger effortin the vice presidency to study corporate performance patterns in East Asia. Copies of the paper are available free from theWorld Bank, 1818 H Street NW, Washington, DC 20433. Please contact Rose Vo, room MCI0-628, telephone 202-473-3722, fax 202-522-2031, Interniet address [email protected]. Policy Research Working Papers are also posted on theWeb at http://www.woridbank.orgihtml/dec/Publications,tWorkpapers/home.html. The authors may be contacted atcclaessens aworldbank.org or sdjankov(gworldbank.org. March 1999. (33 pages)
The Policy Research WYorking Paper Series dissemsinates the findings of wvork in progress to encourage the exchange of ideas aboot
deoeiopment issues. An objective of the series is to get the findings out quickly, even if the presentations are less than fully polished. The
papers carry. the taqmes of the authors end should he cited accordingly. The fiudid;gs, inte;pretations, and conclusions expressed in this
paper are entirely those of the authors. They do not necessarily represent the vieu of the 'World Bank, its Executive Directors, or the
countries they represent.
Produced by the Policy Research Dissemination Center

Expropriation of Minority Shareholders:Evidence from East Asia
Stijn Claessens*, Simeon Djankov*^, Joseph P. H. Fan**, and Larry H. P. Lang***
* World Bank* * Hong Kong University of Science and Technology
*** The University of Chicago
We thank seminar participants at the World Bank, the Federation of Thai Industries in Bangkok, theKorean Development Institute in Seoul, and especially Andrei Shleifer for helpful comments.^ Corresponding author: tel. 202 473 4748, EM:sdjankovgworldbank.org

Expropriation of Minority Shareholders: Evidence from East Asia
Stijn Claessens, Simeon Djankov, Joseph Fan, and Larry Lang
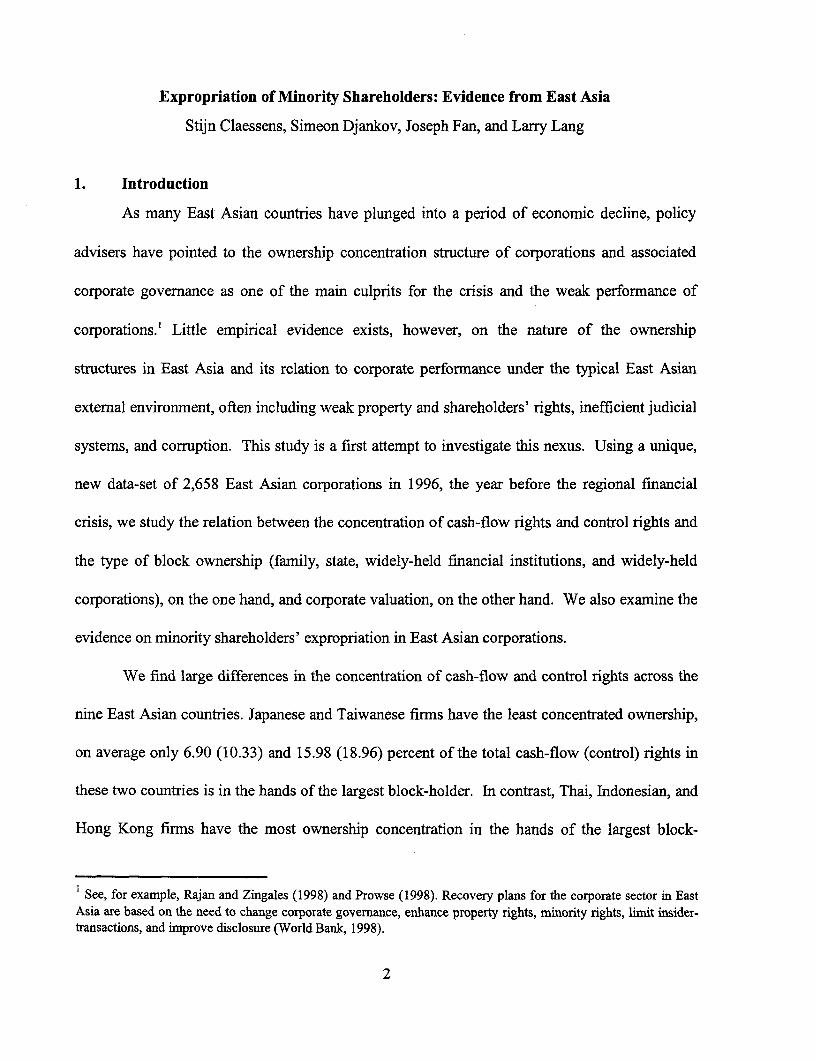
1. Introduction
As many East Asian countries have plunged into a period of economic decline, policy
advisers have pointed to the ownership concentration structure of corporations and associated
corporate governance as one of the main culprits for the crisis and the weak performance of
corporations.! Little empirical evidence exists, however, on the nature of the ownership
structures in East Asia and its relation to corporate perfornance under the typical East Asian
external environment, often including weak property and shareholders' rights, inefficient judicial
systems, and corruption. This study is a first attempt to investigate this nexus. Using a unique,
new data-set of 2,658 East Asian corporations in 1996, the year before the regional financial
crisis, we study the relation between the concentration of cash-flow rights and control rights and
the type of block ownership (family, state, widely-held financial institutions, and widely-held
corporations), on the one hand, and corporate valuation, on the other hand. We also examine the
evidence on minority shareholders' expropriation in East Asian corporations.
We find large differences in the concentration of cash-flow and control rights across the
nine East Asian countries. Japanese and Taiwanese firms have the least concentrated ownership,
on average only 6.90 (10.33) and 15.98 (18.96) percent of the total cash-flow (control) rights in
these two countries is in the hands of the largest block-holder. In contrast, Thai, Indonesian, and
Hong Kong fmns have the most ownership concentration in the hands of the largest block-
I See, for example, Rajan and Zingales (1998) and Prowse (1998). Recovery plans for the corporate sector in EastAsia are based on the need to change corporate governance, enhance property rights, minority rights, limit insider-transactions, and improve disclosure (World Bank, 1998).
2

holder, 32.84 (35.25), 25.61 (33.68), 24.30 (28.08) percent of cash-flow (control) rights
respectively. Financial institutions are the main owners of corporations in Japan, controlling
around 40% of corporations. The state controls more than a quarter of all corporations in
Singapore, while a third of all corporations in the Philippines are controlled by other widely-held
corporations. We find that in Hong Kong, Indonesia, Korea, Malaysia, and Thailand families
have control over the majority of corporations.
In all countries, control is enhanced through the use of pyramid structures, cross-
holdings, and deviations from one-share-one-vote rules. The ratio of cash-flow to control rights
is the smallest in Japan, Indonesia, and Singapore, 0.602, 0.784, and 0.794 respectively. The
least difference between cash-flow and control rights is observed in Thailand, where the ratio
between cash-flow and control rights is 0.941. These findings extend the previous literature,
which has traditionally focused on deviations from one-share-one-vote rules (Wolfenzon, 1999).
We document that high concentration of cash-flow rights in the hands of block-holders is
beneficial for corporate valuation, particularly in the case of widely-held financial institutions.
The concentration of control is shown to be negatively associated with market valuation,
particularly in the case of families and widely-held financial institutions. In contrast, no relation
exists between the concentration of state control and market valuation and between control by
widely-held corporations and market valuation. Adjusting for the level of control, a larger wedge
between cash-flow and control rights is associated with a declining valuation. At the margin, a
10 percentage points increase in the ratio of cash-flow to control rights brings about a 5
percentage points decline in valuation. The results are driven by family-owned corporations
across all East Asian countries, and corporations owned by widely-held financial institutions in
Japan. This finding is consistent with the existing literature on the effect of keiretsu affiliation in
3

Japan (see Weinstein and Yafeh, 1998 for a survey). It also supports the expropriation
hypothesis in Shleifer and Vishny (1997) who argue that "as ownership gets beyond a certain
point, the large owners gain nearly full control and prefer to use firms to generate private benefits
of control that are not shared by minority shareholders" (p.759).
The paper is structured as follows. Section 2 summarizes the existing literature on
ownership structure and corporate valuation. Section 3 describes the data sample and the
construction of the variables. Section 4 studies the effects of ownership concentration and
ownership types on firm valuation and investigates the evidence on small shareholder
expropriation in East Asia. Section 5 concludes.
2. Ownership Structure and Corporate Performance
The research on the topic of ownership structures and corporate valuation dates back
more than sixty years to Berle and Means (1932). They show that diffuse ownership yields
significant power in the hands of managers whose interests do not coincide with the interest of
shareholders. As a result, corporate resources are not used for the maximization of shareholders'
value with diffuse ownership. A more concentrated ownership can consequently lead to better
performance. Jensen and Meckling (1976) develop a theoretical framework to show that
increasing concentration in cash-flow rights is beneficial for corporate valuation. One channel
can be through the reduction in transaction costs in negotiating and enforcing corporate contracts
with various stakeholders, including managers, labor, material suppliers, customers, debt-
holders, and governments. Shleifer and Vishny (1986) argue that large shareholders better
monitor managers, which in turn increases firm value. Shleifer and Vishny (1997) suggest that
the benefits from concentrated ownership may be relatively larger in countries that are generally
4

less developed, where property rights are not well defined and/or protected and enforced by
judicial systems.
Studies for the United States (e.g., Levy, 1983, Lease et al., 1984, DeAngelo and
DeAngelo, 1985, Shleifer and Vishny, 1986, McConnell and Servaes, 1990) indeed find a
positive relation between ownership concentration and corporate valuation. Other US evidence
(Holdemess and Sheehan, 1988; Barclay and Holdemess, 1989) supports the argument that large
shareholders better monitor management and thereby improve firm valuation. This relationship,
while subject to interpretation, suggests that better monitoring and reduced agency costs are
associated with more concentrated ownership.2
There is, however, evidence that concentrated ownership can harm market valuation.
Some studies have found, for example, an inverse U-shaped relationship between ownership by
managers and a firm's valuation and its profitability (Morck, Shleifer and Vishny, 1988). The
inverse-U shaped effects of managerial ownership can be explained by an incentive-
entrenchment tradeoff (Stulz, 1988). Direct managerial ownership is small, however, for most
East Asian corporations and empire building by unaccountable managers cannot account for the
possible negative relationship between ownership concentration and valuation.
Shleifer and Vishny (1997) and La Porta et al. (1999a) focus on another problem
associated with high ownership concentration, the conflict between large and small shareholders.
When large shareholders effectively control corporations, their policies may result in the
2 Other studies (Demsetz, 1983; Demsetz and Lehn, 1985) argue that the relation is spurious. While greaterownership concentration results in stronger incentives to monitor, the expected gain from active monitoring and thecosts of alternative ownership structures vary across finns. If transaction costs inhibiting investors from takingvalue-maximizing positions in firms are low, each firm would have the "right" ownership structure. Specifically,Demsetz and Lehn (1985) argue that distortions in the markets for corporate control and the managerial labormarket increase the control potential of shareholders, which lead to increases in ownership concentration. They
5

expropriation of minority shareholders. The conflicts of interest between large and small
shareholders can be numerous, including controlling shareholders enriching themselves by not
paying out dividends, or transferring profits to other companies they control. Burkart, Gromb,
and Panunzi (1997) provide a theoretical model which suggests that tight control of large
shareholders constitutes an ex ante expropriation threat that reduces managerial initiative and
non-contractible investments. In addition, they show that ownership concentration may conflict
with performnance-based incentive schemes. Wolfenzon (1999) interprets the existence of
pyramiding schemes as a means of expropriation of small shareholders, as it creates a wedge
between the cash-flow and control rights for large block-holders.
Empirical studies on the costs of large block-holders and the means through these costs
arise are few, however. Some studies provide evidence for the United States and other developed
countries of conflicts of interest when control rights of the ultimate owners are significantly in
excess of cash flow rights. Harris and Raviv (1988) document a large number of cases where
control is enhanced through the use of deviations from one-share-one-vote rules, pyramid
structures being the prevalent method. Several empirical studies interpret the large premia that
shares with superior voting rights attract as evidence of significant private benefits of control at
the expense of small shareholders. Bergstrom and Rydqvist (1990) and Barclay and Holdemess
(1989) find some evidence of small shareholder expropriation in Sweden and the United States,
respectively, while Zingales (1994) suggests that small shareholder expropriation is significant in
Italy. In contrast, Malitz (1989) and Slovin and Sushka (1997) find no evidence of small
shareholder expropriation in listed companies in the United States. Shleifer and Vishny (1997)
provide evidence that ownership concentration is positively related to the control potential of firns, among otherfactors. One thus needs to be cognizant of the two-way link between various types of ownership and performance.
6
report cases where Korean chaebols sold their subsidiaries to relatives of chaebol founders at
below-market prices.
Other studies have found that financial institutions which own large stake in corporate
subsidiaries reap private benefits at the expense of the minority shareholders of those
subsidiaries. Weinstein and Yafeh (1998) find that Japanese firms belonging to bank-controlled
keiretsus pay higher interest rates on their liabilities than unaffiliated companies. Similar
behavior was reported for Korea First Bank following the collapse of Hanbo Steel and General
Construction, which had received loans at above-market rates from its creditor-owner. In 1998,
the Korean Financial Supervisory Commission filed lawsuits against the presidents of five other
major Korean banks on charges of illegal loans and breach of trust (Byeon, 1998). Weiss and
Nikitin (1998) report anecdotal evidence from the Czech Republic suggesting that management
companies of large investment funds sold significant ownership packages to related companies
for a fraction of market prices. Several studies on corporate governance in Japan (Aoki, 1990;
Prowse, 1992; Hoshi, Kashyap, and Scharfstein, 1991; Kaplan, 1994) discuss the adverse effects
of keiretsu affiliation on market valuation of firms, and suggest that conflicts of interest between
large and small shareholders, along with economic inefficiencies, may be the reason.
The relative costs and benefits of different ownership structures depend on the difference
between cash-flow and control rights of the major block-holders. Most studies do not, however,
attempt to trace the ownership of each company to its ultimate owners or identify those owners
by type, cash-flow and control stake. The exception is La Porta, Lopez-de-Silanes, and Shleifer
(1998) which documents the ultimate control structure of the largest twenty publicly traded
corporations in 27 rich countries. By tracing control to the ultimate owners of each company,
they find that in the majority of countries relatively few corporations are widely-held. For the
7
four East Asian countries covered in the study, only ownership in the majority of Japanese and
Korean corporations is found to be widely dispersed, with corporations in Hong Kong
predominantly controlled by families, and about half of the sampled companies in Singapore
controlled by the state. They also examine the means through which control is enhanced. They
show that owners extend their resources through the use of pyramiding structures and
management appointments, as well as through frequent cross-ownership and the use, less
frequently, of dual-class shares. Finally, they document that effective control in East Asia can be
achieved with significantly less than an absolute majority share of the stock, as the probability of
being a single controlling owner while holding only 20% of the stock is above 80%.
Following on the methodology developed by La Porta, Lopez-de-Silanes, and Shleifer
(1998), Claessens, Djankov, and Lang (1998) extend the analysis of ultimate control patterns to
about 3,000 publicly traded companies in nine East Asian countries (Hong Kong, Indonesia,
Japan, Korea (South), Malaysia, the Philippines, Singapore, Taiwan and Thailand). They find
large family control in more than half of East Asian corporations. Significant cross-country
differences do exist, however. Corporations in Japan, for example, are generally widely-held,
while corporations in Indonesia and Thailand are mainly family-controlled. State-control is
significant in Indonesia, Korea, Malaysia, Singapore, and Thailand. Smaller firms are more
likely controlled by families, as are older firms. In many countries, control is enhanced through
pyramid structures, and in some countries deviations from one-share-one-vote rules. Separation
of management from ownership control is rare, with management of two-third of firms family-
related to the controlling owner, although managers do not hold much equity themselves.
Given the dominance of concentrated cash-flow and control rights in East Asia, the
primary agency conflict for large corporations is that of restricting expropriation of minority
8

shareholders by the controlling shareholders, rather than that of restricting empire building by
unaccountable managers. The scope for this conflict, and the resulting expropriation, depends on
the wedge between cash-flow and control rights. The East Asian corporations, for which we
have ultimate cash-flow and control information, provide a useful data set to study the evidence
on minority shareholder expropriation.
3. Data Description
A. Cash-Flow versus Control Rights
The analysis is based on newly-assembled data for 2,658 publicly-traded corporations
(including both financial institutions and non-financial institutions) in Hong Kong, Indonesia,
Japan, Korea, Malaysia, the Philippines, Singapore, Taiwan, and Thailand. As our starting point
in the data collection, we use the Worldscope database which generally provides the names and
holdings of large owners. The database has been used in previous studies of corporate ownership
structure (La Porta et al. (1997), Lins and Servaes (1998)). We supplement the data with
information from the Asian Company Handbook 1999, the Japan Company Handbook 1999, the
1997 Annual Reports of the Hong Kong, Jakarta, Seoul, Kuala Lumpur, and Manila Stock
Exchanges, as well as with ownership data from the Korean Fair Trade Commission, the
Securities Exchange of Thailand Companies Handbook, and the Singapore Investment Guide.
We exclude companies which have proxy ownership that cannot be traced to a specific owner. In
all cases, we collect the ownership structure as of December 1996 or the end of the 1996
accounting year. We end up with 2,658 companies for which we can trace the ultimate owners,
and where stock market data are available. Balance sheet and segment data are available for
2,510 of these corporations.
9

Worldscope adjusts the reporting in the income statement and balance sheets of
corporations to make it closer to international accounting standards. While this is generally
straightforward for income statement items, the assets and liabilities numbers include different
categories across the nine East Asian countries. In Indonesia, Japan, Korea, and Thailand,
companies are not required to report intra-group lending, which distorts the leverage ratios.
Similarly, different tax systems distort the reporting of profits. We hence use only stock market
data, sales data net of excise taxes, and capital investment data. The latter two are flow figures
and are not affected by the differences in accounting standards across the nine sample countries.
The database shows consolidated company account data when it is disclosed. Information
on whether the accounts are consolidated is given by Worldscope in a field, which contains
standardized text such as "All subsidiaries are consolidated," "Consolidation for significant
subsidiaries, others are on equity basis," and "No consolidation, cost basis." If a company
changes its consolidation practice, this change is recorded in the data. Of the 2,658 companies
used in the empirical analysis, 505 companies accounting for 19% of the observations do not
report consolidated statements. Indonesia and Thailand have the most such cases as a percentage
of the respective country samples. To test the robustness of our main results, we rerun all
regressions while excluding firms with unconsolidated statements.
Following on La Porta, Lopez-de-Silanes, and Shleifer (1999b), we analyze the control
pattern of companies by studying ultimate shareholdings. In the majority of cases, the principal
shareholders are themselves corporate entities, not-for-profit foundations, or financial
institutions. We then identify their owners, the owners of their owners, etc. We do not
distinguish among individual family members and use the family group as a unit of analysis. We
divide corporations into widely-held and corporations with ultimate owners. A widely-held
10

corporation is a corporation which does not have any owners who have significant control rights.
Ultimate owners are further divided into four categories: families including individuals who have
large stakes, the state, widely-held financial institutions such as banks and insurance companies,
and widely-held corporations.
Our study of expropriation relies on cash-flow rights and control rights. Suppose, for
example, that a family owns 11% of the stock of publicly-traded Firm A, which in turn has 21%
of the stock of Firn B. We would say that the family controls 11% of Firm B-the weakest link
in the chain of voting rights. In contrast, we would say that the family owns about 2% of the
cash flow rights of Firm B, the product of the two ownership stakes along the chain. To make
the distinction between cash-flow and control rights, we document pyramiding structures for
each firm, cross-holdings among firms, and deviations from one-share-one-vote rules.
To better understand the variety of ownership structures that determine the ultimate
control of companies, we provide an example from our data. The example shows some of the
complications in the construction of ultimate ownership and the wealth of data that are necessary
to ensure proper tracing of the ultimate owners in East Asian corporations. Figure 1 shows the
organizational structure of the Lotte group, the tenth largest chaebol in Korea. The Lotte group is
controlled by the Kyuk Ho Shin family which owns 34% of the voting rights in Lotte Japan, and
100% of the voting rights in the Samnarn Foundation, which are in turn the two largest
shareholders of the companies affiliated with the chaebol. Following the definition of ultimate
ownership, we establish that the Dabnid Ham corporation (lower right corner of Figure 1) is
controlled by the Kyuk Ho Shin family at the 24% level. This is because the Samnam Foundation
controls 21% of the votes in Daehong Communications, which in turn controls 24% of the votes
11

in Dabnid Ham. In addition, Lotte Japan controls 24% of Lotteria, which controls 13% of the
votes in Daehong Communications. The latter ownership chain adds to the level of ultimate
control since the weakest link in the chain now becomes Deahong which has 24% voting rights
in Dabnid Ham. The control of Dabnid Ham by the Kyuk Ho Shin family is ensured with only
4% of the cash-flow rights in the company, through the use of both pyramiding (Samnam
Foundation controls Daehong which in turn controls Dabnid Ham) and cross-holding (the
additional votes that Lotteria has in Daehong).
We also study the ultimate ownership structure of Pusan Finance. The Kyuk Ho Shin
family has a 39% direct control of Pusan Finance. In addition, Lotte Japan has a 27% control of
Lotte Industrial, which in turn has a significant stake (12%, not reported in the figure) in Pusan
Finance. Surmming up the two chains of ultimate ownership, the controlling family has 51% of
the control rights in Pusan Finance, while holding 46% of the cash-flow rights.
Figure 1: The Lotte Group(Immediate Control/Ultimate Cash-Flow Rights)
K Yyuk Ho Shin Famnily|
34/34 100/tOO
La Jao.3 ----.| Samnam Foun.dation
41113 2v 32129 23t23 26/26 19(14 19115 71WM 17/l1 39139 329 211
27/9 14/5 16/5 27/9 20/6112/4 2 27n' 3116 |2V5 1 /5 23/S 26/5
42/4 22/2
Honn Ch-ni-lse K..na DiOibw,on
12

The two examples from Figure I show that ultimate cash-flow and control rights are
described both by their level, and by the type of shareholder. Table 1 reports descriptive
statistics on the concentration of ultimate cash-flow and control rights of East Asian corporations
in the hands of the largest controlling holder. Thai corporations display the most concentrated
cash-flow rights, 32.84% on average, followed by Indonesian companies, with 25.61%, and
Hong Kong companies, with 24.30%. Japanese and Korean corporations have the least
concentration of cash-flow rights, 6.90% and 13.96% respectively. A quarter of Thai companies
have more than 40% of the cash-flow rights in the hands of the largest block-holder, while a
quarter of Japanese companies have only 2% of the cash-flow rights in the hands of the largest
block-holder.
The concentration of control rights in the hands of the largest block-holder is similar to
the concentration of cash-flow rights, with Thai and Indonesian companies having the highest
concentration, 35.25% and 33.68% respectively, followed by Malaysian and Hong Kong
companies, 28.32% and 28.08% respectively. The least concentration of control rights is
documented in Japan, Korea, and Taiwan, 10.33%, 17.78%, and 18.96% respectively (Panel B).
Finally, Panel C shows the ratio of cash-flow to control rights, which is lowest in Japan,
Indonesia, and Singapore, and highest in the Philippines and Thailand.
The differences in the ratio of cash-flow to control rights become easier to explain if we
consider the channels through which such deviations are made possible (Table 2). Deviations
from one-share-one-vote rules are rare across East Asian countries. On average, control of 20%
of the vote can be received with 19.7% of the cash-flow rights. The variations across countries
are not significant. Pyramiding is more frequently used to de-couple cash-flow and control
rights. In particular, two-thirds of Indonesian firns in our sample are involved in pyramiding, as
13

are approximately half of the firm in the sample in Korea, the Philippines, Singapore, and
Taiwan. The smallest share of firms involved in pyramiding structures is recorded in Thailand.
Finally, 10.7% of the finns in our data have holdings in other firms. This percentage is highest
for firms in Singapore, Malaysia, and Japan, and lowest for Indonesian and Thai firms.
There are large differences across countries in the distribution of cash-flow and control
rights across ownership categories (Table 3). Of the 2,611 companies which have at least one
owner controlling 5% of the vote, 1,179 companies, or 45% of the sample, have a family as the
largest block-holder; 973, or 37% of the sample, companies are controlled by financial
institutions; and 275 companies, or 13% of the total, have a widely-held corporation as the
largest block-holders. The remaining companies are controlled by the state.
B. Measuring performance
We construct an industry-adjusted market valuation measure, following the approach of
Berger and Ofek (1995) and extended by Lins and Servaes (1998) and Fauver, Houston, and
Naranjo (1998). This approach defines the excess value (EXV) of a firm as the ratio of the firm's
actual value to its imputed value.3 The actual value is measured by market capitalization, the
market value of common equity plus the book value of debt. To calculate the imputed value, we
first construct industry median market-to-sales ratio for each two-digit SIC code industry using
only the single-segment firms in each country. The market-to-sales ratio is the market
capitalization divided by firm sales. We then multiply the level of sales in each segment of a
3 The excess value variable is often used to capture diversification performance. We consider it also appropriate touse the excess value as a market performance measure because it adjusts (by construction) for industry differencesin performance.
14

finn by its corresponding industry median market-to-sales ratio. The imputed value of the firm
is obtained by summing the multiples across all of its segments.
The financial and segment data of the Worldscope database allow the computation of the
market performance measure. Similar to the ownership data, historical segment data for many of
the firms are, however, missing from Worldscope. In such cases, we collected the missing
segment data from various issues of the Asian Company Handbook and the Japan Company
Handbook. All financial data are converted to US dollars using end-year exchange rates. We
exclude a small number of firms from the sample because they do not report segment sales. For
the remaining firms with complete segment data, we determine the industrial sector(s) to which
they belong and group a firm's reported segments according to the two-digit Standard Industry
Classification (SIC) system.4
Table 3 provides mean and median statistics of EXV for the whole sample and sub-
groups by types of ownership. By construction the median of EXV is (about) 1. We find that a
higher degree of cash-flow rights is associated with somewhat higher mean and median EXV for
all type of owners combined (Panel A, column 2). The relationship does appear to taper off,
however, as the mean and median EXV for the fourth quartile are only marginally higher than
those for the third quartile (1.237 and 1.021 versus 1.231 and 1.012). Splitting the sample by the
type of owners, we find that for family ownership the relationship between cash-flow rights and
4 This procedure involves two steps. First, we assign the four-digit SIC codes reported by Worldscope toappropriate segments. In the majority of cases we are able to obtain one-to-one matches between SIC codes andsegments. For some companies, the number of reported SIC codes is not the same as the number of reportedsegments. If a segment can not be associated with a reported SIC code, we determine the segment's SIC codeaccording to its business description. If a segment is associated with multiple SIC codes, it is broken down equallyso that each segment is associated with one SIC code. In the second step, we redefine segments at the two-digit SIClevel and aggregate segment sales to that level. Second, we classify finms as single-segment if at least 90 percent oftheir total sales are derived from one two-digit SIC segment. Firms are classified as multi-segment if they operate in
15

EXV is positive, until the fourth quartile where the mean EXV is less than that of the third
quartile. For ownership by widely-held financial institutions the relationship between cash-flow
rights and EXV is positive throughout, while for ownership by widely-held corporations the
relationship appears to flatten out for the second quartile and beyond. State cash-flow rights and
mean and median EXV are not related in any obvious way.
The raw statistics for control rights suggest that there are some negative costs of block-
holder control as the mean and median EXV are somewhat lower for higher level of control by
all types of owners, but the relationship is not very strong. It is clearer when breaking down by
the types of ownership: the costs of high control rights are the most severe for the firns
controlled by families, particularly so at higher levels of control. For the fourth quartile of
control by families (panel B), for example, the median EXV is only 0.851, the lowest in this
panel. For control rights by widely-held financial institutions, there also appears to be decline in
median and mean EXV at the third quartile, and the median EXV is only 0.876. For widely-held
corporations and the state, the relationship between EXV and the degree of with control rights
are not obvious from these raw statistics.
Since cash-flow rights and control rights are correlated, it not obvious what the net effect
of increases in both cash-flow and control rights on EXV might be. We therefore also calculate
the mean and median EXV for different quartiles of the ratio of cash-flow to control rights (Panel
C). We find for all types of ownership that the mean and median are the lowest for the first
quartile, 0.927 and 0.793 respectively, and monotonically increasing with the ratio. And for the
first quartile of the ratio of cash to control rights for families, the median EXV is only 0.652, the
more than one two-digit SIC code industries and none of their two-digit SIC code segments accounts for more than90 percent of total fimn sales.
16

lowest in this panel. For widely-held financial institutions, low ratios are also associated with
low values of EXV. This is not the case for widely-held corporations and the state where there
is no obvious pattern between EXV and the ratio.
These statistics reported in Table 3 do not control for other firm-specific or country-
specific factors. Establishing the nature of the relation between ultimate ownership and
performance requires the use of multivariate regression analysis to which we turn in the next
section.
4. Evidence of expropriation
We start by regressing market performance (EXV) on cash-flow and control rights for all
type of ownership combined, focusing on the pooled (across countries) results and using linear
relations. We employ the following linear regression model:
(1) EXV = Intercept + bl*CASH + b2*CONTROL + b3*(CASH/CONTROL) +
b4*(CASH/CONTROL)*HICONTROL + b5*CES + (Country dummies) + u
where EXV is excess value, CASH is cash-flow rights of the largest block-holder, CONTROL is
the control rights of the largest block-holder, CASH/CONTROL is the ratio of cash-flow to
control rights of the largest block-holder, and HICONTROL is a dummy variable which is equal
to 1 if the control rights for a particular firm are above the median for the particular ownership
type, 0 otherwise. CES is the capital expenditures over sales ratio, and country dummies are
used to control for the effects of the economic and institutional environment in each country. We
employ the ordinary least-square (OLS) method in the regression analysis. The regressions are
17

performed on the full sample (Table 4) as well as country-by-country, but the latter are not
reported.5
We find that market valuation is positively associated with higher investment, as
measured by capital expenditures over sales (CES), consistent with the findings in Lang and
Stulz (1994). In other regressions, we also included company size (the natural logarithm of total
assets) and operational performance (net operational revenues) as these have been found to be
significant in other studies. Neither of these variables was, however, statistically significant in
explaining the cross-sectional variation in market valuation in this sample. We consequently
drop them from the sample.
In terms of the effects of ownership structures, we find that higher cash-flow rights by the
largest control block-holder is positively related to excess valuation (Table 4, column 1)
consistent with the raw statistics in Table 3. The degree of control rights by the largest block-
holder is, however, negatively related to excess valuation (column 2), suggesting that higher
concentration of control rights leads to expropriation of minority shareholders. This regression
does not show, however, the overall effects of combined cash-flow ownership and control rights.
Since the two are highly positively correlated, univariate results alone are not sufficient. When
considering the degree of cash-flow rights relative to control rights, regressions results (colurnn
3) show that the negative effect of control rights is maintained as is the positive effect of cash-
flow rights. This confirms the results of Table 3 that it is the deviations of control from cash-
flow rights which are associated with expropriation and which lead to the negative effect of
certain ownership structure on market valuation.
sWe also run the regressions while excluding all companies which report unconsolidated statements. Thequalitative results do not change.
18

To further test this hypothesis, we investigate the effect of high control rights, with the
argument that a high level of control rights provides more opportunity for the controlling block-
holder to expropriate. We find (column 4) that there is an additional effect of high (above
median) control rights relative to cash-flow rights as the coefficient on the interactive variable
CASH/CONTROL*HICONTROL is significantly positive. As the coefficient on the
CASH/CONTROL variable has not changed much, this negative effect on valuation of high
control relative to cash-flow rights is in addition to the general negative effect on control relative
to cash-flow rights on market values. These findings may be interpreted to suggest that cash-
flow ownership is associated with higher market valuation, and that concentration of control
rights, especially at high levels relative to low cash-flow rights, is associated with increasing
expropriation of small shareholders.
East Asian corporations are often characterized as family-controlled, which gives rise to
the hypothesis that family ownership leads to the finding of expropriation as these owners have
the most scope for expropriation. We therefore study separately the effects of cash-flow and
control rights for corporations where families are the largest control block-holder (Table 5). The
number of corporations for which family the largest block-holder is 1,158, or about half of our
sample. We find that the effect of family ownership concentration are qualitative very similar to
those found for all classes of ownership combined. As before, we find evidence of a positive
impact of cash-flow rights, but negative impact of control rights, also relative to cash-flow rights
(columns 1-3). Especially at high (above median) levels of family control relative to cash-flow
rights market values are lower (column 4). As most of the coefficients on family are larger in
magnitude than the coefficients for the same variable in case of all ownership classes combined,
19
especially the cash-flow rights relative to control rights variable, the results can be interpreted as
evidence that the small shareholder expropriation occurs to a large extent by families.
We next explain the existence of a valuation discount for the other types of control
ownership. Tables 6 and 7 investigate the effects on valuation of firms for cash-flow and control
ownership for those corporations where respectively widely-held financial institutions, the state
and widely-held corporations are the largest controlling block-holders. Since country-by-country
regressions indicate some important differences for financial institutions in the case of Japan, we
also include in the regression a separate dummy for ownership by widely-held financial
institutions in Japan versus other countries.
We find that cash-flow ownership by financial institutions is positively associated with
corporate valuation and that control rights are negative associated with valuations (Table 6,
columns 1 and 2). The magnitude of the coefficient on the control rights is somewhat less than
that for family control, but higher than control for all classes of ownership. We find further
evidence of expropriation as the coefficient on CASH/CONTROL is positive and significant, and
as the coefficient for the interactive variable for high control stakes is also positive and
significant. The magnitude of the coefficient on the CASH/CONTROL variable is less than for
family control as well as for control for all classes of ownership, suggesting expropriation by
financial institutions is less than that by families. It appears that the negative effect of control by
financial institutions arises from the role of financial institutions in Japan as the interactive
dummy with CASH/CONTROL is positive and significant for Japan, but is not significant for
the other countries (column 5). This finding supports the results in Kang and Stulz (1998),
which show that Japanese firms whose debt had a high fraction of bank loans in 1989 performed
worse from 1990 to 1993, possibly as Japanese financial institutions extract a rent from their
20

borrowers. Morck and Nakamura (1999) also find that Japanese financial institutions do not
provide good corporate governance.
In contrast to overall, family and financial institutional control, the association between
state ownership and market valuation is insignificant, regardless of whether cash-flow or control
rights or the ratio between the two are used as independent variables (Table 7, columns 1-3).
This suggests on one hand that state cash-flow ownership has not effect on market valuation, but
on the other hand that state control does not have negative effects either. It could be that the
usual positive impact resulting from ownership concentration and the negative impact of state
interference on enterprise performance offset each other. It could also be that the state chooses
its ownership and might have stakes in relatively valuable enterprises, while at the same time
exercising poor corporate governance.
Results similar to state ownership obtain for ownership by widely-held corporations
(Table 7, columns 4-6), where most ownership variables are not significant. There is some
evidence that low cash-flow rights relative to control rights is associated with evidence of
expropriation (last column). This could be due to the ownership structures in some countries,
particularly Japan and Korea where cross-ownership is relatively large. Country-by-country
regressions do not confirm this, however, as the results in expropriation remain if these two
countries are excluded from the data set.6
6 Taiwan is the only country where we do not find evidence of expropriation by any type of owner.
21

6. Conclusions
This paper documents the relation between ultimate ownership and market valuation,
differentiating between control from cash-flow rights. We find that higher cash-flow rights are
associated with higher market valuation, but higher control rights are associated with lower
market valuation, especially when cash-flow rights are low and control rights are high. This
suggests expropriation of minority shareholders by controlling shareholders. Using regressions
for individual ownership classes, we conclude that family control is an important factor behind
the negative relation between control rights and market valuation. In contrast, we find no
evidence of expropriation for state control and control by widely-held corporations. Finally, the
relation between control by financial institutions and market valuation is as for families in the
case of Japan where high control by financial institutions has a negative relationship with market
valuation. We conclude that the risk of expropriation is indeed the major principal-agent problem
for large publicly-traded corporations, as suggested by La Porta et al. (1997).
It is likely that the degree to which certain ownership structures are associated with
evidence of expropriation depends on country-specific circumstances. These may include the
quality of banking systems, the legal and judicial protection of individual shareholders, and the
degree of financial disclosure required. The exact magnitude to which these institutional
variables affect the degree of expropriation is an issue of important policy relevance and of
potential future research.
22

References
Aoki, Masahiko, 1990, "Toward an Economic Model of the Japanese Firm, " Journal of
Economic Literature, 28: 1-27.
Asian Company Handbook 1999. 1998. Toyo Keizai Shinposha, Tokyo, Japan, Winter Edition.
Barclay, Michael and Clifford Holderness, 1989, "Private Benefits from Control of Public
Corporations," Journal of Financial Economics, 25: 371-95.
Bergstrom, Clas and Kristian Rydqvist, 1990, "Ownership of Equity in Dual-Class Firms,"
Journal of Banking and Finance, 14: 255-269.
Berle, Adolf and Gardiner Means, 1932, The Modern Corporation and Private Property, New
York, MacMillan.
Berger, Philip G. and Eli Ofek, 1995, "Diversification's Effect on Firm Value," Journal of
Financial Economics, 37, 39-65.
Burkart, Mike, Denis Gromb, and Fausto Panunzi, 1997, "Large Shareholders, Monitoring, and
the Value of the Firm," Quarterly Journal of Economics, 112: 693-728.
Byeon, Yangho, 1998, "Improved Corporate Governance in Korea," Ministry of Finance and
Economy, Seoul, mimeo.
Campbell, J., 1996, "Understanding Risk and Return", Journal of Political Economy, 104,298-
345.
Claessens, S., S. Djankov, and L. Lang, 1998, "Who Controls East Asian Corporations", World
Bank, Discussion Paper 2054.
23

Demsetz, Harold and Kenneth Lehn, 1985, The Structure of Ownership: Causes and
Consequences, Journal of Political Economy, 93: 1155-77.
Demsetz, Harold, 1983, Corporate Control, Insider Trading, and Rates of Return, American
Economic Review, 86: 313-316.
Denis, David, Diane Denis, and Atulya Sarin, 1997, "Agency Problems, Equity Ownership, and
Corporate Diversification," Journal of Finance, 52: 135-160.
Fauver, L., J. Houston and A. Naranjo, 1998, "Capital Market Development, Legal Systems and
the Value of Corporate Diversification: A Cross-Country Analysis," Mimeo, University
of Florida.
Harris, Milton and Artur Raviv, 1988, "Corporate Governance: Voting Rights and Majority
Rules," Journal of Financial Economics, 20: 203-235.
Holderness, C. and D. Sheehan, 1988, "The role of majority shareholders in publicly held
companies," Journal of Financial Economics, 20: 317-346.
Hoshi, Takeo, David Scharfstein, and Anil Hashyap, 1991, "The Role of Banks in Reducing the
Cost of Financial Distress in Japan", Journal of Financial Economics 27: 125-160.
Japan Company Handbook 1999. 1998. Toyo Keizai Shanposha, Tokyo, Japan, Winter Edition.
Jensen, Michael, and William Meckling, 1976, "Theory of the Firm: Managerial Behavior,
Agency Costs, and Ownership Structure," Journal of Financial Economics, 11: 5-50.
Kaplan, Steven, 1994, "Top Executive Rewards and Firm Performance: A Comparison of Japan
and the United States," Journal of Political Economy, 102: 510-546.
24

La Porta, Rafael, Florencio Lopez-de-Silanes, Andrei Shleifer, and Robert W. Vishny, 1997,
"Legal Determinants of External Finance," Journal of Finance, 52: 1131-1150.
La Porta, Rafael, Florencio Lopez-de-Silanes, Andrei Shleifer, and Robert W. Vishny, 1999a,
"Law and Finance," Journal of Political Economy, forthcoming.
La Porta, Rafael, Florencio Lopez-de-Silanes, and Andrei Shleifer, 1999b, "Corporate Ownership
around the World," Journal of Finance, forthcoming.
Lang, Larry H.P. and Rene M. Stulz, 1994, "Tobin's q, Corporate Diversification, and Firm
Performance," Journal of Political Economy, 102: 1248-1280.
Lins, K. and H. Servaes, 1998, "Is Corporate Diversification Beneficial in Emerging Markets?"
Working Paper, University of North Carolina.
Malitz, Ileen, 1989, "A Re-Examination of the Wealth Expropriation Hypothesis: The Case of
Captive Finance Subsidiaries," Journal of Finance, 46: 1039-1047.
McConnell, John and Henri Servaes, 1990, "Additional Evidence on Equity Ownership and
Corporate Value," Journal of Financial Economics, 27: 595-612.
Morck, R., A. Shleifer and R. Vishny, 1988, "Management Ownership and Market Valuation: An
Empirical Analysis," Journal of Financial Economics, 20: 293-315.
Prowse, Stephen, 1992, "The Structure of Corporate Ownership in Japan," Journal of Finance,
47: 1121-1140.
25

Prowse, Stephen, 1998, "Corporate Governance: Emerging Issues and Lessons from East Asia,"
World Bank, mimeo.
Rajan, Ranghuram and Luigi Zingales, 1998, "Which Capitalism? Lessons from the East Asian
Crisis," Journal of Applied Corporate Finance, forthcoming.
Shleifer, Andrei and Robert Vishny, 1986, "Large Shareholders and Corporate Control," Journal
of Political Economy, 94: 461-488.
Shleifer, Andrei and Robert Vishny, 1997. "A survey of corporate governance," Journal of
Finance, 52: 737-783.
Suehiro, Akira. 1993. "Family Business Reassessed: Corporate Structure and Late-Starting
Industrialization in Thailand," Developing Economies, 31: 378-407.
Slovin, Myron, and Marie Sushka, 1997, "The Implications of Equity Issuance Decisions within
a Parent-Subsidiary Governance Structures," Journal of Finance, 52: 841-857.
Weinstein, David and Yishay Yafeh, 1998, "On the Costs of a Bank-Centered Financial System,"
Journal of Finance, 53: 635-672.
Weiss, Andrew and Nikolay Nikitin, 1998, "Corporate Governance in the Czech Republic,"
Boston University, mimeo.
Wolfenzon, Daniel, 1999, "A Theory of Pyramidal Structures," Harvard University, mimeo,
February.
World Bank, 1998, The Road to Recovery: East Asia After the Crisis, Oxford University Press.
26

Table 1: Concentration of Cash-Flow Rights and Ultimate Controlin East Asian Corporations (Largest Control Holder)
The newly-assembled data for 2,658 publicly-traded corporations (including both financial institutions and non-financial institutions) are collected from Worldscope, the Asian Company Handbook 1999 (1998), the JapanCompany Handbook 1999 (1998), the 1997 Annual Reports of the Hong Kong, Jakarta, Seoul, Kuala Lumpur, andManila Stock Exchanges, as well as with ownership data from the Korean Fair Trade Commission, the SecuritiesExchange of Thailand Companies Handbook (1998), the Singapore Investment Guide (1998), and IFR Handbookof World Stock and Commodity Exchanges (1997). In all cases, the data are as of December 1996 or the end of the1996 accounting year.
A. Cash-Flow RightsCountry Number of Mean Standard Median I st Quartile 3rd Quartile
Corporations DeviationHongKong 330 24.30 11.43 18.67 17.43 29.68Indonesia 178 25.61 12.54 24.00 16.00 34.00
Japan 1160 6.90 8.51 4.00 2.00 10.00Korea 214 13.96 9.36 10.10 8.29 18.57Malaysia 238 23.89 11.68 19.68 14.00 30.00Philippines 99 21.34 11.52 19.22 10.00 28.64Singapore 212 20.19 10.82 20.00 13.27 29.66
Taiwan 92 15.98 8.76 14.42 10.00 19.27Thailand 135 32.84 13.51 30.00 20.00 40.00
East Asia 2,658 15.70 13.44 12.00 5.06 22.00
B. Ultimate Control RightsCountry Number of Mean Standard Median _S Quartile 3rd Quartile
Corporations DeviationHong Kong 330 28.08 11.73 20.00 20.00 40.00Indonesia 178 33.68 11.93 30.00 27.52 40.27
Japan 1160 10.33 7.98 10.00 5.00 10.00
Korea 214 17.78 10.74 20.00 10.01 20.08
Malaysia 238 28.32 11.42 30.00 20.00 30.42
Philippines 99 24.36 11.58 20.00 20.00 30.00
Singapore 212 27.52 11.12 30.00 20.00 40.00
Taiwan 92 18.96 8.57 20.00 10.00 20.00
Thailand 135 35.25 13.36 40.00 29.90 50.00
EastAsia 2,658 19.77 13.65 20.00 10.24 30.00
C. Ratio of Cash-Flow to Ultimate Control RightsCountry Number of Mean Standard Median Ist Quartile 3rd Quartile
Corporations DeviationHong Kong 330 0.882 0.214 1.000 0.800 1.000Indonesia 178 0.784 0.241 0.858 0.630 1.000Japan 1117 0.602 0.376 0.600 0.200 1.000
Korea 211 0.858 0.229 1.000 0.700 1.000
Malaysia 238 0.853 0.215 1.000 0.733 1.000
Philippines 99 0.908 0.201 1.000 1.000 1.000
Singapore 211 0.794 0.211 0.800 0.600 1.000
Taiwan 92 0.832 0.198 0.975 0.700 1.000
Thailand 135 0.941 0.164 1.000 1.000 1.000
East Asia 2,611 0.746 0.321 1.000 0.450 1.000
27

Table 2: Methods Used for Enhancing Control(full samples, percentage of total)
Deviations from One-Share-One-Vote is the average share of cash-flow rights necessary to have 20% control rightsin a corporation. Pyramids with Ultimate owners (when companies are not widely-held) equals 1 if the controllingowner exercises control through using at least one publicly-traded company, 0 otherwise; Cross-Holdings equals 1 ifthe company has a controlling shareholder and owns any amount of its controlling shareholder or another companyin her chain of control, 0 otherwise. All data are for 1996.
Country Number of Deviations from One- Pyrarnids with Cross HoldingsCorporations Share-One-Vote Ultimate Owners
HongKong 330 18.8 25.1 9.3Indonesia 178 19.2 66.9 1.3Japan 1160 19.9 36.2 11.8Korea 214 19.5 45.1 9.9Malaysia 238 18.1 39.3 14.9The Philippines 99 18.9 41.8 7.3Singapore 212 19.9 55.3 15.4Taiwan 92 19.6 50.8 8.4Thailand 135 19.2 12.1 0.9East Asia Nine 2,658 19.7 38.9 10.7
28

Table 3: Concentration of Cash-Flow Rights and Ultimate Controlin East Asian Corporations (Largest Control Holder, Mean, Median)
The newly-assembled data for 2,658 publicly-traded corporations (including both financial institutions and non-financial institutions) are collected from Worldscope, the Asian Company Handbook 1999 (1998), the JapanCompany Handbook 1999 (1998), the 1997 Annual Reports of the Hong Kong, Jakarta, Seoul, Kuala Lumpur, andManila Stock Exchanges, as well as with ownership data from the Korean Fair Trade Conmmission, the SecuritiesExchange of Thailand Companies Handbook (1998), the Singapore Investment Guide (1998), and IFR Handbookof World Stock and Commodity Exchanges (1997). In all cases, the data are as of December 1996 or the end of the1996 accounting year. 47 companies where no owner controlled 5% or more of the shares were excluded.
A. Cash-Flow RightsQuartile Full Sample Family Financial Institution Corporations The state
CashFlow EXV CashFlow EXV CashFlow EXV CashFlow EXV CashFlow EXV
Observations 2,611 1,179 973 275 184
1st 2.162 1.062 9.086 1.052 0.861 0.885 9.609 1.189 7.898 1.4862.000 0.912 10.000 0.892 1.000 0.809 10.000 1.014 9.000 1.027
2nd 7.935 1.212 18.049 1.165 2.757 1.082 20.000 1.403 15.439 1.2478.000 1.006 20.000 0.992 3.000 0.921 20.000 1.137 16.000 1.001
3rd 18.319 1.231 23.364 1.319 4.759 1.211 29.768 1.319 23.957 1.17820.000 1.012 22.000 0.997 5.000 1.051 30.000 1.173 22.500 0.877
4th 35.134 1.237 37.469 1.127 12.690 1.330 45.362 1.382 44.516 1.58630.000 1.021 37.500 0.998 10.000 1.103 50.000 1.055 50.000 1.386
All 16.165 1.181 21.997 1.165 5.318 1.128 26.172 1.317 22.952 1.37412.000 0.991 20.000 0.973 4.000 0.992 20.000 1.056 20.000 1.016
B. Control RightsQuartile Full Sample Family Financial Institution Corporations The state
Control EXV Control EXV Control EXV Control EXV Control EXV
Observations 2,611 1,179 973 275 184jst 5.532 1.212 13.942 1.254 4.917 1.173 11.447 1.242 8.377 1.488
5.000 1.026 10.000 1.004 5.000 1.046 10.000 1.058 10.000 1.0262nd 12.178 1.173 20.000 1.255 5.929 1.174 20.000 1.386 19.352 1.187
10.000 0.984 20.000 0.975 5.000 1.012 20.000 1.138 20.000 0.8763 rd 22.315 1.215 29.963 1.199 10.000 1.038 31.305 1.326 27.609 1.298
20.000 0.995 30.000 0.983 10.000 0.876 30.000 1.088 30.000 0.9514 th 39.084 1.145 43.371 0.957 16.419 1.124 46.096 1.298 46.514 1.523
40.000 0.941 40.000 0.851 10.000 0.978 50.000 1.012 50.000 1.284All 20.134 1.181 26.796 1.165 9.365 1.128 27.166 1.317 25.463 1.374
20.000 0.991 20.000 0.973 10.000 0.992 20.000 1.056 20.000 1.016
C.. Ratio of Cash-Flow to Control RightsQuartile Full Sample Farnily Financial Institution Corporations The state
Ratio EXV Ratio EXV Ratio EXV Ratio EXV Ratio EXVObservations 2,611 1,179 973 275 184
1st 0.255 0.927 0.484 0.911 0.129 0.839 0.826 1.178 0.641 1.4420.208 0.793 0.500 0.652 0.194 0.799 1.000 0.983 0.690 0.948
2nd 0.731 1.198 0.869 1.195 0.318 1.062 1.000 1.420 0.965 1.2750.733 1.011 0.850 0.995 0.300 0.876 1.000 1.054 1.000 1.018
3rd 0.984 1.282 1.000 1.254 0.735 1.295 1.000 1.380 1.000 1.0771.000 1.026 1.000 1.019 0.750 1.137 1.000 1.173 1.000 0.870
4th 1.000 1.316 1.000 1.302 1.000 1.312 1.000 1.287 1.000 1.7031.000 1.048 1.000 1.044 1.000 1.086 1.000 1.098 1.000 1.499
All 0.746 1.181 0.745 1.165 0.544 1.128 0.957 1.317 0.901 1.3741.000 0.991 1.000 0.973 0.400 0.992 1.000 1.056 1.000 1.016
29

Table 4: Cash-Flow Rights, Control Rights, and Corporate Valuation
This table presents the regression results of the relationship between excess valuation (EXV) and the concentrationof cash-flow and control rights. The independent variables include the level of cash-flow rights (CASH), the levelof control rights (CONTROL), the ratio of cash flow to control rights (CASH/CONTROL), and an interaction termbetween the ratio of cash-flow to control rights and a dummy for high control (HICONTROL), where the dummytakes the value of 1 if control by the largest block holder is above the median control across the full sample. Controlvariables include total capital expenditures over sales (CES) and country dunmmies (Thailand is the numeraire). Theregressions are performed on the full sample using the ordinary least-square method. All data are for 1996.Companies which do not have a block-holder with at least 5% of the vote or which do not report capitalexpenditures are excluded.
Explanatory Variable EXV EXV EXV EXV
Intercept 1.0285*** 1.3689*** 0.8747*** 0.9343***10.6844 13.9493 7.2723 7.0876
CASH 0.4652***2.4721
CONTROL -0.5004*** -0.5793*** -0.8122***-2.6597 -3.1677 -3.2494
CASH/CONTROL 0.5549*** 0.5284***8.5211 7.4781
(CASH/CONTROL)*HICONTROL 0.1728*1.8983
CES 0.0016*** 0.0014*** 0.0014*** 0.0014***3.1104 2.7995 3.0124 2.9396
Hong Kong 0.1435 0.0647 0.0917 0.10821.5047 0.6942 1.1241 1.1786
Indonesia -0.0604 0.0183 0.0452 0.0617-0.6857 0.1954 1.1587 1.2734
Japan 0.1177 0.1358 0.0358 0.03101.1942 1.4157 0.8574 0.6877
Korea 0.1648 -0.0192 -0.0179 -0.02851.4251 -0.1626 -0.1642 -0.2543
Malaysia -0.0162 -0.0634 -0.0207 -0.0164-0.1748 -0.6857 -0.2854 -0.1811
Philippines 0.1642 0.0584 0.0687 0.07541.5872 0.8758 0.6681 0.7293
Singapore 0.0170 -0.0760 -0.0204 0.00810.1596 -0.9865 -0.3987 0.0752
Taiwan 0.2019** 0.0356* 0.0452** 0.06382.1405 1.8492 1.9847 1.6589
Number of Observations 2,510 2,510 2,510 2,510Adjusted R2 0.0134 0.0127 0.0364 0.0385
8, **, and $** represent significance at the 10, 5, and 1 percent level respectively.
30

Table 5: Cash-Flow Rights, Control Rights, and Corporate Valuation(Ownership by Families)
This table presents the regression results of the relationship between excess valuation (EXV) and the concentrationof cash-flow and control rights. The independent variables include the level of cash-flow rights (CASH), the levelof control rights (CONTROL), the ratio of cash flow to control rights (CASH/CONTROL), and an interaction termbetween the ratio of cash-flow to control rights and a dununy for high control (HICONTROL), where the dummytakes the value of 1 if control by the largest block holder is above the median control across the full sample. Controlvariables include total capital expenditures over sales (CES) and country dummies (Thailand is the numeraire). Theregressions are performed on the full sample using the ordinary least-square method. All data are for 1996.Companies which do not have a block-holder with at least 5% of the vote or which do not report capitalexpenditures are excluded.
Explanatory Variable EXV EXV EXV EXV
Intercept 1.0779*** 1.5101*** 0.7695*** 0.9036***9.7859 13.4586 5.1785 5.9091
CASH 1.03170.4528
CONTROL -1.0931*** -0.8531*** -0.9255***-5.0523 -3.9843 -5.3375
CASH/CONTROL 0.7107*** 0.4854***6.9802 3.5362
(CASHICONTROL)*HICONTROL 0.2743**2.4308
CES 0.0034** 0.0035** 0.0035** 0.0034**2.1491 2.2049 2.1985 2.1857
Hong Kong 0.1086 0.0907 0.0813 0.07971.0685 0.8451 0.8488 0.4057
Indonesia 0.0353 -0.0113 0.1314 0.11920.8754 -0.1127 1.3489 1.2264
Japan 0.3167** 0.3297 0.2253 0.20032.3542 1.4613 1.0501 0.9564
Korea 0.1851 -0.0124 -0.0874 -0.08351.2034 -0.4587 -0.5853 -0.5624
Malaysia -0.0194 -0.1149 -0.0261 -0.0568-0.4085 -1.1685 -0.5248 -0.6021
Philippines 0.0742 -0.0664 0.0102 -0.01620.5563 -0.5241 0.0824 -0.1335
Singapore 0.0607 0.0302 0.0457 0.06550.4281 0.9654 1.2365 0.4692
Taiwan 0.1831 0.0256 0.0689 0.08801.1124 0.6582 0.6916 0.6172
Number of Observations 1,158 1,158 1,158 1,158Adjusted R2 0.0134 0.0267 0.0442 0.0452
*, **, and *** represent significance at the 10, 5, and 1 percent level respectively.
31

Table 6: Cash-Flow Rights, Control Rights, and Corporate Valuation(Ownership by Widely-Held Financial Institutions)
This table presents the regression results of the relationship between excess valuation (EXV) and the concentrationof cash-flow and control rights. The independent variables include the level of cash-flow rights (CASH), the levelof control rights (CONTROL), the ratio of cash flow to control rights (CASH/CONTROL), and an interaction termbetween the ratio of cash-flow to control rights and a dummy for high control (HICONTROL), where the dummytakes the value of 1 if control by the largest block holder is above the median control across the full sample.Interactive terms are also included between the ratio of cash-flow to control rights (CASH/CONTROL) and countrydummy for Japan (JAP), and a dummy for the other eight countries (NOJAP). Control variables include total capitalexpenditures over sales (CES) and country dummies (Thailand is the numeraire). The regressions are performed onthe full sample using the ordinary least-square method. All data are for 1996. Companies which do not have ablock-holder with at least 5% of the vote or which do not report capital expenditures are excluded.
Explanatory Variable EXV EXV EXV EXV EXV
Intercept 0.7753* 1.4015*** 0.8641** 0.8872** 0.57421.8976 4.0884 2.4526 2.5795 0.9312
CASH 1.0748***3.4635
CONTROL -0.9353** -0.6789* -0.9531*** -0.9523***-2.3804 -1.7842 -3.0580 -3.0624
CASH/CONTROL 0.4776*** 0.3875***7.4973 6.0342
(CASH/CONTROL)*JAP 0.3819***5.8512
(CASH/CONTROL)*NOJAP 0.70491.3175
(CASH/CONTROL)*HICONTROL 0.2658** 0.2596**2.2716 2.2375
CES 0.0011** 0.0010* 0.0008 0.0008* 0.0008*2.2849 1.8969 1.5695 1.7397 1.7425
Hong Kong 0.1350 0.1551 0.1967 0.2362 0.26750.3321 0.4290 0.5401 0.6518 0.7376
Indonesia 0.9572 0.8678 0.8764 0.8479 0.84820.6738 0.6188 0.6223 0.6027 0.6029
Japan 0.1794 -0.1977 0.0687 0.1037 0.42020.6962 -0.5938 0.2040 0.3147 0.6780
Korea 0.4138 0.1812 0.2954 0.2910 0.34651.4286 0.4765 0.7795 0.7822 0.8754
Malaysia 0.3932 0.2478 0.2713 0.2374 0.23710.7758 0.4403 0.4778 0.4038 0.4037
Philippines 0.1831 0.2526 0.2483 0.3079 0.31330.8411 0.7331 0.7187 0.9059 0.9251
Singapore -0.3027 -0.1288 -0.1390 -0.0797 -0.0758-0.6248 -0.4271 -0.3046 -0.1738 -0.1653
Taiwan 0.9457 0.6608 0.7433 0.7072 0.74471.0822 0.7906 0.8928 0.8657 0.8728
Number of Observations 895 895 895 895 895Adjusted R2 0.0355 0.0273 0.0793 0.0868 0.0863
$, **, and *** represent significance at the 10, 5, and 1 percent level respectively.
32

Table 7: Cash-Flow Rights, Control Rights, and Corporate Valuation(Ownership by the State and Widely-Held Corporations)
This table presents the regression results of the relationship between excess valuation (EXV) and the concentrationof cash-flow and control rights. The independent variables include the level of cash-flow rights (CASH), the levelof control rights (CONTROL), the ratio of cash flow to control rights (CASH/CONTROL), and an interaction termbetween the ratio of cash-flow to control rights and a dummy for high control (HICONTROL), where the dumnmytakes the value of 1 if control by the largest block holder is above the median control across the full sample. Controlvariables include total capital expenditures over sales (CES) and country dummies (Thailand is the numeraire). Theregressions are performed on the full sample using the ordinary least-square method. All data are for 1996.Companies which do not have a block-holder with at least 5% of the vote or which do not report capitalexpenditures are excluded.
Controlling Block Holder The State Widely-Held Corporations
Intercept 1.4482*** 1.4262*** 1.6086 1.3567*** 1.4532*** 0.6624*3.2776 3.4135 1.6182 5.2317 5.5297 1.7354
CASH 0.4319 0.25290.5894 0.6482
CONTROL 0.4933 1.0421 -0.3236 -0.38720.8119 0.1927 -0.5877 -0.6954
CASH/CONTROL -0.1734 0.8115**-0.6355 2.3023
CES 0.0043 0.0043 0.0043 0.0010 0.0018 0.00121.0178 1.0162 1.1079 0.9854 1.2458 0.4853
Hong Kong 0.3783 0.3893 0.3288 0.1419 0.1332 0.13980.7874 0.8184 0.6762 0.5446 0.5112 0.5365
Indonesia 0.0295 0.0246 -0.0641 -0.0248 -0.0253 0.01370.5685 0.1285 -0.1428 -0.1421 -0.3287 0.0483
Japan -0.2129 -0.2032 -0.2378 -0.2152 -0.2367 -0.2227-0.7524 -0.5986 -0.5513 -0.8952 -0.9843 -0.9243
Korea 0.4982 0.5127 0.3494 -0.1918 -0.2245 -0.22410.9471 0.8967 0.7472 -0.7856 -1.0253 -1.0685
Malaysia -0.1826 -0.1860 -0.2809 0.0281 0.0291 0.0964-0.4319 -0.4429 -0.6428 0.3685 0.4985 0.4471
Philippines -0.3157 -0.3171 -0.4582 0.1603 0.1323 0.1346-1.4288 -1.3584 -1.0226 0.6118 0.8425 0.7181
Singapore -0.4203 -0.4358* -0.5689 0.0562 0.0422 0.0811-1.3585 -1.8542 -1.4252 0.2471 0.1368 0.3696
Taiwan 0.3795 0.3801 0.3776 -0.3196 -0.3607* -0.28080.8806 0.8799 0.8832 -1.4528 -1.7856 -1.2227
Number of Observations 183 183 183 274 274 274Adjusted 2 0.0387 0.0425 0.0841 0.0285 0.0324 0.0346
*, **, and *** represent significance at the 10, 5, and 1 percent level respectively.
33

Policy Research Working Paper Series
ContactTitle Author Date for paper
WPS2072 Growth, Poverty, and Inequality: Quentin T. Wodon March 1999 J. BadamiA Regional Panel for Bangladesh 80425
WPS2073 Politics, Transaction Costs, and the Antonio Estache March 1999 G. Chenet-SmithDesign of Regulatory Institutions David Martimort 36370
WPS2074 Light and Lightning at the End of Antonio Estache March 1999 G. Chenet-Smiththe Public Tunnel: Reform of the Martin Rodriguez-Pardina 36370Electricity Sector in the SouthernCone
WPS2075 Between Group Inequality and Quentin T. Wodon March 1999 J. BadamiTargeted Transfers 80425
WPS2076 Microdeterminants of Consumption, Quentin T. Wodon March 1999 J. BadamiPoverty, Growth, and Inequality in 80425Bangladesh
WPS2077 Change in the Perception of the Branko Milanovic March 1999 C. ArgayosoPoverty Line during Times of Branko Jovanovic 33592Depression: Russia 1993-96
WPS2078 Valuing Mortality Reduction in India: Nathalie B. Simon March 1999 T. TourouguiA Study of Compensationg-Wage Maureen L. Cropper 87431Differentials Anna Alberini
Seema Arora
WPS2079 Is More Targeting Consistent with Martin Ravallion March 1999 P. SaderLess Spending 33902
WPS2080 Monitoring Targeting Performance Martin Ravallion March 1999 P. SaderWhen Decentralized Allocations to 33902the Poor Are Unobserved
WPS2081 Reforming Cote d'lvoire's Cocoa John Mcintire March 1999 P. KokilaMarketing and Pricing System Panos Varangis 33716
WPS2082 Gross Worker and Job Flows in a John C. Hattiwanger March 1999 S. FallonTransition Economy: An Analysis Milan Vodopivec 38009of Estonia
WPS2083 INFRISK: A Computer Simulation Mansoor Dailami March 1999 B. NedrowApproach to Risk Management in Ilya Lipkovich 31585Infrastructure Project Finance John Van DyckTransactions
WPS2084 Future Inequality in Carbon Dioxide Mark T. Heil March 1999 C. AnguizolaEmissions and the Projected Impact Quentin T. Wodon 39230of Abatement Proposals
Policy Research Working Paper Series
ContacTitle Author Date for paper
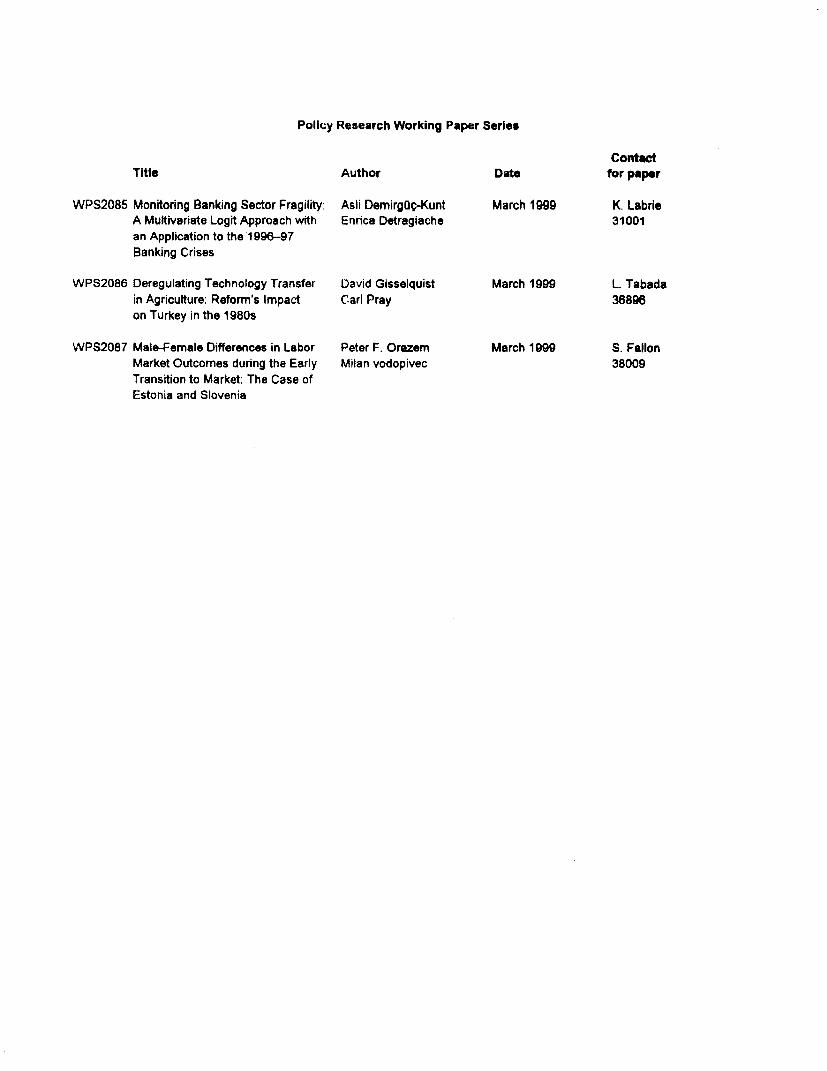
WPS2085 Monitoring Banking Sector Fragility Asli DemirgOg-Kunt March 1999 K. LabrieA Multivariate Logit Approach with Enrica Detragiache 31001an Application to the 1996-97Banking Crises
WPS2086 Deregulating Technology Transfer David Gisselquist March 1999 L. Tabadain Agriculture: Reform's Impact Carl Pray 38896on Turkey in the 1980s
WPS2087 Male-Female Differences in Labor Peter F. Orazem March 1999 S. FallonMarket Outcomes during the Early Milan vodopivec 38009
Transition to Market: The Case ofEstonia and Slovenia