Embed Size (px)
Citation preview
Washington University School of MedicineDigital Commons@Becker
Open Access Publications
2018
Expression profiling of snoRNAs in normalhematopoiesis and AMLWayne A. WarnerWashington University School of Medicine in St. Louis
David H. SpencerWashington University School of Medicine in St. Louis
Maria TrissalWashington University School of Medicine in St. Louis
Brian S. WhiteWashington University School of Medicine in St. Louis
Nichole HeltonWashington University School of Medicine in St. Louis
See next page for additional authors
Follow this and additional works at: https://digitalcommons.wustl.edu/open_access_pubs
This Open Access Publication is brought to you for free and open access by Digital Commons@Becker. It has been accepted for inclusion in OpenAccess Publications by an authorized administrator of Digital Commons@Becker. For more information, please contact [email protected].
Recommended CitationWarner, Wayne A.; Spencer, David H.; Trissal, Maria; White, Brian S.; Helton, Nichole; Ley, Timothy J.; and Link, Daniel C.,,"Expression profiling of snoRNAs in normal hematopoiesis and AML." Blood Advances.2,2. 151-163. (2018).https://digitalcommons.wustl.edu/open_access_pubs/7237

AuthorsWayne A. Warner, David H. Spencer, Maria Trissal, Brian S. White, Nichole Helton, Timothy J. Ley, andDaniel C. Link
This open access publication is available at Digital Commons@Becker: https://digitalcommons.wustl.edu/open_access_pubs/7237

REGULAR ARTICLE
Expression profiling of snoRNAs in normal hematopoiesis and AML
Wayne A. Warner,1,* David H. Spencer,1-3,* Maria Trissal,1 Brian S. White,1,2 Nichole Helton,1 Timothy J. Ley,1-3 and Daniel C. Link1,3
1Division of Oncology, 2McDonnell Genome Institute, School of Medicine, and 3Siteman Cancer Center, Washington University, St. Louis, MO
Key Points
• A subset of snoRNAsis expressed in a de-velopmental- andlineage-specific man-ner during humanhematopoiesis.
•Neither host gene ex-pression nor alternativesplicing accounted forthe observed differentialexpression of snoRNAsin a subset of AML.
Small nucleolar RNAs (snoRNAs) are noncoding RNAs that contribute to ribosome biogenesis
and RNA splicing by modifying ribosomal RNA and spliceosome RNAs, respectively. We
optimized a next-generation sequencing approach and a custom analysis pipeline to
identify and quantify expression of snoRNAs in acute myeloid leukemia (AML) and normal
hematopoietic cell populations. We show that snoRNAs are expressed in a lineage- and
development-specific fashion during hematopoiesis. The most striking examples involve
snoRNAs located in2 imprinted loci,whicharehighlyexpressed inhematopoietic progenitors
and downregulated during myeloid differentiation. Although most snoRNAs are expressed
at similar levels in AML cells compared with CD341, a subset of snoRNAs showed
consistent differential expression, with the great majority of these being decreased in the
AML samples. Analysis of host gene expression, splicing patterns, and whole-genome
sequence data for mutational events did not identify transcriptional patterns or genetic
alterations that account for these expression differences. These data provide a
comprehensive analysis of the snoRNA transcriptome in normal and leukemic cells and
should be helpful in the design of studies to define the contribution of snoRNAs to
normal and malignant hematopoiesis.
Introduction
There has been increasing interest in the contribution of the noncoding transcriptome to the regulationof normal and malignant hematopoiesis. Noncoding RNA (ncRNA) species are classified into 2 groupsbased on their sizes. Long noncoding RNAs (lncRNAs) are.200 nucleotides, and they are expressed ina lineage-specific fashion in hematopoiesis.1 Recent studies have implicated lncRNAs in hematopoieticlineage commitment and control of self-renewal.1 Small noncoding RNAs (sncRNAs) are ,200nucleotides and include a heterogeneous group of RNA species. Best characterized are microRNAs(miRNAs), which are 19-26 nucleotide RNAs that repress translation of target RNAs by targeting themto the RNA-induced silencing complex. MicroRNAs are also expressed in a lineage-specific fashion andhave been shown to play key roles in the regulation of hematopoiesis.2-4 Other sncRNAs include smallnucleolar RNAs (snoRNAs), small nuclear RNAs (snRNAs), small interfering RNAs, and Piwi-interactingRNAs. With some exceptions, the expression of these other sncRNAs in hematopoietic cells and theircontribution to the regulation of hematopoiesis are not well characterized.
snoRNAs are a subset of sncRNAs that are involved in the posttranscriptional modification of ribosomalRNAs (rRNAs) and snRNAs. These modifications are critical for a variety of cellular processes, includingribosomal biogenesis and splicing of RNAs. Classification of snoRNA species is based on the presenceof highly conserved sequence elements that define 3 snoRNA families: H/ACA box (SNORAs), C/Dbox (SNORDs), or small Cajal body–specific RNAs (scaRNAs). H/ACA and CD box snoRNAstarget specific ncRNA species with base pair complementarity for site-specific pseudouridylation5 or
Submitted 13 March 2017; accepted 21 December 2017. DOI 10.1182/bloodadvances.2017006668.
*W.A.W. and D.H.S. contributed equally to this work.
The full-text version of this article contains a data supplement.© 2018 by The American Society of Hematology
23 JANUARY 2018 x VOLUME 2, NUMBER 2 151
2’-O-methylation,6 respectively. scaRNAs localize to RNA-containingCajal bodies and are responsible for the methylation and pseudour-idylation of spliceosomal RNAs U1, U2, U4, U5, and U12. There arealso orphan snoRNAs, which lack known complementarity to rRNAs orsnRNAs and therefore largely have unknown functions. Recent studieshave suggested an expanded role for snoRNAs beyond ribosomalbiogenesis and modifications to snRNA. For example, emerging datasuggest that snoRNAsmay contribute to alternative splicing,7 regulationof chromatin structure,8 metabolism,9 and neoplastic transformation.10
The contribution of snoRNAs to the regulation of normal and malignanthematopoiesis is largely unknown. Chu et al reported that over-expression of the H/ACA box snoRNA ACA11 in t(4;14)-associatedmultiple myeloma contributes to myeloma cell proliferation andresistance to chemotherapy.11 Several groups have reported markedincreased expression of snoRNAs contained in theDLK-DIO3 locus inacute promyelocytic leukemia, although their contribution to leukemo-genesis is unknown.12-14 The lack of a method to accurately andcomprehensively assess snoRNA expression has limited research inthis area. Array-based methods only interrogate a subset of snoRNAsand cannot distinguish between mature and precursor snoRNAs.15,16
To avoid sequencing very abundant rRNAs and transfer RNAs(tRNAs), most next-generation sequencing approaches to interrogatethe transcriptome have focused on longer (.200 nucleotide) or veryshort (17-26 nucleotide) RNA species. Thus, there is a gap in currenttranscriptome sequencing that includes most snoRNAs. To addressthis gap, we developed a next-generation sequencing approachoptimized to interrogate sncRNAs, including snoRNAs. We show thatsnoRNAs are expressed in a lineage- and development-specificfashion in human hematopoiesis with a subset of snoRNAs that showconsistent differential expression in acute myeloid leukemia (AML). Wefurther show that expression of snoRNAs does not correlate withexpression or splicing of host genes, suggesting that other factors aredetermining cellular levels of mature snoRNAs.
Materials and methods
Fluorescence-activated cell sorting of
hematopoietic populations
Bone marrow aspirate samples were obtained from normal healthydonors after obtaining informed consent (institutional review boardapprovalWashington University Human Studies Committee #01-1014).Samples were processed via ammonium–chloride–potassium red celllysis, washed once in phosphate-buffered saline, and then stained forflow cytometry using the following antibodies: CD34-phycoerythrin (PE)(PE-pool, Beckman Coulter, IM1459U), CD14-allophycocyanin (BDBiosciences, clone M5E2), CD15-fluorescein isothiocyanate (BD Bio-sciences, clone HI98), CD16-PE (BD Biosciences, clone 3G8),CD33-allophycocyanin (eBioscience, clone WM-53), CD3-V450(eBioscience, clone OKT3), and CD19-PE (BD Biosciences, cloneHIB19). Defined hematopoietic cell populations that were sortedincluded: promyelocytes (CD142, CD151, and CD16low/2),17
monocytes (CD141), neutrophils (CD142, CD151, and CD161),17
and CD341 cells. Cells were sorted directly into lysis buffer, and RNAwas isolated using the Quick-RNA Microprep Kit (Zymo Research).
Small RNA library construction and sequencing
The NEBNext Small RNA Library Prep Set for Illumina (New EnglandBioLabs, Inc.) was used to prepare the libraries following themanufacturer’s specifications using 100 to 500 ng of total RNA as
input.18 After adaptor ligation, reverse transcription, and polymerasechain reaction (PCR) amplification, the libraries were size selected ona Blue Pippin (Sage Science) to enrich for library molecules withinserts between ;17 and 200 nucleotides. The resulting librarieswere sequenced on a MiSeq instrument to generate 150 bp, single-end reads. All sequence data will be deposited in dbGaP.
Bioinformatic analysis
Sequencing data were trimmed to remove adapter sequences usingcutadapt with the command “cutadapt -f fastq -a AGATCGGAAGAG-CACACGTCT” and then mapped to the National Center forBiotechnology Information Build 37 human reference sequence usingbwa mem19 with the custom parameters “bwa mem -M -k 15 -T 17” toobtain short alignments that result from small RNA species. Thesealignments were then used in the following analyses to characterize thespectrum of RNA species captured by the library approach, identifynovel RNA species, and quantify the expression of annotated snoRNAs.
We first defined the distribution of RNA species captured in thelibrary by annotating the sequencing reads from all samples with RNAbiotypes from GENCODE version 19,20 mirBase version 21,21 and apreviously described set of snoRNA annotations (snoRNAome22).Given that the library preparation method has a 39 end bias, readswere assigned to a single RNA annotation in a strand-specific mannerbased on the proximity of the read start position to the 39 end ofoverlapping annotations. Reads were called “unannotated” if thealignments were uncertain (ie, mapping quality of 0), or they did notmap to any annotation in a strand-dependent manner.
Next, we identified potentially novel RNA species using a customPractical Extraction and Report Language (PERL) script designed todetect and annotate aggregate read “clusters” using pooled se-quence data from all normal hematopoietic cell and AML samples(N5 64). Briefly, mapped reads for all samples with a mapping quality.0 were merged into a single BAM file, and regions with a minimumstrand-specific read depth of 50 were extracted. All reads spanningthese regions were then merged to create strand-specific readclusters, which were trimmed such that the cluster edges were$20%of the maximum read depth (to separate closely spaced clusters thatmay have become merged by spurious “joining” reads), andsubsequently filtered to retain those with an AT nucleotide content,80% to exclude low-complexity sequences. The total number ofclusters that resulted from this procedure was 6231. Clusters werethen annotated with read quality and mapping statistics (eg, meanmapping quality, number of unique read start positions, and meannumber of mismatches with the reference sequence), the number ofstrand-specific read counts, and maximum depth across the cluster.Cluster coordinates were compared with the GENCODE, mirBase,and snoRNAome annotations, and “tagged” with the strand-specifictranscript or gene annotation with the best reciprocal overlap.Potentially novel species from this set that demonstrated ,50%reciprocal overlap with known annotations and total counts $500(N 5 340 clusters) were then manually analyzed with the programssnoGPS and snoSCAN, which identify H/ACA box and C/D boxsnoRNAs with reported rRNA targets,23,24 and with snoReport foridentification of all snoRNAs, including orphans25 as well as acustom script. This produced a final list of 111 clusters that wereidentified as potential snoRNA species, which were manuallyreviewed using the Integrated Genome Viewer (version 2.3.40)26
and the sno/miRNA track of UCSC Genome Browser27 to excludelow-quality clusters or those that overlapped known snoRNAs.
152 WARNER et al 23 JANUARY 2018 x VOLUME 2, NUMBER 2
Finally, expression levels for a comprehensive set of annotated sncRNAspecies were generated for each sample using annotations curatedfrom snoRNAome22 and miRBase28 along with all GENCODE version19 annotations with biotype “snoRNA.” These annotation databaseswere combined to produce a set of 4931 nonoverlapping annotations,with snoRNAome and mirBase entries superseding those fromGENCODE version 19 with overlapping coordinates. Overlappingannotations from snoRNAome and mirBase were reviewed, and asingle species was selected based on the correspondence betweenthe sequencing reads at the locus and annotation; the other annotationwas excluded. Expression values for these annotations were thenobtained with the featureCounts program29 using parameters forstrand-specific counting and including only reads with a mappingquality of$1. These counts were normalized to the total mapped reads3 106 for visualization and subsequent statistical analyses.
Quantitative reverse transcription PCR of
selected snoRNAs
The extracted RNA was purified on a RNA Clean & Concentrator-5column (Zymo Research, R1013) using the manufacturer’s .17-nucleotide-long protocol and resuspended in 10.0 mL of nuclease-free water. The Qubit RNA HS Assay Kit (Life Technologies,Q32855) and the TapeStation system (Agilent) were used forquantification and quality assessment, respectively, according to themanufacturer’s instructions. The RNA was reverse transcribed usingiScript Reverse Transcriptase (BioRad, 1708841) at 42°C, accord-ing to the manufacturer’s instructions. The complementary DNA(cDNA) was PCR amplified using forward and reverse primerscontaining sequences specific to the snoRNAs (supplementalTable 1). In a 20-mL reaction, 3.0 ng of cDNA template, 0.5 mMeach of forward and reverse primers (IDT), 10 mL iTaq UniversalSYBR Green 23 Supermix, (BioRad, 1725120), and nuclease-freewater were cycled for 60 rounds at an annealing temperature of 60°Con a StepOnePlus Real-Time PCR System (Applied Biosystems).The 5S rRNA was used to normalize snoRNA expression.
Differential expression analysis
Differential expression and hierarchical clustering analyses wereperformed with the Partek Genomic Suite (Partek, Inc.) using log2(read count per million mapped reads 3 106 [RPM]) expressionvalues for the curated sncRNA annotations as input30; only RNAspecies with mean normalized count values $5 were selected toproduce reliable differential expression profiles. Data were firstassessed for normality, and differential expression analysis wasperformed with the Partek Genomic Suite using 1-way analysis ofvariance (ANOVA) with estimation via the method of momentsmodel.31 The differential expression of snoRNAs and miRNAs in theAML patients vs normal hematopoietic stem/progenitors was basedon a fold change .2 and P , .05).
Splicing analysis
Intron junction counts for annotations in GENCODE version 19were obtained from aligned BAM files using Tablemaker andBallgown32 and normalized to the total number of junction readsobserved 3 106. The linear regression between normalizedsnoRNA expression (RPM) and the normalized expression for “hostgene” junctions spanning each snoRNA were assembled in R.33
Correlations between all snoRNAs and junction expressions weresimilarly performed.
Somatic mutation of snoRNAs
The coordinates of the 344 651 introns in the genome (GRCh37)and that of 402 snoRNAs were intersected with the coordinates of367 904 prevalidation indels from 49 Cancer Genome Atlas AMLpatient samples using BEDtools34 and R.
Statistical analysis
Statistical analysis and graphing were performed with Prism(GraphPad Software, Inc.) and R. Error bars represent the standarderror of the mean (SEM). Significance was determined by 1-wayANOVA followed by Tukey multiple comparisons test. Significanceis denoted as: *P , .05; ** , .01; ***P, .001; ****P , .0001; andns, not significant.
Results
Small RNA-seq pipeline
We modified a previously described method for sequencingmiRNAs to analyze more comprehensively the small RNA compo-nent of the transcriptome.18 A key aspect of this approach is themethod used for cDNA library generation, which includes theaddition of an oligonucleotide adaptor to the 39-end of RNAmolecules before reverse transcription. Importantly, this requires thepresence of a free 39 hydroxyl group on the RNA molecule. We thenperformed an expanded size selection to capture RNA speciesbetween 17 and 200 nucleotides, which includes miRNAs,snoRNAs, and other sncRNAs, but excludes most messengerRNA (mRNA) and lncRNA molecules. The sequence data obtainedwere analyzed using 2 complementary bioinformatic approaches toquantify both annotated and novel sno- and miRNAs (Figure 1A).
We used this approach to interrogate the small RNA transcriptomein human hematopoietic cell populations from normal hematopoieticstem/progenitors and from diagnostic AML samples. CD34 cells,promyelocytes, neutrophils, monocytes, T cells, and B cells weresorted by flow cytometry from the bone marrow of 6 healthyindividuals. Data from primary AML samples were generated frombulk leukemic cells from 33 treatment-naive patients with AML(Table 1). Most of these cases (97%) had normal cytogenetics, andall were classified as intermediate-risk AML. An average of 3.2 3106 reads was obtained across both normal and leukemic samples(supplemental Table 2). Mapping of sequencing reads from allsamples to annotation features from GENCODE version 19 andsnoRNA and miRNA annotations in the human snoRNAome andmiRBase (see “Materials and methods”) demonstrated thatsnoRNAs were by far the most abundant small RNA speciespresent in our data (Figure 1B). C/D box snoRNAs represented74.95% of all reads; H/ACA box snoRNAs and scaRNAsrepresented another 3.19% and 0.34% of total mapped reads,respectively. Small nuclear RNAs, which are involved in RNAsplicing, were the next most abundant class of sncRNA, represent-ing 10.19% of reads. miRNAs represented a relatively smallpercentage of all sequenced reads (1.48% of all mapped reads).Reads mapping to unannotated regions of the genome accountedfor 0.04% of all sequences.
We next compared the expression of snoRNAs using data from ourmodified library protocol with expression levels obtained bystandard total RNA sequencing (RNA-seq) (Illumina Tru-seq) andof the same tissue sample. Relevant to this analysis, the majority ofsnoRNAs are embedded in the introns of host genes. We observed
23 JANUARY 2018 x VOLUME 2, NUMBER 2 snoRNA EXPRESSION IN NORMAL HEMATOPOIESIS AND AML 153

that standard transcriptome sequencing cannot reliably distinguishunspliced primary host gene RNA from correctly processedsnoRNA. Typical results are shown for SNORA64, which is locatedin the intron of its host gene, RP32 (Figure 1C). Whereas sequencereads corresponding to mature SNOR64 were readily identifiedusing our pipeline, only low-level reads that span the entire intronof RP32 were detected using total RNA-seq. Accordingly, thecorrelation of snoRNAs quantified using these 2 RNA-seq pipelineswas poor (Figure 1D). These data demonstrate the superiority of oursmall sequencing pipeline to quantify mature, correctly processedsnoRNA expression.
To provide orthogonal validation of the snoRNA expression data, weused commercially available reagents to perform quantitative reverse
transcription PCR (RT-qPCR) on a set of 9 snoRNAs with a widerange of expression across 11 primary AML samples. Although somevariability was observed, a significant correlation between snoRNAexpression determined by small RNA Seq and RT-qPCR wasobserved (R2 5 0.5002; P , .0001; supplemental Figure 1).
To determine whether our sequencing approach identified anynovel RNA species, we formed read clusters by merging over-lapping reads and compared them with the RNA annotations asdescribed above. The intersection of read cluster coordinates withour sncRNA annotation set demonstrated that a number of them didnot overlap with known annotations, and could therefore representnovel RNA species. The genomic regions spanned by theseclusters were then analyzed for features of snoRNAs, including the
ADonor bone marrow,
n=4-6
Flow sort hematopoietic cell populations
sncRNA library preparation
1117 expressed snoRNAs and miRNAswith minimum total count of 5 across all
samples
575 snoRNAs 357 box C/D,190 box H/ACA and 28 scaRNAs
Sequence reads aligned to Gencode v.19,human snoRNAome and miRBASE
annotations
De novo Cluster identificationMaximum reciprocal overlap between
cluster and annotation
6231 clusters
111 unannotated clusters
8 novel snoRNAs3 box C/D and 5 box H/ACA snoRNAs
C1000
500
0
1000
500
0
Tota
lco
unts
Tota
lco
unts
B
Mapp
ed re
ads,
perc
enta
ge
8070605012
10
8
6
4
2
0
C/D bo
x sno
RNA
snRNA
Protei
n cod
ing
H/ACA bo
x sno
RNA
Other s
pecie
s
miRNA
Mt rRNA/M
t tRNA
Misc R
NA
lincR
NA
scaR
NA
Unann
otate
d
Small RNA-seq expressionlog2 reads per 106
Tota
l RNA
-seq
exp
ress
ionlog
2 rea
ds p
er 10
6
0 5 10 15 200
5
10
15
20
D
R2=0.178
SNORA64SNORA64
Figure 1. Small RNA-Seq pipeline. (A) Schematic representation of the small RNA-seq pipeline. Sequence reads were aligned to the GENCODE version 19, miRBase
version 21, and human snoRNAome, and reads corresponding to annotated sncRNAs were quantified (left pathway). Alternatively, aligned sequence reads were organized
into genomic clusters; a total of 111 unannotated clusters were identified, of which 8 were classified as novel snoRNAs (right pathway). (B) Graph showing the distribution of
annotation biotypes in GENCODE version 19 for mapped reads from all samples. The percentage of all mapped reads (mapping quality .0) is shown on the y-axis, and the
annotated species is shown on the x-axis. Miscellaneous (Misc) snoRNAs include rRNAs, other species include unprocessed pseudogenes, immunoglobulin genes, T-cell
receptor genes, sense introns, antisense transcripts, sense overlapping transcripts, retained introns, and processed transcripts. Protein-coding genes include nonsense
mediated decay, and nonstop decay biotypes. (C) Integrated Genome Viewer browser view of SNORA64, which is embedded in an intron of the coding gene RPS2. The top
panel shows the alignment of reads generated using total RNA-seq. The middle panel shows the alignment of reads from a small RNA-seq library produced from the same
sample. The genomic boundaries of SNORA64 and exons 4 and 5 of host gene RPS2 are shown in the bottom panel. (D) Representative scatter plot showing log-transformed
normalized read counts of annotated snoRNAs for a CD34 sample analyzed using total RNA-seq (y-axis) or our small RNA-seq pipeline (x-axis).
154 WARNER et al 23 JANUARY 2018 x VOLUME 2, NUMBER 2
presence of conserved sequence motifs and secondary structure.Eight putative novel snoRNAs were identified, including 5 in theSNORA family and 3 in the SNORD family. One of the putativeSNORDs lacked sequence complementarity to rRNAs or snRNAsand was therefore classified as an orphan snoRNA (supplementalTable 3). There was some degree of overlap (#50%) withannotated species, but our analysis supports the characterizationof these snoRNAs as putatively novel.
Developmental- and lineage-specific expression of
snoRNAs in human hematopoiesis
Because snoRNAs were the most abundant sncRNA detected, wefocused our analysis on these RNA species. We first performedunsupervised hierarchical clustering of annotated snoRNAs with anormalized expression of $5 RPM (N 5 378) to determine whetherexpression of snoRNAs is developmentally regulated during hemato-poiesis. This demonstrated that snoRNAs exhibit lineage- and de-velopmentally restricted expression patterns (Figure 2). The moststriking examples were orphan snoRNAs contained in the imprintedDLK-DIO3 and SNURF/SNRPN loci. The DLK-DIO3 locus contained
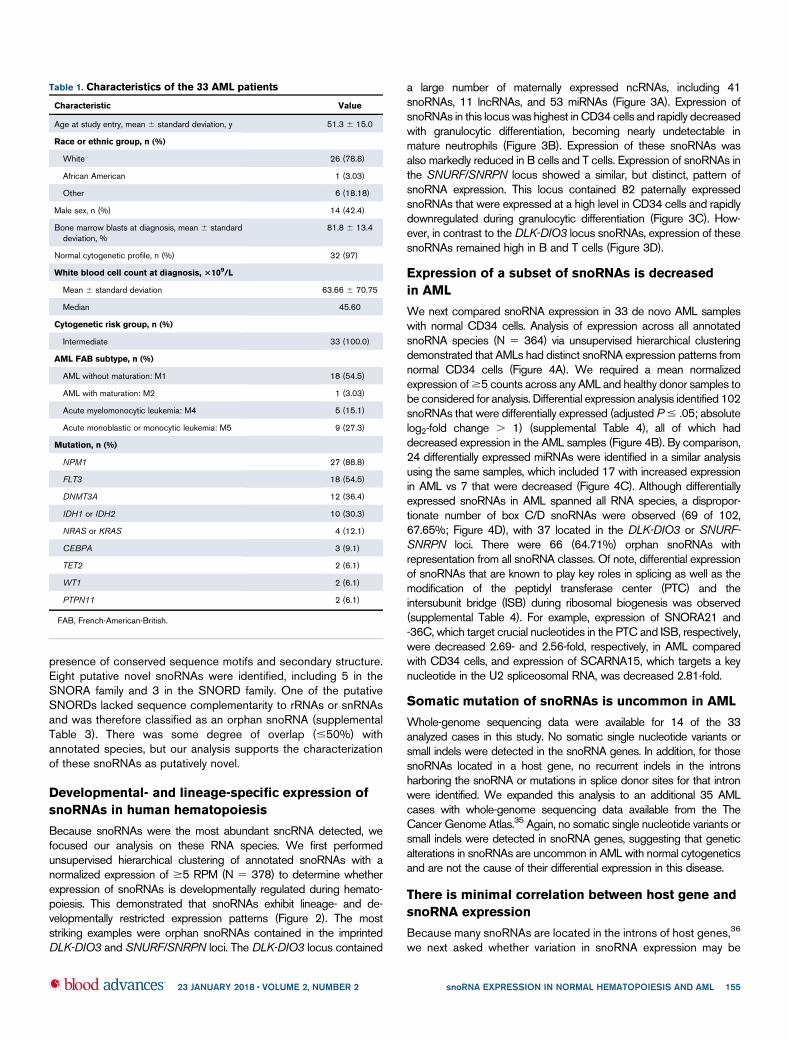
a large number of maternally expressed ncRNAs, including 41snoRNAs, 11 lncRNAs, and 53 miRNAs (Figure 3A). Expression ofsnoRNAs in this locus was highest in CD34 cells and rapidly decreasedwith granulocytic differentiation, becoming nearly undetectable inmature neutrophils (Figure 3B). Expression of these snoRNAs wasalso markedly reduced in B cells and T cells. Expression of snoRNAs inthe SNURF/SNRPN locus showed a similar, but distinct, pattern ofsnoRNA expression. This locus contained 82 paternally expressedsnoRNAs that were expressed at a high level in CD34 cells and rapidlydownregulated during granulocytic differentiation (Figure 3C). How-ever, in contrast to the DLK-DIO3 locus snoRNAs, expression of thesesnoRNAs remained high in B and T cells (Figure 3D).
Expression of a subset of snoRNAs is decreased
in AML
We next compared snoRNA expression in 33 de novo AML sampleswith normal CD34 cells. Analysis of expression across all annotatedsnoRNA species (N 5 364) via unsupervised hierarchical clusteringdemonstrated that AMLs had distinct snoRNA expression patterns fromnormal CD34 cells (Figure 4A). We required a mean normalizedexpression of$5 counts across any AML and healthy donor samples tobe considered for analysis. Differential expression analysis identified 102snoRNAs that were differentially expressed (adjusted P# .05; absolutelog2-fold change . 1) (supplemental Table 4), all of which haddecreased expression in the AML samples (Figure 4B). By comparison,24 differentially expressed miRNAs were identified in a similar analysisusing the same samples, which included 17 with increased expressionin AML vs 7 that were decreased (Figure 4C). Although differentiallyexpressed snoRNAs in AML spanned all RNA species, a dispropor-tionate number of box C/D snoRNAs were observed (69 of 102,67.65%; Figure 4D), with 37 located in the DLK-DIO3 or SNURF-SNRPN loci. There were 66 (64.71%) orphan snoRNAs withrepresentation from all snoRNA classes. Of note, differential expressionof snoRNAs that are known to play key roles in splicing as well as themodification of the peptidyl transferase center (PTC) and theintersubunit bridge (ISB) during ribosomal biogenesis was observed(supplemental Table 4). For example, expression of SNORA21 and-36C, which target crucial nucleotides in the PTC and ISB, respectively,were decreased 2.69- and 2.56-fold, respectively, in AML comparedwith CD34 cells, and expression of SCARNA15, which targets a keynucleotide in the U2 spliceosomal RNA, was decreased 2.81-fold.
Somatic mutation of snoRNAs is uncommon in AML
Whole-genome sequencing data were available for 14 of the 33analyzed cases in this study. No somatic single nucleotide variants orsmall indels were detected in the snoRNA genes. In addition, for thosesnoRNAs located in a host gene, no recurrent indels in the intronsharboring the snoRNA or mutations in splice donor sites for that intronwere identified. We expanded this analysis to an additional 35 AMLcases with whole-genome sequencing data available from the TheCancer Genome Atlas.35 Again, no somatic single nucleotide variants orsmall indels were detected in snoRNA genes, suggesting that geneticalterations in snoRNAs are uncommon in AML with normal cytogeneticsand are not the cause of their differential expression in this disease.
There is minimal correlation between host gene and
snoRNA expression
Because many snoRNAs are located in the introns of host genes,36
we next asked whether variation in snoRNA expression may be
Table 1. Characteristics of the 33 AML patients
Characteristic Value
Age at study entry, mean 6 standard deviation, y 51.3 6 15.0
Race or ethnic group, n (%)
White 26 (78.8)
African American 1 (3.03)
Other 6 (18.18)
Male sex, n (%) 14 (42.4)
Bone marrow blasts at diagnosis, mean 6 standarddeviation, %
81.8 6 13.4
Normal cytogenetic profile, n (%) 32 (97)
White blood cell count at diagnosis, 3109/L
Mean 6 standard deviation 63.66 6 70.75
Median 45.60
Cytogenetic risk group, n (%)
Intermediate 33 (100.0)
AML FAB subtype, n (%)
AML without maturation: M1 18 (54.5)
AML with maturation: M2 1 (3.03)
Acute myelomonocytic leukemia: M4 5 (15.1)
Acute monoblastic or monocytic leukemia: M5 9 (27.3)
Mutation, n (%)
NPM1 27 (88.8)
FLT3 18 (54.5)
DNMT3A 12 (36.4)
IDH1 or IDH2 10 (30.3)
NRAS or KRAS 4 (12.1)
CEBPA 3 (9.1)
TET2 2 (6.1)
WT1 2 (6.1)
PTPN11 2 (6.1)
FAB, French-American-British.
23 JANUARY 2018 x VOLUME 2, NUMBER 2 snoRNA EXPRESSION IN NORMAL HEMATOPOIESIS AND AML 155

explained by differences in expression and/or processing of thesehost genes. We limited our analysis to the AML cases, wherematching small RNA and total RNA-seq data were available. For mostsnoRNAs, there was minimal correlation between host gene andcorresponding snoRNA expression, as illustrated by host geneRPL7A and its corresponding snoRNAs (Figure 5A). Across all 1379snoRNAs contained in host genes, the average coefficient ofdetermination (R2) was 0.037 6 0.102 (Figure 5B). MultiplesnoRNAs are often located within different introns of a single hostgene, as shown for the C19orf48 gene (Figure 5C). If host geneexpression is the primary determinant of snoRNA expression, thenexpression of each snoRNA located in a given multihost gene shouldbe similar. However, we observed marked variability in the expressionof snoRNAs contained within a single gene. For example, expressionof the 3 snoRNAs hosted by C19orf48 varied by .32-fold(Figure 5D). Indeed, marked variability in the expression of snoRNAscontained within the same host gene was observed in the majority ofcases (Figure 5E). These data show that host gene expression is notthe primary determinant of snoRNA expression in AML.
Alternative splicing of host genes is not the primary
determinant of snoRNA expression
Mature snoRNAs are processed from excised introns after splicing ofthe host gene. Thus, we next asked whether alternative splicing of hostgenes is a major determinant of snoRNA expression. We assessedRNA splicing by measuring junction reads, as previously described.37
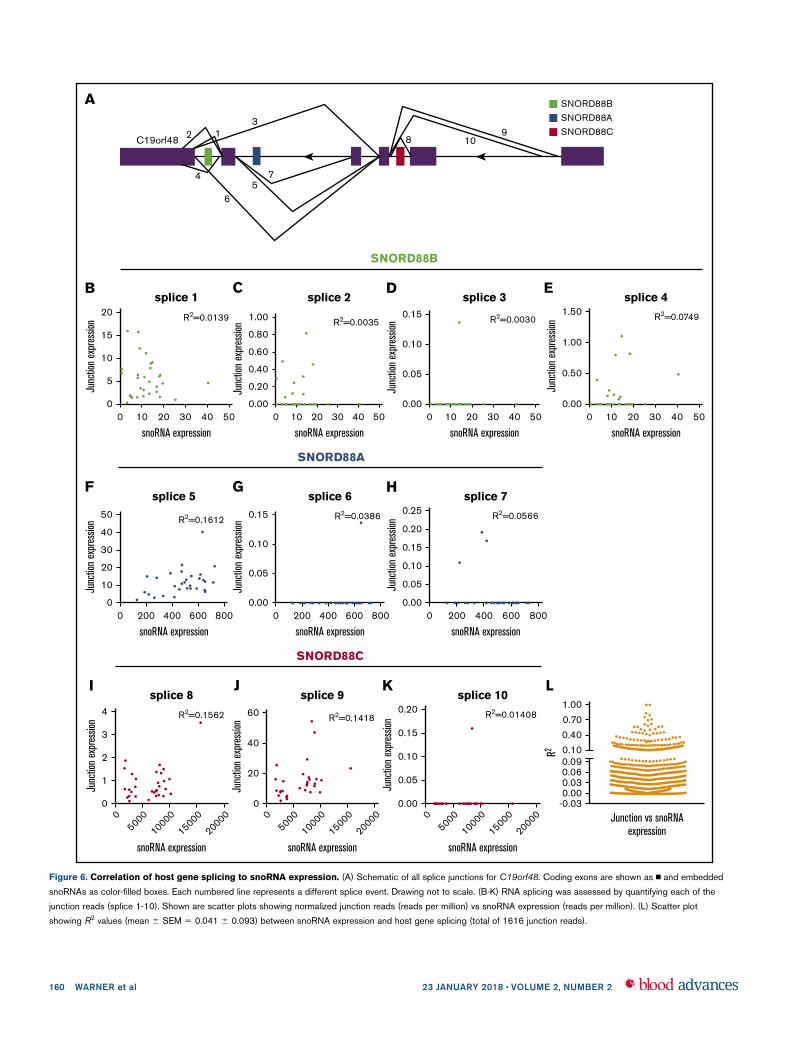
For example, the host gene C19orf48 has 10 predicted splice events
that involve introns containing embedded snoRNAs (Figure 6A).Expression of junction reads corresponding to each splice eventshowed minimal correlation with expression of the relevant snoRNA(Figure 6B-K). This analysis was extended to look at snoRNAexpression and encompassing junction expression across 858snoRNAs spanning 1616 junctions (Figure 6L). For most cases,junction reads correlated minimally with snoRNA expression. Collec-tively, these data show that alternative splicing of host genes is unlikelyto be the primary determinant of snoRNA expression.
Discussion
The expression of snoRNAs has traditionally been determined byhigh-throughput techniques that rely on hybridization-based meth-ods, such as microarray analysis or by standard RNA-seqtechnologies.12-14 Microarrays for snoRNAs are unable to effec-tively capture novel sequences or resolve the expression ofsnoRNAs in families with highly homologous members.38 StandardRNA-seq is generally limited to RNA species .200 nucleotides inlength, and thus does not reliably detect most sncRNAs, includingsnoRNAs. In this study, we optimized both library preparation andbioinformatic analysis to address these challenges, which resultedin improved sensitivity for detecting novel sncRNAs, more accurateexpression levels of annotated species, and efficient resolution ofclosely related snoRNA species, such as those in the DLK-DIO3and SNURF-SNRPN loci. In addition, for those snoRNAs embed-ded in host genes, this approach can distinguish between hostgene primary transcripts and mature, fully processed snoRNAs.
-3.00 0.00
CD
34
Pro
Neu
B c
ell
T ce
ll
3.00
Figure 2. Unsupervised hierarchical clustering of snoRNA expression. Small RNA-seq was performed on the indicated sorted hematopoietic cell populations obtained
from 4-6 normal hematopoietic stem/progenitors. snoRNA expression (z-scored log2 RPM) is shown, with red indicating high expression, and green indicating low expression.
Each column represents a unique snoRNA, and each row represents a sample.
156 WARNER et al 23 JANUARY 2018 x VOLUME 2, NUMBER 2

The best method to normalize small RNA-seq expression data isuncertain. For miRNAs, several studies have compared normalizationmethods, suggesting that the upper quartile, median, the DESeqnormalization offered in the DESeq Bioconductor package, and thetrimmedmean ofM values offered in the edgeRBioconductor packagemay be superior to the RPM normalization method.39-41 In the absenceof a “gold standard” for snoRNA expression, a rigorous comparison ofnormalization strategies of our small RNA-seq snoRNA expression datawas not possible. Thus, in this study, we normalized our small RNA-seqdata with the widely used RPM method.
To our knowledge is the first study to comprehensively analyzesnoRNA expression in human hematopoiesis. snoRNAs are the mosthighly expressed sncRNAs in all of the hematopoietic cell populationstested. Although snoRNAs have been considered to be housekeep-ing genes,42 we identified a subset of snoRNAs that exhibit markeddifferential expression in a lineage- and development-specific pattern.This is particularly true for orphan snoRNAs contained in theimprinted DLK-DIO3 and SNURF/SNRPN loci. The DLK-DIO3
locus contains 47 orphan CD box snoRNAs that are highlyexpressed in CD34 cells and downregulated during myeloid orlymphoid differentiation. This observation is consistent withprevious reports showing high hematopoietic stem/progenitorexpression of lncRNAs43 and miRNAs44 that are contained in theDLK-DIO3 locus. The SNURF/SNRPN locus contains 2 largeorphan CD box snoRNA clusters, SNORD115 and SNORD116,that are expressed highly in CD34 cells and downregulated duringmyeloid differentiation. Loss of SNORD116 in the SNURF/SNRPN locus is thought to be key to the pathogenesis ofPrader-Willi syndrome, a genetic disorder characterized byobesity and developmental delay.45,46 Of note, SNORD115 hasbeen shown to promote alternative splicing of the serotoninreceptor 2C.47 The contribution of the DLK-DIO3 and SNURF/SNRPN loci to hematopoietic stem/progenitor function is un-known, although it is interesting to note that expression of ncRNAsfrom the DLK-DIO3 locus correlates with pluripotency in bothembryonic and inducible pluripotent stem cells.48
DC
****
****
ns
ns
CD34
Promye
locyte
Monoc
yte
Neutro
phil
B cell
T cell
15
10
5
0
Log 2
exp
ress
ion
BA
****
ns
CD34
Promye
locyte
Monoc
yte
Neutro
phil
B cell
T cell
8
6
4
2
0
Log 2
exp
ress
ion~800.0kb
DLK1 RTL1 DIO3
MEG3 MEG8 SNORD112 SNORD113 (1-9) SNORD114 (1-31) miRNA cluster
~835.3kb
SN
UR
F-S
NR
PN
SN
OR
D6
4S
NO
RD
109A
SN
OR
D10
8S
NO
RD
107 SNORD116 (1-29) SNORD115 (1-48)IPW
SN
OR
D10
9B
UB
E3A
ATP
10A
Figure 3. Expression of snoRNAs in the DLK-DIO3 and SNURF/SNRPN loci. (A) Organization of the DLK-DIO3 locus. Maternally expressed genes (open boxes)
and paternally expressed genes (filled boxes) are shown. The miRNA cluster contains 54 miRNAs. (B) Normalized read counts for SNORD113-6 are shown;
its expression is representative of other SNORDs in this locus. Significance was determined by 1-way ANOVA followed by Tukey multiple comparisons test.
(C) Organization of the human SNURF-SNRPN locus (drawing is not to scale). Paternally expressed genes, including SNORDs, are shown as n, and maternally
expressed genes are shown as N. (D) Normalized read counts for SNORD116-1, representative of SNORDs in the SNURF-SNRPN locus, are shown.
****P , .0001. ns, not significant.
23 JANUARY 2018 x VOLUME 2, NUMBER 2 snoRNA EXPRESSION IN NORMAL HEMATOPOIESIS AND AML 157

-3.00 0.00 3.00
CD
34
AM
L
3
4
5
6
7
8
9
2
1
0
− log
10(p
value
)
-6 -5 -4 -3 -2 -1 1 2 3 4 5 60
log2(fold change)
N = 7 N = 0 N = 17
N = 10 N = 80 N = 18
A
201816141210
86
-6 -5 -4 -3 -2 -1
420
1 2 3 4 5 60
− log
10(p
value
)
log2(fold change)
N = 102 N = 75 N = 0
N = 5 N = 182 N = 0
B
H/ACA box snoRNA
C/D box snoRNA
scaRNAN=4, 3.92%
N=69, 67.65%
N=29, 28.43%
D
C
Figure 4. Differentially expressed snoRNAs. (A) Unsupervised hierarchical clustering of snoRNA expression in AML and CD34 from healthy adult donors based on z
scores, with red indicating high expression, and green indicating low expression. Each column represents a specific snoRNA, and each row represents an individual sample.
(B-C) Volcano plot illustrating significant differentially expressed snoRNAs (B) and miRNAs (C). The fold change difference in RNA expression between AML and normal CD34
samples is plotted on the x-axis, and P value significance is plotted on the y-axis. The horizontal line on the plot represents the a-level used for this analysis (0.05). Vertical lines
158 WARNER et al 23 JANUARY 2018 x VOLUME 2, NUMBER 2

We observed no recurring mutations of snoRNA genes in our cohortof cytogenetically normal AML, suggesting that genetic alterationsthat specifically target snoRNAs in AML are uncommon. A previousstudy reported that snoRNAs are globally suppressed in AML relativeto CD34 cells from normal hematopoietic stem/progenitors.14
Although we also observed a trend toward decreased expressionin AML, this was limited to a small subset of snoRNAs (102 of 364,28%). The reasons for this discrepancy are not certain, but theprevious study primarily used a microarray approach to assess
expression of a more limited set of snoRNAs. Of note, of the 102snoRNAs with significantly reduced expression in AML, 37 arelocated in the DLK-DIO3 or SNURF-SNRPN loci. Becauseexpression of these snoRNAs is suppressed during normal myeloiddifferentiation, it is possible that their decrease in AML reflects normaldifferentiation along the myeloid lineage. This is in sharp contrast toprevious studies showing marked increased expression ofDLK-DIO3snoRNAs in acute promyelocytic leukemia.12-14 Of note, Valleron et alshowed that enforced expression of SNORD114-1, which is
Figure 4. (continued) represent the threshold for the log2 fold change (equivalent to a twofold difference). The y-axis reflects the 2log10 (q value–corrected P value). Green
and red colored dots represent snoRNAs showing significantly increased or decreased expression in AML, respectively. (D) Distribution of differentially expressed snoRNAs
across snoRNA subtypes. H/ACA snoRNA distribution includes 4 AluACA snoRNAs.
C19orf48
chr19:51300961-51307974
SNORD88B
SNORD88A
SNORD88C
C
Log 2
exp
ress
ion
-5
SNORD88B
SNORD88C
SNORD88A
0
5
10
15
20 ****
D
Multihost gene
Log 2
exp
ress
ion
0
4
8
12
16
20
E
0 200
Gene
exp
ress
ion, R
PM
snoRNA expression, RPM400 600
0
1000
2000
3000
R2=0.0447
A
Host gene vs snoRNA expression
R2
-0.03
0.00
0.03
0.06
0.09
0.100.300.500.700.901.10
B
Figure 5. Correlation between host gene and snoRNAs expression. (A) Representative plot showing the correlation between the normalized expression of the host
gene RPL7A and its encoded SNORD36B in AML. (B) Summary scatter plot showing the coefficient of determination (R2) of all host gene/snoRNAs pairs (N 5 1379, mean 6 SEM
5 0.037 6 0.102). (C) Organization of the human gene C19orf48 gene (drawing not to scale); exons are shown as n and SNORD88B, 288A and 288C are shown in green-,
blue-, or red-filled boxes, respectively. (D) Log-transformed normalized read counts in AML. Significance was determined by 1-way ANOVA followed by Tukey multiple comparisons test.
(E) Plot showing the log-transformed median expression values for all expressed snoRNAs in a multihost gene (N 5 130). Each line represents a distinct multihost gene.
23 JANUARY 2018 x VOLUME 2, NUMBER 2 snoRNA EXPRESSION IN NORMAL HEMATOPOIESIS AND AML 159
A
C19orf48 2 1
4
65
7
3
8 109
SNORD88B
SNORD88A
SNORD88C
SNORD88C
splice 8
R2=0.1562
00
1
2
3
4
5000
10000
15000
20000
snoRNA expression
Junc
tion
expr
essio
n
Isplice 9
R2=0.141860
40
20
00
5000
10000
15000
20000
snoRNA expression
Junc
tion
expr
essio
n
Jsplice 10
R2=0.01408
05000
10000
15000
20000
snoRNA expression
0.15
0.10
0.05
0.00
0.20
Junc
tion
expr
essio
n
K
Junction vs snoRNAexpression
1.00
0.70
0.40
0.100.090.060.030.00
-0.03
R2
L
SNORD88A
splice 5
R2=0.1612
0 200 400 600 800
snoRNA expression
40
50
30
20
10
0
Junc
tion
expr
essio
n
Fsplice 6
R2=0.0386
0 200 400 600 800
snoRNA expression
0.15
0.10
0.05
0.00
Junc
tion
expr
essio
n
Gsplice 7
R2=0.0566
0 200 400 600 800
snoRNA expression
0.15
0.10
0.05
0.00
0.20
0.25
Junc
tion
expr
essio
n
H
SNORD88B
B
20splice 1
R2=0.0139
15
10
5
00 10 20 30 40 50
snoRNA expression
Junc
tion
expr
essio
n 1.00
0.80
0.60
0.40
0.20
0.00
splice 2
R2=0.0035
0 10 20 30 40 50
snoRNA expression
Junc
tion
expr
essio
n
C
0.15
0.10
0.05
0.00
splice 3
R2=0.0030
0 10 20 30 40 50
snoRNA expression
Junc
tion
expr
essio
n
D
0.00
0.50
1.00
1.50splice 4
R2=0.0749
0 10 20 30 40 50
snoRNA expression
Junc
tion
expr
essio
n
E
Figure 6. Correlation of host gene splicing to snoRNA expression. (A) Schematic of all splice junctions for C19orf48. Coding exons are shown as n and embedded
snoRNAs as color-filled boxes. Each numbered line represents a different splice event. Drawing not to scale. (B-K) RNA splicing was assessed by quantifying each of the
junction reads (splice 1-10). Shown are scatter plots showing normalized junction reads (reads per million) vs snoRNA expression (reads per million). (L) Scatter plot
showing R2 values (mean 6 SEM 5 0.041 6 0.093) between snoRNA expression and host gene splicing (total of 1616 junction reads).
160 WARNER et al 23 JANUARY 2018 x VOLUME 2, NUMBER 2

contained in the DLK1-DIO3 locus, promotes cell growth in vitro,possibly by targeting the Rb pathway.14
We observed significant differential expression of snoRNAs thatmediate pseudouridylation or 29-O methylation of key sites in rRNA.Decreased expression of snoRNAs that target modifications ofthe PTC and ISB regions of the 60S ribosome was observed inAML patients vs normal hematopoietic stem/progenitors. The PTC isthe catalytic site where peptide bonds are made during proteinelongation and peptidyl-tRNAs are hydrolyzed during the terminationof protein synthesis.49 The ISB forms multiple interactions betweenthe ribosomal subunits, which maintain ribosome stability andmodulate dynamics that are critical for translation, such as thatbetween the tRNA and mRNA.50 Studies in yeast suggest that,although loss of pseudouridylation or 29-O methylation at individualrRNA sites has only subtle effects on activity, loss at multiple sites issynergistic, resulting in reading frame changes, increased stop-codon read-through, and altered tRNA selection.51-53 We alsoidentified several snoRNAs responsible for the pseudouridylation ofsnRNAs in regions critical for splicing. For example, scaRNA15,whose expression is reduced 2.81-fold in AML, targets the branchsite recognition region of U2 snRNA. Studies in HeLa cells54 andyeast55 show that pseudouridylation at this site is required for theformation of early spliceosomal complexes and the catalytic phase ofpre-mRNA splicing. Further study is needed to determine whether theobserved decreases in snoRNA expression in AML are sufficient toinduce biologically meaningful differences in translation or splicing.
The mechanisms regulating snoRNA expression are not well defined.Most snoRNAs and scaRNAs are embedded in the introns of hostgenes that produce proteins involved in nucleolar function, ribosomestructure, or protein synthesis,56 providing a potential mechanism forthe coordinated expression of snoRNAs and proteins targetingcommon pathways. Interestingly, we observed that in AML, snoRNAexpression correlates minimally with host gene expression. Recentstudies in yeast and human brain samples have reported a similaruncoupling of host gene and snoRNA expression.57-59 Indeed, weeven observed striking variability in the expression of snoRNAscontained in the same host gene. Mature snoRNAs are producedfrom host genes by exonucleolytic processing of the debranched intronafter splicing.60,61 A recent study suggested that alternative splicing ofhost genes contributes to the regulation of snoRNA expression andaccounts, in part, for the variability in the expression of snoRNAscontained with the same host gene.62 However, in AML, snoRNAexpression and alternative splicing correlate minimally. Thus, in AML,other mechanisms besides host gene expression or splicing arecontributing to mature snoRNA expression. This may includealterations in snoRNA processing, secondary snoRNA structurestability, maturation, trans-acting protein accumulation factors, andintranuclear trafficking of the maturing snoRNPs to the nucleolus orCajal body.63 Of note, many snoRNA host genes contain acharacteristic terminal oligopyrimidine track in their 59-untranslatedregion that has been shown to modulate the differential production of
mRNA vs snoRNAs from that host gene.64,65 Given the critical role ofsnoRNAs in translation, the contribution of these various elements tothe regulation of snoRNA expression warrants further study.
As outlined, array-based and qPCR-based approaches do notdistinguish between mature snoRNAs and primary mRNA transcriptscontaining unprocessed snoRNAs.Without robust orthogonal validationtechnologies for generating gold standard expression values, optimalstatistical procedures for expression normalization from count-basedsequence data have not been established for snoRNAs. This contrastswith miRNA squencing data, for which qPCR provides robustorthogonal validation that has made it possible to evaluate and optimizeexpression normalization methods.40 In the absence of a consensusapproach for snoRNA data, we used the total count method, whichinvolves normalization of the read count for each snoRNA species for thetotal number of counts obtained for each experiment. Additional studieswill be needed to determine the optimal normalization procedures forsequence data from this intermediate-sized RNA species.
In summary, we developed a small RNA-seq pipeline to quantifysnoRNA and other sncRNA expression. We showed that a subset ofsnoRNAs are regulated in lineage- and development-specific expres-sion. Although genetic alterations that specifically target snoRNA genesin AML appear to be uncommon, a subset of snoRNAs are differentiallyexpressed. The contribution of these differentially expressed snoRNAsto the regulation of normal and malignant hematopoiesis represents anexciting new area of investigation.
Acknowledgments
Thisworkwas supported byNational Cancer Institute (NCI), NationalInstitutes of Health (NIH) grant PO1 CA101937 (D.C.L. and T.J.L.);Washington University School of Medicine Graduate School of Artsand Sciences/Chancellor’s Graduate Fellowship Fund 94028C(W.A.W.); NIH, NCI grant K12CA167540 and Clinical and Trans-lational Award UL1 TR000448 from the NIH, National Center forAdvancing Translational Sciences (B.S.W.); and by NIH, NCI grantK08CA190815 and an American Society of Hematology ScholarAward (D.H.S.).
Authorship
Contribution:W.A.W. performed the experiments, analyzed the data,and wrote the manuscript; D.H.S. performed the bioinformaticanalysis, analyzed the data, and edited themanuscript; M.T. andN.H.performed some experiments; B.S.W. performed the splicing anal-ysis; T.J.L. provided some reagents, AML samples, and helped withdata analysis; and D.C.L. designed and supervised the entire re-search project and edited the manuscript.
Conflict-of-interest disclosure: The authors declare no compet-ing financial interests.
Correspondence: Daniel C. Link, Washington University Schoolof Medicine, 660 S Euclid Ave, Campus Box 8007, St. Louis, MO63110; e-mail: [email protected].
References
1. Luo M, Jeong M, Sun D, et al. Long non-coding RNAs control hematopoietic stem cell function. Cell Stem Cell. 2015;16(4):426-438.
2. Raaijmakers MH, Mukherjee S, Guo S, et al. Bone progenitor dysfunction induces myelodysplasia and secondary leukaemia. Nature. 2010;464(7290):852-857.
23 JANUARY 2018 x VOLUME 2, NUMBER 2 snoRNA EXPRESSION IN NORMAL HEMATOPOIESIS AND AML 161

3. Georgantas RW III, Hildreth R, Morisot S, et al. CD341 hematopoietic stem-progenitor cell microRNA expression and function: a circuit diagramof differentiation control. Proc Natl Acad Sci USA. 2007;104(8):2750-2755.
4. Hu W, Dooley J, Chung SS, et al. miR-29a maintains mouse hematopoietic stem cell self-renewal by regulating Dnmt3a. Blood. 2015;125(14):2206-2216.
5. Reichow SL, Hamma T, Ferre-D’Amare AR, Varani G. The structure and function of small nucleolar ribonucleoproteins. Nucleic Acids Res. 2007;35(5):1452-1464.
6. Kiss T. Small nucleolar RNAs: an abundant group of noncoding RNAs with diverse cellular functions. Cell. 2002;109(2):145-148.
7. Zhou HL, Luo G, Wise JA, Lou H. Regulation of alternative splicing by local histone modifications: potential roles for RNA-guided mechanisms.Nucleic Acids Res. 2014;42(2):701-713.
8. Schubert T, Langst G. Changes in higher order structures of chromatin by RNP complexes. RNA Biol. 2013;10(2):175-179.
9. Michel CI, Holley CL, Scruggs BS, et al. Small nucleolar RNAs U32a, U33, and U35a are critical mediators of metabolic stress.Cell Metab. 2011;14(1):33-44.
10. Siprashvili Z, Webster DE, Johnston D, et al. The noncoding RNAs SNORD50A and SNORD50B bind K-Ras and are recurrently deleted in humancancer. Nat Genet. 2016;48(1):53-58.
11. Chu L, Su MY, Maggi LB Jr, et al. Multiple myeloma-associated chromosomal translocation activates orphan snoRNA ACA11 to suppressoxidative stress. J Clin Invest. 2012;122(8):2793-2806.
12. Cohen Y, Hertzog K, Reish O, et al. The increased expression of 14q32 small nucleolar RNA transcripts in promyelocytic leukemia cells is notdependent on PML-RARA fusion gene. Blood Cancer J. 2012;2(10):e92.
13. Liuksiala T, Teittinen KJ, Granberg K, et al. Overexpression of SNORD114-3 marks acute promyelocytic leukemia. Leukemia. 2014;28(1):233-236.
14. Valleron W, Laprevotte E, Gautier EF, et al. Specific small nucleolar RNA expression profiles in acute leukemia. Leukemia. 2012;26(9):2052-2060.
15. Teittinen KJ, Laiho A, Uusimaki A, Pursiheimo JP, Gyenesei A, Lohi O. Expression of small nucleolar RNAs in leukemic cells. Cell Oncol (Dordr). 2013;36(1):55-63.
16. Ronchetti D, Todoerti K, Tuana G, et al. The expression pattern of small nucleolar and small Cajal body-specific RNAs characterizes distinctmolecular subtypes of multiple myeloma. Blood Cancer J. 2012;2(11):e96.
17. Elghetany MT, Patel J, Martinez J, Schwab H. CD87 as a marker for terminal granulocytic maturation: assessment of its expression duringgranulopoiesis. Cytometry B Clin Cytom. 2003;51(1):9-13.
18. Huang X, Yuan T, Tschannen M, et al. Characterization of human plasma-derived exosomal RNAs by deep sequencing. BMC Genomics. 2013;14(1):319.
19. Li H. Aligning sequence reads, clone sequences and assembly contigs with BWA-MEM. ARXIV. 2013;arXiv:1303.3997.
20. Harrow J, Frankish A, Gonzalez JM, et al. GENCODE: the reference human genome annotation for The ENCODE Project. Genome Res. 2012;22(9):1760-1774.
21. Kozomara A, Griffiths-Jones S. miRBase: annotating high confidence microRNAs using deep sequencing data. Nucleic Acids Res. 2014;42(D1):D68-D73.
22. Jorjani H, Kehr S, Jedlinski DJ, et al. An updated human snoRNAome. Nucleic Acids Res. 2016;44(11):5068-5082.
23. Schattner P, Barberan-Soler S, Lowe TM. A computational screen for mammalian pseudouridylation guide H/ACA RNAs. RNA. 2006;12(1):15-25.
24. Lowe TM, Eddy SR. A computational screen for methylation guide snoRNAs in yeast. Science. 1999;283(5405):1168-1171.
25. Hertel J, Hofacker IL, Stadler PF. SnoReport: computational identification of snoRNAs with unknown targets. Bioinformatics. 2008;24(2):158-164.
26. Robinson JT, Thorvaldsdottir H, Winckler W, et al. Integrative genomics viewer. Nat Biotechnol. 2011;29(1):24-26.
27. Kent WJ, Sugnet CW, Furey TS, et al. The human genome browser at UCSC. Genome Res. 2002;12(6):996-1006.
28. Griffiths-Jones S, Grocock RJ, van Dongen S, Bateman A, Enright AJ. miRBase: microRNA sequences, targets and gene nomenclature. NucleicAcids Res. 2006;34(suppl 1):D140-D144.
29. Liao Y, Smyth GK, Shi W. featureCounts: an efficient general purpose program for assigning sequence reads to genomic features.Bioinformatics. 2014;30(7):923-930.
30. Partek Flow. Version 3.0. St. Louis, MO: Partek Inc.; 2014.
31. Eisenhart C. The assumptions underlying the analysis of variance. Biometrics. 1947;3(1):1-21.
32. Frazee AC, Pertea G, Jaffe AE, Langmead B, Salzberg SL, Leek JT. Ballgown bridges the gap between transcriptome assembly and expressionanalysis. Nat Biotechnol. 2015;33(3):243-246.
33. R Development Core Team. R: a language and environment for statistical computing. Vienna, Austria: R Foundation for Statistical Computing; 2013.
34. Quinlan AR, Hall IM. BEDTools: a flexible suite of utilities for comparing genomic features. Bioinformatics. 2010;26(6):841-842.
35. Ley TJ, Miller C, Ding L, et al; Cancer Genome Atlas Research Network. Genomic and epigenomic landscapes of adult de novo acute myeloidleukemia. N Engl J Med. 2013;368(22):2059-2074.
36. Dieci G, Preti M, Montanini B. Eukaryotic snoRNAs: a paradigm for gene expression flexibility. Genomics. 2009;94(2):83-88.
37. Trapnell C, Pachter L, Salzberg SL. TopHat: discovering splice junctions with RNA-Seq. Bioinformatics. 2009;25(9):1105-1111.
162 WARNER et al 23 JANUARY 2018 x VOLUME 2, NUMBER 2
38. Head SR, Komori HK, LaMere SA, et al. Library construction for next-generation sequencing: overviews and challenges. Biotechniques. 2014;56(2):61-64, 66, 68 passim.
39. Dillies MA, Rau A, Aubert J, et al; French StatOmique Consortium. A comprehensive evaluation of normalization methods for Illuminahigh-throughput RNA sequencing data analysis. Brief Bioinform. 2013;14(6):671-683.
40. Garmire LX, Subramaniam S. Evaluation of normalization methods in mammalian microRNA-Seq data. RNA. 2012;18(6):1279-1288.
41. Garmire LX, Subramaniam S. The poor performance of TMM on microRNA-Seq. RNA. 2013;19(6):735-736.
42. Galiveti CR, Rozhdestvensky TS, Brosius J, Lehrach H, Konthur Z. Application of housekeeping npcRNAs for quantitative expression analysis ofhuman transcriptome by real-time PCR. RNA. 2010;16(2):450-461.
43. Alvarez-Dominguez JR, HuW, Gromatzky AA, Lodish HF. Long noncoding RNAs during normal and malignant hematopoiesis. Int J Hematol. 2014;99(5):531-541.
44. Dostalova Merkerova M, Krejcik Z, Votavova H, Belickova M, Vasikova A, Cermak J. Distinctive microRNA expression profiles in CD341 bonemarrow cells from patients with myelodysplastic syndrome. Eur J Hum Genet. 2011;19(3):313-319.
45. de Smith AJ, Purmann C, Walters RG, et al. A deletion of the HBII-85 class of small nucleolar RNAs (snoRNAs) is associated with hyperphagia,obesity and hypogonadism. Hum Mol Genet. 2009;18(17):3257-3265.
46. Peters J. Prader-Willi and snoRNAs. Nat Genet. 2008;40(6):688-689.
47. Kishore S, Stamm S. The snoRNA HBII-52 regulates alternative splicing of the serotonin receptor 2C. Science. 2006;311(5758):230-232.
48. Stadtfeld M, Apostolou E, Ferrari F, et al. Ascorbic acid prevents loss of Dlk1-Dio3 imprinting and facilitates generation of all-iPS cell mice fromterminally differentiated B cells. Nat Genet. 2012;44(4):398-405.
49. Beringer M, Rodnina MV. The ribosomal peptidyl transferase. Mol Cell. 2007;26(3):311-321.
50. Liu Q, Fredrick K. Intersubunit bridges of the bacterial ribosome. J Mol Biol. 2016;428(10 pt B):2146-2164.
51. Baxter-Roshek JL, Petrov AN, Dinman JD. Optimization of ribosome structure and function by rRNA base modification. PLoS One. 2007;2(1):e174.
52. King TH, Liu B, McCully RR, Fournier MJ. Ribosome structure and activity are altered in cells lacking snoRNPs that form pseudouridines in thepeptidyl transferase center. Mol Cell. 2003;11(2):425-435.
53. Liang XH, Liu Q, Fournier MJ. rRNA modifications in an intersubunit bridge of the ribosome strongly affect both ribosome biogenesis and activity.Mol Cell. 2007;28(6):965-977.
54. Donmez G, Hartmuth K, Luhrmann R. Modified nucleotides at the 59 end of human U2 snRNA are required for spliceosomal E-complex formation.RNA. 2004;10(12):1925-1933.
55. Yu YT, Shu MD, Steitz JA. Modifications of U2 snRNA are required for snRNP assembly and pre-mRNA splicing. EMBO J. 1998;17(19):5783-5795.
56. Maxwell ES, Fournier MJ. The small nucleolar RNAs. Annu Rev Biochem. 1995;64(1):897-934.
57. Zhang B, Han D, Korostelev Y, et al. Changes in snoRNA and snRNA Abundance in the Human, Chimpanzee, Macaque, and Mouse Brain.Genome Biol Evol. 2016;8(3):840-850.
58. Ge J, Crosby SD, Heinz ME, Bessler M, Mason PJ. SnoRNA microarray analysis reveals changes in H/ACA and C/D RNA levels caused bydyskerin ablation in mouse liver. Biochem J. 2010;429(1):33-41.
59. He H, Cai L, Skogerbø G, et al. Profiling Caenorhabditis elegans non-coding RNA expression with a combined microarray. Nucleic Acids Res. 2006;34(10):2976-2983.
60. Allmang C, Kufel J, Chanfreau G, Mitchell P, Petfalski E, Tollervey D. Functions of the exosome in rRNA, snoRNA and snRNA synthesis. EMBO J. 1999;18(19):5399-5410.
61. van Hoof A, Lennertz P, Parker R. Yeast exosome mutants accumulate 39-extended polyadenylated forms of U4 small nuclear RNA and smallnucleolar RNAs. Mol Cell Biol. 2000;20(2):441-452.
62. Lykke-Andersen S, Chen Y, Ardal BR, et al. Human nonsense-mediated RNA decay initiates widely by endonucleolysis and targets snoRNA hostgenes. Genes Dev. 2014;28(22):2498-2517.
63. Kiss T, Fayet E, Jady BE, Richard P, Weber M. Biogenesis and intranuclear trafficking of human box C/D and H/ACA RNPs. Cold Spring HarbSymp Quant Biol. 2006;71:407-417.
64. de Turris V, Di Leva G, Caldarola S, Loreni F, Amaldi F, Bozzoni I. TOP promoter elements control the relative ratio of intron-encoded snoRNAversus spliced mRNA biosynthesis. J Mol Biol. 2004;344(2):383-394.
65. Smith CM, Steitz JA. Classification of gas5 as a multi-small-nucleolar-RNA (snoRNA) host gene and a member of the 59-terminal oligopyrimidinegene family reveals common features of snoRNA host genes. Mol Cell Biol. 1998;18(12):6897-6909.
23 JANUARY 2018 x VOLUME 2, NUMBER 2 snoRNA EXPRESSION IN NORMAL HEMATOPOIESIS AND AML 163