Embed Size (px)
Citation preview
©FUNPEC-RP www.funpecrp.com.brGenetics and Molecular Research 15 (2): gmr.15027954
Expression profile of rice Hsp genes under anoxic stress
L.M. Mertz-Henning1, C. Pegoraro2, L.C. Maia2, E. Venske2, C.V. Rombaldi3 and A. Costa de Oliveira2
1Embrapa Soja, Londrina, PR, Brasil2Centro de Genômica e Fitomelhoramento, Departamento de Fitotecnia, Faculdade de Agronomia Eliseu Maciel, Universidade Federal de Pelotas, Pelotas, RS, Brasil3Departamento de Ciência e Tecnologia Agroindustrial, Faculdade de Agronomia Eliseu Maciel, Universidade Federal de Pelotas, Pelotas, RS, Brasil
Corresponding author: A. Costa de OliveiraE-mail: [email protected]
Genet. Mol. Res. 15 (2): gmr.15027954Received October 29, 2015Accepted December 8, 2015Published May 6, 2016DOI http://dx.doi.org/10.4238/gmr.15027954
ABSTRACT. Although flooding is one of the most important environmental stresses worldwide, not all plant species are intolerant to its effects. Species from semi-aquatic environments, such as rice, have the capacity to cope with flooding stress. Heat-shock proteins (Hsps) are thought to contribute to cellular homeostasis under both optimal and adverse growth conditions. Studies of gene expression in plants exposed to low levels of oxygen revealed the up-regulation of Hsp genes. However, it is not clear whether Hsp genes are transcribed as a function of tolerance or whether they represent a response to anoxic stress. Therefore, the accumulation of Hsp gene transcripts was investigated in two different cultivars, “Nipponbare” (flooding tolerant) and “IPSL 2070” (flooding sensitive), subjected to anoxic stress. Fifteen-day-old rice root seedlings from both cultivars were used. Four different treatments were performed: no anoxia (control); 24-h anoxia; 48-h
2L.M. Mertz-Henning et al.
©FUNPEC-RP www.funpecrp.com.brGenetics and Molecular Research 15 (2): gmr.15027954
anoxia; and 72-h anoxia. Anoxic stress was confirmed by the increased gene expression of alcohol dehydrogenase. The data obtained showed that both rice cultivars (“Nipponbare” and “IPSL 2070”) accumulated Hsp gene transcripts under anoxic stress; however, the majority of the Hsp genes evaluated were responsive to anoxic stress in “IPSL 2070” (flooding sensitive), whereas in “Nipponbare” (flooding tolerant), only six genes were highly up-regulated. This suggests that although Hsps have an important role in the response to anoxia, they are not the major cause of tolerance.
Key words: Oryza sativa; Heat-shock proteins; Flooding
INTRODUCTION
In natural environments, plants often have to survive with limited oxygen as a consequence of poor soil drainage, soil compaction, or submergence. Molecular oxygen deficiency leads to altered cellular metabolism and can dramatically reduce crop yield (Fukao and Bailey-Serres, 2004). Molecular oxygen is the terminal electron acceptor in the mitochondrial electron transport chain and is required by several enzymes including those that produce reactive oxygen species as signaling molecules. In plants, oxygen deficiency dramatically reduces the efficiency of cellular ATP production, which has diverse consequences on cellular metabolism and development (Fukao and Bailey-Serres, 2004).
Most species originating from semi-aquatic environments, such as rice (Oryza sativa L.) are able to cope with flooding stress, can survive complete prolonged submergence, and have the capacity to produce high yields. A range of metabolic and morphologic adaptations characterizes these tolerant species, which can generate ATP without the presence of oxygen (fermentative metabolism) or can develop specific morphologies (air channels, enhanced shoot elongation) that improve oxygen uptake (Colmer, 2003; Voesenek et al., 2006). However, most crops that lack these mechanisms can be affected by daily and/or seasonal fluctuations of oxygen availability in the soil. This is a concern of farmers from Southern Brazil, considering that around 27% of the arable land in this region is characterized by poor soil drainage, thus representing a major barrier preventing them from obtaining maximum yields from their crops. On the other hand, most rice varieties are tolerant to fluctuations in oxygen levels.
Abiotic stress responses in plants include mechanisms of perception and signal transduction networks that include a large array of stress-regulated genes. Plant scientists have used genetics, cell biology, and biochemistry tools to elucidate the mechanisms involved in the cellular response to oxygen deficiency. An important discovery involved in plant adaptation to anoxia stress was the identification of the rice Sub1 (Submergence) locus and the elucidation of its role in submergence tolerance (Siangliw et al., 2003; Fukao et al., 2006; Xu et al., 2006). Rice Sub1A was identified as a key element for rice flooding tolerance. However, the ability of rice seeds to germinate under complete anoxia is not likely to be explained by the presence of Sub1 genes (Lasanthi-Kudahettige et al., 2007).
Among the proteins that respond to abiotic stress conditions are heat shock proteins (Hsps), or molecular chaperones, which contribute to cellular homeostasis (Wang et al., 2004; Sarkar et al., 2009). Hsps are responsible for protein folding, assembly, translocation, and
3Hsp genes and anoxic stress
©FUNPEC-RP www.funpecrp.com.brGenetics and Molecular Research 15 (2): gmr.15027954
degradation in a broad array of normal cellular processes. In addition, Hsps cooperate with other proteins and/or cellular components in normal cellular processes and can assist in protein re-folding under stress conditions to re-establish cellular homeostasis (Wang et al., 2004).
Five major conserved families of Hsps have been identified, the Hsp70 family, the chaperonins (Hsp60), the Hsp90 family, the Hsp100 family, and the low molecular mass (12-40 kDa) small Hsp (sHsp) family (Wang et al., 2004). Among the various plant Hsps, the sHsps are maximally expressed under stress conditions (Sarkar et al., 2009). sHsps are encoded by nuclear multigene families and are located within different cellular compartments. For example, the mitochondria and plastids import more than 40 Hsps for use in normal metabolic processes. Detailed studies have shown that plant sHsps are produced in response to a wide array of environmental stresses (Sun et al., 2002; Sarkar et al., 2009) and can either act as a response or an origin of stress tolerance. For example, transgenic carrot cell lines and tomato plants overexpressing sHsp 17.7 showed enhanced thermotolerance (Malik et al., 1997). Similar results were observed in rice overexpressing the Hsp 17.7 gene (Murakami et al., 2004).
Global expression analysis of Arabidopsis and rice plants subjected to anoxic stress showed that Hsps are highly up-regulated in this condition suggesting that these proteins may play an important role in survival in the presence of low oxygen (Loreti et al., 2005; Lasanthi-Kudahettige et al., 2007). In Arabidopsis, anoxia was shown to induce several Hsps, with significant overlap between anoxia and heat responses observed in whole genome microarray analyses (Banti et al., 2010). However, it is not clear whether Hsps represent a tolerance mechanism or a response to anoxic stress. Rice is a model plant species of the monocot group because of its relatively small and completely sequenced genome (International Rice Genome Sequencing Project, 2005). In addition, rice is an ideal model for the study of anoxia-tolerance mechanisms because different genotypes exhibit differential tolerance patterns.
Therefore, in this study, the accumulation of Hsp gene transcripts under anoxia stress was investigated in two cultivars, “Nipponbare” (flooding tolerant) and “IPSL 2070” (flooding sensitive).
MATERIAL AND METHODS
Plant material
Two rice (O. sativa) cultivars were used in this study: “Nipponbare” (flooding tolerant) and “IPSL 2070” (flooding sensitive). Seeds were treated for 15 min in a solution containing 0.5% sodium hypochlorite, pH 5.5, rinsed and washed 10 times in sterile water, and germinated on sterile filter paper at 25°C. Fifteen-day-old seedlings were subjected to anoxia for 0, 24, 48, and 72 h using 0.5-L glass jars flushed with 100% N2. Anoxic treatments were performed in the dark. Three replicate experiments were performed for each experimental condition, and each replicate involved 15 seedlings. After each time period, rice roots were collected and immediately stored at -80°C until use.
Quantitative reverse transcription-polymerase chain reaction (qRT-PCR) analysis
A set of 15 Hsp genes was evaluated (Table 1). Sequences were obtained from the Rice Annotation Project database (RAP-DB) (http://rapdb.dna.affrc.go.jp/). Primers were designed
4L.M. Mertz-Henning et al.
©FUNPEC-RP www.funpecrp.com.brGenetics and Molecular Research 15 (2): gmr.15027954
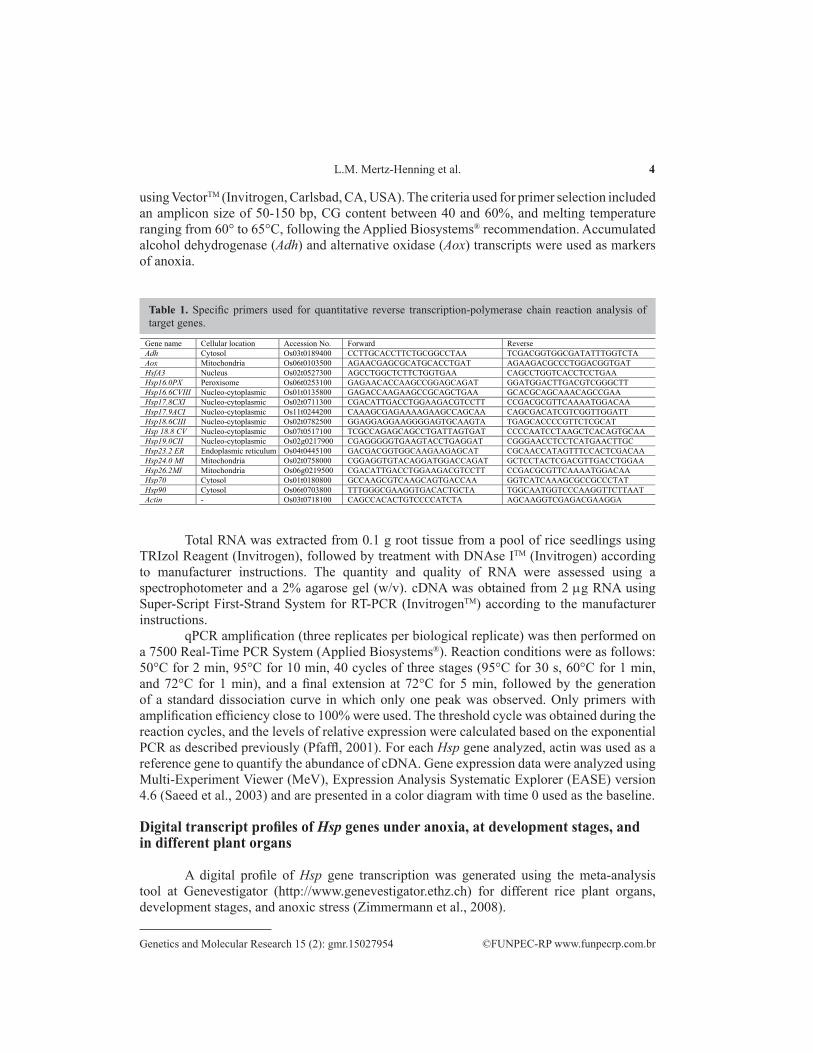
using VectorTM (Invitrogen, Carlsbad, CA, USA). The criteria used for primer selection included an amplicon size of 50-150 bp, CG content between 40 and 60%, and melting temperature ranging from 60° to 65°C, following the Applied Biosystems® recommendation. Accumulated alcohol dehydrogenase (Adh) and alternative oxidase (Aox) transcripts were used as markers of anoxia.
Table 1. Specific primers used for quantitative reverse transcription-polymerase chain reaction analysis of target genes.
Gene name Cellular location Accession No. Forward ReverseAdh Cytosol Os03t0189400 CCTTGCACCTTCTGCGGCCTAA TCGACGGTGGCGATATTTGGTCTAAox Mitochondria Os06t0103500 AGAACGAGCGCATGCACCTGAT AGAAGACGCCCTGGACGGTGATHsfA3 Nucleus Os02t0527300 AGCCTGGCTCTTCTGGTGAA CAGCCTGGTCACCTCCTGAAHsp16.0PX Peroxisome Os06t0253100 GAGAACACCAAGCCGGAGCAGAT GGATGGACTTGACGTCGGGCTTHsp16.6CVIII Nucleo-cytoplasmic Os01t0135800 GAGACCAAGAAGCCGCAGCTGAA GCACGCAGCAAACAGCCGAAHsp17.8CXI Nucleo-cytoplasmic Os02t0711300 CGACATTGACCTGGAAGACGTCCTT CCGACGCGTTCAAAATGGACAAHsp17.9ACI Nucleo-cytoplasmic Os11t0244200 CAAAGCGAGAAAAGAAGCCAGCAA CAGCGACATCGTCGGTTGGATTHsp18.6CIII Nucleo-cytoplasmic Os02t0782500 GGAGGAGGAAGGGGAGTGCAAGTA TGAGCACCCCGTTCTCGCATHsp 18.8 CV Nucleo-cytoplasmic Os07t0517100 TCGCCAGAGCAGCCTGATTAGTGAT CCCCAATCCTAAGCTCACAGTGCAAHsp19.0CII Nucleo-cytoplasmic Os02g0217900 CGAGGGGGTGAAGTACCTGAGGAT CGGGAACCTCCTCATGAACTTGCHsp23.2 ER Endoplasmic reticulum Os04t0445100 GACGACGGTGGCAAGAAGAGCAT CGCAACCATAGTTTCCACTCGACAAHsp24.0 MI Mitochondria Os02t0758000 CGGAGGTGTACAGGATGGACCAGAT GCTCCTACTCGACGTTGACCTGGAAHsp26.2MI Mitochondria Os06g0219500 CGACATTGACCTGGAAGACGTCCTT CCGACGCGTTCAAAATGGACAAHsp70 Cytosol Os01t0180800 GCCAAGCGTCAAGCAGTGACCAA GGTCATCAAAGCGCCGCCCTATHsp90 Cytosol Os06t0703800 TTTGGGCGAAGGTGACACTGCTA TGGCAATGGTCCCAAGGTTCTTAATActin - Os03t0718100 CAGCCACACTGTCCCCATCTA AGCAAGGTCGAGACGAAGGA
Total RNA was extracted from 0.1 g root tissue from a pool of rice seedlings using TRIzol Reagent (Invitrogen), followed by treatment with DNAse ITM (Invitrogen) according to manufacturer instructions. The quantity and quality of RNA were assessed using a spectrophotometer and a 2% agarose gel (w/v). cDNA was obtained from 2 mg RNA using Super-Script First-Strand System for RT-PCR (InvitrogenTM) according to the manufacturer instructions.
qPCR amplification (three replicates per biological replicate) was then performed on a 7500 Real-Time PCR System (Applied Biosystems®). Reaction conditions were as follows: 50°C for 2 min, 95°C for 10 min, 40 cycles of three stages (95°C for 30 s, 60°C for 1 min, and 72°C for 1 min), and a final extension at 72°C for 5 min, followed by the generation of a standard dissociation curve in which only one peak was observed. Only primers with amplification efficiency close to 100% were used. The threshold cycle was obtained during the reaction cycles, and the levels of relative expression were calculated based on the exponential PCR as described previously (Pfaffl, 2001). For each Hsp gene analyzed, actin was used as a reference gene to quantify the abundance of cDNA. Gene expression data were analyzed using Multi-Experiment Viewer (MeV), Expression Analysis Systematic Explorer (EASE) version 4.6 (Saeed et al., 2003) and are presented in a color diagram with time 0 used as the baseline.
Digital transcript profiles of Hsp genes under anoxia, at development stages, and in different plant organs
A digital profile of Hsp gene transcription was generated using the meta-analysis tool at Genevestigator (http://www.genevestigator.ethz.ch) for different rice plant organs, development stages, and anoxic stress (Zimmermann et al., 2008).
5Hsp genes and anoxic stress
©FUNPEC-RP www.funpecrp.com.brGenetics and Molecular Research 15 (2): gmr.15027954
Determination of conserved motifs
Conserved motifs within amino acid sequences were detected using Multiple EM for Motif Elicitation (MEME) (http://meme.sdsc.edu/meme4_4_0/intro.html) version 4.4.0 (Bailey and Elkan, 1994). The sequences were analyzed by the Pfam software (The protein family database) (http://pfam.sanger.ac.uk/search) and the functions of the motifs were predicted.
RESULTS
Alcohol dehydrogenase and alternative oxidase as anoxia indicator
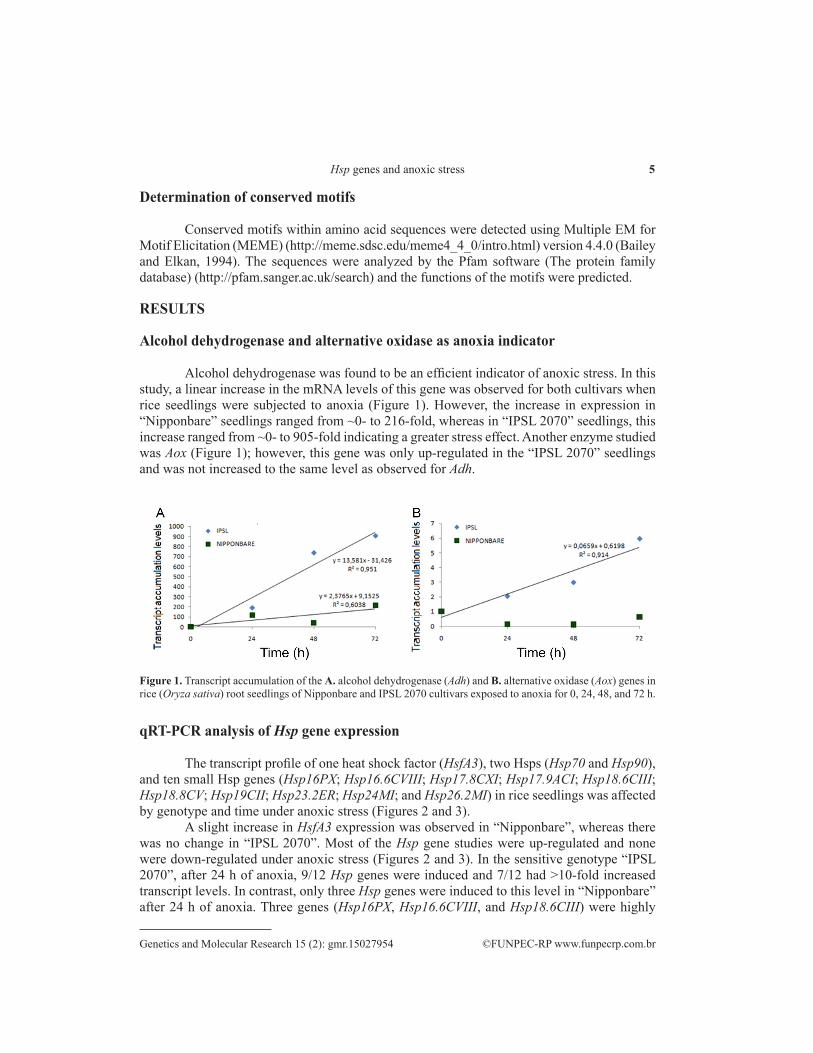
Alcohol dehydrogenase was found to be an efficient indicator of anoxic stress. In this study, a linear increase in the mRNA levels of this gene was observed for both cultivars when rice seedlings were subjected to anoxia (Figure 1). However, the increase in expression in “Nipponbare” seedlings ranged from ~0- to 216-fold, whereas in “IPSL 2070” seedlings, this increase ranged from ~0- to 905-fold indicating a greater stress effect. Another enzyme studied was Aox (Figure 1); however, this gene was only up-regulated in the “IPSL 2070” seedlings and was not increased to the same level as observed for Adh.
Figure 1. Transcript accumulation of the A. alcohol dehydrogenase (Adh) and B. alternative oxidase (Aox) genes in rice (Oryza sativa) root seedlings of Nipponbare and IPSL 2070 cultivars exposed to anoxia for 0, 24, 48, and 72 h.
qRT-PCR analysis of Hsp gene expression
The transcript profile of one heat shock factor (HsfA3), two Hsps (Hsp70 and Hsp90), and ten small Hsp genes (Hsp16PX; Hsp16.6CVIII; Hsp17.8CXI; Hsp17.9ACI; Hsp18.6CIII; Hsp18.8CV; Hsp19CII; Hsp23.2ER; Hsp24MI; and Hsp26.2MI) in rice seedlings was affected by genotype and time under anoxic stress (Figures 2 and 3).
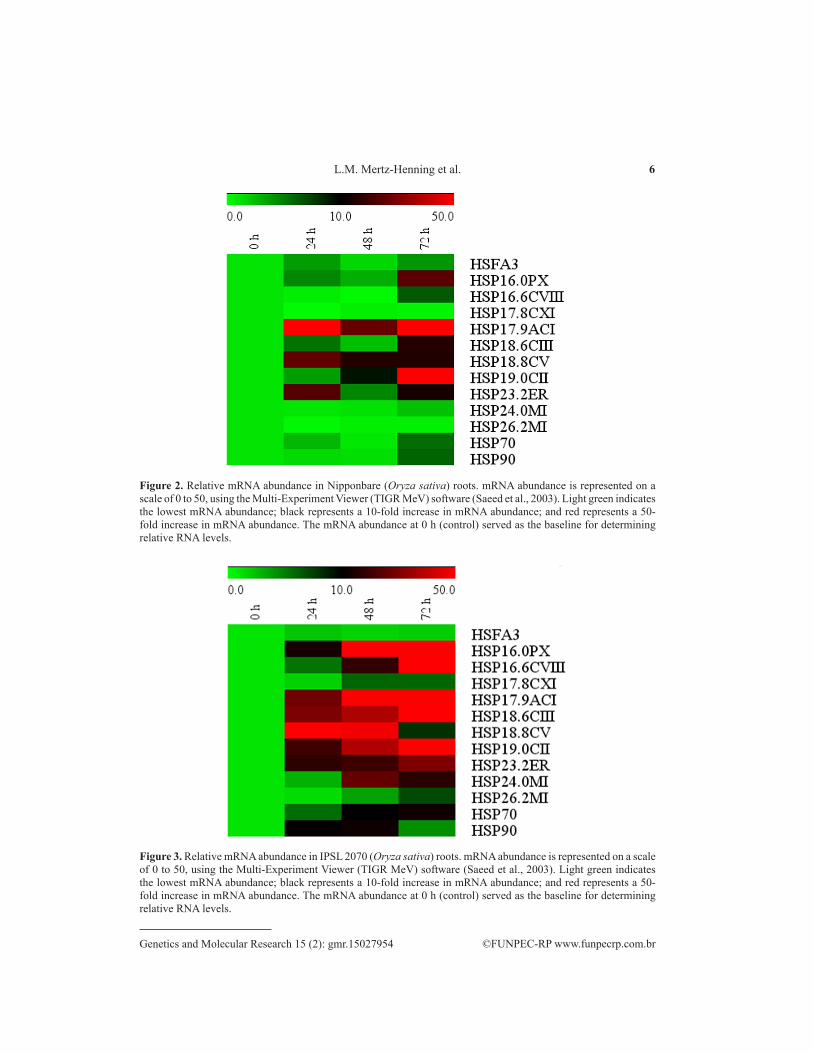
A slight increase in HsfA3 expression was observed in “Nipponbare”, whereas there was no change in “IPSL 2070”. Most of the Hsp gene studies were up-regulated and none were down-regulated under anoxic stress (Figures 2 and 3). In the sensitive genotype “IPSL 2070”, after 24 h of anoxia, 9/12 Hsp genes were induced and 7/12 had >10-fold increased transcript levels. In contrast, only three Hsp genes were induced to this level in “Nipponbare” after 24 h of anoxia. Three genes (Hsp16PX, Hsp16.6CVIII, and Hsp18.6CIII) were highly
6L.M. Mertz-Henning et al.
©FUNPEC-RP www.funpecrp.com.brGenetics and Molecular Research 15 (2): gmr.15027954
Figure 2. Relative mRNA abundance in Nipponbare (Oryza sativa) roots. mRNA abundance is represented on a scale of 0 to 50, using the Multi-Experiment Viewer (TIGR MeV) software (Saeed et al., 2003). Light green indicates the lowest mRNA abundance; black represents a 10-fold increase in mRNA abundance; and red represents a 50-fold increase in mRNA abundance. The mRNA abundance at 0 h (control) served as the baseline for determining relative RNA levels.
Figure 3. Relative mRNA abundance in IPSL 2070 (Oryza sativa) roots. mRNA abundance is represented on a scale of 0 to 50, using the Multi-Experiment Viewer (TIGR MeV) software (Saeed et al., 2003). Light green indicates the lowest mRNA abundance; black represents a 10-fold increase in mRNA abundance; and red represents a 50-fold increase in mRNA abundance. The mRNA abundance at 0 h (control) served as the baseline for determining relative RNA levels.
7Hsp genes and anoxic stress
©FUNPEC-RP www.funpecrp.com.brGenetics and Molecular Research 15 (2): gmr.15027954
up-regulated in “IPSL 2070”, upon the initiation of stress, while in “Nipponbare”, this increase was only minor and began 72 h after stress induction. For Hsp17.8CXI, an increase in transcript accumulation was observed in “IPSL 2070” 48 h after stress induction, but no changes were detected in “Nipponbare”. Hsp17.9ACI was highly up-regulated in both cultivars and the Hsp18.8CV and Hsp19CII genes were expressed at the same level in both cultivars, in which they were up-regulated upon the initiation of stress, with a steeper increase being detected in “ISPL 2070”. Hsp23.2ER was highly up-regulated in “ISPL 2070” and increased over time, whereas in “Nipponbare”, this gene showed up and down variation in expression with stress exposure times. Hsp24MI expression increased from 24 h in “IPSL 2070” and in “Nipponbare” only a slight increase was observed 72 h after the induction of stress. The Hsp26.2MI gene showed a slight up-regulation in “IPSL 2070” and was unaltered in “Nipponbare”.
Genes belonging to the Hsp70 and Hsp90 families were up-regulated in “IPSL 2070” while in “Nipponbare” the up-regulation of these genes was weaker and occurred later, i.e., 72 h after the beginning of anoxia stress.
Digital transcript profiles of Hsp genes under anoxia, in development stages, and in different plant organs
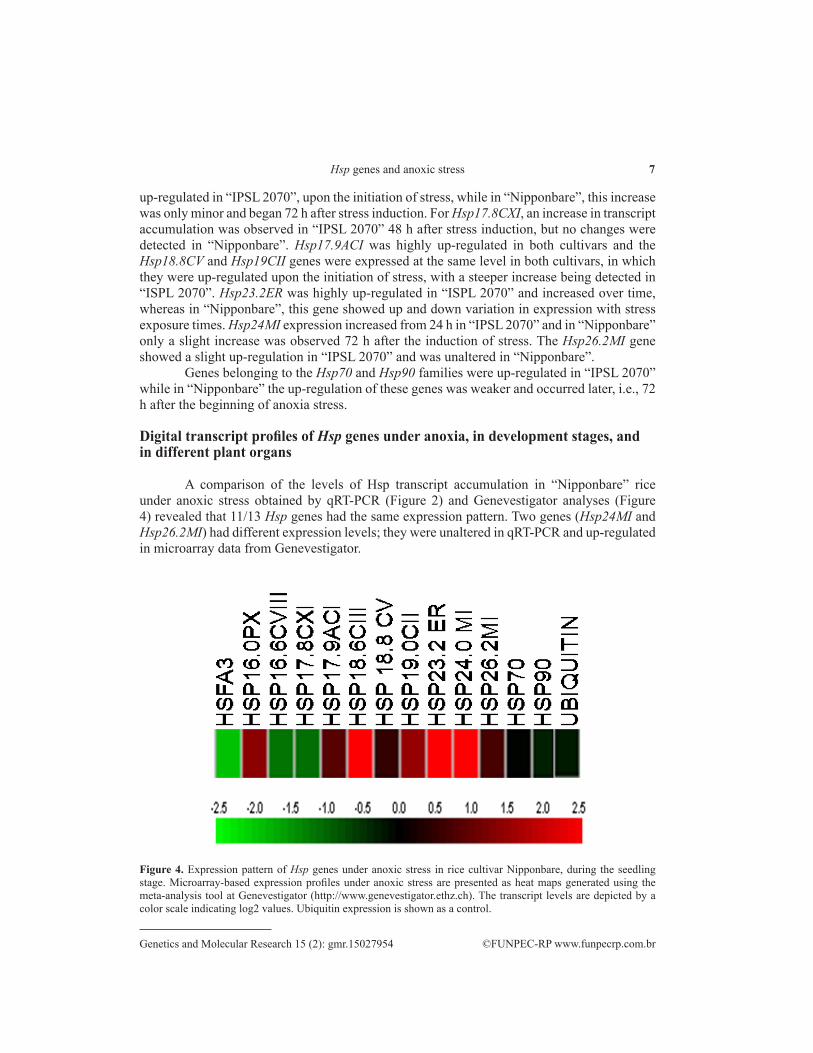
A comparison of the levels of Hsp transcript accumulation in “Nipponbare” rice under anoxic stress obtained by qRT-PCR (Figure 2) and Genevestigator analyses (Figure 4) revealed that 11/13 Hsp genes had the same expression pattern. Two genes (Hsp24MI and Hsp26.2MI) had different expression levels; they were unaltered in qRT-PCR and up-regulated in microarray data from Genevestigator.
Figure 4. Expression pattern of Hsp genes under anoxic stress in rice cultivar Nipponbare, during the seedling stage. Microarray-based expression profiles under anoxic stress are presented as heat maps generated using the meta-analysis tool at Genevestigator (http://www.genevestigator.ethz.ch). The transcript levels are depicted by a color scale indicating log2 values. Ubiquitin expression is shown as a control.
8L.M. Mertz-Henning et al.
©FUNPEC-RP www.funpecrp.com.brGenetics and Molecular Research 15 (2): gmr.15027954
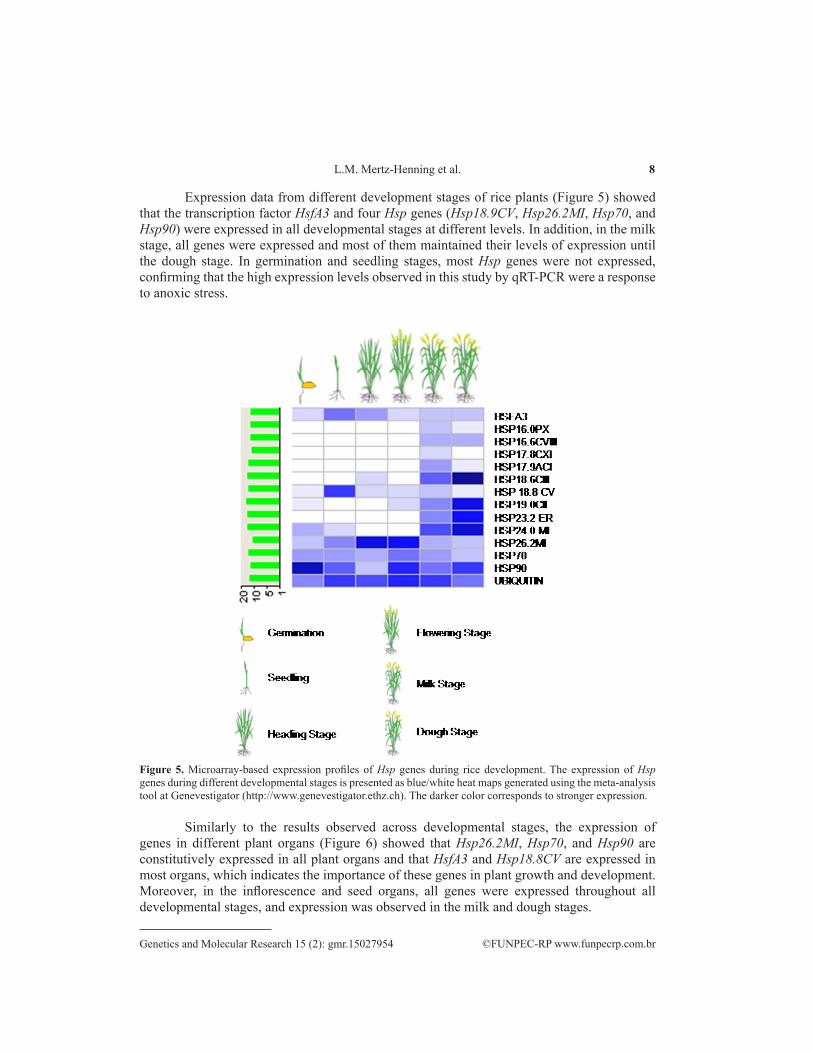
Expression data from different development stages of rice plants (Figure 5) showed that the transcription factor HsfA3 and four Hsp genes (Hsp18.9CV, Hsp26.2MI, Hsp70, and Hsp90) were expressed in all developmental stages at different levels. In addition, in the milk stage, all genes were expressed and most of them maintained their levels of expression until the dough stage. In germination and seedling stages, most Hsp genes were not expressed, confirming that the high expression levels observed in this study by qRT-PCR were a response to anoxic stress.
Figure 5. Microarray-based expression profiles of Hsp genes during rice development. The expression of Hsp genes during different developmental stages is presented as blue/white heat maps generated using the meta-analysis tool at Genevestigator (http://www.genevestigator.ethz.ch). The darker color corresponds to stronger expression.
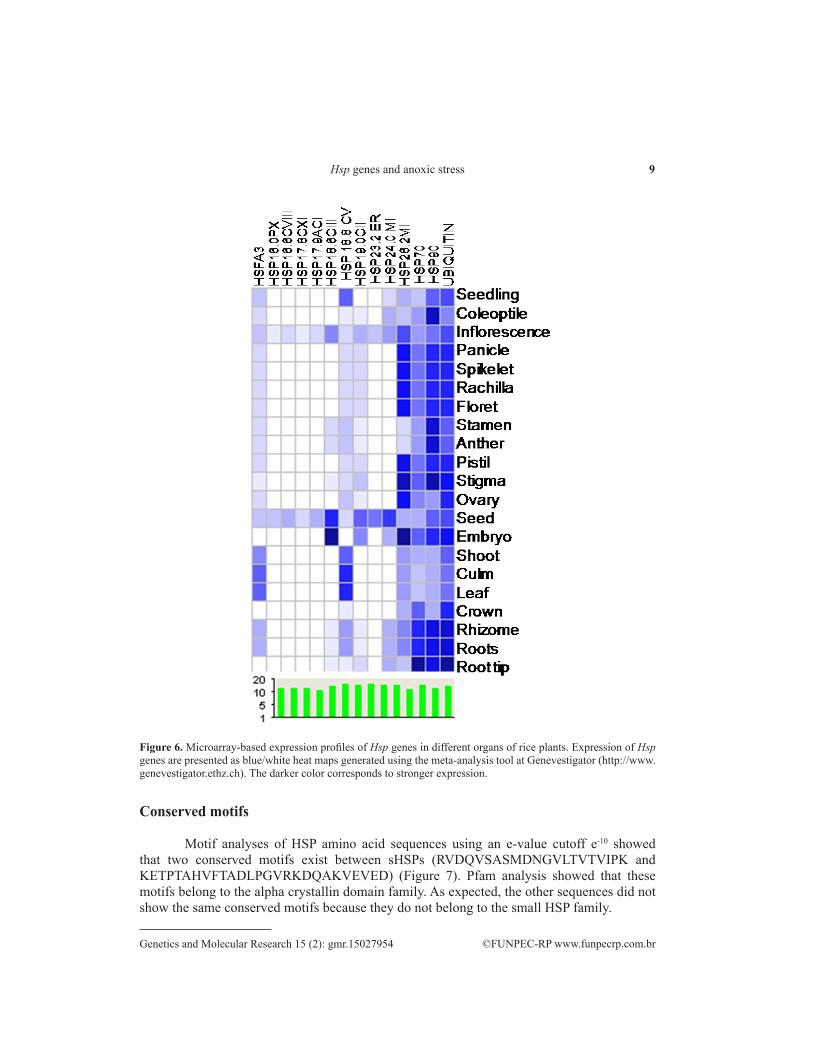
Similarly to the results observed across developmental stages, the expression of genes in different plant organs (Figure 6) showed that Hsp26.2MI, Hsp70, and Hsp90 are constitutively expressed in all plant organs and that HsfA3 and Hsp18.8CV are expressed in most organs, which indicates the importance of these genes in plant growth and development. Moreover, in the inflorescence and seed organs, all genes were expressed throughout all developmental stages, and expression was observed in the milk and dough stages.
9Hsp genes and anoxic stress
©FUNPEC-RP www.funpecrp.com.brGenetics and Molecular Research 15 (2): gmr.15027954
Conserved motifs
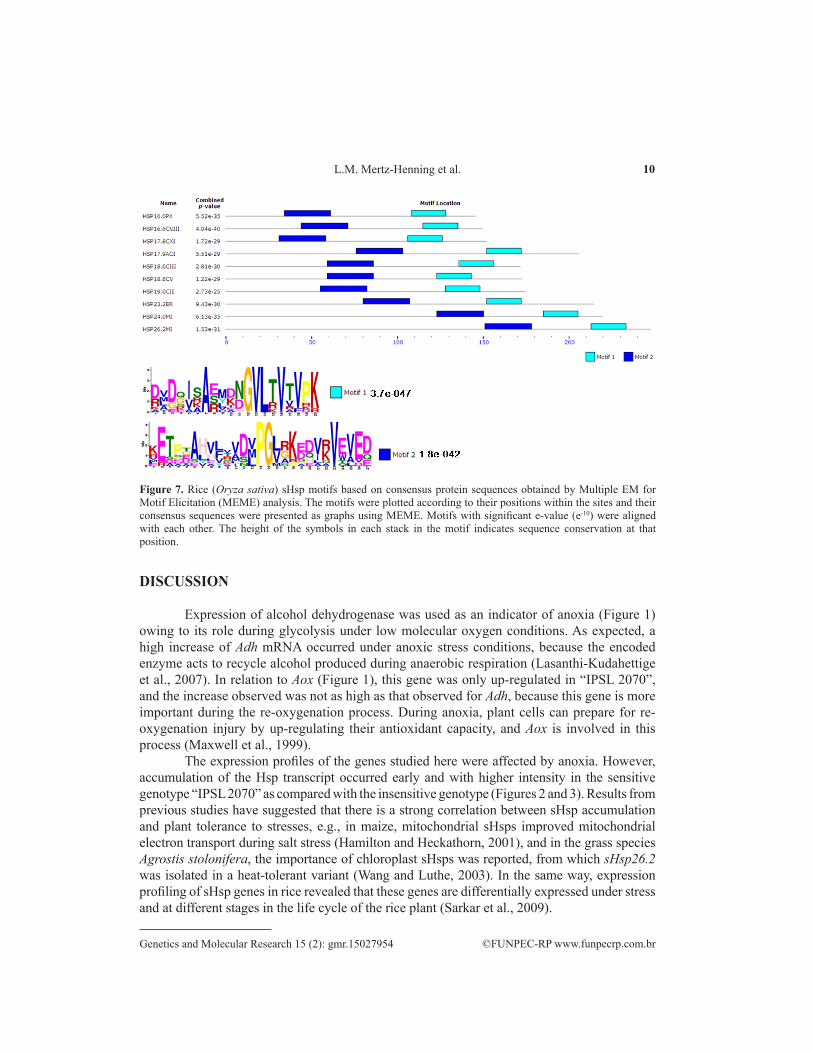
Motif analyses of HSP amino acid sequences using an e-value cutoff e-10 showed that two conserved motifs exist between sHSPs (RVDQVSASMDNGVLTVTVIPK and KETPTAHVFTADLPGVRKDQAKVEVED) (Figure 7). Pfam analysis showed that these motifs belong to the alpha crystallin domain family. As expected, the other sequences did not show the same conserved motifs because they do not belong to the small HSP family.
Figure 6. Microarray-based expression profiles of Hsp genes in different organs of rice plants. Expression of Hsp genes are presented as blue/white heat maps generated using the meta-analysis tool at Genevestigator (http://www.genevestigator.ethz.ch). The darker color corresponds to stronger expression.
10L.M. Mertz-Henning et al.
©FUNPEC-RP www.funpecrp.com.brGenetics and Molecular Research 15 (2): gmr.15027954
DISCUSSION
Expression of alcohol dehydrogenase was used as an indicator of anoxia (Figure 1) owing to its role during glycolysis under low molecular oxygen conditions. As expected, a high increase of Adh mRNA occurred under anoxic stress conditions, because the encoded enzyme acts to recycle alcohol produced during anaerobic respiration (Lasanthi-Kudahettige et al., 2007). In relation to Aox (Figure 1), this gene was only up-regulated in “IPSL 2070”, and the increase observed was not as high as that observed for Adh, because this gene is more important during the re-oxygenation process. During anoxia, plant cells can prepare for re-oxygenation injury by up-regulating their antioxidant capacity, and Aox is involved in this process (Maxwell et al., 1999).
The expression profiles of the genes studied here were affected by anoxia. However, accumulation of the Hsp transcript occurred early and with higher intensity in the sensitive genotype “IPSL 2070” as compared with the insensitive genotype (Figures 2 and 3). Results from previous studies have suggested that there is a strong correlation between sHsp accumulation and plant tolerance to stresses, e.g., in maize, mitochondrial sHsps improved mitochondrial electron transport during salt stress (Hamilton and Heckathorn, 2001), and in the grass species Agrostis stolonifera, the importance of chloroplast sHsps was reported, from which sHsp26.2 was isolated in a heat-tolerant variant (Wang and Luthe, 2003). In the same way, expression profiling of sHsp genes in rice revealed that these genes are differentially expressed under stress and at different stages in the life cycle of the rice plant (Sarkar et al., 2009).
Figure 7. Rice (Oryza sativa) sHsp motifs based on consensus protein sequences obtained by Multiple EM for Motif Elicitation (MEME) analysis. The motifs were plotted according to their positions within the sites and their consensus sequences were presented as graphs using MEME. Motifs with significant e-value (e-10) were aligned with each other. The height of the symbols in each stack in the motif indicates sequence conservation at that position.
11Hsp genes and anoxic stress
©FUNPEC-RP www.funpecrp.com.brGenetics and Molecular Research 15 (2): gmr.15027954
HsfA3 was not observed to be as responsive under anoxic conditions (Figures 2 and 3). Previous studies evaluating this transcription factor in different stress conditions showed that this gene is up-regulated in response to heat, cold, and anoxic stress conditions, with the highest expression observed in response to heat and cold stress, i.e., under anoxia, a 1.85-fold increase was observed whereas under heat and cold stress the increases were 9.68- and 9.83-fold, respectively (Mittal et al., 2009). In tomato plants, HsfA3 was isolated and characterized from a heat-stress cDNA library. This gene was found in the cytoplasm under control conditions and in the nucleus during heat stress (Bharti et al., 2000).
In the present study, genes belonging to the Hsp70 and Hsp90 families were up-regulated in “IPSL 2070”, while in “Nipponbare”, the up-regulation of these genes was weaker and occurred later (Figures 2 and 3). Hsp70 comprises one subset of Hsps that are encoded by a highly conserved multi-gene family whose proteins function in all major subcellular compartments of the cell. Numerous studies have elucidated Hsp70 chaperone functions under stress conditions and during protein metabolism. Hsp70 binds and releases unfolded/non-native proteins, thereby helping polypeptides to undergo productive folding. Hsp70 can prevent aggregation of denatured proteins and can refold stress-denatured proteins (Sung et al., 2001). It is also involved in translation, transport processes, and steroid receptor function. In addition, cytosolic Hsp70-encoded proteins may act as negative repressors of heat shock factor (HSF)-mediated transcription either by themselves or as part of a Hsp90-associated multi-chaperone complex (Shi et al., 1998; Zou et al., 1998). Although Hsp90 chaperones are constitutively expressed in most organisms, their expression increases in response to stress in both prokaryotes and eukaryotes. Expression of Hsp90 in Arabidopsis is developmentally regulated and responds to heat, cold, salt stress, heavy metals, phytohormones, as well as light/dark transitions (Milioni and Hatzopoulos, 1997; Krishna and Gloor, 2001).
In general, the results obtained in the present study show that the majority (10/13) of genes in “IPSL 2070” (flooding sensitive) were responsive to anoxic stress, whereas only six genes (Hsp16PX, Hsp17.9ACI, Hsp16.6CIII, Hsp18.8CV, Hsp19CII, Hsp23.2ER) in “Nipponbare” (flooding tolerant) were responsive to anoxic stress. These data suggest that although HSPs have an important role in the response to anoxic stress, they are not the primary cause of tolerance. This paradox has also been observed in studies on proline under osmotic stress. Many plant species accumulate high levels of proline in response to drought and salinity stress (Adams and Frank, 1980; Delauney and Verma, 1993). The results of some previous studies suggest that proline protects plant tissues from osmotic stress because it is an osmoregulator, a source of nitrogen compounds, and a protectant for enzymes and cellular structures (Stewart and Lee, 1974; Le-Rudulier et al., 1984; Serrano and Gaxiola, 1994). However, no correlation has been observed between proline levels and salt tolerance in certain plant species leading to the conclusion that proline accumulation is a consequence of stress and does not lead to salt tolerance (Moftah and Michel, 1987; Liu and Zhu, 1997; Lutts et al., 2002). Conversely, a proline-deficient Arabidopsis mutant, selected for its ability to germinate in saline media, was unable to continue to grow in this medium because it could not accumulate proline to the equivalent level of the wild-type plant. The conclusion of the authors was that the proline-deficient mutation disrupted the amount of ionic and osmotic stress, as well as other aspects of stress-induced signals (Werner and Finkelstein, 1995). The different responses to anoxia observed between “Nipponbare” and “IPSL 2070” seedlings, indicate that, under the conditions studied, a tolerant genotype does not induce more Hsp gene expression than
12L.M. Mertz-Henning et al.
©FUNPEC-RP www.funpecrp.com.brGenetics and Molecular Research 15 (2): gmr.15027954
does a susceptible genotype. It can be argued that more specific genes could have a greater contribution to the tolerant response; however, all genes induced in “Nipponbare” were also induced in the susceptible genotype. Therefore, these differences could be due to protein sequence polymorphisms reflecting a different degree of activity or different post-translational modifications of proteins in these two genotypes. Furthermore, microRNA regulation of these genes could be involved in counteracting the high levels of expression observed.
In conclusion, the tolerant genotype “Nipponbare” responds to anoxic stress with the induction of a lower number of Hsp genes compared with the flooding-sensitive genotype “IPSL 2070”. The quantitative response to anoxia, i.e., the number of genes activated, is not a sign of tolerance in rice.
Conflicts of interest
The authors declare no conflict of interest.
ACKNOWLEDGMENTS
The authors thank the National Council for Scientific and Technological Development (CNPq), the Coordination for the Improvement of Higher Education Personnel (CAPES) and Rio Grande do Sul Research Foundation (FAPERGS) for financial support and scholarships granted.
REFERENCES
Adams E and Frank L (1980). Metabolism of proline and the hydroxyprolines. Annu. Rev. Biochem. 49: 1005-1061. http://dx.doi.org/10.1146/annurev.bi.49.070180.005041
Bailey TL and Elkan C (1994). Fitting a mixture model by expectation maximization to discover motifs in biopolymers. Proc. Int. Conf. Intell. Syst. Mol. Biol. 2: 28-36.
Banti V, Mafessoni F, Loreti E, Alpi A, et al. (2010). The heat-inducible transcription factor HsfA2 enhances anoxia tolerance in Arabidopsis. Plant Physiol. 152: 1471-1483. http://dx.doi.org/10.1104/pp.109.149815
Bharti K, Schmidt E, Lyck R, Heerklotz D, et al. (2000). Isolation and characterization of HsfA3, a new heat stress transcription factor of Lycopersicon peruvianum. Plant J. 22: 355-365. http://dx.doi.org/10.1046/j.1365-313x.2000.00746.x
Colmer TD (2003). Long-distance transport of gases in plants: a perspective on internal aeration and radial oxygen loss from roots. Plant Cell Environ. 26: 17-36. http://dx.doi.org/10.1046/j.1365-3040.2003.00846.x
Delauney AJ and Verma DPS (1993). Proline biosynthesis and osmoregulation in plants. Plant J. 4: 215-223. http://dx.doi.org/10.1046/j.1365-313X.1993.04020215.x
Fukao T and Bailey-Serres J (2004). Plant responses to hypoxia--is survival a balancing act? Trends Plant Sci. 9: 449-456. http://dx.doi.org/10.1016/j.tplants.2004.07.005
Fukao T, Xu K, Ronald PC and Bailey-Serres J (2006). A variable cluster of ethylene response factor-like genes regulates metabolic and developmental acclimation responses to submergence in rice. Plant Cell 18: 2021-2034. http://dx.doi.org/10.1105/tpc.106.043000
Hamilton EW, 3rd and Heckathorn SA (2001). Mitochondrial adaptations to NaCl. Complex I is protected by anti-oxidants and small heat shock proteins, whereas complex II is protected by proline and betaine. Plant Physiol. 126: 1266-1274. http://dx.doi.org/10.1104/pp.126.3.1266
International Rice Genome Sequencing Project (2005). The map-based sequence of the rice genome. Nature 436: 793-800. http://dx.doi.org/10.1038/nature03895
Krishna P and Gloor G (2001). The Hsp90 family of proteins in Arabidopsis thaliana. Cell Stress Chaperones 6: 238-246. http://dx.doi.org/10.1379/1466-1268(2001)006<0238:THFOPI>2.0.CO;2
Lasanthi-Kudahettige R, Magneschi L, Loreti E, Gonzali S, et al. (2007). Transcript profiling of the anoxic rice coleoptile. Plant Physiol. 144: 218-231. http://dx.doi.org/10.1104/pp.106.093997
13Hsp genes and anoxic stress
©FUNPEC-RP www.funpecrp.com.brGenetics and Molecular Research 15 (2): gmr.15027954
Le Rudulier D, Strom AR, Dandekar AM, Smith LT, et al. (1984). Molecular biology of osmoregulation. Science 224: 1064-1068. http://dx.doi.org/10.1126/science.224.4653.1064
Liu J and Zhu JK (1997). Proline accumulation and salt-stress-induced gene expression in a salt-hypersensitive mutant of Arabidopsis. Plant Physiol. 114: 591-596. http://dx.doi.org/10.1104/pp.114.2.591
Loreti E, Poggi A, Novi G, Alpi A, et al. (2005). A genome-wide analysis of the effects of sucrose on gene expression in Arabidopsis seedlings under anoxia. Plant Physiol. 137: 1130-1138. http://dx.doi.org/10.1104/pp.104.057299
Lutts S, Majerus V and Kinet J-M (2002). NaCl effects on proline metabolism in rice (Oryza sativa) seedlings. Physiol. Plant. 105: 450-458. http://dx.doi.org/10.1034/j.1399-3054.1999.105309.x
Malik MK, Slovin JP and Zimmerman JL (1997). Carrot cell lines and tomato plants transformed with a small heat shock protein from carrot (HSP17.7) exhibit increased thermotolerance. Plant Physiol. 114: 112.
Maxwell DP, Wang Y and McIntosh L (1999). The alternative oxidase lowers mitochondrial reactive oxygen production in plant cells. Proc. Natl. Acad. Sci. USA 96: 8271-8276. http://dx.doi.org/10.1073/pnas.96.14.8271
Milioni D and Hatzopoulos P (1997). Genomic organization of hsp90 gene family in Arabidopsis. Plant Mol. Biol. 35: 955-961. http://dx.doi.org/10.1023/A:1005874521528
Mittal D, Chakrabarti S, Sarkar A, Singh A, et al. (2009). Heat shock factor gene family in rice: genomic organization and transcript expression profiling in response to high temperature, low temperature and oxidative stresses. Plant Physiol. Biochem. 47: 785-795. http://dx.doi.org/10.1016/j.plaphy.2009.05.003
Moftah AE and Michel BE (1987). The effect of sodium chloride on solute potential and proline accumulation in soybean leaves. Plant Physiol. 83: 238-240. http://dx.doi.org/10.1104/pp.83.2.238
Murakami T, Matsuba S, Funatsuki H, Kawaguchi K, et al. (2004). Over-expression of a small heat shock protein, sHSP17.7, confers both heat tolerance and UV-B resistance to rice plants. Mol. Breed. 13: 165-175. http://dx.doi.org/10.1023/B:MOLB.0000018764.30795.c1
Pfaffl MW (2001). A new mathematical model for relative quantification in real-time RT-PCR. Nucleic Acids Res. 29: e45. http://dx.doi.org/10.1093/nar/29.9.e45
Saeed AI, Sharov V, White J, Li J, et al. (2003). TM4: a free, open-source system for microarray data management and analysis. Biotechniques 34: 374-378.
Sarkar NK, Kim Y-K and Grover A (2009). Rice sHsp genes: genomic organization and expression profiling under stress and development. BMC Genomics 10: 393. http://dx.doi.org/10.1186/1471-2164-10-393
Serrano R and Gaxiola R (1994). Microbial models and salt stress tolerance in plants. Crit. Rev. Plant Sci. 13: 121-138. http://dx.doi.org/10.1080/713608057
Shi Y, Mosser DD and Morimoto RI (1998). Molecular chaperones as HSF1-specific transcriptional repressors. Genes Dev. 12: 654-666. http://dx.doi.org/10.1101/gad.12.5.654
Siangliw M, Toojinda T, Tragoonrung S and Vanavichit A (2003). Thai jasmine rice carrying QTLch9 (SubQTL) is submergence tolerant. Ann. Bot. (Lond.) 91: 255-261. http://dx.doi.org/10.1093/aob/mcf123
Stewart GR and Lee JA (1974). The role of proline accumulation in halophytes. Planta 120: 279-289. http://dx.doi.org/10.1007/BF00390296
Sun W, Van Montagu M and Verbruggen N (2002). Small heat shock proteins and stress tolerance in plants. Biochim. Biophys. Acta 1577: 1-9. http://dx.doi.org/10.1016/S0167-4781(02)00417-7
Sung DY, Kaplan F and Guy CL (2001). Plant Hsp70 molecular chaperones: protein structure, gene family, expression and function. Physiol. Plant. 113: 443-451. http://dx.doi.org/10.1034/j.1399-3054.2001.1130402.x
Voesenek LACJ, Colmer TD, Pierik R, Millenaar FF, et al. (2006). How plants cope with complete submergence. New Phytol. 170: 213-226. http://dx.doi.org/10.1111/j.1469-8137.2006.01692.x
Wang D and Luthe DS (2003). Heat sensitivity in a bentgrass variant. Failure to accumulate a chloroplast heat shock protein isoform implicated in heat tolerance. Plant Physiol. 133: 319-327. http://dx.doi.org/10.1104/pp.102.018309
Wang W, Vinocur B, Shoseyov O and Altman A (2004). Role of plant heat-shock proteins and molecular chaperones in the abiotic stress response. Trends Plant Sci. 9: 244-252. http://dx.doi.org/10.1016/j.tplants.2004.03.006
Werner JE and Finkelstein RR (1995). Arabidopsis mutants with reduced response to NaCl and osmotic stress. Physiol. Plant. 93: 659-666. http://dx.doi.org/10.1111/j.1399-3054.1995.tb05114.x
Xu K, Xu X, Fukao T, Canlas P, et al. (2006). Sub1A is an ethylene-response-factor-like gene that confers submergence tolerance to rice. Nature 442: 705-708. http://dx.doi.org/10.1038/nature04920
Zimmermann P, Laule O, Schmitz J, Hruz T, et al. (2008). Genevestigator transcriptome meta-analysis and biomarker search using rice and barley gene expression databases. Mol. Plant 1: 851-857. http://dx.doi.org/10.1093/mp/ssn048
Zou J, Guo Y, Guettouche T, Smith DF, et al. (1998). Repression of heat shock transcription factor HSF1 activation by HSP90 (HSP90 complex) that forms a stress-sensitive complex with HSF1. Cell 94: 471-480. http://dx.doi.org/10.1016/S0092-8674(00)81588-3