Embed Size (px)
Citation preview
1
Thesis for the Master’s degree in Molecular Biosciences Main field of study in Molecular Biology
Expression of the bacterial ectB gene in the chloroplast of Chlamydomonas reinhardtii
Nafisa Batool Afzal
60 study points
Department of Molecular Biosciences
Faculty of mathematics and natural sciences UNIVERSITY OF OSLO 03/2014
2
Acknowledgments
This study was carried out at the Department of Molecular Bioscience at the University of Oslo as part of my Master's degree in molecular bioscience, under the supervision of Dr. Uwe Klein. I owe my deepest gratitude to Dr. Uwe Klein for his guidance and supervision during the work in lab as well as during the writing of the thesis. I would also like to thank my family and friends for their love and support, especially my sister Zahra.
Oslo, March 2014 Nafisa Batool Afzal
3
Summary
Ectoine is a small compound synthesized in the cytoplasm of halophilic and halotolerant
bacteria in response to salt stress. The compound has been found to behave as a compatible
solute counterweighing osmotic imbalance between the interior and exterior of a cell. Because
of its positive effects on the water balance of cells and its protective properties ectoine
isolated from bacteria is broadly used in medical therapies and biotechnology, e.g. as an
additive in cosmetics.
The goal of this study was to synthesize ectoine in the chloroplast of the unicellular green alga
Chlamydomonas reinhardtii in order to increase the cells’ salt tolerance. In bacteria synthesis
of ectoine is catalyzed by proteins encoded by the ectA, ectB and ectC genes. As the ectC
gene was thought to be dispensable for ectoine synthesis in Chlamydomonas, only the
bacterial ectB and ectA genes were stably inserted by biolistic transformation into the
chloroplast genome of the alga. The resulting transgenic cell lines were investigated and
analysed by DNA and RNA blotting techniques for the presence of the genes in the
chloroplast genome, for accumulation of ectA and ectB transcripts, and for improvements in
salt tolerance due to ectoine accumulation.
The results showed that the introduced ectA and ectB genes were expressed in C. reinhardtii
but no improvements in salt tolerance of the transformants could be detected. It is concluded
that expression of ectA and ectB in the chloroplast of C. reinhardtii is not sufficient for
ectoine accumulation. It is suggested that further work focuses on additional expression of the
ectC gene and on codon optimization of ectA and ectB genes.
4
Abbreviations
approx. Approximately ATP Adenosine-5‘-triphosphate atpB Coding for ATP synthase complex, subunit β bp Base pair BSA Bovine serum albumin Ca. Circa CIP Calf Intestinal Alkaline Phosphatase cm Centimetre DEPC Diethylpyrocarbonate dH2O Distilled H2O DNA Deoxyribonucleic acid DNase Deoxyribonuclease dNTP Deoxyribonucleotide triphosphate E. coli Escherichia coli EDTA Ethylenediaminetetraacetic acid EGTA Ethyleneglycolaacetic acid g Gram g Gravitational force kb Kilobase pair L Litre M Molar concentration mA Milliampère mg Milligram min. Minutes mL Milliliter mm Millimeter mM Millimolar concentration MOPS 3-morpholinopropane-1-sulfonic acid mRNA Messenger RNA N Normality NEB New England Biolabs ng Nanogram nm Nanometer OD Optical density PCR Polymarese chain reaction PEG Polyethylene glycol pmol picomol psaB Photosystem I subunit B psbA Coding for Photosystem II subunit DI psbD Coding for Photosystem I subunit D
5
rbcL Ribulose Bisphosphate Carboxylase large subunit RNA Ribonucleic acid RNase Ribonuclease ROS Reactive oxidative species s Second SDS Sodium deodecyl sulphate Tris 2-Amino-2-hydroxymethyl-propane-1,3-diol u Units UTR Untranslated regions UV-light Ultraviolet light V Volt w/v Weight by volume w/w Weight by weight μCi Microcurie μg Microgram μL Microliter °C Degrees celsius x Times
6
TABLE OF CONTENTS
Acknowledgments ...................................................................................................................... 2
Summary .................................................................................................................................... 3
Abbreviations ............................................................................................................................. 4
1. INTRODUCTION .............................................................................................................. 9
1.1 Challenging salinity ..................................................................................................... 9
1.1.1 Organisms in hypersaline environments .............................................................. 9
1.1.2 Salt surviving strategies ..................................................................................... 10
1.1.3 Compatible solutes ............................................................................................. 10
1.1.4 Production of compatible solutes by genetically engineered crops ................... 11
1.2 Ectoine ....................................................................................................................... 12
1.2.1 Ectoine as a compatible solute ........................................................................... 12
1.2.2 The biosynthesis of ectoine ................................................................................ 12
1.2.3 Supporting cell protection and protein stability ................................................. 13
1.2.4 Application of ectoine ........................................................................................ 14
1.2.5 Industrial production of ectoine ......................................................................... 14
1.3 Chlamydomonas reinhardtii ...................................................................................... 16
1.3.1 Physiology of Chlamydomonas reinhardtii ....................................................... 16
1.3.2 Chlamydomonas reinhardtii as a model organism ............................................. 17
1.3.3 Foreign protein expression in the chloroplast of Chlamydomonas .................... 17
1.3.4 Optimized codon usage ...................................................................................... 19
1.3.5 Transformation by microprojectile bombardment ............................................. 20
1.3.6 Ectoine production in Chlamydomonas reinhardtii ........................................... 21
2 AIMS OF STUDY ............................................................................................................ 22
3 METHODS AND MATERIALS ...................................................................................... 23
3.1 Escherichia coli methods ........................................................................................... 23
3.1.1 Liquid medium for growth with kanamycin (or ampicillin) .............................. 23
3.1.2 Solid medium for growth with kanamycin (or ampicillin) ................................ 23
3.1.3 Preparation of competent E. coli TB1 cells (CaCl2 method) ............................. 23
3.1.4 Transformation of competent E. coli .................................................................. 24
3.1.5 Growth of E. coli on agar plates ......................................................................... 24
3.1.6 Small scale growth of E. coli ............................................................................. 24
3.1.7 Storage of E. coli at -80 °C ................................................................................ 24
7
3.1.8 Miniprep plasmid isolation from E. coli ............................................................ 25
3.1.9 Maxiprep plasmid isolation from E. coli ............................................................ 25
3.2 DNA methods ............................................................................................................ 26
3.2.1 Agarose gel electrophoresis ............................................................................... 26
3.2.2 Purification of DNA fragments from an agarose gel ......................................... 27
3.2.3 DNA and RNA quantification ............................................................................ 27
3.3 Subcloning ................................................................................................................. 28
3.3.1 Plasmids ............................................................................................................. 28
3.3.2 Polymerase chain reaction (PCR) ...................................................................... 29
3.3.3 Restriction digestion of DNA ............................................................................. 30
3.3.4 Partial restriction digestion of DNA ................................................................... 30
3.3.5 Dephosphorylation ............................................................................................. 31
3.3.6 Ligation .............................................................................................................. 31
3.4 Chlamydomonas reinhardtii methods ....................................................................... 31
3.4.1 Liquid media for growth of Chlamydomonas .................................................... 32
3.4.2 Solid media for growth of Chlamydomonas ...................................................... 32
3.4.3 Culturing the photosynthetic mutant of Chlamydomonas for transformation .... 32
3.4.4 Plating the photosynthetic mutant of Chlamydomonas for transformation ........ 33
3.4.5 Microprojectile bombardment ............................................................................ 33
3.4.6 Selection of the transgenic clones of Chlamydomonas ...................................... 33
3.4.7 Photosynthetic growth of Chlamydomonas with 2% CO2 ................................. 34
3.4.8 Isolation of genomic DNA from Chlamydomonas ............................................ 34
3.4.9 RNA isolation from Chlamydomonas ................................................................ 35
3.5 Analytical methods .................................................................................................... 36
3.5.1 Sequencing ......................................................................................................... 36
3.5.2 Preparation of radioactive probes for DNA and RNA blots .............................. 36
3.5.3 DNA Slot blot ..................................................................................................... 36
3.5.4 Hybridization of DNA and RNA with radiolabelled probes .............................. 37
3.5.5 Autoradiography ................................................................................................. 38
3.5.6 Southern analysis ................................................................................................ 38
3.5.7 Northern analysis ................................................................................................ 39
3.5.8 Salt tolerance experiment ................................................................................... 39
4 RESULTS ......................................................................................................................... 40
8
4.1 The construct of ectA_B transformation vector ........................................................ 40
4.2 Subcloning of the ectB gene ...................................................................................... 42
4.2.1 Complications during subcloning of the ectB gene ............................................ 45
4.2.2 Microprojectile transformation and selection of phototrophic transformants .... 45
4.3 DNA slot blot analysis ............................................................................................... 46
4.4 Analysis of transformants .......................................................................................... 48
4.4.1 Southern analysis ................................................................................................ 48
4.4.2 Northern blot analysis ........................................................................................ 49
4.4.3 Salt tolerance ...................................................................................................... 51
5 DISCUSSION ................................................................................................................... 52
5.1 EctB transcript levels ................................................................................................. 52
5.2 Accumulation of EctB protein ................................................................................... 53
5.3 Transformant analysis ................................................................................................ 54
5.4 Salt tolerance ............................................................................................................. 55
5.5 Ectoine accumulation in Chlamydomonas ................................................................ 55
6 CONCLUSION ................................................................................................................. 56
7 FUTURE PROSPECTS .................................................................................................... 57
Appendix I: ectABC genes in Pseudomonas stutzeri ............................................................... 59
Appendix II: Sequencing result of insert with orientation 1 in the transformation vector ....... 60
Appendix III: Sequencing result of insert with orientation 2 in the transformation vector ..... 62
Appendix IV: Position of insertion of ectAB genes into the chloroplast genome of C. reinhardtii ................................................................................................................................. 64
Appendix V: Solutions and recipes .......................................................................................... 66
References ................................................................................................................................ 69
9
1. INTRODUCTION
1.1 Challenging salinity
1.1.1 Organisms in hypersaline environments
Most living organisms have difficulties growing and thriving in a hypersaline environment.
High extracellular salt concentrations result in water diffusing out of the cell due to high
outside water potential. Depending on the level of salt tolerance, such unfavourable settings
may lead to loss of cellular water eventually causing cell death (Mahajan & Tuteja, 2005).
Organisms living in extreme conditions are called extremophiles. They have through
evolution developed several properties to tolerate and thrive in extreme habitats.
Extremophiles living in environments with high salt concentrations are classified as either
halophiles or halotolerants. Halophiles and halotolerants are found in various habitats, often
within salt lakes, salt marshes, springs and other sites with elevated salt concentrations. Most
halophiles and halotolerants are archaeal, while others belong to the kingdom of bacteria or
eukaryota (Fukuchi et al., 2003; Oren, 1999). Halophiles require salt for survival and have
optimal growth at concentrations of up to 0.85 M NaCl, tolerating at least 1.7 M NaCl. In
contrast, halotolerants do not require any specific salt concentration for growth and tend to
tolerate a wide range of salt concentrations (Oren, 2008).
As a rule, proteins in halophiles are associated with increased salt tolerance. A number of
studies have shown that extreme halophiles often have small proteins with short side chains,
acidic amino acids and non-hydrophobic residues. Thus, tightly packed proteins are essential
for maintaining the protein conformation on exposure to high salt concentrations (Fukuchi et
al., 2003; Lanyi, 1974; Tadeo et al., 2009). These characteristics are even harmful for certain
extreme halophiles when introduced to an environment with lower salt concentration. The
proteins are inactivated and the cell wall destabilized as a result of difficulties associated with
adaption to lower salt concentrations (Lanyi, 1974; Oren, 2008).
10
1.1.2 Salt surviving strategies
Ca2+ is well known for taking part in alleviating the detrimental effects caused by excessive
salt in cells (Mahajan & Tuteja, 2005). Apart from Ca2+ interference, halophiles and
halotolerants have evolved two different strategies in order to counteract problems related to
saline conditions.
The first strategy maintains the water levels in the cell by accumulating inorganic compounds
intracellularly, mainly by influx of KCl and efflux of Na+ catalyzed by corresponding ion
transporters. Hence, osmotic imbalance is avoided due to similar internal and external salt
concentrations. A few extremely halophilic archaea and anaerobic moderately halophilic
bacteria of the order Haloanaerobiales have adopted this method. Organisms committed to
this strategy have highly acidic proteomes that will denature when moved from high to low
salt concentrations (Oren, 1999).
An alternative strategy applied against water loss is the usage of compatible solutes, which are
acquired by the majority of halophilic bacteria. Under hypersaline conditions, compatible
solutes are synthesized and accumulated within the organism. Their purpose is to maintain
proper osmotic balance by excluding salt from the cell’s cytoplasm, and creating a low
osmotic potential inside the cell (Louis & Galinski, 1997), thereby preventing water loss and
increasing salt tolerance. This strategy is rather flexible unlike the strategy based on
intracellular accumulation of salt. Flexibility is due to swift adjustment in concentration of
intracellular compatible solutes in response to changes in the extracellular environment.
Synthesis of organic solutes is a more energy requiring process compared to accumulation of
inorganic compounds (Oren, 1999).
1.1.3 Compatible solutes
The term compatible solute was first used by Brown and Simpson (1972), but the definition
has since changed. Nowadays compatible solutes are signified as small and soluble organic
compounds, who maintain osmotic balance between the extracellular environment and the
cytoplasm. They manage to do this while being “compatible” with the organism’s
biomolecules, implying they do not disrupt vital cellular functions, metabolic processes or
protein folding (Brown, 1990; Oren, 1999). Compatible solutes are also called osmolytes or
11
osmoprotectans, and are found among all the three domains of life (Roberts, 2005).
Compounds classified as compatible solutes include: amino acids such as proline and
glutamic acid, their derivatives (glycine betaine, ectoine and hydroxyectoine), some sugars
and polyols (Galinski, 1995).
1.1.4 Production of compatible solutes by genetically engineered crops
On a world basis salt stress causes major detrimental effects on crop growth and productivity.
Hence it is important to understand the molecular basis for salinity tolerance to improve
agricultural growth. There has been a considerable effort from the scientific community to
design salt tolerant transgenic crops. A number of studies have described elevated salt
tolerance in genetically engineered crops by using genes that encode compatible solutes
(Moghaieb et al., 2011; Nakayama et al., 2000).
So far, attempts to develop transgenes have mostly been done with model organisms such as
Arabidopsis and tobacco plants (Hayashi et al., 1998; Moghaieb et al., 2006). Even though
introducing salt tolerance traits is complicated and involves multiple genes (Flowers, 2004),
such genes have successfully been introduced into plants providing knowledge about
metabolites and techniques. However, engineering of salt tolerance into plants has only been
partially successful.
According to Chen et al. (2002), most of the genetically engineered plants synthesize low
levels of compatible solutes, with quantities that are not high enough to execute a proper
osmotic balance. A slight increase in the tolerance of stress might be a result of other features
of compatible solutes, such as protein protection activities and reduction of ROS (reactive
oxidative species) (Chen et al., 2002).
Moreover, the idea of transferring bacterial salt tolerance genes to a plant may create mRNA
translation difficulties due to different codon usage between the species. Another impediment
is the energetically expensive production of compatible solutes, which thereby affects energy
resources and crop yield. Associated complications are the ability of various crops to
synthesize and accumulate different types of compatible solutes, which is somehow limited
(Rontein et al., 2002).
12
1.2 Ectoine
1.2.1 Ectoine as a compatible solute
The most abundant compatible solute is ectoine (1,4,5,6-tetrahydro-2-methyl-4-
pyrimidinecarboxylic acid), an uncharged or zwitterionic compound, which was originally
discovered in the phototroph Halorhodospira halochloris by Galinski et al. (1985). Ectoine is
commonly found in aerobic chemoheterotrophic bacteria (Galinski, 1995). Under increased
extracellular salt levels, this cyclic compound is synthesized and accumulated in the
cytoplasm or taken up from a culture medium if available.
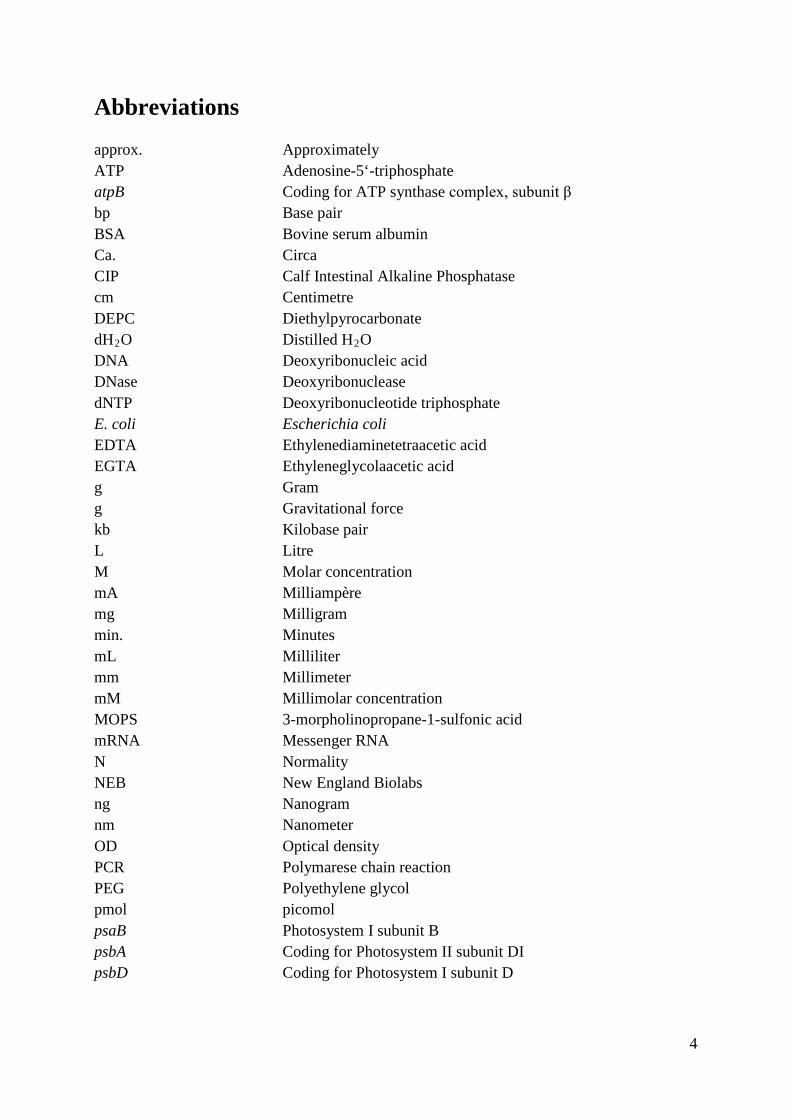
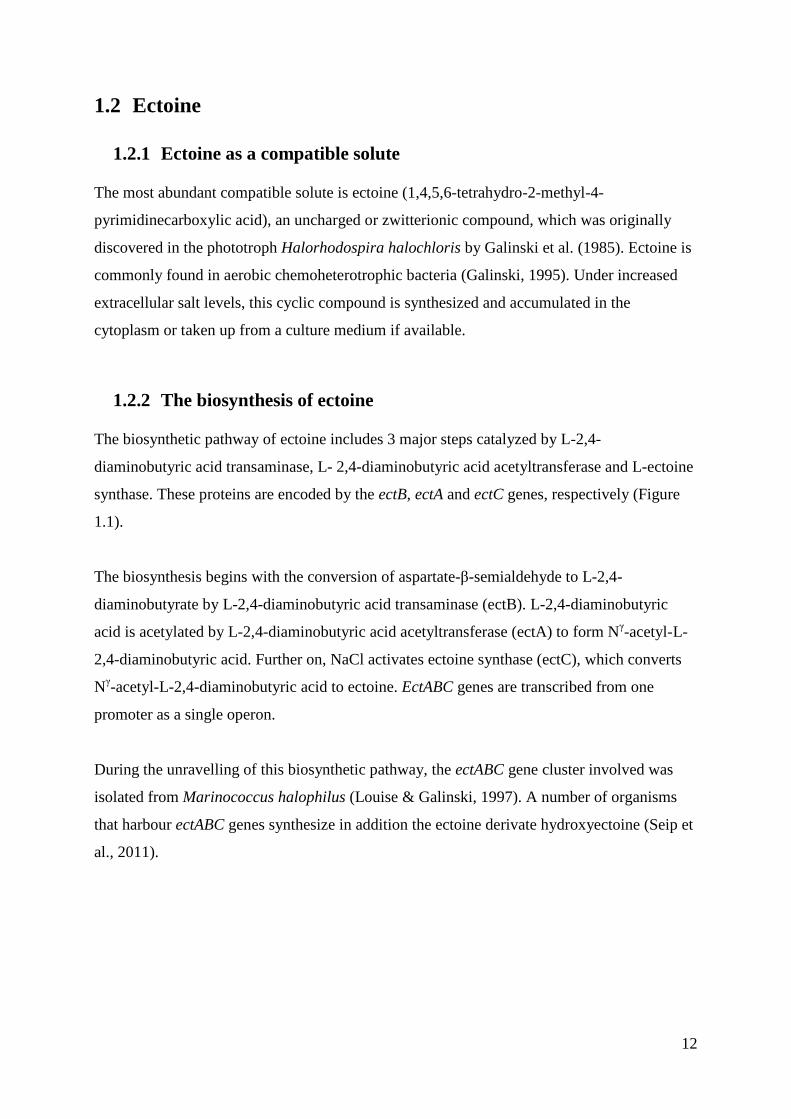
1.2.2 The biosynthesis of ectoine
The biosynthetic pathway of ectoine includes 3 major steps catalyzed by L-2,4-
diaminobutyric acid transaminase, L- 2,4-diaminobutyric acid acetyltransferase and L-ectoine
synthase. These proteins are encoded by the ectB, ectA and ectC genes, respectively (Figure
1.1).
The biosynthesis begins with the conversion of aspartate-β-semialdehyde to L-2,4-
diaminobutyrate by L-2,4-diaminobutyric acid transaminase (ectB). L-2,4-diaminobutyric
acid is acetylated by L-2,4-diaminobutyric acid acetyltransferase (ectA) to form Nγ-acetyl-L-
2,4-diaminobutyric acid. Further on, NaCl activates ectoine synthase (ectC), which converts
Nγ-acetyl-L-2,4-diaminobutyric acid to ectoine. EctABC genes are transcribed from one
promoter as a single operon.
During the unravelling of this biosynthetic pathway, the ectABC gene cluster involved was
isolated from Marinococcus halophilus (Louise & Galinski, 1997). A number of organisms
that harbour ectABC genes synthesize in addition the ectoine derivate hydroxyectoine (Seip et
al., 2011).
13
Figure 1.1: The biosynthetic pathway of ectoine and hydroxyectoine. Aspartate derived from the amino acid biosynthetic pathway takes part in ectoine synthesis. The figure is a slightly modified version of a figure from Pastor et al. (2010).
1.2.3 Supporting cell protection and protein stability
Compatible solutes are termed “chemical chaperones” due to their stabilization traits. There
have been several reports on compatible solutes, including ectoine and hydroxyectoine,
participating in preservation against protein misfolding and stabilizing proteins (Graf et al.,
2008; Knapp et al., 1999).
The presence of certain compatible solutes initiates an interaction between protein and solute,
which exclude the solute from the protein surface due to hydration. Simultaneously, the
protein is forced into its native form, which is compact and occupies less space (Liu & Bolen,
1995). In 1999, Göller and Galinski presented a similar model for protein stabilization by
ectoine, which supported a previous study on compatible solutes (Arakawa & Timasheff,
1985).
14
Ectoine has in addition been shown to be a compound that stabilizes nucleic acids and gives
cell protection against stresses like freezing, drought and heat. It has proven to be the most
stabilizing compound among compatible solutes (Lippert & Galinski, 1992). Besides, ectoine
and hydroxyectoine are able to alter the conformation of DNA in such way that endonucleases
can not cleave it (Malin et al., 1999).
1.2.4 Application of ectoine
Ectoine has multiple advantageous functions and thereof many applications. Foremost is its
ability in cosmetics as a skin moisturizer, where it works as an osmolyte. It reduces stress
factors that lead to aged skin, as documented by Heinrich and colleagues (2007). Likewise,
ectoine is also used in sunscreen creams because of its capability to protect skin from UVA-
rays (Buenger & Driller, 2004).
Furthermore, it maintains protein folding and protects proteins from proteolysis. This may be
utilized against diseases associated with protein misfolding and generally in development of
pharmaceutics (Kolp et al., 2006). Regarding other biotechnological applications, ectoine has
a potential to improve both crop productivity and quality, though a better understanding of
ectoine synthesis and its related cellular pathways is needed.
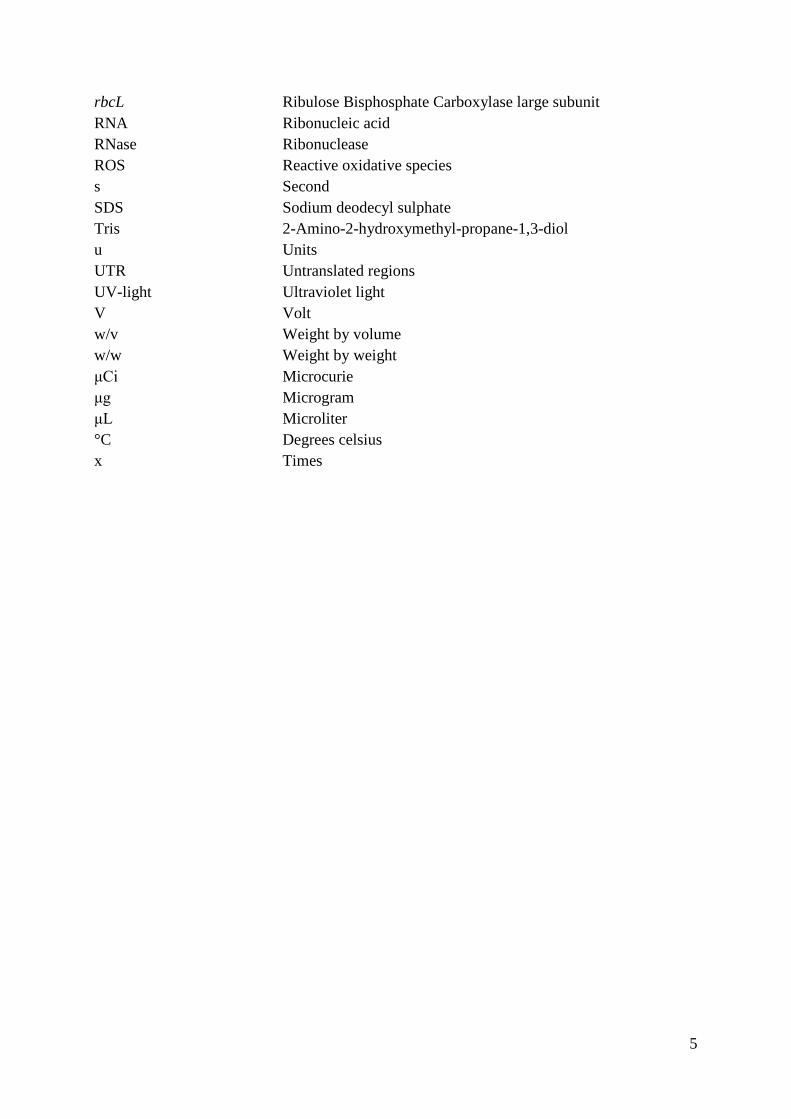
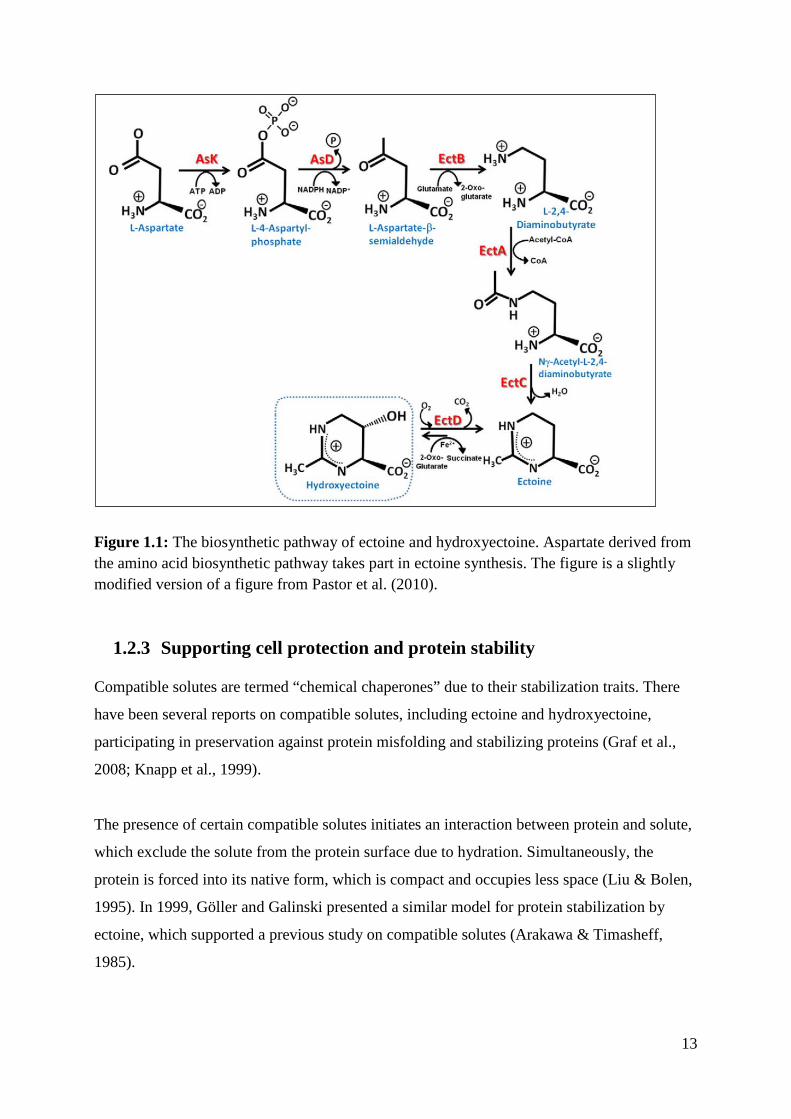
1.2.5 Industrial production of ectoine
The numerous applications of ectoine, especially as an additive in cosmetics, require an
industry-type ectoine production to meet an increasing demand. To produce ectoine in large-
scale, fermentation procedures such as “bacterial milking” are frequently used for extracting
metabolites (Sauer & Galinski, 1998). The bacteria are placed into a medium with high
salinity in which they produce compatible solutes (hyperosmotic shock), a sudden transfer to
a medium with lower salt concentration (hypoosmotic shock) results in release of compatible
solutes. Switching between osmotic shocks in combination with filtration techniques is used
to harvest the compatible solutes (Figure 1.2). In order to solely obtain ectoine, it has to be
isolated and purified from among other compatible solutes present.
15
Figure 1.2: The bacterial milking technique for production of compatible solutes in H. elongata used by Sauer and Galinski (1998). The flow diagram demonstrates how ectoine is made by repeatedly undergoing osmotic changes and filtration steps, before they are isolated and purified. The figure presented is from Galinski and Louis (1998).
The bacterium Halomonas elongata is usually chosen as the ectoine production factory,
mainly because of its ability to grow in a wide range of salt concentrations. Secondly, due to
its rapid response in synthesizing and releasing ectoine through transporters (Fischel & Oren,
1993; Sauer & Galinski, 1998).
New techniques and species are under investigation for improvement of production and
purification of various compatible solutes (Becker et al., 2013). A recent report demonstrated
how different types of sugars available to engineered H. elongata may affect production rates
of ectoine (Tanimura et al., 2013). Results showed that H. elongata produced ectoine more
efficiently with biomass-derived xylose, than with glucose that had been commonly used in
previous studies.
16
1.3 Chlamydomonas reinhardtii
1.3.1 Physiology of Chlamydomonas reinhardtii
Chlamydomonas reinhardtii (hereafter called Chlamydomonas) is a haploid photosynthetic
eukaryotic green alga. It is widely distributed over the world and can be found in different
habitats, especially in soil and fresh water. The wild-type C. reinhardtii strain utilized in
laboratories was originally isolated in the 1940s from soil in Massachusetts (US) by Gilbert
M. Smith (Harris, 2001).
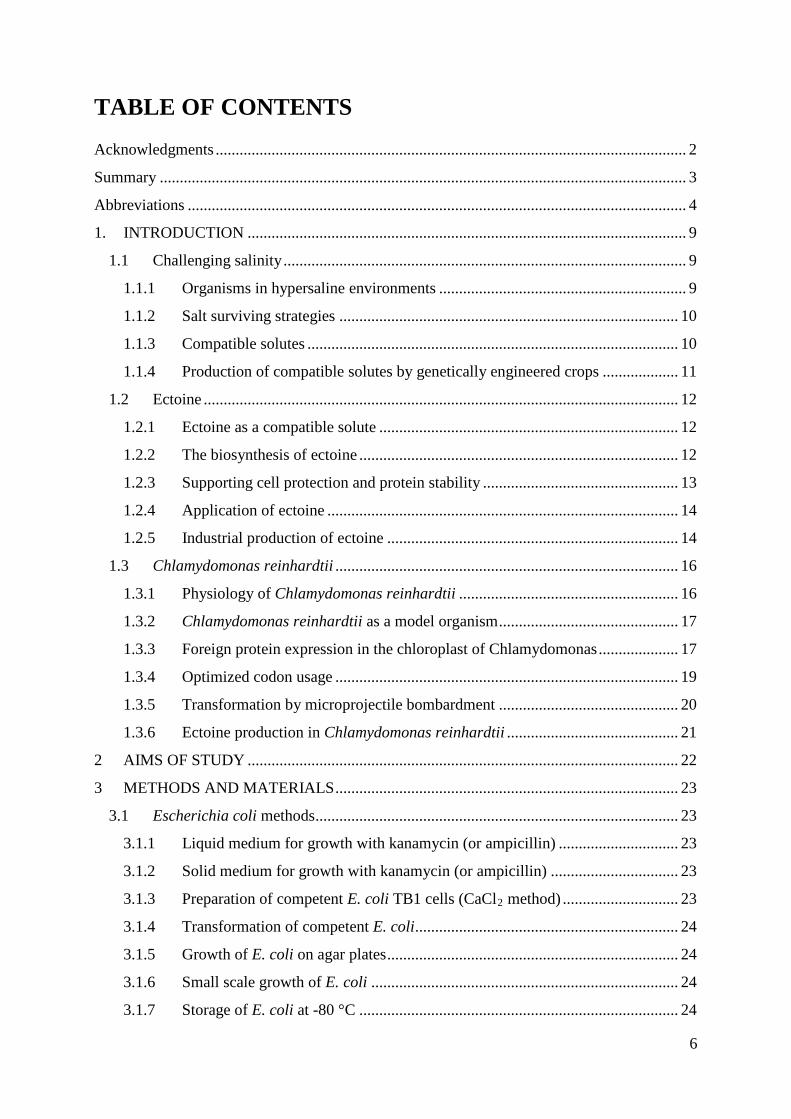
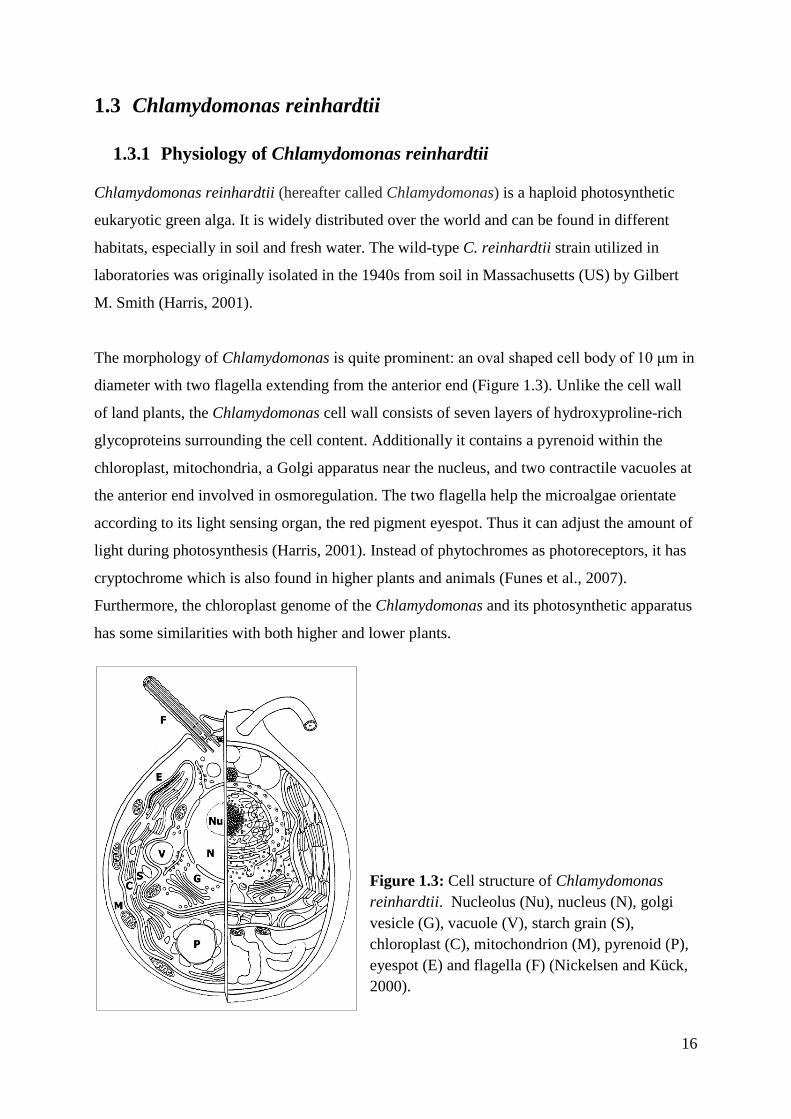
The morphology of Chlamydomonas is quite prominent: an oval shaped cell body of 10 μm in
diameter with two flagella extending from the anterior end (Figure 1.3). Unlike the cell wall
of land plants, the Chlamydomonas cell wall consists of seven layers of hydroxyproline-rich
glycoproteins surrounding the cell content. Additionally it contains a pyrenoid within the
chloroplast, mitochondria, a Golgi apparatus near the nucleus, and two contractile vacuoles at
the anterior end involved in osmoregulation. The two flagella help the microalgae orientate
according to its light sensing organ, the red pigment eyespot. Thus it can adjust the amount of
light during photosynthesis (Harris, 2001). Instead of phytochromes as photoreceptors, it has
cryptochrome which is also found in higher plants and animals (Funes et al., 2007).
Furthermore, the chloroplast genome of the Chlamydomonas and its photosynthetic apparatus
has some similarities with both higher and lower plants.
Figure 1.3: Cell structure of Chlamydomonas reinhardtii. Nucleolus (Nu), nucleus (N), golgi vesicle (G), vacuole (V), starch grain (S), chloroplast (C), mitochondrion (M), pyrenoid (P), eyespot (E) and flagella (F) (Nickelsen and Kück, 2000).
17
1.3.2 Chlamydomonas reinhardtii as a model organism
C. reinhardtii has been used as a model organism particularly in studies of motility,
chloroplast biogenesis, mitochondria and photosynthesis (Funes et al., 2007). Much of our
current understanding of the chloroplast and the photosynthetic machinery has been achieved
through research on Chlamydomonas. In contrast to higher plants, C. reinhardtii can grow
heterotrophically in the dark with acetate, and photosynthetically with light as the only energy
source. It has a short generation time (~6 hours) and can grow in simple media without any
supplementary vitamins or co‐factors (Harris, 2001).
All three genomes of the alga have been entirely sequenced; the mitochondrial genome with
15.8 kb (Vahrenholz et al., 1993) and the circular chloroplast genome which is approx. 200 kb
(Maul et al., 2002). In 2007, Merchant et al. sequenced the nuclear genome that has a size of
approx. 120 Mb.
Analyzing mutations in such organisms since their haploid nature makes mutations appear
rapidly and easily. Their heterotrophic trait creates an opportunity to investigate mutants with
no photosynthetic machinery (Funes et al., 2007). Besides, transformation techniques have
been developed for all three genomes.
1.3.3 Foreign protein expression in the chloroplast of Chlamydomonas
During the past decades, recombinant proteins have gained much attention and are being
researched on in various expression systems. There is great interest in the search for
expression systems that are safe, inexpensive and have high yields (Mayfield et al., 2007).
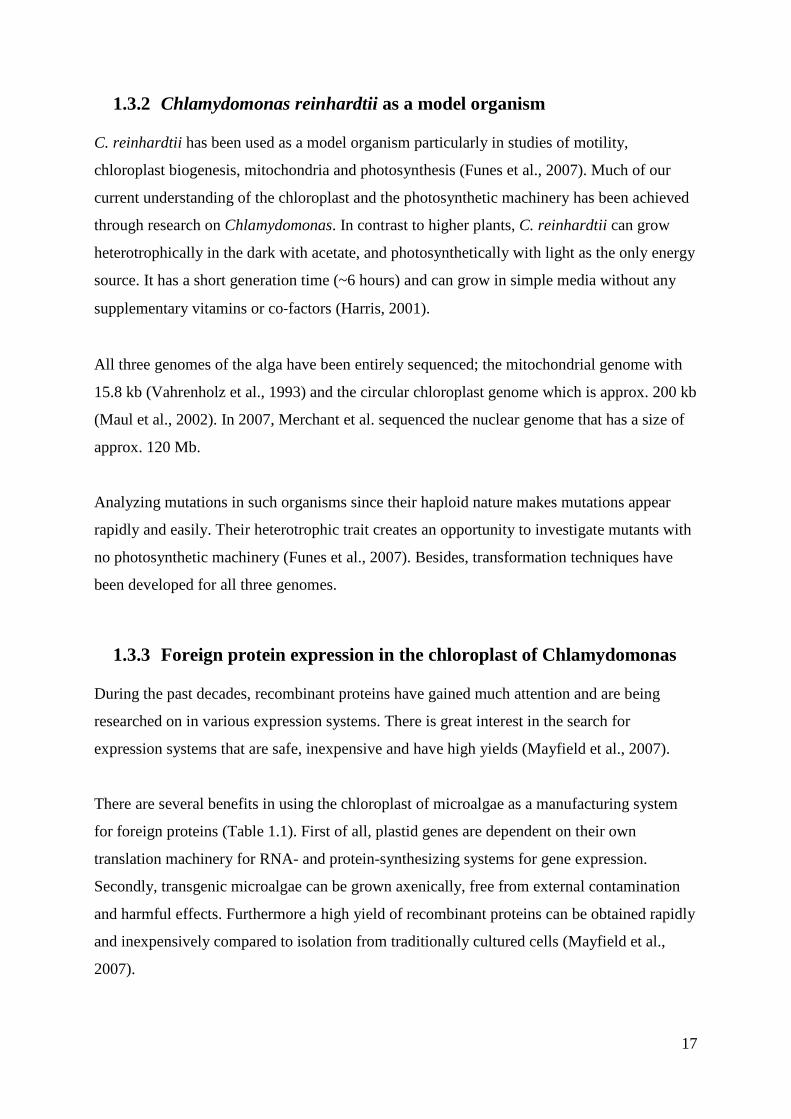
There are several benefits in using the chloroplast of microalgae as a manufacturing system
for foreign proteins (Table 1.1). First of all, plastid genes are dependent on their own
translation machinery for RNA- and protein-synthesizing systems for gene expression.
Secondly, transgenic microalgae can be grown axenically, free from external contamination
and harmful effects. Furthermore a high yield of recombinant proteins can be obtained rapidly
and inexpensively compared to isolation from traditionally cultured cells (Mayfield et al.,
2007).
18
Table 1.1: Recombinant protein expression in the chloroplast of Chlamydomonas (Mayfield et al., 2007).
A stable and high level gene expression in the chloroplast of Chlamydomonas, whether of
natural origin or recombination, is dependent upon various criteria. Most importantly, codon
optimization adjustments for the desired genes are required (Weiβ et al., 2012). Chloroplast
expression constructs having optimized codons have been shown to increase recombinant
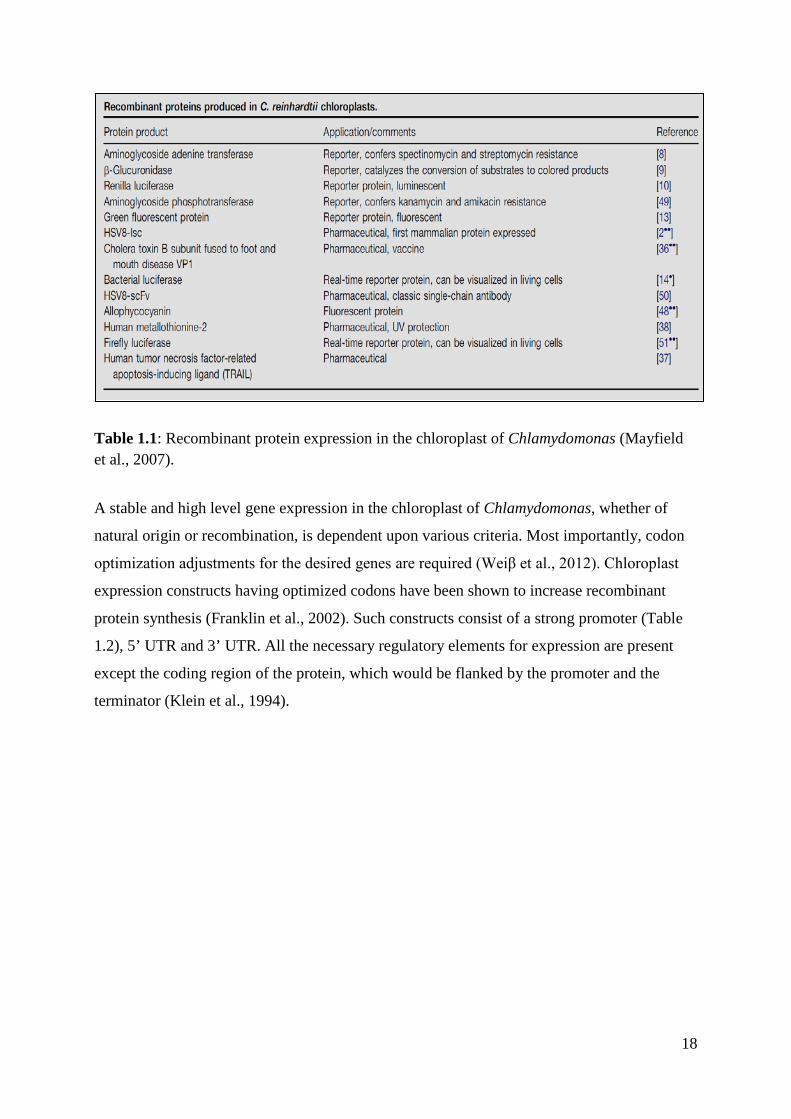
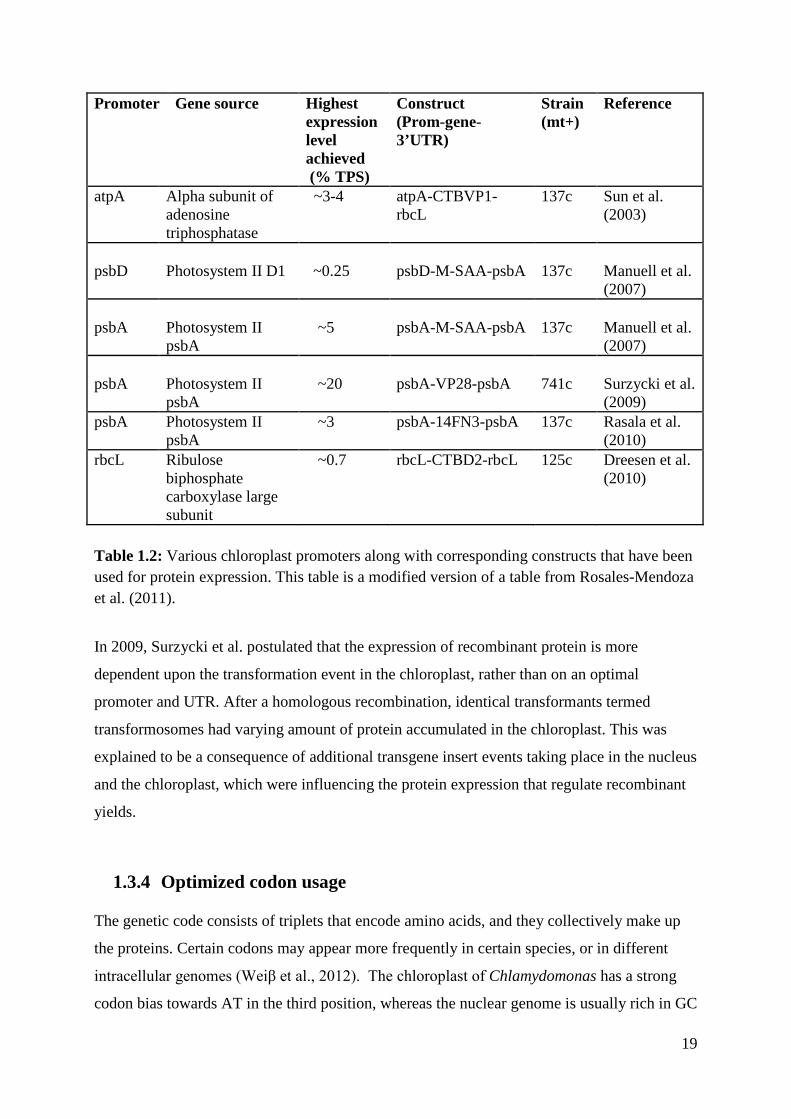
protein synthesis (Franklin et al., 2002). Such constructs consist of a strong promoter (Table
1.2), 5’ UTR and 3’ UTR. All the necessary regulatory elements for expression are present
except the coding region of the protein, which would be flanked by the promoter and the
terminator (Klein et al., 1994).
19
Promoter Gene source Highest expression level achieved (% TPS)
Construct (Prom-gene-3’UTR)
Strain (mt+)
Reference
atpA Alpha subunit of adenosine triphosphatase
~3-4 atpA-CTBVP1-rbcL
137c Sun et al. (2003)
psbD
Photosystem II D1
~0.25
psbD-M-SAA-psbA
137c
Manuell et al. (2007)
psbA
Photosystem II psbA
~5
psbA-M-SAA-psbA
137c
Manuell et al. (2007)
psbA
Photosystem II psbA
~20
psbA-VP28-psbA
741c
Surzycki et al. (2009)
psbA Photosystem II psbA
~3 psbA-14FN3-psbA 137c Rasala et al. (2010)
rbcL
Ribulose biphosphate carboxylase large subunit
~0.7 rbcL-CTBD2-rbcL 125c Dreesen et al. (2010)
Table 1.2: Various chloroplast promoters along with corresponding constructs that have been used for protein expression. This table is a modified version of a table from Rosales-Mendoza et al. (2011).
In 2009, Surzycki et al. postulated that the expression of recombinant protein is more
dependent upon the transformation event in the chloroplast, rather than on an optimal
promoter and UTR. After a homologous recombination, identical transformants termed
transformosomes had varying amount of protein accumulated in the chloroplast. This was
explained to be a consequence of additional transgene insert events taking place in the nucleus
and the chloroplast, which were influencing the protein expression that regulate recombinant
yields.
1.3.4 Optimized codon usage
The genetic code consists of triplets that encode amino acids, and they collectively make up
the proteins. Certain codons may appear more frequently in certain species, or in different
intracellular genomes (Weiβ et al., 2012). The chloroplast of Chlamydomonas has a strong
codon bias towards AT in the third position, whereas the nuclear genome is usually rich in GC
20
(Merchant et al., 2007). Hence the translation efficiency is often low when expressing
transgenic proteins and a common solution is codon optimizing to highly expressed proteins
(Surzycki et al., 2009). Studies have been performed in order to test whether codon
optimization improves the recombinant protein expression in C. reinhardtii chloroplasts (Wu
et al., 2011). Franklin et al. (2002) transformed codon-optimized gfp (green fluorescent
protein) and nonoptimized native gfp genes with the same promoter and UTR into the
chloroplast. Results indicated that the codon-optimized gfp gene had an 80-fold increase in
protein accumulation compared to the non-optimized one.
1.3.5 Transformation by microprojectile bombardment
Microprojectile transformation is an effective method for transferring DNA to cells. It allows
studying transgenes and the alga’s ability to carry out expression of introduced genes (El-
Sheekh, 2000). The first successful microprojectile bombardment of foreign DNA into the
chloroplast of Chlamydomonas was accomplished by Blowers and colleagues (1989). The
method is performed by shooting tungsten or gold-particles coated with DNA into the cell of
interest. The high kinetic energy allows the DNA to penetrate not only the cell wall, but also
the double membrane of chloroplasts. Further on, the DNA can be integrated by homologous
recombination into the chloroplast genome if the elements for a possible recombination are
present (El-Sheekh, 2000; Harris, 2001).
In homologous recombination the integrated DNA can be targeted precisely to a specific
region in the chloroplast genome (Goldschmidt-Clermont, 1991). There are approximately 50-
80 copies of the DNA chromosome in the chloroplast of a Chlamydomonas cell which may
integrate the recombinant form. If all chloroplast genomes contain the inserted gene, the
chloroplast is called homoplasmic, otherwise it is heteroplasmic (Rochaix, 1995). Chloroplast
genomes lack disadvantages such as gene silencing, instability and epigenetic interference
mechanisms, which make recombinant protein expression easier compared to the nucleus
(Bock, 2007).
All three genomes of Chlamydomonas have been reported to have undergone successful
transformation (Harris, 2001), either by microprojectile transformation, electroporation, or
vortexing DNA and cells in the presence of glass beads.
21
1.3.6 Ectoine production in Chlamydomonas reinhardtii
Ectoine has been synthesized de novo in bacterial cells and plants, though with highest yield
in bacteria. Nonetheless, the unicellular organism Chlamydomonas is an optional producer of
ectoine with low salt requirements. Chlamydomonas is a valuable production host in
biotechnology, primarily because its molecular biology is well understood due to studies as a
model organism. Expressing ectoine in genetically modified Chlamydomonas may give
insight into whether ectoine may be possible to synthesize in quantity in higher plants, such as
crops. However, there has not been any ectoine production in Chlamydomonas chloroplast
demonstrated so far.
The nuclear genome of higher plants has been transformed with ectABC genes (Moghaieb et
al., 2011), but not the chloroplast genome. Gene expression in the chloroplast would give
increased protein production, which would be beneficial for obtaining salt tolerant cells or
bulk isolation of ectoine from Chlamydomonas. Additionally, the precursor of ectoine,
aspartate-β-semialdehyde, is probably present in higher amount in chloroplasts than in the
cytoplasm due to their high rates of amino acid synthesis (Louis & Galinski, 1997).
Achieving high expression levels of foreign genes has been challenging (Lunde, 2012). Lunde
(2012) didn’t observe any expression of EctA, nor was there any production of ectoine in the
C. reinhardtii transformant to improve salt tolerance. In order to produce ectoine, the ectA
gene alone is not sufficient. The ectB gene should be expressed in the chloroplast along with
the ectA gene in order to investigate whether any ectoine is synthesized leading to increased
salt tolerance.
22
2 AIMS OF STUDY The main goal of the project:
• To express ectB gene in the chloroplast of Chlamydomonas reinhardtii, along with the
ectA gene.
• To investigate whether the salt tolerance in Chlamydomonas cells transformed with
the ectA/B genes is improved in comparison to wild type cells.
The main goals were further divided into sub‐goals
• Clone the ectB gene along with its gene cassette into a chloroplast transformation
vector that already harbours an ectA gene.
• Introduce the transformation vector containing the ectB gene into the chloroplast of
Chlamydomonas reinhardtii by microprojectile bombardment.
• Detect the ectB gene and mRNA in transformants to measure expression.
• Determine salt tolerance of selected transformants.
• Identify and analyze accumulated ectoine in cell extracts by High-performance liquid
chromatography (HPLC).
23
3 METHODS AND MATERIALS
3.1 Escherichia coli methods Competent E. coli TB1 cells were used in cloning.
3.1.1 Liquid medium for growth with kanamycin (or ampicillin)
Antibiotics are degraded by high temperatures, and are therefore added to the LB medium at approximately 50 °C after autoclaving. Procedure:
- Prepare 1 L Luria-Bertania (LB) medium by mixing: 10 g NaCl, 5 g yeast, 10 g tryptophan, 200 μL 5M NaOH in 1 L dH2O.
- Autoclave the LB medium for approx. 20 minutes. - Let the solution cool and supplement with 1mL kanamycin [50 μg/mL] or 1mL
ampicillin [60 μg/mL]. - The solution is stored in Erlenmeyer flasks at room temperature.
3.1.2 Solid medium for growth with kanamycin (or ampicillin)
- Prepare 1L Luria-Bertania (LB) medium by mixing: 10 g NaCl, 5 g yeast, 10 g tryptophan, 200μL 5M NaOH in 1 L destilled water.
- Add 15 g 1.5% agar the LB medium and autoclave for about 20 minutes. - Let the solution cool and supplement with 1mL kanamycin [50 μg/mL] or 1mL
ampicillin [60 μg/mL]. - The solution is poured into sterile plastic plates under a sterile hood, and allowed to
solidify. - After solidification, the plates are inverted and stored 4 °C.
3.1.3 Preparation of competent E. coli TB1 cells (CaCl2 method)
Use sterilized equipment during this procedure: - Grow TB1 E. coli cells in 3 mL LB medium at 37 °C overnight on a rotating wheel. - Inoculate 100 mL LB medium with 2 mL of the culture in a 250 mL Erlenmeyer flask.
Grow at 37 °C on a shaker. - The absorbance of the culture might be checked at 600nm in a 1 cm plastic cuvette
(with LB medium as standard). - After approx. 2.5 hours, when OD600nm is around 0.6, harvest the cells by
centrifugation [5000rpm for 10 min at 4 °C] in two 50 mL capped plastic tubes. - Discard supernatant and resuspend the pellet in each tube in 20 mL ice-cold sterile
0.1M CaCl2. Leave tubes on ice for 10 minutes.
24
- Repeat the centrifugation as previously and discard supernatant. Resuspend each pellet in ice-cold sterile 2 mL 0.1M CaCl2 with 15% glycerol.
- Transfer 50µL aliquots to each 1.5 mL microfuge tubes on ice, and freeze cells immediately in freezer [-80 °C] or in liquid nitrogen. Cells remain competent for several weeks. Competency may be checked by transformation with a control plasmid, like pUC or pBluescript, at a concentration of 1 ng/µL.
3.1.4 Transformation of competent E. coli
- Melt an aliquot [50 μL] of frozen competent cells on ice, and add 3 μL of ligation mix or pure DNA [1 ng/μL] or 3 μL of a ligation reaction. Mix and leave tube on ice for 30 minutes.
- Heat shock the cells in a water bath for 90 seconds at 42 °C. Cool down immediately on ice.
- Transfer the cells to a Falcon tube with loose cap and add 0.8 mL sterile LB medium. - Incubate the mixture at 37 °C on a rotating wheel for 45 - 60 minutes. - Plate the cell suspension as described in section 3.1.5.
3.1.5 Growth of E. coli on agar plates
The following procedure should be done in a sterile hood. - Sterilize the glass rod spreader in ethanol [96%] and then pass through a burning
flame. Cool it down in air. - Pipette 75 μL E. coli culture (cell suspension) onto antibiotic containing agar plate. - Spread the cells on the plate with the glass rod. - Allow excess liquid to dry into agar. - Invert the plate and incubate at 37 °C for 16 - 20 hours. - Store plate at 4 °C.
3.1.6 Small scale growth of E. coli
- Add 3 mL sterile LB medium containing either ampicillin [60 μg/mL] or kanamycin [50 μg/mL] to a Falcon tube with loose cap.
- Inoculate the medium with cells from a single colony from the growth plate or add 5 µl of a liquid culture.
- Incubate the cells overnight on a rotating wheel at 37 °C. - The tube can be used for plasmid miniprep isolation (section 3.1.8) the next day.
3.1.7 Storage of E. coli at -80 °C
- For long term storage of cells, mix 0.7 mL of the E. coli culture with 0.3 mL of 50% glycerol in a 2 mL tube with screw cap.
25
- Store in freezer at -80 °C.
3.1.8 Miniprep plasmid isolation from E. coli
- Transfer 1.5 mL of an E. coli culture into a 1.5 mL microfuge tube. - Centrifuge at 13,000 g for about 30 seconds. - Discard supernatant, and resuspend the bacterial pellet in 100 μL ice-cold TEG buffer. - Leave for 5 minutes at room temperature. - Add 200 μL of NaOH/SDS [0.2 N, 1% (w/w)] solution prepared fresh. Mix by
inversion, and incubate on ice for 5 minutes. - Add 150 μL ice-cold potassium acetate [5M potassium, 3M acetate]. Mix by
inversion, and incubate on ice for 5 minutes. - Centrifuge at 13,000 g at 4 °C for 5 minutes. - Transfer supernatant to a new microfuge tube, and add 410 μL of
phenol/chloroform/isoamyl alcohol [25:24:1]. Mix by vortexing. - Centrifuge at 13,000 g for 2 minutes. - Transfer upper phase to a new tube and add 410 μL of chloroform/isoamyl alcohol
[24:1]. Mix by vortexing. - Centrifuge at 13,000 g for 2 minutes. - Transfer 310μL of upper phase to a new tube. Add 750 μL of ice-cold ethanol [96%].
Mix by vortexing, and leave on ice for 10 minutes. - Centrifuge at 13,000 g for 10 minutes at 4 °C. - Discard supernatant, and add 1mL of ethanol [70%] to the pellet. Mix by inversion. - Centrifuge at 13,000 g for 5 minutes at 4 °C. - Discard supernatant, and dry the pellet by leaving at room temperature for 10 minutes,
or dry in a vacuum centrifuge. - Dissolve the pellet in 15 μL of dH2O.
A yield of 1- 3μg DNA is expected when isolating plasmid from a 1.5 mL cell culture.
3.1.9 Maxiprep plasmid isolation from E. coli
- Inoculate 100 mL LB medium, supplemented with either ampicillin [60 μg/mL] or kanamycin [50 μg/mL], with 5 μL LB of an E. coli culture or a colony from a plate and grow the culture overnight at 37 °C on a shaker.
- Harvest the cells by centrifugation [6,000 rpm] at 4 °C for 5 minutes. - Discard the supernatant. Resuspend the cells in 3.6 mL ice-cold TEG buffer and
transfer them to a 50 mL plastic tube. - Add 0.4 mL lysozyme [10 mg/mL] in freshly prepared TEG and mix. Leave at room
temperature for 5 minutes and then on ice for 5 minutes. - Add 8 mL NaOH/SDS [0.2N, 1% (w/w)] solution prepared freshly. Mix by inversion,
and leave on ice for 5 minutes.
26
- Add 6 mL ice-cold potassium acetate [5M potassium, 3M acetate]. Mix by inversion and incubate on ice for 5 minutes.
- Centrifuge at 6,000 g for 10 minutes at 4 ⁰C. - Transfer supernatant to a new tube by pouring it through a cheesecloth-filter. - Add 12.5 mL isopropanol. Mix by vortexing and incubate at room temperature for 15
minutes. - Centrifuge at 9,000 g for 10 minutes at room temperature. - Discard supernatant. Leave the tube in room temperature in an inverted position for
drying for 10 minutes. - Resuspend pellet in 3 mL TE [50mM Tris (pH 8), 1mM EDTA] buffer. - Determine the weight of the solution and add TE buffer [50mM Tris (pH 8), 1mM
EDTA] until the solution has a total weight of 4.2 grams. - Add 4.5 g CsCl to the solution, mix, and allow solution to warm to room temperature. - Add 0.5 mL ethidium bromide [10 mg/mL], mix by gently swirling the solution and
centrifuge at 6,000 g for 5 minutes at room temperature. - Transfer supernatant to a Beckman OptiSeal tube, and load tube into VTi 65.2 rotor. - Centrifuge at 50,000 g at 15 ⁰C for 15 hours or more. The rotor should decelerate
without brake. - Illuminate the tube with 350 nm UV-light and extract the middle band containing
DNA with a 2 mL syringe. Expected volume is around 0.5 mL. - Remove ethidium bromide by repeated extraction with 0.5 mL isopropanol/water [7:1]
up to five times. - Dialyze against sterile 200 mL TE buffer at 4 °C to remove CsCl. Replace with fresh
buffer every hour, twice or three times. - Transfer DNA solution to a tube with screw cap, and store in -20 °C freezer. - Determine DNA concentration by measuring OD260nm, with a 1:100 dilution as in
section 3.2.3.
A yield of about 150 – 400 μg DNA is expected.
3.2 DNA methods
3.2.1 Agarose gel electrophoresis
1% agarose gel was used throughout this project, prepared as follows: - Dissolve 0.6g agarose in 60 mL TAE [1X] buffer by boiling. - Cool the solution down to 50 °C, and add 10μL ethidium bromide [1 mg/mL]. - Pour the solution into a tray, insert the comb, and wait until agarose is solid. - Mix 9 μL DNA sample with 1μL agarose gel loading buffer, and load 10μL into each
well in the gel. - Load a 1kb plus DNA ladder (Invitrogen) in another well for estimation of DNA size
and concentration.
27
- Run the agarose gel in electrophoresis buffer at 90V for 30 minutes or longer. - Visualize the bands under UV-light.
3.2.2 Purification of DNA fragments from an agarose gel
After the gel electrophoresis separate the DNA fragments according to size. Bands of interest can be sliced out and purified by an IllustraTM GFXTM PCR DNA and Gel Band Purification Kit (GE Healthcare). Procedure:
- Cut out an agarose slice which contains the DNA fragment of interest, and put into a 1.5 mL Eppendorf tube.
- Calculate the weight of agarose gel slice by weighing. - Add 10 mL Capture buffer (type 3) to each 10 mg agarose gel. - Incubate at 60 °C until the gel is completely dissolved. Mix by inverting the tube
occasionally. - Transfer 800 mL of the Capture buffer sample to a GFX Microspin column assembled
with a collection tube beneath. Incubate at room temperature for 1 minute. - Spin the assembled column and collection tube at 16,000 g for 30 seconds. Discard the
flow. Repeat this step if there is more sample left. - To remove leftovers from agarose gel, add 500 μL Wash buffer type 1 to the GFX
Microspin column and spin at 16,000 g for 30 seconds. - Discard the collection tube and move the GFX Microspin column to a 1.5 mL
Eppendorf tube. - Add 10-50 μL Elution buffer type 4 or type 6 to the centre of the GFX microspin
column and incubate at room temperature for 1 minute. - Spin at 16,000 g for 1 minute to isolate the DNA from the membrane of the GFX
Microspin column. The DNA can be stored at -20 °C.
3.2.3 DNA and RNA quantification
Determination by UV light absorption - Calibrate the spectrophotometer at 260nm with a control sample (usually dH2O, as
dH2O is used to resuspend DNA). - Dilute the DNA sample if needed. - Measure the absorption at 260nm. OD 1.0 = 50 μg DNA/mL [40 μg RNA/mL].
Dot spot method If the DNA sample contains impurities UV light absorption cannot be used. Another way to estimate the amount of DNA is by the Dot spot method, where the amount of DNA is proportional to the amount of fluorescence.
28
- Prepare DNA standards in water solutions with several concentrations [0 ng/μL, 2.5 ng/μL, 5 ng/μL, 7.5 ng/μL, 10 ng/μL, 15 ng/μL, and 20 ng/μL].
- On a UV-light transparent surface, add 2 μL ethidium bromide [2 μg/mL] to each 2 μL drop of DNA standards. Add 2 μL of the DNA sample(s), might be diluted to fit the range of standards. Mix well within the drop by pipetting up and down.
- Examine the intensity of fluorescence of the drops under UV-light and compare with the intensity of the DNA standards to roughly estimate the DNA concentration.
3.3 Subcloning
3.3.1 Plasmids
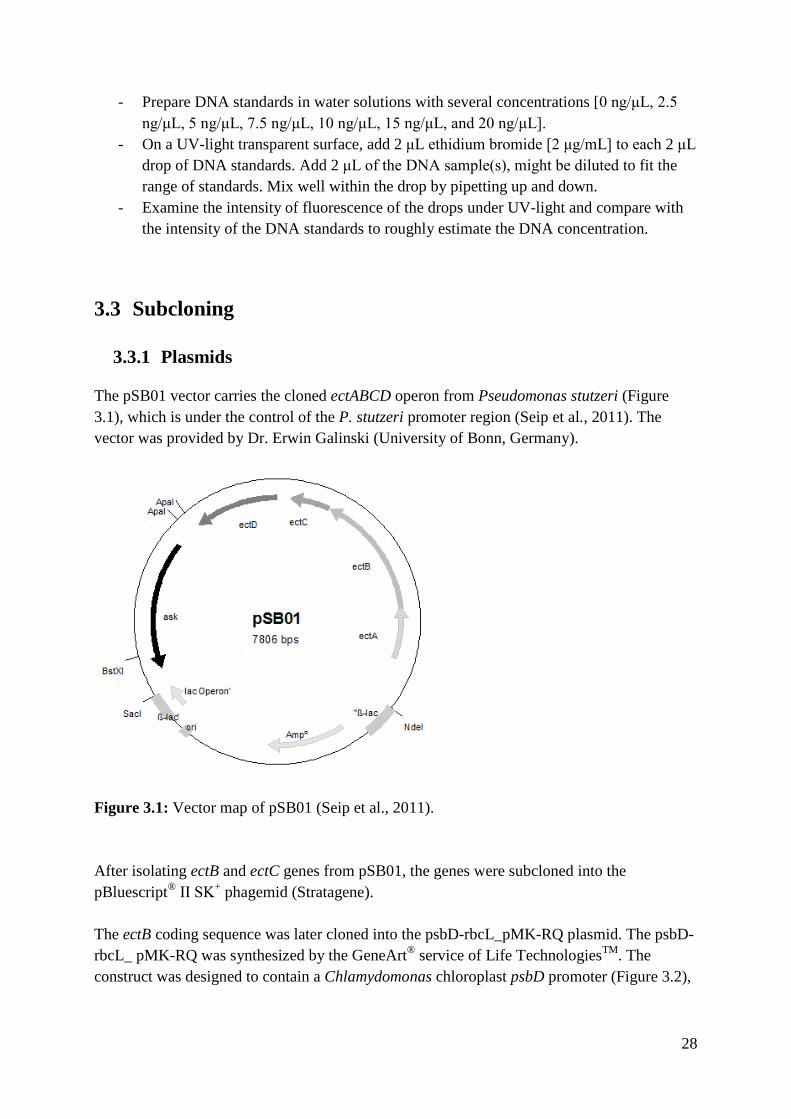
The pSB01 vector carries the cloned ectABCD operon from Pseudomonas stutzeri (Figure 3.1), which is under the control of the P. stutzeri promoter region (Seip et al., 2011). The vector was provided by Dr. Erwin Galinski (University of Bonn, Germany).
Figure 3.1: Vector map of pSB01 (Seip et al., 2011). After isolating ectB and ectC genes from pSB01, the genes were subcloned into the pBluescript® ΙΙ SK+ phagemid (Stratagene). The ectB coding sequence was later cloned into the psbD-rbcL_pMK-RQ plasmid. The psbD-rbcL_ pMK-RQ was synthesized by the GeneArt® service of Life TechnologiesTM. The construct was designed to contain a Chlamydomonas chloroplast psbD promoter (Figure 3.2),
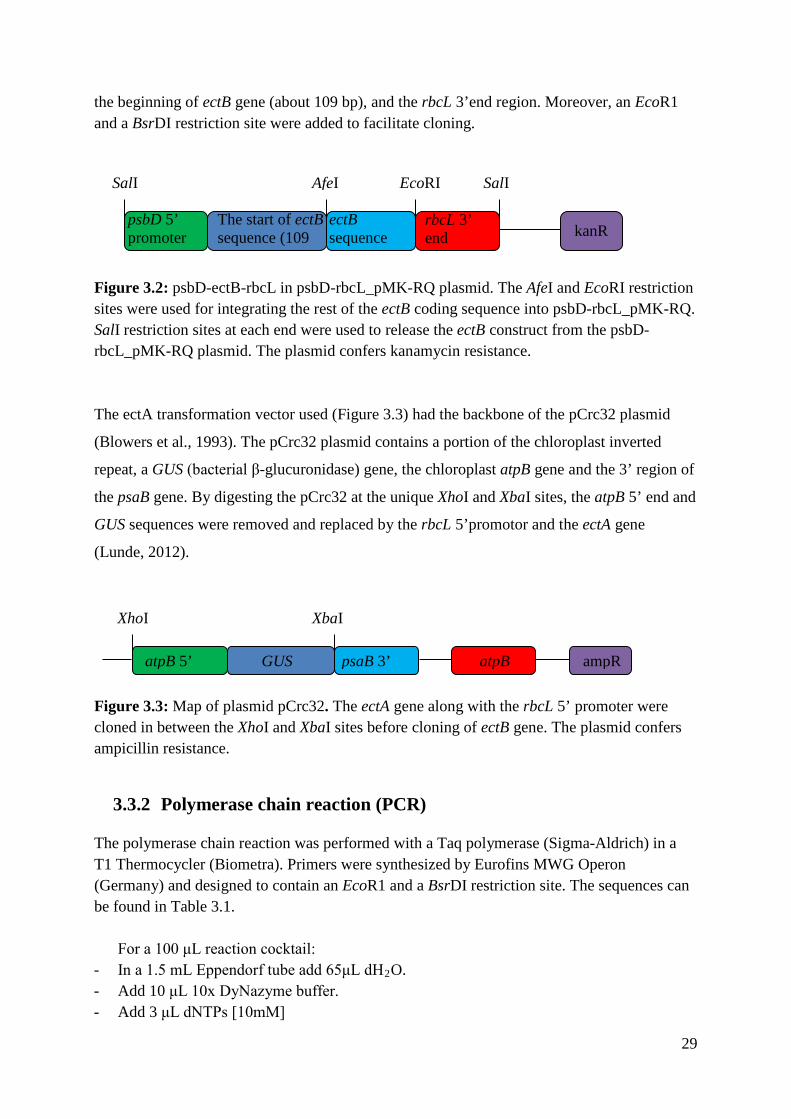
29
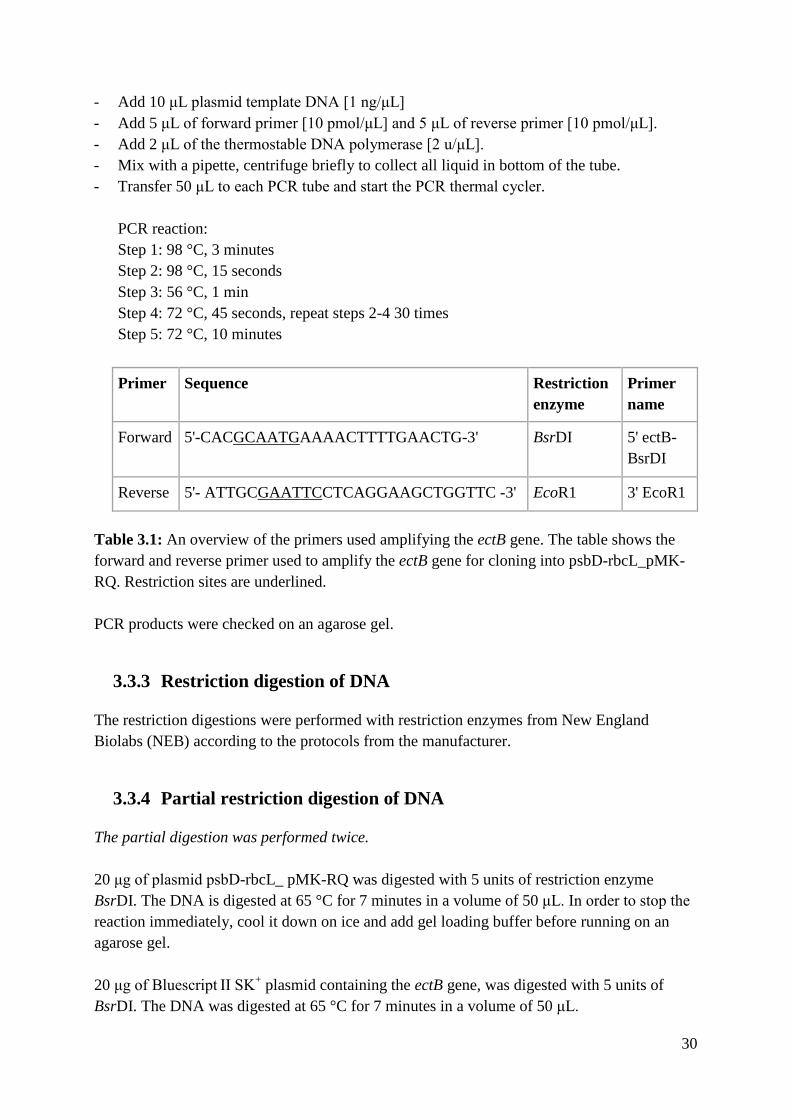
the beginning of ectB gene (about 109 bp), and the rbcL 3’end region. Moreover, an EcoR1 and a BsrDI restriction site were added to facilitate cloning. Figure 3.2: psbD-ectB-rbcL in psbD-rbcL_pMK-RQ plasmid. The AfeI and EcoRI restriction sites were used for integrating the rest of the ectB coding sequence into psbD-rbcL_pMK-RQ. SalI restriction sites at each end were used to release the ectB construct from the psbD-rbcL_pMK-RQ plasmid. The plasmid confers kanamycin resistance. The ectA transformation vector used (Figure 3.3) had the backbone of the pCrc32 plasmid
(Blowers et al., 1993). The pCrc32 plasmid contains a portion of the chloroplast inverted
repeat, a GUS (bacterial β-glucuronidase) gene, the chloroplast atpB gene and the 3’ region of
the psaB gene. By digesting the pCrc32 at the unique XhoI and XbaI sites, the atpB 5’ end and
GUS sequences were removed and replaced by the rbcL 5’promotor and the ectA gene
(Lunde, 2012).
Figure 3.3: Map of plasmid pCrc32. The ectA gene along with the rbcL 5’ promoter were cloned in between the XhoI and XbaI sites before cloning of ectB gene. The plasmid confers ampicillin resistance.
3.3.2 Polymerase chain reaction (PCR)
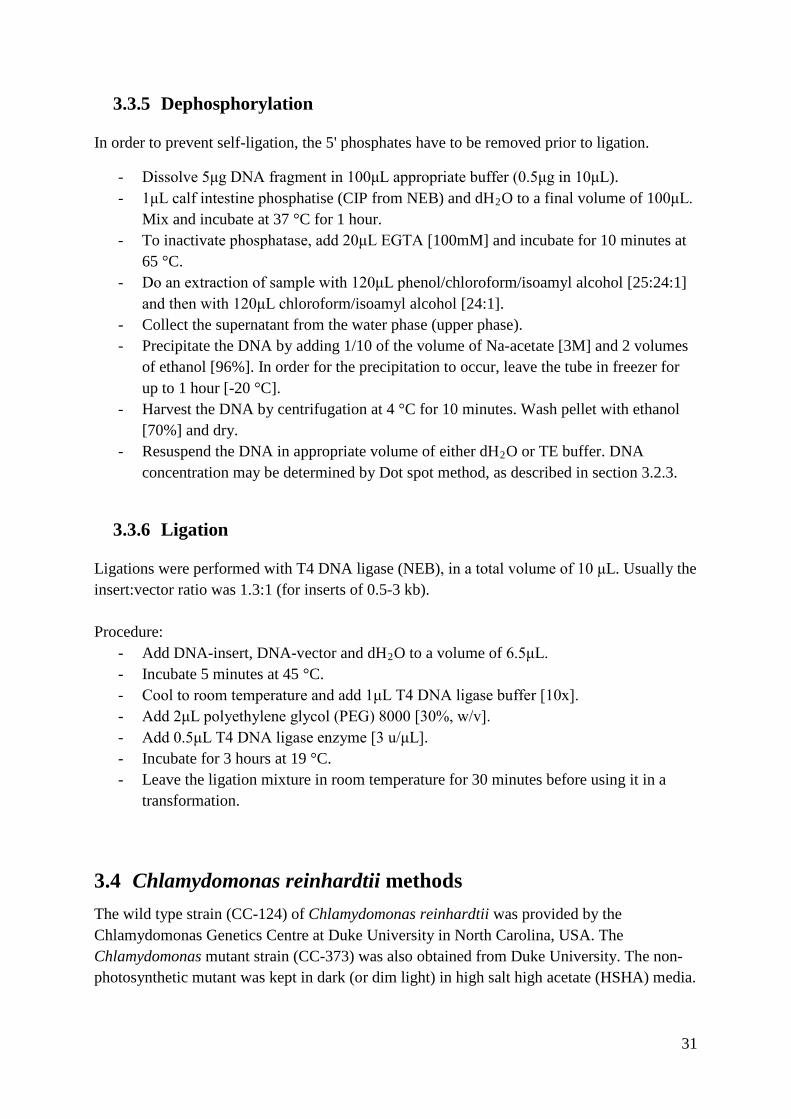
The polymerase chain reaction was performed with a Taq polymerase (Sigma-Aldrich) in a T1 Thermocycler (Biometra). Primers were synthesized by Eurofins MWG Operon (Germany) and designed to contain an EcoR1 and a BsrDI restriction site. The sequences can be found in Table 3.1.
For a 100 μL reaction cocktail: - In a 1.5 mL Eppendorf tube add 65μL dH2O. - Add 10 μL 10x DyNazyme buffer. - Add 3 μL dNTPs [10mM]
XhoI XbaI
atpB 5’
GUS psaB 3’
atpB ampR
SalI AfeI
psbD 5’ promoter
The start of ectB sequence (109
ectB sequence
rbcL 3’ end kanR
SalI EcoRI
30
- Add 10 μL plasmid template DNA [1 ng/μL] - Add 5 μL of forward primer [10 pmol/μL] and 5 μL of reverse primer [10 pmol/μL]. - Add 2 μL of the thermostable DNA polymerase [2 u/μL]. - Mix with a pipette, centrifuge briefly to collect all liquid in bottom of the tube. - Transfer 50 μL to each PCR tube and start the PCR thermal cycler.
PCR reaction: Step 1: 98 °C, 3 minutes Step 2: 98 °C, 15 seconds Step 3: 56 °C, 1 min Step 4: 72 °C, 45 seconds, repeat steps 2-4 30 times Step 5: 72 °C, 10 minutes
Primer Sequence Restriction enzyme
Primer name
Forward 5'-CACGCAATGAAAACTTTTGAACTG-3' BsrDI 5' ectB-BsrDI
Reverse 5'- ATTGCGAATTCCTCAGGAAGCTGGTTC -3' EcoR1 3' EcoR1
Table 3.1: An overview of the primers used amplifying the ectB gene. The table shows the forward and reverse primer used to amplify the ectB gene for cloning into psbD-rbcL_pMK-RQ. Restriction sites are underlined. PCR products were checked on an agarose gel.
3.3.3 Restriction digestion of DNA
The restriction digestions were performed with restriction enzymes from New England Biolabs (NEB) according to the protocols from the manufacturer.
3.3.4 Partial restriction digestion of DNA
The partial digestion was performed twice. 20 μg of plasmid psbD-rbcL_ pMK-RQ was digested with 5 units of restriction enzyme BsrDI. The DNA is digested at 65 °C for 7 minutes in a volume of 50 μL. In order to stop the reaction immediately, cool it down on ice and add gel loading buffer before running on an agarose gel. 20 μg of Bluescript ΙΙ SK+ plasmid containing the ectB gene, was digested with 5 units of BsrDI. The DNA was digested at 65 °C for 7 minutes in a volume of 50 μL.
31
3.3.5 Dephosphorylation
In order to prevent self-ligation, the 5' phosphates have to be removed prior to ligation.
- Dissolve 5μg DNA fragment in 100μL appropriate buffer (0.5μg in 10μL). - 1μL calf intestine phosphatise (CIP from NEB) and dH2O to a final volume of 100μL.
Mix and incubate at 37 °C for 1 hour. - To inactivate phosphatase, add 20μL EGTA [100mM] and incubate for 10 minutes at
65 °C. - Do an extraction of sample with 120μL phenol/chloroform/isoamyl alcohol [25:24:1]
and then with 120μL chloroform/isoamyl alcohol [24:1]. - Collect the supernatant from the water phase (upper phase). - Precipitate the DNA by adding 1/10 of the volume of Na-acetate [3M] and 2 volumes
of ethanol [96%]. In order for the precipitation to occur, leave the tube in freezer for up to 1 hour [-20 °C].
- Harvest the DNA by centrifugation at 4 °C for 10 minutes. Wash pellet with ethanol [70%] and dry.
- Resuspend the DNA in appropriate volume of either dH2O or TE buffer. DNA concentration may be determined by Dot spot method, as described in section 3.2.3.
3.3.6 Ligation
Ligations were performed with T4 DNA ligase (NEB), in a total volume of 10 μL. Usually the insert:vector ratio was 1.3:1 (for inserts of 0.5-3 kb). Procedure:
- Add DNA-insert, DNA-vector and dH2O to a volume of 6.5μL. - Incubate 5 minutes at 45 °C. - Cool to room temperature and add 1μL T4 DNA ligase buffer [10x]. - Add 2μL polyethylene glycol (PEG) 8000 [30%, w/v]. - Add 0.5μL T4 DNA ligase enzyme [3 u/μL]. - Incubate for 3 hours at 19 °C. - Leave the ligation mixture in room temperature for 30 minutes before using it in a
transformation.
3.4 Chlamydomonas reinhardtii methods The wild type strain (CC-124) of Chlamydomonas reinhardtii was provided by the Chlamydomonas Genetics Centre at Duke University in North Carolina, USA. The Chlamydomonas mutant strain (CC-373) was also obtained from Duke University. The non-photosynthetic mutant was kept in dark (or dim light) in high salt high acetate (HSHA) media.
32
3.4.1 Liquid media for growth of Chlamydomonas
HS (high salt) For 1 litre: 20 mL salt stock (see below) 20 mL phosphate stock (see below) 1 mL trace elements (Hutner) HSHA (high salt high acetate) For 1 litre: 20 mL salt stock (see below) 20 mL phosphate stock (see below) 1 mL trace elements (Hutner) 2.5 g potassium acetate Salt stock (50x): Phosphate stock (50x): For 500 mL For 500 mL 12.50 g NH4Cl 47 g K2HPO4 . 3 H2O 0.50 g MgSO4 . 7 H2O 18 g KH2PO4 0.25 g CaCl2 . 2 H2O
3.4.2 Solid media for growth of Chlamydomonas
Procedure for 1 L media: - Prepare 1 L high salt high acetate or high salt (HSHA/HS) media with 1.5 % agar (15g
agar/L). Autoclave for 20 minutes. - Cool down solution to 50 °C. - Pour into sterile plates and let solidify. - Wait until solidification, before turning the plates upside down in order to avoid water
condensation. Seal in plastic bags and store at room temperature.
3.4.3 Culturing the photosynthetic mutant of Chlamydomonas for transformation
The cells are light-sensitive and should at all times be kept in dark or dim light. Inoculate 100 mL of HSHA medium with cells of the non-photosynthetic Chlamydomonas mutant and grow for 2 days on a shaker.
- Transfer about 5 mL of the culture to a new flask with 100 mL HSHA media. - Grow the culture on a shaker for 2 days. - Transfer culture to a flask with 500 mL HSHA medium and grow on shaker for 1 day.
33
3.4.4 Plating the photosynthetic mutant of Chlamydomonas for transformation
The cells were plated on HSHA agar right before the transformation. All equipment and solutions should be sterile.
- Centrifuge 500 mL of the culture at 4000 rpm for 5 minutes at room temperature in two sterile centrifuge tubes.
- Discard the supernatant and resuspend cells in 500 μL HSHA media. - Melt agar medium [0.11% agar in HSHA] in a microwave oven. Add 900 μL to two
preheated [42 °C] sterile microfuge tubes. - Let the tubes cool down to 42 °C. - Add 100 μL of the resuspended Chlamydomonas cells to each microfuge tube, and
mix gently. - Transfer 300 μL of the cell suspension to each HSHA agar plate [5 cm in diameter].
Spread the liquid evenly on the plates by shaking the plate. - Store the plates in the dark for about 3 hours before microprojectile bombardment.
3.4.5 Microprojectile bombardment
The transformation of foreign gene into the Chlamydomonas chloroplast was performed with the particle delivery system (PSD1000He, Bio-Rad), with helium gas at a pressure of 1350 psi. Procedure:
- Precipitate the DNA sample (transformation vector) to 0.6 μm gold particles (Bio-Rad), according to the protocol provided by manufacturer of the PDS. Resuspend carefully as DNA coated particles tend to aggregate.
- Before shooting, the inside of the particle delivery system (PSD1000He, Bio-Rad) should be sterilized with alcohol.
- Following the protocol for shooting and place the agar plates in dark at room temperature overnight.
3.4.6 Selection of the transgenic clones of Chlamydomonas
Transformants are selected by transferring the algae to HS agar plates and growing them photosynthetically in continuous light. Non-transformed cells will eventually die. The transfer should be done under a sterile hood. Wait 1-2 days until the liquid is dried before turning the plates upside down. Procedure:
- Add 300 μL high salt (HS) media evenly to each plate. - Scrap all cells from the agar plate surface with a sterile metal rod.
34
- Transfer the media (now containing the cells) to a fresh HS agar plate with a pipette, and spread it on the agar plate with a glass rod.
- Place the HS agar plates under light. Wait 1-2 days before sealing the plates with parafilm so the liquid does not evaporate.
- Colonies should appear after approximately 2-3 weeks. These can be picked and transferred to an HS agar plate with a visual grid, and subsequently used to inoculate liquid cultures of 200 mL.
3.4.7 Photosynthetic growth of Chlamydomonas with 2% CO2
- Add approximately 100 mL of high salt (HS) medium to sterilized 250 mL glass tubes, and then add about 60 mL of a liquid Chlamydomonas culture.
- Place the glass tubes on a rack in a water bath at 32 °C and a light source. - Connect the tubes to a source of 2% CO2 in air. Make sure that there is equal amount
of bubbling in each glass tube. - After 2-3 days the cultures should be dark green and ready for harvesting.
3.4.8 Isolation of genomic DNA from Chlamydomonas
Use a culture of ≈ 2x10⁶ cells/mL.
- Centrifuge 40 mL culture at 5000 g for 5 minutes at 4 °C. - Resuspend pellet in 0.75 cold DNA extraction buffer [100 mM Tris (pH 8.0), 50 mM
Na2-EDTA, 0.5 M NaCl, 10 mM ß-mercaptoethanol] and transfer the suspension to a 2 mL microfuge tube.
- Add 60 µL SDS [21% w/v], mix, and incubate for 15 min at 65 °C. - Cool down to room temperature and add 0.9 mL phenol [equilibrated with 0.1 M Tris,
pH 8.0]. Mix carefully by inversion. - Centrifuge at 13,000 g for 5 minutes at room temperature. - Transfer 750 μL of upper phase to a new 2 mL microfuge tube, add 750 μL
phenol/chloroform/isoamylalcohol [25:24:1], and mix by inversion. - Centrifuge at 13,000 g at room temperature for 5 minutes. - Transfer 650 μL of upper phase to a new 1.5 mL microfuge tube, and add 650 μL of
isopropanol. Mix by inversion and incubate at room temperature for 5 minutes (or until precipitation occurs).
- Centrifugation at 4,000 g for 2 minute at room temperature. Discard supernatant and add 1mL of ice-cold ethanol [70%]. Mix by inversion.
- Centrifuge at 13,000 g at room temperature for 2 minutes. Discard supernatant and dry pellet in a vacuum centrifuge, or by incubation at room temperature.
- Centrifuge at 13,000 g at room temperature for 2 min. Discard supernatant and dry pellet in a vacuum centrifuge, or by incubation at room temperature.
35
- Resuspend pellet in 90 µL TE buffer [10 mM Tris (pH 8.9), 1 mM Na2EDTA], add 10 µl RNase A [1 mg/mL], and incubate at 37 °C for 1 hour.
- Extract the mixture once with 100 µL phenol/chloroform/isoamylalcohol [25:24:1] and once with 100 µL chloroform/isoamylalcohol [24:1].
- Precipitate DNA in freezer with 0.3 M Na-acetate and 2 volumes ethanol [96 %], for up to 1 hour or overnight.
- Centrifuge at 13,000 g at 4 °C for 10 minutes. Discard supernatant, and add 1 mL of ice-cold ethanol [70 %]. Mix by inversion.
- Centrifuge at 13,000 g at 4 °C for 5 minutes. Discard supernatant and dry pellet in a vacuum centrifuge, or by incubation at room temperature.
- Resuspend DNA in 20 µL dH2O. - Measure DNA concentration (chapter 3.2.3). Expected yield is about 4 µg.
3.4.9 RNA isolation from Chlamydomonas
All work was done with RNase-free material and solutions. The cells were grown in 12-hour light/ dark cycles to a concentration of about 2 x 10⁶ cells/mL. Always keep samples on ice. Procedure:
- Centrifuge 40 mL Chlamydomonas culture at 5,000 g for 5 minutes at 4 °C. - Discard the supernatant and resuspend the pellet in 1.5 mL ice-cold lysis buffer [0.6M
NaCl, 200mM tris (pH 8.0), 10mM Na2EDTA]. - Add 150 μL RNase inhibitor [200mM vanadyl ribonucleoside (NEB)]. - Transfer cells to a 15 mL tube containing 2 mL phenol [equilibrated with 0.1 M tris
pH 8.0] and 1.5 mL SDS [4 %] preheated to 65 °C. Mix. - Incubate for 15 minutes at 65 °C, mix occasionally by shaking. - Cool down on ice and add 1 mL ice-cold chloroform/isoamylalcohol [24:1]. Mix. - Centrifuge at 8,000 g for 5 minutes at 4 °C. - Transfer 3 mL of the upper phase to a new 15 mL tube containing 3 mL ice-cold
phenol/chloroform/isoamylalcohol [25:24:1]. Mix. - Centrifuge at 8,000 g for 5 minutes at 4 °C. - Transfer 2.5 mL of the upper phase to another 15 mL tube containing 2.5 mL ice-cold
phenol/chloroform/isoamylalcohol [25:24:1]. Mix. - Centrifuge at 8,000 g at 4 °C for 5 minutes. - Transfer 2 mL of the upper phase to a new 15 mL tube containing 2.5 mL ice-cold
isopropanol and 250 μL Na-acetate [3M, pH 5.2]. Mix and incubate at -20 °C for at least 1 hour.
- Centrifuge at 12,000 g for 15 minutes at 4 °C. Discard supernatant, and leave the tube inverted on a paper towel for 10 minutes in order to completely dry the pellet.
- Resuspend pellet in 300 μL DEPC-treated H2O, transfer to a 1.5 mL microfuge tube and add 100 μL ice-cold LiCl [3M]. Incubate on ice for 2 hours.
- Centrifuge at 13,000 g for 30 minutes at 4 °C. - Discard supernatant and resuspend pellet in 100 μL DEPC-treated H2O.
36
- Determine the concentration by diluting 10 μL of the RNA solution in 1 mL DEPC-treated H2O, and measure OD260nm [OD 1.0 = 40 μg RNA/mL].
- Precipitate the rest of the RNA solution and add 10μL Na-acetate [3M (pH 5.2)] and 200 μL ice-cold ethanol [96%]. Incubate at -20 °C for 1 hour.
- Centrifuge at 13,000 g for 10 minutes at 4 °C. Discard supernatant and add 1 mL of ethanol [70%]. Mix by inversion.
- Centrifuge at 13,000 g for 10 minutes at 4 °C. Discard supernatant and dry the pellet in a vacuum centrifuge.
- Resuspend RNA in DEPC-treated H2O to a final concentration of 2 μg/μL.
3.5 Analytical methods
3.5.1 Sequencing
Sequencing of the constructs was done by Eurofins MWG/Operon (Germany).
3.5.2 Preparation of radioactive probes for DNA and RNA blots
ectA and ectB probes used for hybridization in Southern and Northern analyses were full-length coding sequences isolated from plasmids by restriction cutting. The probes were labelled as follows:
- Add 10.5 μL dH2O and 2 μL template DNA [100-200 ng/μL] in a 1.5 mL Eppendorf tube.
- Denature the mixture in boiling water bath for at least 5 minutes. - Add 5 μL cold labeling buffer, 2.5 μL BSA [4 mg/mL], 1.5 μL dNTP mixture
(deoxyadenosine triphosphate, deoxythymidine triphosphate, deoxyguanosine triphosphate [1mM of each, mixed 1:1:1])
- Add 2.5 μL [25 microcurie (μCi)] [ɑ-32P]-dCTP, and mix with a pipette. - Add 1 μL DNA polymerase I, (Klenow fragment) [2 units/mL] (NEB). - Spin briefly and incubate at room temperature for 3 hours. - Store at -20 °C. For hybridization use 1/2000 of the volume of the hybridization
solution.
3.5.3 DNA Slot blot
- Add 3 μL NaOH [5N] to a 1.5 μL microfuge tube. - Add 500 ng DNA dissolved in H2O [1-19µL], and raise total volume to 50 μL by
adding dH2O. - Denature by incubating at 65 °C for 45 - 60 minutes. Cool down to room temperature.
37
- Add 50 μL saline-sodium citrate buffer (SSC) [20x]. - Assemble the dot blot apparatus (PR 600 SlotBlot, Hoefer Scientific Instruments)
according to instructions from manufacturer. - In order to avoid air bubbles in sample slot, soak blotting membrane (nylon membrane
from ZetaProbe; BioRad) in dH2O for 5 minutes, and then in SSC [10x] for 5 minutes. - Place blotting membrane on dot blot apparatus, and pull 200 μL SSC [10x] through
sample slot by suction with a water-based vacuum pump. - Turn off suction. Add 100 μL SSC [10x] and denatured DNA sample in sample slot.
Mix with a pipette in the slot. Turn on suction and wait until all liquid has been sucked through.
- Turn off suction, and wash slot by sucking through 200 μL SSC [10x] till it is almost dry.
- Take out the blotting membrane, without touching the DNA binding area, and wrap it into plastic wrap.
- Crosslink DNA to membrane with 1200 energy in a CL-1000 Ultraviolet Crosslinker, UVP. Have the DNA binding side face the light.
- Hybridize the membrane with a radioactive probe and develop this by autoradiography (section 3.5.4 & 3.5.5)
3.5.4 Hybridization of DNA and RNA with radiolabelled probes
This protocol is used for hybridization of radioactive probes using a random primer labelled probe of 1 to 3 kb size. All buffers should be preheated at 65 °C before use. Procedure:
- Wash the blotting membrane with crosslinked DNA in dH2O. - Place the blotting membrane with its backside against the wall in a hybridization tube.
Add 2-3 mL of pre-hybridization buffer, and incubate at 65 °C on a rotating device for 15 minutes.
- Discard the hybridization buffer and hybridize at 65 °C with about 0.1 mL of pre-hybridization buffer per square cm of blotting membrane.
- Add random primer labelled probe until the volume corresponds to 1:2000 of the hybridization buffer.
- Incubate for about 24 hours on the rotation device. - Discard the radioactive buffer, and wash membrane twice in buffer 1 for 5 minutes at
65 °C. - Wash seven times, each for 5 min in buffer 2, and a final wash for 20 minutes in
buffer 2. - Wash the blotting membrane with dH2O, and wrap membrane in plastic foil. Verify
radioactivity with a Geiger counter and visualize the hybridization by autoradiography.
38
3.5.5 Autoradiography
This procedure was performed with Kodak®BioMax®MS x-ray film and solutions.
- Adjust the blotting membrane by taping it onto an autoradiography cassette, and place an x-ray film and intensifying screen over it.
- Expose the film to -80 °C by using an intensifying screen overnight. Exposure to intensifying screen may last for longer, depending upon results from hybridization acquired by Geiger counter.
- Develop the film by dipping it in fixation solution for 1 min, then wash in H2O and finally in developer solution for 1 min.
- Wash away residues from previous solutions by H2O and dry the film in air or by hairdryer.
3.5.6 Southern analysis
- Isolate genomic DNA. - Digest 1.5 µg genomic DNA with 30 units enzyme in a total volume of 20 µL. Digest
for 4 hours. - Precipitate the DNA with 2.2 µL Sodium acetate [3M (pH 5.2)], 67 µL ethanol [96%]
and put in freezer for 1 hour. - Centrifuge at 13000 g for 10 minutes at 4 °C to collect the precipitate, and wash the
pellet with 1 mL ethanol [70%]. - Centrifuge at 13000 g for 5 minutes at 4 °C. Discard the supernatant. Dry pellet in
vacuum centrifuge. - Resuspend DNA in 10 µL TAE-buffer [1x] and add and 2 µL gel loading buffer. - Run an agarose gel [1% agarose gel, at 90V]. - Visualize the gel under UV-light and take a picture. - Incubate the gel in denaturation solution for 30 minutes. - Incubate the gel in neutralization solution for 30 minutes. - Add SSC [10X] to a capillary transfer apparatus. - In the transfer apparatus, stack in the following order; three 3mm thick Whatman
papers, a nylon membrane (BioRad), the gel, 2 Whatman papers and some paper towels on top. Remember to place the gel in the right orientation and avoid bubbles.
- Wash the nylon membrane in SSC [2x]. - Crosslink the DNA to the membrane with CL-1000 Ultraviolet Crosslinker, UVP
(USA), at 1500. - Hybridize the membrane with a probe and visualize the result by autoradiography.
39
3.5.7 Northern analysis
All equipment used in this procedure has to be RNAase-free.
Procedure: - The electrophoresis chamber, comb and gel tray are sterilized overnight in H2O2
[3%]. - Prepare a 1.3% agarose gel by dissolving 0.78g agarose in 37 mL DEPC-treated water,
and bring it up to boil in a microwave. - Cool down in a water bath to 65 °C. - Add 12 mL MOPS [5x] and 11 mL formaldehyde [37%]. - Mix gently by swirling and pour into a gel tray. Place the comb in. - Prepare the sample by mixing following solutions in given order:
2.0 μL MOPS buffer [5x] 3.5 μL formaldehyde 3.5 μL ethidium bromide [100 μg/mL] 10.0 μL formamide 4.5 μL RNA [2 μg/μL]
- Incubate the samples at 65 °C for 15 minutes. - Put the gel into the electrophoresis chamber and add running buffer to immerse the gel
(315 mL DEPC-H2O, 90 mL MOPS [5x], and 45 mL formaldehyde). - Pre-run the gel for 5 minutes at 60 mA. - Cool down sample, centrifuge at max speed for 1 minute, and add 2 μL RNA gel
loading buffer. - Mix with a pipette and add 20 μL samples in each well. - In order to get better resolution, run the samples at 60 mA for 10 minutes in reverse
direction. And then in normal direction until the bromphenol blue band is at the bottom of the gel.
- Photograph the gel with a digital camera. - Wash briefly in DEPC-treated H2O and transfer RNA to a nylon membrane following
the protocol (BioRad Zetaprobe protocol). - Transfer for 5.5 hours. Put membrane into SSC [2x]. Check gel under UV-light for
complete transfer. - Wrap membrane into plastic foil, and crosslink DNA to membrane with CL-1000
Ultraviolet Crosslinker, UVP, set to 1500 energy. - Hybridize the membrane with a radioactive probe and develop by autoradiography.
3.5.8 Salt tolerance experiment
In order to check changes in salt tolerance, Chlamydomonas reinhardtii cells were grown phototrophically in HS media under bright light and 2% CO2 in the presence of varying salt concentrations. In addition to wild type cells grown in either 0.25% or 0.5% NaCl, the mutant was grown at NaCl concentrations of 0.25%, 0.5% and 1.0%. Growth differences were evaluated visually.
40
4 RESULTS
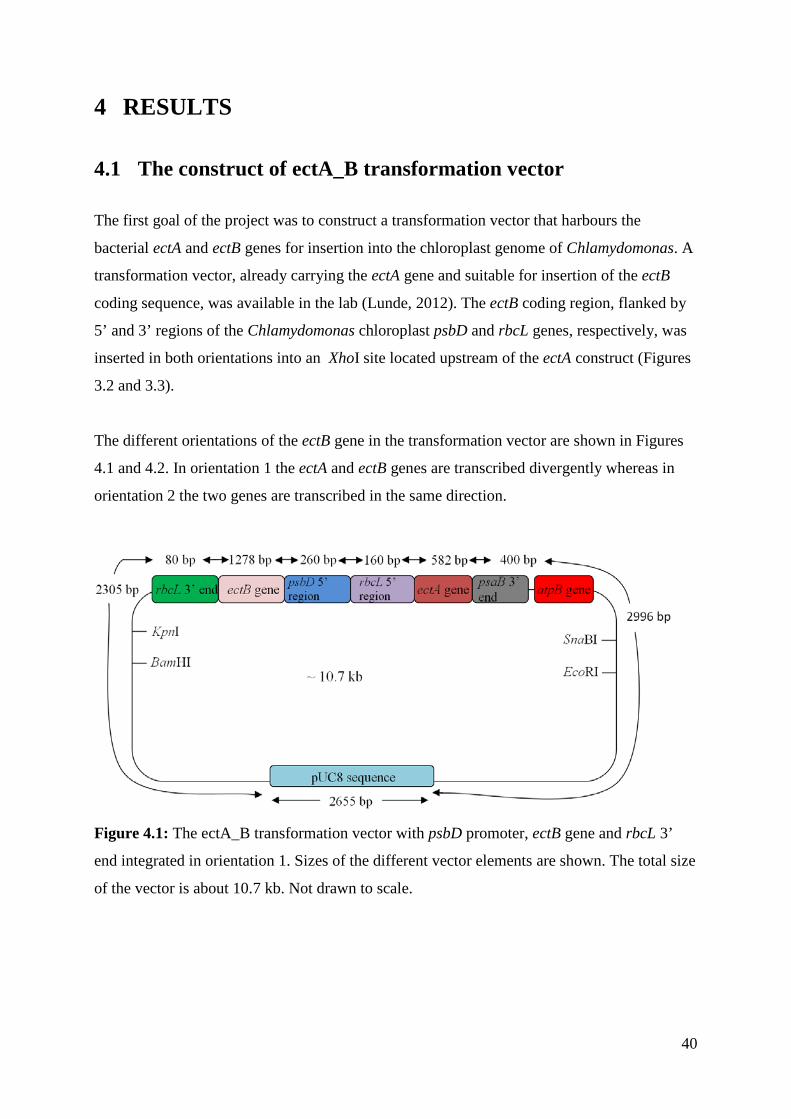
4.1 The construct of ectA_B transformation vector The first goal of the project was to construct a transformation vector that harbours the
bacterial ectA and ectB genes for insertion into the chloroplast genome of Chlamydomonas. A
transformation vector, already carrying the ectA gene and suitable for insertion of the ectB
coding sequence, was available in the lab (Lunde, 2012). The ectB coding region, flanked by
5’ and 3’ regions of the Chlamydomonas chloroplast psbD and rbcL genes, respectively, was
inserted in both orientations into an XhoI site located upstream of the ectA construct (Figures
3.2 and 3.3).
The different orientations of the ectB gene in the transformation vector are shown in Figures
4.1 and 4.2. In orientation 1 the ectA and ectB genes are transcribed divergently whereas in
orientation 2 the two genes are transcribed in the same direction.
Figure 4.1: The ectA_B transformation vector with psbD promoter, ectB gene and rbcL 3’
end integrated in orientation 1. Sizes of the different vector elements are shown. The total size
of the vector is about 10.7 kb. Not drawn to scale.
41
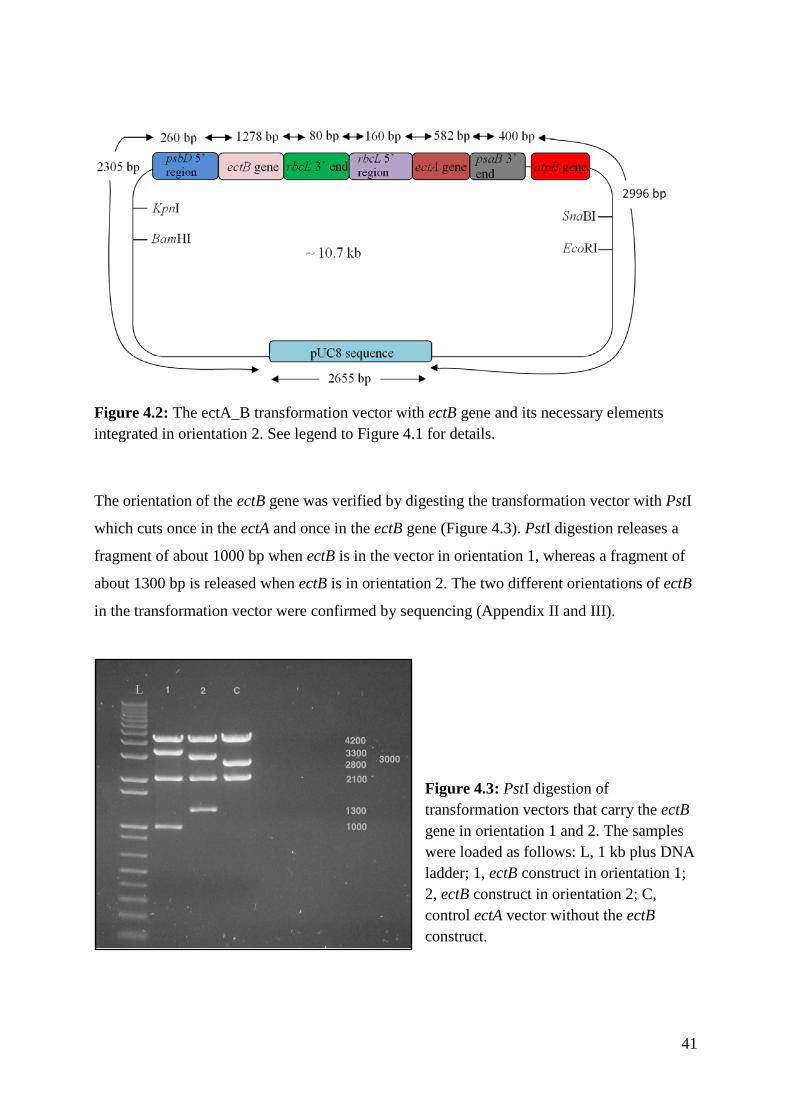
Figure 4.2: The ectA_B transformation vector with ectB gene and its necessary elements integrated in orientation 2. See legend to Figure 4.1 for details.
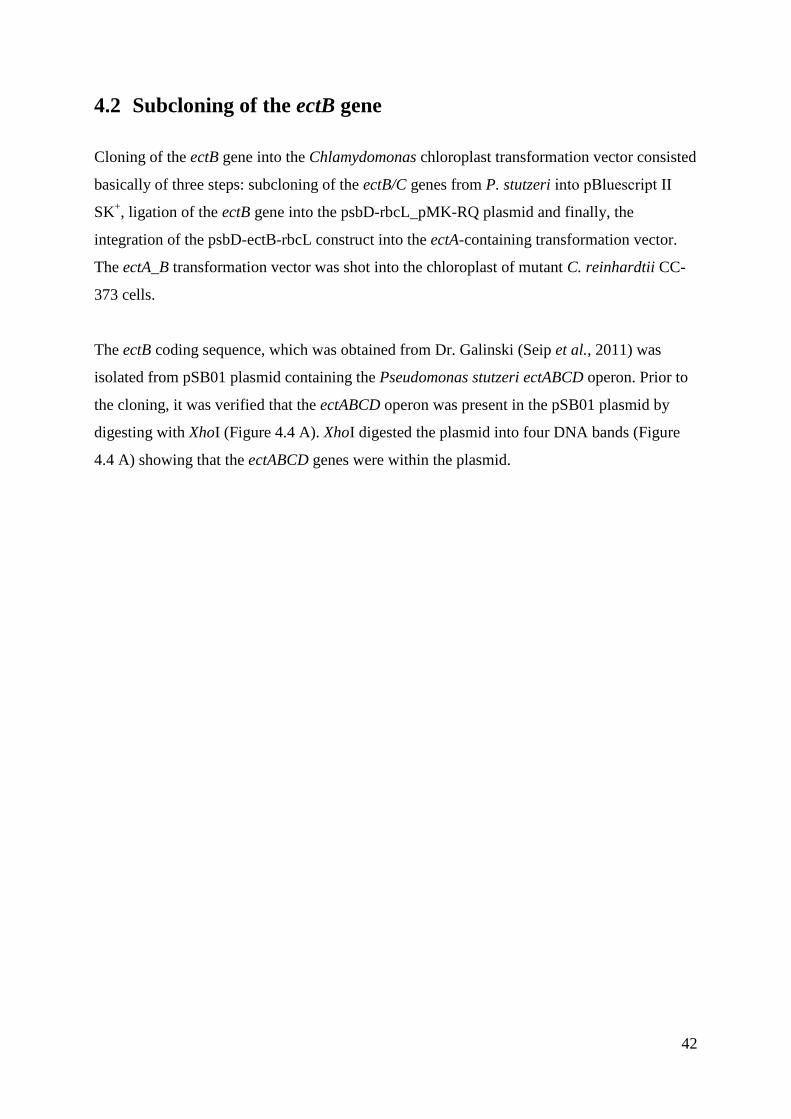
The orientation of the ectB gene was verified by digesting the transformation vector with PstI
which cuts once in the ectA and once in the ectB gene (Figure 4.3). PstI digestion releases a
fragment of about 1000 bp when ectB is in the vector in orientation 1, whereas a fragment of
about 1300 bp is released when ectB is in orientation 2. The two different orientations of ectB
in the transformation vector were confirmed by sequencing (Appendix II and III).
Figure 4.3: PstI digestion of transformation vectors that carry the ectB gene in orientation 1 and 2. The samples were loaded as follows: L, 1 kb plus DNA ladder; 1, ectB construct in orientation 1; 2, ectB construct in orientation 2; C, control ectA vector without the ectB construct.
L
42
4.2 Subcloning of the ectB gene Cloning of the ectB gene into the Chlamydomonas chloroplast transformation vector consisted
basically of three steps: subcloning of the ectB/C genes from P. stutzeri into pBluescript ΙΙ
SK+, ligation of the ectB gene into the psbD-rbcL_pMK-RQ plasmid and finally, the
integration of the psbD-ectB-rbcL construct into the ectA-containing transformation vector.
The ectA_B transformation vector was shot into the chloroplast of mutant C. reinhardtii CC-
373 cells.
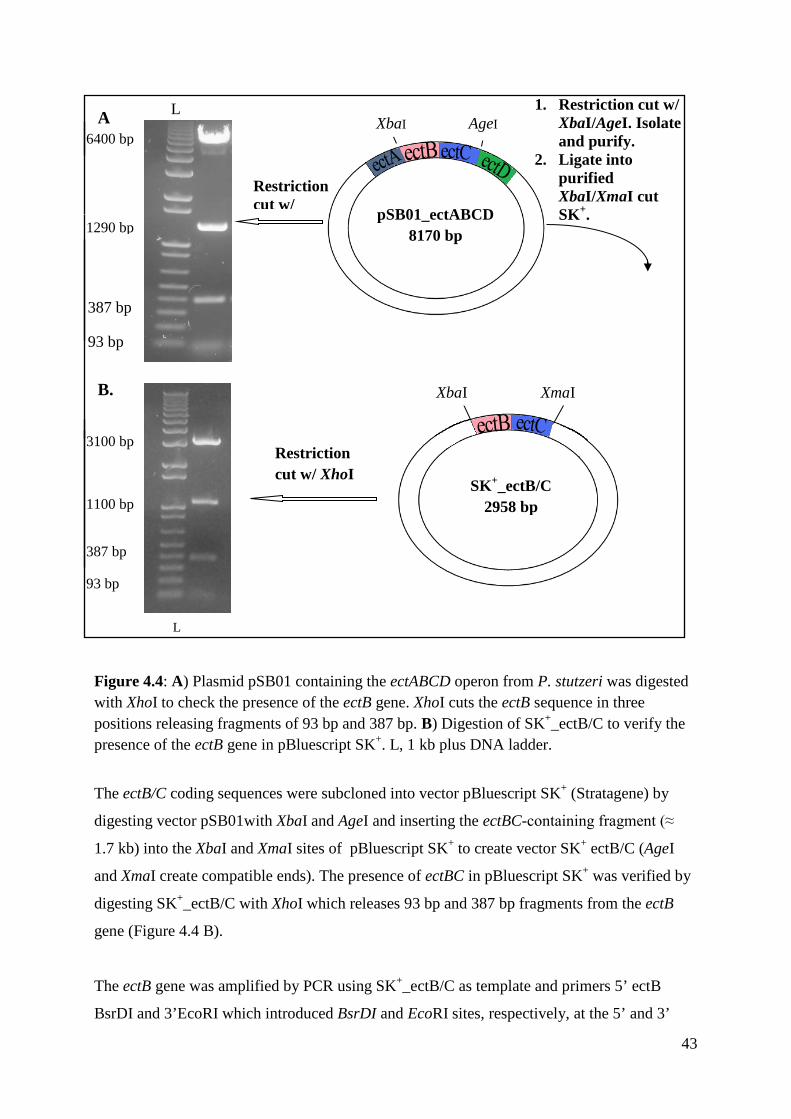
The ectB coding sequence, which was obtained from Dr. Galinski (Seip et al., 2011) was
isolated from pSB01 plasmid containing the Pseudomonas stutzeri ectABCD operon. Prior to
the cloning, it was verified that the ectABCD operon was present in the pSB01 plasmid by
digesting with XhoI (Figure 4.4 A). XhoI digested the plasmid into four DNA bands (Figure
4.4 A) showing that the ectABCD genes were within the plasmid.
43
Figure 4.4: A) Plasmid pSB01 containing the ectABCD operon from P. stutzeri was digested with XhoI to check the presence of the ectB gene. XhoI cuts the ectB sequence in three positions releasing fragments of 93 bp and 387 bp. B) Digestion of SK+_ectB/C to verify the presence of the ectB gene in pBluescript SK+. L, 1 kb plus DNA ladder.
The ectB/C coding sequences were subcloned into vector pBluescript SK+ (Stratagene) by
digesting vector pSB01with XbaI and AgeI and inserting the ectBC-containing fragment (≈
1.7 kb) into the XbaI and XmaI sites of pBluescript SK+ to create vector SK+ ectB/C (AgeI
and XmaI create compatible ends). The presence of ectBC in pBluescript SK+ was verified by
digesting SK+_ectB/C with XhoI which releases 93 bp and 387 bp fragments from the ectB
gene (Figure 4.4 B).
The ectB gene was amplified by PCR using SK+_ectB/C as template and primers 5’ ectB
BsrDI and 3’EcoRI which introduced BsrDI and EcoRI sites, respectively, at the 5’ and 3’
Restriction cut w/
1. Restriction cut w/ XbaI/AgeI. Isolate and purify.
2. Ligate into purified XbaI/XmaI cut SK+.
Restriction cut w/ XhoI
XbaI AgeI
SK+_ectB/C 2958 bp
XmaI XbaI
1290 bp
387 bp
93 bp
6400 bp
3100 bp 1100 bp 387 bp 93 bp
L
A
B.
L
pSB01_ectABCD 8170 bp
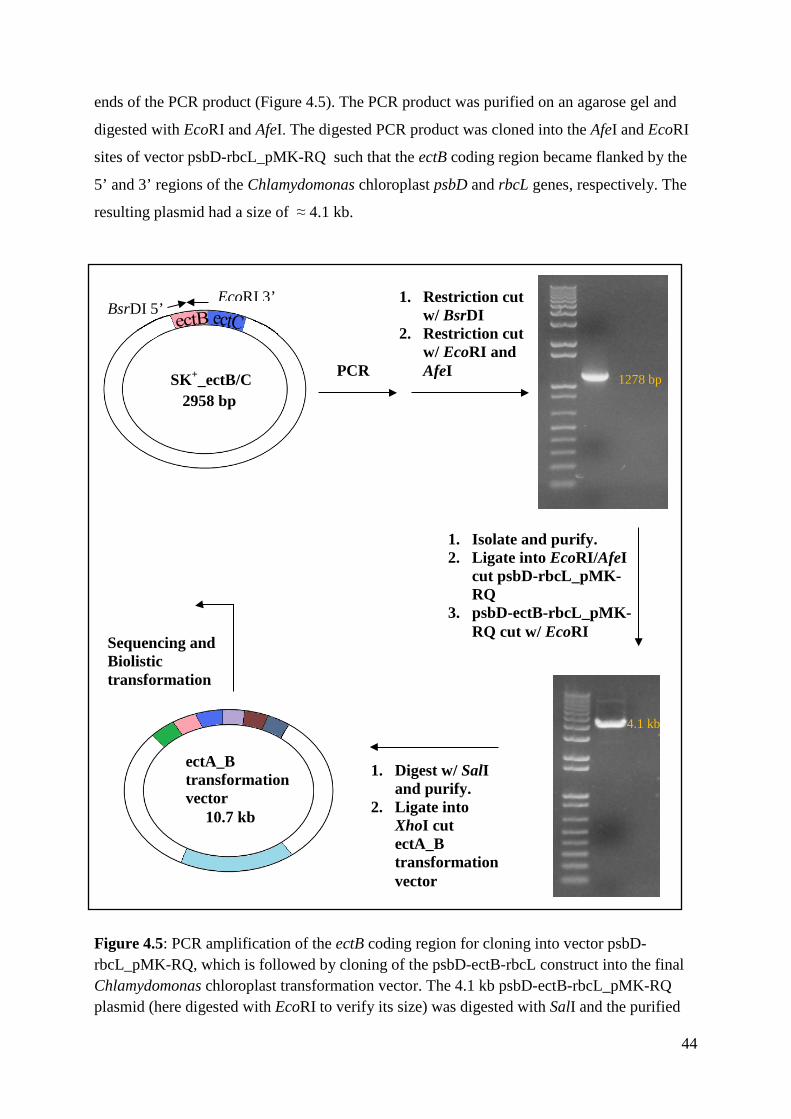
44
ends of the PCR product (Figure 4.5). The PCR product was purified on an agarose gel and
digested with EcoRΙ and AfeΙ. The digested PCR product was cloned into the AfeI and EcoRI
sites of vector psbD-rbcL_pMK-RQ such that the ectB coding region became flanked by the
5’ and 3’ regions of the Chlamydomonas chloroplast psbD and rbcL genes, respectively. The
resulting plasmid had a size of ≈ 4.1 kb.
Figure 4.5: PCR amplification of the ectB coding region for cloning into vector psbD-rbcL_pMK-RQ, which is followed by cloning of the psbD-ectB-rbcL construct into the final Chlamydomonas chloroplast transformation vector. The 4.1 kb psbD-ectB-rbcL_pMK-RQ plasmid (here digested with EcoRI to verify its size) was digested with SalI and the purified
PCR
1. Restriction cut w/ BsrDI
2. Restriction cut w/ EcoRI and AfeI
BsrDI 5’ EcoRI 3’
SK+_ectB/C 2958 bp
1278 bp
1. Isolate and purify. 2. Ligate into EcoRI/AfeI
cut psbD-rbcL_pMK-RQ
3. psbD-ectB-rbcL_pMK-RQ cut w/ EcoRI
1. Digest w/ SalI and purify.
2. Ligate into XhoI cut ectA_B transformation vector
ectA_B transformation vector 10.7 kb
Sequencing and Biolistic transformation
4.1 kb
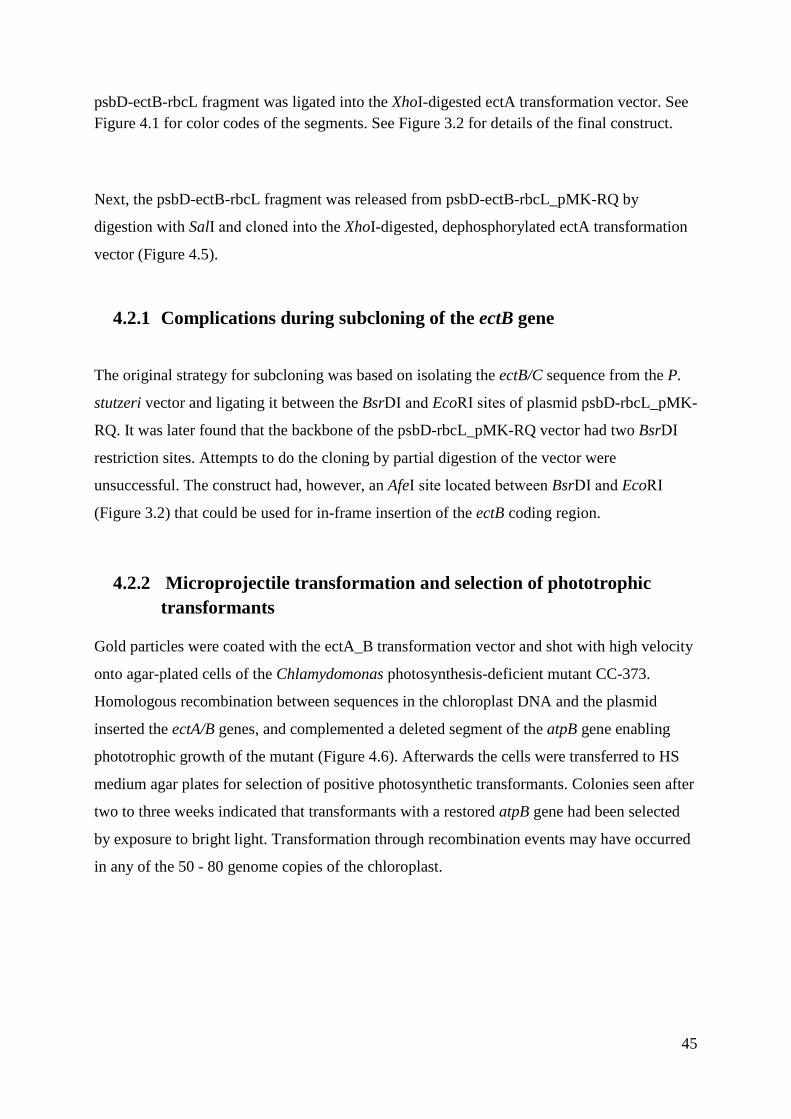
45
psbD-ectB-rbcL fragment was ligated into the XhoI-digested ectA transformation vector. See Figure 4.1 for color codes of the segments. See Figure 3.2 for details of the final construct.
Next, the psbD-ectB-rbcL fragment was released from psbD-ectB-rbcL_pMK-RQ by
digestion with SalΙ and cloned into the XhoI-digested, dephosphorylated ectA transformation
vector (Figure 4.5).
4.2.1 Complications during subcloning of the ectB gene
The original strategy for subcloning was based on isolating the ectB/C sequence from the P.
stutzeri vector and ligating it between the BsrDΙ and EcoRΙ sites of plasmid psbD-rbcL_pMK-
RQ. It was later found that the backbone of the psbD-rbcL_pMK-RQ vector had two BsrDΙ
restriction sites. Attempts to do the cloning by partial digestion of the vector were
unsuccessful. The construct had, however, an AfeΙ site located between BsrDΙ and EcoRΙ
(Figure 3.2) that could be used for in-frame insertion of the ectB coding region.
4.2.2 Microprojectile transformation and selection of phototrophic transformants
Gold particles were coated with the ectA_B transformation vector and shot with high velocity
onto agar-plated cells of the Chlamydomonas photosynthesis-deficient mutant CC-373.
Homologous recombination between sequences in the chloroplast DNA and the plasmid
inserted the ectA/B genes, and complemented a deleted segment of the atpB gene enabling
phototrophic growth of the mutant (Figure 4.6). Afterwards the cells were transferred to HS
medium agar plates for selection of positive photosynthetic transformants. Colonies seen after
two to three weeks indicated that transformants with a restored atpB gene had been selected
by exposure to bright light. Transformation through recombination events may have occurred
in any of the 50 - 80 genome copies of the chloroplast.
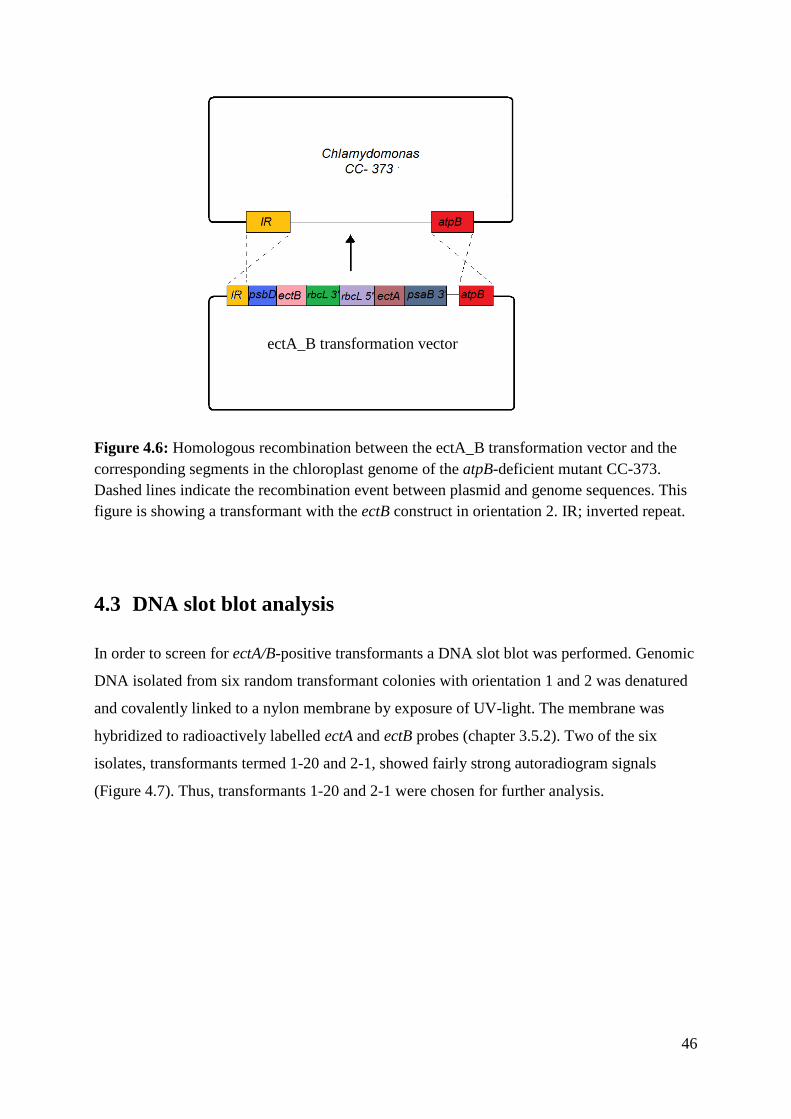
46
Figure 4.6: Homologous recombination between the ectA_B transformation vector and the corresponding segments in the chloroplast genome of the atpB-deficient mutant CC-373. Dashed lines indicate the recombination event between plasmid and genome sequences. This figure is showing a transformant with the ectB construct in orientation 2. IR; inverted repeat.
4.3 DNA slot blot analysis
In order to screen for ectA/B-positive transformants a DNA slot blot was performed. Genomic
DNA isolated from six random transformant colonies with orientation 1 and 2 was denatured
and covalently linked to a nylon membrane by exposure of UV-light. The membrane was
hybridized to radioactively labelled ectA and ectB probes (chapter 3.5.2). Two of the six
isolates, transformants termed 1-20 and 2-1, showed fairly strong autoradiogram signals
(Figure 4.7). Thus, transformants 1-20 and 2-1 were chosen for further analysis.
ectA_B transformation vector
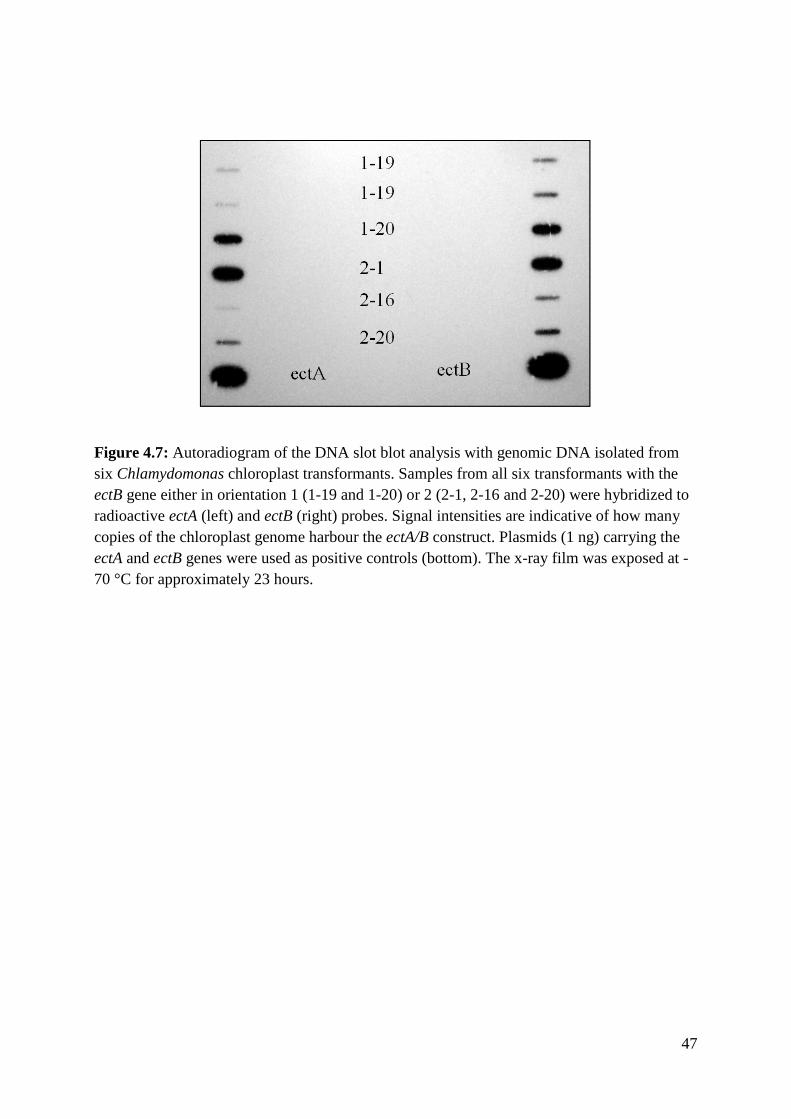
47
Figure 4.7: Autoradiogram of the DNA slot blot analysis with genomic DNA isolated from six Chlamydomonas chloroplast transformants. Samples from all six transformants with the ectB gene either in orientation 1 (1-19 and 1-20) or 2 (2-1, 2-16 and 2-20) were hybridized to radioactive ectA (left) and ectB (right) probes. Signal intensities are indicative of how many copies of the chloroplast genome harbour the ectA/B construct. Plasmids (1 ng) carrying the ectA and ectB genes were used as positive controls (bottom). The x-ray film was exposed at -70 °C for approximately 23 hours.
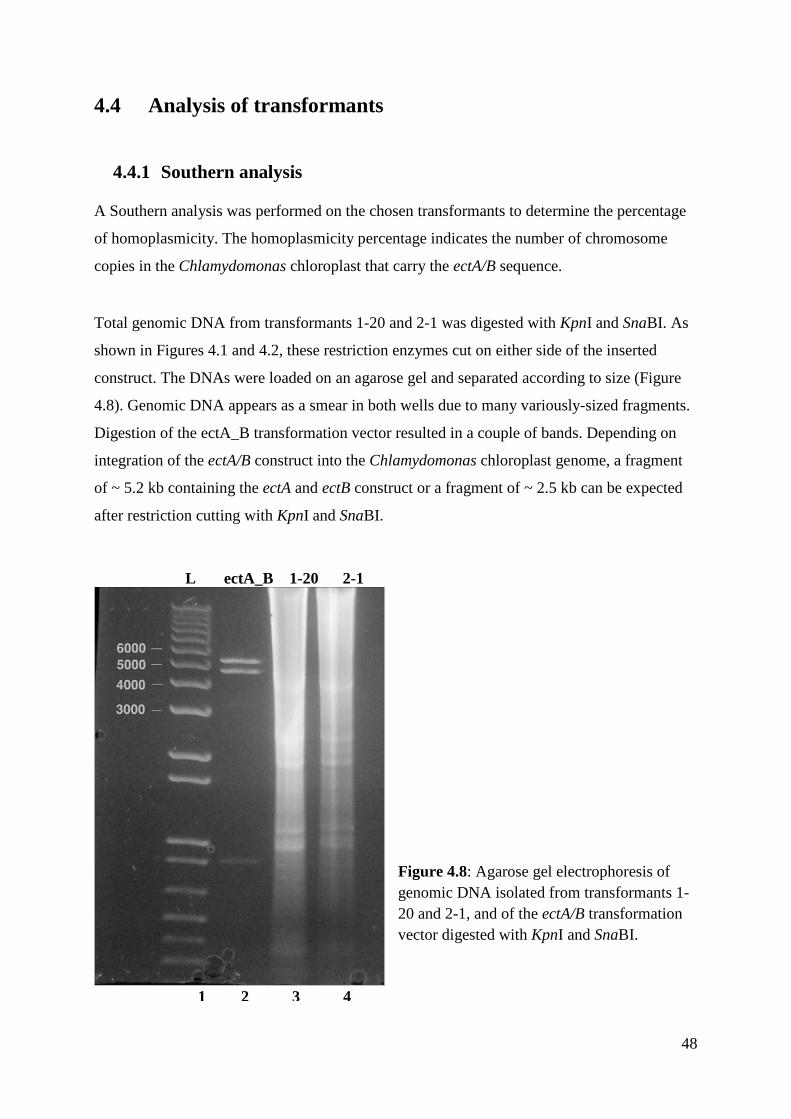
48
4.4 Analysis of transformants
4.4.1 Southern analysis
A Southern analysis was performed on the chosen transformants to determine the percentage
of homoplasmicity. The homoplasmicity percentage indicates the number of chromosome
copies in the Chlamydomonas chloroplast that carry the ectA/B sequence.
Total genomic DNA from transformants 1-20 and 2-1 was digested with KpnI and SnaBI. As
shown in Figures 4.1 and 4.2, these restriction enzymes cut on either side of the inserted
construct. The DNAs were loaded on an agarose gel and separated according to size (Figure
4.8). Genomic DNA appears as a smear in both wells due to many variously-sized fragments.
Digestion of the ectA_B transformation vector resulted in a couple of bands. Depending on
integration of the ectA/B construct into the Chlamydomonas chloroplast genome, a fragment
of ~ 5.2 kb containing the ectA and ectB construct or a fragment of ~ 2.5 kb can be expected
after restriction cutting with KpnI and SnaBI.
Figure 4.8: Agarose gel electrophoresis of genomic DNA isolated from transformants 1-20 and 2-1, and of the ectA/B transformation vector digested with KpnI and SnaBI.
1 2 3 4
L ectA_B 1-20 2-1
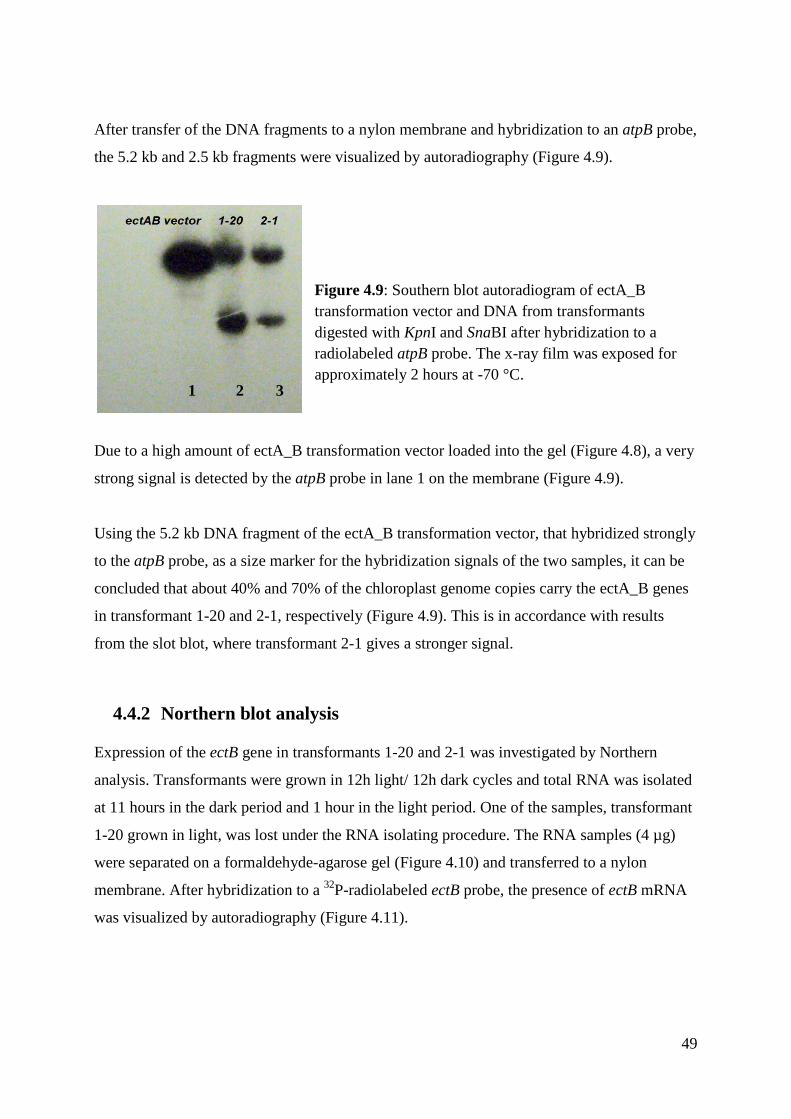
49
After transfer of the DNA fragments to a nylon membrane and hybridization to an atpB probe,
the 5.2 kb and 2.5 kb fragments were visualized by autoradiography (Figure 4.9).
Figure 4.9: Southern blot autoradiogram of ectA_B transformation vector and DNA from transformants digested with KpnI and SnaBI after hybridization to a radiolabeled atpB probe. The x-ray film was exposed for approximately 2 hours at -70 °C.
Due to a high amount of ectA_B transformation vector loaded into the gel (Figure 4.8), a very
strong signal is detected by the atpB probe in lane 1 on the membrane (Figure 4.9).
Using the 5.2 kb DNA fragment of the ectA_B transformation vector, that hybridized strongly
to the atpB probe, as a size marker for the hybridization signals of the two samples, it can be
concluded that about 40% and 70% of the chloroplast genome copies carry the ectA_B genes
in transformant 1-20 and 2-1, respectively (Figure 4.9). This is in accordance with results
from the slot blot, where transformant 2-1 gives a stronger signal.
4.4.2 Northern blot analysis
Expression of the ectB gene in transformants 1-20 and 2-1 was investigated by Northern
analysis. Transformants were grown in 12h light/ 12h dark cycles and total RNA was isolated
at 11 hours in the dark period and 1 hour in the light period. One of the samples, transformant
1-20 grown in light, was lost under the RNA isolating procedure. The RNA samples (4 µg)
were separated on a formaldehyde-agarose gel (Figure 4.10) and transferred to a nylon
membrane. After hybridization to a 32P-radiolabeled ectB probe, the presence of ectB mRNA
was visualized by autoradiography (Figure 4.11).
1 2 3
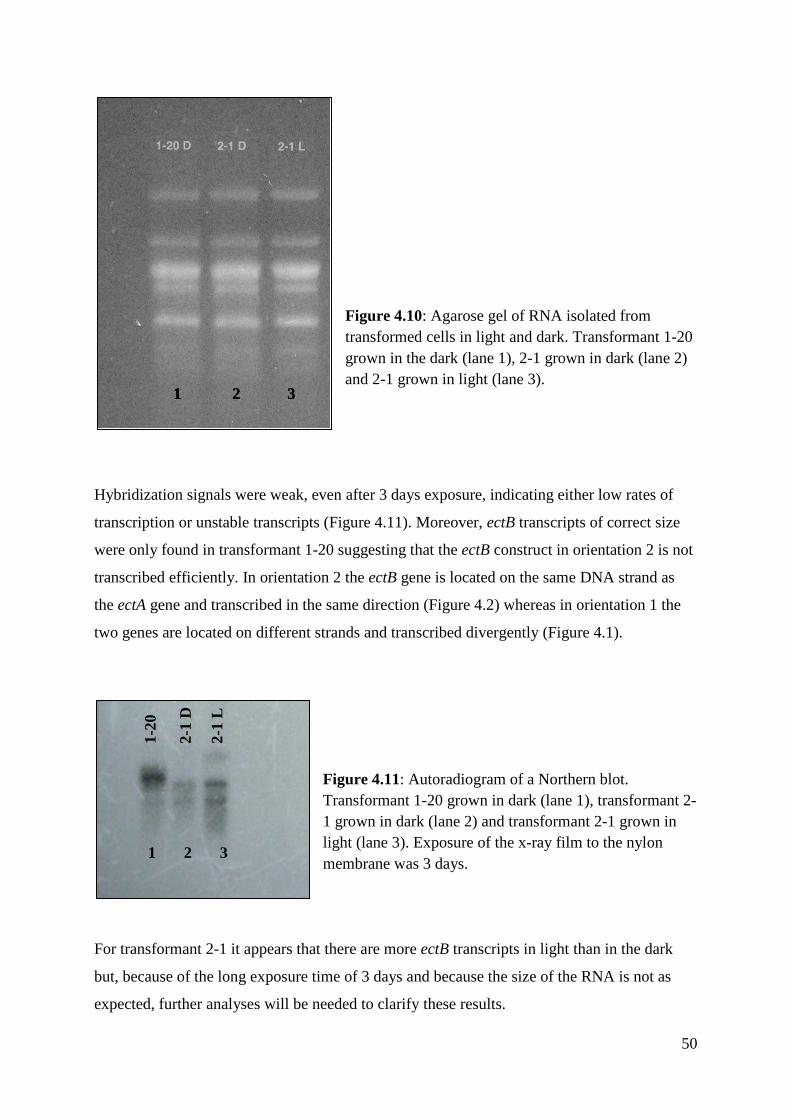
50
Figure 4.10: Agarose gel of RNA isolated from transformed cells in light and dark. Transformant 1-20 grown in the dark (lane 1), 2-1 grown in dark (lane 2) and 2-1 grown in light (lane 3).
Hybridization signals were weak, even after 3 days exposure, indicating either low rates of
transcription or unstable transcripts (Figure 4.11). Moreover, ectB transcripts of correct size
were only found in transformant 1-20 suggesting that the ectB construct in orientation 2 is not
transcribed efficiently. In orientation 2 the ectB gene is located on the same DNA strand as
the ectA gene and transcribed in the same direction (Figure 4.2) whereas in orientation 1 the
two genes are located on different strands and transcribed divergently (Figure 4.1).
Figure 4.11: Autoradiogram of a Northern blot. Transformant 1-20 grown in dark (lane 1), transformant 2-1 grown in dark (lane 2) and transformant 2-1 grown in light (lane 3). Exposure of the x-ray film to the nylon membrane was 3 days.
For transformant 2-1 it appears that there are more ectB transcripts in light than in the dark
but, because of the long exposure time of 3 days and because the size of the RNA is not as
expected, further analyses will be needed to clarify these results.
1 2 3
1-20
2-1
D
2-1
L
1 2 3
1 2 3
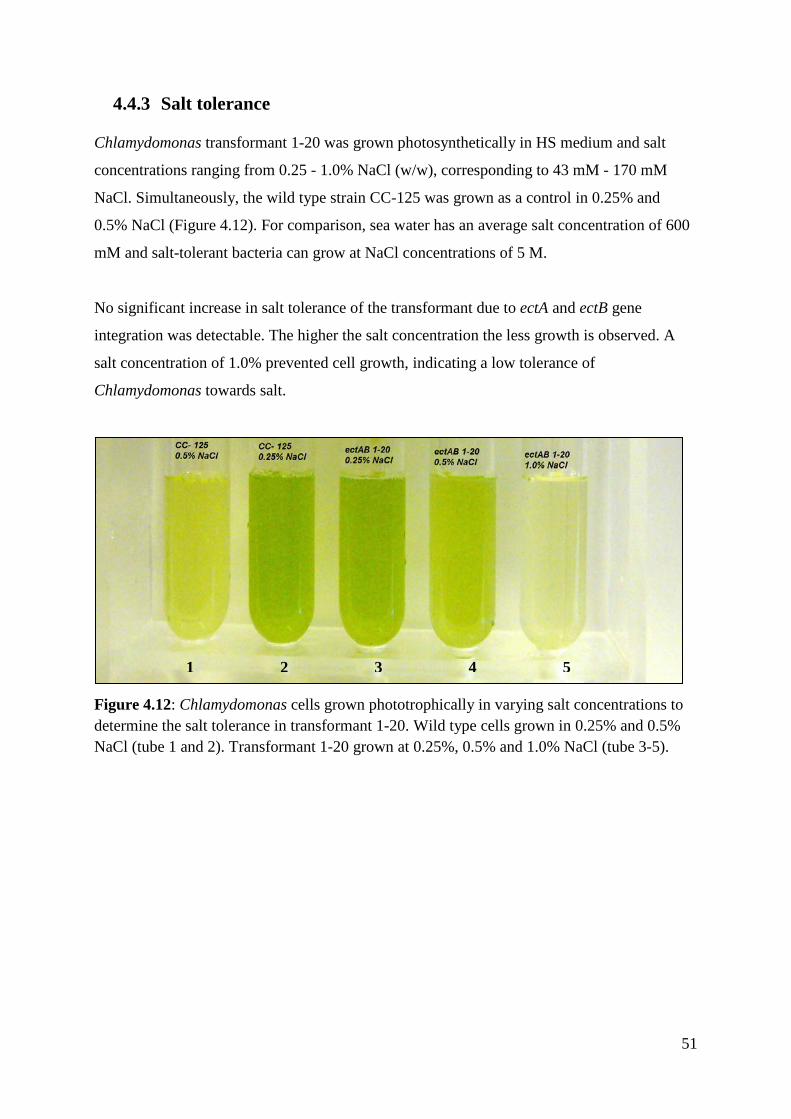
51
4.4.3 Salt tolerance
Chlamydomonas transformant 1-20 was grown photosynthetically in HS medium and salt
concentrations ranging from 0.25 - 1.0% NaCl (w/w), corresponding to 43 mM - 170 mM
NaCl. Simultaneously, the wild type strain CC-125 was grown as a control in 0.25% and
0.5% NaCl (Figure 4.12). For comparison, sea water has an average salt concentration of 600
mM and salt-tolerant bacteria can grow at NaCl concentrations of 5 M.
No significant increase in salt tolerance of the transformant due to ectA and ectB gene
integration was detectable. The higher the salt concentration the less growth is observed. A
salt concentration of 1.0% prevented cell growth, indicating a low tolerance of
Chlamydomonas towards salt.
Figure 4.12: Chlamydomonas cells grown phototrophically in varying salt concentrations to determine the salt tolerance in transformant 1-20. Wild type cells grown in 0.25% and 0.5% NaCl (tube 1 and 2). Transformant 1-20 grown at 0.25%, 0.5% and 1.0% NaCl (tube 3-5).
1 2 3 4 5
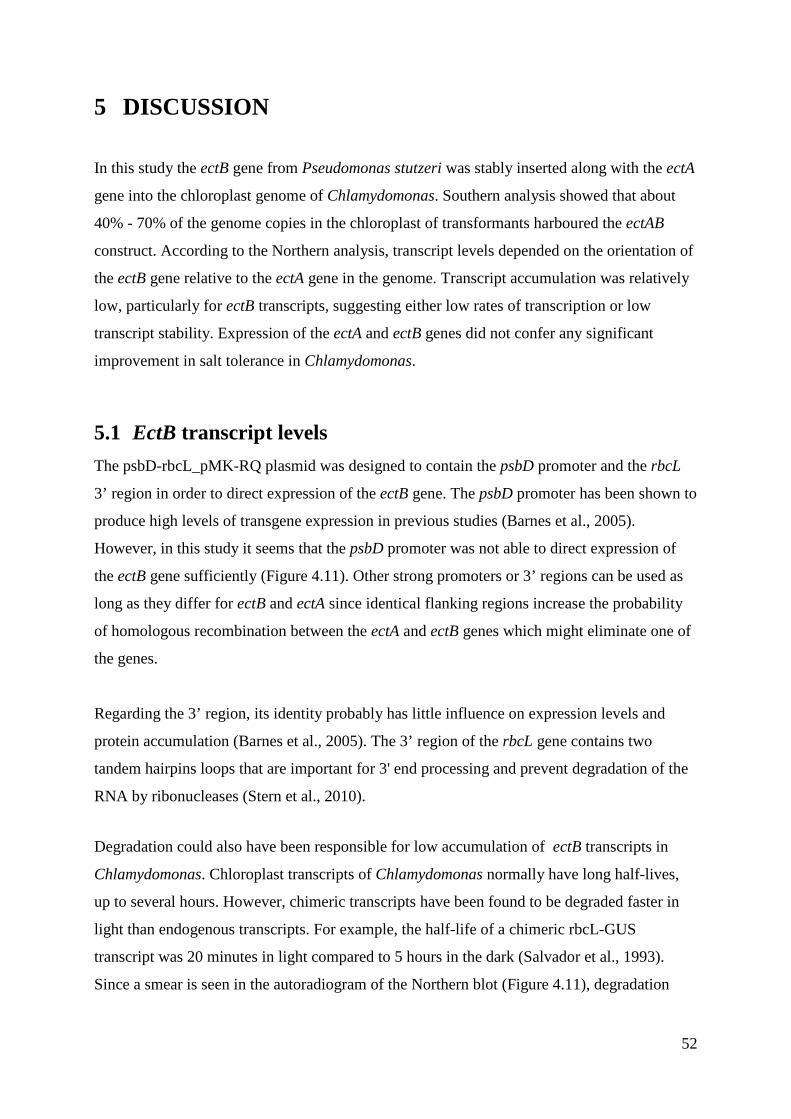
52
5 DISCUSSION
In this study the ectB gene from Pseudomonas stutzeri was stably inserted along with the ectA
gene into the chloroplast genome of Chlamydomonas. Southern analysis showed that about
40% - 70% of the genome copies in the chloroplast of transformants harboured the ectAB
construct. According to the Northern analysis, transcript levels depended on the orientation of
the ectB gene relative to the ectA gene in the genome. Transcript accumulation was relatively
low, particularly for ectB transcripts, suggesting either low rates of transcription or low
transcript stability. Expression of the ectA and ectB genes did not confer any significant
improvement in salt tolerance in Chlamydomonas.
5.1 EctB transcript levels The psbD-rbcL_pMK-RQ plasmid was designed to contain the psbD promoter and the rbcL
3’ region in order to direct expression of the ectB gene. The psbD promoter has been shown to
produce high levels of transgene expression in previous studies (Barnes et al., 2005).
However, in this study it seems that the psbD promoter was not able to direct expression of
the ectB gene sufficiently (Figure 4.11). Other strong promoters or 3’ regions can be used as
long as they differ for ectB and ectA since identical flanking regions increase the probability
of homologous recombination between the ectA and ectB genes which might eliminate one of
the genes.
Regarding the 3’ region, its identity probably has little influence on expression levels and
protein accumulation (Barnes et al., 2005). The 3’ region of the rbcL gene contains two
tandem hairpins loops that are important for 3' end processing and prevent degradation of the
RNA by ribonucleases (Stern et al., 2010).
Degradation could also have been responsible for low accumulation of ectB transcripts in
Chlamydomonas. Chloroplast transcripts of Chlamydomonas normally have long half-lives,
up to several hours. However, chimeric transcripts have been found to be degraded faster in
light than endogenous transcripts. For example, the half-life of a chimeric rbcL-GUS
transcript was 20 minutes in light compared to 5 hours in the dark (Salvador et al., 1993).
Since a smear is seen in the autoradiogram of the Northern blot (Figure 4.11), degradation
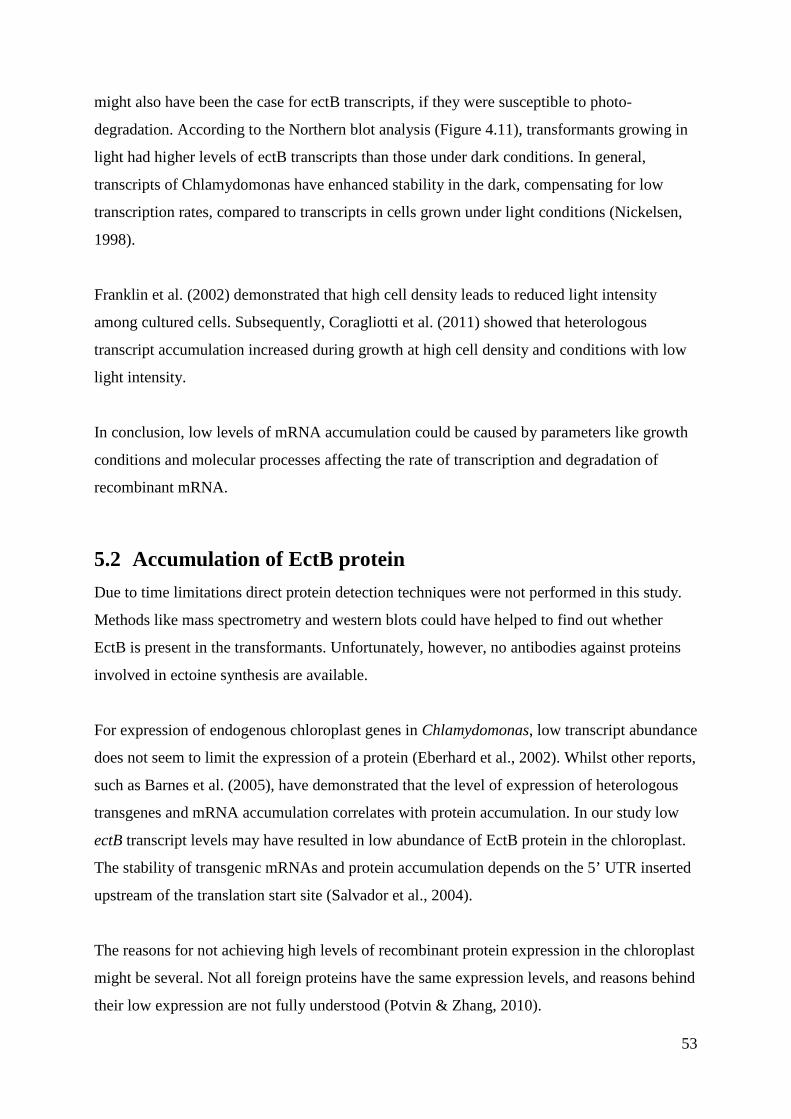
53
might also have been the case for ectB transcripts, if they were susceptible to photo-
degradation. According to the Northern blot analysis (Figure 4.11), transformants growing in
light had higher levels of ectB transcripts than those under dark conditions. In general,
transcripts of Chlamydomonas have enhanced stability in the dark, compensating for low
transcription rates, compared to transcripts in cells grown under light conditions (Nickelsen,
1998).
Franklin et al. (2002) demonstrated that high cell density leads to reduced light intensity
among cultured cells. Subsequently, Coragliotti et al. (2011) showed that heterologous
transcript accumulation increased during growth at high cell density and conditions with low
light intensity.
In conclusion, low levels of mRNA accumulation could be caused by parameters like growth
conditions and molecular processes affecting the rate of transcription and degradation of
recombinant mRNA.
5.2 Accumulation of EctB protein Due to time limitations direct protein detection techniques were not performed in this study.
Methods like mass spectrometry and western blots could have helped to find out whether
EctB is present in the transformants. Unfortunately, however, no antibodies against proteins
involved in ectoine synthesis are available.
For expression of endogenous chloroplast genes in Chlamydomonas, low transcript abundance
does not seem to limit the expression of a protein (Eberhard et al., 2002). Whilst other reports,
such as Barnes et al. (2005), have demonstrated that the level of expression of heterologous
transgenes and mRNA accumulation correlates with protein accumulation. In our study low
ectB transcript levels may have resulted in low abundance of EctB protein in the chloroplast.
The stability of transgenic mRNAs and protein accumulation depends on the 5’ UTR inserted
upstream of the translation start site (Salvador et al., 2004).
The reasons for not achieving high levels of recombinant protein expression in the chloroplast
might be several. Not all foreign proteins have the same expression levels, and reasons behind
their low expression are not fully understood (Potvin & Zhang, 2010).
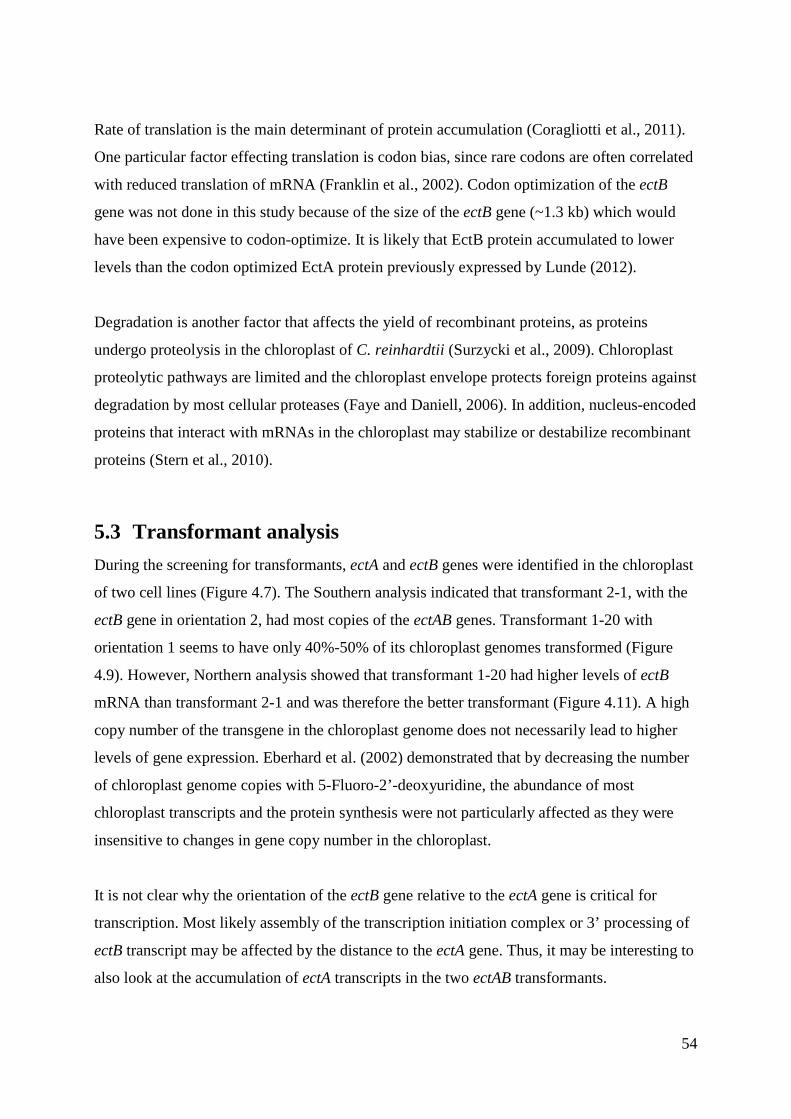
54
Rate of translation is the main determinant of protein accumulation (Coragliotti et al., 2011).
One particular factor effecting translation is codon bias, since rare codons are often correlated
with reduced translation of mRNA (Franklin et al., 2002). Codon optimization of the ectB
gene was not done in this study because of the size of the ectB gene (~1.3 kb) which would
have been expensive to codon-optimize. It is likely that EctB protein accumulated to lower
levels than the codon optimized EctA protein previously expressed by Lunde (2012).
Degradation is another factor that affects the yield of recombinant proteins, as proteins
undergo proteolysis in the chloroplast of C. reinhardtii (Surzycki et al., 2009). Chloroplast
proteolytic pathways are limited and the chloroplast envelope protects foreign proteins against
degradation by most cellular proteases (Faye and Daniell, 2006). In addition, nucleus-encoded
proteins that interact with mRNAs in the chloroplast may stabilize or destabilize recombinant
proteins (Stern et al., 2010).
5.3 Transformant analysis During the screening for transformants, ectA and ectB genes were identified in the chloroplast
of two cell lines (Figure 4.7). The Southern analysis indicated that transformant 2-1, with the
ectB gene in orientation 2, had most copies of the ectAB genes. Transformant 1-20 with
orientation 1 seems to have only 40%-50% of its chloroplast genomes transformed (Figure
4.9). However, Northern analysis showed that transformant 1-20 had higher levels of ectB
mRNA than transformant 2-1 and was therefore the better transformant (Figure 4.11). A high
copy number of the transgene in the chloroplast genome does not necessarily lead to higher
levels of gene expression. Eberhard et al. (2002) demonstrated that by decreasing the number
of chloroplast genome copies with 5-Fluoro-2’-deoxyuridine, the abundance of most
chloroplast transcripts and the protein synthesis were not particularly affected as they were
insensitive to changes in gene copy number in the chloroplast.
It is not clear why the orientation of the ectB gene relative to the ectA gene is critical for
transcription. Most likely assembly of the transcription initiation complex or 3’ processing of
ectB transcript may be affected by the distance to the ectA gene. Thus, it may be interesting to
also look at the accumulation of ectA transcripts in the two ectAB transformants.
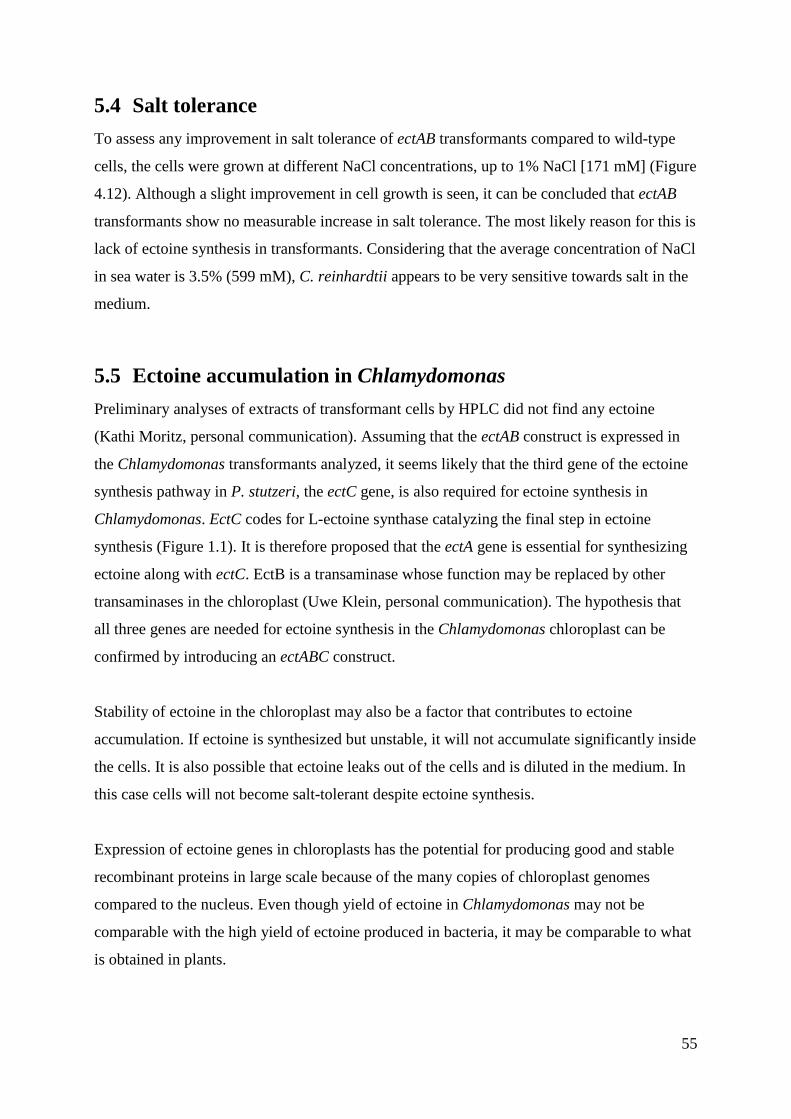
55
5.4 Salt tolerance To assess any improvement in salt tolerance of ectAB transformants compared to wild-type
cells, the cells were grown at different NaCl concentrations, up to 1% NaCl [171 mM] (Figure
4.12). Although a slight improvement in cell growth is seen, it can be concluded that ectAB
transformants show no measurable increase in salt tolerance. The most likely reason for this is
lack of ectoine synthesis in transformants. Considering that the average concentration of NaCl
in sea water is 3.5% (599 mM), C. reinhardtii appears to be very sensitive towards salt in the
medium.
5.5 Ectoine accumulation in Chlamydomonas Preliminary analyses of extracts of transformant cells by HPLC did not find any ectoine
(Kathi Moritz, personal communication). Assuming that the ectAB construct is expressed in
the Chlamydomonas transformants analyzed, it seems likely that the third gene of the ectoine
synthesis pathway in P. stutzeri, the ectC gene, is also required for ectoine synthesis in
Chlamydomonas. EctC codes for L-ectoine synthase catalyzing the final step in ectoine
synthesis (Figure 1.1). It is therefore proposed that the ectA gene is essential for synthesizing
ectoine along with ectC. EctB is a transaminase whose function may be replaced by other
transaminases in the chloroplast (Uwe Klein, personal communication). The hypothesis that
all three genes are needed for ectoine synthesis in the Chlamydomonas chloroplast can be
confirmed by introducing an ectABC construct.
Stability of ectoine in the chloroplast may also be a factor that contributes to ectoine
accumulation. If ectoine is synthesized but unstable, it will not accumulate significantly inside
the cells. It is also possible that ectoine leaks out of the cells and is diluted in the medium. In
this case cells will not become salt-tolerant despite ectoine synthesis.
Expression of ectoine genes in chloroplasts has the potential for producing good and stable
recombinant proteins in large scale because of the many copies of chloroplast genomes
compared to the nucleus. Even though yield of ectoine in Chlamydomonas may not be
comparable with the high yield of ectoine produced in bacteria, it may be comparable to what
is obtained in plants.
56
6 CONCLUSION The ectB gene was successfully cloned into the chloroplast genome of Chlamydomonas
reinhardtii in two different orientations. Low levels of ectB transcripts were observed in the
Chlamydomonas cells. Ectoine did not accumulate in the Chlamydomonas cells, nor was any
salt tolerance observed. This was supposedly due to non-optimized ectA and ectB genes and
the absence of the ectC gene from the construct.
57
7 FUTURE PROSPECTS The results of this study show that expression of the ectA and ectB genes from P. stutzeri is
not sufficient for measurable ectoine synthesis in the Chlamydomonas chloroplast. A number
of measures could be taken to improve ectoine synthesis and accumulation.
Obviously, what should be done first is to introduce the ectC gene in addition to the ectAB
genes. This should result in at least detectable amounts of ectoine, unless other factors
interfere, e.g. instability of transcripts.
In addition, it might be possible to enhance transcription and translation of the bacterial genes
in Chlamydomonas. Different promoter regions may be used in the gene constructs, e.g. the
psbA promoter that has been shown to direct high rates of transcription of foreign genes in
other studies (Surzycki et al., 2009). Translation could be enhanced by optimization of codons
in the ectABC genes. Codon usage is quite different in P. stutzeri and the Chlamydomonas
chloroplast, with some of the bacterial codons used very seldom in Chlamydomonas. Finally,
additional rounds of screening of transformants might help to find cell lines that harbour the
foreign genes in all copies of the chloroplast genome, thus accumulating more transcripts and,
perhaps, EctABC proteins.
Analysis of expression of the ectABC genes in Chlamydomonas would benefit from
antibodies against the gene products. The presence and amount of the EctABC proteins could
be determined and correlated with ectoine concentrations.
Using fusion proteins as a platform for producing recombinant proteins may also be worth
trying, not only does the protein yield in some cases increase significantly but the protein can
possibly be traceable. Muto et al. (2009) fused the luciferase protein with endogenous ribulose
bisphosphate carboxylase (RbcL) and increased accumulation of recombinant luciferase
protein.
In the salt tolerance experiment the ionic effects of NaCl may inhibit growth and result in cell
death. To address the problem, sugar alcohols like mannitol or sorbitol may be used as they
do not have an ionic effect. Studies have shown that these sugars are better than NaCl, as
58
NaCl makes the cells clump together and coagulate in the medium (Uwe Klein, personal
communication).
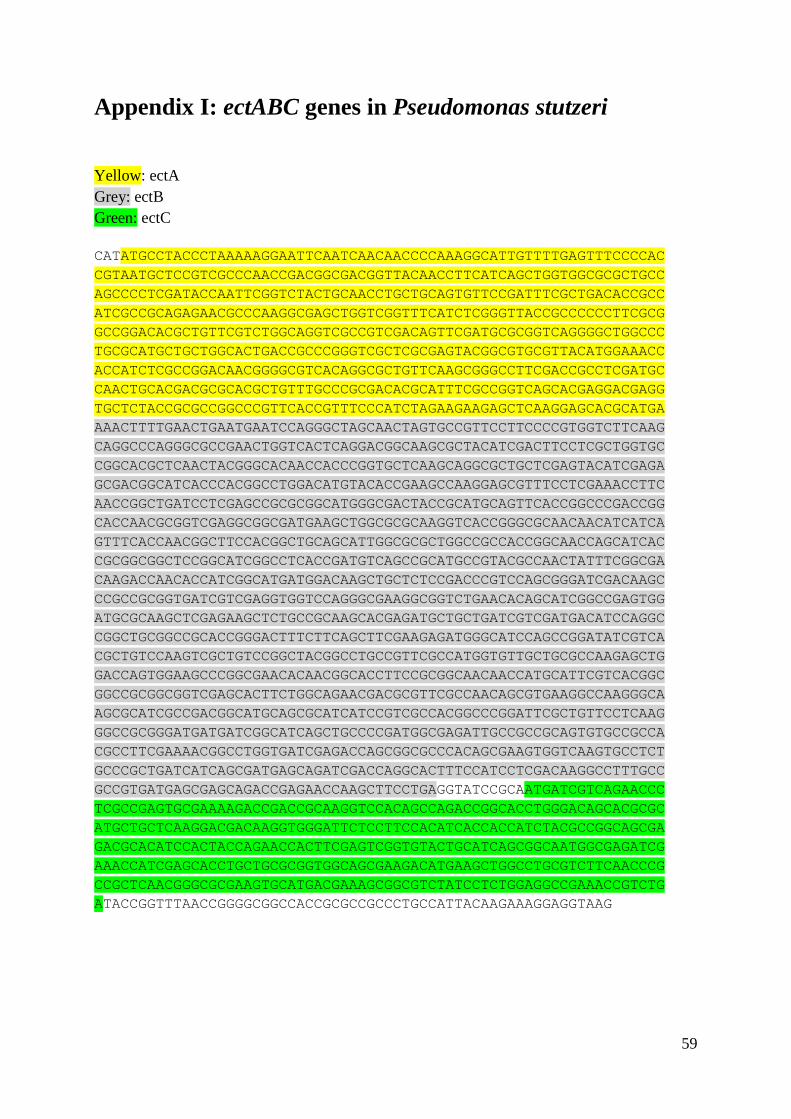
59
Appendix I: ectABC genes in Pseudomonas stutzeri Yellow: ectA Grey: ectB Green: ectC CATATGCCTACCCTAAAAAGGAATTCAATCAACAACCCCAAAGGCATTGTTTTGAGTTTCCCCACCGTAATGCTCCGTCGCCCAACCGACGGCGACGGTTACAACCTTCATCAGCTGGTGGCGCGCTGCCAGCCCCTCGATACCAATTCGGTCTACTGCAACCTGCTGCAGTGTTCCGATTTCGCTGACACCGCCATCGCCGCAGAGAACGCCCAAGGCGAGCTGGTCGGTTTCATCTCGGGTTACCGCCCCCCTTCGCGGCCGGACACGCTGTTCGTCTGGCAGGTCGCCGTCGACAGTTCGATGCGCGGTCAGGGGCTGGCCCTGCGCATGCTGCTGGCACTGACCGCCCGGGTCGCTCGCGAGTACGGCGTGCGTTACATGGAAACCACCATCTCGCCGGACAACGGGGCGTCACAGGCGCTGTTCAAGCGGGCCTTCGACCGCCTCGATGCCAACTGCACGACGCGCACGCTGTTTGCCCGCGACACGCATTTCGCCGGTCAGCACGAGGACGAGGTGCTCTACCGCGCCGGCCCGTTCACCGTTTCCCATCTAGAAGAAGAGCTCAAGGAGCACGCATGAAAACTTTTGAACTGAATGAATCCAGGGCTAGCAACTAGTGCCGTTCCTTCCCCGTGGTCTTCAAGCAGGCCCAGGGCGCCGAACTGGTCACTCAGGACGGCAAGCGCTACATCGACTTCCTCGCTGGTGCCGGCACGCTCAACTACGGGCACAACCACCCGGTGCTCAAGCAGGCGCTGCTCGAGTACATCGAGAGCGACGGCATCACCCACGGCCTGGACATGTACACCGAAGCCAAGGAGCGTTTCCTCGAAACCTTCAACCGGCTGATCCTCGAGCCGCGCGGCATGGGCGACTACCGCATGCAGTTCACCGGCCCGACCGGCACCAACGCGGTCGAGGCGGCGATGAAGCTGGCGCGCAAGGTCACCGGGCGCAACAACATCATCAGTTTCACCAACGGCTTCCACGGCTGCAGCATTGGCGCGCTGGCCGCCACCGGCAACCAGCATCACCGCGGCGGCTCCGGCATCGGCCTCACCGATGTCAGCCGCATGCCGTACGCCAACTATTTCGGCGACAAGACCAACACCATCGGCATGATGGACAAGCTGCTCTCCGACCCGTCCAGCGGGATCGACAAGCCCGCCGCGGTGATCGTCGAGGTGGTCCAGGGCGAAGGCGGTCTGAACACAGCATCGGCCGAGTGGATGCGCAAGCTCGAGAAGCTCTGCCGCAAGCACGAGATGCTGCTGATCGTCGATGACATCCAGGCCGGCTGCGGCCGCACCGGGACTTTCTTCAGCTTCGAAGAGATGGGCATCCAGCCGGATATCGTCACGCTGTCCAAGTCGCTGTCCGGCTACGGCCTGCCGTTCGCCATGGTGTTGCTGCGCCAAGAGCTGGACCAGTGGAAGCCCGGCGAACACAACGGCACCTTCCGCGGCAACAACCATGCATTCGTCACGGCGGCCGCGGCGGTCGAGCACTTCTGGCAGAACGACGCGTTCGCCAACAGCGTGAAGGCCAAGGGCAAGCGCATCGCCGACGGCATGCAGCGCATCATCCGTCGCCACGGCCCGGATTCGCTGTTCCTCAAGGGCCGCGGGATGATGATCGGCATCAGCTGCCCCGATGGCGAGATTGCCGCCGCAGTGTGCCGCCACGCCTTCGAAAACGGCCTGGTGATCGAGACCAGCGGCGCCCACAGCGAAGTGGTCAAGTGCCTCTGCCCGCTGATCATCAGCGATGAGCAGATCGACCAGGCACTTTCCATCCTCGACAAGGCCTTTGCCGCCGTGATGAGCGAGCAGACCGAGAACCAAGCTTCCTGAGGTATCCGCAATGATCGTCAGAACCCTCGCCGAGTGCGAAAAGACCGACCGCAAGGTCCACAGCCAGACCGGCACCTGGGACAGCACGCGCATGCTGCTCAAGGACGACAAGGTGGGATTCTCCTTCCACATCACCACCATCTACGCCGGCAGCGAGACGCACATCCACTACCAGAACCACTTCGAGTCGGTGTACTGCATCAGCGGCAATGGCGAGATCGAAACCATCGAGCACCTGCTGCGCGGTGGCAGCGAAGACATGAAGCTGGCCTGCGTCTTCAACCCGCCGCTCAACGGGCGCGAAGTGCATGACGAAAGCGGCGTCTATCCTCTGGAGGCCGAAACCGTCTGATACCGGTTTAACCGGGGCGGCCACCGCGCCGCCCTGCCATTACAAGAAAGGAGGTAAG
60
Appendix II: Sequencing result of insert with orientation 1 in the transformation vector
Green: rbcL 3’ Violet: ectB Yellow: psbD 5’ Turquoise blue: rbcL 5’ Brown: ectA Blue: psbA AATTCTTTTTATTTTTCATGATGTTTATGTGAATAGCATAAACATCGTTTTTATTTTTATGGTGTTTAGGTTAAATACCTAAAGTCGACATGAAAACTTTTGAACTGAATGAATCCAGGGTTCGCAGCTACTGCCGTTCCTTCCCCGTGGTCTTCAAGCAGGCCCAGGGCGCCGAACTGGTCACTCAGGACGGCAAGCGCTACATCGACTTCCTCGCTGGTGCCGGCACGCTCAACTACGGGCACAACCACCCGGTGCTCAAGCAGGCGCTGCTCGAGTACATCGAGAGCGACGGCATCACCCACGGCCTGGACATGTACACCGAAGCCAAGGAGCGTTTCCTCGAAACCTTCAACCGGCTGATCCTCGAGCCGCGCGGCATGGGCGACTACCGCATGCAGTTCACCGGCCCGACCGGCACCAACGCGGTCGAGGCGGCGATGAAGCTGGCGCGCAAGGTCACCGGACGCAACAACATCATCAGCTTCACCAATGGCTTCCACGGCTGCAGCATTGGCGCGCTGGCCGCCACCGGCAACCAGCATCACCGTGGTGGTTTCGGGCATCAGCCTCACCGATGTCAGCCGCATGCCGTACGCCAATTACTTTGGCGACAGACCAACACCATCGGCATGATGGACAAGCTCTTGTCCGACCCATCCAGCGGTATCGACAGCCGGCGGCGGTGATCGTCGAGTGTGCAGGCGAAGCGCCTGACACCGCGTCGCGATGATGCGCAGCTCGAGAGCTCTGCGCAGCACGAATGCTGCTGATCGTCGACGACTCAAGCGCTGCCGCCGAACCGGGACTCTCAGCTCGAAGAATGCATCAGCGAATCGCAGCGTGTCCAGTCCTGTCCGGCTACGGCTGCGATATTGCAAGTCGCTGTCCGGCTACGGCCTGCCGTTCGCCATGGTGTTGCTGCGCCAAGAGCTGGACCAGTGGAAGCCCGGCGAACACAACGGCACCTTCCGCGGCAACAACCATGCATTCGTCACGGCGGCCGCGGCGGTCGAGCACTTCTGGCAGAACGACGCGTTCGCCAACAGCGTGAAGGCCAAGGGCAAGCGCATCGCCGACGGCATGCAGCGCATCATCCGTCGCCACGGCCCGGATTCGCTGTTCCTCAAGGGCCGCGGGATGATGATCGGCATCAGCTGCCCCGATGGCGAGATTGCCGCCGCAGTGTGCCGCCACGCCTTCGAAAACGGCCTGGTGATCGAGACCAGCGGCGCCCACAGCGAAGTGGTCAAGTGCCTCTGCCCGCTGATCATCAGCGATGAGCAGATCGACCAGGCACTTTCCATCCTCGACAAGGCCTTTGCCGCCGTGATGAGCGAGCAGACCGAGAACCAAGCTTCCTGAGTCGACTAATAATAAAACCTTTATTCATGGTTTATAATATAATAATTGTGATGACTATGCACAAAGCAGTTCTAGTCCCATATATATAACTATATATAACCCGTTTAAAGATTTATTTAAAAATATGTGTGTAAAAAATGCTTATTTTTAATTTTATTTTATATAAGTTATAATATTAAATACACAATGATTAAAATTAAATAATAATAAATTTAACGTAACGATGAGTTGTTTTTTTATTTTGGAGATACACGCATACATATTTATTTACATTGAAGAAAACTGCTAGGATTTTATTAGACAGGCCTTTATATTAAATTTTTAACAACTTTTTAAAATTTATGTAAATTTATATAATATATAAATCTTTATTTTTTATTACATTCGATCGTTTAAATACATGAACAGAATAGTGCATATGCCTACCCTAAAAAGGAATTCAATCAACAACCCCAAAGGCATTGTTTTGAGTTTCCCCACCGTAATGCTCCGTCGTCCAACCGACGGCGACGGTTACAACCTTCATCAGCTGGTGGCGCGCTGCCAGCCCCTCGATACCAATTCGGTCTACTGCAACCTGCTGCAGTGTTCCGATTTCGCTGATACCGCCATCGCCGCAGAGAACGCTCAAGGCGAGCTGGTCGGTTTCATCTCGGGTTACCGCCCCCCTTCGCGGCCGGACACGCTGTTCGTCTGGCAGGTCGCCGTCGACAGCTCGATGCGCGGTCAGGGGCTGGCCCTGCGCATGCTGCTGGCACTGACCGCCCGGGTCGCTCGCGAGTACGGCGTGCGTTACATGGAAACCACCATCTCGCCGGACAACGGGGCGTCACAGGCGCTGTTCAAGCGGGCCTTCGACCGCCTCGATGCCAACTGCACGACGCGCACGCTGTTCGCCCGCGACACGCATTTCGCCGGTCAGCACGAGGACGAGGTGCTCTACCGCGCCGGCCCGTTCACCGTTTCCCATCTAGAAGAAGAGCTCAAGGAGCACGCATGACGACTTCAGGTCGTTTCGGTTAATGTAATGTACTTTATTTACTACCTCATCAGATCAGCATATACGTGCGACCCGATGTGGTACTTTTAAATCGGTTAGACATTTAGTAATATAAATGTCTAACCGATTTTATAATGCGTAAAAAACCTTA
61
TTTCACTACTAATGAAGTCTTTAGATATATATTTATATTACAGATGATACAGTTAACAAGTTATTCCCACTGTGGTTCTTAAAAAACACTTAAGTAAAAACACATAACTCCACGTAAGCGCATTTTCTTACAATCAAAGAATGCCAATTGTTCTTTGCTTGTTGTAAAAGAAAAACTAGGCTTTTTCTTTGAAAACATTTCAGCATATTCAACAACTTTTATAGATTGGTTTAGCGGATGATGGGACTCG
62
Appendix III: Sequencing result of insert with orientation 2 in the transformation vector Yellow: psbD 5’ Violet: ectB Green: rbcL 3’ Turquoise blue: rbcL 5’ Brown: ectA Blue: psbA
TCGACTAATAATAAAACCTTTATTCATGGTTTATAATATAATAATTGTGATGACTATGCACAAAGCAGTTCTAGTCCCATATATATAACTATATATAACCCGTTTAAAGATTTATTTAAAAATATGTGTGTAAAAAATGCTTATTTTTAATTTTATTTTATATAAGTTATAATATTAAATACACAATGATTAAAATTAAATAATAATAAATTTAACGTAACGATGAGTTGTTTTTTTATTTTGGAGATACACGCAATGAAAACTTTTGAACTGAATGAATCCAGGGTTCGCAGCTACTGCCGTTCCTTCCCCGTGGTCTTCAAGCAGGCCCAGGGCGCCGAACTGGTCACTCAGGACGGCAAGCGCTACATCGACTTCCTCGCTGGTGCCGGCACGCTCAACTACGGGCACAACCACCCGGTGCTCAAGCAGGCGCTGCTCGAGTACATCGAGAGCGACGGCATCACCCACGGCCTGGACATGTACACCGAAGCCAAGGAGCGTTTCCTCGAAACCTTCAACCGGCTGATCCTCGAGCCGCGCGGCATGGGCGACTACCGCATGCAGTTCACCGGCCCGACCGGCACCAACGCGGTCGAGGCGGCGATGAAGCTGGCGCGCAAGGTCACCGGACGCAACAACATCATCAGCTTCACCAATGGCTTCCACGGCTGCAGCATTGGCGCGCTGGCCGCCACCGGCAACCAGCATCACCGTGGTGGTTTCGGGCATCAGCCTCACCGATGTCAGCCGCATGCCGTACGCCAATTACTTTGGCGACAGACCAACACCATCGGCATGATGGACAAGCTCTTGTCCGACCCATCCAGCGGTATCGACAGCCGGCGGCGGTGATCGTCGAGTGTGCAGGCGAAGCGCCTGACACCGCGTCGCGATGATGCGCAGCTCGAGAGCTCTGCGCAGCACGAATGCTGCTGATCGTCGACGACTCAAGCGCTGCCGCCGAACCGGGACTCTCAGCTCGAAGAATGCATCAGCGAATCGCAGCGTGTCCAGTCCTGTCCGGCTACGGCTGCGATATTGCAAGTCGCTGTCCGGCTACGGCCTGCCGTTCGCCATGGTGTTGCTGCGCCAAGAGCTGGACCAGTGGAAGCCCGGCGAACACAACGGCACCTTCCGCGGCAACAACCATGCATTCGTCACGGCGGCCGCGGCGGTCGAGCACTTCTGGCAGAACGACGCGTTCGCCAACAGCGTGAAGGCCAAGGGCAAGCGCATCGCCGACGGCATGCAGCGCATCATCCGTCGCCACGGCCCGGATTCGCTGTTCCTCAAGGGCCGCGGGATGATGATCGGCATCAGCTGCCCCGATGGCGAGATTGCCGCCGCAGTGTGCCGCCACGCCTTCGAAAACGGCCTGGTGATCGAGACCAGCGGCGCCCACAGCGAAGTGGTCAAGTGCCTCTGCCCGCTGATCATCAGCGATGAGCAGATCGACCAGGCACTTTCCATCCTCGACAAGGCCTTTGCCGCCGTGATGAGCGAGCAGACCGAGAACCAAGCTTCCTGAGAATTCTTTTTATTTTTCATGATGTTTATGTGAATAGCATAAACATCGTTTTTATTTTTATGGTGTTTAGGTTAAATACCTAAAGTCGACTACATATTTATTTACATTGAAGAAAACTGCTAGGATTTTATTAGACAGGCCTTTATATTAAATTTTTAACAACTTTTTAAAATTTATGTAAATTTATATAATATATAAATCTTTATTTTTTATTACATTCGATCGTTTAAATACATGAACAGAATAGTGCATATGCCTACCCTAAAAAGGAATTCAATCAACAACCCCAAAGGCATTGTTTTGAGTTTCCCCACCGTAATGCTCCGTCGTCCAACCGACGGCGACGGTTACAACCTTCATCAGCTGGTGGCGCGCTGCCAGCCCCTCGATACCAATTCGGTCTACTGCAACCTGCTGCAGTGTTCCGATTTCGCTGATACCGCCATCGCCGCAGAGAACGCTCAAGGCGAGCTGGTCGGTTTCATCTCGGGTTACCGCCCCCCTTCGCGGCCGGACACGCTGTTCGTCTGGCAGGTCGCCGTCGACAGCTCGATGCGCGGTCAGGGGCTGGCCCTGCGCATGCTGCTGGCACTGACCGCCCGGGTCGCTCGCGAGTACGGCGTGCGTTACATGGAAACCACCATCTCGCCGGACAACGGGGCGTCACAGGCGCTGTTCAAGCGGGCCTTCGACCGCCTCGATGCCAACTGCACGACGCGCACGCTGTTCGCCCGCGACACGCATTTCGCCGGTCAGCACGAGGACGAGGTGCTCTACCGCGCCGGCCCGTTCACCGTTTCCCATCTAGAAGAAGAGCTCAAGGAGCACGCATGACGACTTCAGGTCGTTTCGGTTAATGTAATGTACTTTATTTACTACCTCATCAGATCAGCATATACGTGCGACCCGATGTGGTACTTTTAAATCGGTTAGACATTTAGTAATATAAATGTCTAACCGATTTTATAATGCGTAAAAAACCTTA

63
TTTCACTACTAATGAAGTCTTTAGATATATATTTATATTACAGATGATACAGTTAACAAGTTATTCCCACTGTGGTTCTTAAAAAACACTTAAGTAAAAACACATAACTCCACGTAAGCGCATTTTCTTACAATCAAAGAATGCCAATTGTTCTTTGCTTGTTGTAAAAGAAAAACTAGGCTTTTTCTTTGAAAACATTTCAGCATATTCAACAACTTTTATAGATTGGTTTAGCGGATGATGGGACTCG
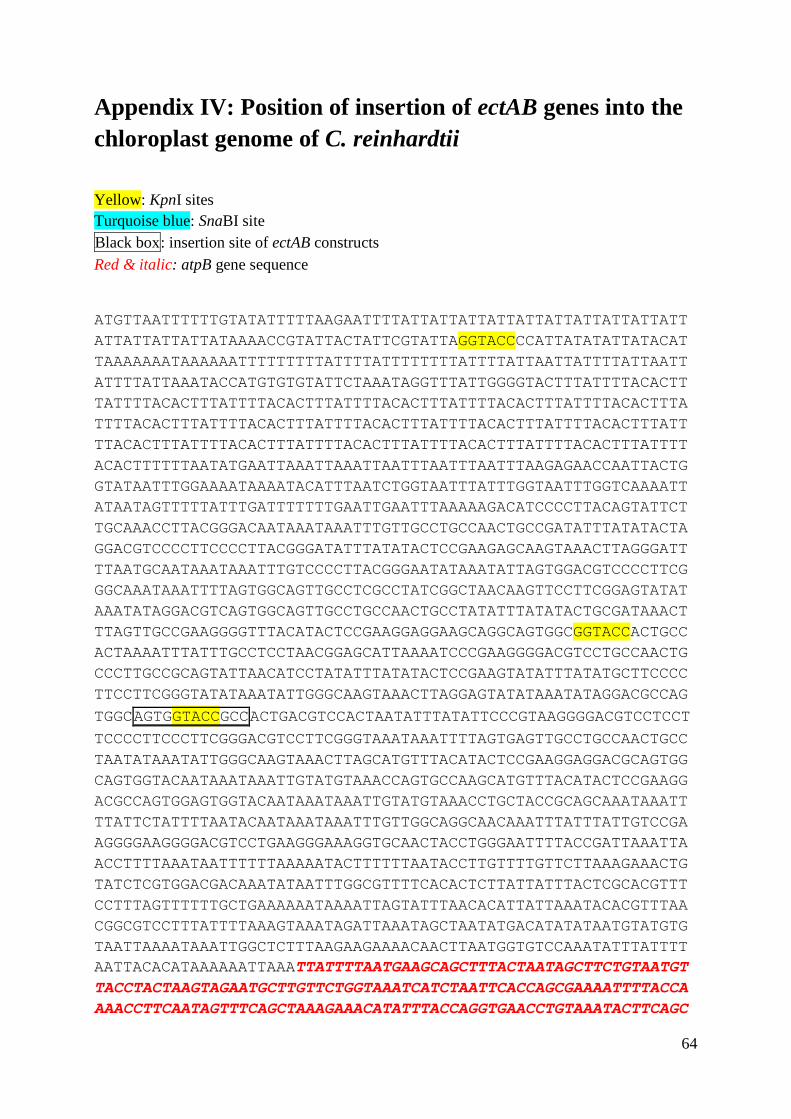
64
Appendix IV: Position of insertion of ectAB genes into the chloroplast genome of C. reinhardtii
Yellow: KpnI sites Turquoise blue: SnaBI site Black box: insertion site of ectAB constructs Red & italic: atpB gene sequence
ATGTTAATTTTTTGTATATTTTTAAGAATTTTATTATTATTATTATTATTATTATTATTATTATTATTATTATTATAAAACCGTATTACTATTCGTATTAGGTACCCCATTATATATTATACATTAAAAAAATAAAAAATTTTTTTTTATTTTATTTTTTTTATTTTATTAATTATTTTATTAATTATTTTATTAAATACCATGTGTGTATTCTAAATAGGTTTATTGGGGTACTTTATTTTACACTTTATTTTACACTTTATTTTACACTTTATTTTACACTTTATTTTACACTTTATTTTACACTTTATTTTACACTTTATTTTACACTTTATTTTACACTTTATTTTACACTTTATTTTACACTTTATTTTACACTTTATTTTACACTTTATTTTACACTTTATTTTACACTTTATTTTACACTTTATTTTACACTTTTTTAATATGAATTAAATTAAATTAATTTAATTTAATTTAAGAGAACCAATTACTGGTATAATTTGGAAAATAAAATACATTTAATCTGGTAATTTATTTGGTAATTTGGTCAAAATTATAATAGTTTTTATTTGATTTTTTTGAATTGAATTTAAAAAGACATCCCCTTACAGTATTCTTGCAAACCTTACGGGACAATAAATAAATTTGTTGCCTGCCAACTGCCGATATTTATATACTAGGACGTCCCCTTCCCCTTACGGGATATTTATATACTCCGAAGAGCAAGTAAACTTAGGGATTTTAATGCAATAAATAAATTTGTCCCCTTACGGGAATATAAATATTAGTGGACGTCCCCTTCGGGCAAATAAATTTTAGTGGCAGTTGCCTCGCCTATCGGCTAACAAGTTCCTTCGGAGTATATAAATATAGGACGTCAGTGGCAGTTGCCTGCCAACTGCCTATATTTATATACTGCGATAAACTTTAGTTGCCGAAGGGGTTTACATACTCCGAAGGAGGAAGCAGGCAGTGGCGGTACCACTGCCACTAAAATTTATTTGCCTCCTAACGGAGCATTAAAATCCCGAAGGGGACGTCCTGCCAACTGCCCTTGCCGCAGTATTAACATCCTATATTTATATACTCCGAAGTATATTTATATGCTTCCCCTTCCTTCGGGTATATAAATATTGGGCAAGTAAACTTAGGAGTATATAAATATAGGACGCCAGTGGCAGTGGTACCGCCACTGACGTCCACTAATATTTATATTCCCGTAAGGGGACGTCCTCCTTCCCCTTCCCTTCGGGACGTCCTTCGGGTAAATAAATTTTAGTGAGTTGCCTGCCAACTGCCTAATATAAATATTGGGCAAGTAAACTTAGCATGTTTACATACTCCGAAGGAGGACGCAGTGGCAGTGGTACAATAAATAAATTGTATGTAAACCAGTGCCAAGCATGTTTACATACTCCGAAGGACGCCAGTGGAGTGGTACAATAAATAAATTGTATGTAAACCTGCTACCGCAGCAAATAAATTTTATTCTATTTTAATACAATAAATAAATTTGTTGGCAGGCAACAAATTTATTTATTGTCCGAAGGGGAAGGGGACGTCCTGAAGGGAAAGGTGCAACTACCTGGGAATTTTACCGATTAAATTAACCTTTTAAATAATTTTTTAAAAATACTTTTTTAATACCTTGTTTTGTTCTTAAAGAAACTGTATCTCGTGGACGACAAATATAATTTGGCGTTTTCACACTCTTATTATTTACTCGCACGTTTCCTTTAGTTTTTTGCTGAAAAAATAAAATTAGTATTTAACACATTATTAAATACACGTTTAACGGCGTCCTTTATTTTAAAGTAAATAGATTAAATAGCTAATATGACATATATAATGTATGTGTAATTAAAATAAATTGGCTCTTTAAGAAGAAAACAACTTAATGGTGTCCAAATATTTATTTTAATTACACATAAAAAATTAAATTATTTTAATGAAGCAGCTTTACTAATAGCTTCTGTAATGTTACCTACTAAGTAGAATGCTTGTTCTGGTAAATCATCTAATTCACCAGCGAAAATTTTACCAAAACCTTCAATAGTTTCAGCTAAAGAAACATATTTACCAGGTGAACCTGTAAATACTTCAGC
65
TACGAAGAATGGTTGTGATAAGAAACGTTCAATTTTACGAGCACGAGCTACAATAAGTCTGTCTTCTTCAGATAATTCATCTAAACCTAGAATAGCAATAATATCTTGTAATTCTTTGTAACGTTGTAAAGTTTTTTTTACGCTTTGTGCAGAATCATAGTGTTTTTCACCAAGAATCCACGGTTGTAACATAGTTGAAGTTGATTCTAATGGGTCAACCGCAGGGTAAATACCTTTAGCAGCTAAGTTACGAGAAAGTACTGTAGTAGCATCTAAGTGAGCGAATGTTGTAGCAGGAGCAGGGTCAGTAAGGTCATCTGCAGGTACATATACAGCCTGAATCGATGTGATAGAACCATCTTTAGTTGAAGTAATACGTTCTTGAAGACCACCCATTTCTGTAGCTAAAGTAGGTTGGTAACCTACAGCTGATGGCATACGACCTAATAAAGCAGATACTTCAGCACCAGCTTGTACGAAACGGAAAATGTTATCAATGAAGAATAATACGTCTTGTTTGTTAACATCACGGAAATATTCAGCCATTGTTAAAGCTGTTAAAGCAACACGCATACGAGCACCTGGTGGTTCGTTCATTTGACCGTATACAAGAGCTACTTTTGAATCAGATAAGTTCTTTTCAACAATAACACCAGATTCTTTCATTTCTGTGTAAAGGTCGTTACCTTCACGTGTACGTTCACCAACACCAGCAAATACAGAAACACCACCGTGTGCTTTAGCAATGTTGTTGATCAGTTCCATAATTAAAACTGTTTTGCCTACACCAGCACCACCGAAAAGACCAATTTTACCACCACGACGGTATGGAGCTAAAAGGTCTACAACTTTAATACCTGTTTCAAAAATTGATAAACGAGTATCTAAATCAACGAAAGCAGGAGCTGTACGGTGAATTGGTAAAGTTTCTTCAACTTTAACATTACCCATGTTATCTACAGGTTCACCTAGAACGTTGAAAATACGTCCTAAAGTTACTTTACCTACAGGAACACTTAACGGTTTACCAGTATCTACAACTTCCATACCACGCATTAAACCTTCTGTTGGGTTCATAGAAACTGCACGTACACAGTTATCACCTAAAAGTTGTTGAACTTCACAAGTAACAGCCATTTCTGTACCTGCTGAGTTTTTAGCACGAATAGTTAGAGCGTTGTAAATATTTGGTACTTGGCCTTTAGCAAATACGATATCTAAAACAGGACCAATAATTTGTACAATACGTCCCATGTTTTTTGTTTCAATAGAATCACTCATAGTAAGTGGAATTAATATGCCCCAAGGCATTCATATTTTAACTTATTTTACTTAAATTCTTACGTATAAACCCCGAAGGAAACTTTATCTTAGGTAATTTGAAATAAGAACCTCCTCCTTCCCCTTCGGGCAAGTAAACTTAGCATGTTTACATACTCCGAAGGAGGACGCCAGTGGCAGTGGTATCGCCACTGCCTAGTATGTAAACATTGTGGCTTTACTTTCAAAAAGGCAGGAAATACTGAGAGTGTAACTTGTTATAAATTTAAAATTTATATAAAAGGAAGCTCAAACATATAGTAGAATTTATATATAAAAAGTATTATTCACTAACGCTTATTTTTTAGTTTTTTCATTTAACTATATATATTAATATATTATATAA
66
Appendix V: Solutions and recipes E. coli and DNA: 1% agarose [60mL]: Add 0.6 g agarose to 60 mL TAE buffer [1x]. Boil the solution in a microwave oven. Cool down to 50 °C with cold water before pouring into tray and placing the comb. Agarose gel loading buffer: 0.25% bromphenol blue, 0.25% xylene cyanol FF and 30% glycerol. Ampicillin 60mg/mL (10mL): To 600 mg of ampicillin, add dH2O to a final volume of 10 mL. The solution is sterilized by filtering 1 mL solution to each 1.5 mL Eppendorf tube. Store the tubes at -20 °C. Kanamycin 50mg/mL (10mL): To 500 mg of kanamycin, add dH2O to a final volume of 10 mL. The solution is sterilized by filtering 1 mL solution to each 1.5 mL Eppendorf tube. Store the tubes at -20 °C. Lysogeny broth (LB) (1L): 10g tryptone, 5g yeast extract, 10g NaCl, 200μL 5M NaOH. Add dH2O to 1L. Autoclave the solution at 121 °C for 20 minutes. Lysogeny broth (LB) with 1.5% agar (1L): 10 g tryptone, 5 g yeast extract, 10 g NaCl, 15 g agar, 200μL 5M NaOH. Add dH2O water to 1 L. Autoclave the solution at 121 °C for 20 minutes. Potassium acetate (5M potassium, 3M acetate): 294.42 g potassium acetate is added in 100 mL dH2O. Add glacial acetic acid until a pH of 4.6 is reached [ca. 40-50% of final volume]. Final volume should be 1 L. TEG [1L]: 25mM Tris-HCl (pH 8.0), 10mM Na2-EDTA, 50mM glucose. TAE (Tris‐acetate EDTA) buffer [50x]: 242 g Tris base, 57.1 mL glacial acetic acid, 100 mL 0.5 M EDTA (pH 8.0) in 1 L dH2O. Chlamydomonas: DNA extraction buffer: [100mM Tris (pH 8.0), 50mM Na2-EDTA, 0.5M NaCl, 10mM ß-mercaptoethanol]. High salt (HS) medium [1L]: 20 mL salt stock [50x], 20 mL phosphate stock [50x], 1 mL trace elements. Add dH2O to 1 L, and autoclave for 20 minutes at 121 °C.
67
High salt high acetate (HSHA) [1L]: 20 mL salt stock [50x], 20 mL phosphate stock [50x], 1 mL trace elements, 2.5 g potassium acetate, bring the volume to 1 L by adding dH2O. Autoclave for 20 minutes at 121 °C.
Hutner trace elements:
Solution Amount
Na2EDTA· 2H2O 5 g
ZnSO4·7H2O 2.2 g
H3BO3 1.14 g
MnCl2·4H2O 506 mg
FeSO4·7H2O 499 mg
CoCl2·6H2O 161 mg
CuSO4·5H2O 157 mg
Mo7O24(NH4)6·4H2O 110 mg
Distilled water 100 mL
Adjust the pH to 6.5-6.8 with KOH (~1.6 g) at 70 °C. Store the solution in a refrigerator [5 °C]. The solution should be violet before use. Phosphate stock [50x] (500mL): 47 g K2HPO4 ·3 H2O (36 g water free), 18 g KH2PO4. Add dH2O to a final volume of 500mL. Salt stock [50x] (500 mL): 12.50g NH4Cl, 0.5g MgSO4·7H2O, and 0.25g CaCl2·2H2O. Add dH2O to a final volume of 500mL. Analytical methods: Blotting: SSC [20x] (saline-sodium citrate): 175.3 g NaCl [3M], 88.2 g Sodium citrate · 2H2O in dH2O[300mM]. Adjust pH to 7.0 with HCl solution and bring to 1 L. Labelling buffer:
68
Make the following solutions: 1) 625μL Tris [1M] (pH 8.0), 62.5μL MgCl2 [1 M], 8.7μL β‐mercaptoethanol [14.4M] in 1mL. 2) 16.4g 4‐(2‐hydroxyelhyl)‐1‐piperazineethanesulfonic acid (HEPES) in 25mL pH 6.6. 3) Random, primers (pd[N]6) (Pharmacia), 50 units/mL in TE (Tris [10mM], Na2‐EDTA [1mM] pH 7.5. Mix 475μL of solution 1, 500 μL of solution 2, and 25 μL of solution 3. Hybridization: Hybridization buffer [100mL]: 50mL Na-phosphate buffer [0.5M], 200μL EDTA [1mM], 1g BSA, 7g SDS in 100mL. Dissolve at room temperature. Na-phosphate buffer [1M pH 7.2] (hybridization): 134g Na2HPO4 · 7H2O, 4mL H3PO4 [85%], add dH2O to 1L. Wash buffer #1 (1L): 40mL Na-phosphate buffer [1M (pH 7.2)], 2mL EDTA [0.5M (pH 8.9)], 5g BSA, 50g SDS in a final volume of 1L. Wash buffer #2 (4L): 160mL Na-phosphate buffer [1M (pH 7.2)], 8mL EDTA [0.5M (pH 8.9)], 40g SDS in a final volume of 4L. Southern blot: DNA gel loading buffer: 4% sucrose, 0.25% bromphenol blue. Neutralization solution: Tris [1.5M] pH 7.4, NaCl [1.5M]. Denaturation solution: NaOH [0.5M], NaCl [1M] Northern blot: MOPS buffer [5x] MgSO4 [10mM], MOPS [0.5M] M, NaCl [2.5M]. Adjust pH to 7.5 with NaOH. Filter to sterilize and store the solution in the dark. RNA gel loading buffer: 0.5mL glycerol [100%], 4μL Na2-EDTA [250mM (pH 8.0)], 2.5mg bromphenolblue, 2.5mg Xylene cyanol FF, and add sterile dH2O to 1mL. Treat with DEPC before use.
69
References Alia, Hayashi, H., Sakamoto, A., & Murata, N. (1998). Enhancement of the tolerance of
Arabidopsis to high temperatures by genetic engineering of the synthesis of glycinebetaine. Plant J, 16(2), 155-161.
Arakawa, T., & Timasheff, S. N. (1985). The stabilization of proteins by osmolytes. Biophys
J, 47(3), 411-414. Barnes, D., Franklin, S., Schultz, J., Henry, R., Brown, E., Coragliotti, A., & Mayfield, S. P.
(2005). Contribution of 5'- and 3'-untranslated regions of plastid mRNAs to the expression of Chlamydomonas reinhardtii chloroplast genes. Mol Genet Genomics, 274(6), 625-636.
Becker, J., Schäfer, R., Kohlstedt, M., Harder, B. J., Borchert, N. S., Stöveken, N., Bremer,
E., & Wittmann, C. (2013). Systems metabolic engineering of Corynebacterium glutamicum for production of the chemical chaperone ectoine. Microbial Cell Factories, 12:110.
Blowers, A. D., Bogorad, L., Shark, K. B., & Sanford, J. C. (1989). Studies on
Chlamydomonas chloroplast transformation: foreign DNA can be stably maintained in the chromosome. Plant Cell, 1(1), 123-132.
Blowers, A. D., Klein, U., Ellmore, G. S., & Bogorad, L. (1993). Functional invivo analyzes
of the 3' flanking sequences of the Chlamydomonas chloroplast rbcL and psaB genes. Mol Gen Genet, 238(3), 339-349.
Bock, R. (2007). Plastid biotechnology: prospects for herbicide and insect resistance,
metabolic engineering and molecular farming. Curr Opin Biotechnol, 18(2), 100-106. Brown, A. D. (1990). Microbial water stress physiology: Principles and perspectives (pp. 13
+ 313). Michigan: Wiley. Brown, A. D., & Simpson, J. R. (1972). Water relations of sugar-tolerant yeasts: the role of
intracellular polyols. Gen Microbiol, 72(3), 589-591. Buenger, J., & Driller, H. (2004). Ectoine: an effective natural substance to prevent UVA-
induced premature photoaging. Skin Pharmacol Physiol, 17(5), 232-237. Chen, T. H., & Murata, N. (2002). Enhancement of tolerance of abiotic stress by metabolic
engineering of betaines and other compatible solutes. Curr Opin Plant Biol, 5(3), 250-257.
Coragliotti, A. T., Beligni, M. V., Franklin, S. E., & Mayfield, S. P. (2011). Molecular factors
affecting the accumulation of recombinant proteins in the Chlamydomonas reinhardtii chloroplast. Mol Biotechnol, 48(1), 60-75.
Eberhard, S., Drapier, D., & Wollman, F. A. (2002). Searching limiting steps in the
expression of chloroplast-encoded proteins: relations between gene copy number,
70
transcription, transcript abundance and translation rate in the chloroplast of Chlamydomonas reinhardtii. Plant J, 31(2), 149-160.
El-Sheekh, M. M. (2000). Stable chloroplast transformation in Chlamydomonas reinhardtii
using microprojectile bombardment. Folia Microbiol (Praha), 45(6), 496-504. Faye, L., & Daniell, H. (2006). Novel pathways for glycoprotein import into chloroplasts.
Plant Biotechnol J, 4, 275−279. Fischel, U., & Oren, A. (1993). Fate of compatible solutes during dilution stress in
Ectothiorhodospira-Marismortui. Fems Microbiology Letters, 113(1), 113-118. Flowers, T. J. (2004). Improving crop salt tolerance. J Exp Bot, 55(396), 307-319. Franklin, S., Ngo, B., Efuet, E., & Mayfield, S. P. (2002). Development of a GFP reporter
gene for Chlamydomonas reinhardtii chloroplast. Plant J, 30(6), 733-744. Fukuchi, S., Yoshimune, K., Wakayama, M., Moriguchi, M., & Nishikawa, K. (2003).
Unique amino acid composition of proteins in halophilic bacteria. J Mol Bio, 327(2), 347-357.
Funes, S., Franzen, L. G., & Gonzalez-Halphen, D. (2007). Chlamydomonas reinhardtii: the
model of choice to study mitochondria from unicellular photosynthetic organisms. Methods Mol Biol, 372, 137-149.
Galinski, E. A. (1995). Osmoadaptation in bacteria. Adv Microb Physiol, 37, 272-328. Galinski, E. A. & Louis, P. (1998). Compatible solutes: Ectoine production and gene
expression. In A. Oren (Eds.), Microbiology and Biogeochemistry of Hypersaline Environments. (pp. 187-202). Florida: CRC Press.
Galinski, E. A., Pfeiffer, H. P., & Truper, H. G. (1985). 1,4,5,6-Tetrahydro-2-methyl-4-
pyrimidinecarboxylic acid. A novel cyclic amino acid from halophilic phototrophic bacteria of the genus Ectothiorhodospira. Eur J Biochem, 149(1), 135-139.
Goldschmidt-Clermont M. (1991). Transgenic expression of aminoglycoside adenine
transferase in the chloroplast: A selectable marker of site-directed transformation of Chlamydomonas. Nucleic Acids Res, 19(15), 4083–4089.
Graf, R., Anzali, S., Buenger, J., Pfluecker, F., & Driller, H. (2008). The multifunctional role
of ectoine as a natural cell protectant. Clinics in Dermatology, 26(4), 326-333. Göller, K., Galinski, E.A. (1999). Protection of a model enzyme (lactate dehydrogenase)
against heat, urea and freeze–thaw treatment by compatible solutes additives. J Mol Cat B: Enzym, 7(1-4), 37–45.
Harris, E. H. (2001). Chlamydomonas as a Model Organism. Annu Rev Plant Physiol Plant
Mol Biol, 52, 363-406.
71
Heinrich, U., Garbe, B., & Tronnier, H. (2007). In vivo assessment of ectoine: a randomized, vehicle controlled clinical trial. Skin Pharmacol Physiol, 20(4), 211–218.
Klein, U., Salvador, M. L., & Bogorad, L. (1994). Activity of the Chlamydomonas chloroplast
rbcL gene promoter is enhanced by a remote sequence element. Proc Natl Acad Sci U S A, 91(23), 10819-10823.
Knapp, S., Ladenstein, R., & Galinski, E. A. (1999). Extrinsic protein stabilization by the
naturally occurring osmolytes beta-hydroxyectoine and betaine. Extremophiles, 3(3), 191-198.
Kolp, S., Pietsch, M., Galinski, E. A., & Gutschow, M. (2006). Compatible solutes as
protectants for zymogens against proteolysis. Biochim Biophys Acta, 1764(7), 1234-1242.
Lanyi, J. K. (1974). Salt-dependent properties of proteins from extremely halophilic bacteria.
Bacteriol Rev, 38(3), 272-290. Lippert, K., & Galinski, E. (1992). Enzyme stabilization by ectoine-type compatible solutes:
protection against heating, freezing and drying. Appl Microbiol Biotechnol, 37(1), 61-65.
Liu, Y., & Bolen, D. W. (1995). The peptide backbone plays a dominant role in protein
stabilization by naturally occurring osmolytes. Biochemistry, 34(39), 12884-12891. Louis, P., & Galinski, E. A. (1997). Characterization of genes for the biosynthesis of the
compatible solute ectoine from Marinococcus halophilus and osmoregulated expression in Escherichia coli. Microbiology, 143, 1141-1149.
Lunde, A. (2012). Expression of the bacterial ectA gene in the chloroplast of Chlamydomonas
reinhardtii (Department of Molecular Bioscience, University of Oslo). Oslo: University of Oslo.
Mahajan, S., & Tuteja, N. (2005). Cold, salinity and drought stresses: an overview. Arch
Biochem Biophys, 444(2), 139-158. Malin, G., Iakobashvili, R., & Lapidot, A. (1999). Effect of tetrahydropyrimidine derivatives
on protein-nucleic acids interaction. Type II restriction endonucleases as a model system. J Biol Chem, 274(11), 6920-6929.
Maul, J. E., Lilly, J. W., Cui, L., dePamphilis, C. W., Miller, W., Harris, E. H., & Stern, D. B.
(2002). The Chlamydomonas reinhardtii plastid chromosome: islands of genes in a sea of repeats. Plant Cell, 14(11), 2659-2679.
Mayfield, S. P., Manuell, A. L., Chen, S., Wu, J., Tran, M., Siefker, D., Muto. M., & Marin-
Navarro, J. (2007). Chlamydomonas reinhardtii chloroplasts as protein factories. Curr Opin Biotechnol, 18(2), 126-133.
Merchant, S. S., Prochnik, S. E.,Vallon, O., Harris, E. H., Karpowicz, S. J., Witman, G. B.,
Terry, A., Salamov, A., Fritz-Laylin, L. K., Marechal-Drouard, L., Marshall, W. F.,
72
Qu, L. H., Nelson, D. R., Sanderfoot, A. A., Spalding, M. H., Kapitonov, V. V., Ren, Q., Ferris, P., Lindquist, E., Shapiro, H., Lucas, S. M., Grimwood, J., Schmutz, J., Cardol, P., Cerutti, H., Chanfreau, G., Chen, C. L., Cognat, V., Croft, M. T., Dent, R., Dutcher, S., Fernandez, E., Fukuzawa, H., Gonzalez-Ballester, D., Gonzalez-Halphen, D., Hallmann, A., Hanikenne, M., Hippler, M., Inwood, W., Jabbari, K., Kalanon, M., Kuras, R., Lefebvre, P. A., Lemaire, S. D., Lobanov, A. V., Lohr, M., Manuell, A., Meier, I., Mets, L., Mittag, M., Mittelmeier, T., Moroney, J. V., Moseley, J., Napoli, C., Nedelcu, A. M., Niyogi, K., Novoselov, S. V., Paulsen, I. T., Pazour, G., Purton, S., Ral, J. P., Riano-Pachon, D. M., Riekhof, W., Rymarquis, L., Schroda, M., Stern, D., Umen, J., Willows, R., Wilson, N., Zimmer, S. L., Allmer, J., Balk, J., Bisova, K., Chen, C. J., Elias, M., Gendler, K., Hauser, C., Lamb, M. R., Ledford, H., Long, J. C., Minagawa, J., Page, M. D., Pan, J., Pootakham, W., Roje, S., Rose, A., Stahlberg, E., Terauchi, A. M., Yang, P., Ball, S., Bowler, C., Dieckmann, C. L., Gladyshev, V. N., Green, P., Jorgensen, R., Mayfield, S., Mueller-Roeber, B., Rajamani, S., Sayre, R. T., Brokstein, P., Dubchak, I., Goodstein, D., Hornick, L., Huang, Y. W., Jhaveri, J., Luo, Y., Martinez, D., Ngau, W. C., Otillar, B., Poliakov, A., Porter, A., Szajkowski, L., Werner, G., Zhou, K., Grigoriev, I. V., Rokhsar, D. S., & Grossman, A. R. (2007). The Chlamydomonas Genome Reveals the Evolution of Key Animal and Plant Functions. Science, 318, 245-250.
Moghaieb, R. E., Nakamura, A., Saneoka, H., & Fujita, K. (2011). Evaluation of salt tolerance
in ectoine-transgenic tomato plants (Lycopersicon esculentum) in terms of photosynthesis, osmotic adjustment, and carbon partitioning. GM Crops, 2(1), 58-65.
Moghaieb, R. E., Tanaka, N., Saneoka, H., Murooka, Y., Ono, H., Morikawa, H., Nakamura,
A., Nguyen, N.T., Suwa, R., & Fujita, K. (2006). Characterization of salt tolerance in ectoine-transformed tobacco plants (Nicotiana tabaccum): photosynthesis, osmotic adjustment, and nitrogen partitioning. Plant Cell Environ, 29(2), 173-182.
Muto, M., Henry, R. E., & Mayfield, S. P. (2009). Accumulation and processing of a
recombinant protein designed as a cleavable fusion to the endogenous Rubisco LSU protein in Chlamydomonas chloroplast. BMC Biotechnol, 9, 26.
Nakayama, H., Yoshida, K., Ono, H., Murooka, Y., & Shinmyo, A. (2000). Ectoine, the
compatible solute of Halomonas elongata, confers hyperosmotic tolerance in cultured tobacco cells. Plant Physiol, 122(4), 1239-1247.
Nickelsen, J. (1998). Chloroplast RNA stability. In J. D. Rochaix, M. Goldschmidt-Clermont,
S. Merchant, & M. Kluwer (Eds.), The molecular biology of chloroplasts and mitochondria in Chlamydomonas. (pp.151-163). Netherlands: Springer.
Nickelsen, J., & Kuck, U. (2000). The unicellular green alga Chlamydomonas reinhardtii as
an experimental system to study chloroplast RNA metabolism. Naturwissenschaften, 87(3), 97-107.
Oren, A. (1999). Bioenergetic aspects of halophilism. Microbiol Mol Biol Rev, 63(2), 334-
348. Oren, A. (2008). Microbial life at high salt concentrations: phylogenetic and metabolic
diversity. Saline Systems, 4, 2.
73
Pastor, J. M., Salvador, M., Argandona, M., Bernal, V., Reina-Bueno, M., Csonka, L. N.,
Iborra, J.L., Vargas, C., Nieto, J.J., & Canovas, M. (2010). Ectoines in cell stress protection: uses and biotechnological production. Biotechnol Adv, 28(6), 782-801.
Potvin, G. & Zhang, Z. (2010). Strategies for high-level recombinant protein expression in
transgenic microalgae: a review. Biotechnol Adv, 28(6), 910-918. Purton, S. (2007). Tools and techniques for chloroplast transformation of Chlamydomonas.
Adv Exp Med Biol, 616, 34-45. Roberts, M. F. (2005). Organic compatible solutes of halotolerant and halophilic
microorganisms. Saline Systems, 1, 5. Rochaix, J. D. (1995). Chlamydomonas reinhardtii as the photosynthetic yeast. Annu Rev
Genet, 29, 209-230. Rontein, D., Basset, G., & Hanson, A. D. (2002). Metabolic engineering of osmoprotectant
accumulation in plants. Metab Eng, 4, 49-56. Rosales-Mendoza, S., Paz-Maldonado, L. M., & Soria-Guerra, R. E. (2012). Chlamydomonas
reinhardtii as a viable platform for the production of recombinant proteins: current status and perspectives. Plant Cell Rep, 31(3), 479-494.
Salvador, M. L., Klein, U., & Bogorad, L. (1993). Light-regulated and endogenous
fluctuations of chloroplast transcript levels in Chlamydomonas. Regulation by transcription and RNA degradation. The Plant Journal, 3 (2), 213–219.
Salvador, M. L., Suay, L., Anthonisen, I. L., & Klein, U. (2004). Changes in the 5'-
untranslated region of the rbcL gene accelerate transcript degradation more than 50-fold in the chloroplast of Chlamydomonas reinhardtii. Curr Genet, 45(3), 176-182.
Sauer, T., & Galinski, E. A. (1998). Bacterial milking: A novel bioprocess for production of
compatible solutes. Biotechnol Bioeng, 59(1), 128. Seip, B., Galinski, E. A., & Kurz, M. (2011). Natural and engineered hydroxyectoine
production based on the Pseudomonas stutzeri ectABCD-ask gene cluster. Appl Environ Microbiol, 77(4), 1368-1374.
Stern, D. B., Goldschmidt-Clermont, M., & Hanson, M. R. (2010). Chloroplast RNA
Metabolism. Annu Rev Plant Biol, 61, 125-155. Surzycki, R., Greenham, K., Kitayama, K., Dibal, F., Wagner, R., Rochaix, J. D., Ajam, T. &
Surzycki, S. (2009). Factors effecting expression of vaccines in microalgae. Biologicals, 37(3), 133-138.
Tadeo, X., Lopez-Mendez, B., Trigueros, T., Lain, A., Castano, D., & Millet, O. (2009).
Structural Basis for the Aminoacid Composition of Proteins from Halophilic Archea. Plos Biology, 7(12).
74
Tanimura, K., Nakayama, H., Tanaka, T., & Kondo, A. (2013). Ectoine production from lignocellulosic biomass-derived sugars by engineered Halomonas elongata. Bioresour Technol, 142, 523-529.
Timasheff, S. N. (1993). The control of protein stability and association by weak interactions
with water: how do solvents affect these processes? Annu Rev Biophys Biomol Struct, 22, 67-97.
Vahrenholz, C., Riemen, G., Pratje, E., Dujon, B., & Michaelis, G. (1993). Mitochondrial
DNA of Chlamydomonas reinhardtii: the structure of the ends of the linear 15.8-kb genome suggests mechanisms for DNA replication. Curr Genet, 24(3), 241-247.
Weiss, C., Bertalan, I., & Johanningmeier, U. (2012). Effects of rare codon clusters on the
expression of a high-turnover chloroplast protein in Chlamydomonas reinhardtii. J Biotechnol, 160(3-4), 105-111.
Wu, S., Xu, L., Huang, R., & Wang, Q. (2011). Improved biohydrogen production with an
expression of codon-optimized hemH and lba genes in the chloroplast of Chlamydomonas reinhardtii. Bioresour Technol, 102(3), 2610-2616.
![The Molecular Machinery of Chloroplast Division1[OPEN]...Update on Chloroplast Division The Molecular Machinery of Chloroplast Division1[OPEN] Cheng Chen,a Joshua S. MacCready,b Daniel](https://img.pdfslide.us/doc/110x75/5ffce43ba15d1e4dec6f4683/the-molecular-machinery-of-chloroplast-division1open-update-on-chloroplast.jpg)
![The Molecular Machinery of Chloroplast Division1[OPEN] · Update on Chloroplast Division The Molecular Machinery of Chloroplast Division1[OPEN] Cheng Chen,a Joshua S. MacCready,b](https://img.pdfslide.us/doc/110x75/6025c6a7c7a5a154ca59f7b1/the-molecular-machinery-of-chloroplast-division1open-update-on-chloroplast-division.jpg)