Embed Size (px)
Citation preview
1
Expression of Cocaine- and Amphetamine-Regulated Transcript is
Associated with Worse Survival in Small Bowel Carcinoid Tumors
Kalle Landerholm1,2, Liliya Shcherbina3, Sture E. Falkmer4, Johannes Järhult1,2, Nils Wierup3
1Department of Surgery, Ryhov Hospital, Jönköping; 2 Department of Clinical and
Experimental Medicine, Linköping University, Linköping; 3 Department of Clinical Sciences in
Malmö, Lund University, and 4 Department of Clinical Pathology, Ryhov Hospital, Jönköping ,
Sweden
Running title: CART in small bowel carcinoid tumors
Key words: Small bowel, Carcinoid, Neuroendocrine tumor, Cocaine- and amphetamine-regulated
transcript, CART
Financial support:
Landerholm Futurum – Academy of Healthcare at Jönköping County Council and the Foundation
for Clinical Cancer Research in Jönköping
Falkmer The Foundation for Clinical Cancer Research in Jönköping
Järhult The Foundation for Clinical Cancer Research in Jönköping
Wierup The Swedish Research Council (Projects No. 522-2008-4216, K2009-55X 21111-01-4,
K2007-55X-04499-33-3), Faculty of Medicine at Lund University, the Novo Nordisk,
Gyllenstiernska Krapperup, Fredrik and Ingrid Thuring, Magnus Bergwall, Crafoord
and Albert Påhlsson Foundations.
Corresponding author:
Kalle Landerholm
Department of Surgery, Ryhov Hospital, SE-551 85 Jönköping, Sweden
Phone: +46-36-32 10 00
Fax: +46-36-32 13 22
E-mail: [email protected]
None of the authors have anything to disclose.
Words in manuscript: 3436
Total number of figures and tables: 6
Research. on May 20, 2020. © 2012 American Association for Cancerclincancerres.aacrjournals.org Downloaded from
Author manuscripts have been peer reviewed and accepted for publication but have not yet been edited. Author Manuscript Published OnlineFirst on May 2, 2012; DOI: 10.1158/1078-0432.CCR-11-2513
2
Translational Relevance:
Beside the recently introduced TNM stage and proliferation index which together give some indication of the
disease course, prognostic markers of small bowel carcinoid are scarce. Cocaine- and amphetamine-regulated
transcript (CART) peptide functions as a neurotransmitter but also as a hormone and is produced by
enteroendocrine cells, among others. We recently demonstrated that CART is expressed in several types of
neuroendocrine tumors. The significance of tumor CART expression is previously unknown. In this study we
present evidence for worse survival in patients with CART-producing small bowel carcinoid tumors. In support
of this, we also show that cell viability of two intestinal tumor cell lines is increased in the presence of CART
peptide. These findings suggest CART as a putative prognostic biomarker, but also as a new potential target for
anti-tumor treatment.
Abstract
Purpose: Cocaine- and amphetamine-regulated transcript (CART) peptide exerts several
regulatory functions acting both as neurotransmitter and hormone. We recently showed that
CART is expressed in various neuroendocrine tumors, including small bowel carcinoids. The
main objective of the present study was to examine whether CART expression is associated
with survival in small bowel carcinoid patients. Secondary aims were to assess if CART
expression is associated with other tumor characteristics or clinical symptoms.
Experimental Design: Specimens from 97 patients with small bowel carcinoids were
examined for CART expression using immunohistochemistry. A CART score was introduced
based on the proportion of CART immunoreactive cells. On inclusion, specimens were
examined by routine histopathological methods and detailed clinical patient data were
retrieved. The effect of CART on cell viability was assessed in vitro using two intestinal
tumor cell lines.
Results: Expression of CART (P = 0.011), and increasing CART score (P = 0.033) were
associated with worse disease-specific survival. Adjusting for age, disease stage, and tumor
grade in multivariable analysis, CART expression was still associated with worse survival
Research. on May 20, 2020. © 2012 American Association for Cancerclincancerres.aacrjournals.org Downloaded from
Author manuscripts have been peer reviewed and accepted for publication but have not yet been edited. Author Manuscript Published OnlineFirst on May 2, 2012; DOI: 10.1158/1078-0432.CCR-11-2513
3
(Low CART hazard ratio (HR) 5.47, 95% confidence interval (CI) 0.71 to 42.46; and High
CART HR 9.44, 95% CI 1.14 to 78.14). CART expression was not associated with patient
age, disease stage, tumor grade, or any presenting symptom. Supporting our clinical data, we
found that CART promoted tumor cell viability in vitro in two different tumor cell lines.
Conclusion: Expression of CART in small bowel carcinoid tumors is associated with worse
survival.
Research. on May 20, 2020. © 2012 American Association for Cancerclincancerres.aacrjournals.org Downloaded from
Author manuscripts have been peer reviewed and accepted for publication but have not yet been edited. Author Manuscript Published OnlineFirst on May 2, 2012; DOI: 10.1158/1078-0432.CCR-11-2513
4
Introduction
Cocaine- and amphetamine-regulated transcript (CART) was discovered as an mRNA that
was up-regulated in rat striatum in response to psychostimulant administration (1). CART
peptides have since been found in the central, peripheral, and enteric nervous systems, and
also in endocrine cells in the pancreatic islets (2-4), the gastrointestinal (GI) tract mucosa
(5, 6), the thyroid (7), and the adrenal medulla (7, 8). Thus it appears that CART peptide is a
so-called brain-gut peptide, acting both as a neurotransmitter and as a hormone. Within the
brain, the spatial distribution of CART peptides together with various experimental studies
suggest a role of CART peptides in regulating food intake and body weight (9, 10) with an
overall anorexigenic effect via largely unknown mechanisms (10, 11). This is also supported
by observations that CART prepropeptide-encoding gene CARTPT null mice and humans
carrying a mutated CARTPT gene develop obesity and signs of type 2 diabetes (12-14). In
addition, there is evidence for CART involvement in other brain processes such as
mechanisms of reward and stress response (9, 10).
Hormonal expression of CART in pancreatic islets occurs mainly in the somatostatin-
producing δ-cells (2, 3), and the CART peptides participate in the regulation of insulin,
glucagon, and somatostatin secretion (3, 15). Within the GI tract mucosa, CART expression
has been identified mainly in gastrin-producing G-cells, but also in enterochromaffin (EC)
cells of the small bowel (5, 6). The physiological function of CART in the enteric neurons and
enteroendocrine cells remains poorly elucidated (16).
We recently showed that CART is expressed in tumor cells in human neuroendocrine tumors
(NETs) of various origin, including EC cell-derived small bowel carcinoids (17). Expression
of CART was found in a similar proportion of tumors regardless of the anatomical site of
Research. on May 20, 2020. © 2012 American Association for Cancerclincancerres.aacrjournals.org Downloaded from
Author manuscripts have been peer reviewed and accepted for publication but have not yet been edited. Author Manuscript Published OnlineFirst on May 2, 2012; DOI: 10.1158/1078-0432.CCR-11-2513
5
origin. The frequency of CART immunoreactive (IR) cells varied from none in some tumors
to a majority of the tumor cells in others. In small bowel carcinoids, CART was consistently
co-expressed with the established EC cell markers serotonin and chromogranin A within the
same tumor cell, and sometimes also with neuropeptide K. Our data gain support from a study
showing raised levels of circulating CART peptides in patients with a wide range of NETs
(18).
The purpose of the present study was to determine whether tumor CART expression is
associated with survival in small bowel carcinoid patients. A second aim was to investigate if
CART expression is associated with other tumor characteristics such as disease stage or
histopathological grade. A third aim was to examine whether tumor CART expression is
associated with pronounced weight loss, or other symptoms. In addition, the effect of CART
on cell viability was assessed in a murine intestinal NET cell line and a human colon cancer
cell line.
Materials and Methods
Patient cohort
All patients in Jönköping County (population 338,000) diagnosed with carcinoid tumor in the
jejunum or ileum, including the ileocecal valve, from 1960 to 2005, were identified in two
previous studies (19, 20). In brief, patients were initially found through the Swedish Cancer
Registry and the local cancer registry. Patients diagnosed at autopsy were excluded. Another
22 patients were excluded because the diagnosis proved to be incorrect or because the medical
records could not be found, leaving 145 patients in the preceding studies. These patients were
all eligible for inclusion in the present investigation, under condition that paraffin-embedded
tumor material could be retrieved for analysis. Eventually, 97 patients with adequate
Research. on May 20, 2020. © 2012 American Association for Cancerclincancerres.aacrjournals.org Downloaded from
Author manuscripts have been peer reviewed and accepted for publication but have not yet been edited. Author Manuscript Published OnlineFirst on May 2, 2012; DOI: 10.1158/1078-0432.CCR-11-2513
6
specimens were included. Patients with distant metastases were somewhat underrepresented
among the included patients compared to the eligible (28% versus 36%) owing to the fact that
some patients with distant metastases never underwent surgical resection.
The study was approved by the Regional ethical review board at Linköping University,
Sweden.
Patient data and follow-up
All relevant patient data were collected from medical records from primary health care centers
and hospital departments. Patients were followed-up until death or until 1st February 2011.
The median follow-up time was 6.1 (interquartile range 3.2 to 11.5) years.
Routine histopathological examinations
Before inclusion, sections from all specimens were histopathologically re-examined with
routine staining procedures, including immunohistochemistry (IHC) to confirm presence of
serotonin. In order to calculate Ki67 proliferation index, sections of all included tumors were
examined after incubation with the conventional MIB-1 antiserum.
Staging and Cause of death
Following the WHO 2010 histopathogical grading system, tumors were divided into G1 with
Ki67 proliferation index equal to or less than two per cent, G2 with an index between three
and 20 per cent, and G3 with an index of more than 20 per cent (21). The highest Ki67 index
in any primary tumor or metastasis within the first year of diagnosis was applied for each
patient.
Research. on May 20, 2020. © 2012 American Association for Cancerclincancerres.aacrjournals.org Downloaded from
Author manuscripts have been peer reviewed and accepted for publication but have not yet been edited. Author Manuscript Published OnlineFirst on May 2, 2012; DOI: 10.1158/1078-0432.CCR-11-2513
7
In accordance with previous studies (20, 22, 23), the disease stage was defined as localized
when the tumor was confined to the bowel wall, regional with either local tumor invasion of
the adjacent mesentery or regional lymph node metastases, and distant with metastases
elsewhere, including the peritoneum other than that covering the adjacent mesentery. These
three groups correspond to stages I-IIB, IIIA-IIIB, and IV, respectively, in the recently
introduced TNM classification (24, 25).
At the end of the observation period, 20 patients were alive and 77 patients were deceased.
The cause of death was individually assessed for each patient from medical records and
autopsy reports, when available. Death could convincingly be attributed to the carcinoid
disease in 38 patients, 34 patients died of other causes, whereas the cause of death was not
evident in five patients.
Immunohistochemistry
Indirect immunofluorescence was used. The primary antibody was a rabbit polyclonal anti-
CART (code 2059A; dilution 1:5,000; kindly provided by Dr. Jes T. Clausen, Novo Nordisk,
Måløv, Denmark). The antibody has been used previously for IHC and tested for possible
cross-reactivity with chemically related substances, including preabsorption tests with CART
54-102 (17). Importantly, the same staining pattern was seen with six other CART antisera,
and the specificity of all CART antibodies was verified by lack of staining in the GI tract of
CARTPT null mutant mice (17).
Briefly, sections (5 μm thickness) were cut from paraffin-embedded specimens, mounted on
slides, deparaffinized and rehydrated. Prior to immunostaining, antigen retrieval was
performed by boiling sections in 0.01M citrate buffer (pH 6.0) in a microwave oven for 2x7
Research. on May 20, 2020. © 2012 American Association for Cancerclincancerres.aacrjournals.org Downloaded from
Author manuscripts have been peer reviewed and accepted for publication but have not yet been edited. Author Manuscript Published OnlineFirst on May 2, 2012; DOI: 10.1158/1078-0432.CCR-11-2513
8
min at 650 W. Sections were incubated with the primary antibody, diluted in PBS with 0.25%
bovine serum albumin and 0.25% Triton-X100, overnight at 4°C. After rinsing 2x10 min with
PBS containing 0.25% Triton-X100, sections were incubated with a secondary antibody with
specificity for rabbit IgG and conjugated with Cy2 (Jackson, West Grove, PA) for 1h at room
temperature. Sections were again rinsed and then mounted in 1:1 PBS and glycerol.
Classification of CART immunoreactivity
Specimens were examined for CART IR by at least two independent observers in the
microscope using the same visual field (25x objective), and a grading (0-4) was introduced
based on the proportion of CART IR cells. In our previous study it was noted that CART IR
frequently was heterogeneous between different areas of the same tumor (17). Therefore, one
grade was assigned to the most common pattern of CART IR, and a second grade to the next
most common pattern. If the pattern was homogenous, both values were the same. Areas with
no CART IR cells were designated 0; areas with 1-10 CART IR cells per visual field were
designated 1; areas with 10-100 CART IR cells per visual field were designated 2; areas with
100-1,000 CART IR cells were designated 3; and areas with more than 1,000 CART IR cells
were designated 4 (Fig. 1). For example, a tumor predominated by areas with a few scattered
CART IR cells but also containing a smaller part with a high frequency of CART IR cells
could be designated as 1 + 4.
These grades were then used to divide the tumors into three groups, with the dominating
pattern given more weight than the second pattern. The group No CART contained only grades
0 + 0; Low CART contained 0 + 1-3, 1 + 0-3, and 2 + 0-2; and High CART contained 2 + 3,
3 + 0-3, and 4 in either position. This classification was referred to as CART score.
Research. on May 20, 2020. © 2012 American Association for Cancerclincancerres.aacrjournals.org Downloaded from
Author manuscripts have been peer reviewed and accepted for publication but have not yet been edited. Author Manuscript Published OnlineFirst on May 2, 2012; DOI: 10.1158/1078-0432.CCR-11-2513
9
All statistical analyses were performed using the CART score, and in addition comparing
tumors with no CART IR cells to those with any level of CART IR, this division was referred
to as CART 0/+.
Imaging
Immunofluorescence was examined in an epi-fluorescence microscope (Olympus BX60).
Images were taken with a digital camera (Nikon DS-2Mv).
Culture of GLUTag and HCT-116 cells
The GLUTag cell line (kindly provided by Dr. Daniel J. Drucker, Mount Sinai Hospital,
Toronto, Canada) was originally isolated from a glucagon-producing enteroendocrine tumor
in mice (26). GLUTag cells were routinely cultured in Dulbecco’s modified Eagle’s medium
(DMEM) supplemented with 10% FBS, 2mM glutamine, 100 U/mL penicillin, and
100 μg/mL streptomycin. The human colon cancer HCT-116 cell line (AACT, Bethesda, MD)
was grown in McCoy's 5A medium supplemented with 10% FBS, 2mM glutamine, 100 U/mL
penicillin, and 100 μg/mL streptomycin.
Cell viability assay
GLUTag and HCT-116 cells were seeded in 96-well plates at a density of 40,000 and 20,000
cells per well, respectively, and cultured for 24 h. Thereafter medium was replaced by new
medium with or without 10 or 100nM CART 54-102 peptide (kindly provided by Dr. Lars
Thim, Novo Nordisk, Måløv, Denmark), or 10nM glucagon-like peptide-1 (GLP-1; Sigma-
Aldrich, St. Louis, MO) used as positive control, and cells were cultured for another 48 h.
Then 10 μL of WST-1 reagent (Roche Applied Science, Rotkreuz, Switzerland) was added to
each well and absorbance at 450 nm with reference at 690 nm was read after 1 hour.
Research. on May 20, 2020. © 2012 American Association for Cancerclincancerres.aacrjournals.org Downloaded from
Author manuscripts have been peer reviewed and accepted for publication but have not yet been edited. Author Manuscript Published OnlineFirst on May 2, 2012; DOI: 10.1158/1078-0432.CCR-11-2513
10
Western blot
GLUTag cells were seeded in 6-well plates and cultured in full DMEM for 24 h. Thereafter
cells were incubated with 10nM CART 54-102 peptide for another 48 h. After the treatment,
cells were washed with PBS and lysed in Lysis-M reagent supplemented with Complete Mini
Protease inhibitor cocktail (Roche Diagnostics, Mannheim, Germany). The protein
concentration in the samples was determined using the Bio-Rad protein assay (Bio-Rad,
Hercules, CA). Proteins were separated by SDS PAGE electrophoresis and transferred to
nitrocellulose membranes (Bio-Rad, Hercules, CA). The membranes were probed with
primary antibodies followed by horseradish peroxidase-conjugated secondary antibodies and
visualized using the SuperSignal Femto Chemiluminescent Substrate (Pierce Biotechnology,
Rockford, IL). Antibodies used were against cyclin D1 (1:500; Cell signaling Technology,
Beverly, MA) and β-tubulin (1:1,000; Cell signaling Technology, Beverly, MA). Protein
quantification was assessed by band densitometry measurement using ImageJ software
(Research Services Branch, National Institute of Mental Health, Bethesda, MD) and presented
as cyclin D1 expression relative to that of β-tubulin.
Statistical analysis
Kendall’s rank correlation coefficient (τ, tau) was used to determine the strength of
relationship between variables on ordinal scales. Fisher’s exact test was used to test
differences in proportions, and Mann-Whitney U test for comparisons of ordinal variables.
Disease-specific survival was calculated according to the Kaplan-Meier method, censoring at
the time of death patients who died from reasons other than small bowel carcinoid tumor or
when the cause of death could not be established. The log-rank test was used to test
differences between the survival curves of subgroups. After confirming the proportional
hazards assumption, multivariable Cox proportional hazards regression was used to assess the
Research. on May 20, 2020. © 2012 American Association for Cancerclincancerres.aacrjournals.org Downloaded from
Author manuscripts have been peer reviewed and accepted for publication but have not yet been edited. Author Manuscript Published OnlineFirst on May 2, 2012; DOI: 10.1158/1078-0432.CCR-11-2513
11
independent influence of CART score on disease-specific survival adjusted for patient age,
disease stage and histopathological grade. Differences in in vitro cell viability and protein
expression were tested using one-way ANOVA, followed by Dunnet’s multiple comparison
test. All statistical analyses were performed using Statistica 9.1 (StatSoft, Tulsa, OK). All
tests were two-tailed and P-values < 0.05 were considered statistically significant.
Results
Tumor specimens
One-hundred and thirty-one specimens from the 97 patients were analyzed; 79 of them were
from primary tumors at the time of diagnosis. In 54 patients specimens were available only
from the primary tumors, in 20 patients from both primary tumors and mesenteric metastases,
in 5 patients from both primary tumors and distant metastases, and in 2 patients from primary
tumors, mesenteric as well as distant metastases. In 10 patients specimens were available only
from mesenteric metastases, in 3 patients only from distant metastases, and in 3 patients from
both mesenteric and distant metastases. Specimens retrieved within the first year after
diagnosis were available from all but 4 patients.
CART immunoreactivity and association with prognostic factors
CART immunoreactive cells were found in the majority of specimens, but with wide
variations between different areas of the same tumor, in accordance with our previous
observations (17). As expected in small bowel carcinoids, the predominating tumor growth
pattern was the insular – with rounded nests of densely packed tumor cells and typical
peripheral palisading (27). CART IR was often higher in these peripheral cells of the insular
nests, and also higher in nests closer to the mucosa (Fig. 2A). Areas with trabecular,
Research. on May 20, 2020. © 2012 American Association for Cancerclincancerres.aacrjournals.org Downloaded from
Author manuscripts have been peer reviewed and accepted for publication but have not yet been edited. Author Manuscript Published OnlineFirst on May 2, 2012; DOI: 10.1158/1078-0432.CCR-11-2513
12
glandular, and solid (Fig. 2C) growth patterns were seen in some tumors (28, 29). Typical
cord-like arrangement of tumor cells was seen in areas of deeper local invasion, and CART
was often abundant in such chords (Fig. 2B).
Specimens from both primary tumors and metastases from the time of diagnosis were
available in 27 patients. With the null hypothesis of no relationship between CART IR levels
in the primary tumors and the corresponding metastases, Kendall´s τ was 0.453 (P = 0.013)
indicating a fair correlation. Consequently, the proportion of CART IR cells in the metastases
was used for those 16 patients where specimens from the primary tumor were unavailable.
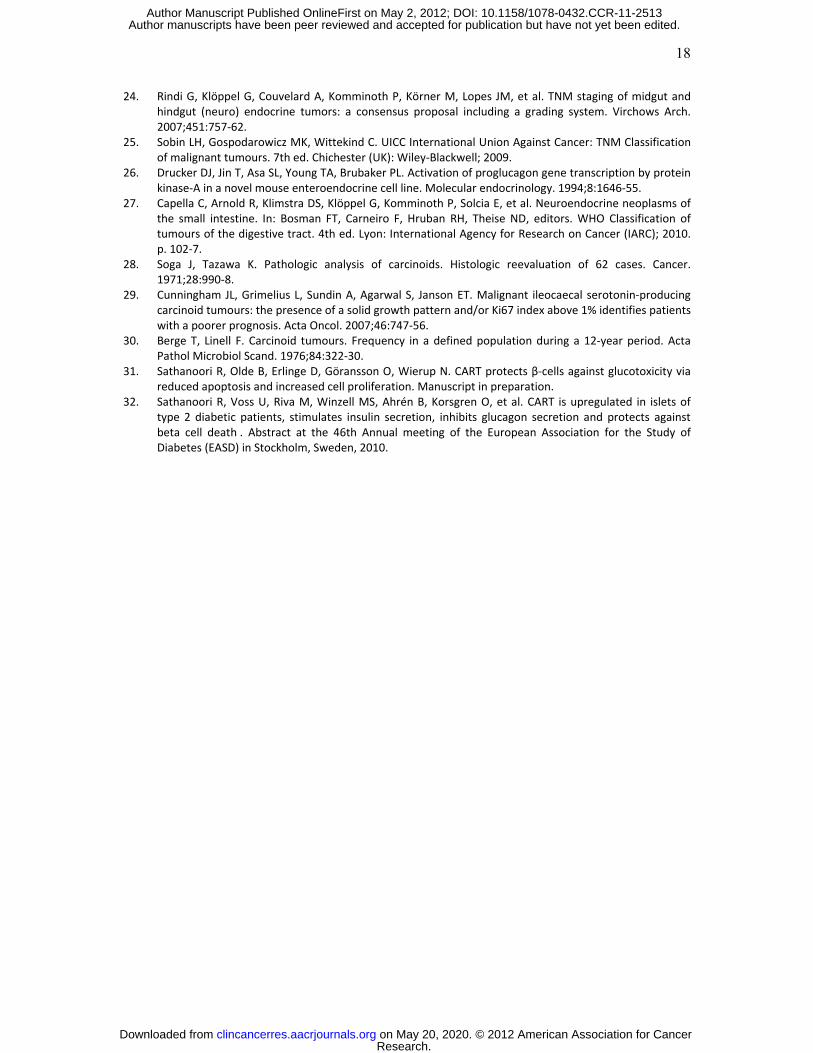
Some level of CART IR was detected in 81 of 97 patients (84%). Table 1 shows the
distribution of CART IR, patient age, disease stage, and tumor grade. There was no
statistically significant association between the presence of CART (CART 0/+) on the one
hand, and patient age, disease stage, or histopathological grade on the other. Neither was
CART score associated with any of the other tumor characteristics.
Association between CART and symptoms
Since CART is a regulator of food intake and body weight (10, 11), we next addressed
whether the degree of CART expression was associated with cachexia, observed in 18
patients at diagnosis. However, no association was found between CART 0/+ (P = 1.000) or
CART score (P = 0.923) and pronounced weight loss at presentation. Neither was CART
expression associated with any other presenting symptom including flush (n = 7), diarrhea
(n = 19), bowel obstruction (n = 31), abdominal pain (n = 44), or GI hemorrhage (n = 12).
Research. on May 20, 2020. © 2012 American Association for Cancerclincancerres.aacrjournals.org Downloaded from
Author manuscripts have been peer reviewed and accepted for publication but have not yet been edited. Author Manuscript Published OnlineFirst on May 2, 2012; DOI: 10.1158/1078-0432.CCR-11-2513
13
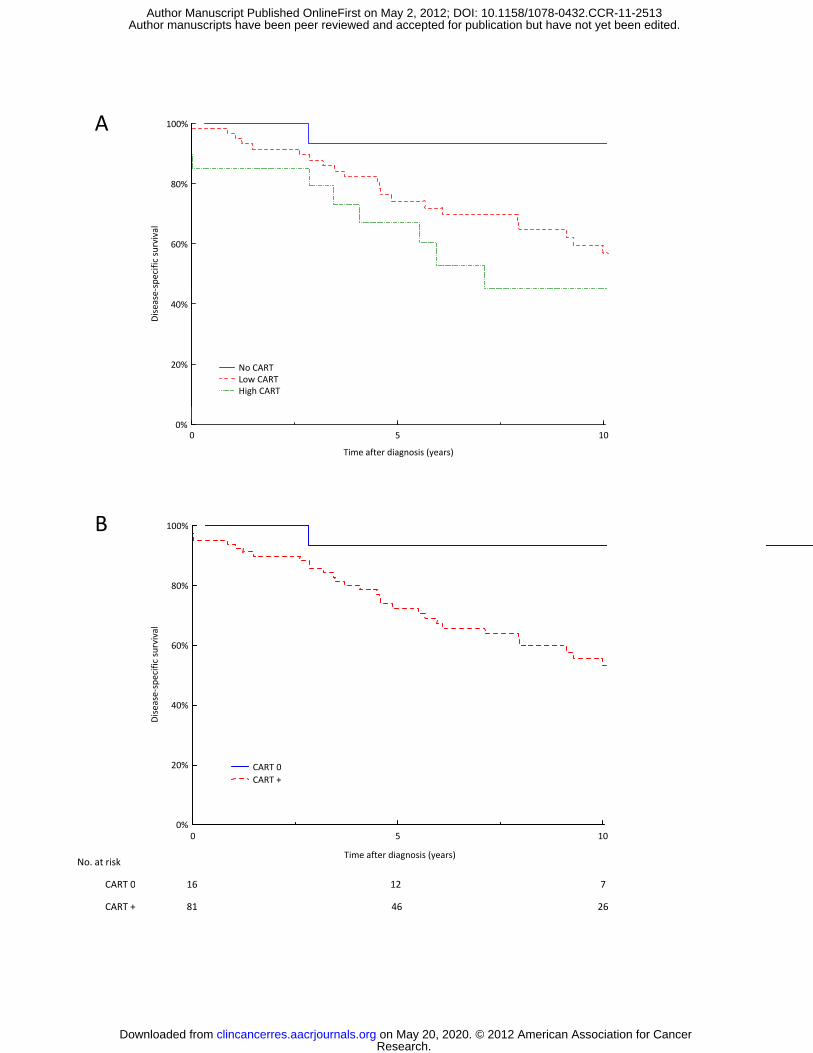
Survival
Comparing disease-specific survival between patients of the three CART score tiers using the
Kaplan-Meier method, increasing CART score was associated with worse survival
(P = 0.033) (Fig. 3A). Comparing tumors with and tumors without CART IR (CART 0/+)
gave a similar result, CART-containing tumors were associated with worse survival
(P = 0.011) (Fig. 3B).
When the analysis was confined to the 79 patients with specimens available from the primary
tumors at the time of diagnosis, the result was similar with worse survival for patients with
CART-containing tumors (P = 0.039). Excluding the five patients that died within 30 days
after diagnosis, the difference was still statistically significant (P = 0.020). Excluding the 16
patients, in whom the tumors were detected en passant, the difference was also significant
(P = 0.023). Limiting the analysis to the 79 patients with regional or distant metastases, those
with CART present in the tumor similarly had a shorter survival (P = 0.020).
Adjusting for age, disease stage, and histopathological grade in multivariable Cox
proportional hazards regression, the hazard ratio (HR) compared to No CART was 5.47 (95%
confidence interval (CI) 0.71 to 42.46) for Low CART, and HR 9.44 (95% CI 1.14 to 78.14)
for High CART (Table 2).
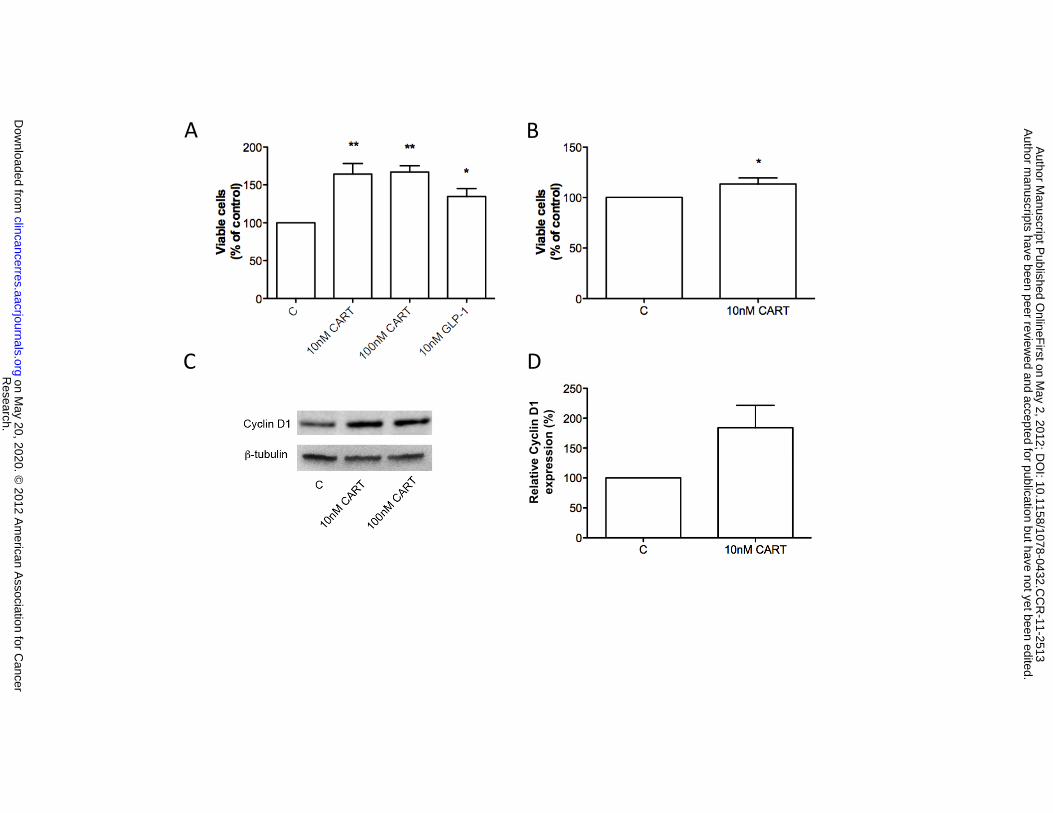
CART enhances tumor cell viability in vitro
Since our clinical data revealed that presence of CART in tumors is associated with increased
mortality, we hypothesized that CART promotes tumor cell viability. To test this we cultured
GLUTag cells (murine enteroendocrine cancer cell line) in the presence of 10 and 100nM of
CART 54-102 peptide, and found that both doses of CART significantly increased cell
Research. on May 20, 2020. © 2012 American Association for Cancerclincancerres.aacrjournals.org Downloaded from
Author manuscripts have been peer reviewed and accepted for publication but have not yet been edited. Author Manuscript Published OnlineFirst on May 2, 2012; DOI: 10.1158/1078-0432.CCR-11-2513
14
viability (163% and 167% compared to control, respectively; P < 0.01; data from six
experiments run in quadruplicate) (Fig. 4A). In fact, the effect of CART was even stronger
than that of 10nM GLP-1 used as positive control (135% compared to control: P < 0.05;
n = 5). The effect of CART on cell proliferation was confirmed by Western blot for
cyclin D1. There was a trend for increased cyclin D1 protein expression in CART-treated
GLUTag cells (mean 184%; range 116-327%; P = 0.06; n = 5) (Fig. 4C, D). Next, we
repeated the viability experiments in the human colon cancer cell line HCT-116 using the
lowest effective dose 10nM of CART peptide. In line with the data obtained in GLUTag cells,
CART provoked a moderate, but significant augmentation of viability also in HCT-116 cells
(114% compared to control; P < 0.05; n = 8) (Fig. 4B).
Discussion
This study is the first to report worse survival for patients with CART-expressing tumors, as
examined in small bowel carcinoid tumors. In support of this, we also found that CART
increases tumor cell viability in vitro.
The present results confirm our recent finding that CART is expressed in small bowel
carcinoid tumor cells (17). The distribution of the CART score was similar to this previous
study, although a somewhat modified classification of CART IR was used. A main finding of
the present study was that tumors with any level of CART expression were associated with
worse disease-specific survival. In addition, we found that increasing levels of CART IR was
associated with worse survival.
Research. on May 20, 2020. © 2012 American Association for Cancerclincancerres.aacrjournals.org Downloaded from
Author manuscripts have been peer reviewed and accepted for publication but have not yet been edited. Author Manuscript Published OnlineFirst on May 2, 2012; DOI: 10.1158/1078-0432.CCR-11-2513

15
Patients with localized small bowel carcinoid tumors have a far better prognosis than those
with metastases, as previously established (20, 22). It was therefore intriguing that the
majority of localized tumors contained CART-expressing cells when CART tumor expression
is associated with worse survival. One tentative explanation could be that the localized tumors
were removed before they had become metastatic. It is known from an autopsy study that
most small bowel carcinoids remain localized and asymptomatic throughout the patients’
lives, thereby escaping detection (30). The localized tumors in the present study were likely
biologically different, since they were diagnosed ante mortem – ten of them because of the
symptoms they caused (six GI hemorrhage and four bowel obstruction), and eight incidentally
during surgery for other reasons. Thus, it is possible that the localized CART-expressing
carcinoid tumors of the present study were intrinsically malignant but removed in time
because they were, at the same time, more prone to cause symptoms. However, a separate
survival analysis was performed for patients with metastases, also showing worse survival in
patients with CART-containing tumors.
The second aim of the study was to assess associations between CART and patient age,
disease stage, and histopathological grade. No such association was evident. Adjusting for
these established prognostic factors in multivariable analysis, presence of CART was still
associated with an increased hazard ratio.
The third aim was to assess whether presence of CART was associated with clinical
symptoms. Of particular interest were hormonal symptoms such as flush, diarrhea, and above
all weight loss, bearing in mind the physiological functions of CART – regulating hormone
secretion and inhibiting appetite. However, there were no tendencies for any associations
between CART expression and any hormonal or other symptom.
Research. on May 20, 2020. © 2012 American Association for Cancerclincancerres.aacrjournals.org Downloaded from
Author manuscripts have been peer reviewed and accepted for publication but have not yet been edited. Author Manuscript Published OnlineFirst on May 2, 2012; DOI: 10.1158/1078-0432.CCR-11-2513
16
We also found that CART peptide in vitro caused a significant increase in viability of
GLUTag and HCT-116 cells. These data are in agreement with our previous observations that
CART is crucial for regulation of pancreatic islet β-cell viability, both by reducing apoptosis
and by increasing proliferation (31, 32).
Supported by our present clinical data, the increased GLUTag and HCT-116 cell viability
suggests that CART expressed in tumors promotes cell survival via enhanced proliferation.
The mechanisms leading to increased viability remains to be established, and further studies
are needed to evaluate the potential for CART as a potential treatment target in NETs.
Interesting in this context is that Bech et al. found higher levels of circulating CART in
patients with progressive NET disease (18).
In conclusion, the present study demonstrates that CART expression in small bowel carcinoid
tumors is associated with worse survival.
Acknowledgements
Linda Johansson, Jeanette Karlsmo, Barbro Nilsson, Doris Persson, and Ann-Helen Thorén-
Fischer are acknowledged for excellent technical assistance.
Grant support
This work was supported by Futurum – Academy of Healthcare at Jönköping County Council,
the Foundation for Clinical Cancer Research in Jönköping, the Swedish Research Council
(Projects No. 522-2008-4216, K2009-55X 21111-01-4, K2007-55X-04499-33-3), Faculty of
Medicine at Lund University, the Novo Nordisk, Gyllenstiernska Krapperup, Fredrik and
Ingrid Thuring, Magnus Bergwall, Crafoord and Albert Påhlsson Foundations.
Research. on May 20, 2020. © 2012 American Association for Cancerclincancerres.aacrjournals.org Downloaded from
Author manuscripts have been peer reviewed and accepted for publication but have not yet been edited. Author Manuscript Published OnlineFirst on May 2, 2012; DOI: 10.1158/1078-0432.CCR-11-2513
17
References
1. Douglass J, McKinzie AA, Couceyro P. PCR differential display identifies a rat brain mRNA that is transcriptionally regulated by cocaine and amphetamine. J Neurosci. 1995;15:2471-81.
2. Jensen PB, Kristensen P, Clausen JT, Judge ME, Hastrup S, Thim L, et al. The hypothalamic satiety peptide CART is expressed in anorectic and non-anorectic pancreatic islet tumors and in the normal islet of Langerhans. FEBS Lett. 1999;447:139-43.
3. Wierup N, Sundler F. CART is a novel islet regulatory peptide. Peptides. 2006;27:2031-6. 4. Wierup N, Kuhar M, Nilsson BO, Mulder H, Ekblad E, Sundler F. Cocaine- and amphetamine-regulated
transcript (CART) is expressed in several islet cell types during rat development. J Histochem Cytochem. 2004;52:169-77.
5. Ekblad E, Kuhar M, Wierup N, Sundler F. Cocaine- and amphetamine-regulated transcript: distribution and function in rat gastrointestinal tract. Neurogastroenterol Motil. 2003;15:545-57.
6. Wierup N, Kask L, Sörhede-Winzel M, Kuhar M, Ahrén B, Sundler F. CART is a regulator of islet function and a possible incretin hormone. Abstract at the Islet and beta cell biology meeting in Snowbird, Utah, 2008.
7. Wierup N, Gunnarsdóttir A, Ekblad E, Sundler F. Characterisation of CART-containing neurons and cells in the porcine pancreas, gastro-intestinal tract, adrenal and thyroid glands. BMC Neurosci. 2007;8:51.
8. Dun SL, Brailoiu GC, Yang J, Chang JK, Dun NJ. Cocaine- and amphetamine-regulated transcript peptide and sympatho-adrenal axis. Peptides. 2006;27:1949-55.
9. Kuhar MJ, Dall Vechia SE. CART peptides: novel addiction- and feeding-related neuropeptides. Trends Neurosci. 1999;22:316-20.
10. Rogge G, Jones D, Hubert GW, Lin Y, Kuhar MJ. CART peptides: regulators of body weight, reward and other functions. Nat Rev Neurosci. 2008;9:747-58.
11. Hunter RG, Philpot K, Vicentic A, Dominguez G, Hubert GW, Kuhar MJ. CART in feeding and obesity. Trends Endocrinol Metab. 2004;15:454-9.
12. Asnicar MA, Smith DP, Yang DD, Heiman ML, Fox N, Chen YF, et al. Absence of cocaine- and amphetamine-regulated transcript results in obesity in mice fed a high caloric diet. Endocrinology. 2001;142:4394-400.
13. Wierup N, Richards WG, Bannon AW, Kuhar MJ, Ahrén B, Sundler F. CART knock out mice have impaired insulin secretion and glucose intolerance, altered beta cell morphology and increased body weight. Regulatory peptides. 2005;129:203-11.
14. del Giudice EM, Santoro N, Cirillo G, D’Urso L, Di Toro R, Perrone L. Mutational screening of the CART gene in obese children: identifying a mutation (Leu34Phe) associated with reduced resting energy expenditure and cosegregating with obesity phenotype in a large family. Diabetes. 2001;50:2157-60.
15. Wierup N, Björkqvist M, Kuhar MJ, Mulder H, Sundler F. CART regulates islet hormone secretion and is expressed in the β-cells of type 2 diabetic rats. Diabetes. 2006;55:305-11.
16. Ekblad E. CART in the enteric nervous system. Peptides. 2006;27:2024-30. 17. Landerholm K, Falkmer SE, Järhult J, Sundler F, Wierup N. Cocaine- and amphetamine-regulated
transcript in neuroendocrine tumors. Neuroendocrinology. 2011;94:228-36. 18. Bech P, Winstanley V, Murphy KG, Sam AH, Meeran K, Ghatei MA, et al. Elevated cocaine- and
amphetamine-regulated transcript immunoreactivity in the circulation of patients with neuroendocrine malignancy. J Clin Endocrinol Metab. 2008;93:1246-53.
19. Landerholm K, Falkmer S, Järhult J. Epidemiology of small bowel carcinoids in a defined population. World J Surg. 2010;34:1500-5.
20. Landerholm K, Zar N, Andersson RE, Falkmer SE, Järhult J. Survival and prognostic factors in patients with small bowel carcinoid tumour. Br J Surg. 2011;98:1617-24..
21. Rindi G, Arnold R, Bosman FT, Capella C, Klimstra DS, Klöppel G, et al. Nomenclature and classification of neuroendocrine neoplasms of the digestive system. In: Bosman FT, Carneiro F, Hruban RH, Theise ND, editors. WHO Classification of tumours of the digestive system. 4th ed. Lyon: International Agency for Research on Cancer (IARC); 2010. p. 13-4.
22. Modlin IM, Champaneria MC, Chan AK, Kidd M. A three-decade analysis of 3,911 small intestinal neuroendocrine tumors: the rapid pace of no progress. Am J Gastroenterol. 2007;102:1464-73.
23. Onaitis MW, Kirshbom PM, Hayward TZ, Quayle FJ, Feldman JM, Seigler HF, et al. Gastrointestinal carcinoids: characterization by site of origin and hormone production. Annals of surgery. 2000;232:549-56.
Research. on May 20, 2020. © 2012 American Association for Cancerclincancerres.aacrjournals.org Downloaded from
Author manuscripts have been peer reviewed and accepted for publication but have not yet been edited. Author Manuscript Published OnlineFirst on May 2, 2012; DOI: 10.1158/1078-0432.CCR-11-2513
18
24. Rindi G, Klöppel G, Couvelard A, Komminoth P, Körner M, Lopes JM, et al. TNM staging of midgut and hindgut (neuro) endocrine tumors: a consensus proposal including a grading system. Virchows Arch. 2007;451:757-62.
25. Sobin LH, Gospodarowicz MK, Wittekind C. UICC International Union Against Cancer: TNM Classification of malignant tumours. 7th ed. Chichester (UK): Wiley-Blackwell; 2009.
26. Drucker DJ, Jin T, Asa SL, Young TA, Brubaker PL. Activation of proglucagon gene transcription by protein kinase-A in a novel mouse enteroendocrine cell line. Molecular endocrinology. 1994;8:1646-55.
27. Capella C, Arnold R, Klimstra DS, Klöppel G, Komminoth P, Solcia E, et al. Neuroendocrine neoplasms of the small intestine. In: Bosman FT, Carneiro F, Hruban RH, Theise ND, editors. WHO Classification of tumours of the digestive tract. 4th ed. Lyon: International Agency for Research on Cancer (IARC); 2010. p. 102-7.
28. Soga J, Tazawa K. Pathologic analysis of carcinoids. Histologic reevaluation of 62 cases. Cancer. 1971;28:990-8.
29. Cunningham JL, Grimelius L, Sundin A, Agarwal S, Janson ET. Malignant ileocaecal serotonin-producing carcinoid tumours: the presence of a solid growth pattern and/or Ki67 index above 1% identifies patients with a poorer prognosis. Acta Oncol. 2007;46:747-56.
30. Berge T, Linell F. Carcinoid tumours. Frequency in a defined population during a 12-year period. Acta Pathol Microbiol Scand. 1976;84:322-30.
31. Sathanoori R, Olde B, Erlinge D, Göransson O, Wierup N. CART protects β-cells against glucotoxicity via reduced apoptosis and increased cell proliferation. Manuscript in preparation.
32. Sathanoori R, Voss U, Riva M, Winzell MS, Ahrén B, Korsgren O, et al. CART is upregulated in islets of type 2 diabetic patients, stimulates insulin secretion, inhibits glucagon secretion and protects against beta cell death . Abstract at the 46th Annual meeting of the European Association for the Study of Diabetes (EASD) in Stockholm, Sweden, 2010.
Research. on May 20, 2020. © 2012 American Association for Cancerclincancerres.aacrjournals.org Downloaded from
Author manuscripts have been peer reviewed and accepted for publication but have not yet been edited. Author Manuscript Published OnlineFirst on May 2, 2012; DOI: 10.1158/1078-0432.CCR-11-2513
Table 1. CART score and tumor characteristics
Localized
Regional
metastases
Distant
metastases
(I-IIB) (IIIA-IIIB) (IV)
No CART 16 (16) 72 (58, 81) 3 11 2 16 0
Low CART 61 (63) 67 (59, 75) 10 31 20 51 10
High CART 20 (21) 74 (68, 81) 5 10 5 17 3
All 97 (100) 69 (59, 77) 18 (19) 52 (54) 27 (28) 84 (87) 13 (13)
Values in parentheses are percent except for age.
Grade
G1 G2CART score No.
Age (years)
median (IQR)
Stage
Research. on May 20, 2020. © 2012 American Association for Cancerclincancerres.aacrjournals.org Downloaded from
Author manuscripts have been peer reviewed and accepted for publication but have not yet been edited. Author Manuscript Published OnlineFirst on May 2, 2012; DOI: 10.1158/1078-0432.CCR-11-2513
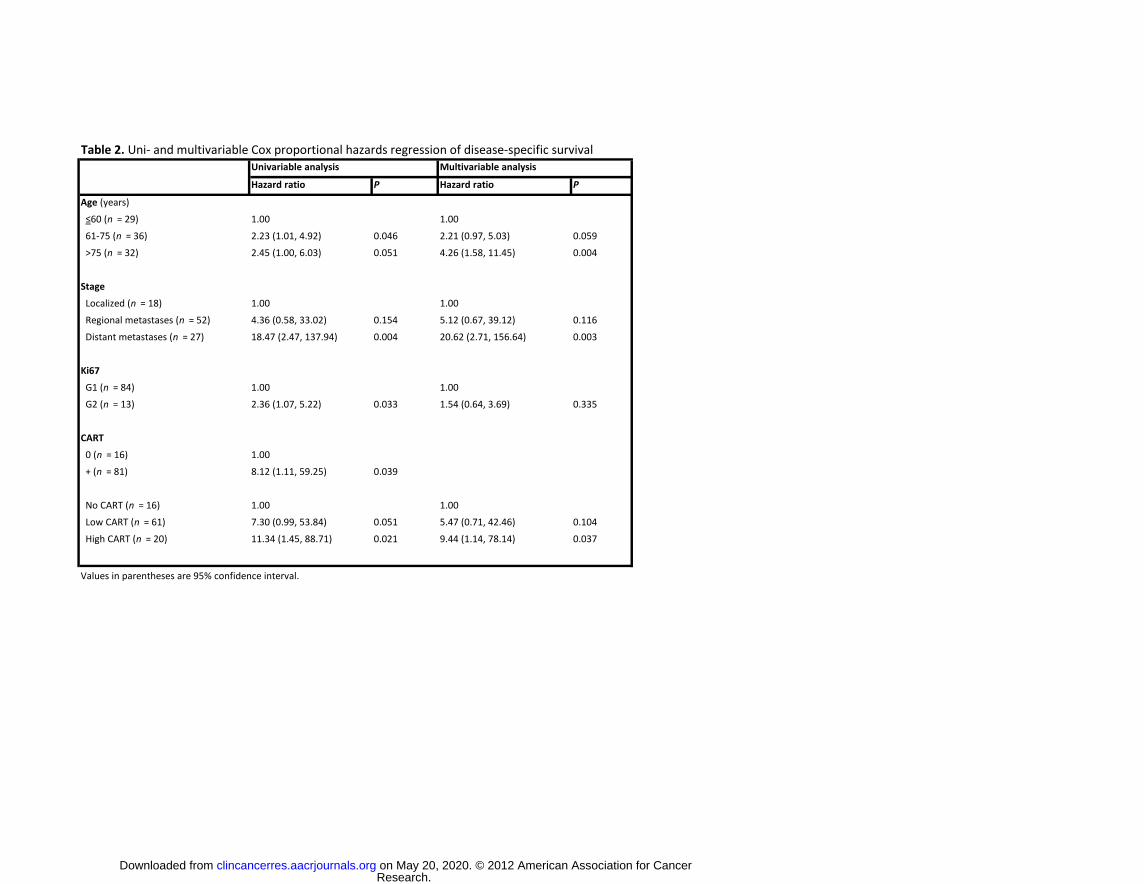
Table 2. Uni- and multivariable Cox proportional hazards regression of disease-specific survival
Hazard ratio P Hazard ratio P
Age (years)
≤60 (n = 29) 1.00 1.00
61-75 (n = 36) 2.23 (1.01, 4.92) 0.046 2.21 (0.97, 5.03) 0.059
>75 (n = 32) 2.45 (1.00, 6.03) 0.051 4.26 (1.58, 11.45) 0.004
Stage
Localized (n = 18) 1.00 1.00
Regional metastases (n = 52) 4.36 (0.58, 33.02) 0.154 5.12 (0.67, 39.12) 0.116
Distant metastases (n = 27) 18.47 (2.47, 137.94) 0.004 20.62 (2.71, 156.64) 0.003
Ki67
G1 (n = 84) 1.00 1.00
G2 (n = 13) 2.36 (1.07, 5.22) 0.033 1.54 (0.64, 3.69) 0.335
CART
0 (n = 16) 1.00
+ (n = 81) 8.12 (1.11, 59.25) 0.039
No CART (n = 16) 1.00 1.00
Low CART (n = 61) 7.30 (0.99, 53.84) 0.051 5.47 (0.71, 42.46) 0.104
High CART (n = 20) 11.34 (1.45, 88.71) 0.021 9.44 (1.14, 78.14) 0.037
Values in parentheses are 95% confidence interval.
Univariable analysis Multivariable analysis
Research. on May 20, 2020. © 2012 American Association for Cancerclincancerres.aacrjournals.org Downloaded from
Author manuscripts have been peer reviewed and accepted for publication but have not yet been edited. Author Manuscript Published OnlineFirst on May 2, 2012; DOI: 10.1158/1078-0432.CCR-11-2513
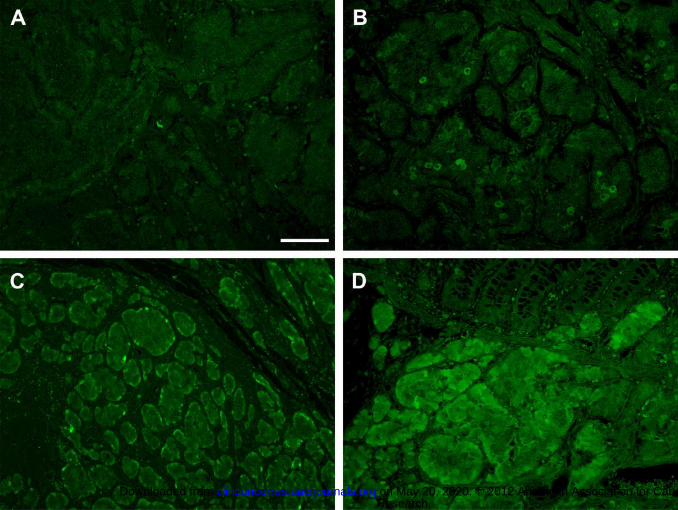
Fig 1. Illustration of CART immunoreactivity grades used to establish the CART score, grade 0 not shown. Areas
with 1-10 cells per visual field in 25x objective were grade 1 (A), areas with 10-100 cells were grade 2 (B), areas
with 100-1000 cells were grade 3 (C), and areas with more than 1000 cells were grade 4 (D).
Scale bar = 100 μm.
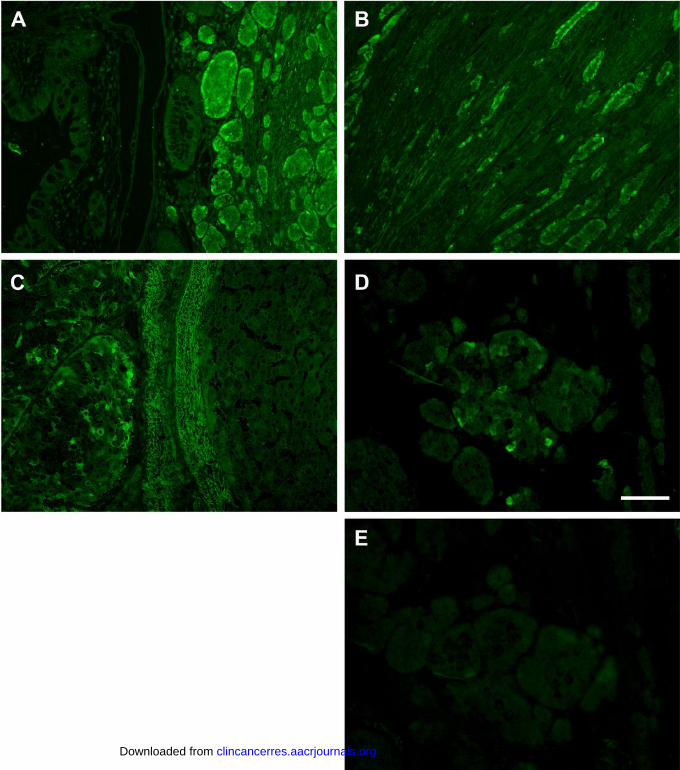
Fig 2. Illustration of abundant CART immunoreactivity (IR) and distinct tumor growth patterns. A: Insular
growth with rounded nests and peripheral palisading, frequently with more abundant CART IR close to the
mucosa. B: CART IR was often high in areas of deep local invasion, where carcinoid tumor cells typically are
oriented into chords and files, exemplified in connective tissue. C: Liver metastasis with solid growth pattern
and CART IR tumor cells to the left, normal hepatocytes to the right. D: CART IR tumor cells invading muscle
layers. E: Negative control staining without primary CART antibodies of the same area as in D in a consecutive
section. Scale bar = 100 μm.
Fig 3. Disease-specific survival by A CART score, P = 0.033 (logrank); and B CART 0/+, P = 0.011 (logrank).
Fig 4. Effect of CART on tumor cell line viability and proliferation. A: GLUTag cell viability presented as % of
viability in control medium (C). GLP-1 was used as positive control. B: HCT-116 cell viability as % of viability in
control medium (C). C: Representative western blot showing that CART treatment increases cell cycle regulator
cyclin D1. D: Quantification of immunoblots from 5 separate experiments. ** P < 0.01 vs. control, * P < 0.05 vs.
control.
Research. on May 20, 2020. © 2012 American Association for Cancerclincancerres.aacrjournals.org Downloaded from
Author manuscripts have been peer reviewed and accepted for publication but have not yet been edited. Author Manuscript Published OnlineFirst on May 2, 2012; DOI: 10.1158/1078-0432.CCR-11-2513
A 100%
60%
80%
spec
ific
surv
ival
20%
40%
Dis
ease
-s
No CART Low CART High CART
100%B
0 5 10
Time after diagnosis (years)
0%
60%
80%
100%
rviv
al
B
20%
40%
60%
Dis
ease
-spe
cific
sur
CART 0
0 5 10
Time after diagnosis (years)
0%
20% CART 0 CART +
No. at risk
CART 0 16 12 7CART 0 16 12 7
CART + 81 46 26
Research. on May 20, 2020. © 2012 American Association for Cancerclincancerres.aacrjournals.org Downloaded from
Author manuscripts have been peer reviewed and accepted for publication but have not yet been edited. Author Manuscript Published OnlineFirst on May 2, 2012; DOI: 10.1158/1078-0432.CCR-11-2513
A B
C DC D
Cyc
linD
1ss
ion
(%)
Rel
ativ
e ex
pre s
Research.
on May 20, 2020. ©
2012 Am
erican Association for C
ancerclincancerres.aacrjournals.org
Dow
nloaded from
Author m
anuscripts have been peer reviewed and accepted for publication but have not yet been edited.
Author M
anuscript Published O
nlineFirst on M
ay 2, 2012; DO
I: 10.1158/1078-0432.CC
R-11-2513
Published OnlineFirst May 2, 2012.Clin Cancer Res Kalle Landerholm, Liliya Shcherbina, Sture Falkmer, et al. Tumorsis Associated with Worse Survival in Small Bowel Carcinoid Expression of Cocaine- and Amphetamine-Regulated Transcript
Updated version
10.1158/1078-0432.CCR-11-2513doi:
Access the most recent version of this article at:
Manuscript
Authoredited. Author manuscripts have been peer reviewed and accepted for publication but have not yet been
E-mail alerts related to this article or journal.Sign up to receive free email-alerts
Subscriptions
Reprints and
To order reprints of this article or to subscribe to the journal, contact the AACR Publications
Permissions
Rightslink site. Click on "Request Permissions" which will take you to the Copyright Clearance Center's (CCC)
.http://clincancerres.aacrjournals.org/content/early/2012/05/02/1078-0432.CCR-11-2513To request permission to re-use all or part of this article, use this link
Research. on May 20, 2020. © 2012 American Association for Cancerclincancerres.aacrjournals.org Downloaded from
Author manuscripts have been peer reviewed and accepted for publication but have not yet been edited. Author Manuscript Published OnlineFirst on May 2, 2012; DOI: 10.1158/1078-0432.CCR-11-2513


![Spatio‐temporal assessment of illicit drug use at large ...[cocaine, cannabis, amphetamine, methamphetamine and methylenedioxymethamphetamine (MDMA)] in raw wastewater [8]. The monitoring](https://img.pdfslide.us/doc/110x75/5e87ef6a7ddc284d9b6428b9/spatioatemporal-assessment-of-illicit-drug-use-at-large-cocaine-cannabis.jpg)