Embed Size (px)
Citation preview
Expression Modules
Brian S. Yandell (with slides from Steve Horvath, UCLA, andMark Keller, UW-Madison)
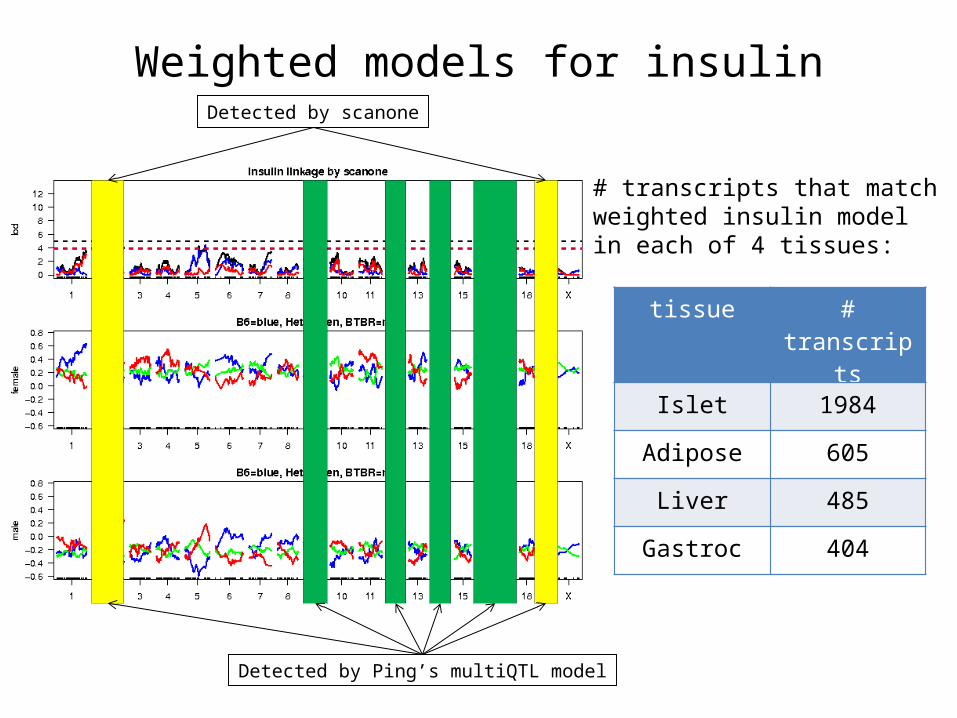
Weighted models for insulinDetected by scanone
Detected by Ping’s multiQTL model
tissue # transcripts
Islet 1984
Adipose 605
Liver 485
Gastroc 404
# transcripts that matchweighted insulin modelin each of 4 tissues:
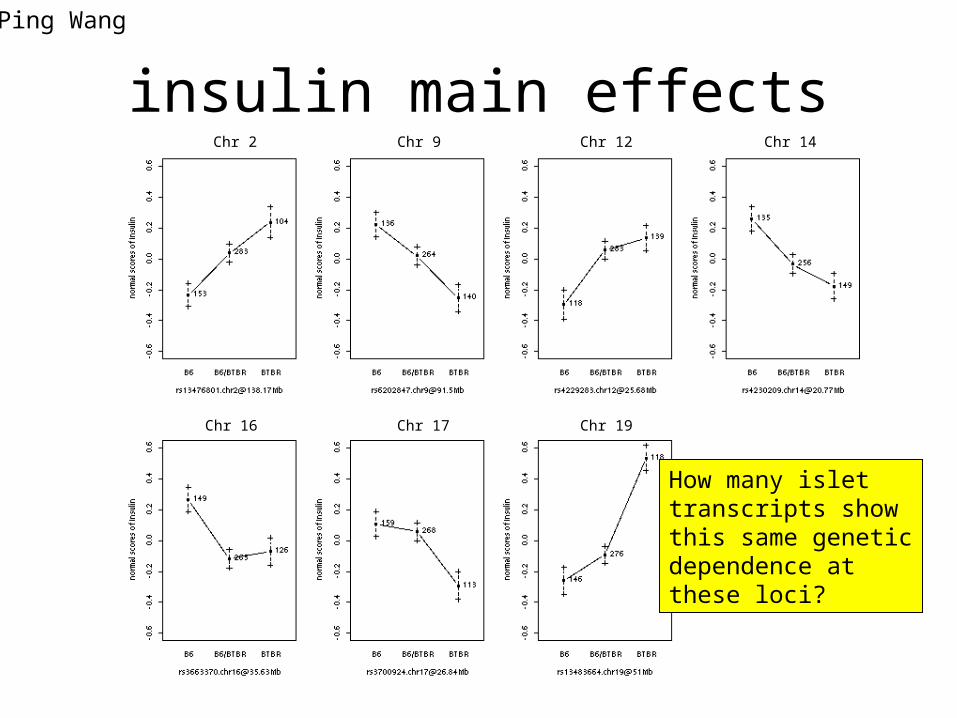
insulin main effectsPing Wang
How many islettranscripts showthis same geneticdependence at these loci?
Chr 9 Chr 12 Chr 14
Chr 16 Chr 17 Chr 19
Chr 2
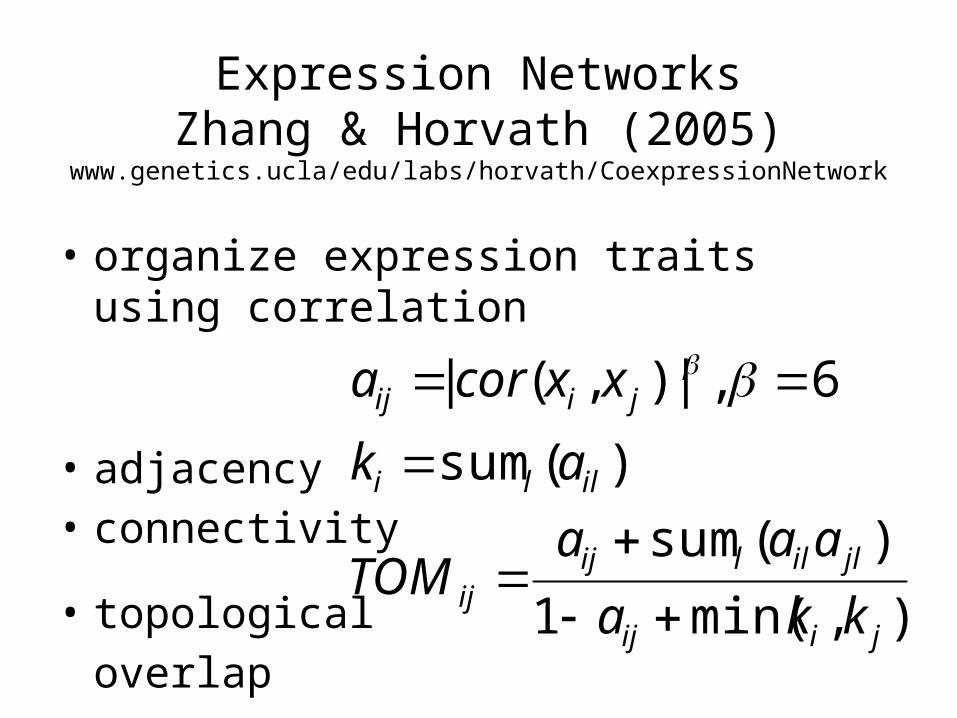
Expression NetworksZhang & Horvath (2005)
www.genetics.ucla/edu/labs/horvath/CoexpressionNetwork
• organize expression traits using correlation
• adjacency• connectivity
• topologicaloverlap ),min(1
)(sum
)(sum
6,|),(|
jiij
jlillijij
illi
jiij
kka
aaaTOM
ak
xxcora
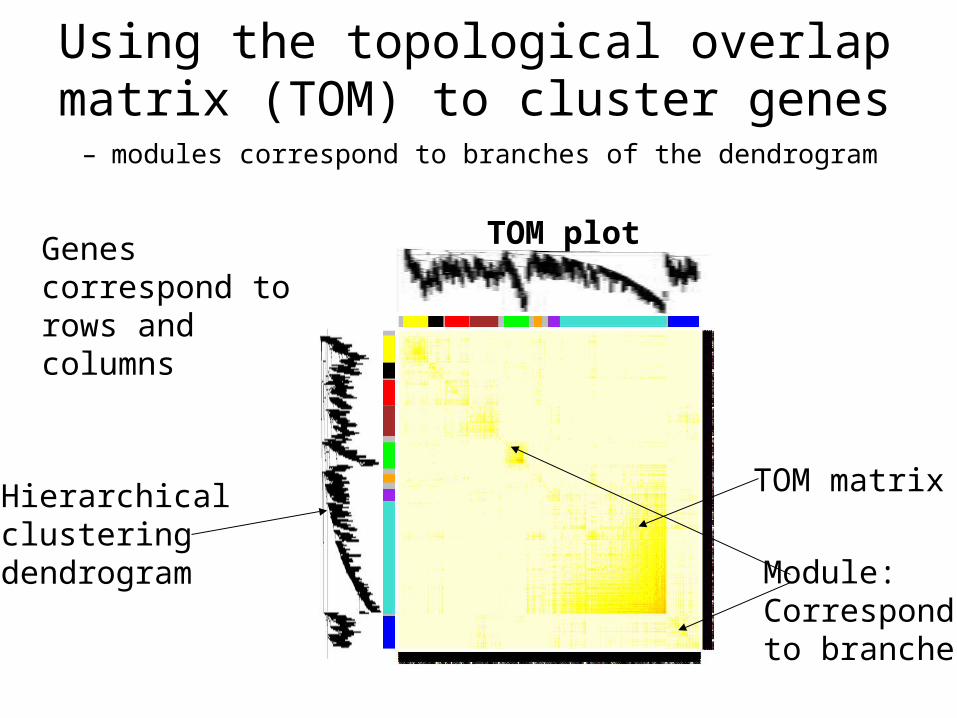
Using the topological overlap matrix (TOM) to cluster genes
– modules correspond to branches of the dendrogram
TOM plot
Hierarchical clustering dendrogram
TOM matrix
Module:Correspond to branches
Genes correspond to rows and columns

module traits highly correlated
• adjacency attenuates correlation• can separate positive, negative correlation• summarize module– eigengene– weighted average of traits
• relate module– to clinical traits– map eigengene
www.genetics.ucla/edu/labs/horvath/CoexpressionNetwork
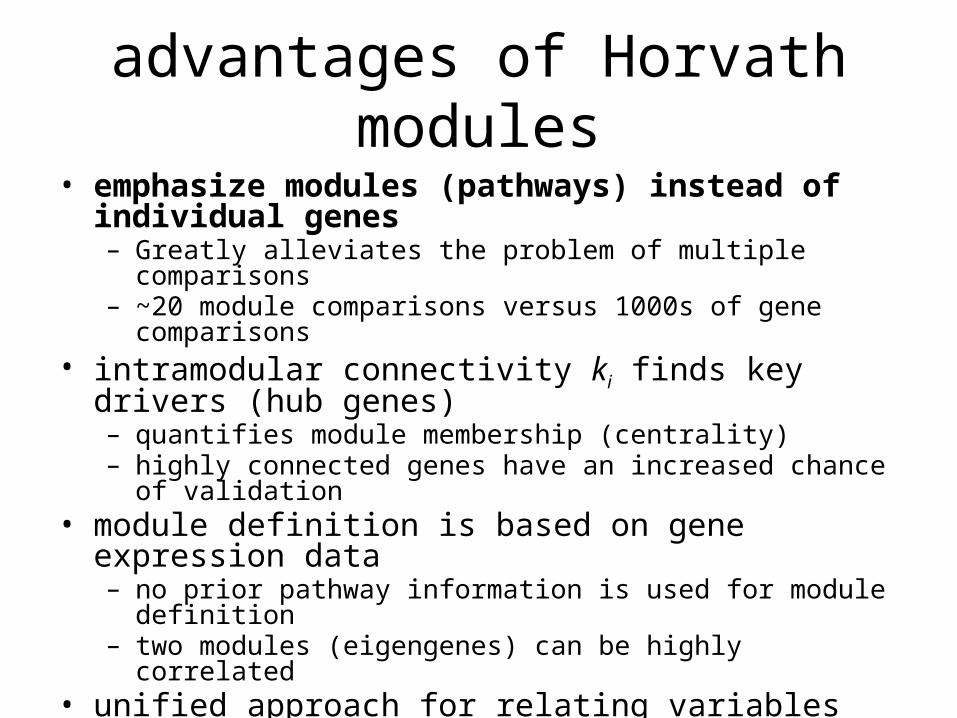
advantages of Horvath modules• emphasize modules (pathways) instead of individual genes
– Greatly alleviates the problem of multiple comparisons– ~20 module comparisons versus 1000s of gene comparisons
• intramodular connectivity ki finds key drivers (hub genes)– quantifies module membership (centrality)– highly connected genes have an increased chance of validation
• module definition is based on gene expression data– no prior pathway information is used for module definition– two modules (eigengenes) can be highly correlated
• unified approach for relating variables– compare data sets on same mathematical footing
• scale-free: zoom in and see similar structure
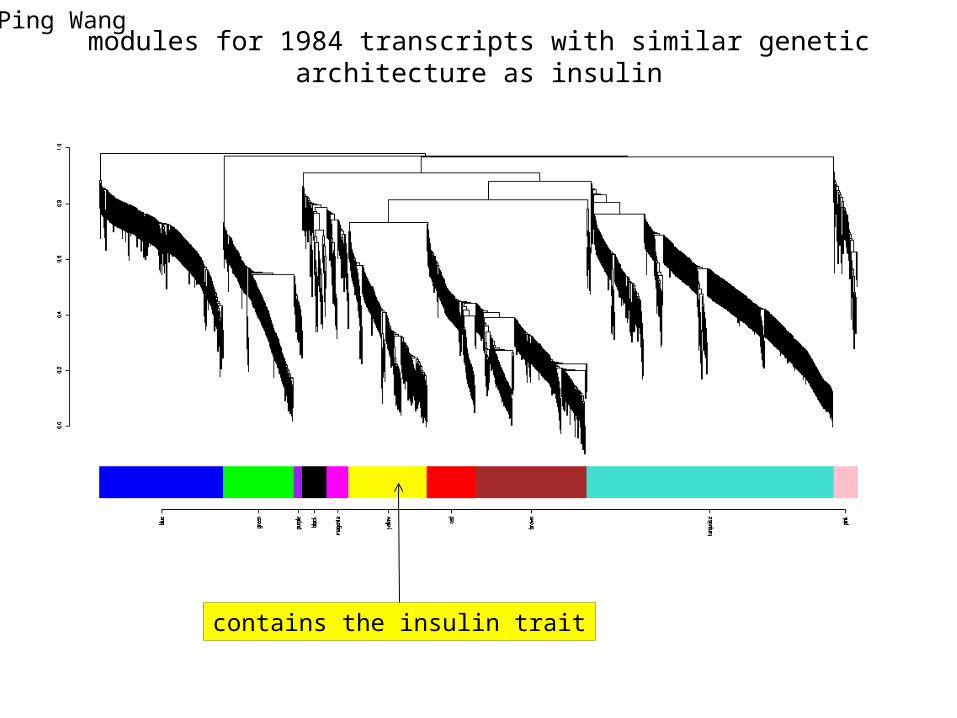
modules for 1984 transcripts with similar genetic architecture as insulin
contains the insulin trait
Ping Wang
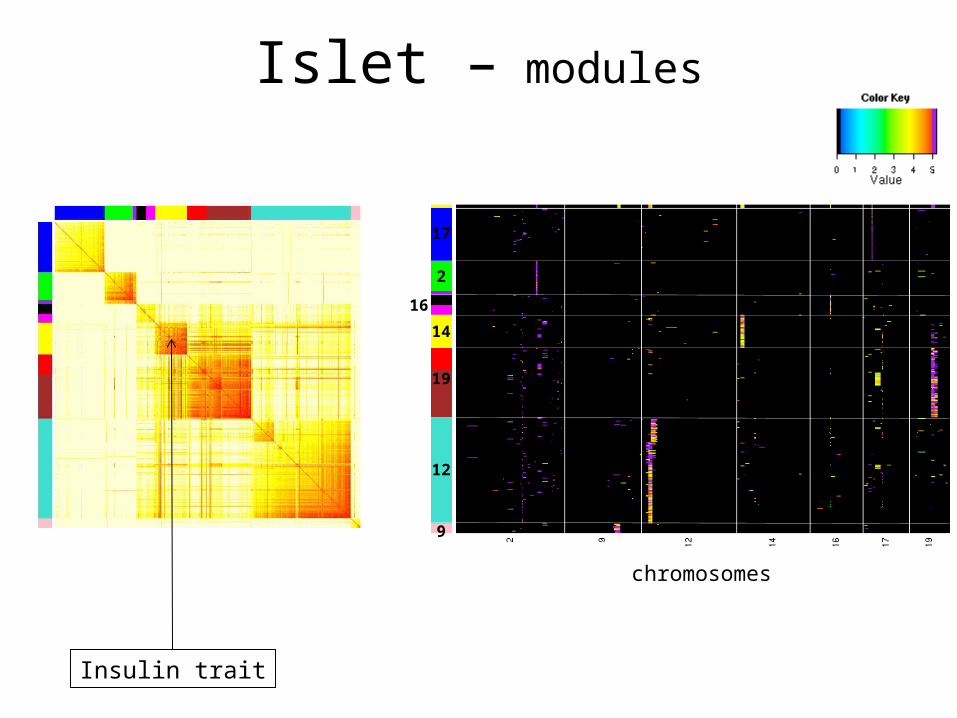
Islet – modules
Insulin trait
chromosomes
17
2
16
14
19
12
9
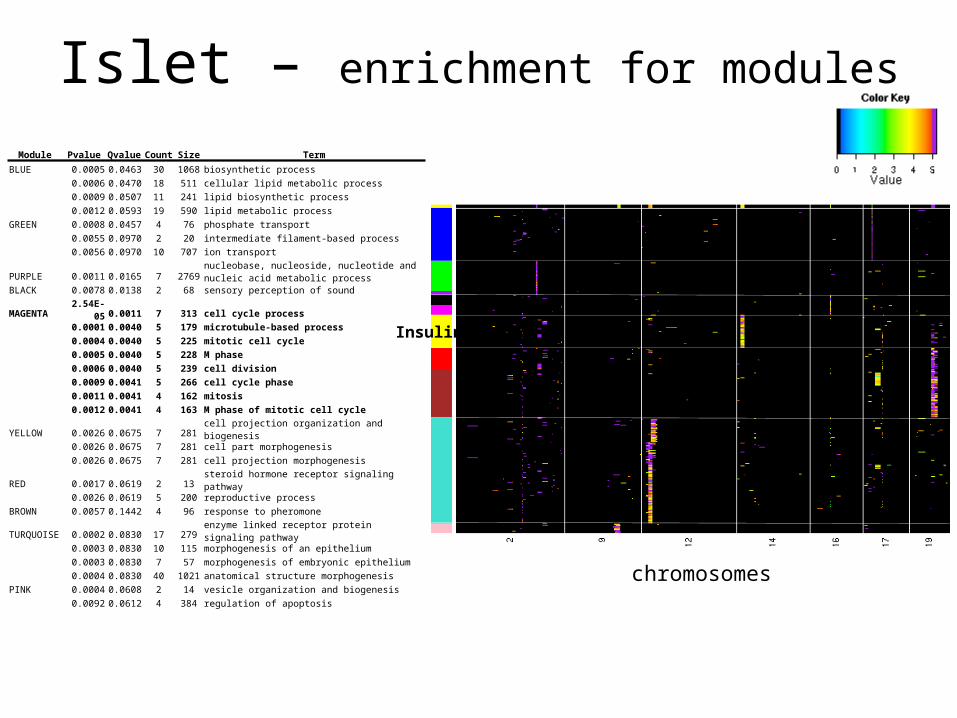
Islet – enrichment for modules
chromosomes
Module Pvalue Qvalue Count Size Term
BLUE 0.0005 0.0463 30 1068 biosynthetic process0.0006 0.0470 18 511 cellular lipid metabolic process0.0009 0.0507 11 241 lipid biosynthetic process0.0012 0.0593 19 590 lipid metabolic process
GREEN 0.0008 0.0457 4 76 phosphate transport0.0055 0.0970 2 20 intermediate filament-based process0.0056 0.0970 10 707 ion transport
PURPLE 0.0011 0.0165 7 2769nucleobase, nucleoside, nucleotide and nucleic acid metabolic process
BLACK 0.0078 0.0138 2 68 sensory perception of soundMAGENTA 2.54E-05 0.0011 7 313 cell cycle process
0.0001 0.0040 5 179 microtubule-based process0.0004 0.0040 5 225 mitotic cell cycle0.0005 0.0040 5 228 M phase0.0006 0.0040 5 239 cell division0.0009 0.0041 5 266 cell cycle phase0.0011 0.0041 4 162 mitosis0.0012 0.0041 4 163 M phase of mitotic cell cycle
YELLOW 0.0026 0.0675 7 281 cell projection organization and biogenesis0.0026 0.0675 7 281 cell part morphogenesis0.0026 0.0675 7 281 cell projection morphogenesis
RED 0.0017 0.0619 2 13 steroid hormone receptor signaling pathway0.0026 0.0619 5 200 reproductive process
BROWN 0.0057 0.1442 4 96 response to pheromoneTURQUOISE 0.0002 0.0830 17 279 enzyme linked receptor protein signaling pathway
0.0003 0.0830 10 115 morphogenesis of an epithelium0.0003 0.0830 7 57 morphogenesis of embryonic epithelium0.0004 0.0830 40 1021 anatomical structure morphogenesis
PINK 0.0004 0.0608 2 14 vesicle organization and biogenesis0.0092 0.0612 4 384 regulation of apoptosis
Insulin
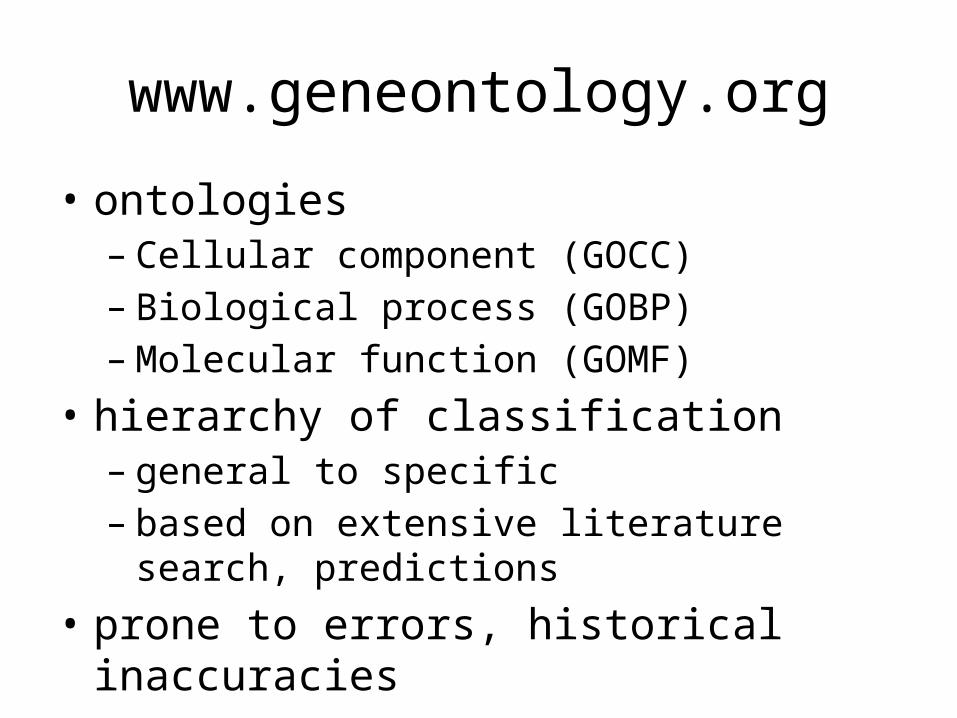
www.geneontology.org
• ontologies– Cellular component (GOCC)– Biological process (GOBP)– Molecular function (GOMF)
• hierarchy of classification– general to specific– based on extensive literature search, predictions
• prone to errors, historical inaccuracies
SISG (c) 2012 Brian S Yandell 12
Bayesian causal phenotype network incorporating genetic variation and biological
knowledge
Brian S Yandell, Jee Young MoonUniversity of Wisconsin-Madison
Elias Chaibub Neto, Sage BionetworksXinwei Deng, VA Tech
Sysgen Biological
SISG (c) 2012 Brian S Yandell 13
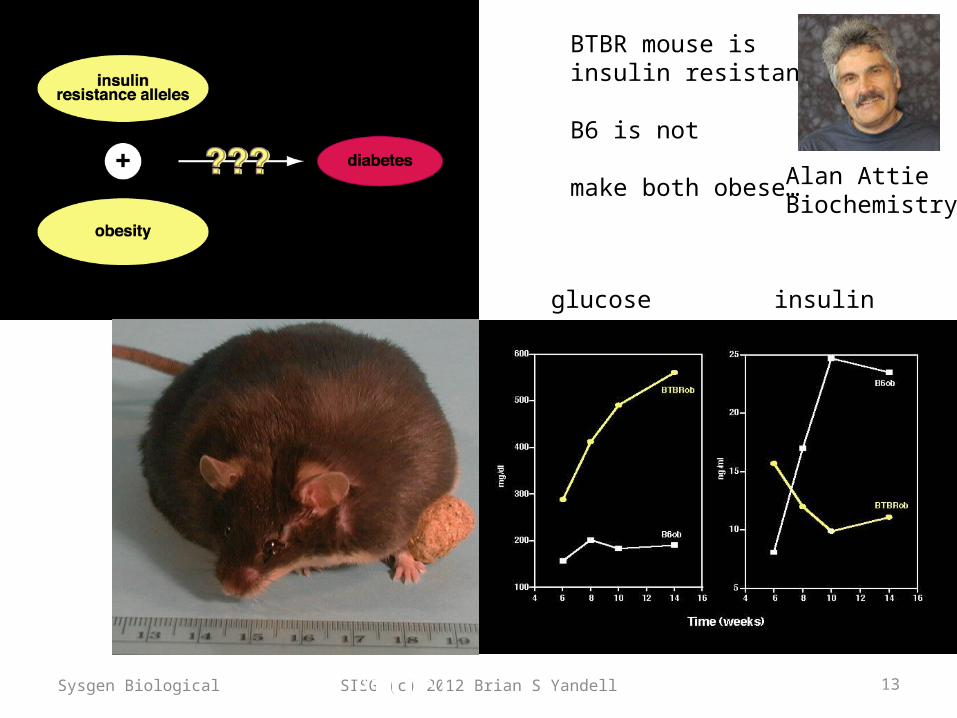
glucose insulin
(courtesy AD Attie)
BTBR mouse isinsulin resistant
B6 is not
make both obese…Alan AttieBiochemistry
Sysgen Biological
SISG (c) 2012 Brian S Yandell 14
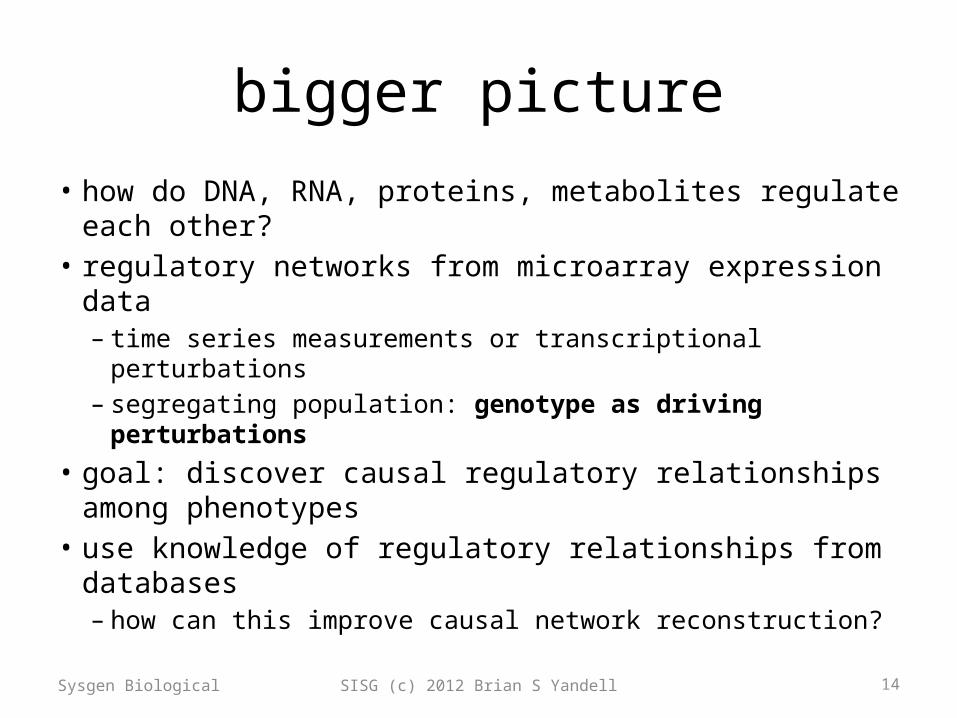
bigger picture
• how do DNA, RNA, proteins, metabolites regulate each other?
• regulatory networks from microarray expression data– time series measurements or transcriptional perturbations– segregating population: genotype as driving perturbations
• goal: discover causal regulatory relationships among phenotypes
• use knowledge of regulatory relationships from databases– how can this improve causal network reconstruction?
Sysgen Biological
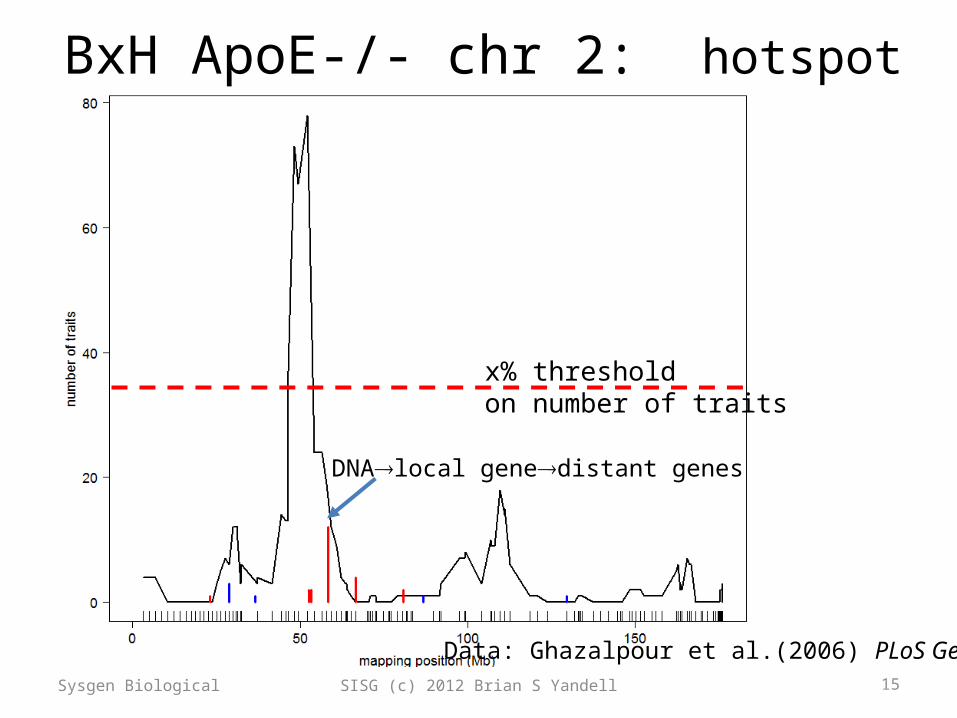
BxH ApoE-/- chr 2: hotspot
15Sysgen Biological SISG (c) 2012 Brian S Yandell
x% thresholdon number of traits
Data: Ghazalpour et al.(2006) PLoS Genetics
DNAlocal genedistant genes
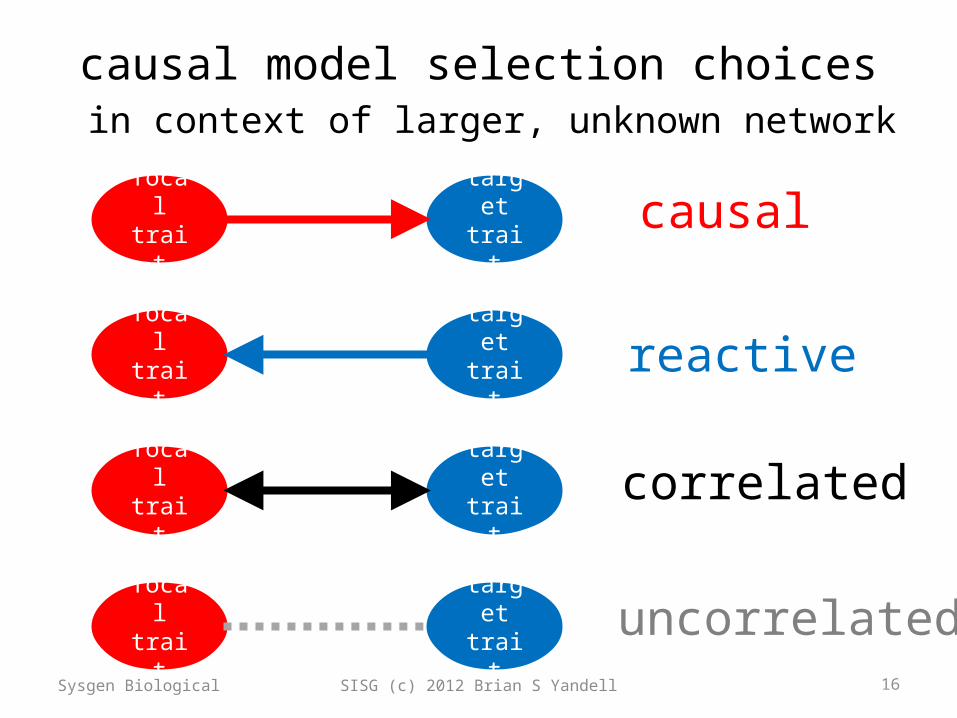
causal model selection choices in context of larger, unknown network
focal trait
target trait
focal trait
target trait
focal trait
target trait
focal trait
target trait
causal
reactive
correlated
uncorrelated16Sysgen Biological SISG (c) 2012 Brian S Yandell
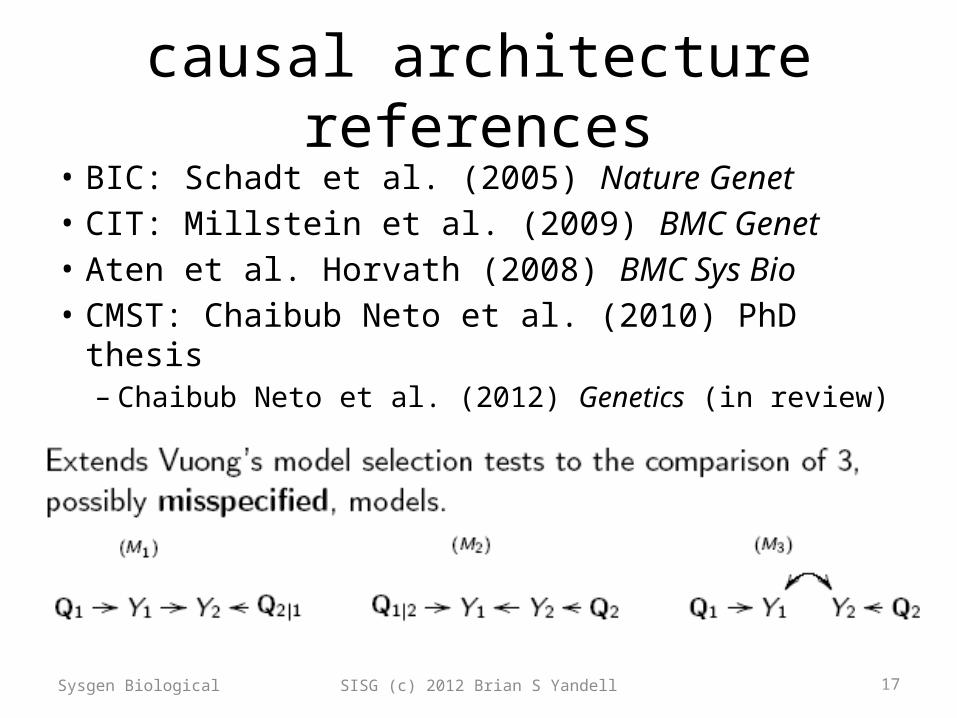
causal architecture references• BIC: Schadt et al. (2005) Nature Genet• CIT: Millstein et al. (2009) BMC Genet• Aten et al. Horvath (2008) BMC Sys Bio• CMST: Chaibub Neto et al. (2010) PhD thesis– Chaibub Neto et al. (2012) Genetics (in review)
Sysgen Biological SISG (c) 2012 Brian S Yandell 17
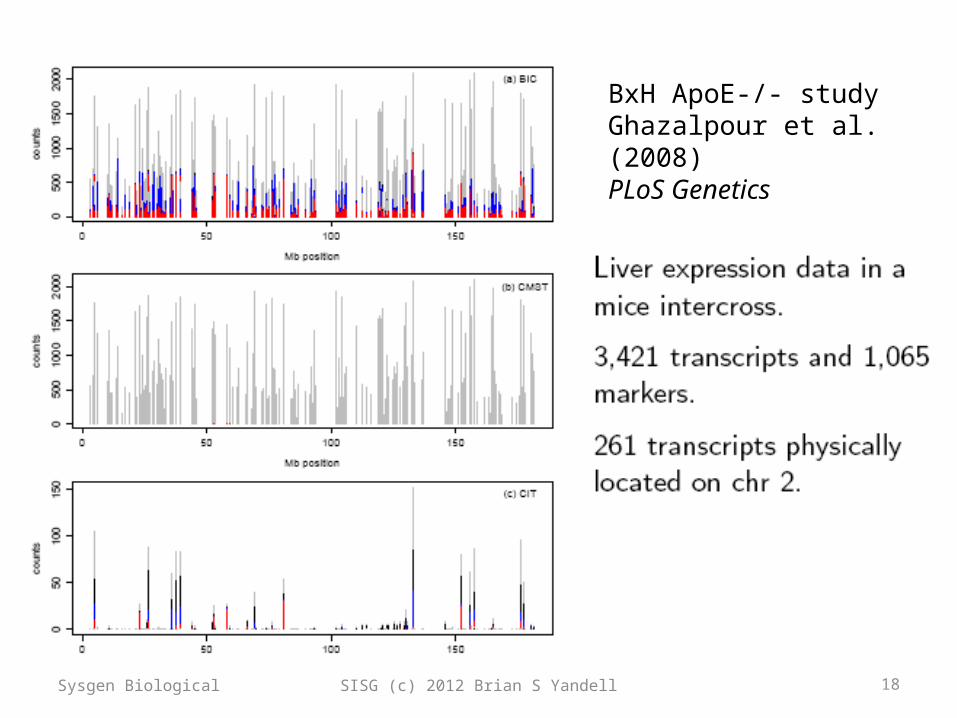
Sysgen Biological SISG (c) 2012 Brian S Yandell 18
BxH ApoE-/- studyGhazalpour et al. (2008)PLoS Genetics

Sysgen Biological SISG (c) 2012 Brian S Yandell 19

QTL-driven directed graphs
• given genetic architecture (QTLs), what causal network structure is supported by data?
• R/qdg available at www.github.org/byandell• references – Chaibub Neto, Ferrara, Attie, Yandell (2008) Inferring
causal phenotype networks from segregating populations. Genetics 179: 1089-1100. [doi:genetics.107.085167]
– Ferrara et al. Attie (2008) Genetic networks of liver metabolism revealed by integration of metabolic and transcriptomic profiling. PLoS Genet 4: e1000034. [doi:10.1371/journal.pgen.1000034]
SISG (c) 2012 Brian S Yandell 20Sysgen Biological

partial correlation (PC) skeleton
Sysgen Biological SISG (c) 2012 Brian S Yandell 21
1st order partial correlations
true graph
correlations
drop edge
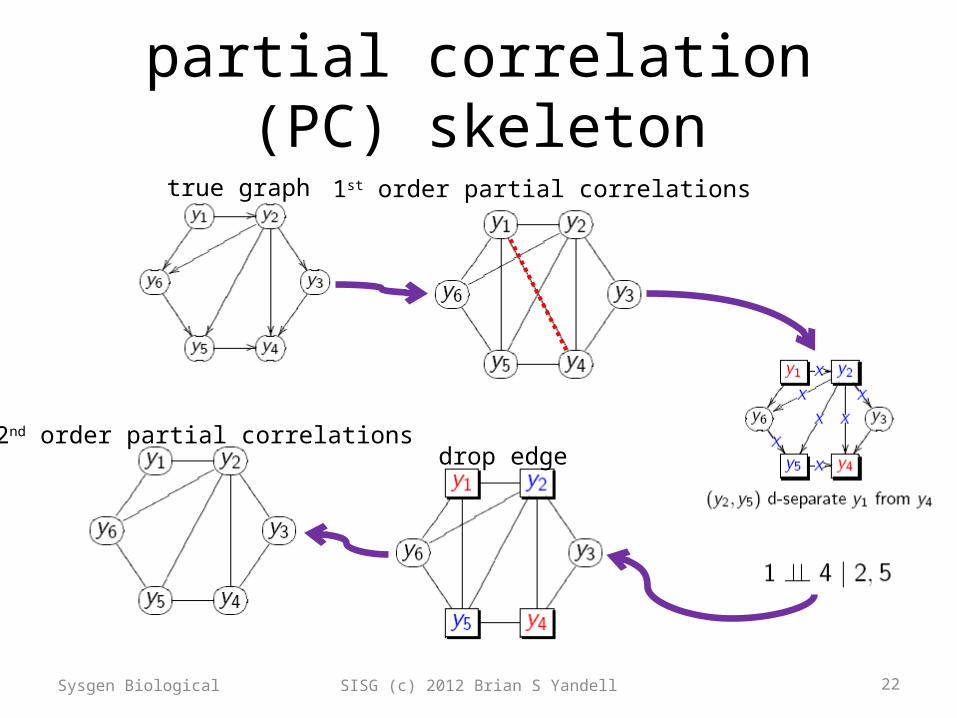
partial correlation (PC) skeleton
Sysgen Biological SISG (c) 2012 Brian S Yandell 22
true graph 1st order partial correlations
2nd order partial correlationsdrop edge
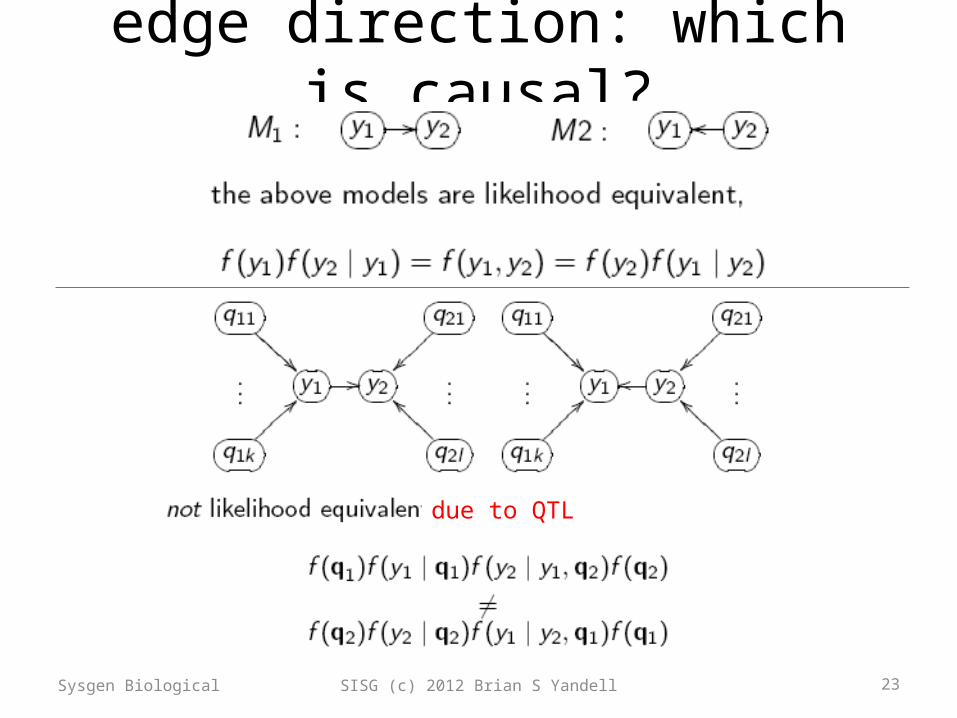
edge direction: which is causal?
Sysgen Biological SISG (c) 2012 Brian S Yandell 23
due to QTL
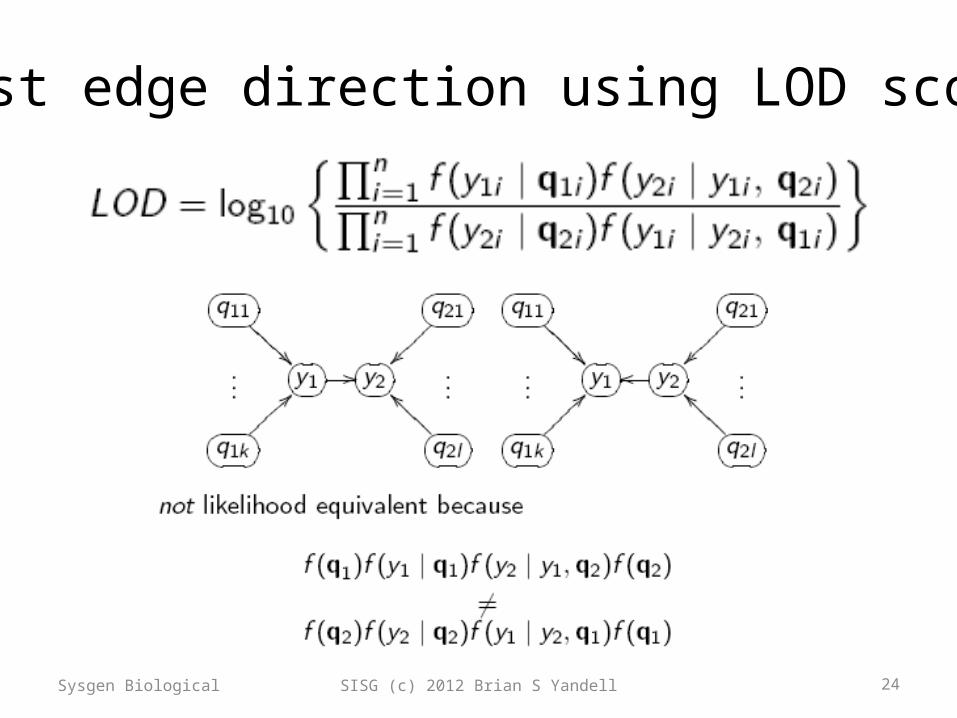
Sysgen Biological SISG (c) 2012 Brian S Yandell 24
test edge direction using LOD score
Sysgen Biological SISG (c) 2012 Brian S Yandell 25
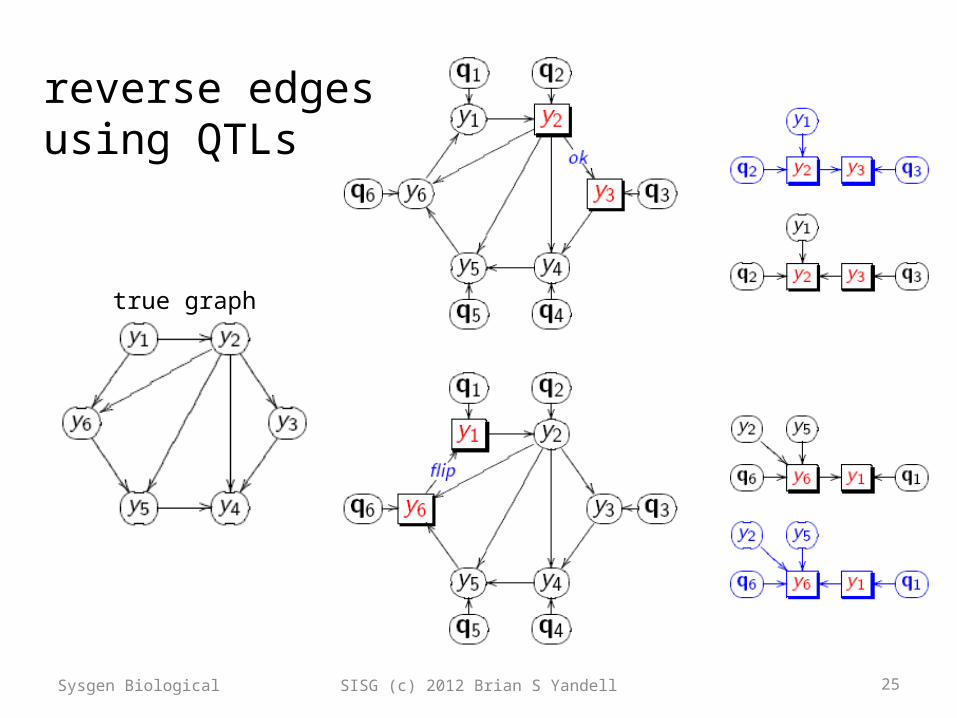
true graph
reverse edgesusing QTLs
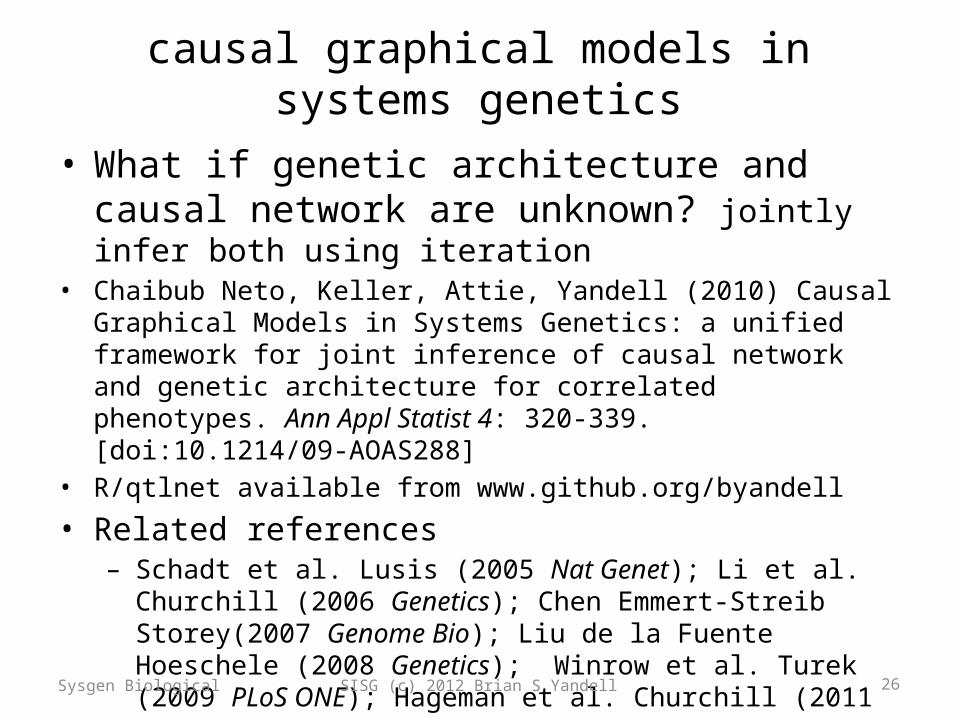
causal graphical models in systems genetics
• What if genetic architecture and causal network are unknown? jointly infer both using iteration
• Chaibub Neto, Keller, Attie, Yandell (2010) Causal Graphical Models in Systems Genetics: a unified framework for joint inference of causal network and genetic architecture for correlated phenotypes. Ann Appl Statist 4: 320-339. [doi:10.1214/09-AOAS288]
• R/qtlnet available from www.github.org/byandell
• Related references– Schadt et al. Lusis (2005 Nat Genet); Li et al. Churchill (2006 Genetics);
Chen Emmert-Streib Storey(2007 Genome Bio); Liu de la Fuente Hoeschele (2008 Genetics); Winrow et al. Turek (2009 PLoS ONE); Hageman et al. Churchill (2011 Genetics)
SISG (c) 2012 Brian S Yandell 26Sysgen Biological
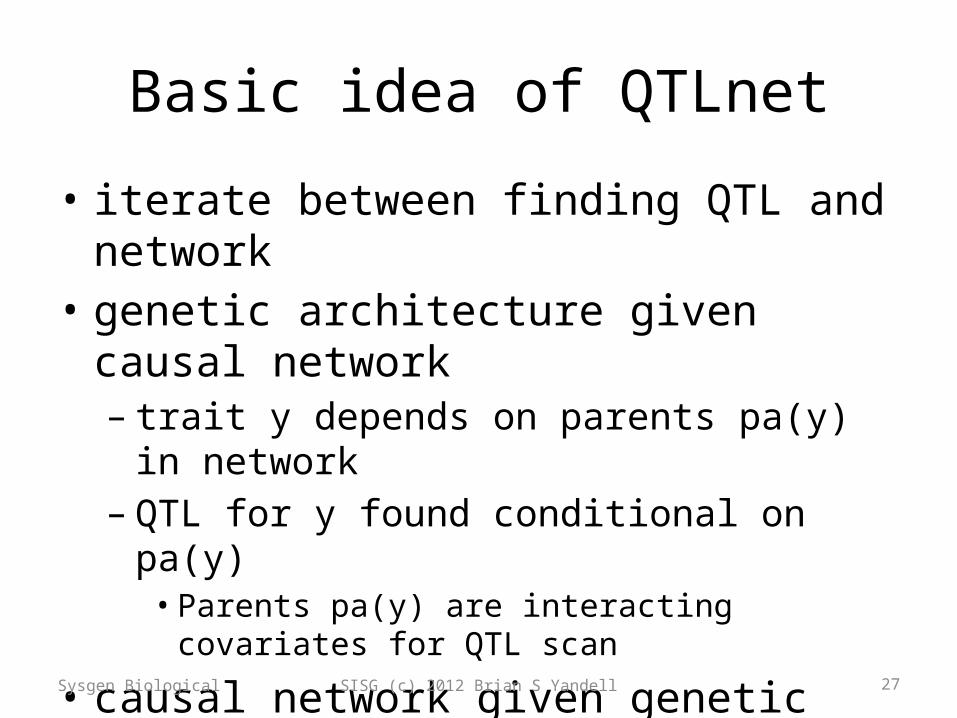
Basic idea of QTLnet
• iterate between finding QTL and network• genetic architecture given causal network– trait y depends on parents pa(y) in network– QTL for y found conditional on pa(y)• Parents pa(y) are interacting covariates for QTL scan
• causal network given genetic architecture– build (adjust) causal network given QTL– each direction change may alter neighbor edges
SISG (c) 2012 Brian S Yandell 27Sysgen Biological

missing data method: MCMC
• known phenotypes Y, genotypes Q• unknown graph G• want to study Pr(Y | G, Q)• break down in terms of individual edges– Pr(Y|G,Q) = sum of Pr(Yi | pa(Yi), Q)
• sample new values for individual edges– given current value of all other edges
• repeat many times and average results
Sysgen Biological SISG (c) 2012 Brian S Yandell 28
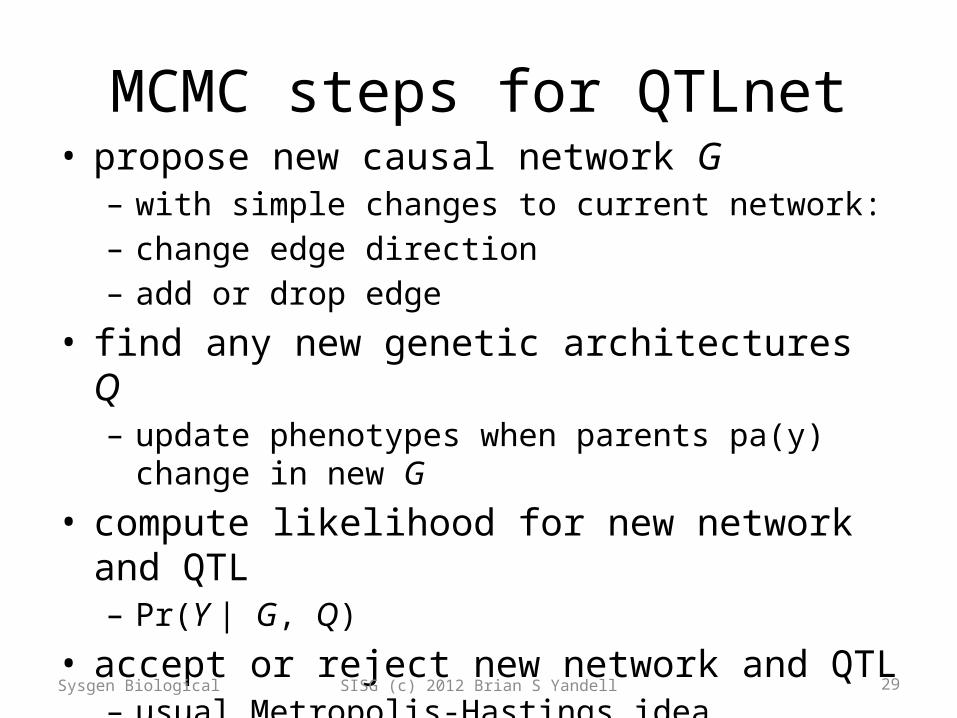
MCMC steps for QTLnet• propose new causal network G– with simple changes to current network:– change edge direction– add or drop edge
• find any new genetic architectures Q– update phenotypes when parents pa(y) change in new G
• compute likelihood for new network and QTL– Pr(Y | G, Q)
• accept or reject new network and QTL– usual Metropolis-Hastings idea
Sysgen Biological SISG (c) 2012 Brian S Yandell 29
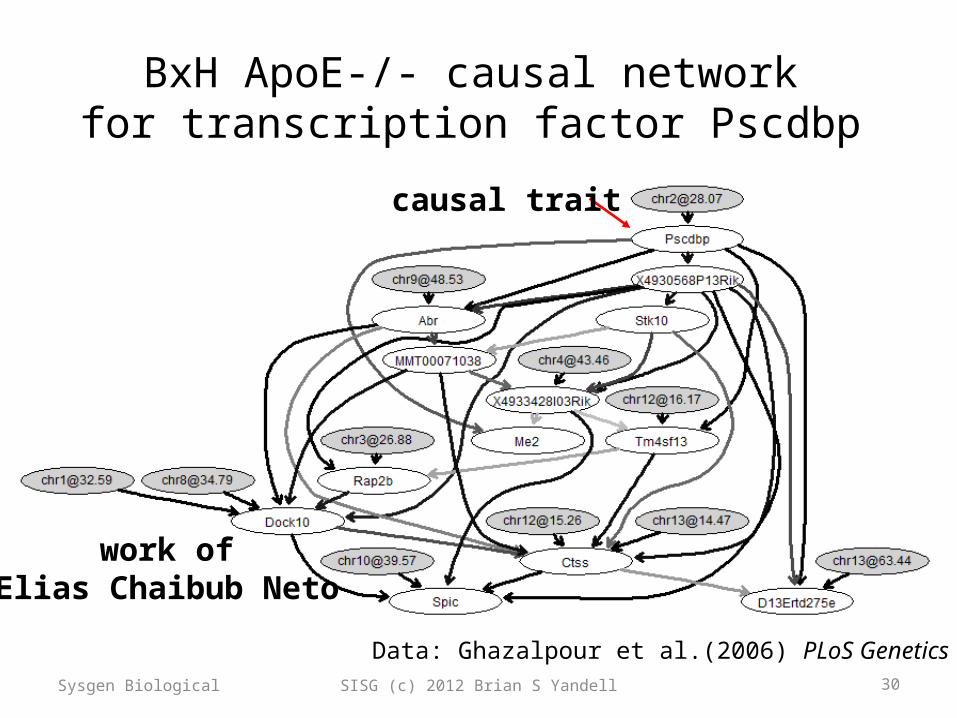
BxH ApoE-/- causal networkfor transcription factor Pscdbp
causal trait
30
work ofElias Chaibub Neto
Sysgen Biological SISG (c) 2012 Brian S Yandell
Data: Ghazalpour et al.(2006) PLoS Genetics
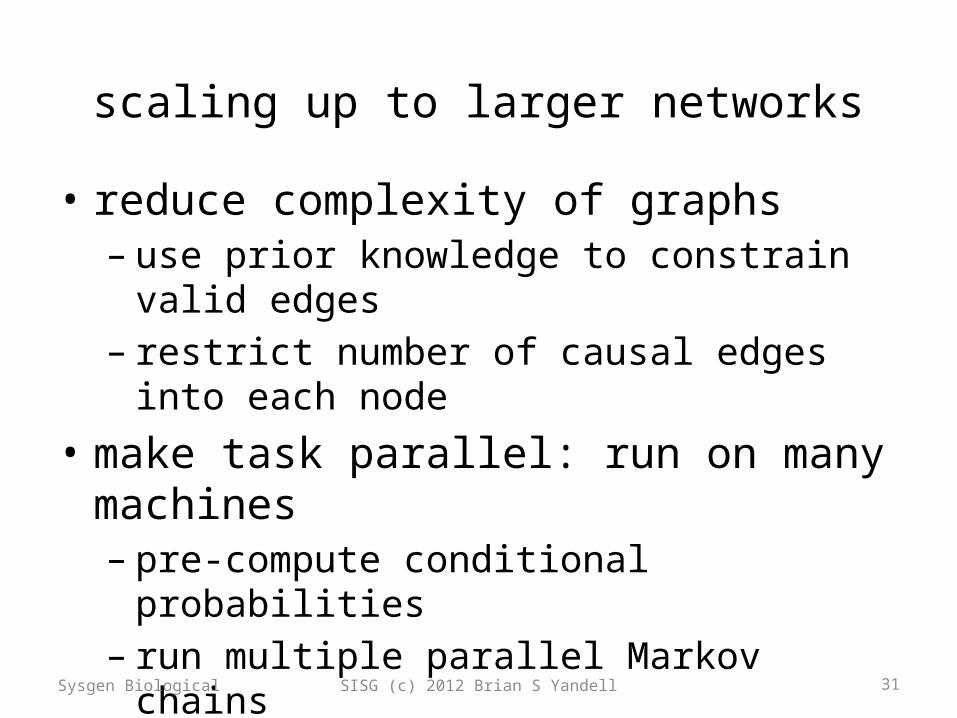
scaling up to larger networks
• reduce complexity of graphs– use prior knowledge to constrain valid edges– restrict number of causal edges into each node
• make task parallel: run on many machines– pre-compute conditional probabilities– run multiple parallel Markov chains
• rethink approach– LASSO, sparse PLS, other optimization methods
SISG (c) 2012 Brian S Yandell 31Sysgen Biological

graph complexity with node parents
SISG (c) 2012 Brian S Yandell 32
pa2pa1
node
of2 of3of1
pa1
node
of2of1
pa3
of3
Sysgen Biological
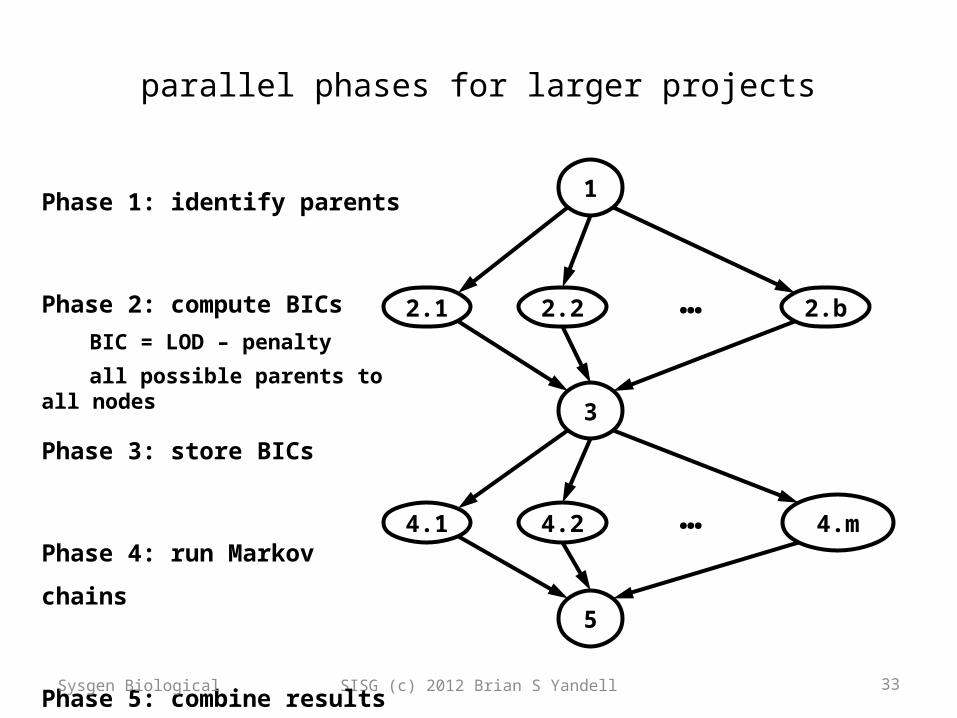
parallel phases for larger projects
SISG (c) 2012 Brian S Yandell 33
1
2.2 2.b2.1 …
3
4.2 4.m4.1 …
5
Phase 1: identify parents
Phase 2: compute BICs
BIC = LOD – penalty
all possible parents to all nodes
Phase 3: store BICs
Phase 4: run Markov chains
Phase 5: combine resultsSysgen Biological

parallel implementation• R/qtlnet available at www.github.org/byandell• Condor cluster: chtc.cs.wisc.edu– System Of Automated Runs (SOAR)• ~2000 cores in pool shared by many scientists• automated run of new jobs placed in project
SISG (c) 2012 Brian S Yandell 34
Phase 4Phase 2
Sysgen Biological
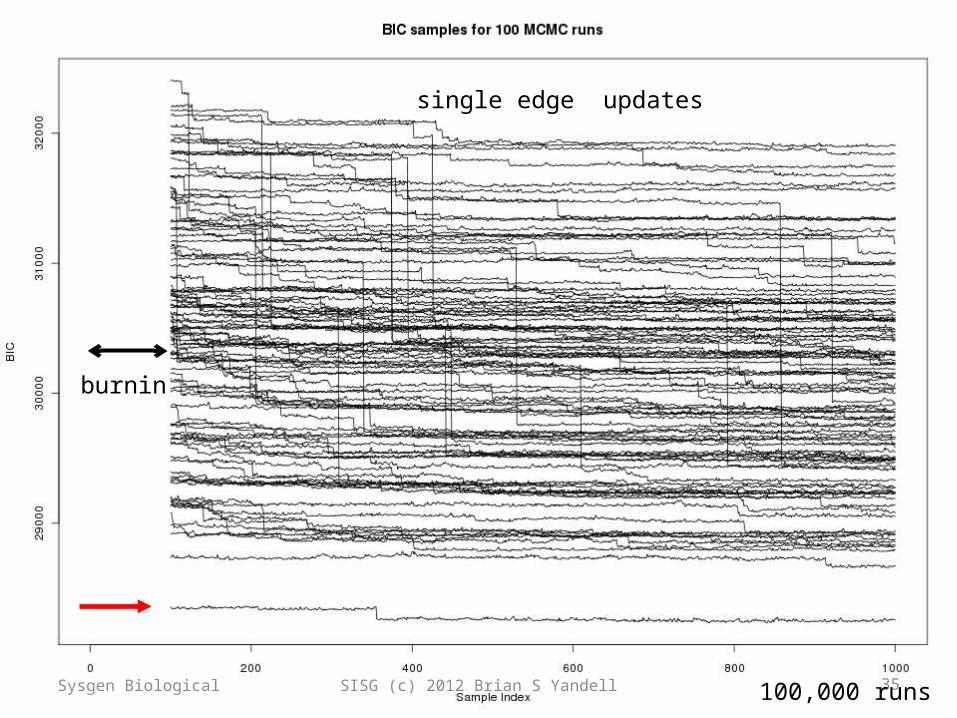
SISG (c) 2012 Brian S Yandell 35
single edge updates
100,000 runs
burnin
Sysgen Biological
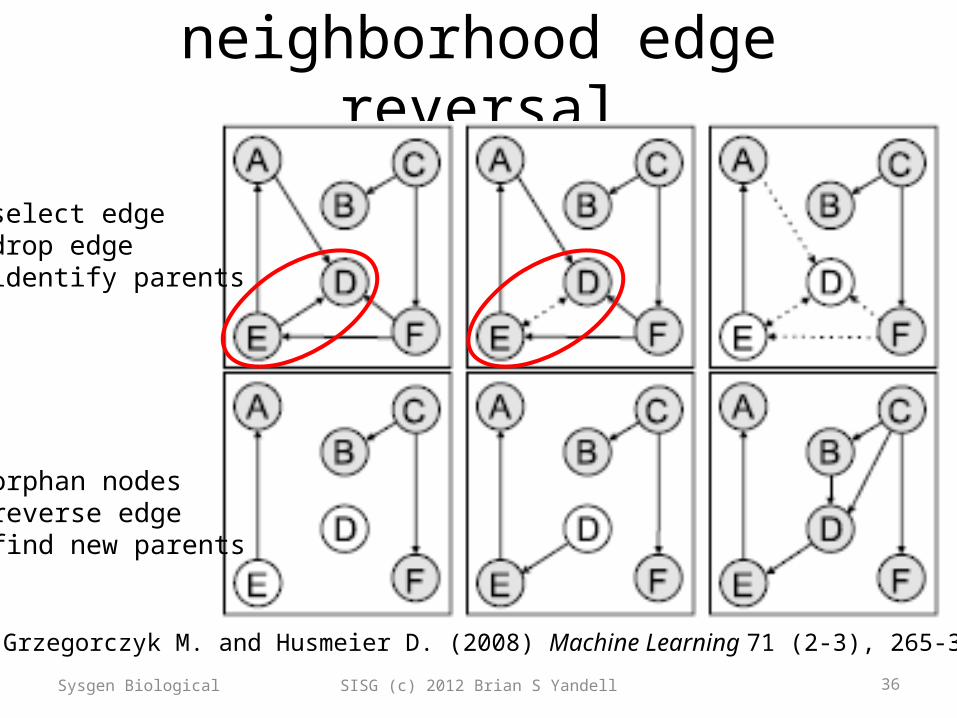
neighborhood edge reversal
SISG (c) 2012 Brian S Yandell 36
Grzegorczyk M. and Husmeier D. (2008) Machine Learning 71 (2-3), 265-305.
orphan nodesreverse edgefind new parents
select edgedrop edgeidentify parents
Sysgen Biological
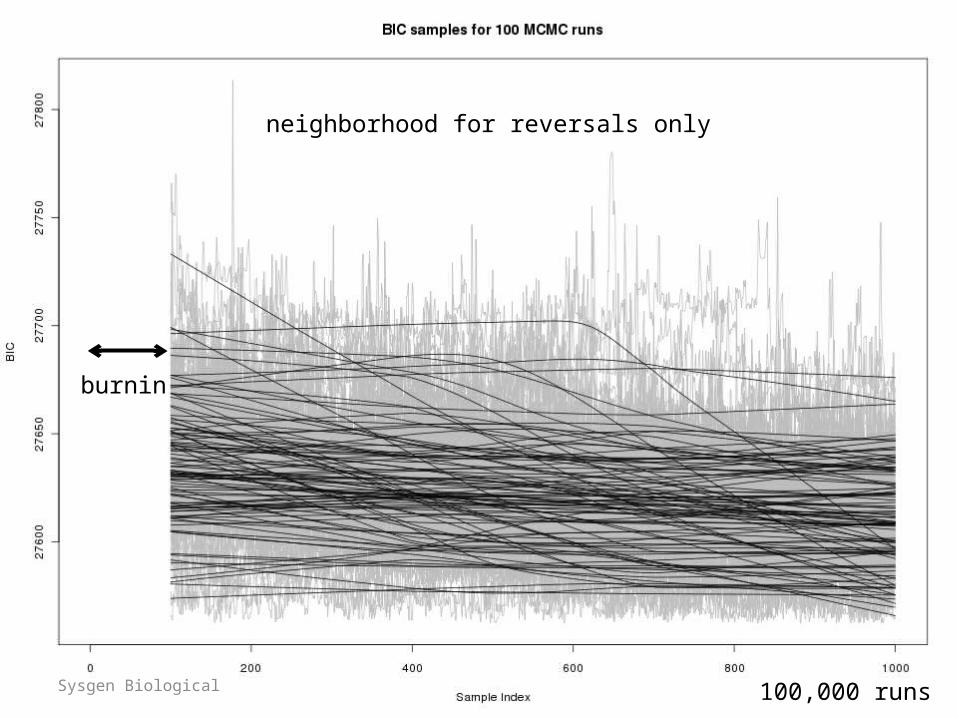
SISG (c) 2012 Brian S Yandell 37
neighborhood for reversals only
100,000 runs
burnin
Sysgen Biological
how to use functional information?• functional grouping from prior studies– may or may not indicate direction– gene ontology (GO), KEGG– knockout (KO) panels – protein-protein interaction (PPI) database– transcription factor (TF) database
• methods using only this information• priors for QTL-driven causal networks– more weight to local (cis) QTLs?
SISG (c) 2012 Brian S Yandell 38Sysgen Biological
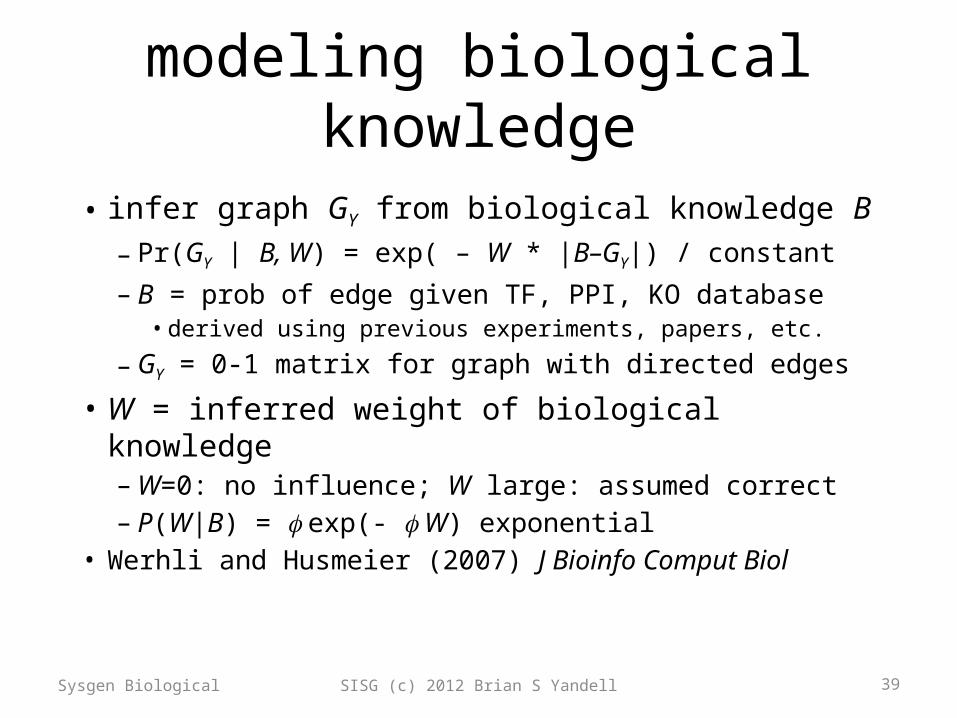
modeling biological knowledge
• infer graph GY from biological knowledge B– Pr(GY | B, W) = exp( – W * |B–GY|) / constant– B = prob of edge given TF, PPI, KO database
• derived using previous experiments, papers, etc.
– GY = 0-1 matrix for graph with directed edges
• W = inferred weight of biological knowledge– W=0: no influence; W large: assumed correct– P(W|B) = exp(- W) exponential
• Werhli and Husmeier (2007) J Bioinfo Comput Biol
SISG (c) 2012 Brian S Yandell 39Sysgen Biological

combining eQTL and bio knowledge• probability for graph G and bio-weights W– given phenotypes Y, genotypes Q, bio info B
• Pr(G, W | Y, Q, B) = c Pr(Y|G,Q)Pr(G|B,W,Q)Pr(W|B)– Pr(Y|G,Q) is genetic architecture (QTLs)
• using parent nodes of each trait as covariates
– Pr(G|B,W,Q) = Pr(GY|B,W) Pr(GQY|Q)• Pr(GY|B,W) relates graph to biological info
• Pr(GQY|Q) relates genotype to phenotype
Moon JY, Chaibub Neto E, Deng X, Yandell BS (2011) Growing graphical models to infer causal phenotype networks. In Probabilistic Graphical Models Dedicated to Applications in Genetics. Sinoquet C, Mourad R, eds. (in review)
SISG (c) 2012 Brian S Yandell 40Sysgen Biological

SISG (c) 2012 Brian S Yandell 41
encoding biological knowledge Btranscription factors, DNA binding (causation)
• p = p-value for TF binding of ij• truncated exponential () when TF ij• uniform if no detection relationship• Bernard, Hartemink (2005) Pac Symp Biocomp
Sysgen Biological
)1(
ee
eB
p
p
ij

SISG (c) 2012 Brian S Yandell 42
encoding biological knowledge Bprotein-protein interaction (association)
• post odds = prior odds * LR• use positive and negative gold standards• Jansen et al. (2003) Science
Sysgen Biological
oddsposterior 1
oddsposterior
jiij BB
SISG (c) 2012 Brian S Yandell 43
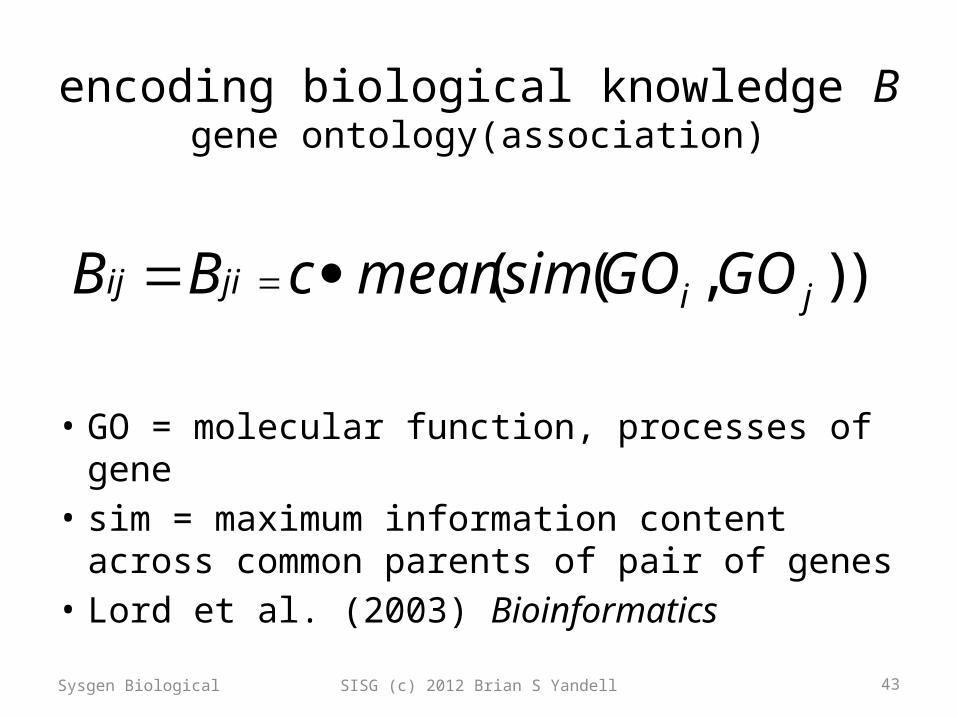
encoding biological knowledge Bgene ontology(association)
• GO = molecular function, processes of gene• sim = maximum information content across
common parents of pair of genes• Lord et al. (2003) Bioinformatics
Sysgen Biological
)),(( jijiij GOGOsimmeancBB
SISG (c) 2012 Brian S Yandell 44
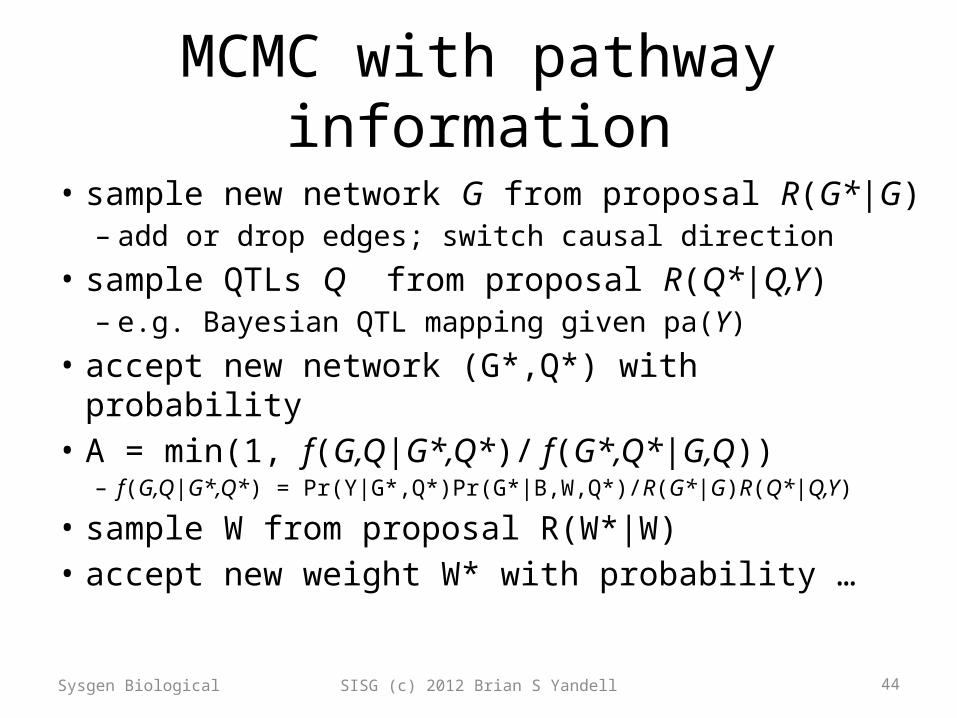
MCMC with pathway information
• sample new network G from proposal R(G*|G)– add or drop edges; switch causal direction
• sample QTLs Q from proposal R(Q*|Q,Y)– e.g. Bayesian QTL mapping given pa(Y)
• accept new network (G*,Q*) with probability• A = min(1, f(G,Q|G*,Q*)/ f(G*,Q*|G,Q))
– f(G,Q|G*,Q*) = Pr(Y|G*,Q*)Pr(G*|B,W,Q*)/R(G*|G)R(Q*|Q,Y)
• sample W from proposal R(W*|W)• accept new weight W* with probability …Sysgen Biological
SISG (c) 2012 Brian S Yandell 45
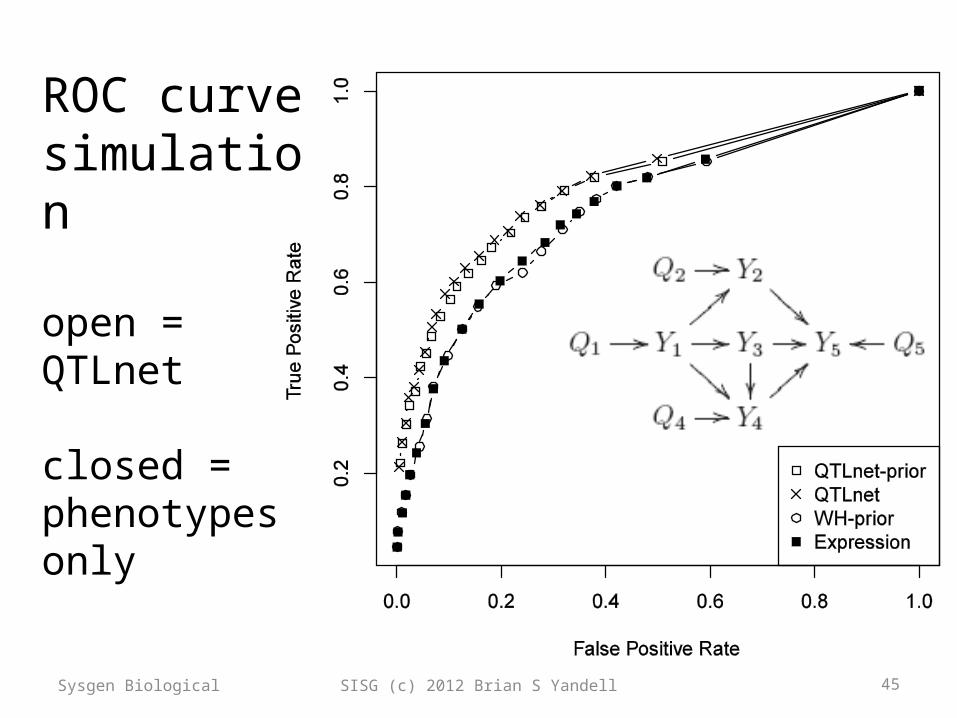
ROC curvesimulation
open = QTLnet
closed = phenotypes only
Sysgen Biological
SISG (c) 2012 Brian S Yandell 46
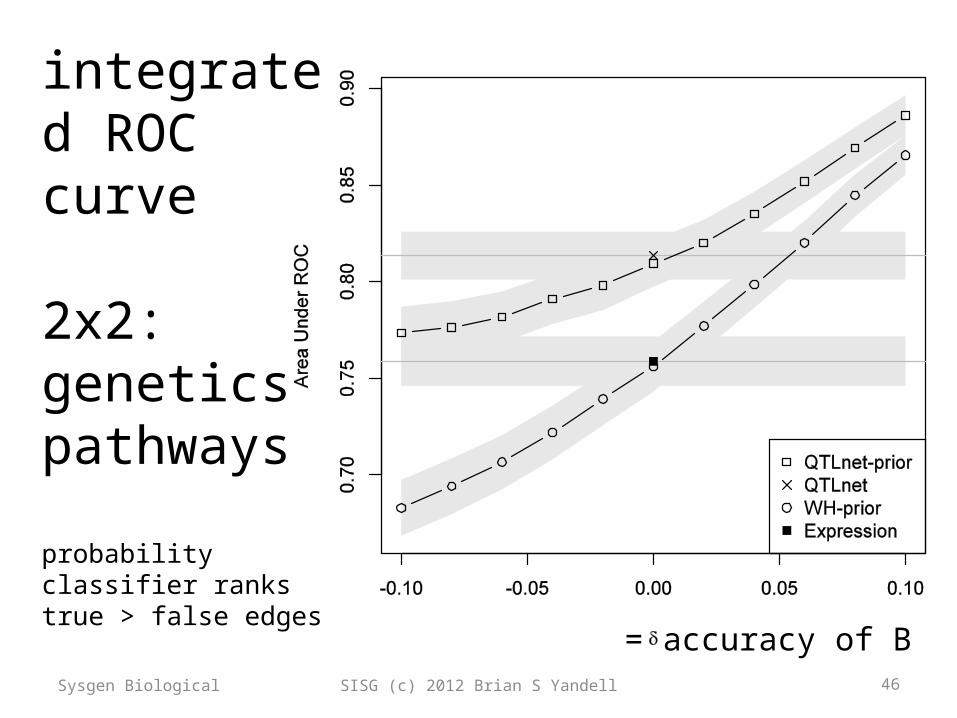
integrated ROC curve
2x2:geneticspathways
probability classifier ranks true > false edges
Sysgen Biological
= accuracy of B
SISG (c) 2012 Brian S Yandell 47
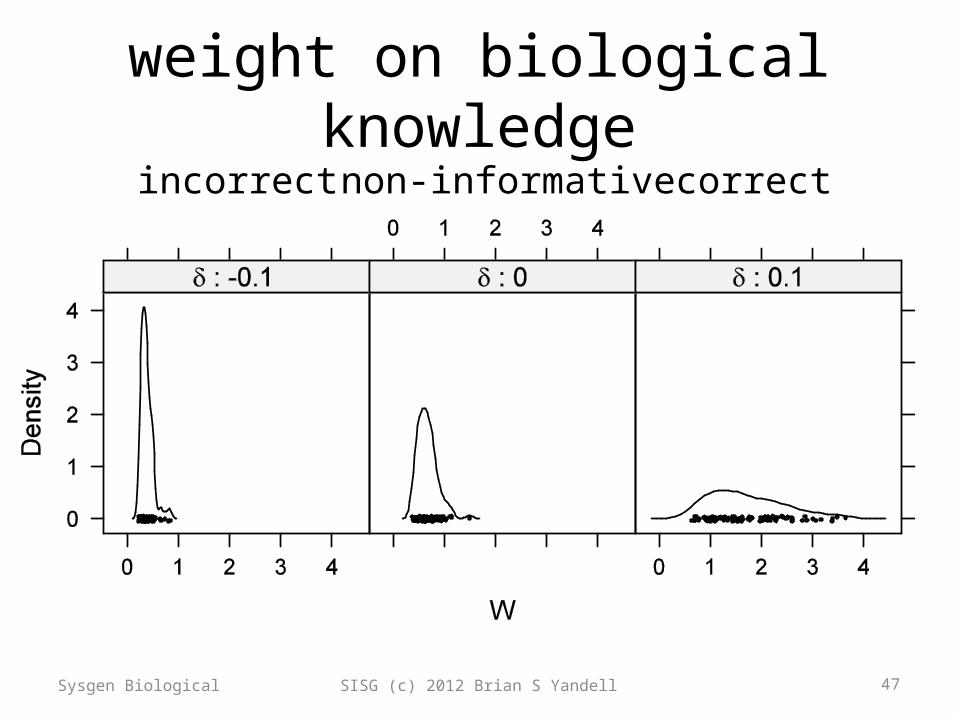
weight on biological knowledge
Sysgen Biological
incorrect correctnon-informative
SISG (c) 2012 Brian S Yandell 48
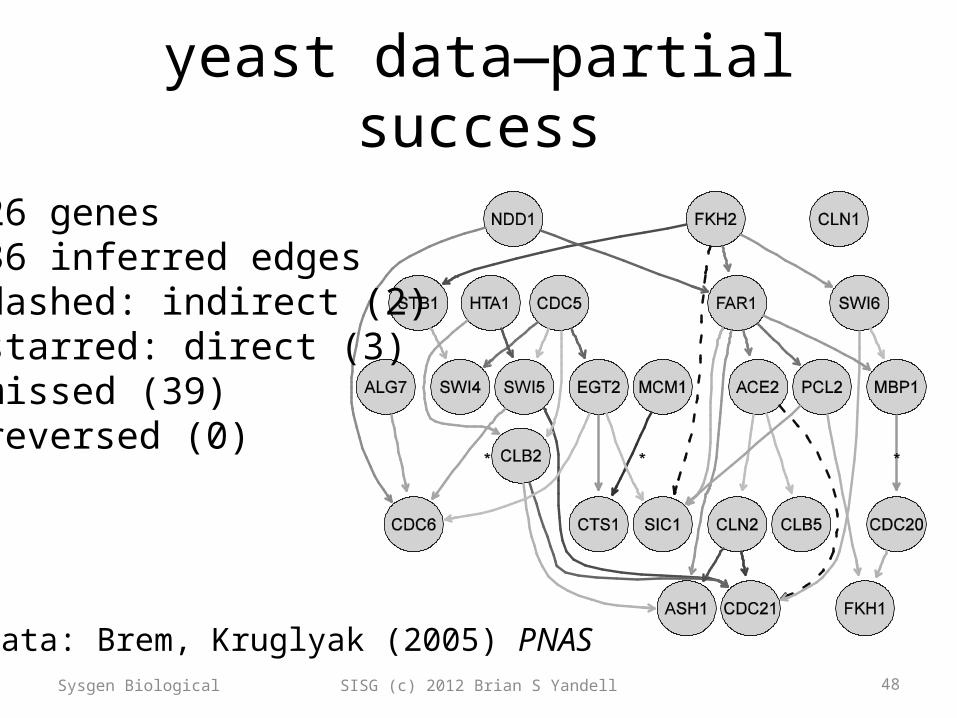
yeast data—partial success
Sysgen Biological
26 genes36 inferred edgesdashed: indirect (2)starred: direct (3)missed (39)reversed (0)
Data: Brem, Kruglyak (2005) PNAS

phenotypic bufferingof molecular QTL
SysGen: Overview Seattle SISG: Yandell © 2012 49
Fu et al. Jansen (2009 Nature Genetics)
SISG (c) 2012 Brian S Yandell 50
limits of causal inference
• Computing costs already discussed• Noisy data leads to false positive causal calls
– Unfaithfulness assumption violated– Depends on sample size and omic technology– And on graph complexity (d = maximal path length ij)– Profound limits
• Uhler C, Raskutti G, Buhlmann P, Yu B (2012 in prep) Geometry of faithfulness assumption in causal inference.
• Yang Li, Bruno M. Tesson, Gary A. Churchill, Ritsert C. Jansen (2010) Critical reasoning on causal inference in genome-wide linkage and association studies. Trends in Genetics 26: 493-498.
Sysgen Biological
SISG (c) 2012 Brian S Yandell 51
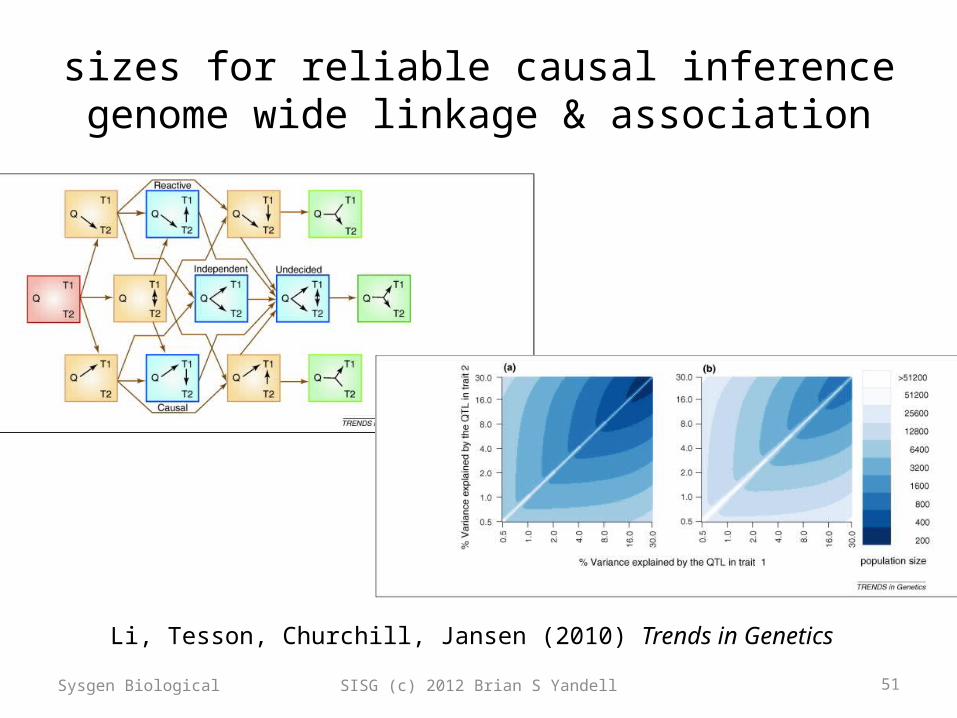
sizes for reliable causal inferencegenome wide linkage & association
Sysgen Biological
Li, Tesson, Churchill, Jansen (2010) Trends in Genetics
SISG (c) 2012 Brian S Yandell 52
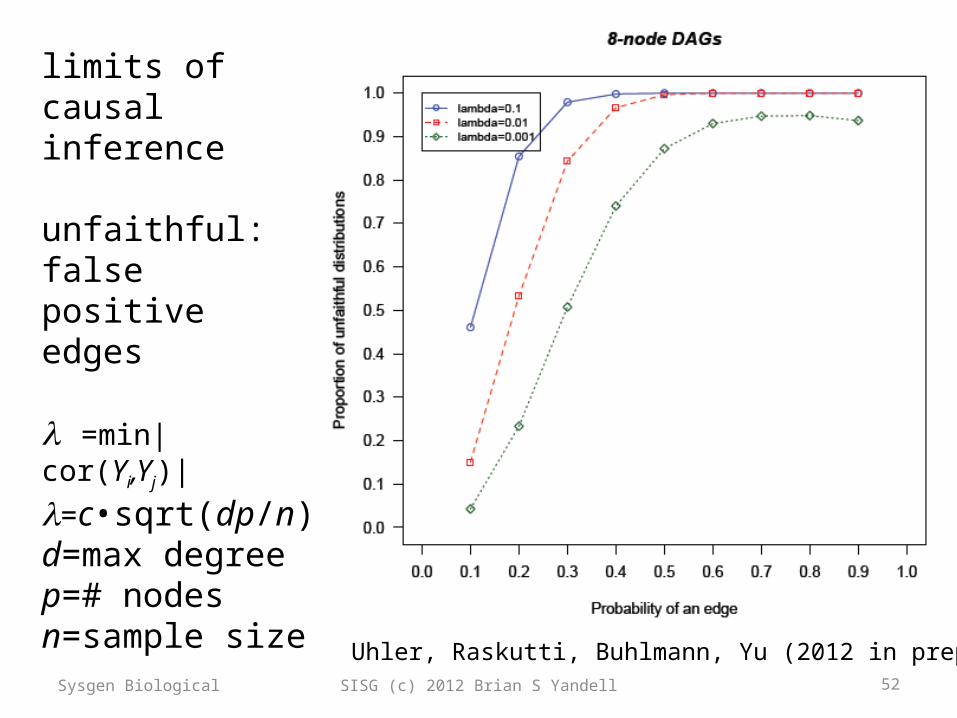
limits of causal inference
unfaithful: false positive edges
=min|cor(Yi,Yj)|
=c•sqrt(dp/n)d=max degreep=# nodesn=sample size
Sysgen Biological
Uhler, Raskutti, Buhlmann, Yu (2012 in prep)
SISG (c) 2012 Brian S Yandell 53
Thanks!
• Grant support– NIH/NIDDK 58037, 66369– NIH/NIGMS 74244, 69430– NCI/ICBP U54-CA149237– NIH/R01MH090948
• Collaborators on papers and ideas– Alan Attie & Mark Keller, Biochemistry– Karl Broman, Aimee Broman, Christina Kendziorski
Sysgen Biological