Embed Size (px)
Citation preview

TransCo
TransCo
APPLICATION FOR THE ALTERNATIVE RATE SETTING METHODOLOGY FOR
THE 2ND REGULATORY PERIOD (2006-2010)
Transmission Wheeling Rate Guidelines (TWRG)
National Transmission Corporation
18-Oct-05 Corporate Planning Group
TransCo3TRANSMISSION WHEELING RATE GUIDELINES (TWRG)
ERC’s Performance Based Regulation requires a price control arrangement determined prior to the start of a five year regulatory period.
18-Oct-05 Corporate Planning Group
TransCo4
1. TransCo Business Process2. Regulated Entity Assumptions3. Annual Revenue Requirement (ARR)
Demand ForecastForecast OPEX
OUTLINE OF THE PRESENTATION
18-Oct-05 Corporate Planning Group
TransCo5OUTLINE OF THE PRESENTATION
Return of Capital (depreciation) and Return on Capital• Regulated Asset Base (RAB)• Capital Expenditures• Regulatory Depreciation• Working Capital• Weighted Average Cost of Capital
Taxes
18-Oct-05 Corporate Planning Group
TransCo6
4. Price Control – Estimated Maximum Allowable Revenue (MAR)
5. Proposed Service Incentive Scheme
OUTLINE OF THE PRESENTATION
TransCo
TRANSCO BUSINESS PROCESS
National Transmission Corporation
18-Oct-05 Corporate Planning Group
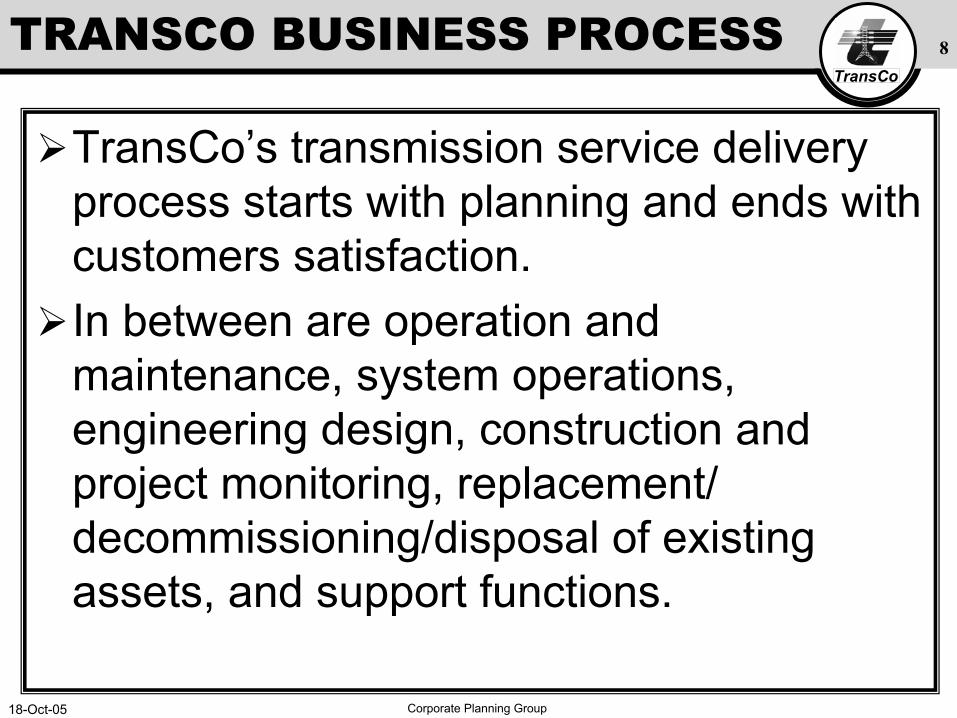
TransCo8TRANSCO BUSINESS PROCESS
TransCo’s transmission service delivery process starts with planning and ends with customers satisfaction.In between are operation and maintenance, system operations, engineering design, construction and project monitoring, replacement/ decommissioning/disposal of existing assets, and support functions.
18-Oct-05 Corporate Planning Group
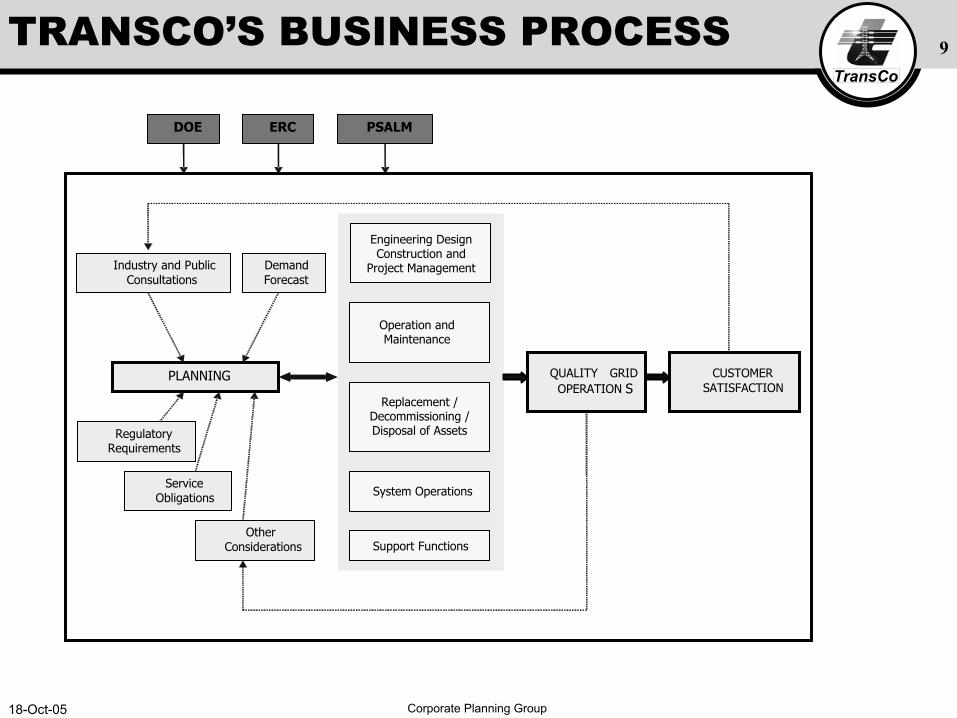
TransCo9TRANSCO’S BUSINESS PROCESS
PLANNING
Demand Forecast
Industry and Public Consultations
CUSTOMER SATISFACTION
Engineering Design Construction and
Project Management
Operation and Maintenance
Replacement / Decommissioning / Disposal of Assets
System Operations
Support Functions
QUALITY GRID OPERATION S
Other Considerations
Regulatory Requirements
Service Obligations
DOE ERC PSALM
TransCo
REGULATED ENTITY ASSUMPTIONS
National Transmission Corporation
TransCo
Regulated Entity - Assumptions
Application assumes:
• Services provided jointly by TransCo and Conssesionaire
• Concessionaire from January 2006, hence:
-Corporate tax payable
-Other taxes apply
• EVAT law applies (E.g. corporate tax rates)
TransCo
DEMAND FORECAST
National Transmission Corporation
TransCo
TRANSCO DEMAND FORECAST
Reflects conservative growth profile
Based on econometric modeling, with the Gross Domestic Product (GDP) as main explanatory variable
Considers customer demand growth forecast, particularly that of Meralco
18-Oct-05 Corporate Planning Group
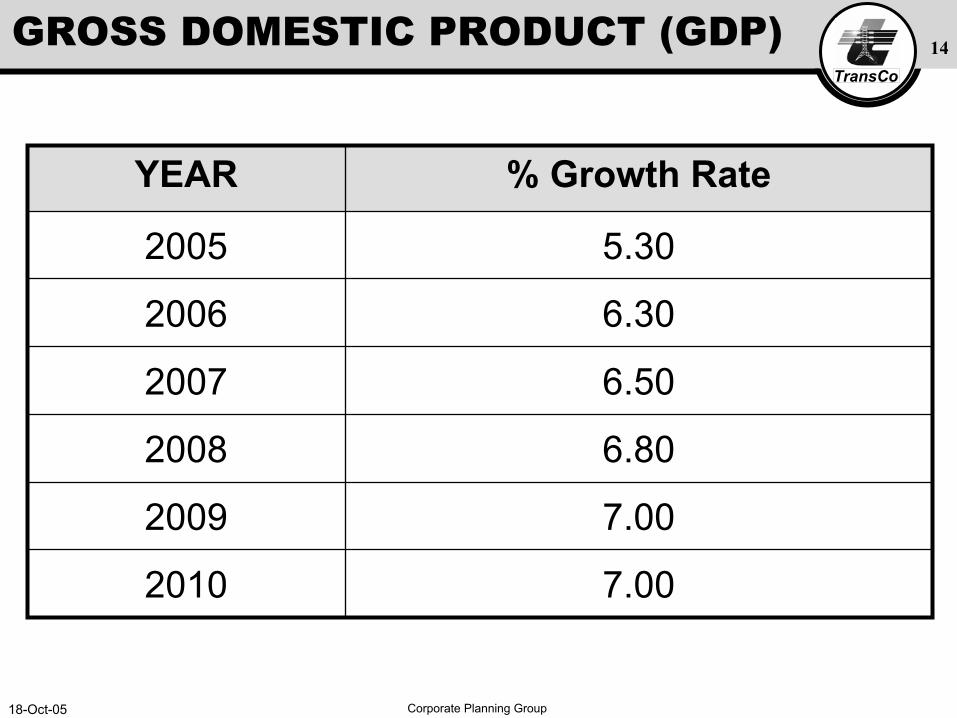
TransCo14GROSS DOMESTIC PRODUCT (GDP)
% Growth RateYEAR
7.002010
7.002009
6.802008
6.502007
6.302006
5.302005
18-Oct-05 Corporate Planning Group
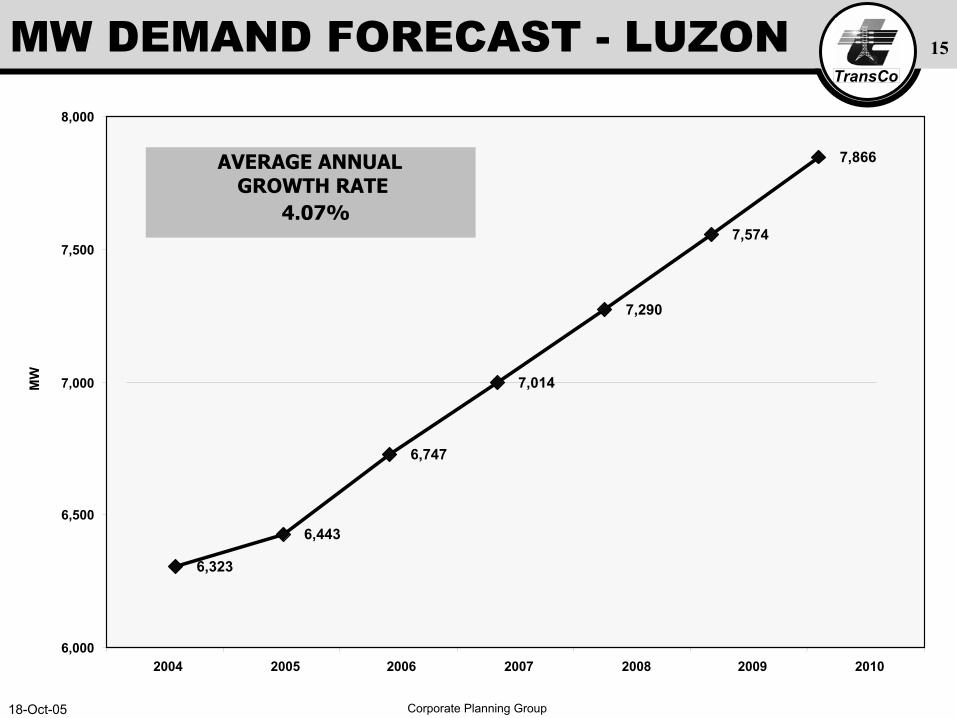
TransCo15
6,000
6,500
7,000
7,500
8,000
2004 2005 2006 2007 2008 2009 2010
MW
MW DEMAND FORECAST - LUZON
6,323
6,443
6,747
7,014
7,290
7,574
7,866AVERAGE ANNUAL GROWTH RATE
4.07%
18-Oct-05 Corporate Planning Group
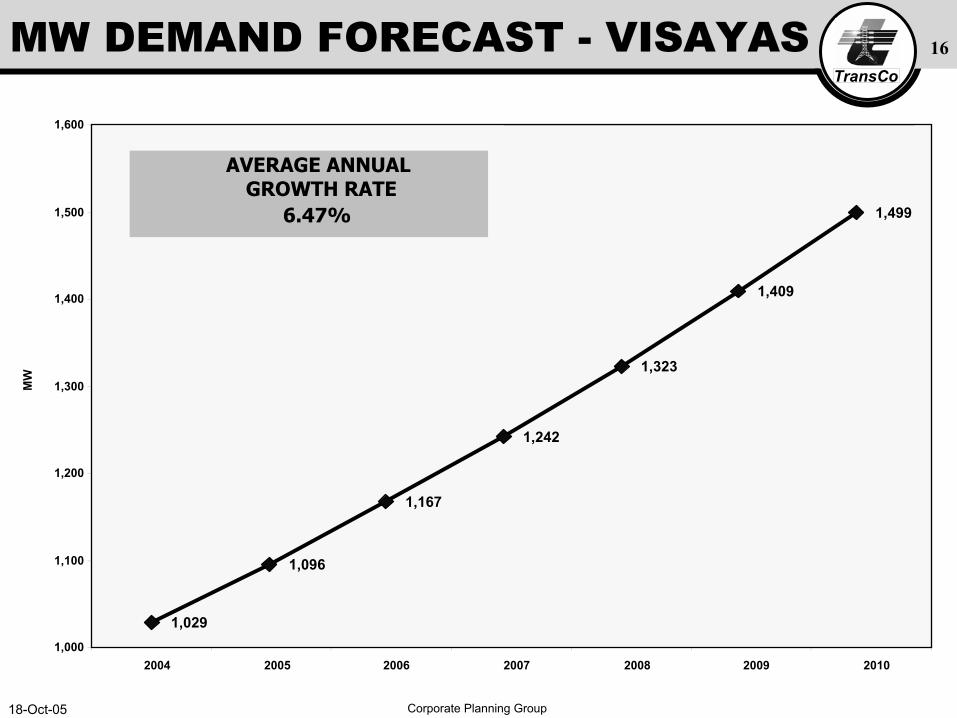
TransCo16
1,000
1,100
1,200
1,300
1,400
1,500
1,600
2004 2005 2006 2007 2008 2009 2010
MW
MW DEMAND FORECAST - VISAYAS
1,029
1,096
1,167
1,242
1,323
1,409
1,499
AVERAGE ANNUAL GROWTH RATE
6.47%
18-Oct-05 Corporate Planning Group
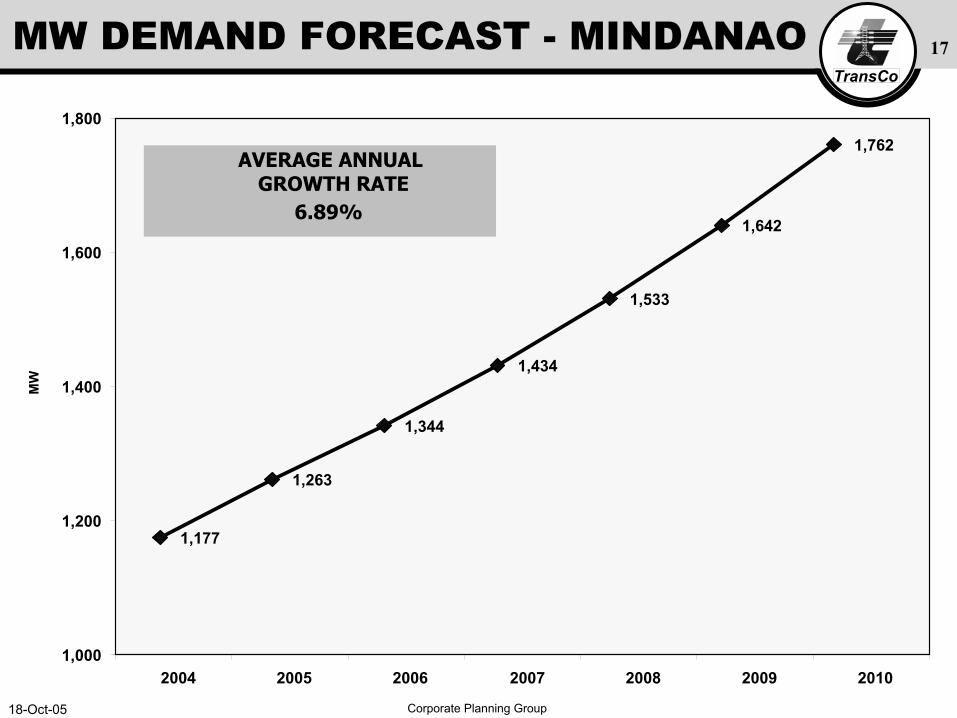
TransCo17
1,000
1,200
1,400
1,600
1,800
2004 2005 2006 2007 2008 2009 2010
MW
MW DEMAND FORECAST - MINDANAO
1,177
1,263
1,344
1,434
1,533
1,642
1,762AVERAGE ANNUAL
GROWTH RATE6.89%
18-Oct-05 Corporate Planning Group
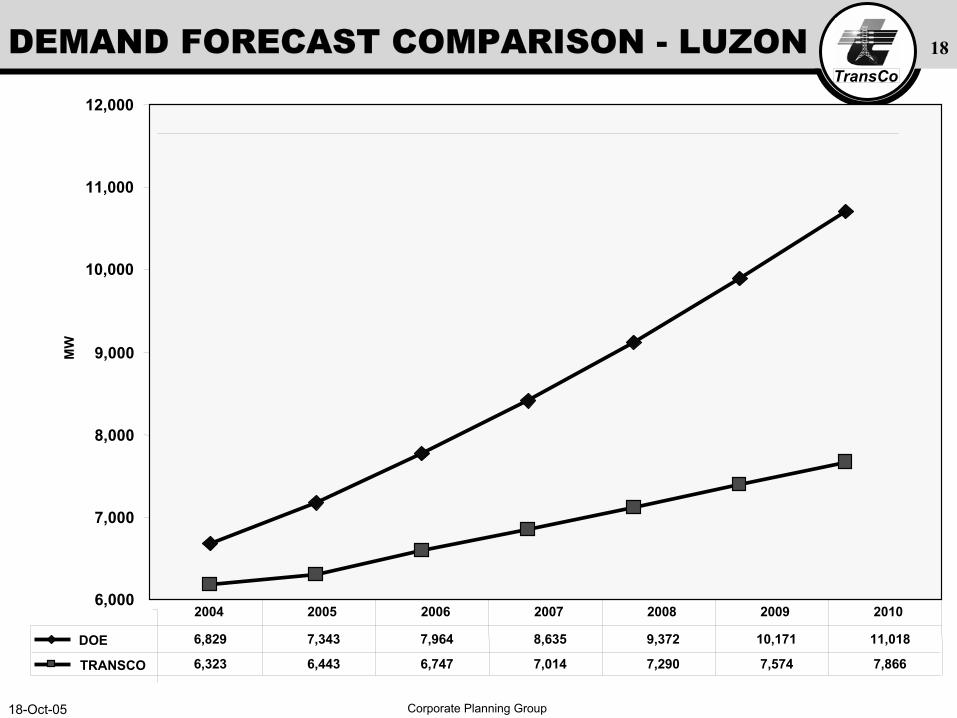
TransCo18
MW
6,000
7,000
8,000
9,000
10,000
11,000
12,000
DOE 6,829 7,343 7,964 8,635 9,372 10,171 11,018
TRANSCO 6,323 6,443 6,747 7,014 7,290 7,574 7,866
2004 2005 2006 2007 2008 2009 2010
DEMAND FORECAST COMPARISON - LUZON
18-Oct-05 Corporate Planning Group
TransCo19REASONS FOR LOWER FORECAST IN LUZON
Lower actual 2004 and 2005 levels; adjustments made to forecast for succeeding years
More conservative forecast by Meralco
18-Oct-05 Corporate Planning Group
TransCo20
1,000
1,100
1,200
1,300
1,400
1,500
1,600
MW
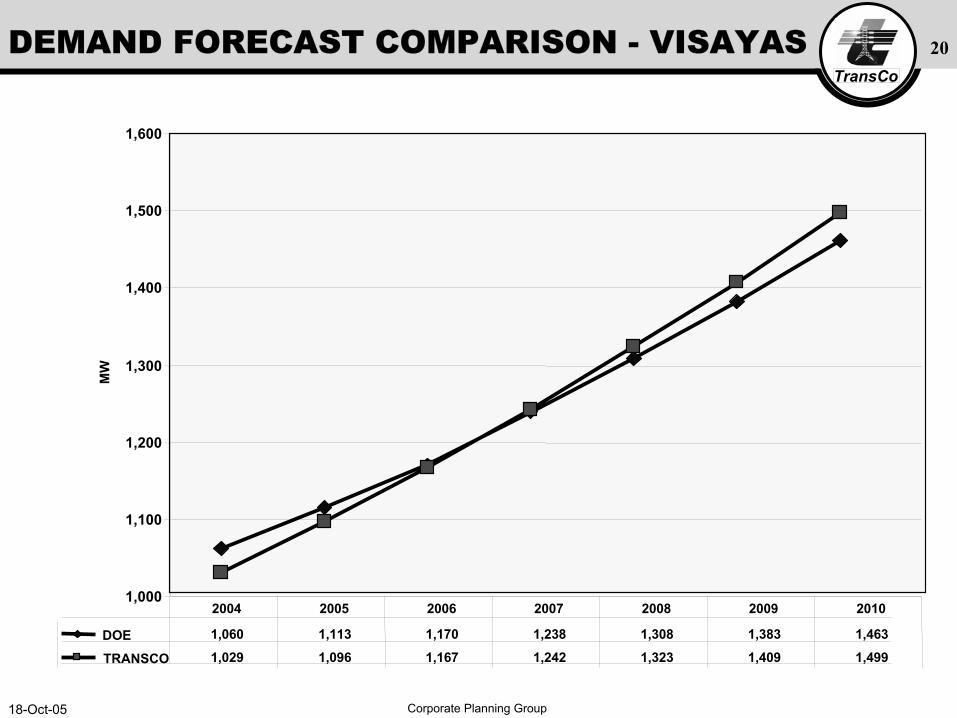
DOE 1,060 1,113 1,170 1,238 1,308 1,383 1,463
TRANSCO 1,029 1,096 1,167 1,242 1,323 1,409 1,499
2004 2005 2006 2007 2008 2009 2010
DEMAND FORECAST COMPARISON - VISAYAS
18-Oct-05 Corporate Planning Group
TransCo21
1,000
1,200
1,400
1,600
1,800
2,000M
W
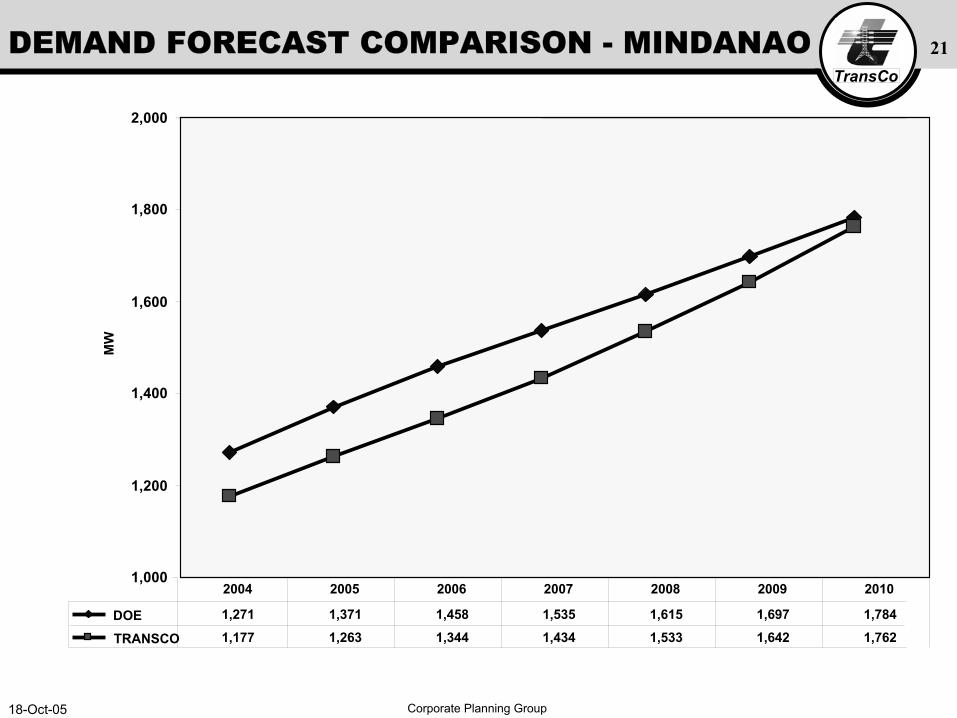
DOE 1,271 1,371 1,458 1,535 1,615 1,697 1,784
TRANSCO 1,177 1,263 1,344 1,434 1,533 1,642 1,762
2004 2005 2006 2007 2008 2009 2010
DEMAND FORECAST COMPARISON - MINDANAO
TransCo
ANNUAL REVENUE REQUIREMENT (ARR)
National Transmission Corporation
18-Oct-05 Corporate Planning Group
TransCo23
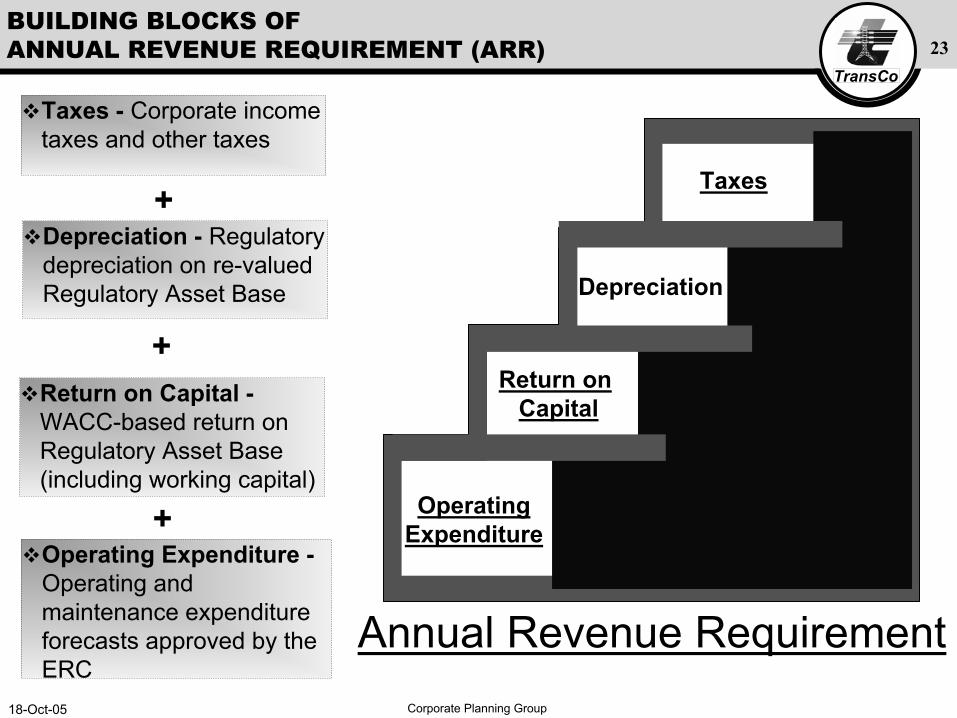
BUILDING BLOCKS OF ANNUAL REVENUE REQUIREMENT (ARR)
Annual Revenue Requirement
OperatingExpenditure
Operating Expenditure -Operating and maintenance expenditure forecasts approved by the ERC
Taxes
Taxes - Corporate income taxes and other taxes
+
Depreciation
Depreciation - Regulatory depreciation on re-valued Regulatory Asset Base
+Return on
CapitalReturn on Capital -WACC-based return on Regulatory Asset Base (including working capital)
+
TransCo
FORECAST OPEX
National Transmission Corporation
18-Oct-05 Corporate Planning Group
TransCo25
Purpose
Designed to cope with the growth in load and expansion in facilities, at the same time maintain and further improve performance.
FORECAST OPEX
18-Oct-05 Corporate Planning Group
TransCo26DRIVERS OF OPEX
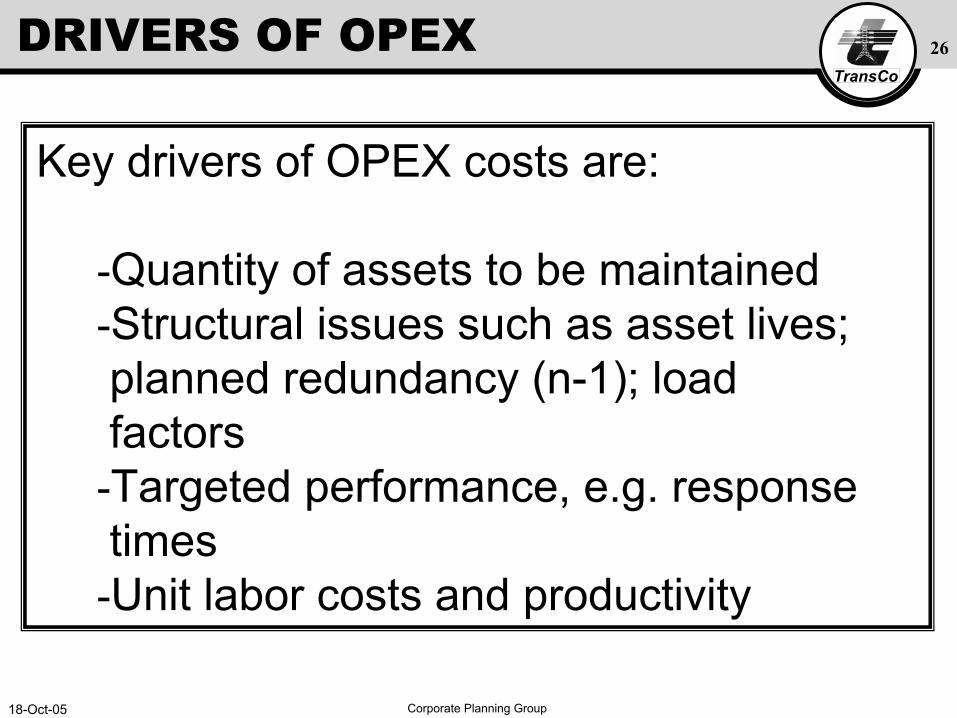
Key drivers of OPEX costs are:
-Quantity of assets to be maintained-Structural issues such as asset lives; planned redundancy (n-1); load factors
-Targeted performance, e.g. response times
-Unit labor costs and productivity
18-Oct-05 Corporate Planning Group
TransCo27
Initial forecast reviewed by Expert
Labor efficiencies (fewer staff per measure output).
Higher cost because of salary adjustments (Mercer Survey shows TransCo salaries below industry).
EXPERTS REPORT
18-Oct-05 Corporate Planning Group
TransCo28
Transco responded by revising forecast
New forecast shows improved operating efficiency against all measures.
TRANSCO RESPONSE
18-Oct-05 Corporate Planning Group
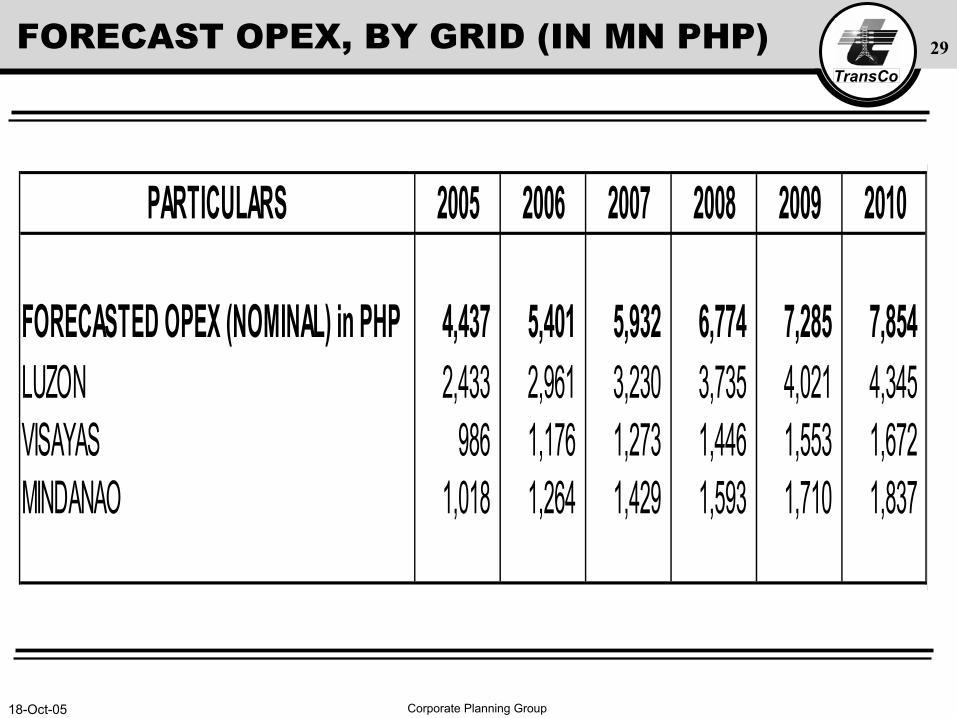
TransCo29FORECAST OPEX, BY GRID (IN MN PHP)
PARTICULARS 2005
FORECASTED OPEX (NOMINAL) in PHP 4,437 5,401 5,932 6,774 7,285 7,854LUZON 2,433 2,961 3,230 3,735 4,021 4,345VISAYAS 986 1,176 1,273 1,446 1,553 1,672MINDANAO 1,018 1,264 1,429 1,593 1,710 1,837
2009 20102006 2007 2008
18-Oct-05 Corporate Planning Group
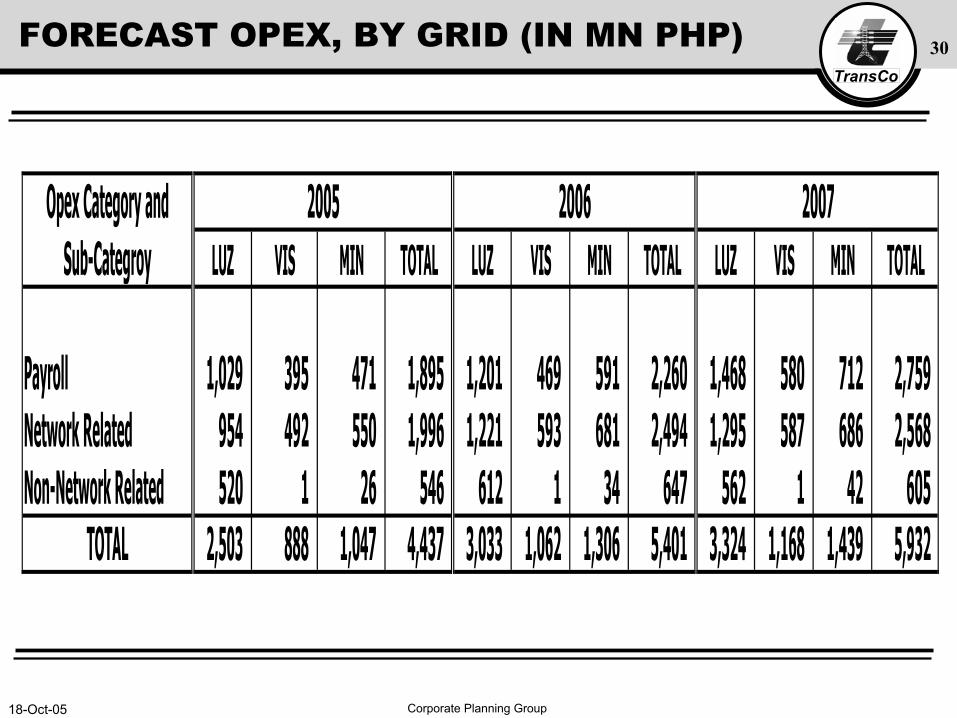
TransCo30
Opex Category andSub-Categroy LUZ VIS MIN TOTAL LUZ VIS MIN TOTAL LUZ VIS MIN TOTAL
Payroll 1,029 395 471 1,895 1,201 469 591 2,260 1,468 580 712 2,759Network Related 954 492 550 1,996 1,221 593 681 2,494 1,295 587 686 2,568Non-Network Related 520 1 26 546 612 1 34 647 562 1 42 605
TOTAL 2,503 888 1,047 4,437 3,033 1,062 1,306 5,401 3,324 1,168 1,439 5,932
2005 2006 2007
FORECAST OPEX, BY GRID (IN MN PHP)
18-Oct-05 Corporate Planning Group
TransCo31
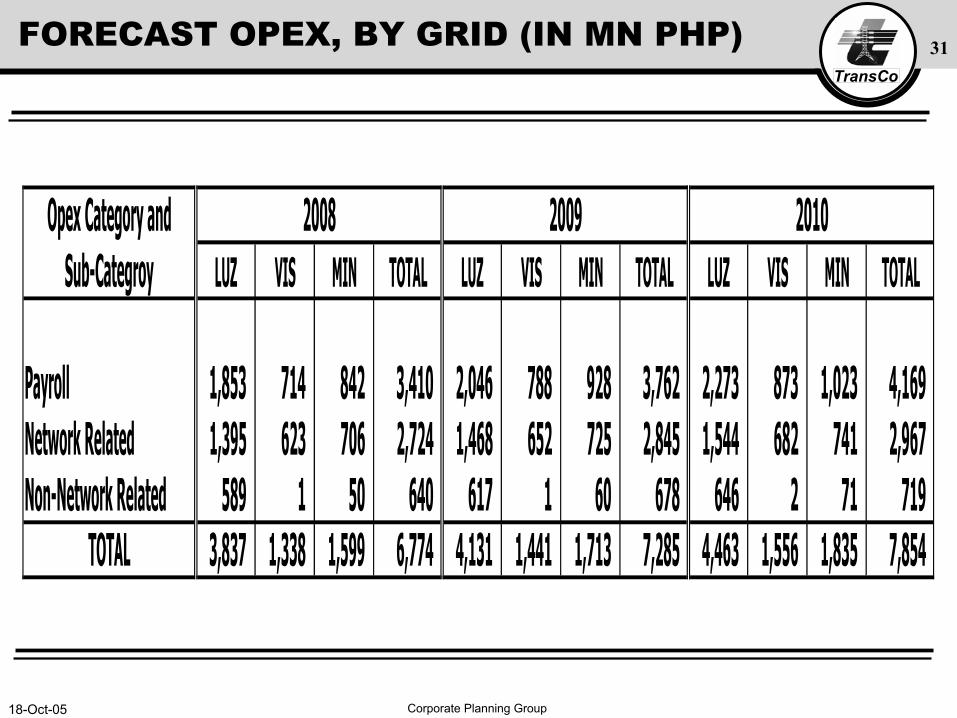
Opex Category andSub-Categroy LUZ VIS MIN TOTAL LUZ VIS MIN TOTAL LUZ VIS MIN TOTAL
Payroll 1,853 714 842 3,410 2,046 788 928 3,762 2,273 873 1,023 4,169Network Related 1,395 623 706 2,724 1,468 652 725 2,845 1,544 682 741 2,967Non-Network Related 589 1 50 640 617 1 60 678 646 2 71 719
TOTAL 3,837 1,338 1,599 6,774 4,131 1,441 1,713 7,285 4,463 1,556 1,835 7,854
2009 20102008
FORECAST OPEX, BY GRID (IN MN PHP)
18-Oct-05 Corporate Planning Group
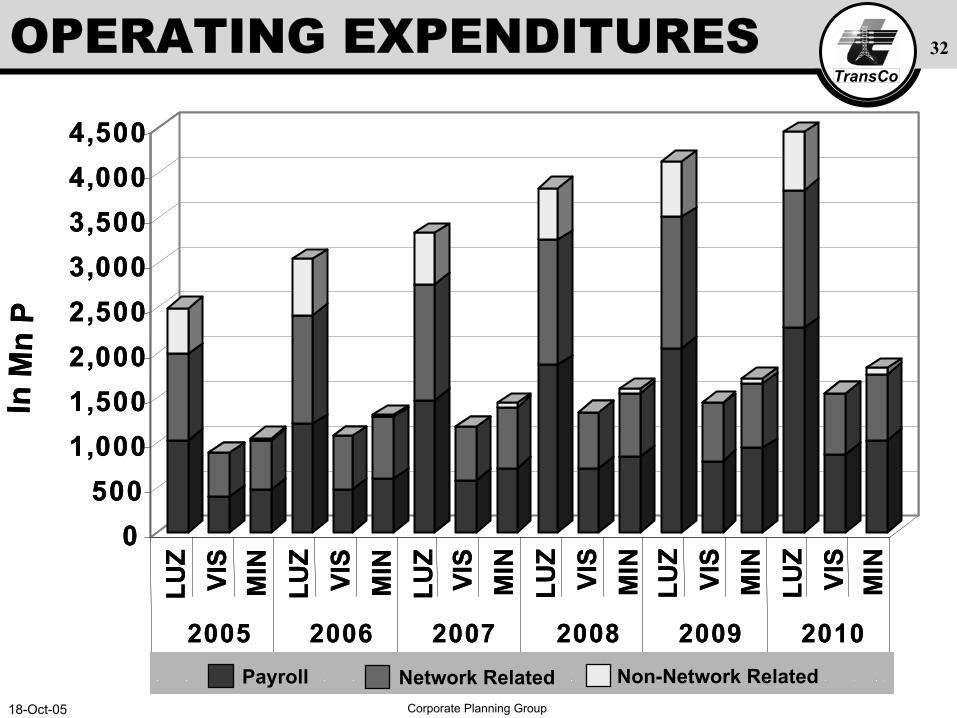
TransCo32OPERATING EXPENDITURES
0500
1,0001,5002,0002,5003,0003,5004,0004,500
In M
nP
LUZ
VIS
MIN
LUZ
VIS
MIN
LUZ
VIS
MIN
LUZ
VIS
MIN
LUZ
VIS
MIN
LUZ
VIS
MIN
2005 2006 2007 2008 2009 2010
0500
1,0001,5002,0002,5003,0003,5004,0004,500
In M
nP
LUZ
VIS
MIN
LUZ
VIS
MIN
LUZ
VIS
MIN
LUZ
VIS
MIN
LUZ
VIS
MIN
LUZ
VIS
MIN
2005 2006 2007 2008 2009 2010Non-Network RelatedNetwork RelatedPayroll
18-Oct-05 Corporate Planning Group
TransCo33
TransCo Opex/MVA Installed (Real)
0
50
100
150
200
250
300
2003 2004 2005 2006 2007 2008 2009 2010
SKM Report Revised by TransCo
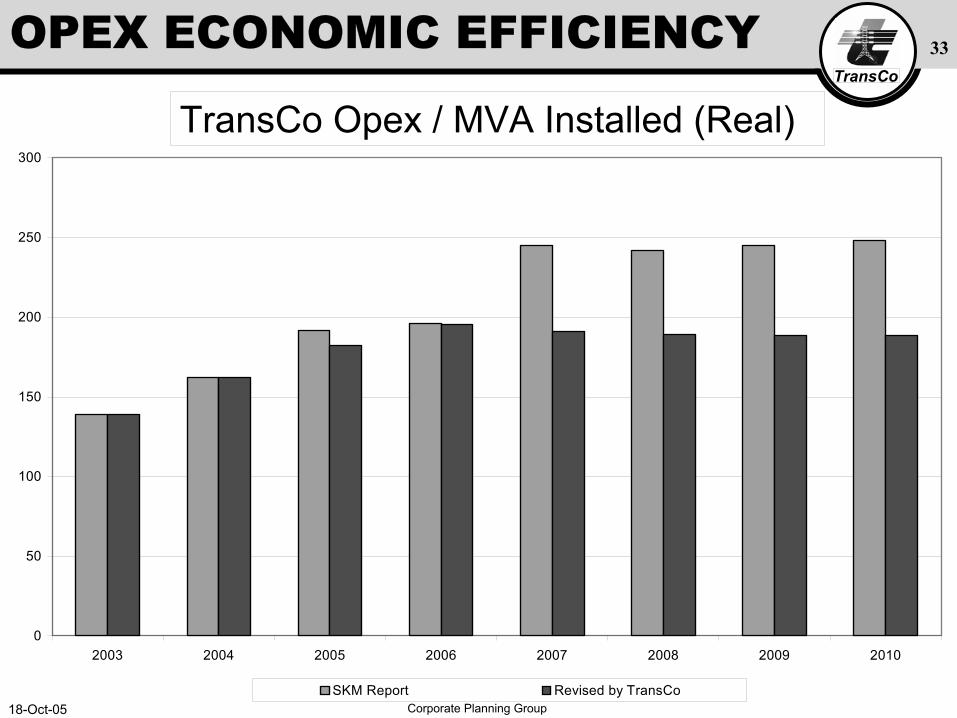
OPEX ECONOMIC EFFICIENCY
TransCo Opex / MVA Installed (Real)
18-Oct-05 Corporate Planning Group
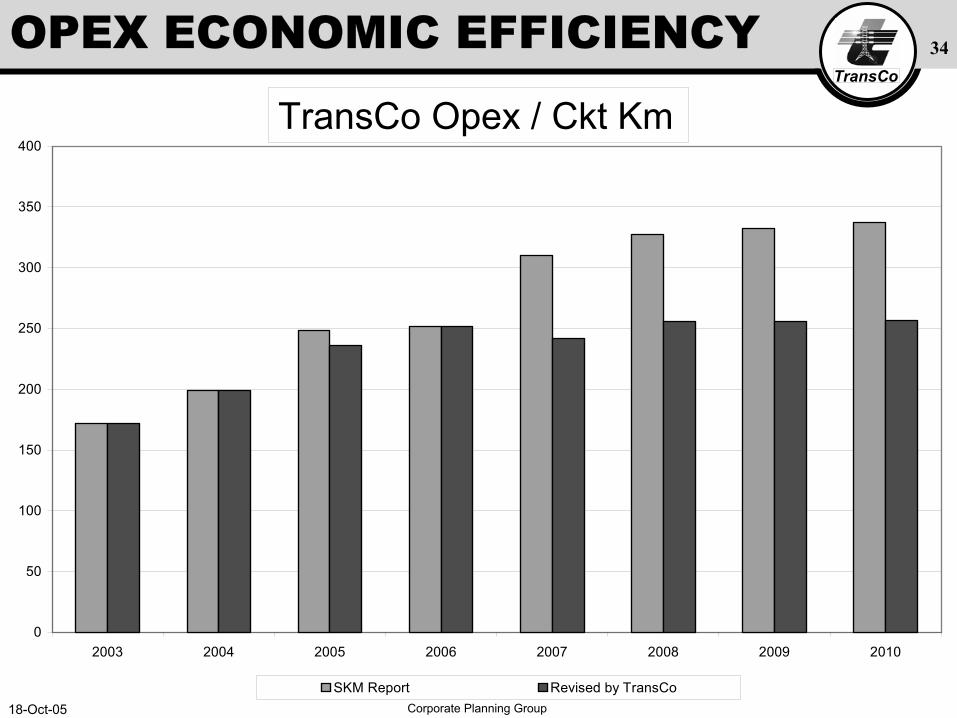
TransCo34OPEX ECONOMIC EFFICIENCY
TransCo Opex/Cct Km
0
50
100
150
200
250
300
350
400
2003 2004 2005 2006 2007 2008 2009 2010
SKM Report Revised by TransCo
TransCo Opex / Ckt Km
18-Oct-05 Corporate Planning Group
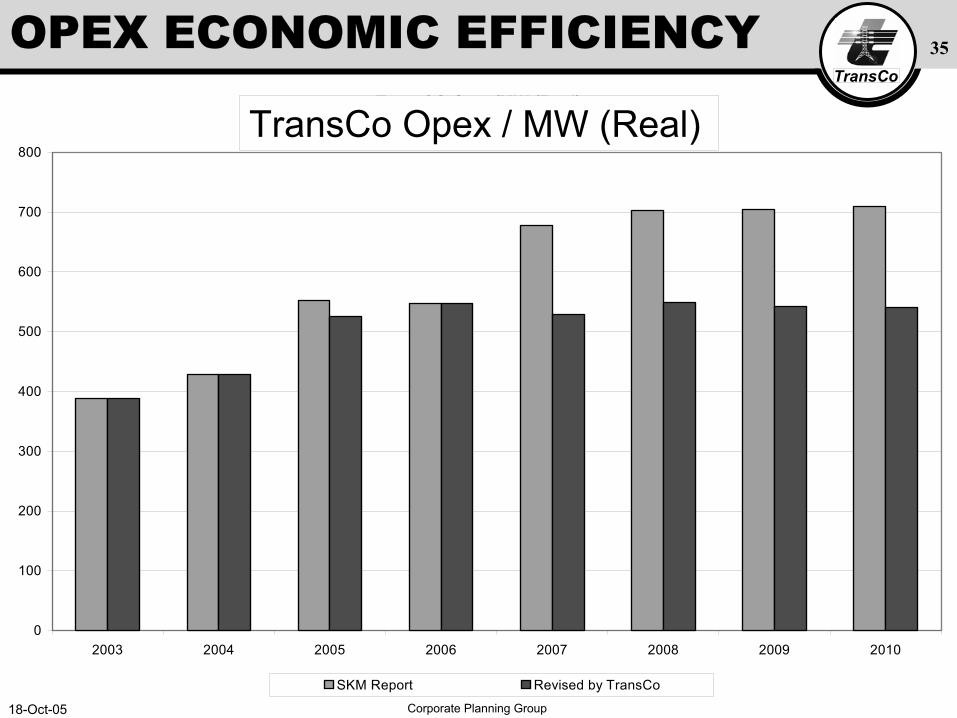
TransCo35
TransCO Opex/MW (Real)
0
100
200
300
400
500
600
700
800
2003 2004 2005 2006 2007 2008 2009 2010
SKM Report Revised by TransCo
OPEX ECONOMIC EFFICIENCY
TransCo Opex / MW (Real)
18-Oct-05 Corporate Planning Group
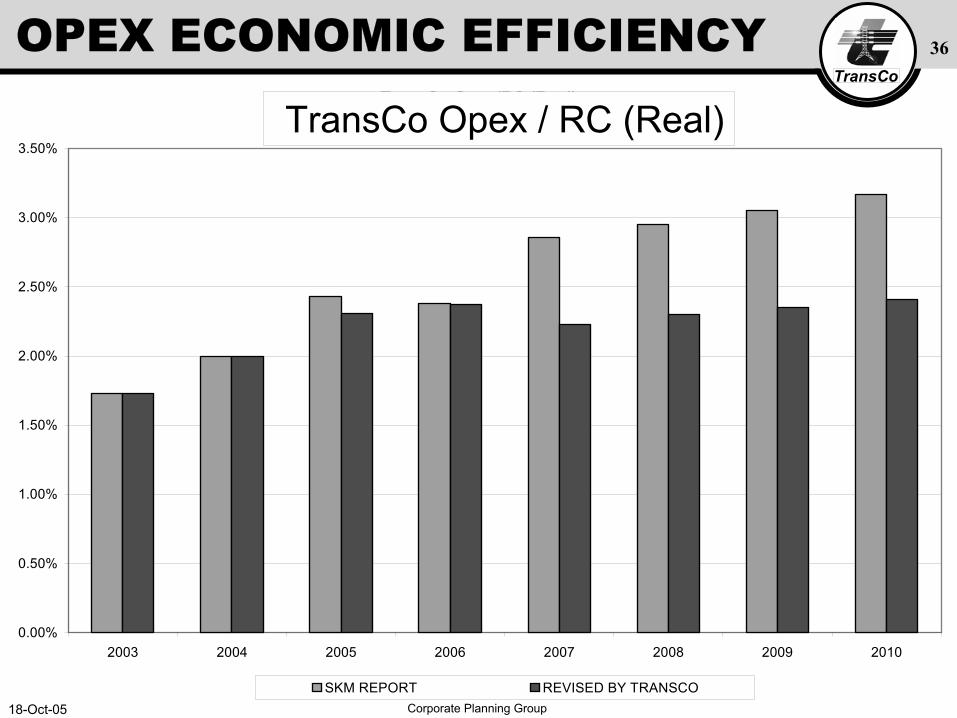
TransCo36
TransCo Opex/RC (Real)
0.00%
0.50%
1.00%
1.50%
2.00%
2.50%
3.00%
3.50%
2003 2004 2005 2006 2007 2008 2009 2010
SKM REPORT REVISED BY TRANSCO
OPEX ECONOMIC EFFICIENCY
TransCo Opex / RC (Real)
18-Oct-05 Corporate Planning Group
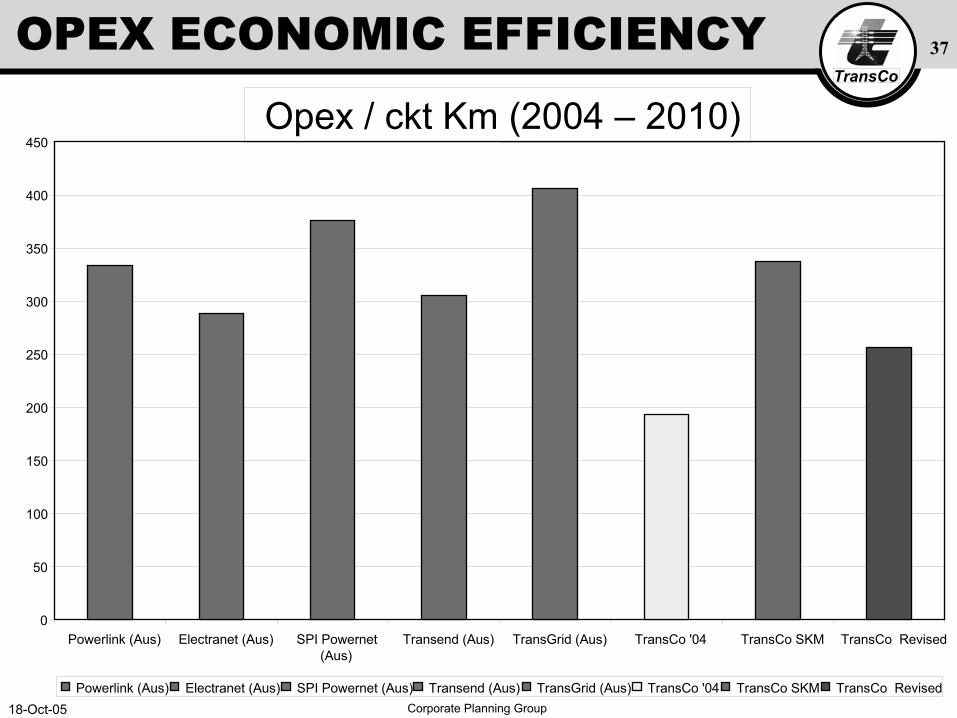
TransCo37OPEX ECONOMIC EFFICIENCY
Opex / ckt Km (2004 – 2010)
0
50
100
150
200
250
300
350
400
450
Powerlink (Aus) Electranet (Aus) SPI Powernet(Aus)
Transend (Aus) TransGrid (Aus) TransCo '04 TransCo SKM TransCo Revised
Powerlink (Aus) Electranet (Aus) SPI Powernet (Aus) Transend (Aus) TransGrid (Aus) TransCo '04 TransCo SKM TransCo Revised
18-Oct-05 Corporate Planning Group
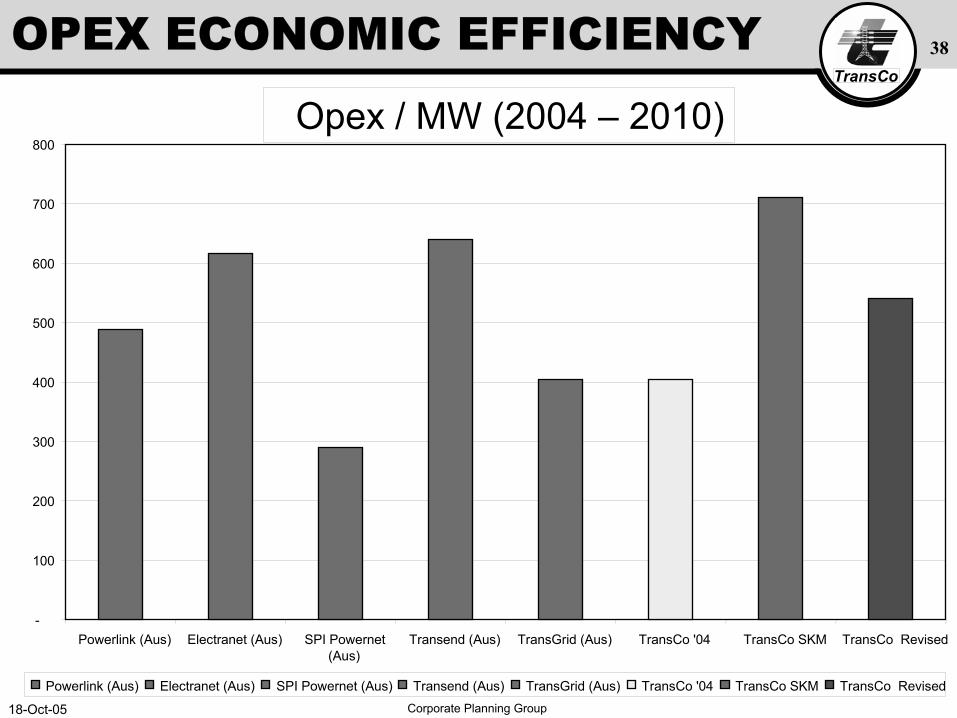
TransCo38OPEX ECONOMIC EFFICIENCY
Opex / MW (2004 – 2010)
-
100
200
300
400
500
600
700
800
Powerlink (Aus) Electranet (Aus) SPI Powernet(Aus)
Transend (Aus) TransGrid (Aus) TransCo '04 TransCo SKM TransCo Revised
Powerlink (Aus) Electranet (Aus) SPI Powernet (Aus) Transend (Aus) TransGrid (Aus) TransCo '04 TransCo SKM TransCo Revised
18-Oct-05 Corporate Planning Group
TransCo39
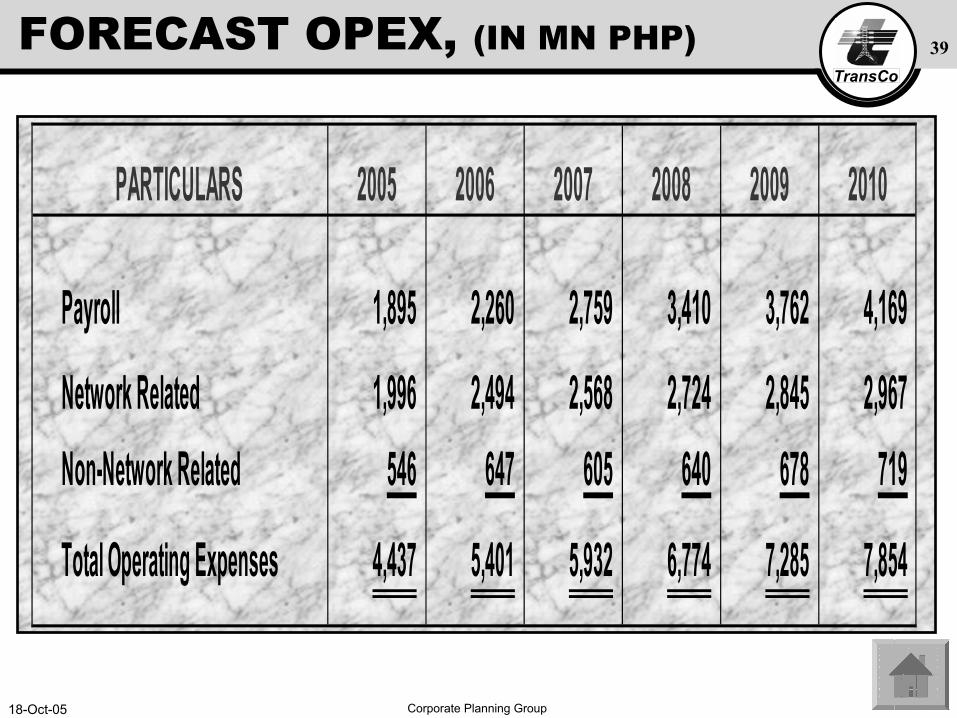
PARTICULARS 2005 2006 2007 2008 2009 2010
Payroll 1,895 2,260 2,759 3,410 3,762 4,169
Network Related 1,996 2,494 2,568 2,724 2,845 2,967 Non-Network Related 546 647 605 640 678 719
Total Operating Expenses 4,437 5,401 5,932 6,774 7,285 7,854
FORECAST OPEX, (IN MN PHP)
TransCo
RETURN OF CAPITAL (DEPRECIATION) AND RETURN ON CAPITAL
National Transmission Corporation
TransCo
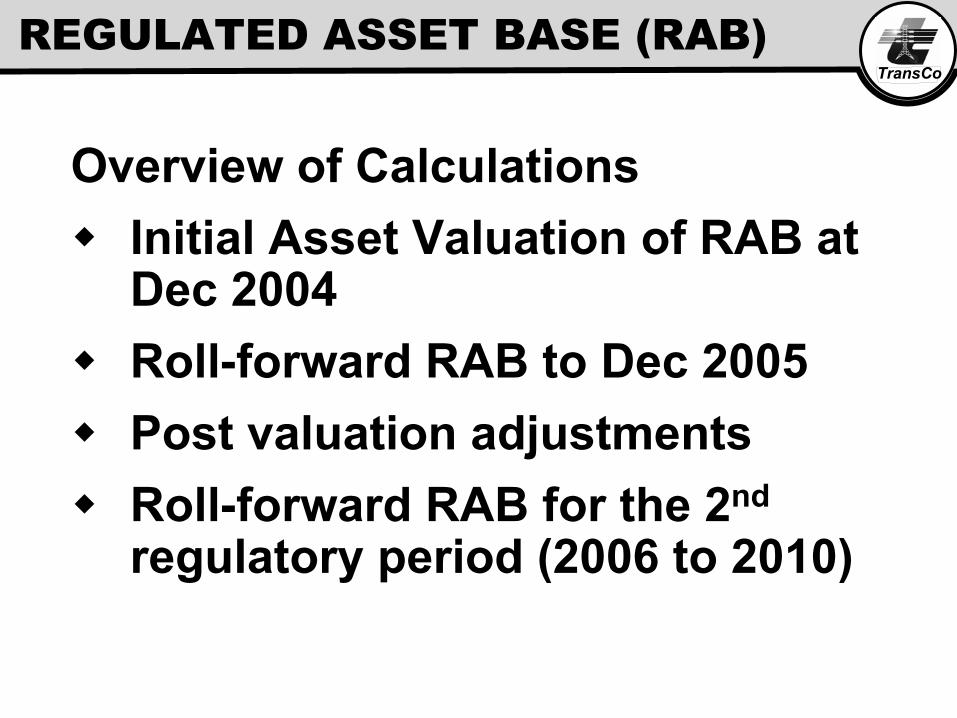
REGULATED ASSET BASE (RAB)
Overview of CalculationsInitial Asset Valuation of RAB at Dec 2004Roll-forward RAB to Dec 2005Post valuation adjustmentsRoll-forward RAB for the 2nd
regulatory period (2006 to 2010)
18-Oct-05 Corporate Planning Group
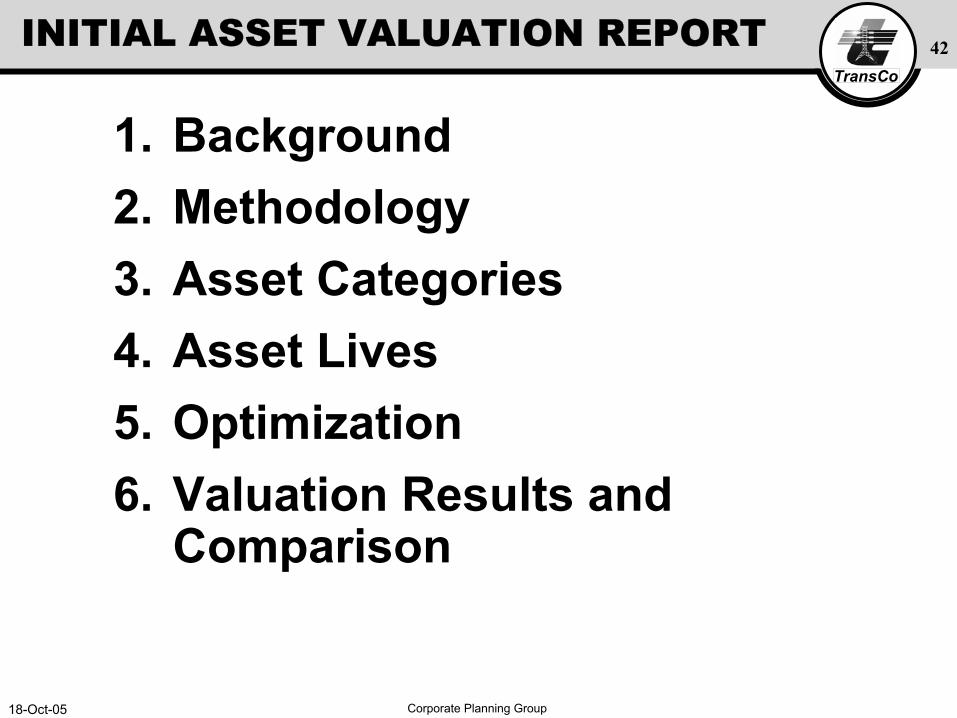
TransCo42INITIAL ASSET VALUATION REPORT
1. Background2. Methodology3. Asset Categories4. Asset Lives5. Optimization6. Valuation Results and
Comparison
18-Oct-05 Corporate Planning Group
TransCo43BACKGROUND
• Transmission Wheeling Rates Guidelines -TWRG Sec. 4.6.1 and 4.6.2 (c)
• TransCo 2004 External Asset Revaluation Project Contractor:
Independent experts experienced in regulated regimeERC accredited assessors
TransCo complied with the procurement process of RA 9184
18-Oct-05 Corporate Planning Group
TransCo44VALUATION METHODOLOGY
• Indexation
• Absolute valuation using Replacement Cost Analysis
• Absolute valuation using Modern Equivalent Asset (MEA) analysis
18-Oct-05 Corporate Planning Group
TransCo45INDEXATION DEFINITION
• Adjusting value over time using statistical index like Consumer Price Index (CPI)
18-Oct-05 Corporate Planning Group
TransCo46REPLACEMENT COST ANALYSIS DEFINITION
• This method of valuation involves valuing the relevantassets at their current unit prices multiplied by their volumes.
18-Oct-05 Corporate Planning Group
TransCo47MEA DEFINITION
• Modern Equivalent Asset (MEA) -is the asset which, in the normal course of business, the transmission entity would use to replace the existing asset if it were to be replaced today
18-Oct-05 Corporate Planning Group
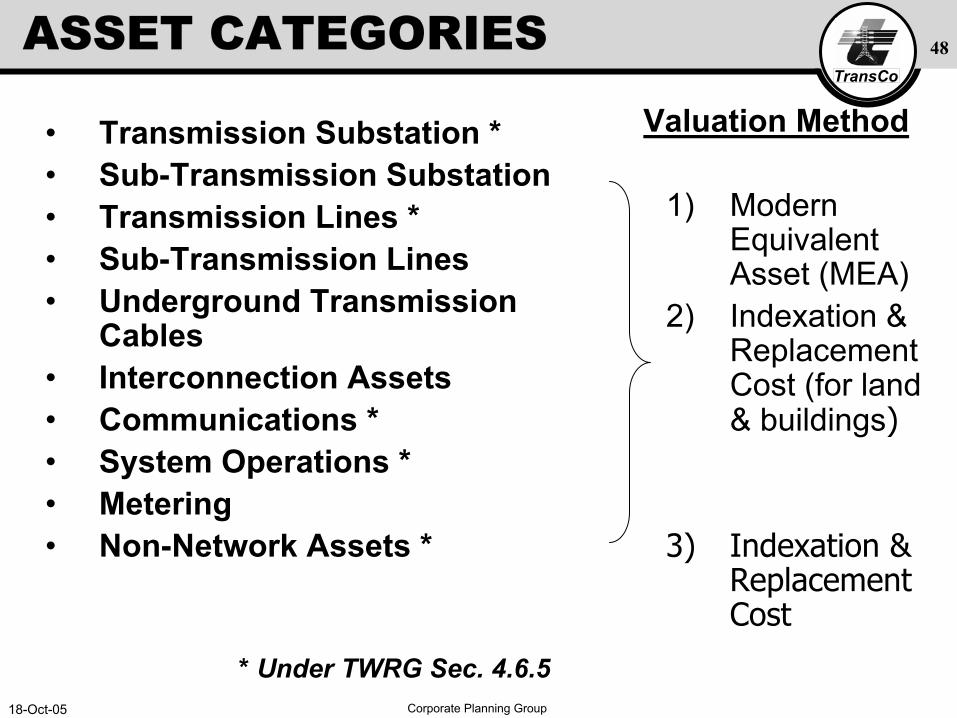
TransCo48ASSET CATEGORIES
• Transmission Substation *• Sub-Transmission Substation• Transmission Lines *• Sub-Transmission Lines• Underground Transmission
Cables• Interconnection Assets• Communications *• System Operations *• Metering• Non-Network Assets *
Valuation Method
1) Modern Equivalent Asset (MEA)
2) Indexation & Replacement Cost (for land & buildings)
3) Indexation & Replacement Cost
* Under TWRG Sec. 4.6.5
18-Oct-05 Corporate Planning Group
TransCo49
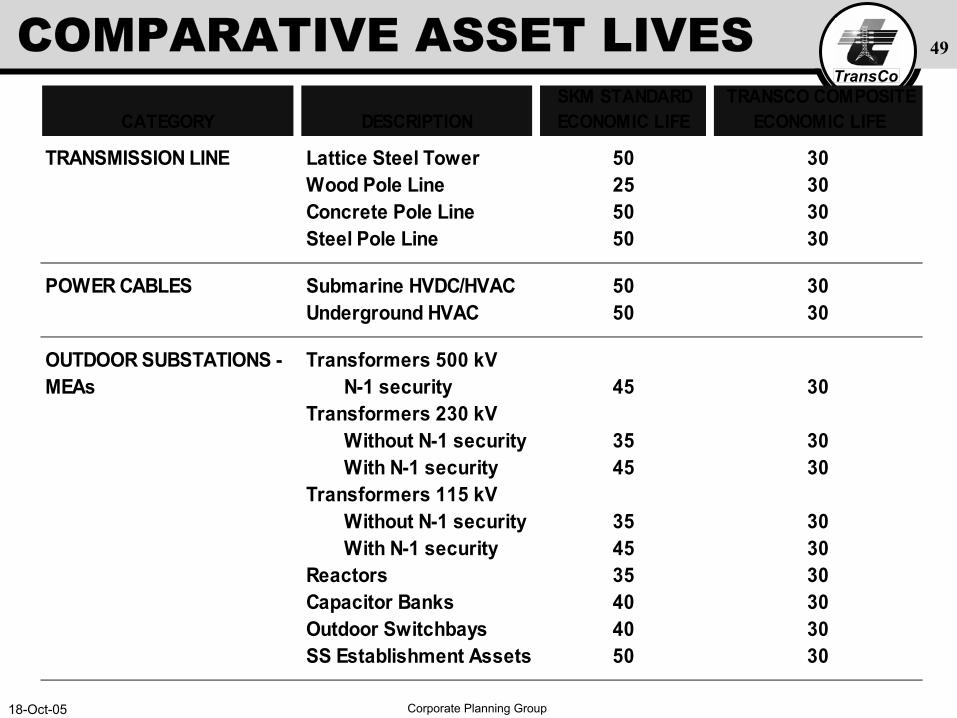
CATEGORY DESCRIPTION SKM STANDARDECONOMIC LIFE
TRANSCO COMPOSITEECONOMIC LIFE
TRANSMISSION LINE Lattice Steel Tower 50 30Wood Pole Line 25 30Concrete Pole Line 50 30Steel Pole Line 50 30
POWER CABLES Submarine HVDC/HVAC 50 30Underground HVAC 50 30
OUTDOOR SUBSTATIONS - Transformers 500 kVMEAs N-1 security 45 30
Transformers 230 kVWithout N-1 security 35 30With N-1 security 45 30
Transformers 115 kVWithout N-1 security 35 30With N-1 security 45 30
Reactors 35 30Capacitor Banks 40 30Outdoor Switchbays 40 30SS Establishment Assets 50 30
COMPARATIVE ASSET LIVES
18-Oct-05 Corporate Planning Group
TransCo50
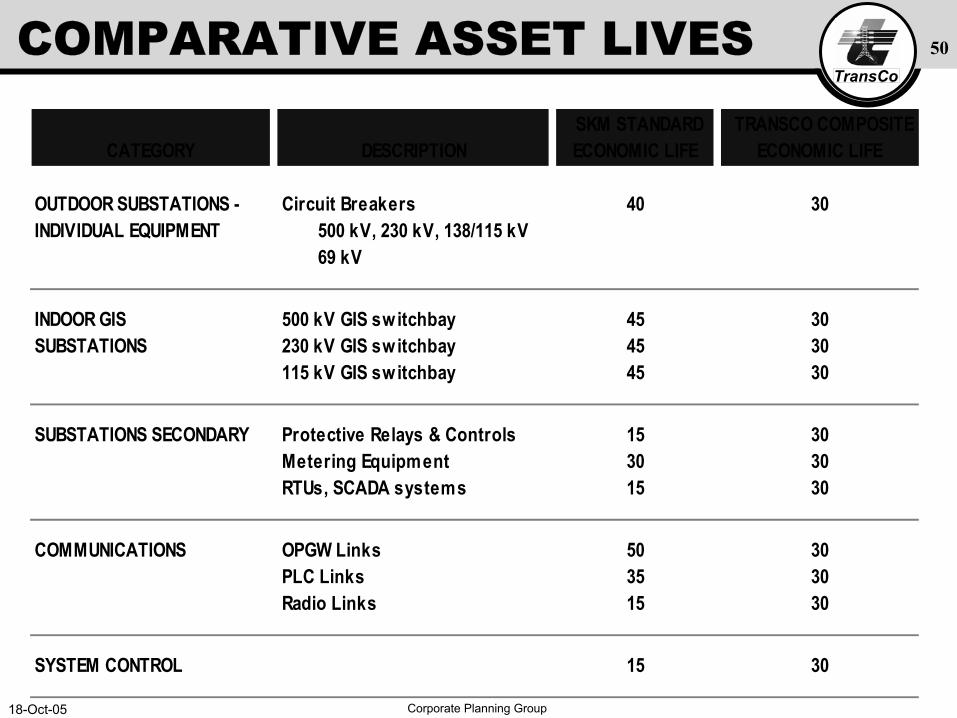
CATEGORY DESCRIPTION SKM STANDARDECONOMIC LIFE
TRANSCO COMPOSITEECONOMIC LIFE
OUTDOOR SUBSTATIONS - Circuit Breakers 40 30INDIVIDUAL EQUIPMENT 500 kV, 230 kV, 138/115 kV
69 kV
INDOOR GIS 500 kV GIS switchbay 45 30SUBSTATIONS 230 kV GIS switchbay 45 30
115 kV GIS switchbay 45 30
SUBSTATIONS SECONDARY Protective Relays & Controls 15 30Metering Equipment 30 30RTUs, SCADA systems 15 30
COMMUNICATIONS OPGW Links 50 30PLC Links 35 30Radio Links 15 30
SYSTEM CONTROL 15 30
COMPARATIVE ASSET LIVES
18-Oct-05 Corporate Planning Group
TransCo51OPTIMIZATION
• Eliminate unnecessary redundant assets;
• Eliminate over design of assets; and
• Eliminate over capacity in the network• Applied to transformer, transmission
and sub-transmission lines
18-Oct-05 Corporate Planning Group
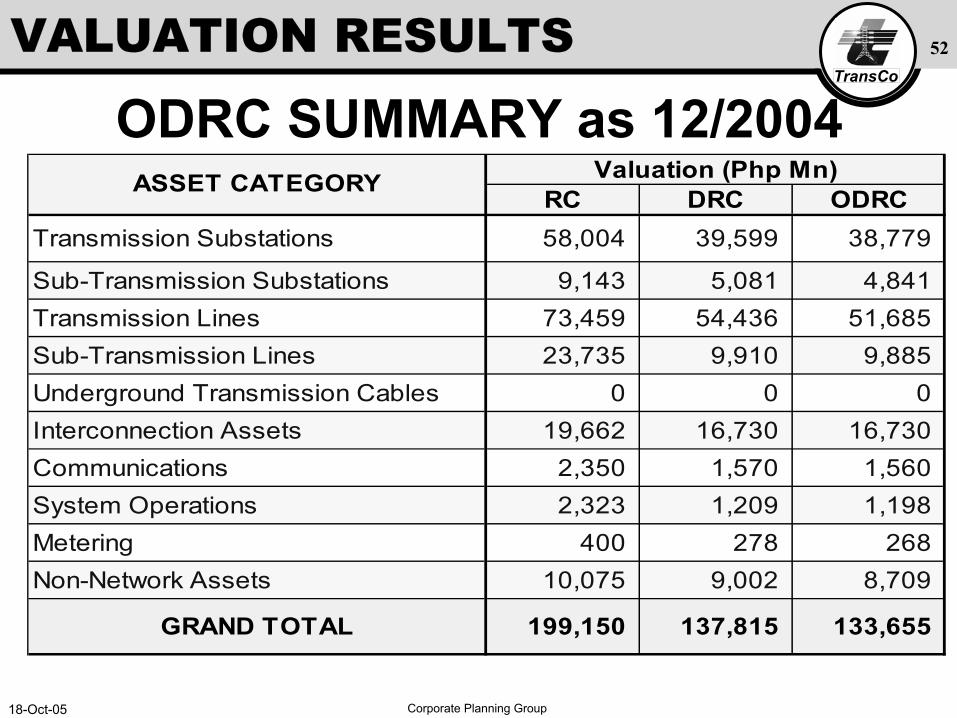
TransCo52VALUATION RESULTS
ODRC SUMMARY as 12/2004Valuation (Php Mn)
RC DRC ODRCTransmission Substations 58,004 39,599 38,779
Sub-Transmission Substations 9,143 5,081 4,841Transmission Lines 73,459 54,436 51,685Sub-Transmission Lines 23,735 9,910 9,885Underground Transmission Cables 0 0 0Interconnection Assets 19,662 16,730 16,730Communications 2,350 1,570 1,560System Operations 2,323 1,209 1,198Metering 400 278 268Non-Network Assets 10,075 9,002 8,709
GRAND TOTAL 199,150 137,815 133,655
ASSET CATEGORY
18-Oct-05 Corporate Planning Group
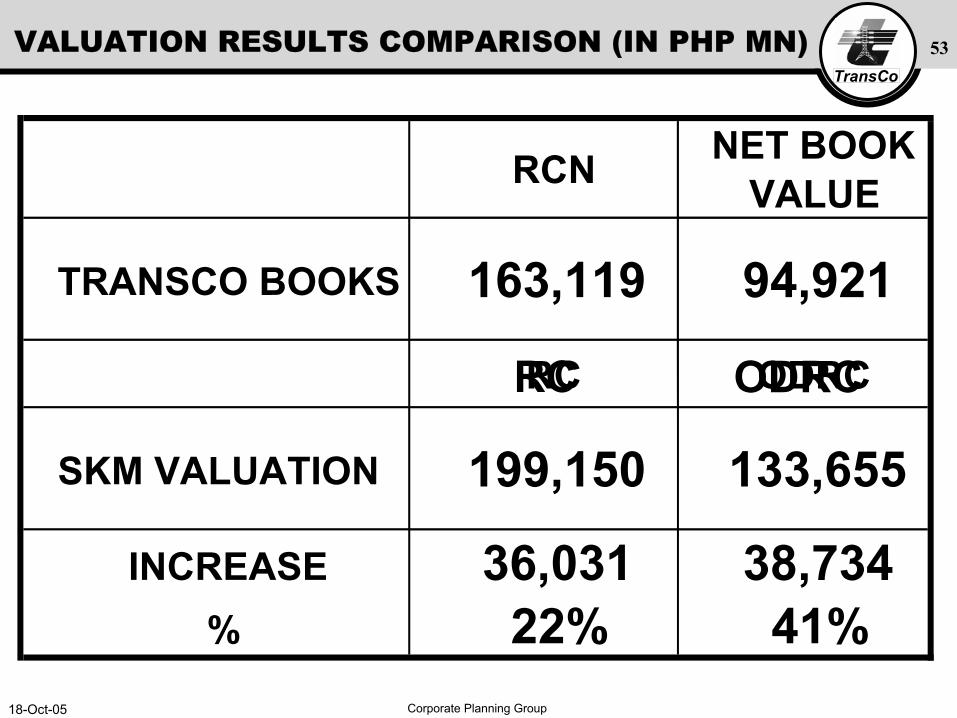
TransCo53VALUATION RESULTS COMPARISON (IN PHP MN)
RCN NET BOOK VALUE
TRANSCO BOOKS 163,119 94,921
RC ODRC
SKM VALUATION 199,150 133,655
INCREASE 36,031 38,734% 22% 41%
RC ODRC
TransCo
REGULATORY ASSET BASE:ROLLED FORWARD TO JAN 1, 2005
National Transmission Corporation
18-Oct-05 Corporate Planning Group
TransCo55ROLLED FORWARD ANALYSIS
Sec 4.6.10 of the TWRG requires that the initial revaluation report must estimate the rolled-forward depreciated RAB for each asset category at the start of the 2nd Regulatory Period i.e. January 2006.
18-Oct-05 Corporate Planning Group
TransCo56ROLLED FORWARD ANALYSIS
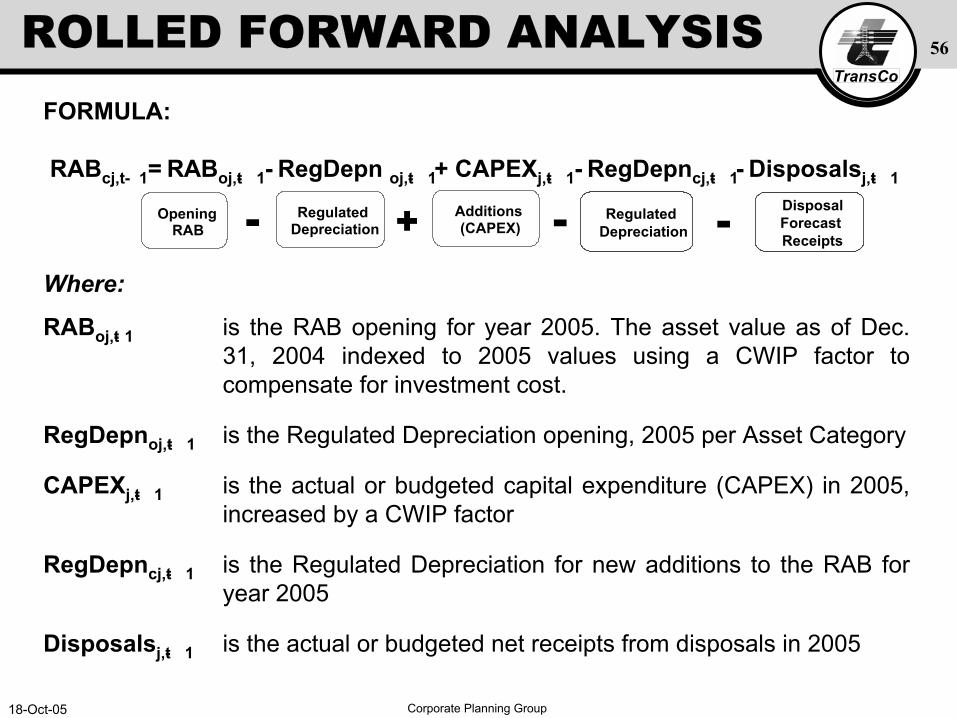
FORMULA:
RABcj,t- 1= RABoj,t- 1- RegDepn oj,t- 1+ CAPEXj,t- 1- RegDepncj,t- 1 - Disposalsj,t- 1
Where:
RABoj,t- 1 is the RAB opening for year 2005. The asset value as of Dec. 31, 2004 indexed to 2005 values using a CWIP factor to compensate for investment cost.
RegDepnoj,t- 1 is the Regulated Depreciation opening, 2005 per Asset Category
CAPEXj,t- 1 is the actual or budgeted capital expenditure (CAPEX) in 2005, increased by a CWIP factor
RegDepncj,t- 1 is the Regulated Depreciation for new additions to the RAB for year 2005
Disposalsj,t- 1 is the actual or budgeted net receipts from disposals in 2005
- + --Opening RAB
Regulated Depreciation
Additions (CAPEX)
Regulated Depreciation
DisposalForecast Receipts
18-Oct-05 Corporate Planning Group
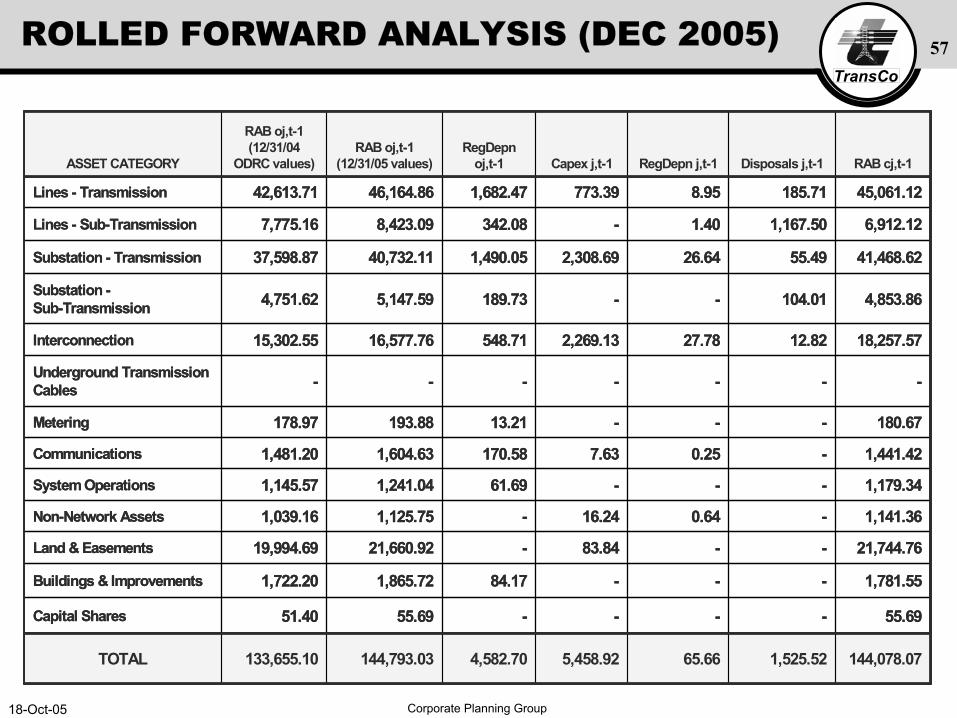
TransCo57ROLLED FORWARD ANALYSIS (DEC 2005)
144,078.07 1,525.52 65.66 5,458.92 4,582.70 144,793.03 133,655.10 TOTAL
55.69 ----55.69 51.40 Capital Shares
1,781.55 ---84.17 1,865.72 1,722.20 Buildings & Improvements
21,744.76 --83.84 -21,660.92 19,994.69 Land & Easements
1,141.36 -0.64 16.24 -1,125.75 1,039.16 Non-Network Assets
1,179.34 ---61.69 1,241.04 1,145.57 System Operations
1,441.42 -0.25 7.63 170.58 1,604.63 1,481.20 Communications
180.67 ---13.21 193.88 178.97 Metering
-------Underground Transmission Cables
18,257.57 12.82 27.78 2,269.13 548.71 16,577.76 15,302.55 Interconnection
4,853.86 104.01 --189.73 5,147.59 4,751.62 Substation -Sub-Transmission
41,468.62 55.49 26.64 2,308.69 1,490.05 40,732.11 37,598.87 Substation - Transmission
6,912.12 1,167.50 1.40 -342.08 8,423.09 7,775.16 Lines - Sub-Transmission
45,061.12 185.71 8.95 773.39 1,682.47 46,164.86 42,613.71 Lines - Transmission
RAB cj,t-1Disposals j,t-1RegDepn j,t-1Capex j,t-1RegDepn
oj,t-1RAB oj,t-1
(12/31/05 values)
RAB oj,t-1(12/31/04
ODRC values)ASSET CATEGORY
18-Oct-05 Corporate Planning Group
TransCo58REGULATORY DEPRECIATION
• Depreciation is calculated on a straight line basis (TWRG 4.8.1);
• Depreciation includes depreciation on opening asset (ODRC valuation) and depreciation on capital expenditure within the regulatory period; and
• Expressed in nominal terms
18-Oct-05 Corporate Planning Group
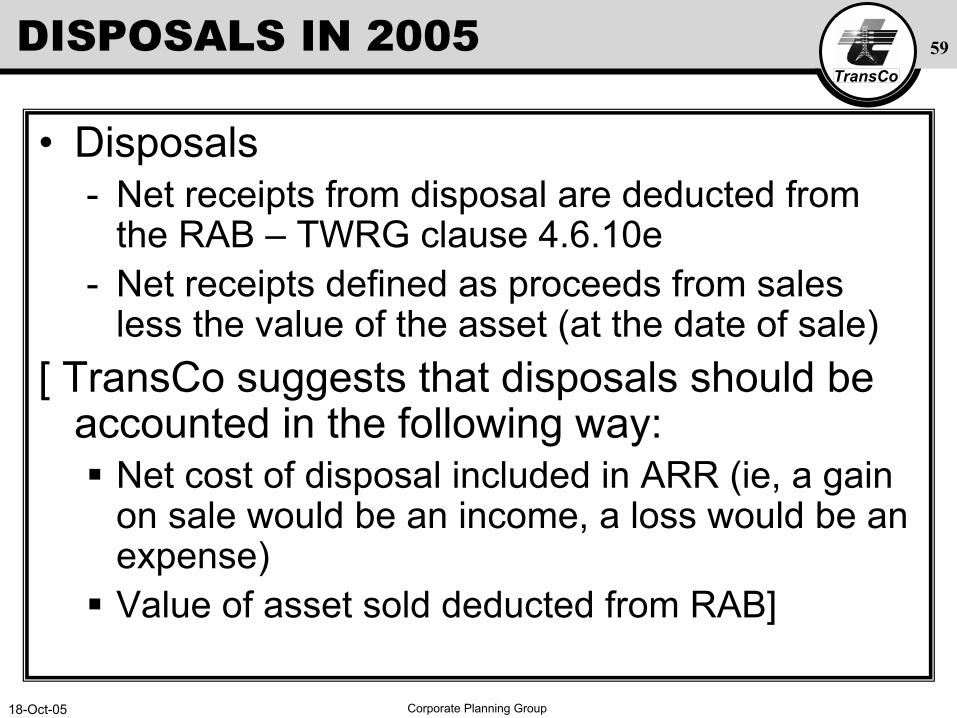
TransCo59DISPOSALS IN 2005
• Disposals- Net receipts from disposal are deducted from
the RAB – TWRG clause 4.6.10e- Net receipts defined as proceeds from sales
less the value of the asset (at the date of sale)[ TransCo suggests that disposals should be
accounted in the following way:Net cost of disposal included in ARR (ie, a gain on sale would be an income, a loss would be an expense)Value of asset sold deducted from RAB]
18-Oct-05 Corporate Planning Group
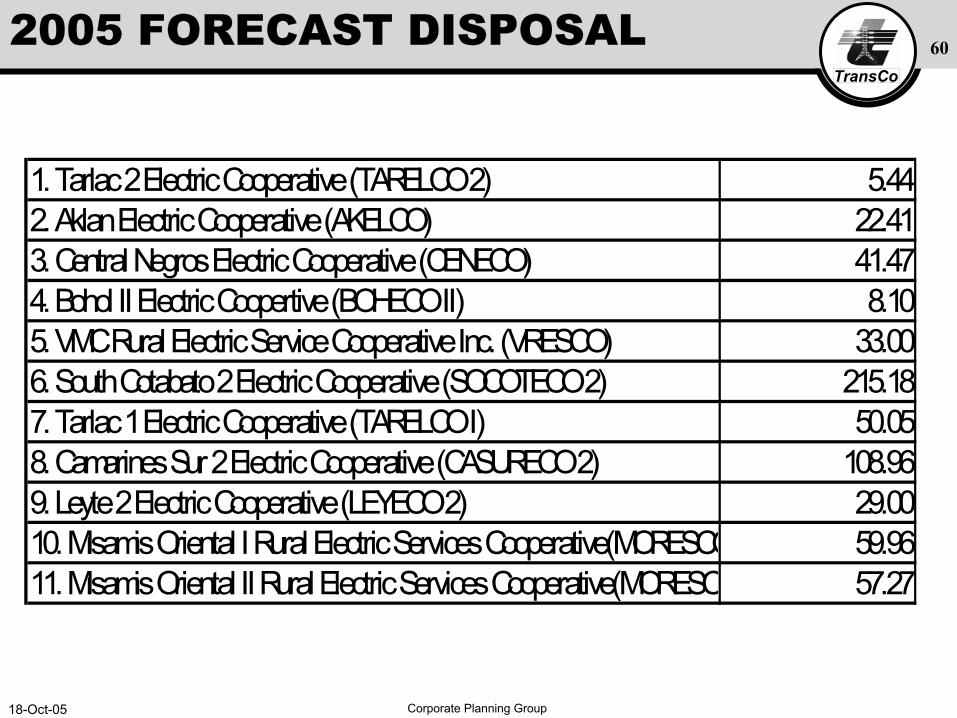
TransCo602005 FORECAST DISPOSAL
1. Tarlac 2 Electric Cooperative (TARELCO 2) 5.442. Aklan Electric Cooperative (AKELCO) 22.413. Central Negros Electric Cooperative (CENECO) 41.474. Bohol II Electric Coopertive (BOHECO II) 8.105. VMC Rural Electric Service Cooperative Inc. (VRESCO) 33.006. South Cotabato 2 Electric Cooperative (SOCOTECO 2) 215.187. Tarlac 1 Electric Cooperative (TARELCO I) 50.058. Camarines Sur 2 Electric Cooperative (CASURECO 2) 108.969. Leyte 2 Electric Cooperative (LEYECO 2) 29.0010. Misamis Oriental I Rural Electric Services Cooperative(MORESCO 59.9611. Misamis Oriental II Rural Electric Services Cooperative(MORESC 57.27
18-Oct-05 Corporate Planning Group
TransCo61
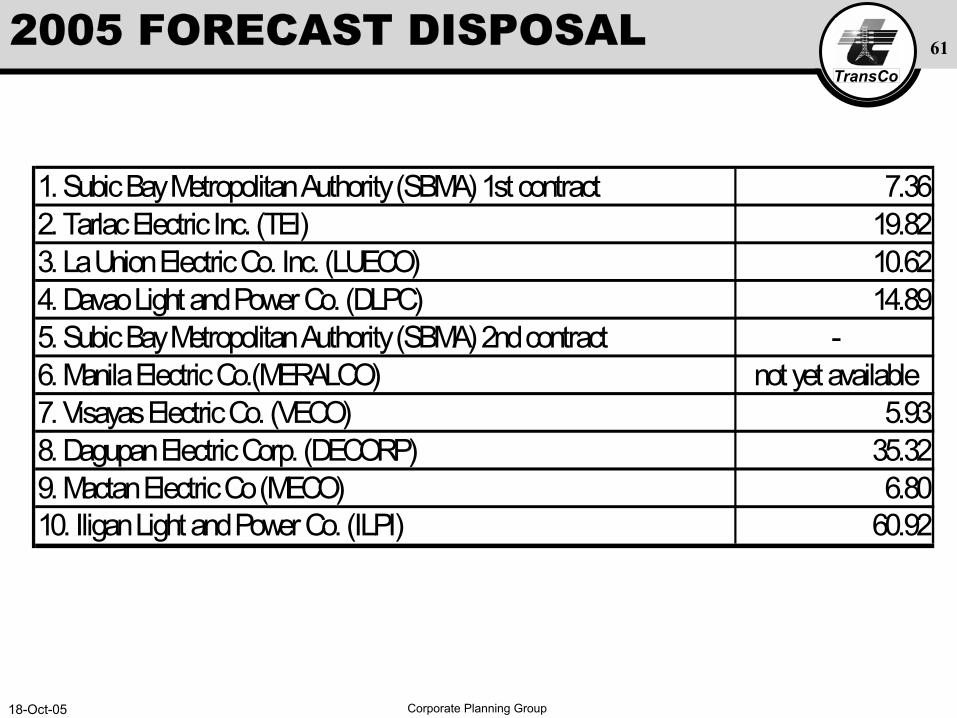
1. Subic Bay Metropolitan Authority (SBMA) 1st contract 7.362. Tarlac Electric Inc. (TEI) 19.823. La Union Electric Co. Inc. (LUECO) 10.624. Davao Light and Power Co. (DLPC) 14.895. Subic Bay Metropolitan Authority (SBMA) 2nd contract -6. Manila Electric Co.(MERALCO) not yet available7. Visayas Electric Co. (VECO) 5.938. Dagupan Electric Corp. (DECORP) 35.329. Mactan Electric Co (MECO) 6.8010. Iligan Light and Power Co. (ILPI) 60.92
2005 FORECAST DISPOSAL
18-Oct-05 Corporate Planning Group
TransCo62POST VALUATION ADJUSTMENTS
• Post valuation adjustments made:
-To account for missing assets
-Update WACC used in CWIP factor
18-Oct-05 Corporate Planning Group
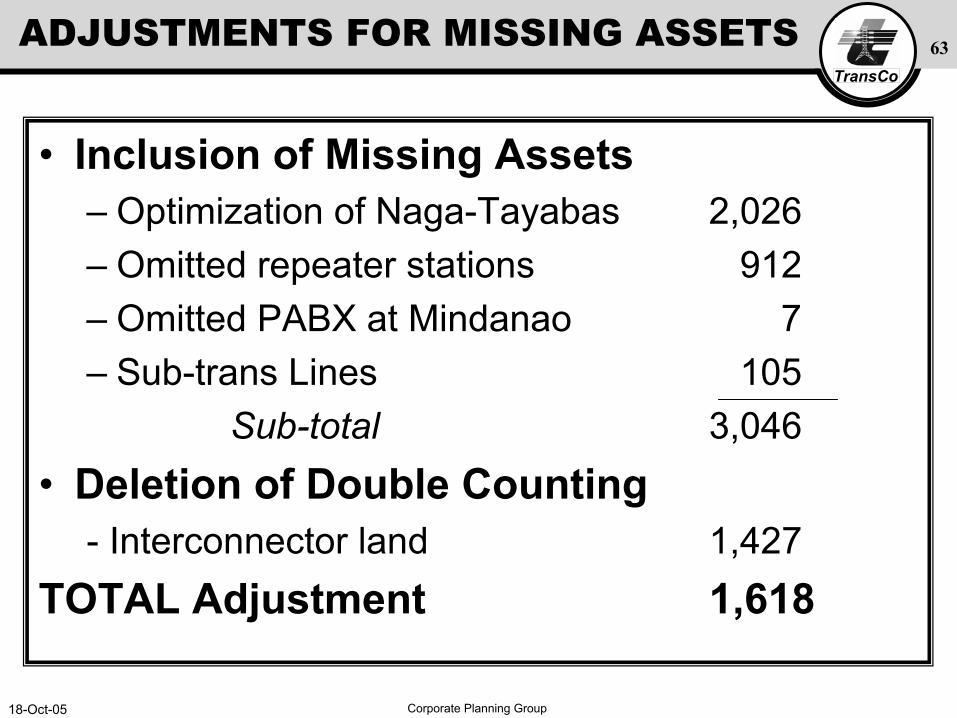
TransCo63ADJUSTMENTS FOR MISSING ASSETS
• Inclusion of Missing Assets– Optimization of Naga-Tayabas 2,026– Omitted repeater stations 912– Omitted PABX at Mindanao 7– Sub-trans Lines 105
Sub-total 3,046• Deletion of Double Counting
- Interconnector land 1,427TOTAL Adjustment 1,618
18-Oct-05 Corporate Planning Group
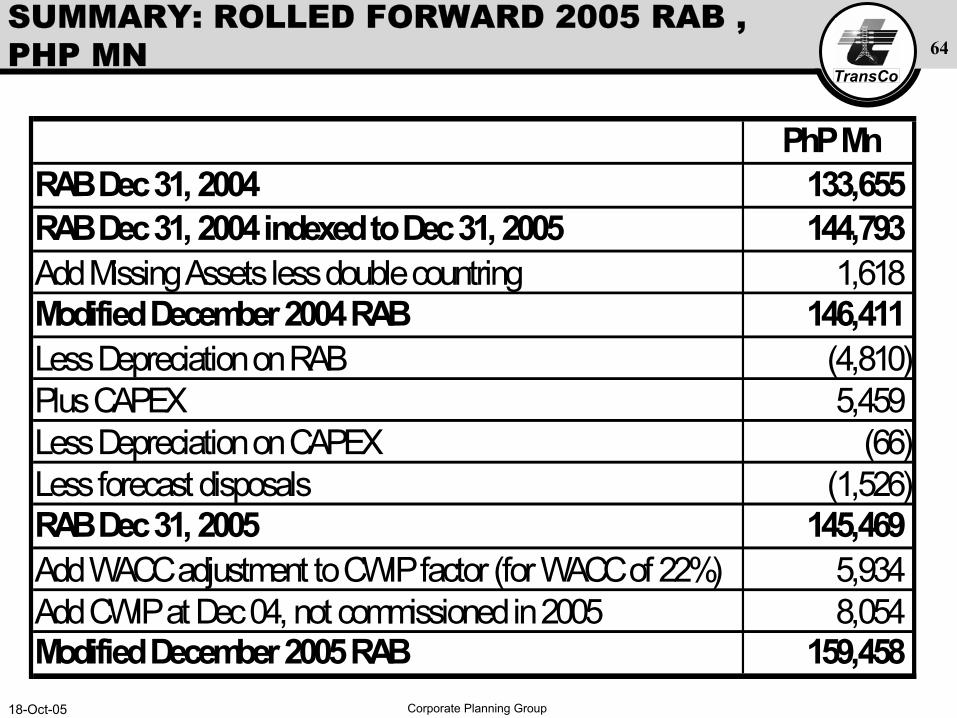
TransCo64
SUMMARY: ROLLED FORWARD 2005 RAB , PHP MN
PhP MnRAB Dec 31, 2004 133,655 RAB Dec 31, 2004 indexed to Dec 31, 2005 144,793 Add Missing Assets less double countring 1,618 Modified December 2004 RAB 146,411 Less Depreciation on RAB (4,810) Plus CAPEX 5,459 Less Depreciation on CAPEX (66) Less forecast disposals (1,526) RAB Dec 31, 2005 145,469 Add WACC adjustment to CWIP factor (for WACC of 22%) 5,934 Add CWIP at Dec 04, not commissioned in 2005 8,054 Modified December 2005 RAB 159,458
18-Oct-05 Corporate Planning Group
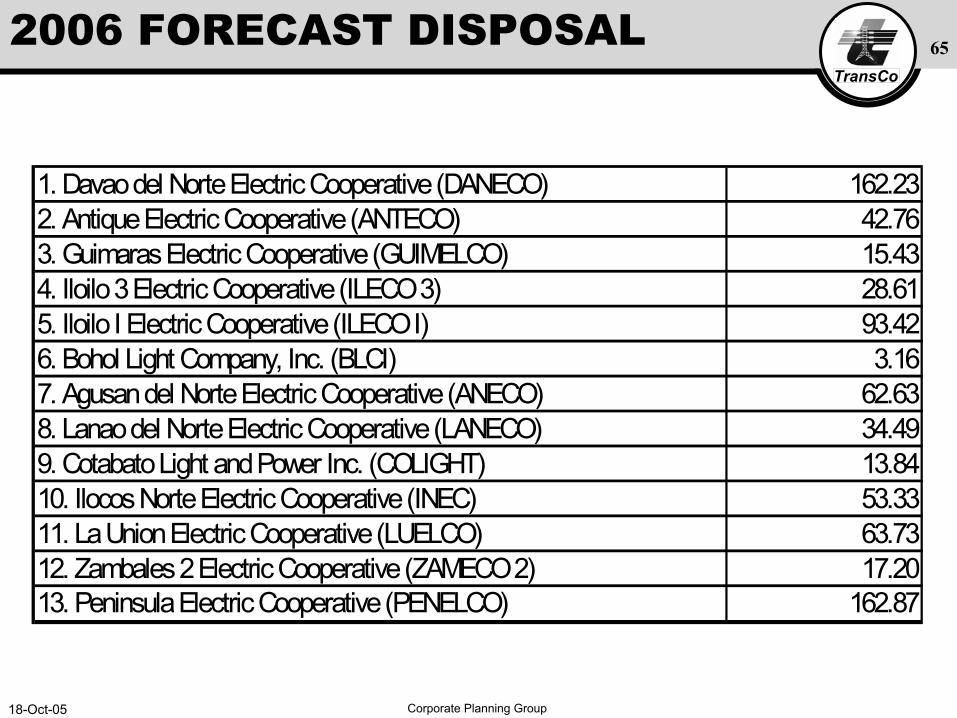
TransCo652006 FORECAST DISPOSAL
1. Davao del Norte Electric Cooperative (DANECO) 162.232. Antique Electric Cooperative (ANTECO) 42.763. Guimaras Electric Cooperative (GUIMELCO) 15.434. Iloilo 3 Electric Cooperative (ILECO 3) 28.615. Iloilo I Electric Cooperative (ILECO I) 93.426. Bohol Light Company, Inc. (BLCI) 3.167. Agusan del Norte Electric Cooperative (ANECO) 62.638. Lanao del Norte Electric Cooperative (LANECO) 34.499. Cotabato Light and Power Inc. (COLIGHT) 13.8410. Ilocos Norte Electric Cooperative (INEC) 53.3311. La Union Electric Cooperative (LUELCO) 63.7312. Zambales 2 Electric Cooperative (ZAMECO 2) 17.2013. Peninsula Electric Cooperative (PENELCO) 162.87
18-Oct-05 Corporate Planning Group
TransCo66
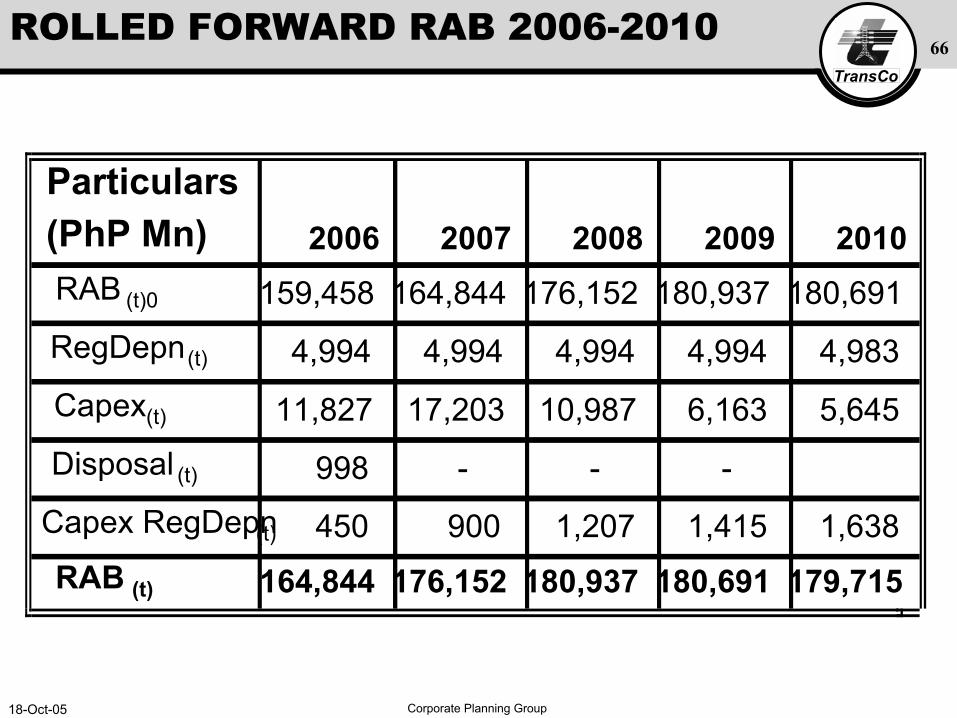
ROLLED FORWARD RAB 2006-2010
Particulars (PhP Mn) 2006 2007 2008 2009 2010RAB (t)0 159,458 164,844 176,152 180,937 180,691
RegDepn(t) 4,994 4,994 4,994 4,994 4,983
Capex(t) 11,827 17,203 10,987 6,163 5,645
Disposal (t) 998 - - -
Capex RegDepn(t) 450 900 1,207 1,415 1,638RAB (t) 164,844 176,152 180,937 180,691 179,715
TransCo
FORECAST CAPEX
National Transmission Corporation
TransCo
Rationale
Part of TransCo’s submission to the ERC for the
Second Regulatory Period (2006-2010)
(Per Sec. 4.10.1 of the TWRG)
Review of Forecast
CAPEX
Conclusion
Introduction
FORECAST CAPEX
TransCo
Methodology
References
Transmission Development Plan
TransCo’s costing methodology
TWRG and Issues Paper
TransCo’s Capex forecast
Project feasibility studies
Introduction
Review of Forecast
CAPEX
Conclusion
FORECAST CAPEX
TransCo
Methodology (cont’d)
References
Demand forecasts
DBM Economic and Fiscal Targets
Project cost estimates
Other TransCo documents
Interviews
Introduction
Review of Forecast
CAPEX
Conclusion
FORECAST CAPEX
TransCo
Adjustments Made
Conversion from nominal to real
IDC removed
Use of conservative forecast
Adjustment on capitalized overhead
Inclusion of transmission line easement
Introduction
Review of Forecast
CAPEX
Conclusion
FORECAST CAPEX
TransCo
CAPEX Forecasts SubmissionTWRG Requirements
Project Cost > P 50-Million
Asset categories
Individual project profile
Summary spreadsheets
Introduction
Review of Forecast
CAPEX
Conclusion
FORECAST CAPEX
TransCo
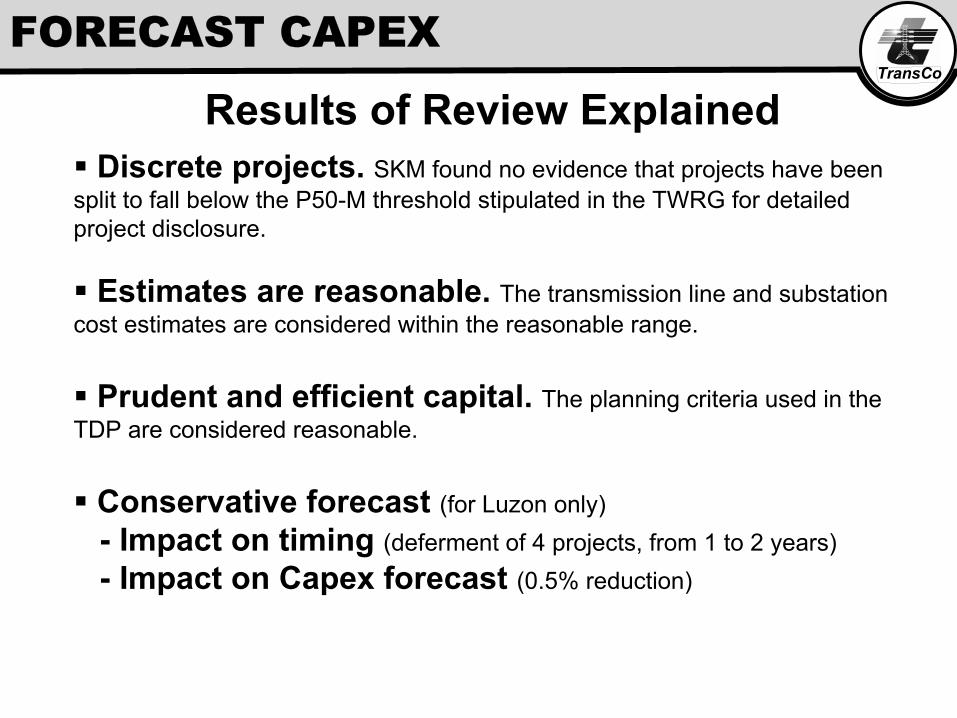
Results of Review ExplainedDiscrete projects. SKM found no evidence that projects have been
split to fall below the P50-M threshold stipulated in the TWRG for detailed project disclosure.
Estimates are reasonable. The transmission line and substation cost estimates are considered within the reasonable range.
Prudent and efficient capital. The planning criteria used in the TDP are considered reasonable.
Conservative forecast (for Luzon only)- Impact on timing (deferment of 4 projects, from 1 to 2 years)- Impact on Capex forecast (0.5% reduction)
FORECAST CAPEX
18-Oct-05 Corporate Planning Group
TransCo74
HHHH
HH
H
H
G
SIRAWAY
ZAMBALESBASE
ZAMBOANGA CITYPUTIK
SANGALI
TUNGAWAN
SALUG
MALANGAS
DINAS
DAPITAN
OROQUETACITY
MOLAVE
PAGADIANSTA.CLARA
BASILAN
AURORA
KAPATAGAN
LUGAIT
COTABATOCITY
NULING
LEBAK
MALABANG
KIAMBA
TACURONG
KORONADAL
KIBAWE
VALENCIA
PULANGUI
AGUSAN
TAGOLOAN
APLAYA
MARAMAG
MT.APO
DIGOS
MALITA
MALAPATAN
GLAN
TAGUMMACO
MATI
LUPON
APEXNORTHDAVAO
TINDALOCATEEL
BANGANGA
SURIGAOANISLAGAN
SANTIAGOCABADBARAN
MADRID
BUTUAN
BAYUGAN
NASIPIT
GINGOOGBALINGOAN
PSC
CAMIGUIN
CAGWAIT
BAROBO
TRENTO
MONTEVISTA
MAASIM
GEN.SANTOS
ABAGAH
KABACAN
MATALAM
H D
D
MABUHAY MIDSAYAP
ISULAN
SURALLAH
KIDAPAWAN
MARCELINODON
MONKAYO
ASUNCION
NEWLOON
D
KOLAMBUGAN
D
AMPAYON
TALOMO
B.BATANG
CARMEN
D
D
TO TONGONAN(VIA PANAON IS.)
SAN FERNANDO
(BADAS)
NABUNTURAN
FRANCISCOSAN
PNOC
BUNAWAN
MAA
H
1,2,3 & 5
TAGO
H
H
PITOGO
SAMAL IS.
SIARGAO IS.
DINAGAT IS.
TANDAG
MACO
C
MALAYBALAY
DALWANGAN
PULANCOCALAMBA
TALACOGON
MATANAOTAP
BANSALAN
SIOM
PANGI
STA.BARBARAT.DANDA
OZAMIS CITY
JIMENEZ
COGON
LANOY
SARI
POLOMOLOK
SIMUAY
MAGANOY
BALIGUIANTUBOD
SINDANGAN
COMPOSTELA
KM. 13
SAN ISIDRO
LUNOCAN
MAKILALA
TUPI
SIQUIL
MAITUM
MANIKLING
SULU
TAWI TAWI
PROSPERIDADKIRAHON
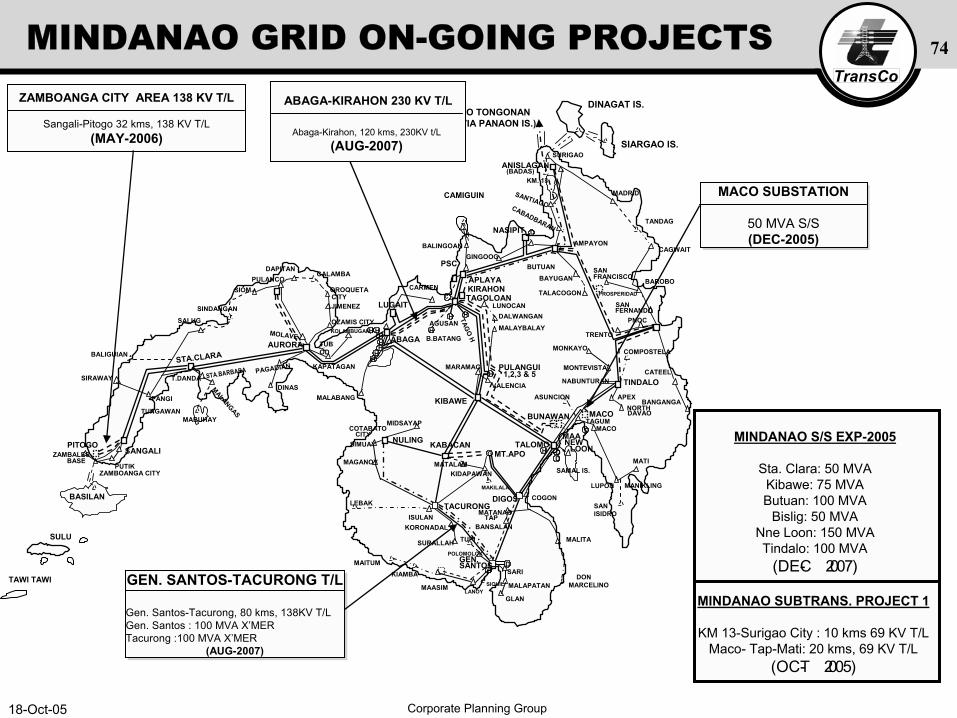
GEN. SANTOS-TACURONG T/L
Gen. Santos-Tacurong, 80 kms, 138KV T/LGen. Santos : 100 MVA X’MERTacurong :100 MVA X’MER
(AUG-2007)
ZAMBOANGA CITY AREA 138 KV T/L
Sangali-Pitogo 32 kms, 138 KV T/L(MAY-2006)
MACO SUBSTATION
50 MVA S/S(DEC-2005)
MINDANAO S/S EXP-2005
Sta. Clara: 50 MVAKibawe: 75 MVAButuan: 100 MVA
Bislig: 50 MVANne Loon: 150 MVATindalo: 100 MVA
(DEC- 2007)
MINDANAO SUBTRANS. PROJECT 1
KM 13-Surigao City : 10 kms 69 KV T/LMaco- Tap-Mati: 20 kms, 69 KV T/L
(OCT- 2005)
ABAGA-KIRAHON 230 KV T/L
Abaga-Kirahon, 120 kms, 230KV t/L(AUG-2007)
MINDANAO GRID ON-GOING PROJECTS
TransCo
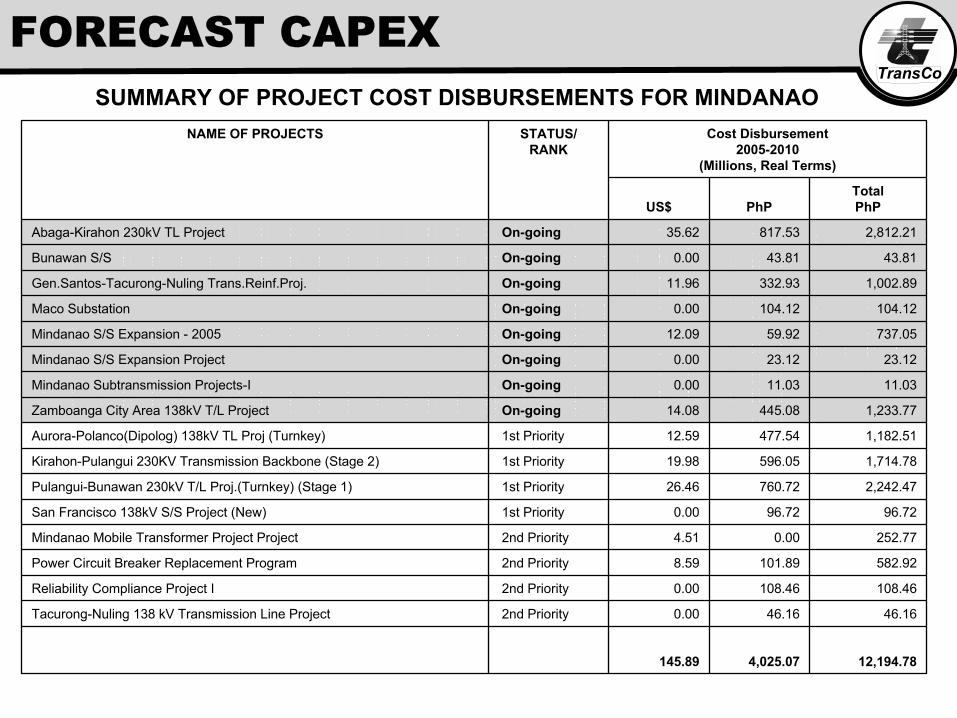
12,194.784,025.07145.89
46.1646.160.002nd Priority Tacurong-Nuling 138 kV Transmission Line Project
108.46108.460.002nd Priority Reliability Compliance Project I
582.92101.898.592nd Priority Power Circuit Breaker Replacement Program
252.770.004.512nd Priority Mindanao Mobile Transformer Project Project
96.7296.720.001st Priority San Francisco 138kV S/S Project (New)
2,242.47760.7226.461st Priority Pulangui-Bunawan 230kV T/L Proj.(Turnkey) (Stage 1)
1,714.78596.0519.981st Priority Kirahon-Pulangui 230KV Transmission Backbone (Stage 2)
1,182.51477.5412.591st Priority Aurora-Polanco(Dipolog) 138kV TL Proj (Turnkey)
1,233.77445.0814.08On-going Zamboanga City Area 138kV T/L Project
11.0311.030.00On-going Mindanao Subtransmission Projects-I
23.1223.120.00On-going Mindanao S/S Expansion Project
737.0559.9212.09On-going Mindanao S/S Expansion - 2005
104.12104.120.00On-going Maco Substation
1,002.89332.9311.96On-going Gen.Santos-Tacurong-Nuling Trans.Reinf.Proj.
43.8143.810.00On-going Bunawan S/S
2,812.21817.5335.62On-going Abaga-Kirahon 230kV TL Project
TotalPhPPhPUS$
Cost Disbursement2005-2010
(Millions, Real Terms)
STATUS/RANK
NAME OF PROJECTS
SUMMARY OF PROJECT COST DISBURSEMENTS FOR MINDANAO
FORECAST CAPEX
18-Oct-05 Corporate Planning Group
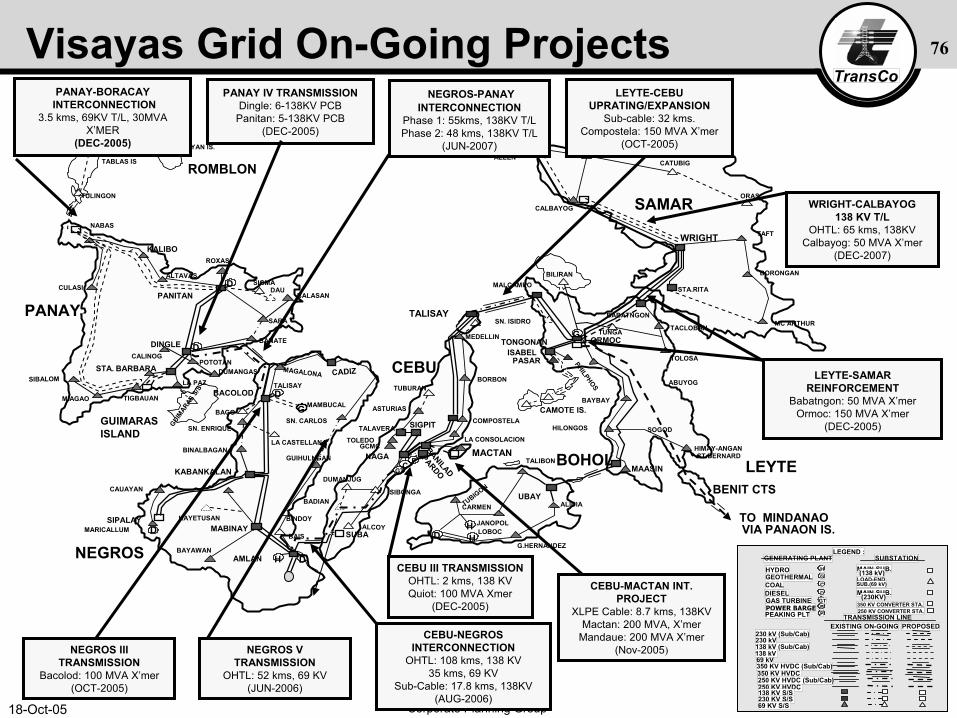
TransCo76
GT
BANATE
POTOTAN
LA PAZSIBALOMSTA. BARBARA
SARA
PANITAN
ROXASKALIBO
ALTAVAS
CULASI
NABAS
PANAYG
ALLEN
CATARMAN
CATUBIG
ORAS
TAFT
BORONGAN
MC ARTHURTACLOBANTUNGA
TONGONAN ORMOC
TOLOSA
WRIGHT
CALBAYOG
BILIRAN
ISABELPASAR PHILPHOS
BAYBAY
SAMAR
LEYTE
HD H
TALIBON
ALICIACARMEN
JANOPOLLOBOC
G.HERNANDEZ
ABUYOG
SOGOD
ST.BERNARD
TUBIGON
BORBON
LA CONSOLACION
MACTAN
STA.RITA
CADIZMAGALONA
D
D
DDINGLE
TALISAY
G
BACOLOD
SN. ENRIQUE
KABANKALAN
BAYAWAN
SN. CARLOS
GUIHULNGAN
BADIAN
BINDOY
BAIS
DUMANJUG
SIBONGA
ALCOY
ASTURIAS
TUBURAN
DH
MABINAY
AMLAN
MEDELLIN
PC
SIGPIT
BANILAD
NAGA
TALAVERA
TOLEDO
NEGROS
BOHOL
CEBU
SIBUYAN IS.
TABLAS IS
BINALBAGAN
BALASANMALCAMPO
TALISAY
TO MINDANAOVIA PANAON IS.
BABATNGON
MAASIN
UBAY
HILONGOS
HIMAY-ANGAN
GUIMARASISLAND
GUIMAR
AS S
/S
SUBA
DUMANGAS
PARDO
GCMC
CALINOG
SIGMADAU
BAGO
LA CASTELLANA
CAMOTE IS.
ROMBLON
TULINGON
SIPALAY
CAUAYAN
MARICALLUM D
MAMBUCALMIAGAO TIGBAUAN
SN. ISIDRO
COMPOSTELA
KAYETUSAN
BENIT CTS
PANAY-BORACAYINTERCONNECTION
3.5 kms, 69KV T/L, 30MVA X’MER
(DEC-2005)
NEGROS-PANAYINTERCONNECTION
Phase 1: 55kms, 138KV T/LPhase 2: 48 kms, 138KV T/L
(JUN-2007)
CEBU-NEGROS INTERCONNECTION
OHTL: 108 kms, 138 KV35 kms, 69 KV
Sub-Cable: 17.8 kms, 138KV(AUG-2006)
WRIGHT-CALBAYOG138 KV T/L
OHTL: 65 kms, 138KVCalbayog: 50 MVA X’mer
(DEC-2007)
CEBU III TRANSMISSIONOHTL: 2 kms, 138 KVQuiot: 100 MVA Xmer
(DEC-2005)
CEBU-MACTAN INT. PROJECT
XLPE Cable: 8.7 kms, 138KVMactan: 200 MVA, X’mer
Mandaue: 200 MVA X’mer(Nov-2005)
PANAY IV TRANSMISSIONDingle: 6-138KV PCB
Panitan: 5-138KV PCB(DEC-2005)
NEGROS III TRANSMISSION
Bacolod: 100 MVA X’mer(OCT-2005)
NEGROS V TRANSMISSION
OHTL: 52 kms, 69 KV(JUN-2006)
GCD
LEGEND :GENERATING PLANT
HYDROGEOTHERMALCOALDIESELGAS TURBINE
TRANSMISSION LINEEXISTING ON-GOING PROPOSED
350 KV HVDC
138 kV (Sub/Cab)
69 kV
SUBSTATIONH
GT
MAIN SUB.(138 kV)LOAD-ENDSUB.(69 kV)MAIN SUB.(230KV)
230 kV (Sub/Cab)230 kV
138 kV
350 KV HVDC (Sub/Cab)
350 KV CONVERTER STA.BPOWER BARGEPPEAKING PLT
250 KV HVDC 250 KV HVDC (Sub/Cab)
250 KV CONVERTER STA.
138 KV S/S 230 KV S/S 69 KV S/S
LEYTE-CEBU UPRATING/EXPANSION
Sub-cable: 32 kms.Compostela: 150 MVA X’mer
(OCT-2005)
LEYTE-SAMAR REINFORCEMENT
Babatngon: 50 MVA X’merOrmoc: 150 MVA X’mer
(DEC-2005)
Visayas Grid On-Going Projects
TransCo
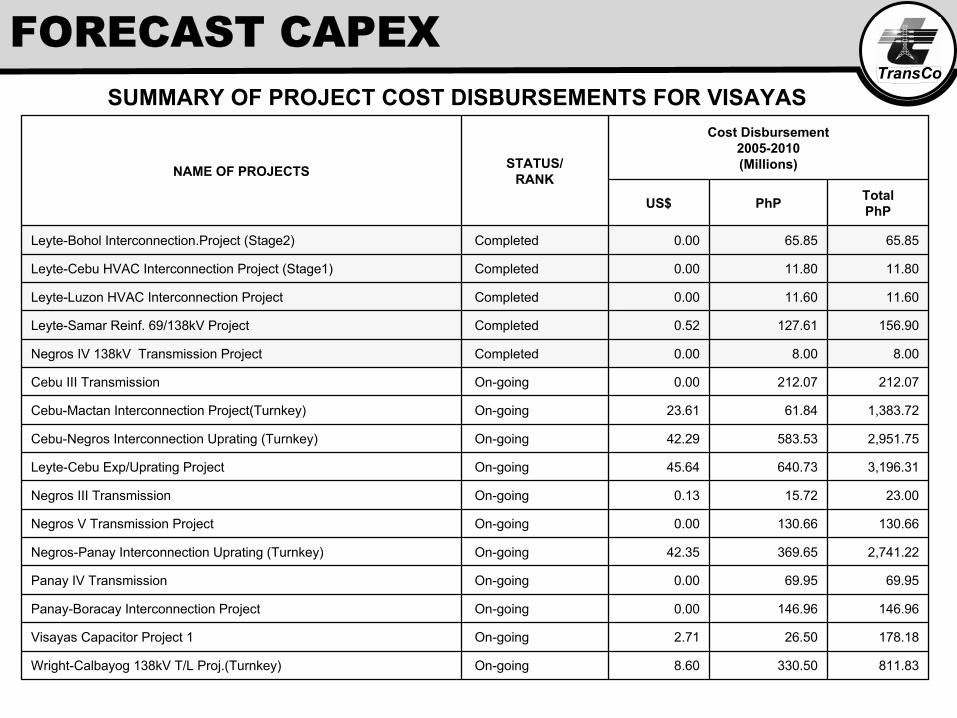
811.83330.508.60On-going Wright-Calbayog 138kV T/L Proj.(Turnkey)
178.1826.502.71On-going Visayas Capacitor Project 1
146.96146.960.00On-going Panay-Boracay Interconnection Project
69.9569.950.00On-going Panay IV Transmission
2,741.22369.6542.35On-going Negros-Panay Interconnection Uprating (Turnkey)
130.66130.660.00On-going Negros V Transmission Project
23.0015.720.13On-going Negros III Transmission
3,196.31640.7345.64On-going Leyte-Cebu Exp/Uprating Project
2,951.75583.5342.29On-going Cebu-Negros Interconnection Uprating (Turnkey)
1,383.7261.8423.61On-going Cebu-Mactan Interconnection Project(Turnkey)
212.07212.070.00On-going Cebu III Transmission
8.008.000.00Completed Negros IV 138kV Transmission Project
156.90127.610.52Completed Leyte-Samar Reinf. 69/138kV Project
11.6011.600.00Completed Leyte-Luzon HVAC Interconnection Project
11.8011.800.00Completed Leyte-Cebu HVAC Interconnection Project (Stage1)
65.8565.850.00Completed Leyte-Bohol Interconnection.Project (Stage2)
TotalPhPPhPUS$
Cost Disbursement2005-2010(Millions)STATUS/
RANKNAME OF PROJECTS
SUMMARY OF PROJECT COST DISBURSEMENTS FOR VISAYAS
FORECAST CAPEX
TransCo
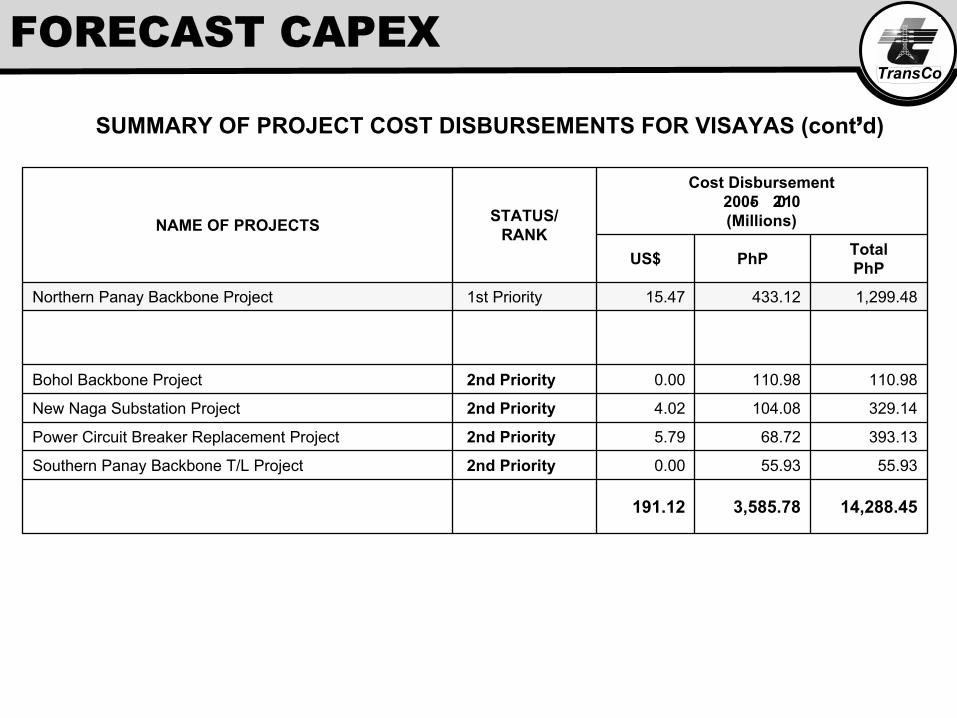
14,288.453,585.78191.12
55.9355.930.002nd Priority Southern Panay Backbone T/L Project
393.1368.725.792nd Priority Power Circuit Breaker Replacement Project
329.14104.084.022nd Priority New Naga Substation Project
110.98110.980.002nd Priority Bohol Backbone Project
1,299.48433.1215.471st Priority Northern Panay Backbone Project
TotalPhPPhPUS$
Cost Disbursement2005- 2010(Millions)STATUS/
RANKNAME OF PROJECTS
SUMMARY OF PROJECT COST DISBURSEMENTS FOR VISAYAS (cont’d)
FORECAST CAPEX
18-Oct-05 Corporate Planning Group
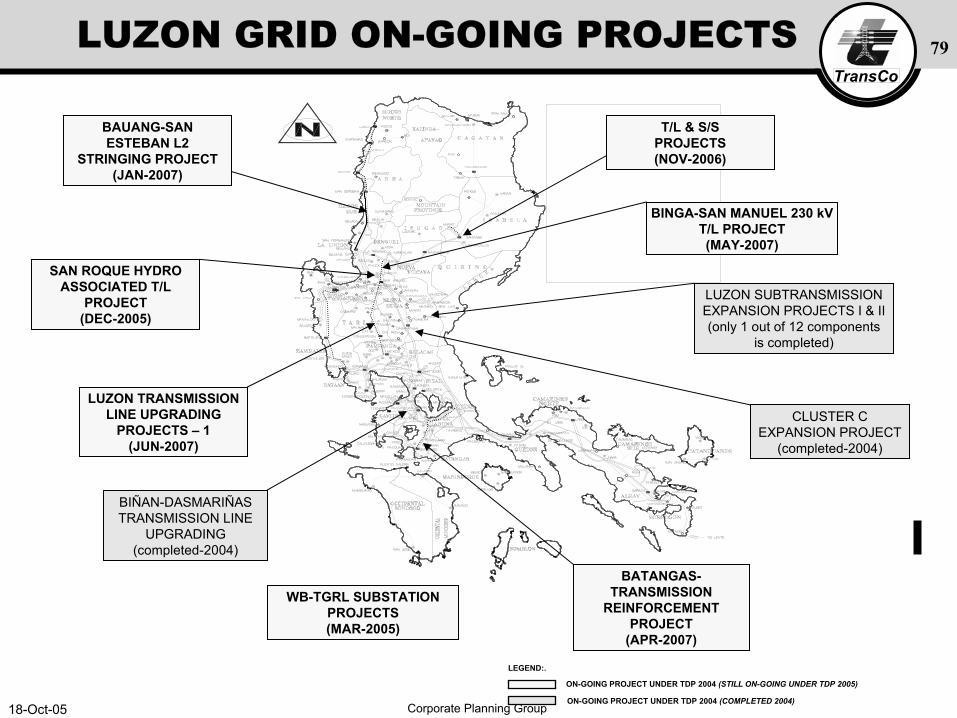
TransCo79LUZON GRID ON-GOING PROJECTS
LUZON SUBTRANSMISSION EXPANSION PROJECTS I & II (only 1 out of 12 components
is completed)
BIÑAN-DASMARIÑAS TRANSMISSION LINE
UPGRADING (completed-2004)
CLUSTER C EXPANSION PROJECT
(completed-2004)
LEGEND:.
ON-GOING PROJECT UNDER TDP 2004 (STILL ON-GOING UNDER TDP 2005)
ON-GOING PROJECT UNDER TDP 2004 (COMPLETED 2004)
WB-TGRL SUBSTATION PROJECTS(MAR-2005)
BAUANG-SAN ESTEBAN L2
STRINGING PROJECT(JAN-2007)
BINGA-SAN MANUEL 230 kV T/L PROJECT(MAY-2007)
SAN ROQUE HYDRO ASSOCIATED T/L
PROJECT(DEC-2005)
BATANGAS-TRANSMISSION
REINFORCEMENT PROJECT
(APR-2007)
T/L & S/S PROJECTS(NOV-2006)
LUZON TRANSMISSION LINE UPGRADING
PROJECTS – 1(JUN-2007)
TransCo
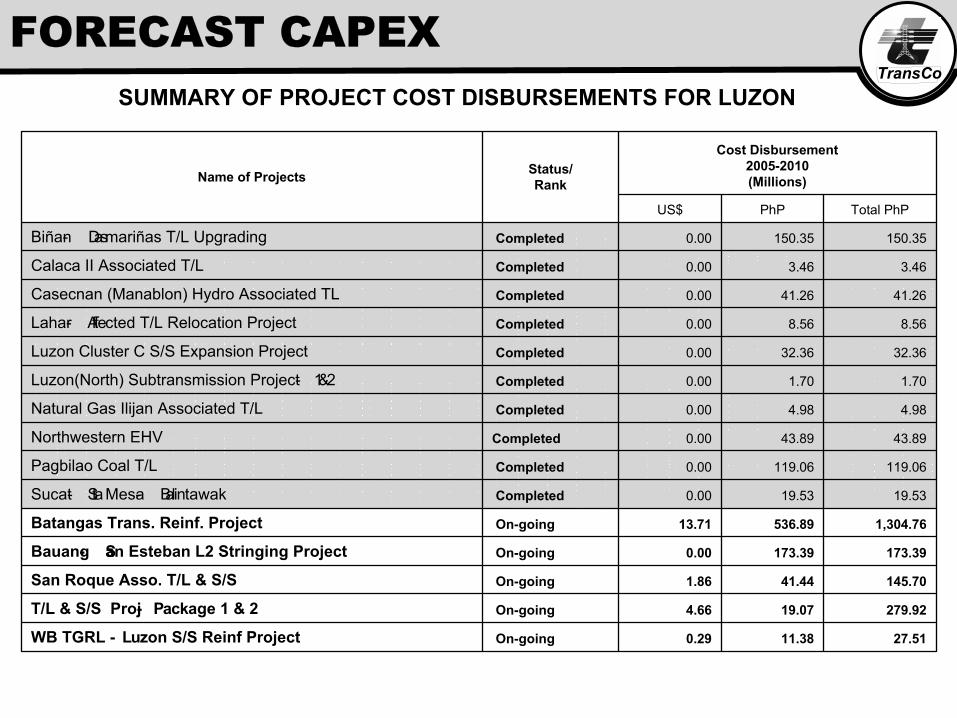
27.5111.380.29On-going WB TGRL - Luzon S/S Reinf Project
279.9219.074.66On-going T/L & S/S Proj- Package 1 & 2
145.7041.441.86On-going San Roque Asso. T/L & S/S
173.39173.390.00On-going Bauang- San Esteban L2 Stringing Project
1,304.76536.8913.71On-going Batangas Trans. Reinf. Project
19.5319.530.00Completed Sucat- StaMesa- Balintawak
119.06119.060.00Completed Pagbilao Coal T/L
43.8943.890.00CompletedNorthwestern EHV
4.984.980.00Completed Natural Gas Ilijan Associated T/L
1.701.700.00Completed Luzon(North) Subtransmission Project- 1&2
32.3632.360.00Completed Luzon Cluster C S/S Expansion Project
8.568.560.00Completed Lahar- Affected T/L Relocation Project
41.2641.260.00Completed Casecnan (Manablon) Hydro Associated TL
3.463.460.00Completed Calaca II Associated T/L
150.35150.350.00Completed Biñan- Dasmariñas T/L Upgrading
Total PhPPhPUS$
Cost Disbursement2005-2010(Millions)
Status/RankName of Projects
SUMMARY OF PROJECT COST DISBURSEMENTS FOR LUZON
FORECAST CAPEX
TransCo
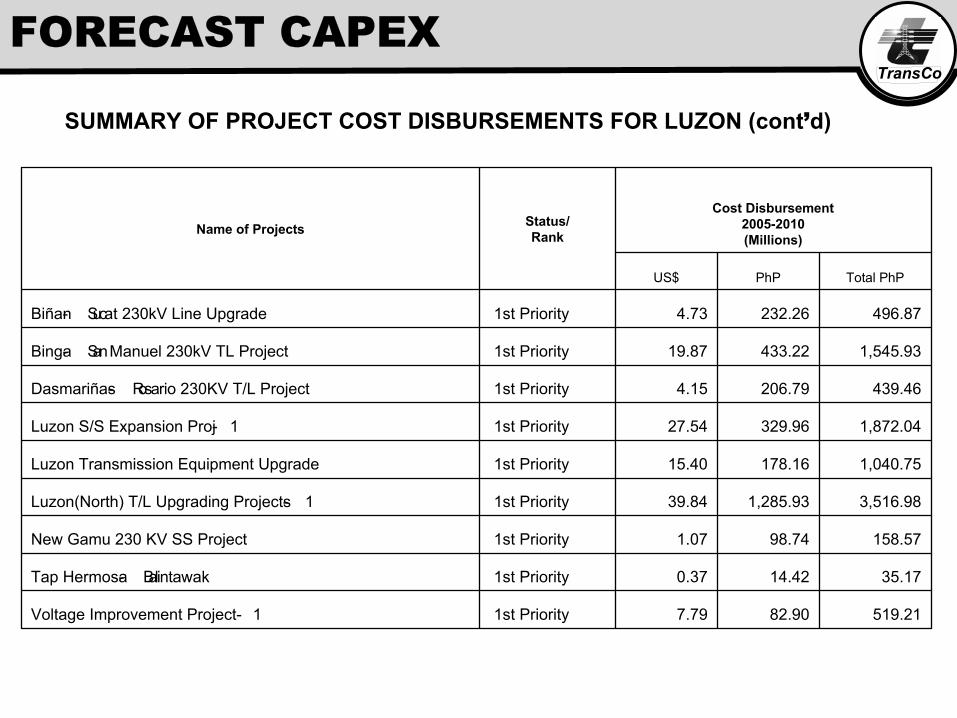
519.2182.907.791st Priority Voltage Improvement Project - 1
35.1714.420.371st Priority Tap Hermosa- Balintawak
158.5798.741.071st Priority New Gamu 230 KV SS Project
3,516.981,285.9339.841st Priority Luzon(North) T/L Upgrading Projects- 1
1,040.75178.1615.401st Priority Luzon Transmission Equipment Upgrade
1,872.04329.9627.541st Priority Luzon S/S Expansion Proj- 1
439.46206.794.151st Priority Dasmariñas- Rosario 230KV T/L Project
1,545.93433.2219.871st Priority Binga- San Manuel 230kV TL Project
496.87232.264.731st Priority Biñan- Sucat 230kV Line Upgrade
Total PhPPhPUS$
Cost Disbursement2005-2010(Millions)
Status/RankName of Projects
SUMMARY OF PROJECT COST DISBURSEMENTS FOR LUZON (cont’d)
FORECAST CAPEX
TransCo
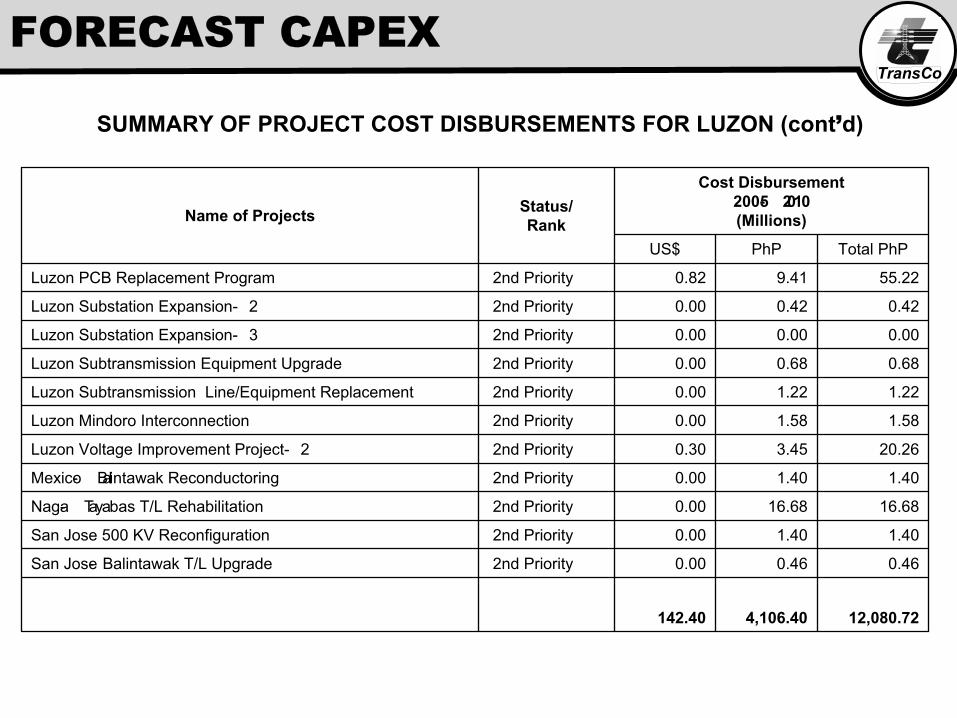
SUMMARY OF PROJECT COST DISBURSEMENTS FOR LUZON (cont’d)
12,080.724,106.40142.40
0.460.460.002nd Priority San Jose- Balintawak T/L Upgrade
1.401.400.002nd Priority San Jose 500 KV Reconfiguration
16.6816.680.002nd Priority Naga- Tayabas T/L Rehabilitation
1.401.400.002nd Priority Mexico- Balintawak Reconductoring
20.263.450.302nd PriorityLuzon Voltage Improvement Project - 2
1.581.580.002nd Priority Luzon Mindoro Interconnection
1.221.220.002nd Priority Luzon Subtransmission Line/Equipment Replacement
0.680.680.002nd Priority Luzon Subtransmission Equipment Upgrade
0.000.000.002nd Priority Luzon Substation Expansion - 3
0.420.420.002nd Priority Luzon Substation Expansion - 2
55.229.410.822nd Priority Luzon PCB Replacement Program
Total PhPPhPUS$
Cost Disbursement2005- 2010(Millions)
Status/RankName of Projects
FORECAST CAPEX
TransCo
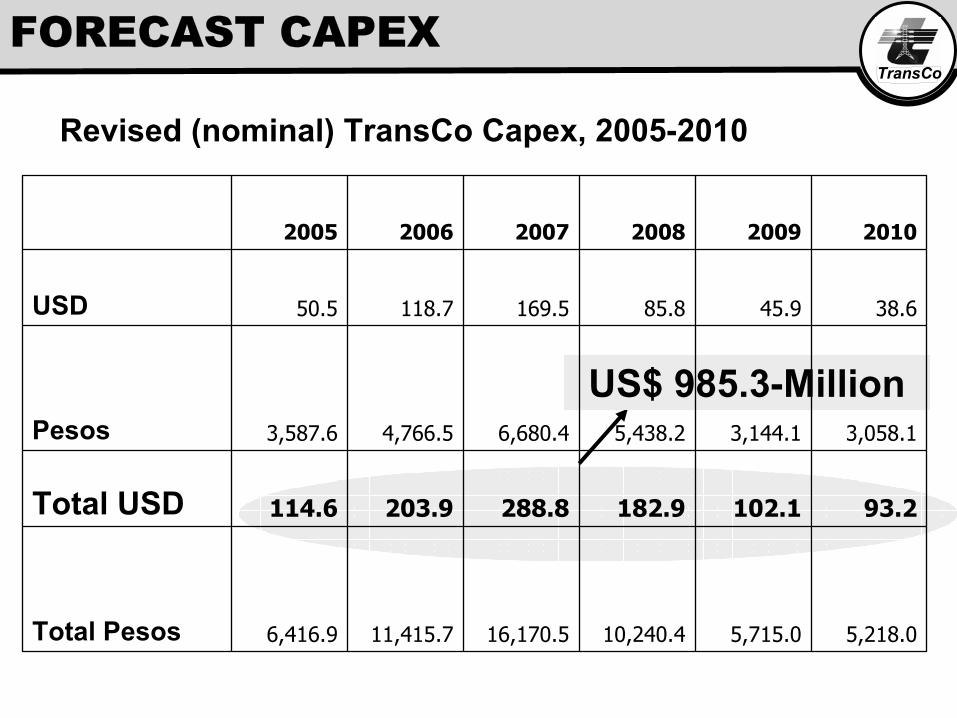
US$ 985.3-Million
Revised (nominal) TransCo Capex, 2005-2010
5,218.05,715.010,240.416,170.511,415.76,416.9Total Pesos
93.2102.1182.9288.8203.9114.6Total USD
3,058.13,144.15,438.26,680.44,766.53,587.6Pesos
38.645.985.8169.5118.750.5USD
201020092008200720062005
FORECAST CAPEX
TransCo
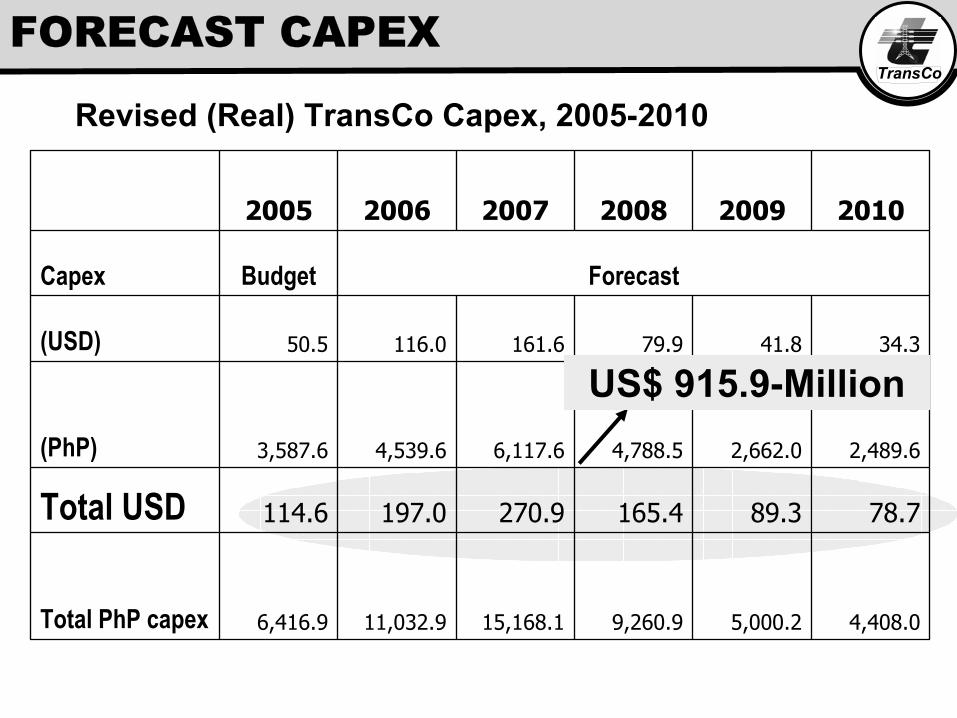
4,408.05,000.29,260.915,168.111,032.96,416.9Total PhP capex
78.789.3165.4270.9197.0114.6Total USD2,489.62,662.04,788.56,117.64,539.63,587.6(PhP)
34.341.879.9161.6116.050.5(USD)
ForecastBudgetCapex
201020092008200720062005
US$ 915.9-Million
Revised (Real) TransCo Capex, 2005-2010
FORECAST CAPEX
TransCo
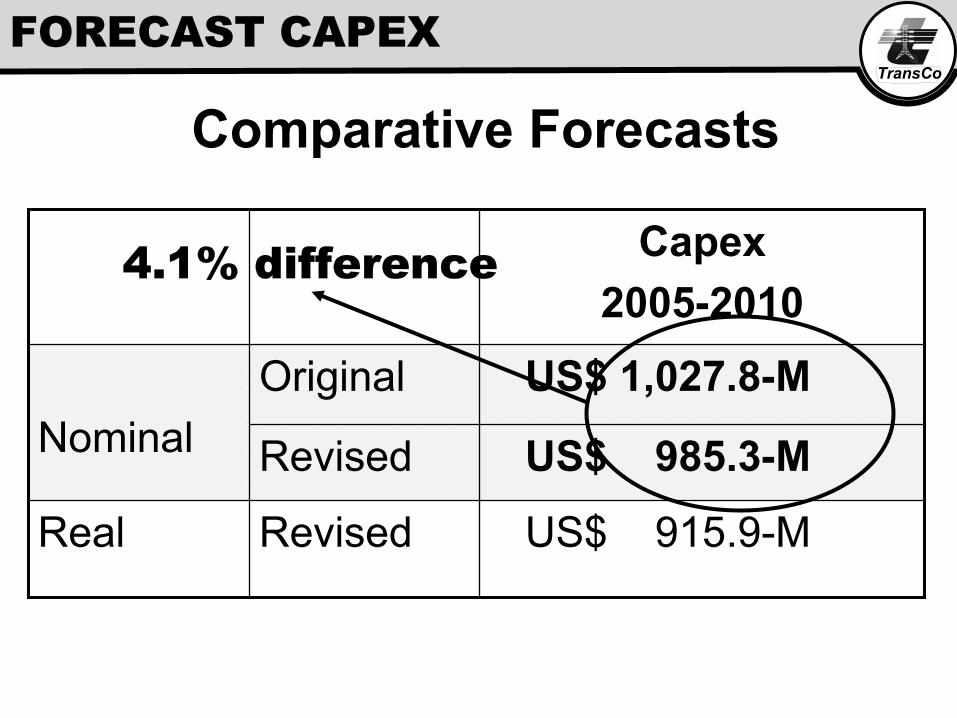
Comparative Forecasts
US$ 915.9-MRevisedReal
Nominal US$ 985.3-M Revised
US$ 1,027.8-MOriginal
Capex2005-2010
4.1% difference
FORECAST CAPEX
TransCo
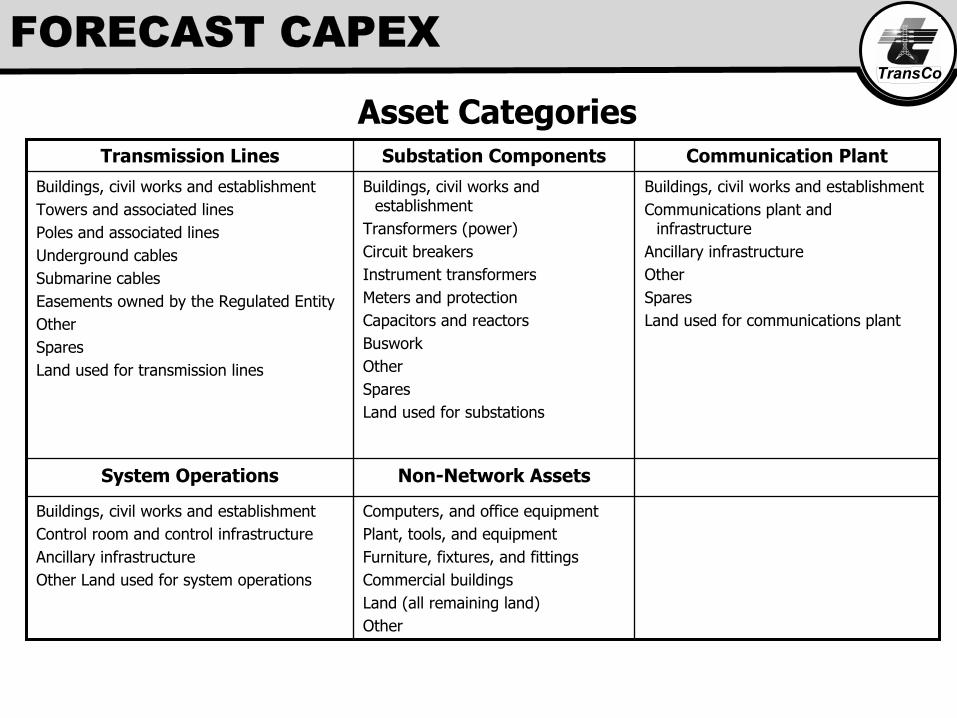
Computers, and office equipmentPlant, tools, and equipmentFurniture, fixtures, and fittingsCommercial buildingsLand (all remaining land)Other
Buildings, civil works and establishmentControl room and control infrastructureAncillary infrastructureOther Land used for system operations
Non-Network AssetsSystem Operations
Buildings, civil works and establishmentCommunications plant and
infrastructureAncillary infrastructureOtherSparesLand used for communications plant
Buildings, civil works and establishment
Transformers (power)Circuit breakersInstrument transformersMeters and protectionCapacitors and reactorsBusworkOtherSparesLand used for substations
Buildings, civil works and establishmentTowers and associated linesPoles and associated linesUnderground cablesSubmarine cablesEasements owned by the Regulated EntityOther SparesLand used for transmission lines
Communication PlantSubstation ComponentsTransmission Lines
Asset Categories
FORECAST CAPEX