Embed Size (px)
Citation preview
Policy Research Working Paper 6711
Exporter Dynamics, Firm Size and Growth, and Partial Year Effects
Andrew B. BernardRenzo Massari
Jose-Daniel ReyesDaria Taglioni
The World BankPoverty Reduction and Economic Management NetworkInternational Trade UnitNovember 2013
WPS6711P
ublic
Dis
clos
ure
Aut
horiz
edP
ublic
Dis
clos
ure
Aut
horiz
edP
ublic
Dis
clos
ure
Aut
horiz
edP
ublic
Dis
clos
ure
Aut
horiz
edP
ublic
Dis
clos
ure
Aut
horiz
edP
ublic
Dis
clos
ure
Aut
horiz
edP
ublic
Dis
clos
ure
Aut
horiz
edP
ublic
Dis
clos
ure
Aut
horiz
ed
Produced by the Research Support Team
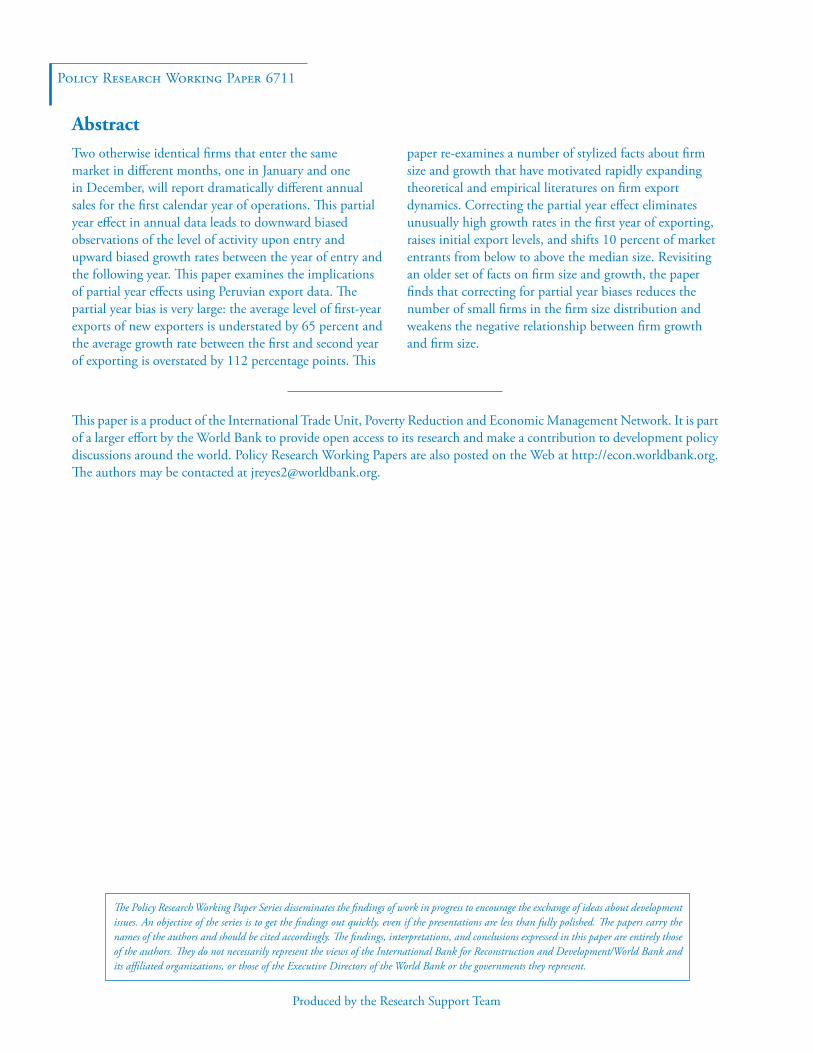
Abstract
The Policy Research Working Paper Series disseminates the findings of work in progress to encourage the exchange of ideas about development issues. An objective of the series is to get the findings out quickly, even if the presentations are less than fully polished. The papers carry the names of the authors and should be cited accordingly. The findings, interpretations, and conclusions expressed in this paper are entirely those of the authors. They do not necessarily represent the views of the International Bank for Reconstruction and Development/World Bank and its affiliated organizations, or those of the Executive Directors of the World Bank or the governments they represent.
Policy Research Working Paper 6711
Two otherwise identical firms that enter the same market in different months, one in January and one in December, will report dramatically different annual sales for the first calendar year of operations. This partial year effect in annual data leads to downward biased observations of the level of activity upon entry and upward biased growth rates between the year of entry and the following year. This paper examines the implications of partial year effects using Peruvian export data. The partial year bias is very large: the average level of first-year exports of new exporters is understated by 65 percent and the average growth rate between the first and second year of exporting is overstated by 112 percentage points. This
This paper is a product of the International Trade Unit, Poverty Reduction and Economic Management Network. It is part of a larger effort by the World Bank to provide open access to its research and make a contribution to development policy discussions around the world. Policy Research Working Papers are also posted on the Web at http://econ.worldbank.org. The authors may be contacted at [email protected].
paper re-examines a number of stylized facts about firm size and growth that have motivated rapidly expanding theoretical and empirical literatures on firm export dynamics. Correcting the partial year effect eliminates unusually high growth rates in the first year of exporting, raises initial export levels, and shifts 10 percent of market entrants from below to above the median size. Revisiting an older set of facts on firm size and growth, the paper finds that correcting for partial year biases reduces the number of small firms in the firm size distribution and weakens the negative relationship between firm growth and firm size.
Exporter Dynamics, Firm Size and Growth, andPartial Year Effects∗
Andrew B. Bernard†
Renzo Massari‡
Jose-Daniel Reyes§
Daria Taglioni¶
Keywords: firm size distribution, firm growth, variance of firm growth, export entry,export growth, heterogeneous firmsJEL codes: F14, L11, C81, D22
Sector Board: Economic Policy (EPOL)
∗We thank Emily Blanchard, Teresa Fort, Ana Fernandes and seminar participants at the World Bank for helpfulcomments and discussions. Any opinions or conclusions expressed herein are those of the authors and do not neces-sarily reflect those of the IBRD/World Bank and its affiliated organizations, the Executive Directors of the WorldBank or the governments they represent, the NBER or any other institution to which the authors are affiliated.†Tuck School of Business at Dartmouth, CEPR & NBER, 100 Tuck Hall, Hanover, NH 03755, USA, tel: +1 603
646 0302, email: [email protected]‡World Bank, 1818 H Street NW, Washington, DC 20433, USA, tel: +1 202 473 8519 , email: rmas-
[email protected]§World Bank, 1818 H Street NW,Washington, DC 20433, USA tel: +1 202 458 7052, email: [email protected]¶World Bank, 1818 H Street NW, Washington, DC 20433, USA tel: +1 202 458 5264, email:
Exporter Dynamics, Firm Size and Growth, and Partial Year Effects
1 Introduction
The past two decades have seen an explosion of research on the microeconomic determinants of
exporting and the complicated relationship between participating in foreign markets and firm per-
formance. This new perspective on international trade has been fostered by access to increasingly
detailed data, starting with census data on whether or not an establishment, or firm, exports in a
given year, and continuing with panel data at the transaction level from individual customs records
with information on exports at the level of the firm-product-destination-year. The most recent
round of research is now matching individual sellers to individual buyers by destination, prod-
uct and year.1 A growing literature, both empirical and theoretical, is considering the firm-level
evolution and dynamics of exports over time by examining the process of entry and growth.
This paper focuses on one specific issue that touches on most of the existing empirical work on
export entry and performance and suggests caution when approaching the disaggregated data. The
concept is quite simple, almost trivial, yet the implications for the existing stylized facts on export
levels and growth rates are profound. Consider two otherwise identical firms that enter the same
market in different months, one in January and one in December. These two firms, starting at the
same initial size and growing at the same rate per month, will report dramatically different annual
sales for the first calendar year of operations. The January entrant will record a full 12 months
of sales and its growth rate from its first to second year will reflect the true underlying annual
growth rate of the firm in the market. The December entrant, in contrast, will only record one
month of sales for its first year so the calendar, or annual sales, of the December firm will be biased
downwards relative to its actual sales during its first year in the market. Similarly the recorded
first year growth rate of the December firm will be biased upwards as one month of sales will be
compared to as many as 12 months of sales in the second calendar year.
This “partial year” effect contaminates all the statistics about market entrants that depend on
the first year of activity. For example, the average level of exports for entering firms will contain a
downward bias, depending on the distribution of entry months over the year, and the average first
year growth rate of entrants will be biased upward. Measures that flow from these averages will,
in turn, contain the same bias. There is, of course, a comparable bias in the last year of exporting
when the firm totals are based on calendar years. Exiting firms will appear to have annual sales that
are lower than the total for their last 12 months of operations and their growth rates just before
exit will be biased downward.
This partial year effect in annual data has the potential to lead to large downward biased
observations of level of activity upon entry as well as to large upward biased growth rates between
the year of entry and the following year. This paper examines the implications of partial year effects1See Blum, Claro, and Horstmann (2011), Eaton, Eslava, Jinkins, Krizan, and Tybout (2012), Bernard, Moxnes,
and Ulltveit-Moe (2013), and Carballo, Ottavianio, and Martincus (2013).
1
Exporter Dynamics, Firm Size and Growth, and Partial Year Effects
using transaction-level export data on Peruvian exports from 1992-2009. The partial year bias is
found to be very large, causing the level of first-year exports of all new exporters to be understated
by 65 percent on average and overstating the average growth rate between the first and second year
of exporting by 112 percentage points. Similar partial year effects are found in the year of exit from
the market.
Empirical work using annual firm-level export data by Eaton, Eslava, Kugler, and Tybout
(2008) and others has documented a set of strong empirical regularities about the performance
of exporters over time. These regularities include the fact that new market entrants, either new
exporters or continuing exporters in new markets, have small levels of exports upon entry, a large
fraction of entrants export for only a single year before exiting the market, and surviving entrants
have extremely rapid export growth between years one and two with more modest growth rates
subsequently. These facts have been taken as evidence against models of high sunk costs of entry
into export markets as in Roberts and Tybout (1997) and have generated a growing literature on
learning and experimentation in export markets.
Correcting for the partial year bias in the calendar year exports of new market entrants eliminates
or dramatically mitigates most of these stylized facts. Surviving new entrants still have smaller initial
levels than ongoing exporters but on average their adjusted first year sales are increased by more
than 76 percent. Surviving entrants have adjusted exports in their first year that are 160 percent
greater than those recorded in the annual data. Extremely rapid growth rates in the first year of
exporting, average rates well over 100 percent are typical, are completely eliminated for surviving
entrants. Growth rates in the first year are no different on average from those in subsequent years
after adjusting for the month of entry.2
In addition, we examine the implications of the partial year bias for an older set of facts on
firm size and growth that have been the focus of substantial research in industrial organization.
A large fraction of firms are new to the market in each year; from 1994 to 2007, 45.8 percent of
Peruvian exporters were new to the US market each year. New entrants are a sizable fraction of
firms even in developed economies. Over the same period, an average of 10.5 percent of active US
firms (513,000) began operations each year. Correcting for partial year biases increases the average
size of new entrants into exporting, reduces the number of small firms in the market, and shifts the
overall structure of the firm size distribution of exporters. More than 10 percent of new Peruvian
exporters move from below to above the median firm size after adjusting for the partial year bias
with commensurate adjustments to their first year growth rates. The adjustments also weaken the
negative relationships between firm growth and its variance and firm size as the level and dispersion
of growth rates for the smallest quintile of market participants are reduced.
The empirical approach of this paper is heavily influenced by Arkolakis (2011) who develops2Firm exit rates remain very high for new entrants in export markets.
2
Exporter Dynamics, Firm Size and Growth, and Partial Year Effects
an analytical framework to study firm and export growth and evaluates the model by comparing
results of calibration exercises with the growth of sales of US firms as well as with Brazilian export
sales to the US. His argument that the same processes are at work within an economy and in export
markets as firms search for customers motivates us to use export data to analyze the impact of
partial years for new entrants in a market.
The characteristics and performance of new exporters
The empirical literature on the dynamics of firm-level exports was initiated by the work of Eaton,
Eslava, Kugler, and Tybout (2008) on Colombian exporters. Eaton, Eslava, Kugler, and Tybout
(2008) set out to generate a new set of stylized facts on export dynamics and destination-specific
flows for the same set of producers using annual trade transaction data for Colombian firms. In the
abstract to the paper, they state “that nearly half of all Colombian exporters were not exporters in
the previous year. These new exporters tend to be extremely small in terms of their overall contri-
bution to export revenues, and most do not continue exporting in the following year.... Nonetheless,
out of each cohort of new exporters, a fraction of firms go on to expand their foreign sales very
rapidly....” Empirical work on annual firm-level export data that confirms some or all of these facts
for other countries includes Lawless (2009) for Irish exporters and Buono and Fadinger (2012) for
French exporters.
These stylized facts in turn have been used and extended by others to motivate dynamic models
of exporting and learning. In Albornoz, Pardo, Corcos, and Ornelas (2012), firms experiment in a
market to learn about export profitability and then expand to new destinations. In their empirical
work on Argentine exporters, they confirm the small size, low survival and rapid growth of new
exporters. They report that growth rates between the first and second years in a market range from
104 to 190 percent. In every case, they find that second year growth rates in export markets are
much lower and are not substantially different from growth rates in subsequent years.
Eaton, Eslava, Jinkins, Krizan, and Tybout (2012) develop a model of search and learning to
explain the dynamic pattern of entry and survival by Colombian exporters and to differentiate be-
tween the costs of finding new buyers and maintaining relationships with existing ones. Aeberhardt,
Buono, and Fadinger (2012) and Araujo, Mion, and Ornelas (2012) model exporter dynamics in the
context of contracting, learning and institutional quality, again confirming the small size upon entry
of new exporters and their subsequent rapid growth conditional on survival, using annual firm-level
French and Belgian data, respectively.
Akhmetova and Mitaritonna (2012) develop a model of experimentation and learning to explain
the fact that new exporters exhibit different patterns in a given market than old exporters. They
emphasize the facts of Eaton, Eslava, Jinkins, Krizan, and Tybout (2012) for Colombia and Eaton,
Kortum, and Kramarz (2011) for France - many new exporters ship very small quantities and
3
Exporter Dynamics, Firm Size and Growth, and Partial Year Effects
surviving exporters expand rapidly.
Timoshenko (2013) focuses on a different dimension of exporter behavior, the margin of product
switching. A model of learning by exporters in new markets is motivated by the fact that Brazilian
exporters in their second year in the market have disproportionately greater shares of sales from new
products and greater shares of new products in their product mix. Partial year effects potentially
play a role in these stylized facts as well, understating the number of products sold abroad in the
first year of exporting and in turn overstating the growth in number of exported products and their
share in sales between years one and two.3
Extensive margins in trade
A related body of work has been attempting to understand the underlying sources of aggregate
export growth and the importance of the extensive margins of trade. These extensive margins
include new exporters and new destinations and products by existing exporters. Typically annual
export growth is decomposed into the contribution of these extensive margins and the intensive
margin, i.e. the change of sales of existing products by continuing exporters to previous destinations.
Bernard, Jensen, Redding, and Schott (2009) find that the annual variation in aggregate trade is
dominated by the intensive margin. The small role for the extensive margin is due primarily to the
small size of new entrants relative to incumbents. Related analyses have been conducted by Lawless
(2009) (Ireland); Amiti and Freund (2010) (China); Van Beveren, Bernard, and Vandenbussche
(2012) (Belgium); and Cebeci and Fernandes (2013) (Turkey). The conclusion in all these papers
that new exporters, new export destinations and newly exported products contribute only a small
fraction to overall annual export growth is subject to potential downward bias from partial year
effects.
Firm size distribution
Beyond the literature on export dynamics, the issues raised in this paper relate to the extensive
body of work on the firm size distribution as exemplified by Axtell (2001) and Luttmer (2007) for
the domestic economy and by Eaton, Kortum, and Kramarz (2011) for exporters by destination
market.4 All of these papers, and many others, find that the distributions of sales, or employees,
closely approximate a Pareto distribution except in the region with the smallest firms. In every
case, the smallest firms are present in greater numbers than suggested by a pure Pareto distribution.3Freund and Pierola (2010) focus on exporter entry and survival in products not previously exported by Peruvian
firms. As most of their analysis is on entry and the duration of export spells it is not directly affected by the partialyear effects discussed here. However, it remains unknown how adjusting the date of the firm’s export year to reflectthe initial month of entry would affect the probability of the frequently observed pattern of entry, exit and subsequentre-entry into the export market.
4Related work on firm size and growth includes Evans (1987b,a), Dunne, Roberts, and Samuelson (1989, 1988),Cabral and Mata (2003), and the survey by Sutton (1997).
4
Exporter Dynamics, Firm Size and Growth, and Partial Year Effects
Theoretical models in Luttmer (2007), Arkolakis (2011), and Eaton, Kortum, and Kramarz (2011) all
incorporate specific elements to handle the large number of small firms. This general feature of firm
size distributions is subject to bias if the share of entrants is large, entrants are disproportionately
among the smallest firms and their sales or employment only reflect a partial year of activity.
Correcting the partial year effect should decrease the share of the smallest firms and may result in
firm size distributions that more closely resemble a Pareto.
Arkolakis (2011) develops an analytical framework that integrates aspects of the export dynamics
and firm size literatures to study firm and export growth. He compares calibrations of the model
both to the growth of sales of US firms as well as to Brazilian exports to the US. Among the
stylized facts he uses to motivate and assess the model are the negative relationship between firm
size and firm growth rates and their variance, the small size of entrants in a market, the parity of
size between entrants and exits, the different distributions of growth rates for large (lognormal) and
small (skewed high) exporters, and the relationship between firm growth and firm age conditional
on firm size.
A related set of findings focuses on the distribution of growth rates conditional on firm size and
age, in particular Cabral and Mata (2003). Arkolakis (2011) shows that the distribution of growth
rates for smallest (quartile 1) and largest (quartile 4) Brazilian exporters to the US are starkly
different. The distribution of growth rates of the smallest firms is heavily skewed towards higher
growth rates while that of the largest firms is approximately lognormal and center around zero. If a
large share of entrants is concentrated in the smallest firms, partial year effects may lead to growth
rates and their variance being overstated for the smallest firms in the market.
In spite of the potentially pervasive nature of the problem, there has been almost no work
examining the degree of bias induced by partial year effects nor any correction in empirical work
using firm-level data. In large part this is due to the nature of the data that are available to
researchers. Most detailed trade datasets have been aggregated to the exporter-destination-product-
year level before being provided to the researchers. Eaton, Kortum, and Kramarz (2011) are typical
when they report “All (customs record) data is aggregated first at the monthly level. In the analysis
files accessible to researchers, these records are further aggregated by year ....” However even when
the underlying monthly (or daily) data are available, the first step is usually to aggregate the data
to the annual level, e.g. Bernard, Jensen, Redding, and Schott (2009). An exception is the recent
paper by Berthou and Vicard (2013) who control for the month of entry of exporting in their study
of the effect of export experience and export growth for French exporters.5
The rest of this paper explores the magnitude of partial year bias in the stylized facts on
export dynamics and firm size and growth using Peruvian data. The data on Peruvian exports are5Although Berthou and Vicard (2013) do not focus on partial year effects, they report that initial year exports
are reduced by 32 percent.
5
Exporter Dynamics, Firm Size and Growth, and Partial Year Effects
described in Section 2. Section 3 outlines a simple model of market entry by month and generates
benchmark predictions for the bias on firm size and growth. The magnitude of the bias in entry
levels and growth rates for surviving exporters is estimated in Section 4. Section 5 examines the
importance of partial year effects in estimates of the cross-section firm size distribution and firm
growth conditional on firm size. The final section concludes.
2 Data
The data employed in this paper come from Peruvian transaction-level customs data from 1993-
2009. The source of the data is SUNAT and it was collected by the Trade and Integration Unit of the
World Bank Research Department as part of the effort to build the Exporter Dynamics Database
(see Cebeci, Fernandes, Freund, and Pierola (2012)). Although we have daily information on all
shipments between years 1992 and 2009, we aggregate the data to the monthly level before any of
our analyses. The data have the usual features of transaction-level trade data in that it is possible
to create flows of exports by product and destination for all Peruvian exporters. We create two
measures of “annual” exports for each firm and each firm-destination in the data. The first measure
is a simple aggregation to the calendar year summing across months. This results in an annual
data set that is directly comparable to annual firm level export data used by other researchers. The
second data set contains annual export data adjusting for the month of entry into the market by the
firm.6 The first year of exports starts in the month of first entry and runs for the next 11 months.
For the same firm and market the second year also starts in the same month.
3 Partial Year Effects - An Example
In this section we work through a simple example to demonstrate the potential magnitude of the
partial year effect on first year sales and growth in a market. We refer to export sales and output
interchangably throughout this section as the partial year effects will distort both revenue and
quantity-based measures of sales. In the subsequent empirical work, we use revenue based measures
of exports.
We assume that firms enter the market uniformly across months during the year with identical
initial exports. All firms subsequently grow at 22.6 percent per year corresponding to a 1.715 percent
compound monthly growth rate and firms do not exit.7 The firms that enter in January will record
a full year’s initial exports and grow between year 1 and year 2 at 22.6 percent with or without a6The market can be a particular export destination or the export market in general. The month of entry will
typically differ for a firm across markets and the annual exports will be adjusted correspondingly.7Table 1 shows that the uniform entry assumption is not a bad approximation for the distribution of Peruvian
export entrants across months. The growth rate number is designed to match the Peruvian export data on survivingexporters. The assumption of no exits from the market is clearly at odds with the firm-level evidence on new exporters.However, this assumption is useful to facilitate comparisons with growth rates of surviving entrants.
6
Exporter Dynamics, Firm Size and Growth, and Partial Year Effects
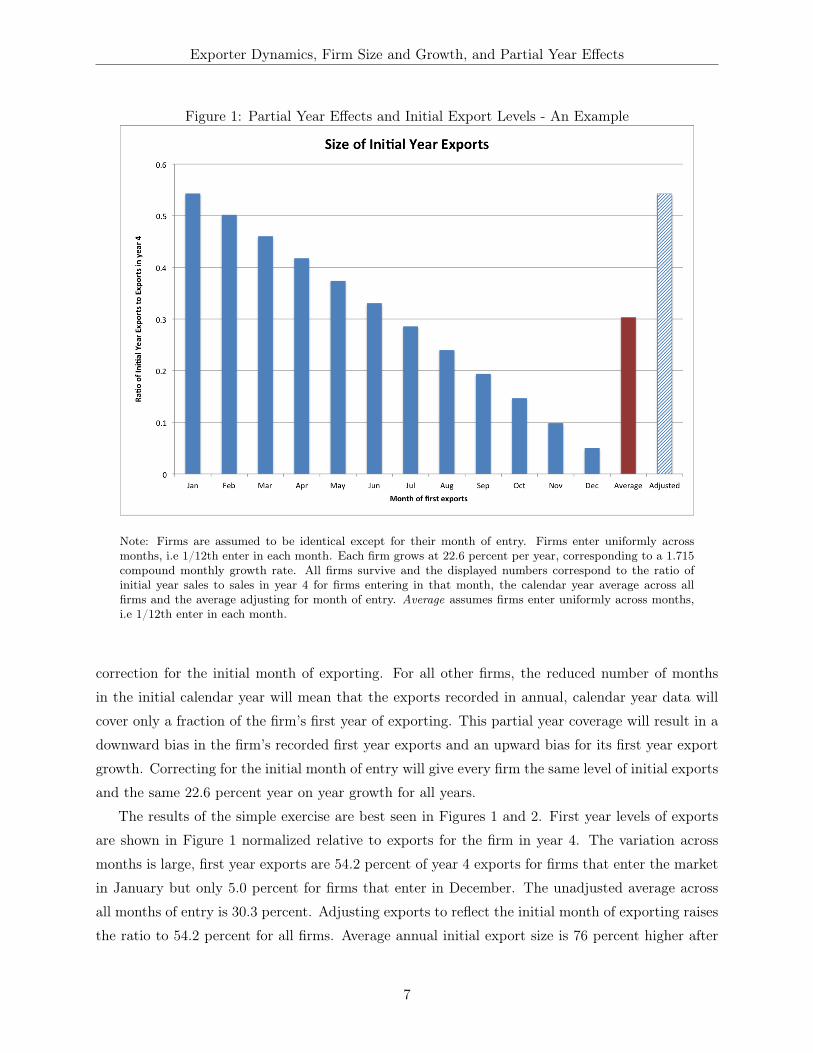
Figure 1: Partial Year Effects and Initial Export Levels - An Example
Note: Firms are assumed to be identical except for their month of entry. Firms enter uniformly acrossmonths, i.e 1/12th enter in each month. Each firm grows at 22.6 percent per year, corresponding to a 1.715compound monthly growth rate. All firms survive and the displayed numbers correspond to the ratio ofinitial year sales to sales in year 4 for firms entering in that month, the calendar year average across allfirms and the average adjusting for month of entry. Average assumes firms enter uniformly across months,i.e 1/12th enter in each month.
correction for the initial month of exporting. For all other firms, the reduced number of months
in the initial calendar year will mean that the exports recorded in annual, calendar year data will
cover only a fraction of the firm’s first year of exporting. This partial year coverage will result in a
downward bias in the firm’s recorded first year exports and an upward bias for its first year export
growth. Correcting for the initial month of entry will give every firm the same level of initial exports
and the same 22.6 percent year on year growth for all years.
The results of the simple exercise are best seen in Figures 1 and 2. First year levels of exports
are shown in Figure 1 normalized relative to exports for the firm in year 4. The variation across
months is large, first year exports are 54.2 percent of year 4 exports for firms that enter the market
in January but only 5.0 percent for firms that enter in December. The unadjusted average across
all months of entry is 30.3 percent. Adjusting exports to reflect the initial month of exporting raises
the ratio to 54.2 percent for all firms. Average annual initial export size is 76 percent higher after
7
Exporter Dynamics, Firm Size and Growth, and Partial Year Effects
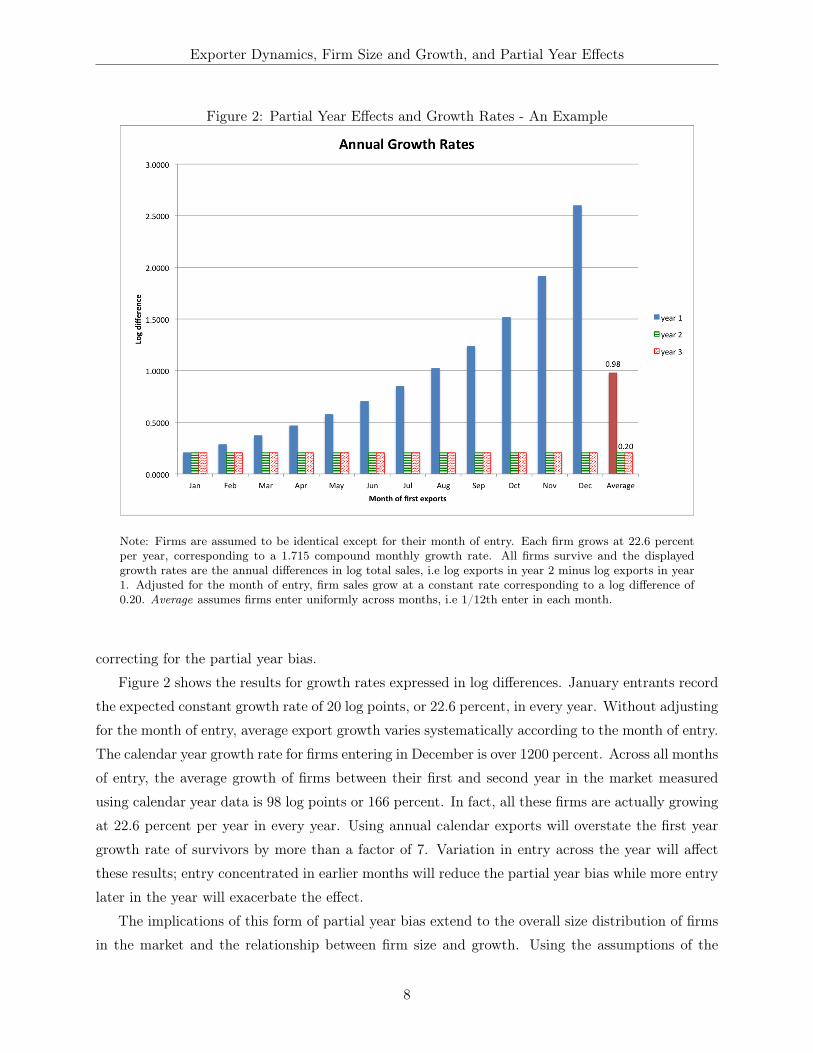
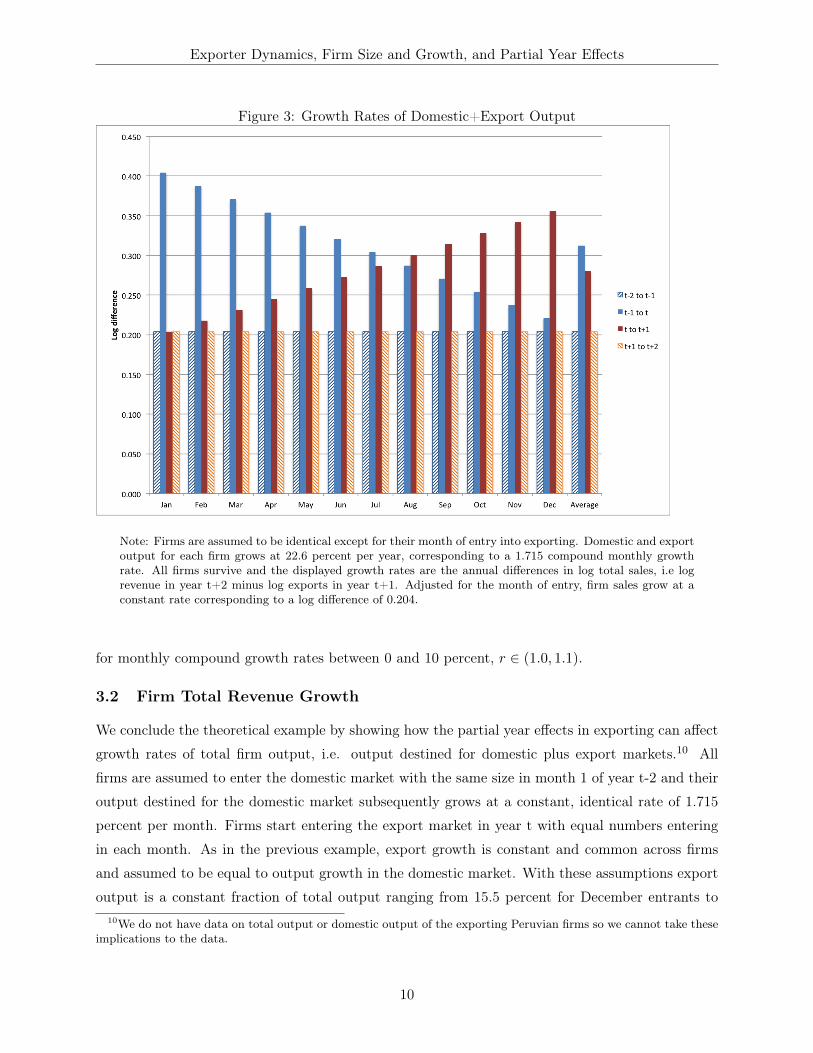
Figure 2: Partial Year Effects and Growth Rates - An Example
Note: Firms are assumed to be identical except for their month of entry. Each firm grows at 22.6 percentper year, corresponding to a 1.715 compound monthly growth rate. All firms survive and the displayedgrowth rates are the annual differences in log total sales, i.e log exports in year 2 minus log exports in year1. Adjusted for the month of entry, firm sales grow at a constant rate corresponding to a log difference of0.20. Average assumes firms enter uniformly across months, i.e 1/12th enter in each month.
correcting for the partial year bias.
Figure 2 shows the results for growth rates expressed in log differences. January entrants record
the expected constant growth rate of 20 log points, or 22.6 percent, in every year. Without adjusting
for the month of entry, average export growth varies systematically according to the month of entry.
The calendar year growth rate for firms entering in December is over 1200 percent. Across all months
of entry, the average growth of firms between their first and second year in the market measured
using calendar year data is 98 log points or 166 percent. In fact, all these firms are actually growing
at 22.6 percent per year in every year. Using annual calendar exports will overstate the first year
growth rate of survivors by more than a factor of 7. Variation in entry across the year will affect
these results; entry concentrated in earlier months will reduce the partial year bias while more entry
later in the year will exacerbate the effect.
The implications of this form of partial year bias extend to the overall size distribution of firms
in the market and the relationship between firm size and growth. Using the assumptions of the
8
Exporter Dynamics, Firm Size and Growth, and Partial Year Effects
example above, the first year size of new entrants is underestimated on average by 80 percent.
This will cause the number of small firms to be overestimated and will lead to a corresponding
distortion in the firm size distribution. Of course the extent of the bias in the firm size distribution
depends on the share of new entrants in the overall number of firms but the potential magnitudes
are large: in Peru more than 45 percent of firms are new to exporting each year, while in the US
more than 10 percent of firms are new to the domestic market in each year.8 In addition, the bias
can affect attempts to understand the relationship between firm size and firm growth. Entrants are
disproportionately small in the unadjusted data and thus the growth rates of the smallest firms is
likely to be subject to greater overstatement.9
3.1 Bias Approximation
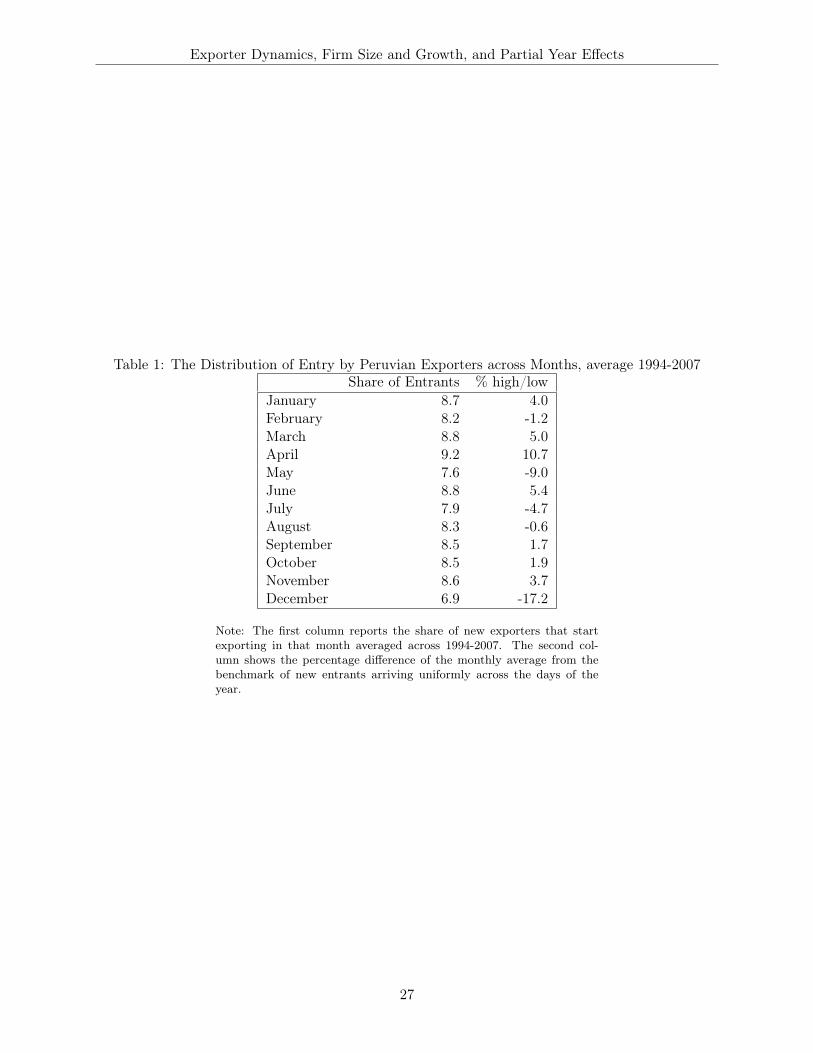
In Table 1, we report the distribution of new Peruvian exporters across months based on their first
month of exporting. There is some systematic variation over months; March, April and June have
higher shares of entrants while May, July and December have lower shares. However, the monthly
averages are reasonably close to what would be expected if entry were uniform across days during
the year. This finding suggests both that partial-year bias is likely to be important in the Peruvian
export data and that for aggregate or market-specific measures of exporting a relatively simple
adjustment might be possible.
The relationship between the firm’s exports in its first full year in the market, Xtrues , and the
observed first year exports, Xobss , is given by Xtrue
s = θsXobss , where s is the month of entry into
exporting. The adjustment factor for the levels of exports in the first year for each month of an
entering cohort is
θs =1− r12
1− r13−s
where r is a common constant compound monthly growth rate and average entry levels across
months are assumed to be identical. We can also sign the partial year bias in log difference growth
rates, β = ∆log(Xtrue
0
)−∆log
(Xobs
0
), for a cohort of firms entering the market in year 0 as
β =12∑s=1
N s
Nlog
(r13−s − r13−s+12
1− r13−s
)− log
(r12 − r24
1− r12
)where N is the total number of entrants and N s is the number of entrants in month s. If shares of
entering firms are constant across months, the bias in log differences can be closely approximated
by
β = 3.3639− 2.546r
8The US numbers are the average share of entrants per year from 1994-2007 tabulated by the authors from theBusiness Dynamics Statistics database, http://www.census.gov/ces/dataproducts/bds/data.html.
9In the raw data, more than 76 percent of the bottom decile of Peruvian exporters to the US are new entrants.
9
Exporter Dynamics, Firm Size and Growth, and Partial Year Effects
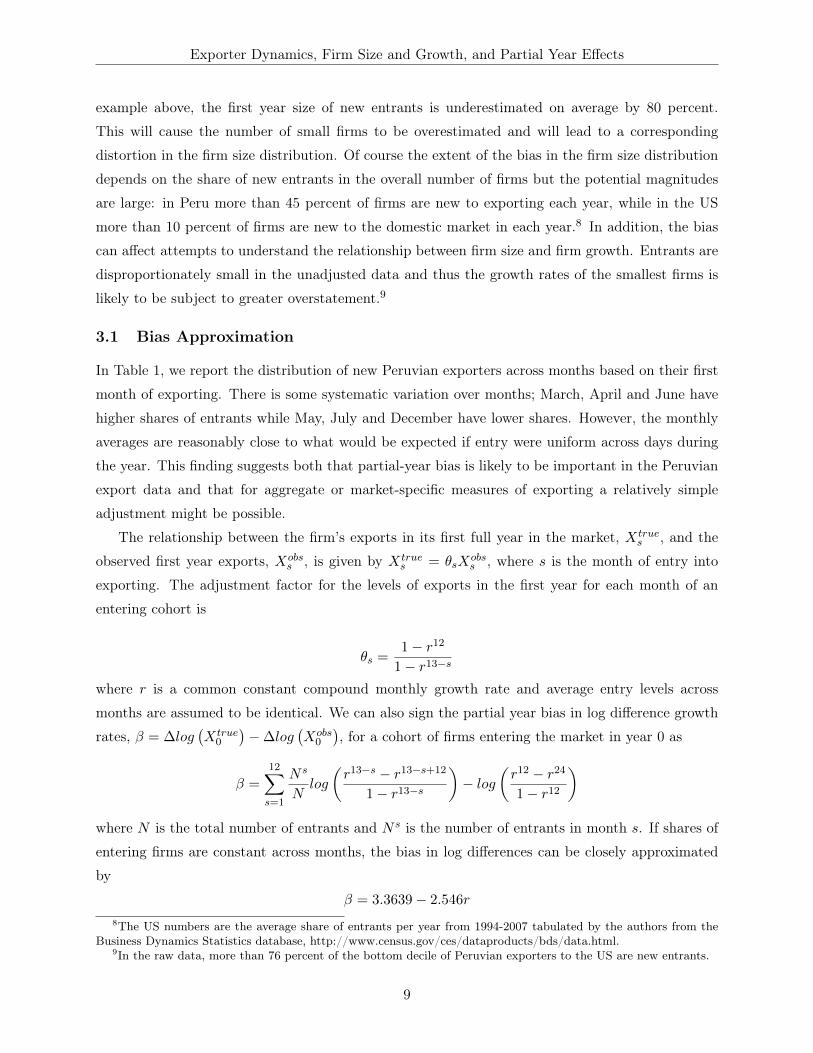
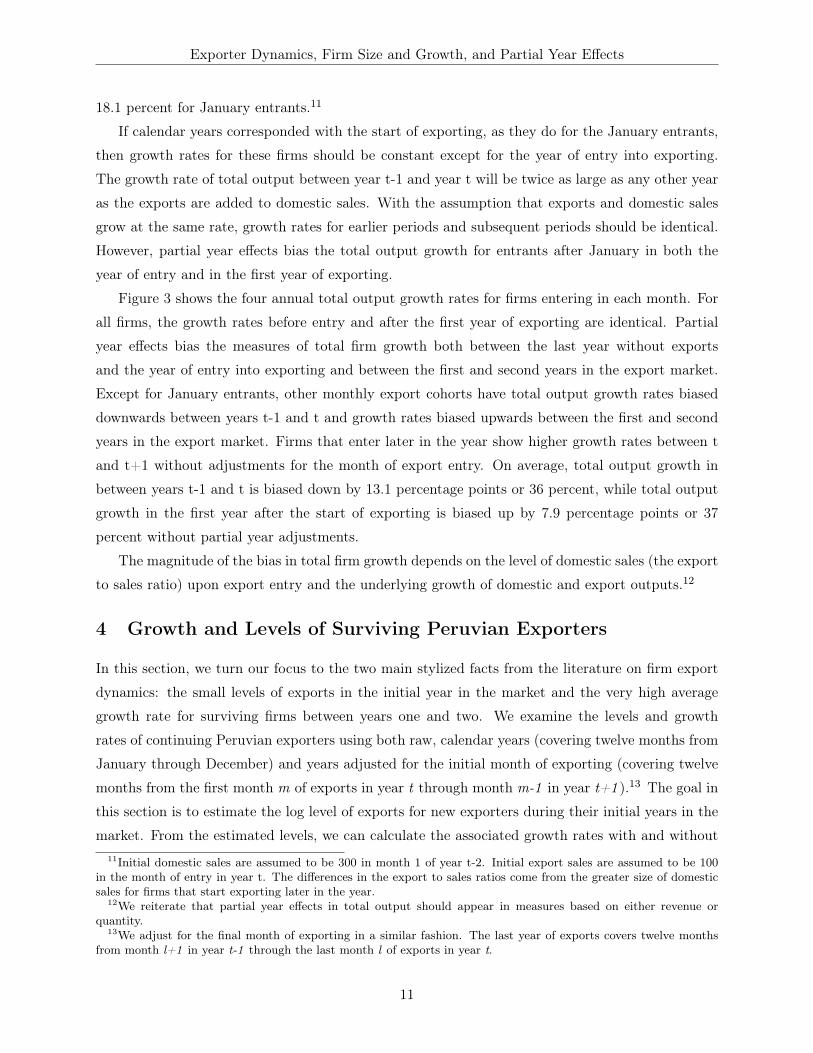
Figure 3: Growth Rates of Domestic+Export Output
Note: Firms are assumed to be identical except for their month of entry into exporting. Domestic and exportoutput for each firm grows at 22.6 percent per year, corresponding to a 1.715 compound monthly growthrate. All firms survive and the displayed growth rates are the annual differences in log total sales, i.e logrevenue in year t+2 minus log exports in year t+1. Adjusted for the month of entry, firm sales grow at aconstant rate corresponding to a log difference of 0.204.
for monthly compound growth rates between 0 and 10 percent, r ∈ (1.0, 1.1).
3.2 Firm Total Revenue Growth
We conclude the theoretical example by showing how the partial year effects in exporting can affect
growth rates of total firm output, i.e. output destined for domestic plus export markets.10 All
firms are assumed to enter the domestic market with the same size in month 1 of year t-2 and their
output destined for the domestic market subsequently grows at a constant, identical rate of 1.715
percent per month. Firms start entering the export market in year t with equal numbers entering
in each month. As in the previous example, export growth is constant and common across firms
and assumed to be equal to output growth in the domestic market. With these assumptions export
output is a constant fraction of total output ranging from 15.5 percent for December entrants to10We do not have data on total output or domestic output of the exporting Peruvian firms so we cannot take these
implications to the data.
10
Exporter Dynamics, Firm Size and Growth, and Partial Year Effects
18.1 percent for January entrants.11
If calendar years corresponded with the start of exporting, as they do for the January entrants,
then growth rates for these firms should be constant except for the year of entry into exporting.
The growth rate of total output between year t-1 and year t will be twice as large as any other year
as the exports are added to domestic sales. With the assumption that exports and domestic sales
grow at the same rate, growth rates for earlier periods and subsequent periods should be identical.
However, partial year effects bias the total output growth for entrants after January in both the
year of entry and in the first year of exporting.
Figure 3 shows the four annual total output growth rates for firms entering in each month. For
all firms, the growth rates before entry and after the first year of exporting are identical. Partial
year effects bias the measures of total firm growth both between the last year without exports
and the year of entry into exporting and between the first and second years in the export market.
Except for January entrants, other monthly export cohorts have total output growth rates biased
downwards between years t-1 and t and growth rates biased upwards between the first and second
years in the export market. Firms that enter later in the year show higher growth rates between t
and t+1 without adjustments for the month of export entry. On average, total output growth in
between years t-1 and t is biased down by 13.1 percentage points or 36 percent, while total output
growth in the first year after the start of exporting is biased up by 7.9 percentage points or 37
percent without partial year adjustments.
The magnitude of the bias in total firm growth depends on the level of domestic sales (the export
to sales ratio) upon export entry and the underlying growth of domestic and export outputs.12
4 Growth and Levels of Surviving Peruvian Exporters
In this section, we turn our focus to the two main stylized facts from the literature on firm export
dynamics: the small levels of exports in the initial year in the market and the very high average
growth rate for surviving firms between years one and two. We examine the levels and growth
rates of continuing Peruvian exporters using both raw, calendar years (covering twelve months from
January through December) and years adjusted for the initial month of exporting (covering twelve
months from the first month m of exports in year t through month m-1 in year t+1 ).13 The goal in
this section is to estimate the log level of exports for new exporters during their initial years in the
market. From the estimated levels, we can calculate the associated growth rates with and without11Initial domestic sales are assumed to be 300 in month 1 of year t-2. Initial export sales are assumed to be 100
in the month of entry in year t. The differences in the export to sales ratios come from the greater size of domesticsales for firms that start exporting later in the year.
12We reiterate that partial year effects in total output should appear in measures based on either revenue orquantity.
13We adjust for the final month of exporting in a similar fashion. The last year of exports covers twelve monthsfrom month l+1 in year t-1 through the last month l of exports in year t.
11
Exporter Dynamics, Firm Size and Growth, and Partial Year Effects
adjusting for partial year effects. Our focus on continuing exporters matches that of the empirical
literature on exporter dynamics that explores the growth pattern of surviving exporters.14
To conduct the exercise we first select a sample of firms with enough data to be able to compare
the levels of exports in the initial three years after export entry to export levels in subsequent (non-
exit) years. Similarly we examine exports in the final three years of exporting. The sample includes
all firms who export for at least four years and have just one change in their export status (entry
or exit but not both) for measures of calendar year exports and exports adjusted for the initial
month.15 These criteria mean that firms with gaps in their annual exports (by either method) are
excluded, as are all firms who export for brief spells, defined as fewer than 4 consecutive years. The
number of firms in the sample is reduced from the overall population of Peruvian exporters because
many firms enter and then exit, a large number of firms in the data enter after 2005, and a smaller
number of firms have multiple spells of exporting with a gap of at least one calendar year. After
limiting our sample in this manner we are left with 2352 firms and 10,580 firm export-years.
For the sample of “continuing” exports we estimate the following regression,
lnYit = ci +2∑
n=0
δentryi,t−n +3∑
x=1
δexiti,t+x + δt + εit (1)
where lnYit is the log exports of firm i in year t, δentryi,t−n is an indicator that equals one if firm i
started exporting in year t − n, i.e. Yi,t−n−1 = 0, Yi,t−n > 0, and δexiti,t+x is an indicator that equals
one if the firm stopped exporting in year t+ x, i.e. Yi,t+x−1 > 0, Yi,t+x = 0. The regression is run
on the same set of firms, once using the raw calendar year data and once using the data adjusted
for the initial export month. Standard errors are clustered at the firm level.16
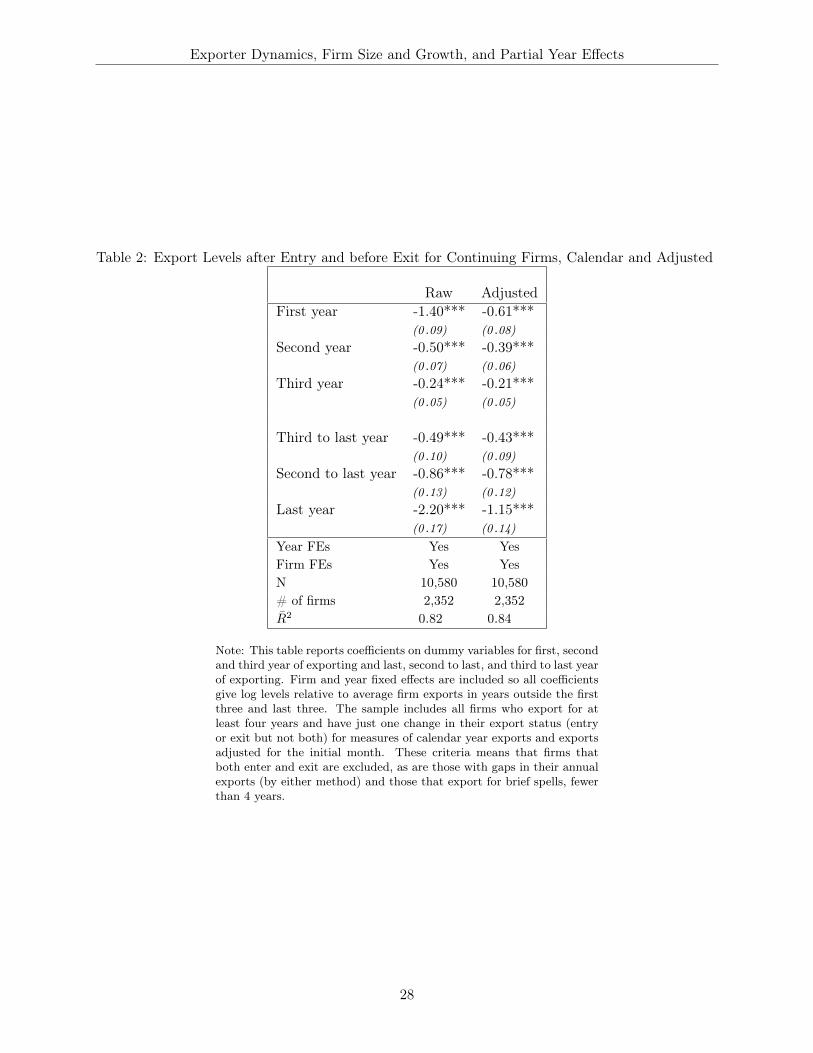
Table 2 reports coefficients on dummy variables for the first, second and third year of exporting
and the last, second to last, and third to last year of exporting. Firm and year fixed effects are
included so all coefficients give log levels relative to average firm exports in years outside the first
three and last three.
Figure 4 shows the average within-firm deviations in percentages for new exporters in their first
three years and exiting exporters in the last three years. The baseline is the within-firm average
over the period of active exporting. The red series of circles is calculated from the raw data without
any partial year corrections. These numbers correspond to the often-reported facts about exiting
and especially entering exporters. New exporters are small at entry, 75 percent below their within
sample average. However within several years most of the difference is erased, in their third year of
exporting these firms are just 22 percent below their average. Similarly firms contract in the years14We also estimate levels and growth rates for exiting firms in their last years in the market.15It is important to make sure there are no 12 months gaps in either the annual calendar data or the data adjusted
for initial months as no gaps in one series does not necessarily mean no gaps in the other.16This specification means that we lose several years of data at the beginning and end of the sample period so that
all the dummies are correctly specified for every firm.
12
Exporter Dynamics, Firm Size and Growth, and Partial Year Effects
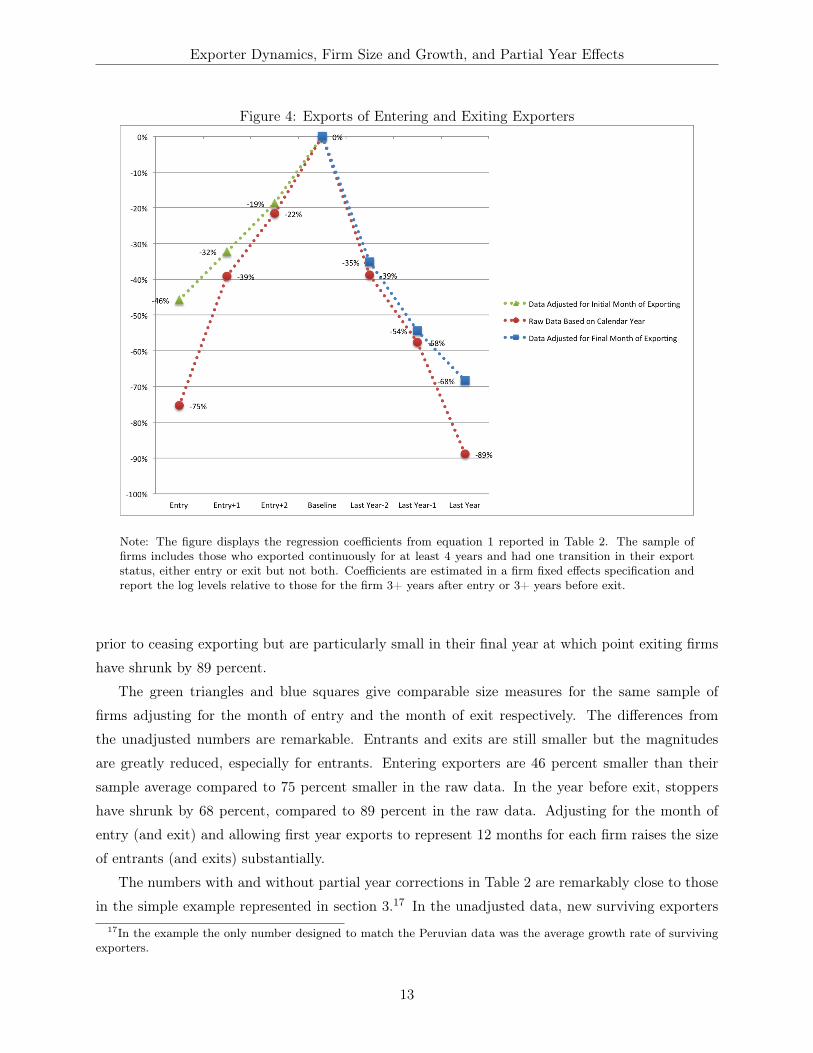
Figure 4: Exports of Entering and Exiting Exporters
Note: The figure displays the regression coefficients from equation 1 reported in Table 2. The sample offirms includes those who exported continuously for at least 4 years and had one transition in their exportstatus, either entry or exit but not both. Coefficients are estimated in a firm fixed effects specification andreport the log levels relative to those for the firm 3+ years after entry or 3+ years before exit.
prior to ceasing exporting but are particularly small in their final year at which point exiting firms
have shrunk by 89 percent.
The green triangles and blue squares give comparable size measures for the same sample of
firms adjusting for the month of entry and the month of exit respectively. The differences from
the unadjusted numbers are remarkable. Entrants and exits are still smaller but the magnitudes
are greatly reduced, especially for entrants. Entering exporters are 46 percent smaller than their
sample average compared to 75 percent smaller in the raw data. In the year before exit, stoppers
have shrunk by 68 percent, compared to 89 percent in the raw data. Adjusting for the month of
entry (and exit) and allowing first year exports to represent 12 months for each firm raises the size
of entrants (and exits) substantially.
The numbers with and without partial year corrections in Table 2 are remarkably close to those
in the simple example represented in section 3.17 In the unadjusted data, new surviving exporters17In the example the only number designed to match the Peruvian data was the average growth rate of surviving
exporters.
13
Exporter Dynamics, Firm Size and Growth, and Partial Year Effects
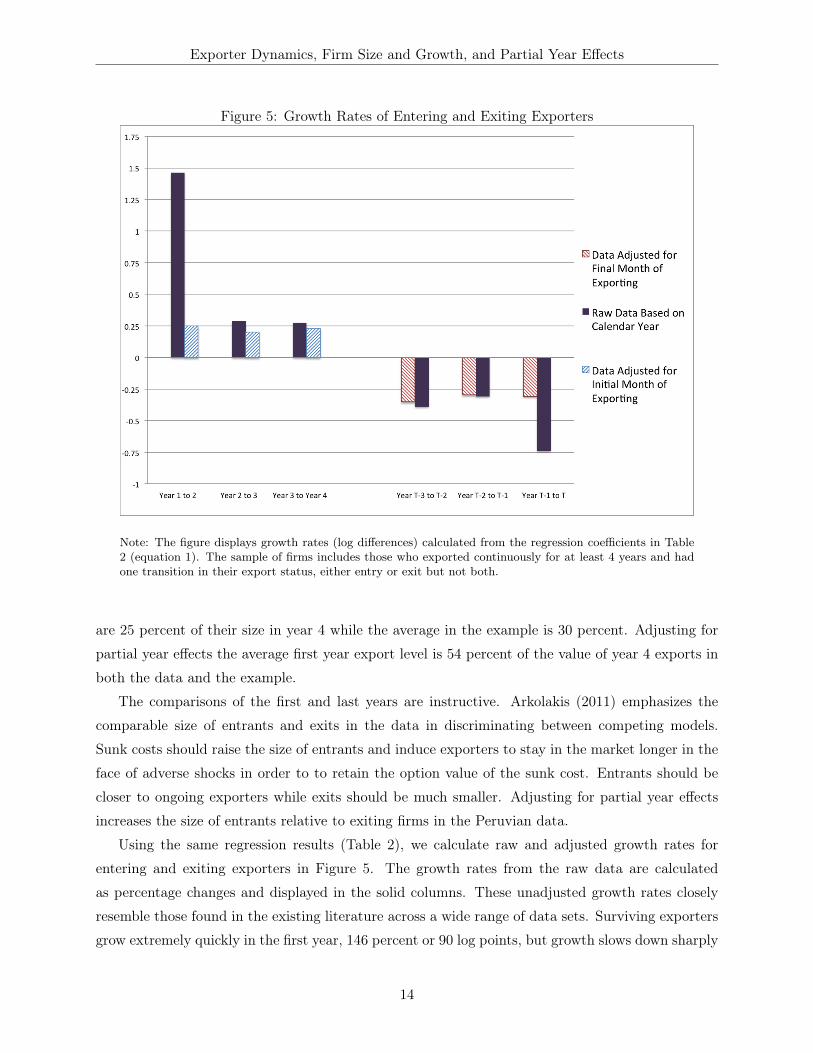
Figure 5: Growth Rates of Entering and Exiting Exporters
Note: The figure displays growth rates (log differences) calculated from the regression coefficients in Table2 (equation 1). The sample of firms includes those who exported continuously for at least 4 years and hadone transition in their export status, either entry or exit but not both.
are 25 percent of their size in year 4 while the average in the example is 30 percent. Adjusting for
partial year effects the average first year export level is 54 percent of the value of year 4 exports in
both the data and the example.
The comparisons of the first and last years are instructive. Arkolakis (2011) emphasizes the
comparable size of entrants and exits in the data in discriminating between competing models.
Sunk costs should raise the size of entrants and induce exporters to stay in the market longer in the
face of adverse shocks in order to to retain the option value of the sunk cost. Entrants should be
closer to ongoing exporters while exits should be much smaller. Adjusting for partial year effects
increases the size of entrants relative to exiting firms in the Peruvian data.
Using the same regression results (Table 2), we calculate raw and adjusted growth rates for
entering and exiting exporters in Figure 5. The growth rates from the raw data are calculated
as percentage changes and displayed in the solid columns. These unadjusted growth rates closely
resemble those found in the existing literature across a wide range of data sets. Surviving exporters
grow extremely quickly in the first year, 146 percent or 90 log points, but growth slows down sharply
14
Exporter Dynamics, Firm Size and Growth, and Partial Year Effects
in the next two years to 29 and 28 percent respectively. However, adjusting for the starting month
of exporting produces dramatic changes as seen in the striped columns. These same firms now
show average annual growth rates in the first three years of exporting of 25, 20 and 23 percent
respectively. The unusually large growth rate between years 1 and 2 is completely eliminated.
Instead of an anomalous first year, new, surviving exporters grow quickly but steadily after entry.18
Again the numbers with and without partial year corrections are remarkably close to those in
the simple example. Unadjusted first year growth rates are 90 log points in the data and 98 log
points in the example. Adjusted first year growth rates are 22 and 20 log points in the data and
the example respectively.
Adjusting for the month of entry eliminates the first year growth rate anomaly and raises initial
export size. Similarly adjusting for the month of exit eliminates the last year growth rate anomaly
and increases the relative size of first year exports to last year exports. The results suggest that the
stylized facts on growth rates and levels for new exporters may be substantially different than are
typically reported in the literature.
4.1 Productivity and Learning-by-exporting
Our findings on the bias in initial export levels and growth rates have potential implications beyond
the new literature on exporter dynamics. The relationship between exporting and productivity
remains an ongoing question for research using micro-data on firms engaged in international trade.
More productive firms select into exporting but the evidence is more mixed on the existence of
learning-by-exporting or, more precisely, whether productivity growth is faster at a firm after it
enters the export market.
To the extent that authors have found evidence of exporting effects on productivity, the higher
productivity growth is often concentrated in the period just after export entry.19 The results
presented here suggest that output growth, domestic plus export revenue, measured on an annual
basis will be biased around the years of entry into the export market. On average, the recorded
level in the year of export entry will not reflect a full year of exports and the growth rate of total
firm output will be biased. The bias will be negative for firm growth between year t-1 and year t
and positive between years t and t+1.20
18Partial year adjustments for the month of exit also eliminate the unusually rapid decline in exports just beforeexit. Exiting exporters decline steadily for several years before leaving the export market entirely.
19De Loecker (2007) argues that Slovenian firms increase their productivity after entry into the export market andfinds that almost all the productivity increase in the Slovenian data occurs between the first and second years inthe export market. Delgado, Farina, and Ruano (2002) find that productivity growth is higher for new exporters.Many other authors, e.g. Lileeva and Trefler (2010), report average annual growth rates for a multi-year period afterexporting which attenuates but does not eliminate the bias in total firm output. In Appendix 3.2, five year averageoutput growth rates starting in the year of export entry remain on average 7 percent above the true underlying changein annual total output.
20As before the bias will be greatest for firms that enter the new market later in the year.
15
Exporter Dynamics, Firm Size and Growth, and Partial Year Effects
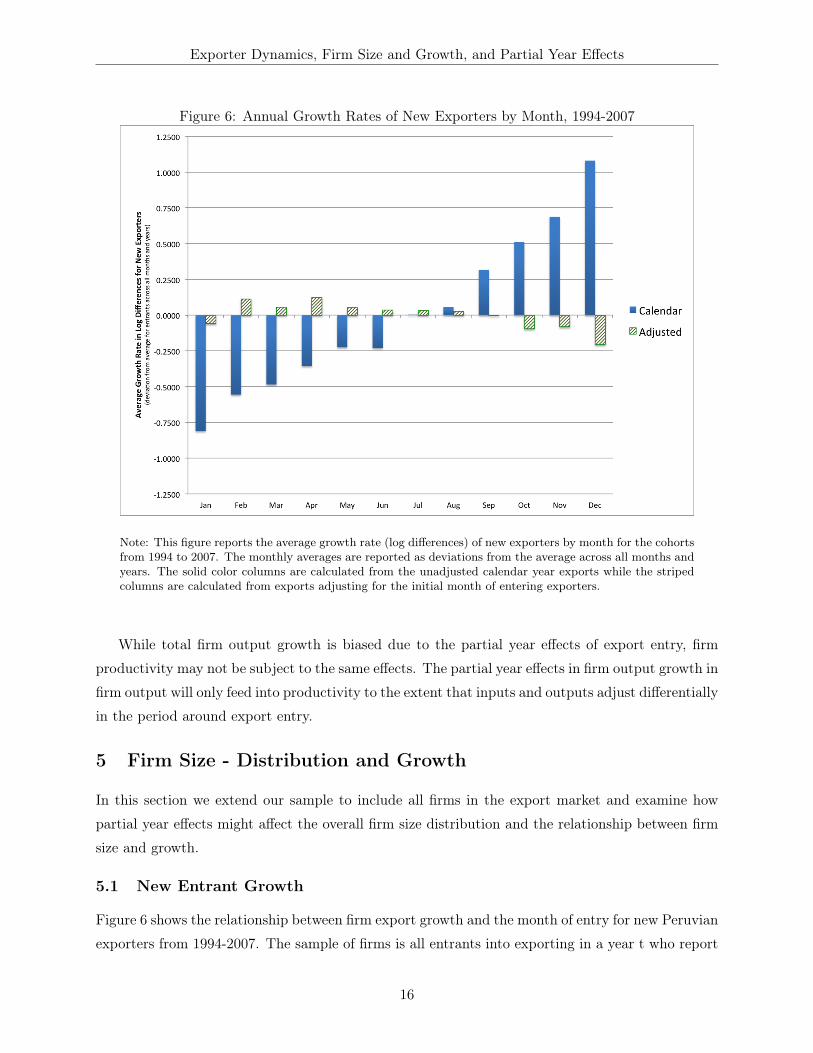
Figure 6: Annual Growth Rates of New Exporters by Month, 1994-2007
Note: This figure reports the average growth rate (log differences) of new exporters by month for the cohortsfrom 1994 to 2007. The monthly averages are reported as deviations from the average across all months andyears. The solid color columns are calculated from the unadjusted calendar year exports while the stripedcolumns are calculated from exports adjusting for the initial month of entering exporters.
While total firm output growth is biased due to the partial year effects of export entry, firm
productivity may not be subject to the same effects. The partial year effects in firm output growth in
firm output will only feed into productivity to the extent that inputs and outputs adjust differentially
in the period around export entry.
5 Firm Size - Distribution and Growth
In this section we extend our sample to include all firms in the export market and examine how
partial year effects might affect the overall firm size distribution and the relationship between firm
size and growth.
5.1 New Entrant Growth
Figure 6 shows the relationship between firm export growth and the month of entry for new Peruvian
exporters from 1994-2007. The sample of firms is all entrants into exporting in a year t who report
16
Exporter Dynamics, Firm Size and Growth, and Partial Year Effects
some exports in the following calendar year t+1. The solid columns are the average first year growth
rates by month of entry for all firms using the raw calendar data. The growth rates are given as
the deviation from the average across all months and years. As expected, partial year effects cause
the growth rates based on the calendar year data to rise systematically across the months with the
lowest for January entrants (81 log points below the mean) and the highest for December entrants
(108 log points above the mean). The striped columns show the same growth rates relative to
the mean for first year export growth adjusting for the month of entry. The systemic relationship
between entry month and export growth is eliminated and the pattern partly reverses.21 On average
the growth rates of all new exporters is 112 percent higher using calendar year data instead of the
adjusted data.
5.2 Export Levels of Entrants
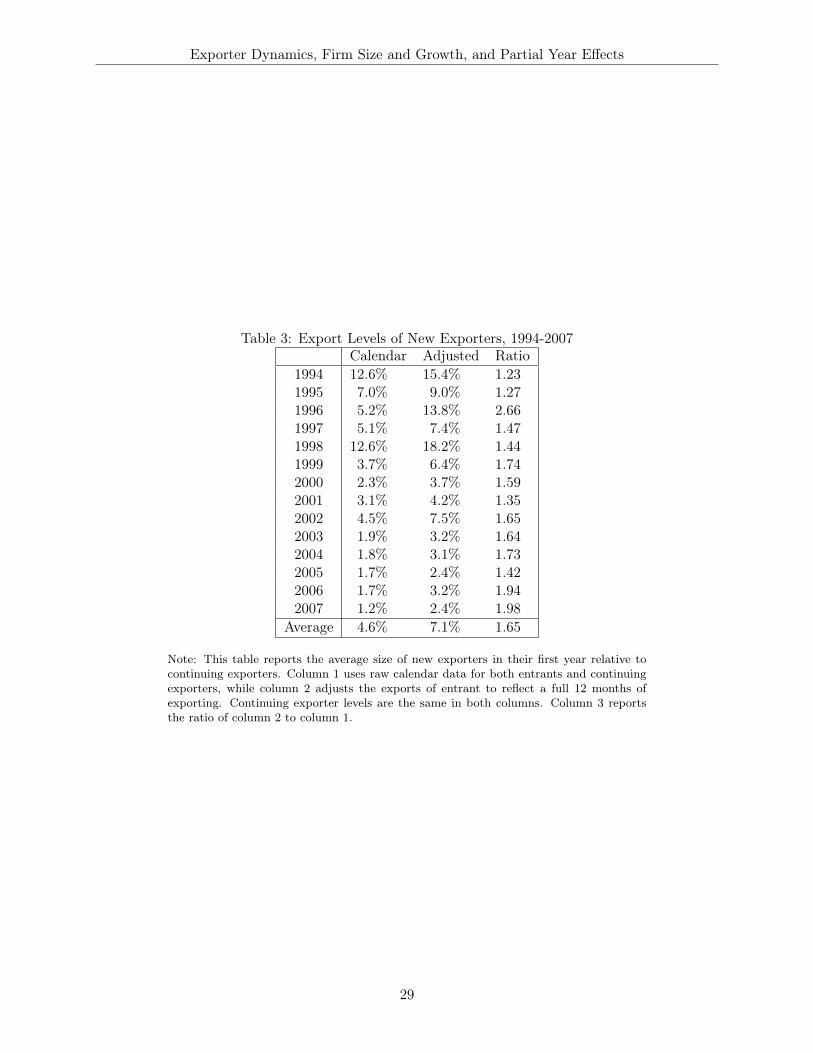
Table 3 reports the average size of all new exporters in their first year relative to continuing exporters
by year for the entire set of firms. As emphasized in the exporter dynamics literature, entrants are
indeed much smaller than continuing exporters. However, adjusting for partial year effects increases
entrant size by 65 percent.22 In addition there is a noticeable downward trend over time in the
relative size of entrants, calculated by either method. This decline is due to the systematic increase
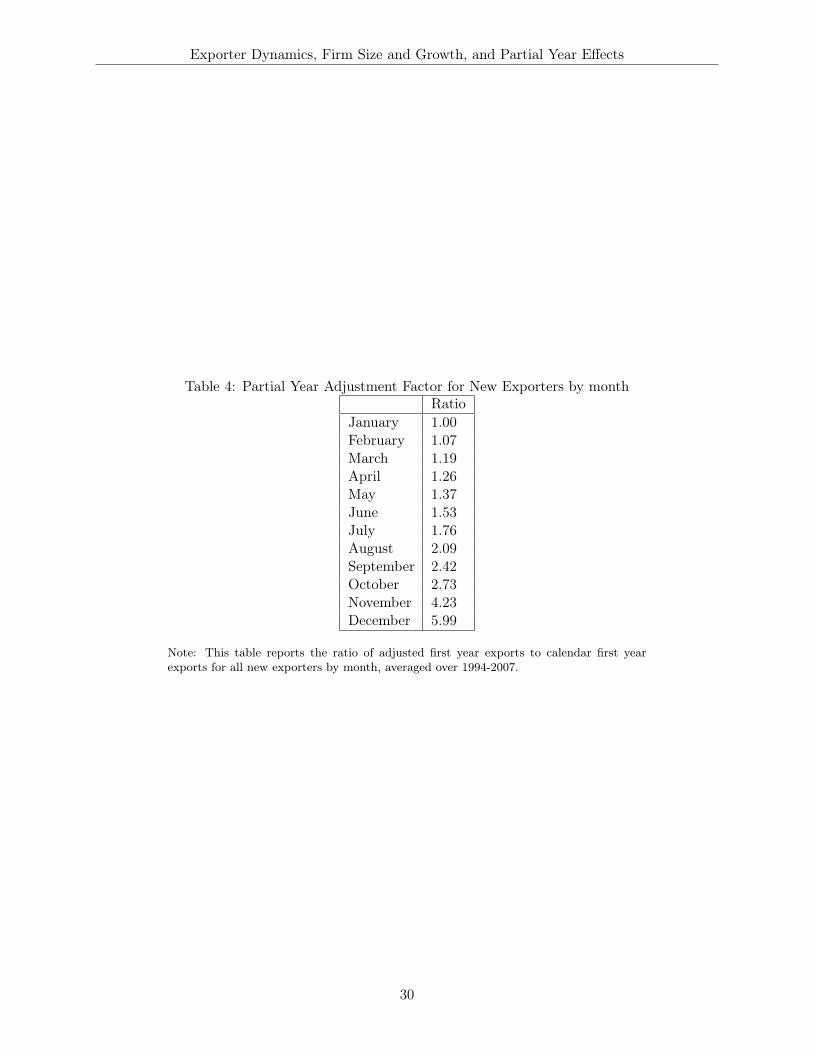
in the size of continuing exporters rather than a decline in the size of entrants. Table 4 shows
that adjusting for partial year effects varies systematically across months. Entrants in December
on average have a 599 percent increase in the measured first year exports.
5.3 Firm Size Distribution
The downward bias in levels for new exporters in a market has the potential to shift the export
firm size distribution. In the raw data typically used to calculate the firm size distribution, new
entrants are not measured with a full year’s sales in the market. Measuring their firm size with a full
year of export sales would increase their size and since exporters are typically smaller firms these
adjustments should have the biggest effects in the left tails of the distribution. We investigate the
effects of partial year effects on the export size distribution of Peruvian firms in the US market.23
As is the case in many exporting countries, a large fraction of Peruvian exporters are new to the
market each year. The US market is no exception, fully 45.8 percent of Peruvian exporters in the
US are new in each year. These new exporters vary substantially in initial size. Figure 7 shows the
percentage of new exporters in the export size distribution for firms serving the US market. The21The lower growth rates for entrants in later months comes from a truncation of the sample. Firms are included
if they report exports in years t and t+1 whether or not they continue to export past December, t+1. The latermonths include a greater fraction of firms that no longer export to the US in year t+2 and thus have small exportsin their second year in the market due to exit.
22This is twice as large as the size correction reported for new French exporters by Berthou and Vicard (2013).23The patterns in other destinations market are largely unchanged.
17
Exporter Dynamics, Firm Size and Growth, and Partial Year Effects
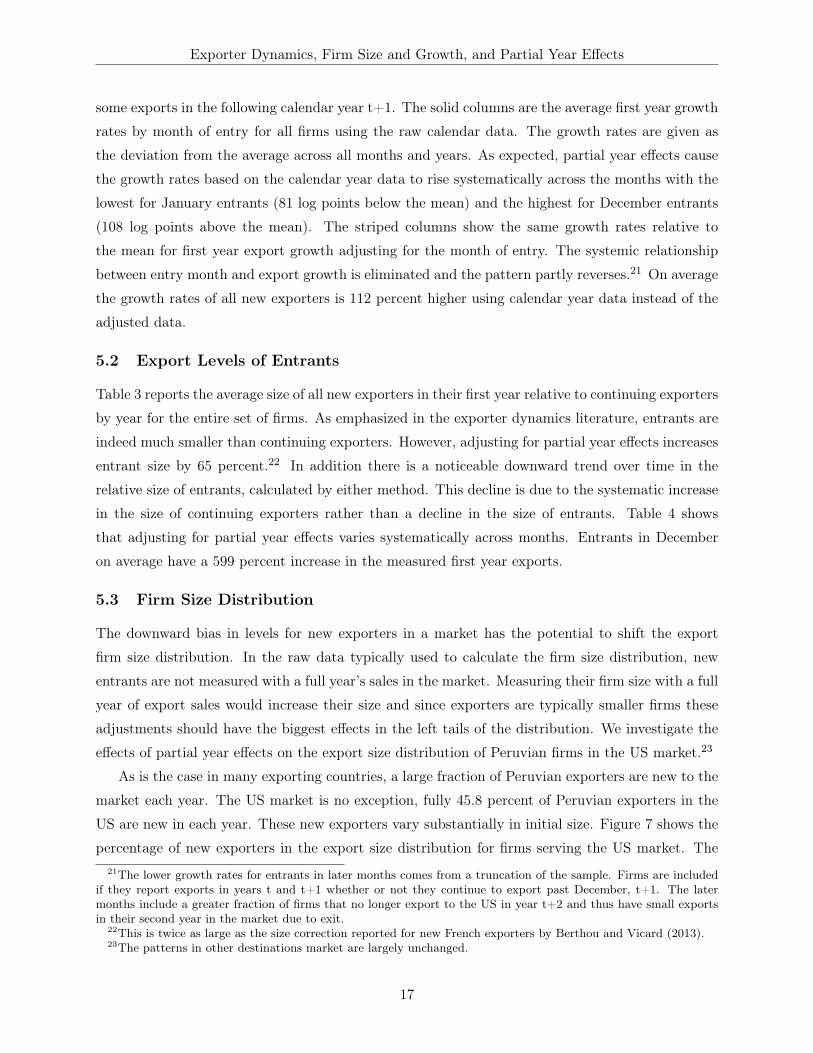
Figure 7: Entering Exporters as a Share of All Exporters in the US Market by Size Decile
Note: This figure reports new exporters to the US as a fraction of all firms exporting to the US by firm sizedecile. The solid color columns are calculated from the unadjusted calendar year exports while the stripedcolumns are calculated from exports adjusting for the initial month of entering exporters.
calendar year shares are given by the solid red columns and, as expected, new exporters are most
common in the smallest group of firms (76.2 percent) and relatively infrequent in the largest size
decile (10.1 percent).
Adjusting for partial year effects shifts the location of new exporters in the size distribution
towards the larger groups of firms (striped columns in the figure). More than 10 percent of the
new entrants move from below the median to above the median, with the biggest drops in the
smallest deciles and the biggest gains in the largest. These results point to an important extension
of the findings so far - the overall size distribution of firms, not just that of exporters, is biased
as a result of the presence of entrants who have been active for less than a full year. While new
entrants are particularly prevalent in individual export markets, they also are important in the
overall distribution of firms. Between 2001-2007 in the US, new firms accounted for more than 10
percent of all firms in any given year, with the entrants heavily concentrated in the smallest size
categories.
Next we examine the change in the firm size distribution itself. Figure 8 shows the firm size
18
Exporter Dynamics, Firm Size and Growth, and Partial Year Effects
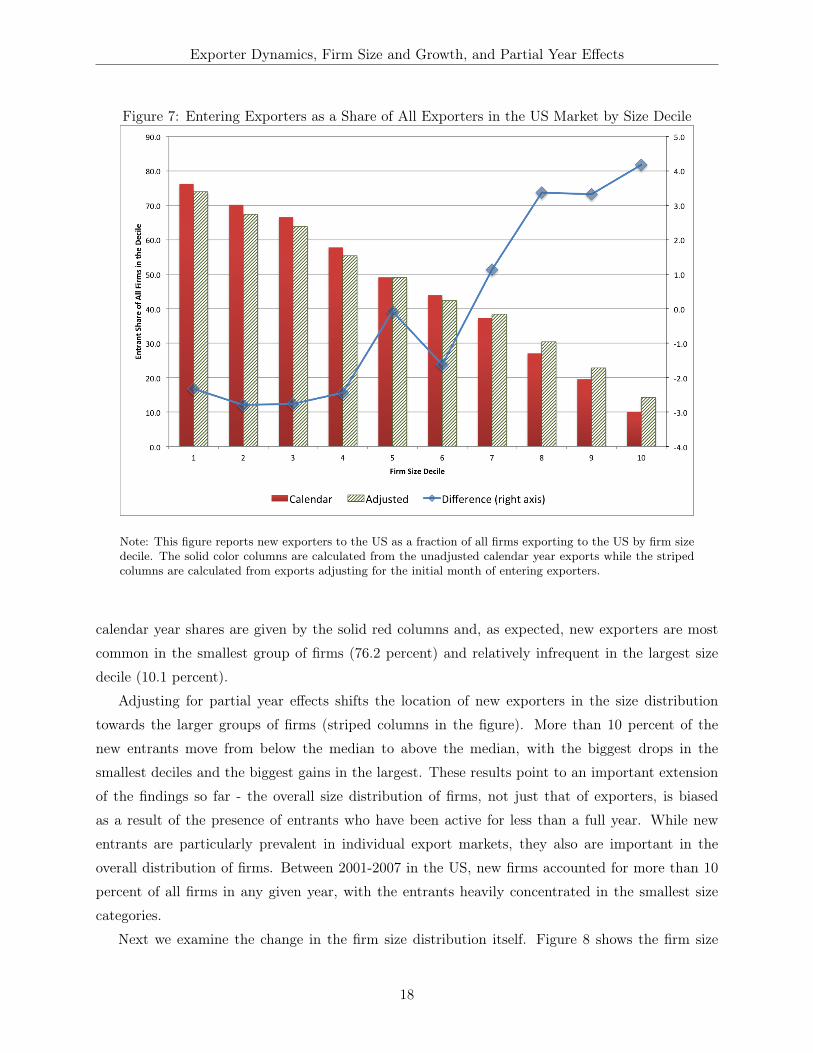
Figure 8: Exporter Size Distribution - US Market, 2006
Note: This figure reports the distribution exporter sizes in the US market. The solid color columns arecalculated from the unadjusted calendar year exports while the striped columns are calculated from exportsadjusting for the initial month of entering exporters. Continuing exporters have the same size (exports toUS) in both the calendar and adjusted calculations.
distribution for Peruvian exporters to the US market in 2006. The solid columns are tabulated with
the raw data while the striped columns are calculated with the adjusted data. The lower part of the
size distribution does shift rightward as expected but the magnitude of the shift in the distribution
is quite small.
There are two competing effects at work. Entry and exit rates are high among Peruvian ex-
porters. On the one hand, high entry means that many firms can potentially have their first year
export numbers adjusted upwards. This effect shifts the size distribution to the right. On the other
hand with high firm exit, many entrants quickly exit the export market and so their partial year
exports represent their entire first (and only) year in the market. This effect reduces, but does not
eliminate, the magnitude of the partial year adjustment on the firm size distribution. The results
in Section 4 for continuing exporters and the big differences in growth rates reported in this section
exclude one year exporters and are not subject to the latter effect.24
24We reiterate that high entry and exit rates among exporting firms are robust to partial year adjustments.
19
Exporter Dynamics, Firm Size and Growth, and Partial Year Effects
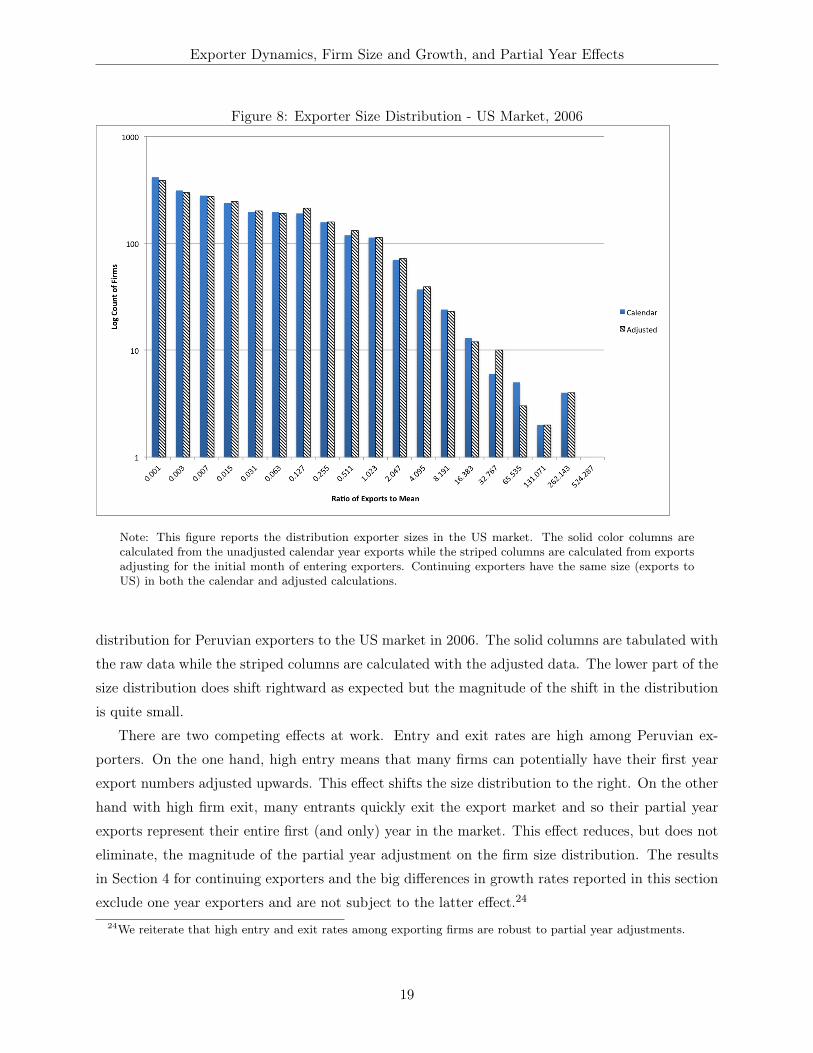
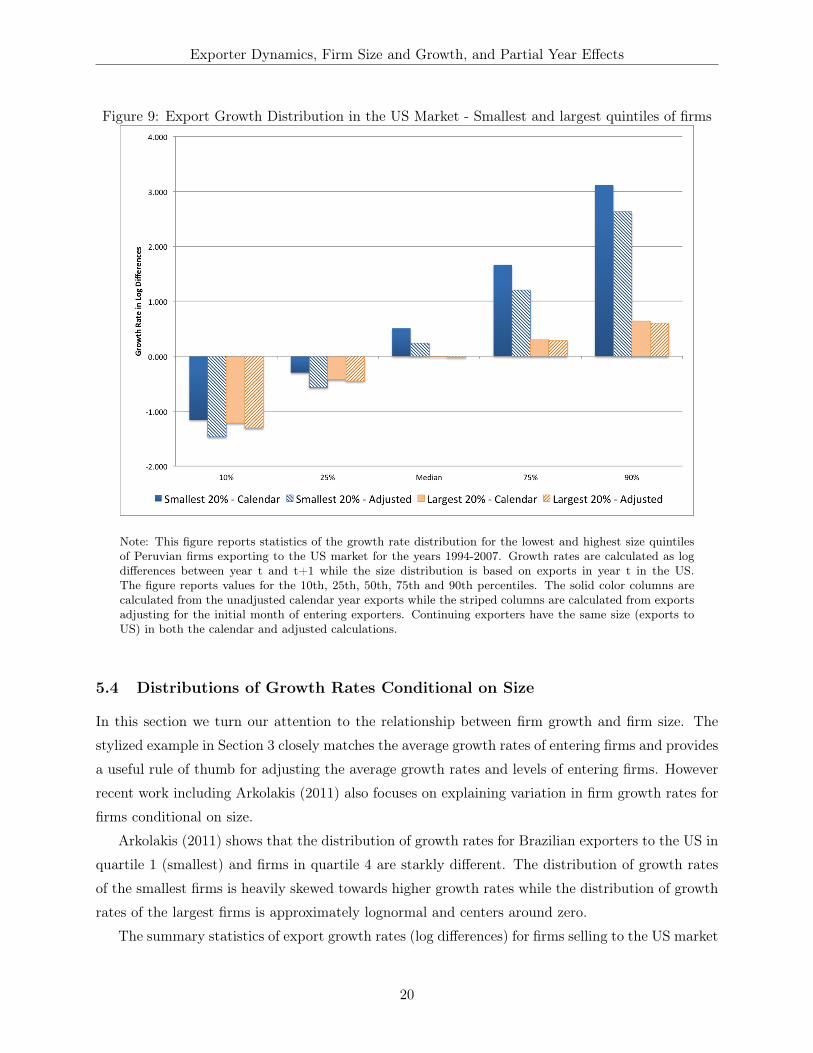
Figure 9: Export Growth Distribution in the US Market - Smallest and largest quintiles of firms
Note: This figure reports statistics of the growth rate distribution for the lowest and highest size quintilesof Peruvian firms exporting to the US market for the years 1994-2007. Growth rates are calculated as logdifferences between year t and t+1 while the size distribution is based on exports in year t in the US.The figure reports values for the 10th, 25th, 50th, 75th and 90th percentiles. The solid color columns arecalculated from the unadjusted calendar year exports while the striped columns are calculated from exportsadjusting for the initial month of entering exporters. Continuing exporters have the same size (exports toUS) in both the calendar and adjusted calculations.
5.4 Distributions of Growth Rates Conditional on Size
In this section we turn our attention to the relationship between firm growth and firm size. The
stylized example in Section 3 closely matches the average growth rates of entering firms and provides
a useful rule of thumb for adjusting the average growth rates and levels of entering firms. However
recent work including Arkolakis (2011) also focuses on explaining variation in firm growth rates for
firms conditional on size.
Arkolakis (2011) shows that the distribution of growth rates for Brazilian exporters to the US in
quartile 1 (smallest) and firms in quartile 4 are starkly different. The distribution of growth rates
of the smallest firms is heavily skewed towards higher growth rates while the distribution of growth
rates of the largest firms is approximately lognormal and centers around zero.
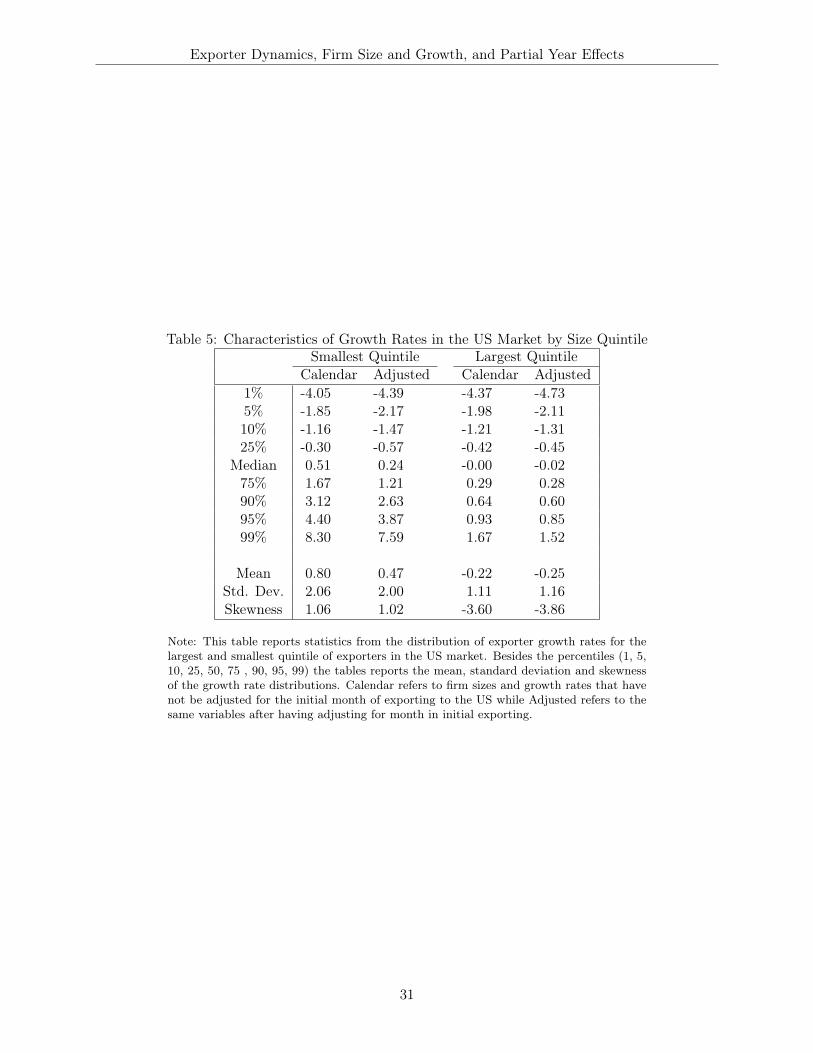
The summary statistics of export growth rates (log differences) for firms selling to the US market
20
Exporter Dynamics, Firm Size and Growth, and Partial Year Effects
for the quintile of the smallest firms and the quintile of the largest firms are given in Table 5. The
left-hand columns report statistics on growth rates for the smallest quintile of firms, first using the
raw, calendar data and then adjusting levels and growth rates of new exporters for the initial month
of entry. The right hand pair of columns reports the same statistics for the largest quintile of firms.
The Peruvian exporter growth rate distributions in the US vary across firm sizes in much the
same way as the Brazilian growth rates reported in Arkolakis (2011). Growth in the smallest firms
is high on average, is skewed towards higher values, and shows a large amount of dispersion. Growth
rates in the largest firms are centered around zero, are skewed towards negative growth rates and
have relatively compact support.
Performing the partial year adjustments for new exporters, we find large changes in the features
of the distribution that vary systematically across the size groups. Figure 9 shows characteristics
of the growth rate distribution for the smallest and largest size quintiles of firms. The partial year
adjustments dramatically lower the mean and median growth for the group of the smallest firms
and shift the distribution of their growth rates leftward over the entire range but particularly for
the highest values. The dispersion and skewness also fall for these smaller firms. As expected, the
largest quintile of firms shows relatively little change since there are many fewer new exporters in
this part of the firm size distribution. The distribution of growth rates for the largest firms also
shifts to the left but the changes are small.
Overall we have shown that partial year effects are responsible for some of the observed regular-
ities in the firm size distribution and the growth rate distribution for firms of different sizes. These
effects provide a partial explanation for the presence of large numbers of small firms. They also
reduce the mean and dispersion of growth rates for the smallest firms in the market. However, it
is important to recognize that, for Peruvian exporters to the US, adjusting for partial year effects
does not overturn the stylized facts on overall firm size and firm growth.
5.5 Employment versus Sales
The focus of the empirical work in this paper has been on export sales and the firm size distribution
measured by exports. There is every reason to believe that the findings on exports will largely be
replicated when looking at overall firm sales or sales in the domestic market.25 However, most of the
empirical work on firm size and growth has looked at the employment levels of firms in an economy.
To the extent that employment is a variable factor of production and covaries systematically with
sales levels, our findings should apply more broadly to the employment size distribution and growth
rates. In contrast, if labor is a fixed factor that does not adjust with firm output growth, the
biases documented here for exports will be less likely to distort the empirical results based on firm25Obviously, exports do differ from domestic sales in a number of dimensions, particular the level of activity, the
selection of firms into the market, and the duration of the market participation spells.
21
Exporter Dynamics, Firm Size and Growth, and Partial Year Effects
employment. The extent to which partial year effects are important in analyses of employment
levels and growth across firms remains a question for future research.
6 Conclusion
This paper has taken a first step towards a deeper understanding of the performance of firms in
their first years in a market. The motivation for the work is the rapidly growing literature on firm
export dynamics that is heavily based on the twin stylized facts that exporters start small and grow
very rapidly in their first year in the foreign market. This paper shows that these two facts are
largely explained by the fact that exporters enter the market throughout the year and only part of
their first year sales are recorded in the calendar year of entry.
Aggregated to the calendar year, the Peruvian data used in this paper match the stylized facts
in the literature quite closely. Adjusting for the month of entry changes the findings dramatically.
Exporters are larger upon entry, although still smaller than continuing exporters, and their growth
in their first year in the market is no different from subsequent years. The motivating stylized facts
on new exporter size and growth are not robust to partial year adjustments.
These findings have implications for a variety of research efforts using detailed micro-data on
exports. A number of papers have examined the contributions of extensive and intensive margins to
annual export growth and during specific events such as the Asian Crisis and the Great Recession.
The use of annual data will understate the contribution of the extensive margins in annual export
growth. New exporters will contribute less to overall growth in their year of entry because only
part of their first year sales are recorded. Symmetrically their growth rates will be biased upwards
between the year of entry and the following year and will be recorded as increases in the intensive
margin of exporting.
Partial year effects also distort total firm growth in and after the year of export entry. The
growth rates between year t-1 and t, the year of export entry, will be reduced and the growth
rate between t and t+1 biased upward. Depending on the timing of input purchases this may
lead to perceived higher productivity growth after entry and mistaken conclusions that there is
learning-by-exporting.
The potential consequences of partial year effects go beyond firm export dynamics and include
effects on the firm size distribution and the relationships between firm size and growth. We examine
the implications for the firm size and growth distributions of Peruvian exporters in the US market.
After adjusting for partial year effects the size distribution is shifted to the right (towards large firm
sizes), albeit modestly, and the growth distribution of the smallest firms in the market is shifted
to the left (towards lower growth rates). More work using data on firms active in the domestic
market is needed to understand how important the partial year effect is for measures of output and
employment growth and for the overall firm size distribution.
22
Exporter Dynamics, Firm Size and Growth, and Partial Year Effects
The consequences of partial year effects may extend to work on more aggregated data such as
that assembled in the Exporter Dynamics Database at the World Bank and described by Cebeci,
Fernandes, Freund, and Pierola (2012). Stylized Fact 1 in that paper states that more developed
and larger countries have larger average exporter size and exhibit significantly lower exporter entry
and exit rates. However, the findings reported here suggest that large shares of entrants and exits
will by themselves be likely to induce downward bias in firm size as measured in unadjusted annual
export flows. As a result, the cross-country correlation between average exporter size and GDP
per capita may be driven in part by partial year effects. The importance of entry and exit in the
exporting sector and the reliance on export value data for analysis means that such comparisons
based on even aggregate data must be viewed with caution.
23
Exporter Dynamics, Firm Size and Growth, and Partial Year Effects
References
Aeberhardt, R., I. Buono, and H. Fadinger (2012): “Learning, incomplete contracts and
export dynamics: theory and evidence from French firms,” Discussion paper, Banca D’Italia
Working Paper 883. 1
Akhmetova, Z., and C. Mitaritonna (2012): “A Model of Firm Experimentation under Demand
Uncertainty with an Application to Multi-Destination Exporters,” Working paper, University of
New South Wales, School of Economics. 1
Albornoz, F., H. F. C. Pardo, G. Corcos, and E. Ornelas (2012): “Sequential Exporting,”
Journal of International Economics, 88, 17–31. 1
Amiti, M., and C. Freund (2010): “China’s Growing Role in World Trade,” chap. The Anatomy
of China’s Export Growth, pp. 35–56. University of Chicago Press. 1
Araujo, L. F., G. Mion, and E. Ornelas (2012): “Institutions and Export Dynamics,” Discus-
sion paper, National Bank of Belgium Working Paper No. 220. 1
Arkolakis, K. (2011): “A Unified Theory of Firm Selection and Growth,” Working paper, NBER
Working Paper 17553. 1, 1, 4, 5.4, 5.4
Axtell, R. L. (2001): “Zipf Distribution of US Firm Sizes,” Science, 293, 1818–1820. 1
Bernard, A. B., J. B. Jensen, S. J. Redding, and P. K. Schott (2009): “The Margins of
US Trade,” American Economic Review, 99(2), 487–93. 1, 1
Bernard, A. B., A. Moxnes, and K. H. Ulltveit-Moe (2013): “Two-sided Heterogeneity and
Trade,” Discussion paper, Tuck School of Business. 1
Berthou, A., and V. Vicard (2013): “Firms’ Export Dynamics: Experience vs. Size,” Discussion
paper, Mimeo. 1, 5, 22
Beveren, I. V., A. B. Bernard, and H. Vandenbussche (2012): “Concording EU Trade and
Production Data over Time,” Discussion paper, NBER Working Paper 18604. 1
Blum, B., S. Claro, and Horstmann (2011): “Intermediation and the nature of trade costs:
theory and evidence,” Unpublished, Rotman School of Management. 1
Buono, I., and H. Fadinger (2012): “The Micro Dynamics of Exporting - Evidence from French
Firms,” Discussion paper, Banca D’Italia Working Paper 880. 1
Cabral, L., and J. Mata (2003): “On the Evolution of the Firm Size Distribution: Facts and
Theory,” American Economic Review, 93(4), 1075–1090. 4, 1
24
Exporter Dynamics, Firm Size and Growth, and Partial Year Effects
Carballo, J., G. I. Ottavianio, and C. V. Martincus (2013): “The Buyer Margins of Firms’
Exports,” Discussion paper, LSE. 1
Cebeci, T., and A. Fernandes (2013): “Micro Dynamics of Turkey’s Export Boom in the 2000s,”
Discussion paper, World Bank Policy Research Working Paper 6452. 1
Cebeci, T., A. M. Fernandes, C. Freund, and M. D. Pierola (2012): “Exporter Dynamics
Database,” Policy research working paper 6229, The World Bank. 2, 6
De Loecker, J. (2007): “Do exports generate higher productivity? Evidence from Slovenia,”
Journal of International Economics, 73(1), 69–98. 19
Delgado, M. A., J. C. Farina, and S. Ruano (2002): “Firm Productivity and export market:
a non-parametric approach,” Journal of International Economics, 57(1), 397–422. 19
Dunne, T., M. J. Roberts, and L. Samuelson (1988): “Patterns of Firm Entry and Exit in
U.S. Manufacturing Industries,” Rand Journal of Economics, 19, 495–515. 4
(1989): “The Growth and Failure of U.S. Manufacturing Plants,” The Quarterly Journal
of Economics, 104(4), 671–98. 4
Eaton, J., M. Eslava, D. Jinkins, C. J. Krizan, and J. Tybout (2012): “A Search and
Learning Model of Export Dynamics,” working paper. 1, 1
Eaton, J., M. Eslava, M. Kugler, and J. Tybout (2008): “Export Dynamics in Colombia:
Firm-Level Evidence,” in The Organization of Firms in a Global Economy, ed. by E. Helpman,
D. Marin, and T. Verdier. University of Chicago Press. 1, 1
Eaton, J., S. S. Kortum, and F. Kramarz (2011): “An Anatomy of International Trade:
Evidence from French Firms,” Econometrica, 79(5), 1453–1498. 1, 1
Evans, D. S. (1987a): “The Relationship between Firm Growth, Size, and Age: Estimates for 100
Manufacturing Industries,” Journal of Industrial Economics, 35(4), 567–81. 4
Evans, D. S. (1987b): “Tests of Alternative Theories of Firm Growth,” The Journal of Political
Economy, 95(4), 657–674. 4
Freund, C., and M. D. Pierola (2010): “Export entrepreneurs: Evidence from Peru,” Discussion
paper, World Bank Policy Research Working paper 5407. 3
Lawless, M. (2009): “Firm Export Dynamics and the Geography of Trade,” Journal of Interna-
tional Economics, 77, 245–254. 1, 1
25
Exporter Dynamics, Firm Size and Growth, and Partial Year Effects
Lileeva, A., and D. Trefler (2010): “Improved Access to Foreign Markets Raises Plant-Level
Productivity... for Some Plants,” The Quarterly Journal of Economics, 125(3), 1051–1099. 19
Luttmer, E. G. J. (2007): “Selection, growth and the size distribution of firms,” The Quarterly
Journal of Economics, 122(3), 1103–1144. 1
Roberts, M. J., and J. R. Tybout (1997): “The Decision to Export in Colombia: An Empirical
Model of Entry with Sunk Costs,” American Economic Review, 87(4), 545–64. 1
Sutton, J. (1997): “Gibrat’s Legacy,” Journal of Economic Literature, 35(1), 40–59. 4
Timoshenko, O. A. (2013): “Product Switching in a Model of Learning,” Working paper, George
Washington University, Department of Economics. 1
26
Exporter Dynamics, Firm Size and Growth, and Partial Year Effects
Table 1: The Distribution of Entry by Peruvian Exporters across Months, average 1994-2007Share of Entrants % high/low
January 8.7 4.0February 8.2 -1.2March 8.8 5.0April 9.2 10.7May 7.6 -9.0June 8.8 5.4July 7.9 -4.7August 8.3 -0.6September 8.5 1.7October 8.5 1.9November 8.6 3.7December 6.9 -17.2
Note: The first column reports the share of new exporters that startexporting in that month averaged across 1994-2007. The second col-umn shows the percentage difference of the monthly average from thebenchmark of new entrants arriving uniformly across the days of theyear.
27
Exporter Dynamics, Firm Size and Growth, and Partial Year Effects
Table 2: Export Levels after Entry and before Exit for Continuing Firms, Calendar and Adjusted
Raw AdjustedFirst year -1.40*** -0.61***
(0 .09) (0 .08)Second year -0.50*** -0.39***
(0 .07) (0 .06)Third year -0.24*** -0.21***
(0 .05) (0 .05)
Third to last year -0.49*** -0.43***(0 .10) (0 .09)
Second to last year -0.86*** -0.78***(0 .13) (0 .12)
Last year -2.20*** -1.15***(0 .17) (0 .14)
Year FEs Yes YesFirm FEs Yes YesN 10,580 10,580# of firms 2,352 2,352R̄2 0.82 0.84
Note: This table reports coefficients on dummy variables for first, secondand third year of exporting and last, second to last, and third to last yearof exporting. Firm and year fixed effects are included so all coefficientsgive log levels relative to average firm exports in years outside the firstthree and last three. The sample includes all firms who export for atleast four years and have just one change in their export status (entryor exit but not both) for measures of calendar year exports and exportsadjusted for the initial month. These criteria means that firms thatboth enter and exit are excluded, as are those with gaps in their annualexports (by either method) and those that export for brief spells, fewerthan 4 years.
28
Exporter Dynamics, Firm Size and Growth, and Partial Year Effects
Table 3: Export Levels of New Exporters, 1994-2007Calendar Adjusted Ratio
1994 12.6% 15.4% 1.231995 7.0% 9.0% 1.271996 5.2% 13.8% 2.661997 5.1% 7.4% 1.471998 12.6% 18.2% 1.441999 3.7% 6.4% 1.742000 2.3% 3.7% 1.592001 3.1% 4.2% 1.352002 4.5% 7.5% 1.652003 1.9% 3.2% 1.642004 1.8% 3.1% 1.732005 1.7% 2.4% 1.422006 1.7% 3.2% 1.942007 1.2% 2.4% 1.98
Average 4.6% 7.1% 1.65
Note: This table reports the average size of new exporters in their first year relative tocontinuing exporters. Column 1 uses raw calendar data for both entrants and continuingexporters, while column 2 adjusts the exports of entrant to reflect a full 12 months ofexporting. Continuing exporter levels are the same in both columns. Column 3 reportsthe ratio of column 2 to column 1.
29
Exporter Dynamics, Firm Size and Growth, and Partial Year Effects
Table 4: Partial Year Adjustment Factor for New Exporters by monthRatio
January 1.00February 1.07March 1.19April 1.26May 1.37June 1.53July 1.76August 2.09September 2.42October 2.73November 4.23December 5.99
Note: This table reports the ratio of adjusted first year exports to calendar first yearexports for all new exporters by month, averaged over 1994-2007.
30
Exporter Dynamics, Firm Size and Growth, and Partial Year Effects
Table 5: Characteristics of Growth Rates in the US Market by Size QuintileSmallest Quintile Largest Quintile
Calendar Adjusted Calendar Adjusted1% -4.05 -4.39 -4.37 -4.735% -1.85 -2.17 -1.98 -2.1110% -1.16 -1.47 -1.21 -1.3125% -0.30 -0.57 -0.42 -0.45
Median 0.51 0.24 -0.00 -0.0275% 1.67 1.21 0.29 0.2890% 3.12 2.63 0.64 0.6095% 4.40 3.87 0.93 0.8599% 8.30 7.59 1.67 1.52
Mean 0.80 0.47 -0.22 -0.25Std. Dev. 2.06 2.00 1.11 1.16Skewness 1.06 1.02 -3.60 -3.86
Note: This table reports statistics from the distribution of exporter growth rates for thelargest and smallest quintile of exporters in the US market. Besides the percentiles (1, 5,10, 25, 50, 75 , 90, 95, 99) the tables reports the mean, standard deviation and skewnessof the growth rate distributions. Calendar refers to firm sizes and growth rates that havenot be adjusted for the initial month of exporting to the US while Adjusted refers to thesame variables after having adjusting for month in initial exporting.
31