Embed Size (px)
Citation preview

The purpose of this study is to ascertain how export assis-tance needs may vary across exporting status of agribusi-nesses, whether the firm is a high-involvement exporter, alow-involvement exporter, or a firm that does not current-ly export but intends to export. This analysis also providesinformation regarding which assistance needs are mostand least important overall. The study also seeks to as-certain how firm size, business experience, sole location,wholesaling/distribution of own products, type of productsold, and location influence export status. © 1998 JohnWiley & Sons, Inc.
World food trade has increased by nearly one-thirdover the past two decades, with the majority ofgrowth being in consumer food products, while bulkproducts trade has stagnated.1 Agricultural exportsfrom the US have followed this trend, shifting toover half the value of exports comprised by high-value products (HVP’s), rather than bulk com-
modities.2 In 1995, bulk products comprised onlyabout 46.3% of the total value of exports.3
As a result, export assistance programs, such asthe Market Access Program (MAP), have focusedon high-value agricultural products. However, anumber of General Accounting Office Reports havebeen critical of coordination and targeting of pub-licly provided export promotion assistance pro-grams (GAO January 1992; GAO December 1992;GAO June 1993).4,5,6 In particular, these reportshave been critical of service provision to small andnew-to-export firms. In response, USDA/FAS hasgiven special program emphasis to small firms. TheMAP regulations now require that small businessesand cooperatives receive priority assistance.7
While firm size and export experience have be-come of focal interest in export programs provision,empirical studies of exporting across other indus-tries have suggested that willingness and ability toexport may be tied to firm size and other firm char-acteristics. Results from past studies have suggestedthat smaller firms, with less experience in distribu-tion, and selling certain types of products may beless willing or able to export than larger firms, with
• Kim Jensen is an Associate Professor in the Department of Agricultural Economics and Rural Sociology, Universityof Tennessee, Knoxville.• Scott Hollis is an Agricultural Statistician at the Kentucky Agricultural Statistics Service.
Export Status and Assistance Needs of US High-Value Agribusiness
•425
•Kim JensenScott Hollis
Agribusiness, Vol. 14, No. 6, 425–434 (1998)© 1998 John Wiley & Sons, Inc. CCC 0742-4477/98/060425-10
Funding for this study was provided in part by the USDA National
Research Initiative Grants Program and by the Tennessee Agricultural
Experiment Station.
more experience in distribution, and selling prod-ucts that are highly marketable overseas. Further-more, results from firm-level studies have shownthat the types of assistance needed by firms dependon their level of export experience and their com-mitment to exporting. Understanding how exportstatus may influence export assistance needs andhow firm characteristics may influence export sta-tus, can facilitate targeting of assistance servicesacross various firms by export status and firmcharacteristics, such as firm size and business expe-rience.
Study Objectives
The purpose of this study is to ascertain how exportassistance needs may vary across exporting statusof agribusinesses, whether the firm is a high in-volvement exporter, a low involvement exporter, ora firm that does not currently export but intends toexport. This analysis also provides information re-garding which assistance needs are most and leastimportant overall. The study also seeks to ascertainhow firm size, business experience, sole location,wholesaling/distribution of own products, type ofproducts sold, and location influence export status.
Past Studies
The barriers and assistance needs experienced byfirms have been found to be related to export in-volvement or degree of internationalization of thefirm. Naidu and Rao8 found that export intendersneed differing services than experienced exporters.For example, marketing consulting services, and ed-ucational programs were more important to exportintenders than to sporadic exporters or regular ex-porters. However, trade shows and computerizedtrade leads were found to be more important to spo-radic and regular exporters. Cavusgil9 found thatworking with foreign distributors was the most seri-ous problem for experimental exporters, while ex-change rate risk was the most serious problem for ac-tive and committed exporters. Dichtl, Koeglmayr,and Mueller10 examined export barriers across ex-porters, occasional exporters, and nonexporters. Ex-porters and occasional exporters held similar views
about pricing and the competitive situation being themost serious export barriers. However, nonexportersviewed market development costs and personnel lim-itations as the most serious export barriers.
Results from past studies have suggested firmcharacteristics can influence export marketing ac-tivity. Firm characteristics examined in previousstudies include years in business, firm size, domes-tic market access, experience in distribution, andtypes of products.
Studies examining export status across years inbusiness have shown mixed results. A study by Moi-ni11 showed that 52.6% of nonexporters had beenin business for more than 20 years, while 60.4% ofexporters had been in business for more than 20years. While 6.0% of the nonexporters had been inbusiness 5 years or less, only 3.7% of the exportershad been in business 5 years or less. Czinkota andUrsic,12 however, found that firms with over 15%in sales from exports during the past 5 years had anaverage of 32.6 years in operation. Those with un-der 15% of the sales in exports had been in opera-tion an average of 44.5 years.
In a study of manufacturing firms, Cavusgil9
found that the degree of internationalization was in-dependent of firm size, as measured by the numberof employees. However, the study results showedthat degree of internationalization was positivelyassociated with firm size as measured by value ofsales. Categories of internationalization includedexperimental exporters (less than 10% of total busi-ness), active exporters, and committed exporters.Cavusgil9 also found that the types of problems as-sociated with exporting differed across stages of in-ternationalization. Results from a study by Cavus-gil and Naor13 suggested that larger firms may havemore adequate productive capacity and ability toreallocate resources to serving foreign markets.Growth in domestic markets and experience in dis-tribution may also provide firms with unique ad-vantages for exporting. A study of Midwestern cor-porations by Ali and Swiercz14 found that adequatecross-cultural skills necessary for exporting werepositively associated with larger firm size. A studyby Barker and Kaynak15 showed that smaller firmswere less interested in exporting than larger firms.Other studies have found deterrents to exportingare lack of adequate production capacity16,17 and
Jensen and Ho l l i s
•426
that achieving potential economies of scale and ex-cess capacity are reasons for exporting.18
Cavusgil and Naor13 suggest that firms solely serv-ing a local market tend not to export. However,firms with a well-expanded domestic market havefewer problems entering international markets.Therefore, firms with multiple locations and experi-ence wholesaling and distributing products might beexpected to have greater ease entering internationalmarkets. Bodur19 also found that exporting prob-lems experienced by firms differed across indus-tries, suggesting that ability to increase involvementin exporting may differ by product type.
Regional location of the firm may also influencethe willingness and ability to export for several rea-sons. Regional differences in market access due todiffering distances and logistical infrastructure mayinfluence exporting. In addition, attitudes towardexporting or “psychic” distance perceived by man-agement20 may vary across regions. However, be-cause most exporting studies in the US have beenconducted at a state or regional level, regionalcross-comparisons are limited to comparing resultsbetween studies. Naidu and Rao9 point out that as-sistance needs vary across stages of international-ization of the firms which may differ across regionand type of industry.
Data and Methodology
Data to conduct this study were obtained through a1996 mail survey of 3,435 high-value agribusiness-es. A listing of agribusinesses was prepared byAmerican Business Lists. The sample was drawnbased upon the types of products sold and locationof firms that participated in the 1993–1994 MarketPromotion Program-Branded Portion. The sampleincluded a variety food and beverage processorsfrom across the United States. The survey con-tained questions regarding a variety of export relat-ed problems and issues, including export status,knowledge and use of export assistance services, ex-port assistance needs, and firm characteristics.Firms were asked questions regarding export statusand firm characteristics based upon their firm’s1995 business records. A survey was mailed to theagribusinesses, followed by a second mailing ap-
proximately 3 weeks later. Of the firms surveyed,422 responded to the survey. From these respon-dents, 264 firms provided usable responses to allquestions regarding export status, firm characteris-tics, and assistance needs.
The respondents were classified into four exportinvolvement groups. High involvement exporterswere defined as having 5 or more years experienceand at least 10% of total sales from exporting in1995. Low involvement exporters were defined asexporting in 1995, but having less than 5 years ex-perience or less than 10% of total sales from ex-ports in 1995. Export intenders were firms that didnot export in 1995, but plan to in the future. Non-exporters/nonintenders were firms that did not ex-port in 1995 and do not plan to in the future.
Assistance Needs Across Export Status
Firms which were either high involvement ex-porters, low involvement exporters, or those thatdid not currently export, but planned to export inthe future, were asked to rate strength of need forseveral potential types of assistance (See Table 1).Firms that did not export and were not interested in exporting are excluded from this portion of theanalysis.
Respondents were presented with several types ofassistance services and asked to rate each with a 3-point Likert scale (1 5 strong need, 2 5 moderateneed, and 3 5 no need). The assistance services list-ed in the survey were selected based upon the exportassistance literature discussed earlier in this paper,consultation with officials from Foreign AgricultureService, and through results from an industry focusgroup. The frequency of responses across exportstatus are analyzed. Chi-square tests of associationare used to test whether needs for each type of assis-tance are significantly associated with export status.The x2 test statistic is calculated as
where nij 5 cell frequency, ith row, jth column, mij5 row totals *column totals/n.The degrees of free-dom are (R 2 1)/(C 2 1).
Q = −∑∑ ( ) /n m mij ij ijji
2
High -Va lue Agr ibus iness
•427
Jensen and Ho l l i s
•428
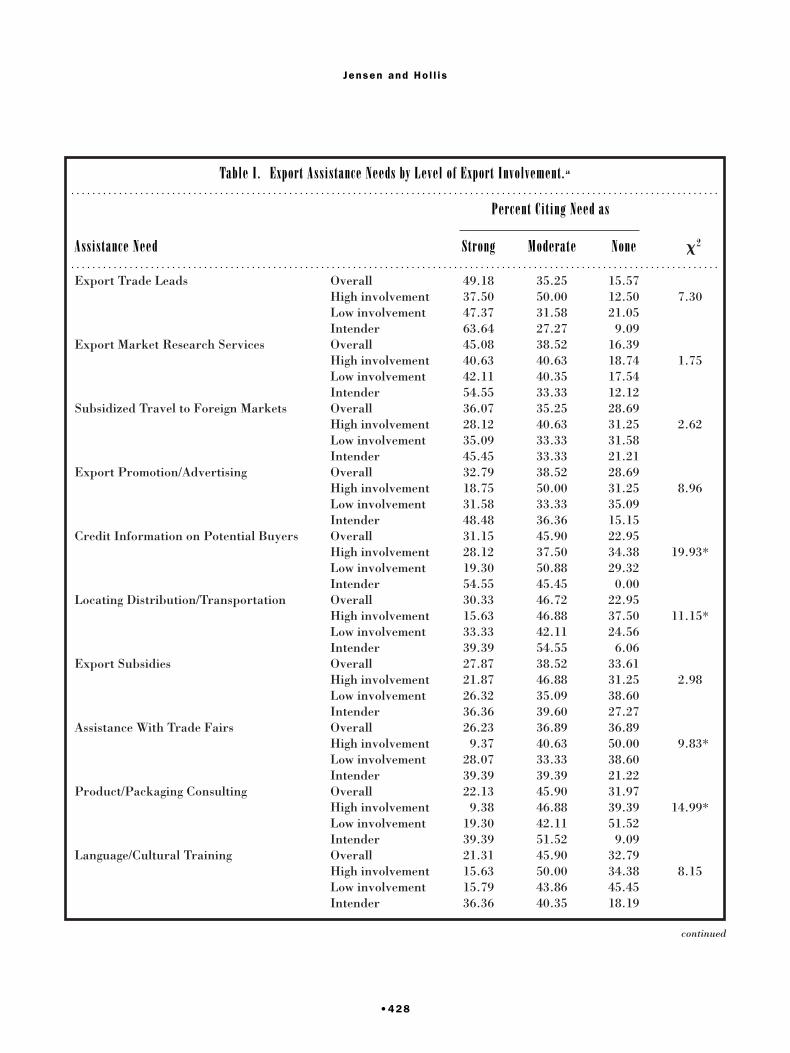
Table I. Export Assistance Needs by Level of Export Involvement.a
Percent Citing Need as
Assistance Need Strong Moderate None x2
Export Trade Leads Overall 49.18 35.25 15.57High involvement 37.50 50.00 12.50 7.30Low involvement 47.37 31.58 21.05Intender 63.64 27.27 9.09
Export Market Research Services Overall 45.08 38.52 16.39High involvement 40.63 40.63 18.74 1.75Low involvement 42.11 40.35 17.54Intender 54.55 33.33 12.12
Subsidized Travel to Foreign Markets Overall 36.07 35.25 28.69High involvement 28.12 40.63 31.25 2.62Low involvement 35.09 33.33 31.58Intender 45.45 33.33 21.21
Export Promotion/Advertising Overall 32.79 38.52 28.69High involvement 18.75 50.00 31.25 8.96Low involvement 31.58 33.33 35.09Intender 48.48 36.36 15.15
Credit Information on Potential Buyers Overall 31.15 45.90 22.95High involvement 28.12 37.50 34.38 19.93*Low involvement 19.30 50.88 29.32Intender 54.55 45.45 0.00
Locating Distribution/Transportation Overall 30.33 46.72 22.95High involvement 15.63 46.88 37.50 11.15*Low involvement 33.33 42.11 24.56Intender 39.39 54.55 6.06
Export Subsidies Overall 27.87 38.52 33.61High involvement 21.87 46.88 31.25 2.98Low involvement 26.32 35.09 38.60Intender 36.36 39.60 27.27
Assistance With Trade Fairs Overall 26.23 36.89 36.89High involvement 9.37 40.63 50.00 9.83*Low involvement 28.07 33.33 38.60Intender 39.39 39.39 21.22
Product/Packaging Consulting Overall 22.13 45.90 31.97High involvement 9.38 46.88 39.39 14.99*Low involvement 19.30 42.11 51.52Intender 39.39 51.52 9.09
Language/Cultural Training Overall 21.31 45.90 32.79High involvement 15.63 50.00 34.38 8.15Low involvement 15.79 43.86 45.45Intender 36.36 40.35 18.19
continued

It was hypothesized that the need for most types ofassistance would be negatively associated with in-creased export involvement. In particular, educa-tional types of assistance and basic technical assis-tance are likely to be most needed by exportintenders or by firms with low export involvement.Educational assistance would include “how to ex-port” and language/cultural training. Basic techni-cal assistance would include locating distributionand lending, product/packaging consulting, and as-sistance with export documentation.
Model of Export Status
To measure the influence of firm characteristics onexport status, an ordered logit model is estimated.The export status of the jth firm includes high in-volvement exporters (I 5 1), low involvement ex-porters (I 5 2), export intenders (I 5 3), and non-exporter/nonintenders (I 5 4). The jth firm is
hypothesized to have an unobservable set of prefer-ences regarding exporting as defined by Zj. Theseunobservable preferences are hypothesized to be afunction of firm characteristics, Xj, such that
Zj 5 g(Pr(Export Status # i|Xj)) 5 ai 1 b9Xj
where j 5 1, . . . , N, N 5 number of firms, k 5 3,1 # i # k.
Cutoff points in preferences exist where the ob-served export status outcome changes. The proba-bility of observing the ith export status is
f(a1 1 b9Xj), i 5 1
Pr(Export Statusj 5 iuXj) 5 f(a2 1 b9Xj) 2f(a1 1 b9Xj), i 5 2
f(a3 1 b9Xj) 2f(a2 1 b9Xj), i 5 31 2 f(a3 1b9Xj), i 5 4
High -Va lue Agr ibus iness
•429
Table I. (Continued)
Percent Citing Need as
Assistance Need Strong Moderate None x2
Assistance With Export Documentation Overall 18.85 46.72 34.43High involvement 9.38 34.38 56.25 20.33*Low involvement 15.79 45.61 39.60Intender 33.33 60.61 6.06
Locating Lenders for Export Overall 18.85 24.49 56.56High involvement 9.38 21.87 68.75 13.84*Low involvement 12.28 26.32 61.40Intender 39.39 24.24 36.36
Courses, Seminars, Publications on Overall 18.03 35.25 46.72“How to Export” High involvement 9.38 21.87 68.75 21.66*
Low involvement 10.53 40.35 49.12Intender 39.39 49.12 21.21
aHigh involvement is defined as having 5 or more years experience and at least 10% of total sales from exporting in 1995. Low involvement is
defined as exporting in 1995, but having less than 5 years experience or less than 10% of total sales from exports in 1995. Export intenders
are firms that did not export in 1995, but plan to in the future.
* Significance at a 5 .05.
where
the cumulative logistic distribution.The characteristics of the jth firm, Xj, hypothe-
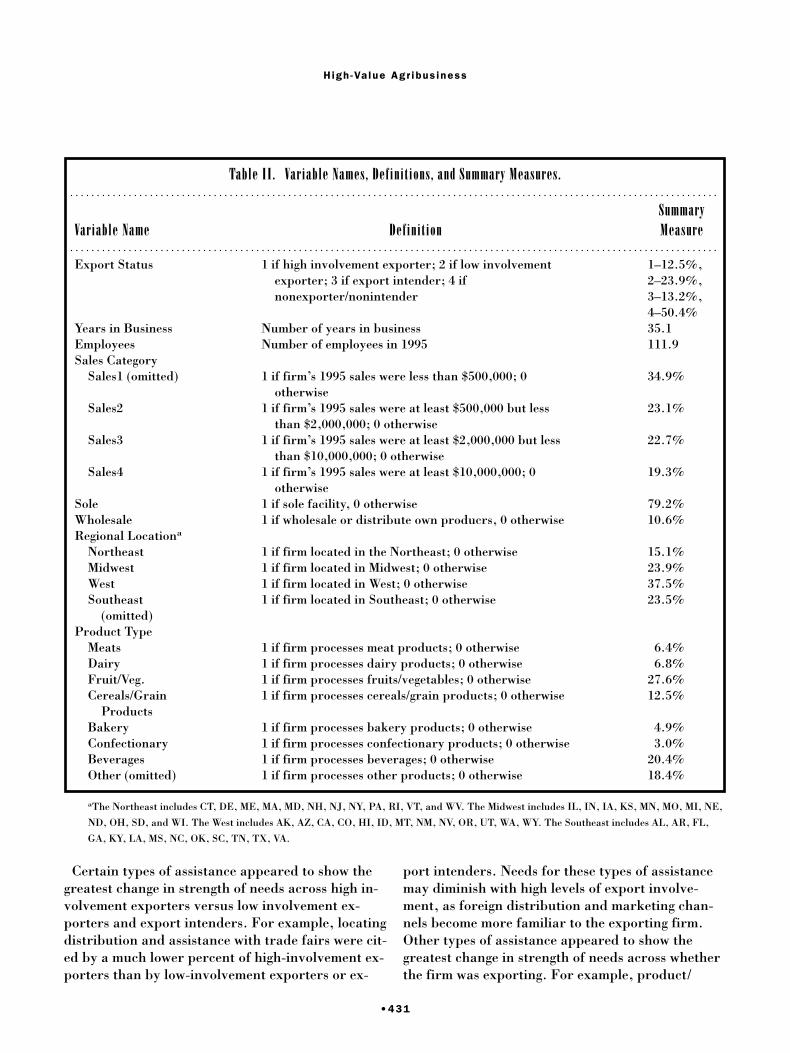
sized to influence export status are firm size, asmeasured by the number of employees and value ofsales, years of business experience, whether thefirm is a sole location, whether it has wholesaling/distribution functions, regional location of the firm,and type of products it processes and sells. A listingof variable names, definitions, and summary mea-sures are shown in Table II.
Results from past studies have suggested that larg-er firms are more likely to be actively involved inexporting.9,10,12 Therefore, it is hypothesized thatlarger firm size will positively influence the proba-bility of exporter status and decrease the probabili-ty that a firm is not exporting and not interested inexporting. While mixed results regarding businessexperience and exporting have been found in paststudies, it is hypothesized that increases in years inbusiness will positively influence exporting. If firmshave multiple locations or are involved in wholesal-ing and distribution, this could indicate willingnessand ability to export.13 Therefore, sole location ishypothesized to have a negative influence on ex-porting, while involvement in wholesaling/distribu-tion is hypothesized to positively influence export-ing. Location of a firm in the Northeast or Midwestis hypothesized to negatively influence exportingcompared with firms in the Southeast, due to thoseregion’s lower export shares. The 1995 MISER21 es-timates of exports of food and kindred products in-dicated that the West comprised just over 29.5% ofexports, the Southeast comprised about 38.7%, theNortheast about 7.2%, and the Midwest about24.5%. No sign is hypothesized a priori for theWest firms. Certain types of products are likelymore difficult to export than others, due to the na-ture of the product, lack of acceptance, or lack ofcompetitiveness in foreign markets. For example,firms producing dairy products are hypothesized tobe less likely to export than general food productsprocessors, because of low world prices for dairyproducts. The USDA/ERS22 estimates that dairy
products held a 3.4% share of processed food prod-uct exports in 1994. Other products with low sharesinclude bakery products, sugars/confectionaryproducts, and beverages. The omitted or basegroup “other” held a 29.1% share of processedfood exports from the US in 1994.
Results
Assistance Needs Across Export Status
The results from the frequency of responses regard-ing strength of export assistance needs across ex-port status are shown in Table I. Based upon de-scriptive analysis of the results, export trade leads,export market research services, subsidized travelto foreign markets, and export promotion advertis-ing appear to receive the highest percent “strong”need ratings of all the potential types of assistance.None of these types of assistance were found to besignificantly associated with export status. Thiswould suggest that these types of assistance areneeded by firms regardless of export status andmay be helpful in initiating exporting, as well ascontinuing exports. Need ratings for credit in-formation on potential buyers, assistance locat-ing distribution, assistance with trade fairs, prod-uct/packaging consulting, assistance with exportdocumentation, locating lenders for export, and“how to” assistance were all significantly associatedwith export status. For each of these types of assis-tance, a higher percent of assistance export inten-ders rated the assistance as “strong” than did low-involvement or high-involvement exporters. Theseresults indicate that these types of assistance maybe most useful for firms in the planning and start-up phases of exporting, rather than for those al-ready exporting. For the assistance type “credit in-formation on potential buyers” a lower percent oflow-involvement exporters cited the need as strongthan did high involvement exporters or export in-tenders. This result is somewhat surprising. Howev-er, one possible explanation is that firms that havehigh export involvement may have expanded toserve new foreign buyers, for which they are lessknowledgeable of their financial position.
φβ
β=+
′
′e
e
X
X
j
j1,
Jensen and Ho l l i s
•430
Certain types of assistance appeared to show thegreatest change in strength of needs across high in-volvement exporters versus low involvement ex-porters and export intenders. For example, locatingdistribution and assistance with trade fairs were cit-ed by a much lower percent of high-involvement ex-porters than by low-involvement exporters or ex-
port intenders. Needs for these types of assistancemay diminish with high levels of export involve-ment, as foreign distribution and marketing chan-nels become more familiar to the exporting firm.Other types of assistance appeared to show thegreatest change in strength of needs across whetherthe firm was exporting. For example, product/
High -Va lue Agr ibus iness
•431
Table II. Variable Names, Definitions, and Summary Measures.
SummaryVariable Name Definition Measure
Export Status 1 if high involvement exporter; 2 if low involvement 1–12.5%,exporter; 3 if export intender; 4 if 2–23.9%,nonexporter/nonintender 3–13.2%,
4–50.4%Years in Business Number of years in business 35.1Employees Number of employees in 1995 111.9Sales Category
Sales1 (omitted) 1 if firm’s 1995 sales were less than $500,000; 0 34.9%otherwise
Sales2 1 if firm’s 1995 sales were at least $500,000 but less 23.1%than $2,000,000; 0 otherwise
Sales3 1 if firm’s 1995 sales were at least $2,000,000 but less 22.7%than $10,000,000; 0 otherwise
Sales4 1 if firm’s 1995 sales were at least $10,000,000; 0 19.3%otherwise
Sole 1 if sole facility, 0 otherwise 79.2%Wholesale 1 if wholesale or distribute own producrs, 0 otherwise 10.6%Regional Locationa
Northeast 1 if firm located in the Northeast; 0 otherwise 15.1%Midwest 1 if firm located in Midwest; 0 otherwise 23.9%West 1 if firm located in West; 0 otherwise 37.5%Southeast 1 if firm located in Southeast; 0 otherwise 23.5%
(omitted)Product Type
Meats 1 if firm processes meat products; 0 otherwise 6.4%Dairy 1 if firm processes dairy products; 0 otherwise 6.8%Fruit/Veg. 1 if firm processes fruits/vegetables; 0 otherwise 27.6%Cereals/Grain 1 if firm processes cereals/grain products; 0 otherwise 12.5%
ProductsBakery 1 if firm processes bakery products; 0 otherwise 4.9%Confectionary 1 if firm processes confectionary products; 0 otherwise 3.0%Beverages 1 if firm processes beverages; 0 otherwise 20.4%Other (omitted) 1 if firm processes other products; 0 otherwise 18.4%
aThe Northeast includes CT, DE, ME, MA, MD, NH, NJ, NY, PA, RI, VT, and WV. The Midwest includes IL, IN, IA, KS, MN, MO, MI, NE,
ND, OH, SD, and WI. The West includes AK, AZ, CA, CO, HI, ID, MT, NM, NV, OR, UT, WA, WY. The Southeast includes AL, AR, FL,
GA, KY, LA, MS, NC, OK, SC, TN, TX, VA.
packaging consulting, language/cultural training,assistance with export documentation, locatinglenders for export, and “how to” assistance wererated as strong needs by much higher percents ofexport intenders than by those that were either high or low involvement exporters. These results in-dicate that these types of assistance are most usefulfor planning and initiating exports. The assistancetypes, trade fairs, product/packaging consulting,assistance with export documentation, locatinglenders for export, and “how to” export assistanceeach received less than 10% “strong” need ratingsby high involvement exporters. Clearly, experiencein export markets diminishes the perceived need forthese types of assistance.
Model of Export Status
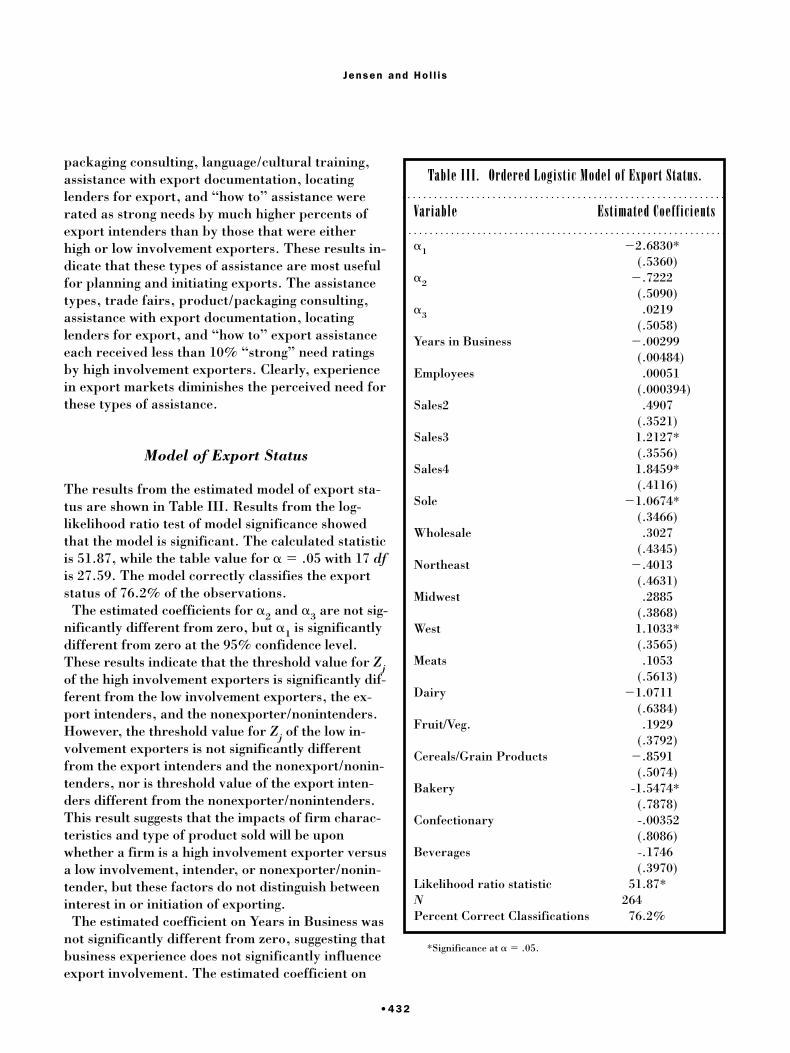
The results from the estimated model of export sta-tus are shown in Table III. Results from the log-likelihood ratio test of model significance showedthat the model is significant. The calculated statisticis 51.87, while the table value for a 5 .05 with 17 dfis 27.59. The model correctly classifies the exportstatus of 76.2% of the observations.
The estimated coefficients for a2 and a3 are not sig-nificantly different from zero, but a1 is significantlydifferent from zero at the 95% confidence level.These results indicate that the threshold value for Zjof the high involvement exporters is significantly dif-ferent from the low involvement exporters, the ex-port intenders, and the nonexporter/nonintenders.However, the threshold value for Zj of the low in-volvement exporters is not significantly differentfrom the export intenders and the nonexport/nonin-tenders, nor is threshold value of the export inten-ders different from the nonexporter/nonintenders.This result suggests that the impacts of firm charac-teristics and type of product sold will be uponwhether a firm is a high involvement exporter versusa low involvement, intender, or nonexporter/nonin-tender, but these factors do not distinguish betweeninterest in or initiation of exporting.
The estimated coefficient on Years in Business wasnot significantly different from zero, suggesting thatbusiness experience does not significantly influenceexport involvement. The estimated coefficient on
Jensen and Ho l l i s
•432
Table III. Ordered Logistic Model of Export Status.
Variable Estimated Coefficients
a1 22.6830*(.5360)
a2 2.7222(.5090)
a3 .0219(.5058)
Years in Business 2.00299(.00484)
Employees .00051(.000394)
Sales2 .4907(.3521)
Sales3 1.2127*(.3556)
Sales4 1.8459*(.4116)
Sole 21.0674*(.3466)
Wholesale .3027(.4345)
Northeast 2.4013(.4631)
Midwest .2885(.3868)
West 1.1033*(.3565)
Meats .1053(.5613)
Dairy 21.0711(.6384)
Fruit/Veg. .1929(.3792)
Cereals/Grain Products 2.8591(.5074)
Bakery -1.5474*(.7878)
Confectionary -.00352(.8086)
Beverages -.1746(.3970)
Likelihood ratio statistic 51.87*N 264Percent Correct Classifications 76.2%
*Significance at a 5 .05.

Employees was not significantly different from zeroand neither was the coefficient on Sales2. How-ever, the coefficients on Sales3, sales of at least$2,000,000 but less than $10,000,000, and Sales4,sales of at least $10,000,000, were significantly dif-ferent from zero and had positive signs. Therefore,compared with the lowest sales category, being incategories Sales3 and Sales4 increased the probabili-ty of high export involvement and decreased theprobability of low export involvement or not export-ing. This result indicates that larger firms, as mea-sured by value sales, are more likely to be high in-volvement exporters than are small firms. Theestimated coefficient on the sole location dummyvariable, Sole, was significant and carried a negativesign. Hence firms with a sole location were less likelyto have high involvement export status. The estimat-ed coefficient on the wholesaling/distribution dum-my, Wholesale, was not significantly different fromzero. Therefore, firms that wholesaled or distrib-uted products did not appear to be more likely to behigh involvement exporters than firms that did notwholesale/distribute. The only regional locationdummy that had a significant influence was West.The estimated coefficient on West was positive.Therefore, compared with firms in the Southeast,firms located in the West were more likely to be highinvolvement exporters and less likely to be low in-volvement exporters or nonexporters. The coeffi-cient on the product dummy variable for Bakeryproducts was significantly different from zero andnegative. Firms selling bakery products as their pri-mary product were less likely to be high involvementexporters than firms selling other types of products.
Conclusions
The results from this study suggest that export as-sistance needs of firms are associated with export
involvement. Certain types of assistance were con-sidered to be the most needed by firms of all exportstatus. These were trade leads, export market re-search services, subsidized travel to foreign mar-kets, and export promotion/advertising assistance.However, many types of assistance were cited asstronger needs by low involvement exporters andexport intenders. These generally tended to be edu-cational types of assistance, such as “how to” or basic technical assistance, including locating distri-bution/transportation, locating lending, or prod-uct/packaging consulting.
The results from this study also suggest that ex-port involvement is influenced by firm size, sole lo-cation, firm location, and selling certain types ofproducts. However, the model of export status didnot show any differences in thresholds for low in-volvement exporters, export intenders, and nonex-porter/nonintenders. Therefore, the impacts ofsales, sole location, regional firm location, andproduct type were upon whether the firm was likelyto be a high involvement exporter. Larger firm sizeand multiple locations have positive influences onhigh involvement export status and negative influ-ences on low involvement, export intender, or non-exporter/nonintender status.
One possible implication of the results from thisstudy is that certain types of assistance that areparticularly useful to initiating or low involvementexporters may need some specially focused pro-gramming to assist small firms. These would includemany of the basic technical and educational ser-vices. However, other services that dealt with ac-cessing market information and marketing, includ-ing trade leads, export market research, subsidizedtravel to foreign markets, and export promotion/advertising assistance, appeared to be needed by abroader base of firms across export stages and firmsizes.
High -Va lue Agr ibus iness
•433
References
1. M. Drabenstott and A. Barkema, “New Directions for U.S.Agricultural Exports.” http://ianrwww.unl.edu/farmbill/exports.htm, June 11, 1997.
2. J. Greene, “High-Value Food Products Boost AgriculturalExports,” Food Review, 17, 18 (1994).
3. USDA/FAS Online/GICO, U.S. Export/Import Statisticsfor Bulk, Intermediate, and Consumer Oriented (BICO)Foods and Beverages, http://www.fas.usda.gov/scriptsw/bico/, December 9, 1997.
4. United States General Accounting Office, “Export Promo-
tion: Federal Programs Lack Organizational and FundingCohesiveness,” GAO Report, GAO/NSLAD-92-49, January1992.
5. United States General Accounting Office, “Export Fi-nance: The Role of the U.S. Export–Import Bank,” GAOReport, GAO/GGD-93-39, December 1992.
6. United States General Accounting Office, “InternationalTrade Effectiveness of Market Promotion Program Re-mains Unclear,” GAO Report, GAO/NSLAD-93-103, June1993.
7. USDA/FAS Online, Market Access Program,http://www.fas.usda.gov/info/factsheets/mapfact.html,December 5, 1997.
8. G. Naidu and T. Rao, “Public Sector Promotion of Ex-ports: A Needs-Based Approach,” Journal of Business Re-search, 27, 85 (1993).
9. T. Cavusgil, “Differences Among Exporting Firms Basedon Their Degree of Internationalization,” Journal of Busi-ness Research, 12, 195 (1984).
10. E. Dichtl, H. Koeglmayr, and S. Mueller, “International,Orientation as a Precondition for Export Success,” Jour-nal of International Business Studies, 28, 23 (1990).
11. A. Moini, “Barriers Inhibiting Export-Performance ofSmall and Medium-Sized Manufacturing Firms,” Journalof Global Marketing, 10, 67 (1997).
12. M. Czinkota and M. Ursic, “Classification of ExportingFirms According to Sales and Growth Into a Share Ma-trix,” Journal of Business Research, 22, 243 (1991).
13. T. Cavusgil and J. Naor, “Firm and Management Charac-
teristics as Discriminators of Export Marketing Activity,”Journal of Business Research, 15, 221 (1987).
14. A. Ali and P. Swierz, “Firm Size and Export Behavior:Lessons from the Midwest,” Journal of Small BusinessManagement, 29, 71 (1991).
15. T. Barker and E. Kaynak, “An Empirical Investigation ofthe Differences Between Initiating and Continuing Ex-porters,” European Journal of Marketing, 26, 27 (1992).
16. D. O’Rourke, “Differences in Exporting, Practices, andProblems by Size of Firm,” American Journal of SmallBusiness, 3, 25 (1985).
17. T. Sharkey, J. Lim, and K. Kim, “Export Developmentand Perceived Export Barriers: An Empirical Analysis ofSmall Firms,” Management International Review, 29, 33(1989).
18. A. Egshi, “Attitude-Behavior Inconsistency in Exporting,”International Marketing Review, 9, 40 (1992).
19. M. Bodur, “A Study on the Nature and Intensity of Prob-lems Experienced by Turkish Exporting Firms,” Advancesin International Marketing, 1, 205 (1986).
20. A. Shoham and G. Albaum, “Reducing the Impact of Bar-riers to Exporting: A Managerial Perspective,” Journal ofInternational Marketing, 4, 85 (1995).
21. Massachusetts Institute for Social and Economic Research(MISER), Exports Food and Kindred Products by State,report obtained from MISER, December 7, 1997.
22. USDA/ERS, Processed Food Export and Import Values,http://usda.mannlib.cor . . ./trade/95011/, December 5,1997.
Jensen and Ho l l i s
•434