Embed Size (px)
Citation preview
Export Processing Zone Expansion in an African Country: What are the Labor Market
and Gender Impacts?
Peter Glick and François Roubaud
Export Processing Zone Expansion in an African Country: What are the Labor Market and Gender Impacts?
By
Peter Glick (Cornell University)
and
François Roubaud (DIAL/Cipré)
Paper prepared for the conference “African Development and Poverty Reduction: The Macro-Micro Linkage”
Cape Town, South Africa October 2004Linkage”
Abstract
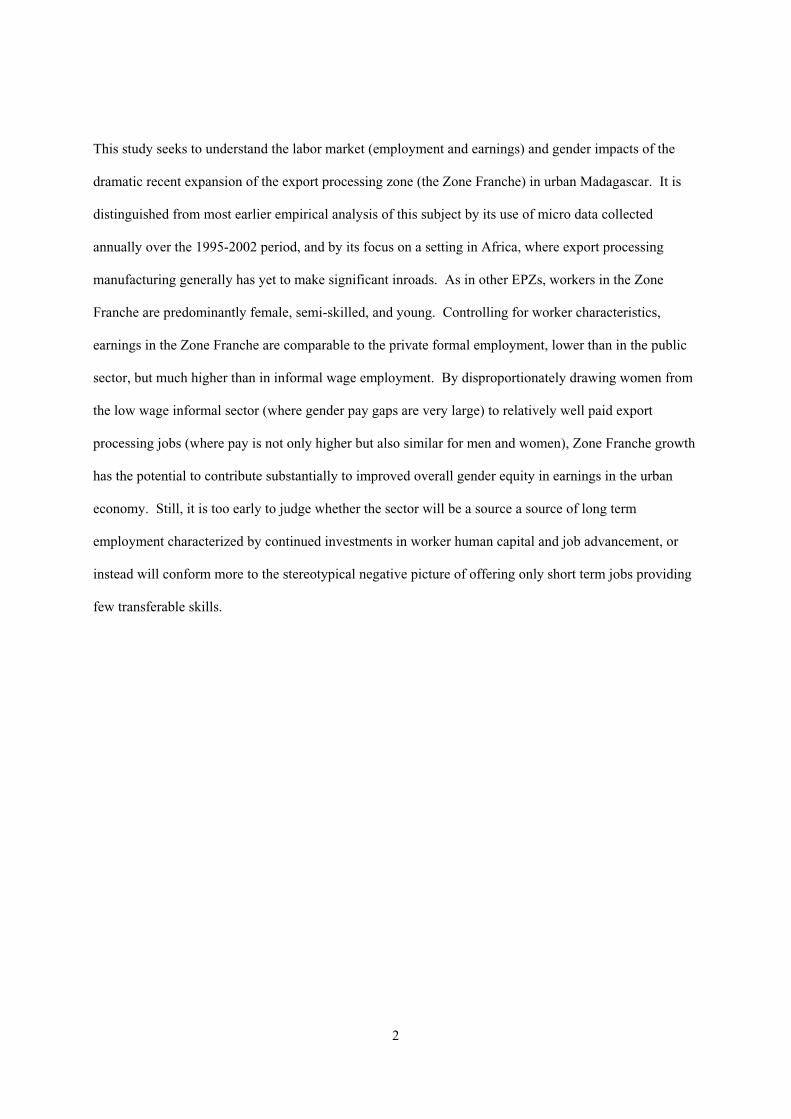
This study seeks to understand the labor market (employment and earnings) and gender impacts of the
dramatic recent expansion of the export processing zone (the Zone Franche) in urban Madagascar. It is
distinguished from most earlier empirical analysis of this subject by its use of micro data collected
annually over the 1995-2002 period, and by its focus on a setting in Africa, where export processing
manufacturing generally has yet to make significant inroads. As in other EPZs, workers in the Zone
Franche are predominantly female, semi-skilled, and young. Controlling for worker characteristics,
earnings in the Zone Franche are comparable to the private formal employment, lower than in the public
sector, but much higher than in informal wage employment. By disproportionately drawing women from
the low wage informal sector (where gender pay gaps are very large) to relatively well paid export
processing jobs (where pay is not only higher but also similar for men and women), Zone Franche growth
has the potential to contribute substantially to improved overall gender equity in earnings in the urban
economy. Still, it is too early to judge whether the sector will be a source a source of long term
employment characterized by continued investments in worker human capital and job advancement, or
instead will conform more to the stereotypical negative picture of offering only short term jobs providing
few transferable skills.
2
I. Introduction
Promotion of export processing zones—in which (usually foreign) companies enjoy tax holidays,
and exemptions from import duties and taxes and other benefits—is one way in which many developing
country governments have sought to reap benefits from the global economy. However, EPZs remain
controversial. Experiences throughout the developing world suggest that there are potentially large
employment and foreign exchange benefits to EPZs, and in many cases wages there appear to be higher
than in the alternatives available to the workers in them (who are usually women). However, the record
in areas such as technology transfer, skills upgrading, backward linkages, and overall contribution to
growth is at best mixed. Equally unresolved is an important subset of the controversy, which is whether
growth of the sector is ultimately beneficial to women in particular and hence to the objective of gender
equity.
In Africa, the question of whether EPZs can contribute to the alleviation of poverty, and its effect
on women, is an even more open question. To date almost no African countries have successfully
promoted this sector, despite the fact that the continent has an essential ingredient of early EPZ
promotion: cheap labor. One exception to this is Madagascar, where the government began actively
promoting its EPZ (called the Zone Franche) in the early 90s. Output in export processing zone
enterprises increased by about 20% annually from 1997-2001 as foreign investors took advantage of the
country’s very low labor costs as well as the incentives provided by trade initiatives giving exports from
the poorest countries preferential access to developed country markets (in particular, the U.S.’s Africa
Growth and Opportunity Act). The growth of the EPZ has significantly shifted the structure of exports
away from traditional commodities such as vanilla and coffee. By 2001, Zone Franche firms accounted
for about half of all secondary sector employment in the country. (IMF 2003).
3
This study seeks to understand the labor market (employment and earnings) and gender impacts
of this dramatic expansion of the EPZ in Madagascar.1 It is distinguished from most earlier empirical
analysis of this subject by three main factors. First, it makes use of detailed micro data, whereas most
previous analyses have been limited to studying only industry or sector mean pay differentials. Second,
and even more rare, these data were collected in Antananarivo, the capital city, in annual surveys over the
entire 1995-2002 period of rapid export processing manufacturing growth (and subsequent decline due to
political crisis), allowing the analysis of changes in earnings and employment in a very dynamic
environment. Third, these data are from an African country, where as noted EPZs have yet to figure in
any significant way. Comparisons of the characteristics of EPZs in an African context with those in other
regions may provide clues as to the potential for African countries and in particular, the poor and women
in them, to reap benefits from future EPZ investments.
The paper first considers trends in the sectoral allocation employment in the urban labor market
of Antananarivo and in the characteristics of workers in Zone Franche and other sectors. Multinomial
logit models of sector of employment are used to assess the determinants of entry into the EPZ and other
labor market sectors and changes in these factors over time. A primary objective is to see how
Madagascar compares to EPZ experiences in other developing countries with regard to the nature of the
workforce and the characteristics of employment, and with regard to changes in these factors as the sector
develops. Next we consider earnings. We use results from earnings functions to (1) compare hourly
compensation in Zone Franche and other sectors controlling for worker characteristics, and measure
trends in sectoral pay differences over time; (2) compare returns to education and experience across
sectors and genders; (3) compare male and female earnings in the Zone Franche and in other sectors, and
examine changes in gender wage gaps over time. Finally, the debate over export processing employment
involves more than just the issue of wages, but also working conditions and prospects for long-term
1 In an complementary paper, Cling, Razafindrakoto, and Roubaud (2004) also analyze the development and charactersitics of the Zone Franche, and provide considerably more background and a discussion of macroeconomicimplications.
4
employment. Therefore we take advantage of the rich detail of our labor force surveys to also consider
how Zone Franche employment compares with other sectors with respect to employment conditions and
access to a range of non-wage benefits, as well as rates of job promotion and employer provided training.
The paper concludes by drawing together the findings and discussing what they imply for the role of
export processing zone expansion in reducing poverty and improving gender equity in the labor market
Madagascar.
2. Data
We use the urban labor force surveys implemented by the Malagasy national statistical office
(Institut National de la Statistics/INSTAT) with the support of the MADIO Project (Madagascar-DIAL-
INSTAT-ORSTOM). These surveys make up the part of the more general 1-2-3 surveys2 program
implemented in Madagascar since 1995 (Rakotomana, Ramilison and Roubaud 2000) and in various
African, Asian and Latin American countries (Razafindrakoto and Roubaud 2003). The surveys have the
advantage, in addition to collecting very detailed information on labor force activity, of being fully
consistent over time in terms of the structure of the questionnaires. The surveys initially focused on the
capital city, Anatanarivo (‘Tana’) and collected yearly data from 1995-2002; in 2000 and 2001 the survey
was extended to cover all of the country’s largest seven cities. The last survey, for Tana only, was
collected in December 2002 and January 2003, about six months after the political crisis finally came to
an end. We use the data for Tana only since the surveys from the other urban areas do not allow us to
consider trends. Given our emphasis on export processing zones, this is not really a disadvantage, since
with the exception of one other urban area (Antsirabe) these have been instituted only in the capital.
2 The 1-2-3 survey is a three-phase process. The first phase of the method is a labour force survey on employment,unemployment and the conditions of activity of households. Phase 2 is a survey on household enterprise activities inthe informal sector and phase 3 measures household consumption and poverty. In subsequent extensions to thisanalysis we plan to utilize limited information from the other surveys, for example to derive suitable instruments toidentify labor force sector selection.
5
2.1 Trends in the sectoral allocation of urban employment
Tables 1 and 2, using data from the 1-2-3 labor force surveys from 1995-2002, illustrate the
dynamic growth of export processing manufacturing in the Tana economy over the period. As a
consequence, female employment patterns have been transformed to a fairly remarkable degree over a
relatively short period of time. Women have shifted out of private informal wage employment, which
declined from 24 to 14% of the female workforce, and into formal employment in Zone Franche
enterprises, which rose from 5 % to 15% of all female employment. Strikingly, there has been no shift to
speak of into other private formal employment, defined from the survey questionnaire as employment in
an enterprise that is officially registered with the government and issues pay receipts to its employees.
The shares for this sector have remained generally constant for both women and men. The self-
employment share for women was also largely unchanged over the period through 2001.3
For men the same kind of reallocation has taken place but in less dramatic fashion. Zone Franche
employment rose from 1% to 6% of the male workforce in the capital, while the share of informal wage
employment fell from 14 to 11%. At the same time, for men there was a sharp reduction in civil service
employment, from 15 to 10 percent of the workforce.
Madagascar’s political and economic crisis lasted throughout the entire first half of 2002.
Comparisons of the 2001 and (end of) 2002 data clearly show the imprint of the crisis. The strongest
negative employment impacts, not surprisingly, were in the export processing zone. As transportation
networks were severely disrupted around Tana and Antsirabe, most export processing firms were unable
to meet orders and simply shut down operations, temporarily laying off their workforces (IMF 2003). In
the Madio survey this is reflected in the sharp reduction in female employment in Zone Franche
enterprises: the share of employed women working in such enterprises fell from 15% to 6%. Since at the
3 It should be kept in mind that, given the increase in the size of Tana’s economically active population over time, a constant share for private formal non-EPZ jobs and self-employment means that the absolute number of such jobs
6
same time the proportion of all women who were actually employed fell from 64% to 60% (see Glick,
Randrianasolo, and Roubaud forthcoming) the actual reduction in employment in this sector was even
more severe.
The share of other formal private employment also fell slightly from 2001 to 2002. At the same
time the share of self-employment or family workers among employed women rose sharply, from 45% to
55%. We can infer that many women who were laid off from their jobs with foreign owned firms turned
to independent activities or work in family enterprises to help make ends meet. There were analogous
reallocations for the male workforce, though less pronounced: a sharp cut in Zone Franche employment
and an increase in self-employment.4
These labor force data are consistent with other data in showing the Zone Franche to be the most
dynamic sector of the Malagasy economy. However, it is important to keep its current level of
significance in perspective. The sector remains largely insignificant in urban areas outside of Tana, and is
still just a tiny portion (about 1%) of employment in the economy of Madagascar as a whole, which
remains overwhelmingly rural and agricultural. Clearly any impacts on poverty (and gender gaps in
earnings) to date have been small; hence what our analysis really is considering are the potential impacts
if Zone Franche growth continues.
3. The sorting of workers among sectors of the urban labor market
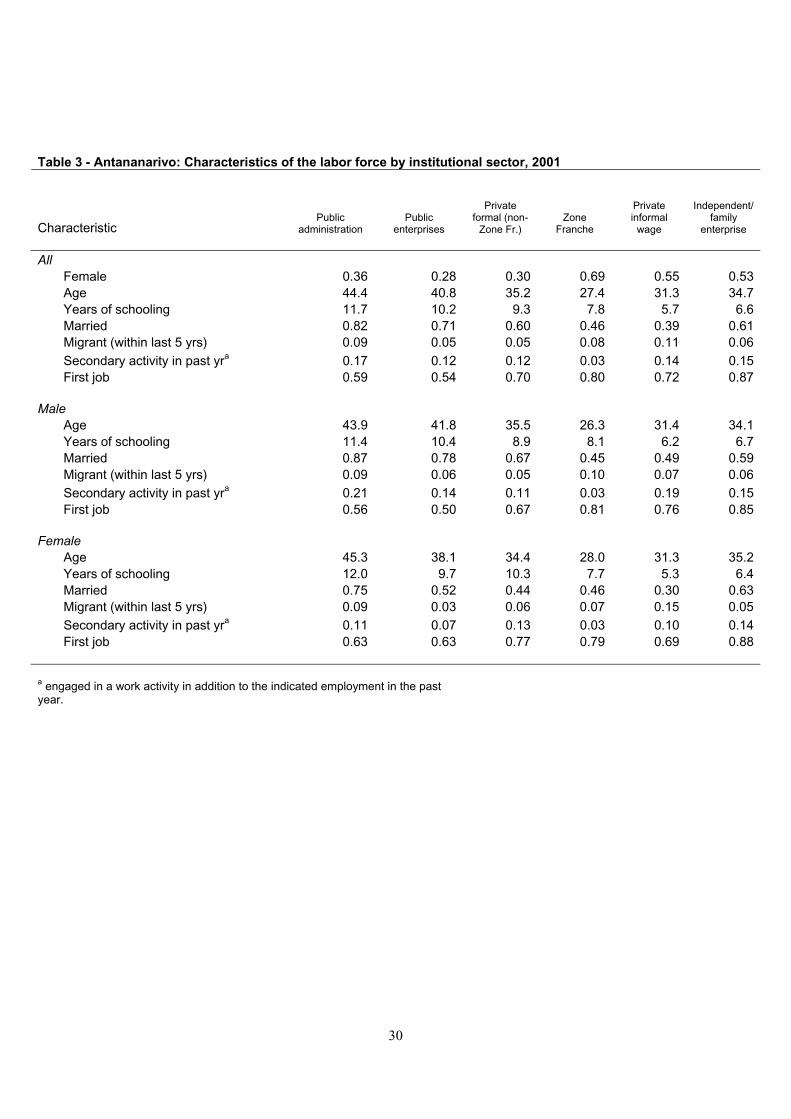
Table 3 shows the characteristics of the Tana workforce in 2001 by sector. Formal sector
employment is generally strongly dominated by men: the share of women in public administration, public
enterprises, and private formal wage employment is generally less than a third. However, the opposite is
the case for jobs in the export processing zone: 68% of Zone Franche workers in 2001 were women. This
has grown somewhat (only the number of individuals in public administration appears to have declined in absoluteterms). The point is that this growth of other sectors has been very slow relative to Zone Franche expansion.4 The 2002 survey was post-crisis but still not far removed from it. Government data indicate a substantial if notcomplete recovery some nine months later: by October 2003, the government was reporting that employment in EPZ firms was about 80,000, compared with the pre-crisis peak of about 110,000.
7
repeats a well known pattern in export processing manufacturing throughout the developing world. In
light of the under-representation of women in other kinds of formal employment, it suggests that export
processing provides women with opportunities for formal employment not available to them in other
sectors.5
Zone Franche workers average 8 years of schooling, significantly less than other formal sector
workers but more than private informal wage workers (6 years) and the self-employed (6.6 years).
Differences by gender within each sector are not large. Zone Franche workers are younger on average
(26 and 28 years old for male and female employees) than workers in all other sectors. This is similar to
experiences with EPZs elsewhere (see Kusago and Tzannatos 1998). Consistent with this, most (80%)
Zone Franche employees are in their first job, more than in any of the other wage sectors.
Marital status is another factor that is often found to distinguish women in export processing zone
employment from those in other sectors. In Madagascar’s case, women in the Zone Franche are about as
likely to be married as those in formal non-EPZ private wage employment (46% vs. 44%) and
substantially more likely to be married than their counterparts in informal wage employment (30%). It is
noteworthy that while in other private wage employment (both formal and informal) male employees are
far more likely to be married than female employees, this is not the case for Zone Franche, for which the
share married is very similar for men and women. On this evidence, marriage does not seem to be an
impediment to employment in the export processing zone in Madagascar, at least compared to other
private sector wage employment.
To better understand the determinants of employment sector, we estimated multinomial logit
models of sector of employment for men and women. The sector outcomes in these models are public
administration, public sector (administration and public enterprise), private formal wage employment,
informal private wage employment, and self-employment (independent/family worker), and non-
5Though the corollary to this is also well known and is one of the reasons such employment has generatedcontroversy: employers in export manufacturing prefer female workers because they are more docile than men.
8

employment. We include in the models standard covariates such as age and schooling as well as a series
of household composition covariates and year dummies to capture trends. The multinomial logit
estimates themselves do not give the effects of these independent variables on the probability that an
individual is found in a given sector. These marginal effects instead must be calculated from the data and
the estimates. The marginal effects are presented with their associated t-statistics in Tables 4 and 5 for
males and females, respectively.
The estimates for age and schooling confirm the pattern seen in the descriptive statistics. For
men and women, additional schooling raises the probabilities of entering public employment and private
formal employment, while reducing the probability of being a private informal sector wage employee or
self-employed.6 The Zone Franche case occupies a middle ground: years of primary education has
strongly significant positive impacts on probabilities of employment in the sector, while secondary
schooling has a positive but much smaller impact and years of post-secondary schooling reduces the
probability. As noted before, Zone Franche employment appears to offer formal employment
opportunities to individuals with limited, but not zero, education.
Also consistent with the descriptive analysis, being married is positively associated with Zone
Franche employment for women. The numbers of young children in the household, in contrast, inhibit
employment in the sector, but statistically similar negative marginal effects on the children variables are
also found for other formal employment (in public sector or private sector). The negative child effects are
less strong for private informal wage employment and the presence of young children is actually
positively associated with being self-employed. Work in these last two sectors, especially self-
employment, should be relatively compatible with child care. For all formal employment, therefore,
6 The marginal effects in the table give the percentage point change in the probability of being in the sector from a unit change in the independent variable, e.g., an additional year of school. These are probabilities calculated for theentire sample (of women or men). The analogous changes in probabilities among the working subsamples would be larger: they are found by dividing the marginal effect by the share employed (about 53% for women and 63% formen). Since a smaller share of women than men is employed, this adjustment would raise the marginal effect forwomen more than for men.
9
having young children appears to be a barrier to participation, but there is evidently no particular
discrimination against women with young children by Zone Franche employers. Thus Madagascar
conforms to several typical patterns of EPZs in developing countries—the prevalence of women, and the
use of a young, semi-skilled workforce—but avoids the more egregious patterns of discrimination against
married women and mothers reported for some EPZs.
The changing gender composition of Zone Franche employment: increasing skill intensity?
Table 6 shows several rather striking changes in the nature of the Zone Franche workforce over a
fairly short period. First, the share of jobs in the sector held by women fell from .84 to .69 between 1995
and 2001. No equivalent change is observed in the rest of the private formal sector (also shown in the
table) and in other sectors other than a modest increase in the share of women in the public sector. Why
has the rapid expansion of the export processing zone been accompanied by an increasing prevalence of
men? This trend has been observed in many countries and is usually attributed to a combination of several
factors: use of more sophisticated technology; a change in the industrial composition of export processing
firms (e.g. from light to heavy industry or to greater capital intensively); and rising wages as labor
markets tighten (Kusago and Tzannatos 1998). The first two factors would increase the demand for male
labor, which is more highly skilled on average than female labor, while the third would attract more men
to the sector. If these processes are occurring, we would expect to observe a rising share of men
accompanied by an increase in average level schooling and skill classification of workers in the industry,
and increasing average wages in the sector.
In fact, mean years of schooling of Zone Franche workers has fallen (statistically significantly),
from 9.3 in 1995 to 7.8 in 2001 (Table 6), and while real median earnings in the sector have risen, they
have risen only slightly and less than elsewhere in the urban labor market (trends in earnings are
discussed below). This suggests rather compellingly that no increase in skill level of jobs in these firms
10
has occurred. We can also address this issue by looking at the self-reported occupational classifications
of employees in different sectors over time. In fact—and at odds with the trend in mean schooling—there
is a pronounced shift toward high skill categories in the Zone Franche workforce. For example, from
1996 to 2001 the shares of ‘skilled workers’ rose from 36% to 66% of all employees in the sector, while
‘semi-skilled’ and ‘laborer’ categories fell sharply. Shifts to higher skill groups are seen in other, less
dynamic sectors too, in particular private formal wage work, though the changes are less dramatic. One
must keep in mind that these are self-reported, hence to a degree subjective, classifications and exhibit a
fair amount of variability over years. Still, the shift is large for Zone Franche workers, and clearly larger
than elsewhere. However, it occurred for both genders. By 2001, although 50% of women were self-
reported as ‘skilled’ labor compared to 67% of men in the sector, more women (17% vs. 8%) were in the
‘management’ (mostly ‘middle’) group.
Despite this increase in self-reported occupational or skill status, it seems unlikely that we are
observing the kind of shift toward male-biased skill intensity in the sector that has been observed in
export processing manufacturing in other countries. This is suggested by the contradictory fall in mean
years of education and the almost flat trend in earnings as well as the fact that the export processing
experience in Madagascar is probably still too recent for significant changes in technology, and
concomitant increases in the demand for better skilled labor, to have occurred. A more likely explanation
for the apparent increase in skilled positions suggested by the shifts in occupational categories is that very
few workers had suitable training for this kind of work when the sector began to grow in the mid 90s.
Firms had to rapidly train a new workforce to achieve minimum competence at these tasks, leading to
upgrades in skill classifications over the next few years. Further, the decline in mean education levels
may be have occurred because in the depressed Malagasy economy of the mid-90s, an initially very small
number of export processing firms had a larger pool of unemployed (or underemployed) workers to select
from, hence were able to choose relatively highly skilled (well educated) workers. As the 90s progressed,
the number of Zone Franche enterprises grew while the labor market tightened overall, so firms in the
sector were less able to secure such highly skilled employees.
11
4. An analysis of compensation in zone franche and other sectors of the urban labor market
Trends in earnings
Figure 1 shows the evolution of median real hourly compensation (salary plus benefits) by sector
from 1997-2002.7 There are clear differences in earnings across the various portions of the urban labor
market. Earnings are highest by far in public sector employment, and lowest among the private informal
wage employed. Remuneration in Zone Franche employment appears to be lower than in other private
formal employment. However, these difference do not in of themselves indicate segmentation, i.e., labor
market inefficiencies, as they may simply reflect sector differences in average levels of schooling and
experience. The regression analysis below sheds more light on this issue.
The figure shows that real hourly earnings in most portions of the labor market rising quite
strongly during the growth period of 1997-2001. The proportional gain in real earnings was 26% in
public administration, 16% in private formal wage, and a rather incredible 67% in private informal
employment. In contrast, wages in the fastest growing sector—the Zone Franche—grew only slowly, a
point we will return to below. Increases in real remuneration, of course, are consistent with the renewed
economic growth of this period. But the implied growth of real income from these earnings data is much
higher than the modest improvements suggested by macro statistics. However, the latter data are
problematic and probably significantly understate income growth in urban areas, and the labor force
survey earnings data are corroborated by other indicators from the related consumption and informal
sector surveys (see Razafindrakoto and Roubaud 1999).
How did earnings respond to the crisis? The figure shows that real median hourly earnings
generally declined in (late) 2002 relative to 2001, though not equally across sectors. These reductions in
7 See Glick, Randrianasolo, and Roubaud (forthcoming) for a discussion of data issues related to our measures ofcompensation.
12
real earnings were not severe (usually under 10%) and arose from the sharp increases in prices in Tana
caused by the crisis, not by reductions in nominal pay. In any case, the main labor market impact of the
crisis was in employment, and there the Zone Franche experienced the largest loss, as shown above.
Earnings regressions for 1997-2001
We turn now to the econometric analysis of the determinants of hourly earnings in Tana through
the period of economic expansion; we exclude the crisis year 2002 because it potentially represents a
significant but (hopefully) exceptional structural break. We employ two specifications of Mincerian
earnings functions. The first is a simple regression of the natural log of real hourly earnings on schooling
(by level), occupational experience and its square, institutional sector dummies, and year dummies to
capture trends:
it
titj
jijiiiiii eyeartorEESSSW ++++++++= ää==
2001
1998
4
1
2543322110 secln dbaaaaaa
where ln Wi is the natural log of hourly earnings for individual i, S1i to S3i are years of primary, secondary,
and post-secondary education of i, Ei is occupational experience, and ei is a disturbance term. The sector
dummies j are public administration, public enterprise, private formal, and Zone Franche; private informal
wage is the base category. Our second model expands this specification to include interactions of sector
dummies with year (to capture sector-specific trends in earnings) and sector dummies with schooling and
experience (to capture sector differences in returns to these factors). We also explored further interactions
of sector with year and schooling, and sector with year and experience to allow for sector-specific
changes in returns to these factors over time. Since all of these effects may differ by gender, we ran the
models separately on men and women. We then used the estimates and data to test for differences in the
13
returns to education and experience across sector and gender, as well as to compare expected wages for
men and women in each sector.8
We discuss the results of the first specification only briefly, to get a general impression of
earnings determinants and trends. The estimates are shown in Table 7 for men and women. The impact of
education on wages appears to be similar for both genders. Returns to years of schooling in each level
(primary, secondary, post-secondary) are positive and significant, but the returns increase sharply with the
level of schooling.9 The coefficients on the sector dummies are large, positive and highly significant for
men and women, indicating that work in the formal portions of the economy pays better than informal
wage employment, the base category, controlling for differences in education and experience among
workers. We delay further discussion of sectoral differences until we present the more flexible extended
model. The coefficients on the year dummies indicate substantial growth in real wages since 1997, the
base year—23% for men and 34% for women.10
The extended model results are shown in Table 8. Initial estimations detected no time trends in
returns to experience overall or by sector, so these interactions were dropped from the model. The first
set of interactions in the model are for year and sector. An interesting pattern emerges for both men and
women: the year*sector coefficients are almost always negative, and for Zone Franche (and to a lesser
extent public enterprise) they are significantly so. Recall that the base sector category is private informal
wage employment. Therefore the pattern in the year*sector coefficients is indicating that earnings in
8 The sector dummies and interactions with them are treated as exogenous in the models, and we do not correct forselection into the wage labor force. The ideal way to do this would be to follow the method of Lee (1983) andconstruct selection terms for sector specific wage regressions using the multinomial sector participation model. Wewill attempt this in the next version of the paper. Note, however, that our division into four sectors places strongdemands on the data in terms of finding satisfactory instruments to identify the sector selection terms.
9 This pattern is not uncommon in recent African studies (Moll 1995; Appleton, Hoddinott, and Knight 1996;Appleton, Hoddinott, Krishnan and Max 1995), and for Madagascar specifically Glick (1999) finds a similar patternusing 1993-94 household survey data. Falling primary school quality together with an increase in primary schoolgraduates in a period of slow formal sector employment growth may explain the apparent decline in returns toprimary education.10 In a regression where the dependent variable is in the log of the wage, the proportional increase in the FMG wageresulting from the dummy variable changing from zero to 1 is exp(b)-1, where b is the coefficient on the dummyvariable.
14
other sectors (and especially the Zone Franche) fell during 1997-2001 relative to informal wages. This of
course does not mean that earnings in these sectors fell in absolute terms. Rather, they rose, but more
slowly than informal wages—the same trend indicated by the descriptive statistics above, but here
controlling for any changes over time in the characteristics of the workforce in different sectors.
These sector differences in real wage growth, in particular the flat trend for Zone Franche
earnings, may seem surprising. However, note that the Zone Franche is largely de-linked from the local
economy—indeed this is a standard criticism of export processing zones—and that the demand for labor
from this sector is determined by competitive international markets rather than domestic factors.
Domestic conditions would more strongly affect labor demand and earnings in sectors supplying the
domestic market. This would explain the sharp increase in informal sector wages over the period, since
urban incomes and hence demand for many goods and services produced in this sector were rising.
Further, the one area where Zone Franche and the rest of the economy are linked, if indirectly, is the labor
market. It is possible, particularly for women, that the large shift of semi-skilled labor into export
processing employment has reduced the supply of such labor to the informal wage sector enough to put
additional upward pressure on wages there (and at the same time, downward pressure on Zone Franche
earnings).
With respect to the faster overall growth of earnings for women compared with men which we
first saw in the year coefficients in the simple earnings models, recall that women experienced a relatively
large shift over the period from a low wage sector (private informal wage) to a higher wage sector (Zone
Franche).11 This would raise mean female earnings. At the same time, women remained
disproportionately involved in the informal sector, so the rise of earnings in that sector also benefited
women relative to men.
11 Even though the faster growth of informal wages narrowed the gap with Zone Franche wages, the gap was stillvery large in 2001: the median female wage was 632,300 FMG in Zone Franche compared with only 303,500 FMG
15

Sector and gender differences in the returns to schooling and experience
To permit a consideration of whether the returns to schooling are different in different sectors of
the labor market the model includes interactions of sector and schooling. To avoid having an enormous
number of parameters, the model in Table 8 interacts sector with linear years of education rather than
separately with years at different levels of schooling. The returns to schooling in a given sector thus
depend on the base schooling coefficients, the interaction of schooling with sector, and the interactions of
schooling and year by sector. Because of the interactions, the sector-specific returns are a function of the
years of schooling as well as the calendar year. To calculate the derivatives (and associated standard
errors) of predicted log hourly wages with respect to years of schooling, we set the years of schooling at
the sample means for men and women and set the year equal to the most recent year in the sample (2001).
A similar procedure was used to calculate the marginal impacts of occupational experience.
In Tables 9 and 10 we present for men and women matrices of sector-by-sector differences in the
estimated marginal effects of schooling together with the p-value of the differences. Reading across the
row for a given sector j, the columns k show the difference in the marginal effect of schooling
(specifically, the proportional increase in earnings from an additional year of schooling) in sector j and
sector k. For men (Table 9), several sector differences are statistically significant. The main finding is
that the incremental impacts of schooling on hourly earnings are low in public administration: statistically
the impact of additional schooling is lower in this sector then all others except for Zone Franche.
Similarly for women (Table 10), the impact of schooling is lower in public administration than elsewhere.
These results reflect at least in part the government’s policy from 1993 to 1999 of increasing equity in pay
in the public sector by raising wages disproportionately in lower employment grades.
With respect specifically to the Zone Franche, for women estimated returns to schooling are
lower than in other sectors, though the differences are significant only with respect to private informal
in private informal wage employment. Simulations reported below show that the gap in 2001 remains verysubstantial even after controlling for differences in characteristics of workers in the two sectors.
16
wage and private formal wage. For both women and men, there are few differences in returns to
occupational experience across sectors (Tables 11-12).
How do the impacts of education and experience compare for men and women within the
different labor market sectors? We calculated within sector, across gender comparisons in the same
manner as above. As Table 13 shows, there are few differences that are significant—and those that are
significant favor females. Returns to education in the private informal wage sector are higher for women
than for men. Women gain more than men from an additional year of occupational experience in both
public administration and private formal employment. Note that within Zone Franche firms, increments
to both schooling and experience are rewarded equivalently for men and women. In sum, conditional on
entry into specific sectors, increments to women’s human capital are rewarded similarly to—or
sometimes even better than—men’s. This finding is consistent with Schultz’s (2001) observation that
most studies of wage structure in developing countries find the returns to education as high or higher for
women as for men.
Wage premia to sector?
Although the returns to schooling and occupation in most cases are statistically similar across
sectors of the urban labor market, this conclusion refers to increments to earnings and does not mean that
the level of earnings will be the same for workers with the same schooling and other characteristics. If
labor markets are segmented, pay will differ even controlling for background. We investigate this by
comparing statistically the expected earnings across sectors. To control for differences in observed
worker characteristics, we calculate predicted earnings in each case using the same set of values for these
characteristics, which for variables other than schooling and year (and interactions involving these
variables) are the mean characteristics of the male or female working sample. For schooling, recall that
our estimates indicated that the impacts varied with level of education. Therefore we calculate expected
17
earnings for two levels of schooling: completed primary (5 years of schooling) and completed secondary
(12 years). As before, the predictions are calculated for 2001.12
For men (Table 14-15), the patterns for primary and secondary graduates are very similar.
Private informal wage work pays significantly less than all types of formal wage employment controlling
for worker characteristics. Public administration and public enterprise jobs generally pay better than
work in other sectors, including private formal employment. Zone Franche earnings are superior to
private informal wages and inferior to wages in the public sector, but not statically different from other
private formal wages.
For women, too, predicted log earnings in the private informal sector are significantly lower than
elsewhere in the wage labor market (Tables 16-17). As with men, public administration pays better than
informal sector and Zone Franche employment and also pays better (though only for higher levels of
schooling) than private formal employment. Also as with men, Zone Franche earnings are superior to
informal sector earnings. Zone Franche and private formal wages are not statistically different for female
primary completers, but private formal wages are higher for secondary completers.
Sectoral differences in predicted wages for men and women are thus not dissimilar in qualitative
terms. Further, for both, the magnitude of the differences across sectors can be very large. This can be
seen clearly from Table 18, which calculates the absolute level of the predicted wage for each sector. For
both genders, informal wage work is particularly poorly remunerated, and public administration work is
particularly well compensated. For women (and for the purposes of this study) a particularly relevant
comparison is between Zone Franche employment and informal wage work for those with a primary
education. For such women the earnings premium to Zone Franche work, while much lower than the
premium to public sector employment, is still almost 100% (755 Fmg vs. 397 Fmg) 13; the analogous
figure for men is only 35%. These comparisons thus point to another important finding. For women, the
12The predicted natural log of earnings from the regressions are transformed to FMG earnings using the formulaexp(s2)/2*exp(bx), where bx is the predicted log earnings and s is the standard deviation of the residual from theregression.
18
gap between informal and (any type of) formal sector pay, controlling for worker characteristics, is much
greater than for men. Yet, as noted earlier, working women are less likely than men to be in high-wage
formal employment outside of the Zone Franche, and more likely to be in the informal sector. Given the
apparent lack of access of women to other parts of the private formal sector, the Zone Franche provides
the only possibility for many women to find well-paid alternatives to informal sector work.
More generally, the large gaps in pay between formal and informal work for both genders, as well
as between different portions of the formal sector, suggest that the urban labor market is inefficient, that
is, segmented. Some caution in interpretation is called for here, however, since we are unable to control
for unobserved heterogeneity in worker abilities or preferences for different types of employment.
Premia to gender
Another potential form of labor market imperfection arises through discrimination on the basis of gender.
This may occur because of differences in the types of occupations within a sector that women and men
choose to--or are allowed to--enter, or simply to gender discrimination in pay for the same type of job.
We investigate this possibility in Table 18 by comparing female and male predicted earnings in each
sector of the labor market, again distinguishing primary and secondary completers and using same values
for all regressors for both genders. There are only a few cases where gender differences are significant.
In private informal wage employment, men are paid substantially more than similarly qualified women.
This gender gap is especially large among informal wage workers with only a primary education: the
expected hourly wage for men is almost 50% higher (584 vs. 397 Fmg). In private formal wage
employment, men are paid slightly (13%) more than women at lower schooling levels but not at higher
levels. Therefore there is evidence of possible gender discrimination in pay in portions of the private
sector in urban Tana, but not in public sector employment.
13 These and subsequent Fmg amounts are expressed in 1995 Fmg.
19
For the Zone Franche, which is part of private formal employment, the point estimates of
predicted earnings are larger for males at the primary school level but the difference here (as for
secondary schooling) is not statistically significant. This result contrasts with the findings of Nicita and
Razzaz (2003) who use 1997 and 1999 EPM data to analyze earnings in the textile sector, which strongly
overlaps with (but is not identical to) export processing zone employment. Although like us they find a
large wage premium to such employment relative to informal sector pay, they also find that males earn
substantially more than women even after controlling for worker characteristics, except at high levels of
schooling. One reason for the difference is apparently the time frame. The calculations we have
presented are for the most recent pre-crisis year, 2001. The sector*year interactions in Table 8 show a
negative trend in both male and female Zone Franche earnings relative to the private informal sector, but
the proportional decline in earnings from 1997 to 2001 is larger for men.
In other words, female earnings in the sector rose relative to men over the period, essentially
closing the pro-male bias in pay by 2001.14 With a large gender pay gap in informal sector jobs but no
such gap in export processing jobs, shifts by women from the former to the latter imply an improvement
in overall gender earnings equity.
5. Sector differences in non-pecuniary aspects of employment
Jobs are distinguished from each other by more than pay. In particular, formal or ‘modern’ sector
firms in developing countries tend to offer non-salary job benefits not available in the informal sector. In
this section we consider whether this is true for export processing firms in Madagascar as well as ranking
the Zone Franche and other sectors on the basis of several other measures of job ‘quality’. Sector means
for a number of indicators for 2001 are shown in Table 19. The high level of benefits in Zone Franche
14 Indeed, if we calculate predicted earnings for 1997, we find a very large and statistically significant gender gap inZone Franche earnings for primary schooling and a smaller and insignificant gap for secondary completers. This is consistent with the pattern by school level in Nicita and Razzaz’s results. We should also note that, in addition to the difference in years, our findings are not directly comparable to theirs because they consider all textile workers in all areas of the country, while we consider only export processing zone workers in the capital.
20
employment is noteworthy: 79% of such workers, for example, enjoy paid leave and 83% receive health
care coverage from their employers. This is on par with the public sector, and substantially higher than in
the non-EPZ private sector, even among private formal sector wage workers, of whom 52% have paid
leave and 46% have health coverage. Very few informal private wage workers enjoy these benefits. 15
As for the nature of employment, almost all workers in formal employment describe their jobs as
continuous, as do even most informal wage workers (81%). Almost all public workers have a formal
employment contract. The share is smaller for private formal non-Zone Franche employment (68%) but
very high in for Zone-Franche workers (93%). Only a small minority of wage earners in Tana are
members of a union; only in public enterprises is more than a quarter of the workforce unionized (39%).
Here again, the Zone Franche resembles the public sector more than other private formal employment and
especially private informal wage employment. Some 13% percent of Zone Franche workers belong to a
union (out of 42% who say there is a union in their place of work) compared with 18 percent in public
administration (49% reporting the presence of a union) and 8% for other formal private employment
(16% reporting presence of a union).16
Thus along a number of non-wage dimensions of employment, Zone Franche firms rank
comparably to or even above employers in other portions of the formal economy, in particular other
formal sector private firms. However, several other characteristics are less favorable. Zone Franche
enterprises, subject to international competition, obligate their employees to work substantially longer
hours than other workers. As shown in Table 19, average hours of work per month is 211 for Zone
Franche employees, compared with 187 in the rest of the private formal sector and just 161 in public
administration. For women alone the differences are even more pronounced: 209 hours in Zone Franche,
168 in the non-Zone Franche private formal sector, and 147 in public administration. Such long working
15 Some analysts actually use the presence of such benefits (as well as other indicators in the table such as presenceof an employment contract) to define formal sector employment. For our analysis of the Madio data we do not dothis, but our criteria are obviously correlated with these alternative criteria 16 We are not arguing that this indicates that EPZ employers are not hostile to unionization efforts—a hotly debatedissue in the discussion of EPZs—but merely that they do not seem more so than elsewhere in the formal economy.
21
hours may be detrimental to worker health and well-being, and for women, can interfere with their ability
to balance home and work responsibilities. In addition, job turnover is high in the Zone Franche. Using
the same data we use here, Cling, Razafindrakoto, and Roubaud (2004) infer that about one in five
employees leave their jobs each year compared with one in ten in the private formal sector.
Sector differences in turnover are an important aspect of the debate over the benefits of export
processing zone employment. A pattern has been reported in many countries whereby firms in EPZs
employ primarily young, unmarried women for several years duration only; these women quit either
because there is no room for advancement or to raise families--or they may simply be dismissed because
employers do not want female employees workers with domestic responsibilities that may cause
absenteeism.17 We have seen that Zone Franche workers in Madagascar are indeed young and
disproportionately female. On the other hand, marriage is not a barrier to employment in the sector, and
while having children is negatively associated with this employment, the effect is similar to other formal
sector employment. Still, the unusually long hours required by Zone Franche employers operates to
discourage long-term employment, especially of women who want to raise families, and is no doubt a
major reason for the high turnover observed in the sector.
Whether Zone Franche provides long-term employment with prospects for advancement or
simply short term ‘dead end’ jobs can also be assessed by comparing sectors in terms of promotion and
employer provided training. The surveys ask respondents where they have ever been promoted or
received training provided or paid for by their employers. Rather than simply comparing means of these
indicators by sector, we use a regression framework to control for differences in worker characteristics
that might affect an employee’s access to training or promotion. Since on the job experience is
necessarily low in Zone Franche employment—most firms were no more than several years old even by
the time of the 2001 survey—we restrict the sample for comparison to workers in all sectors with 5 or
17 For case studies and discussion see Seguino (1997); Pearson (1995); Salaf (1981); and Greenhalgh (1985).
22
fewer years of experience in their current firm. Therefore we are comparing promotion and training
probabilities for relatively new workers—the best we can do given the data.
We should point out first that the share of such workers receiving training is not very high—it is
about 21-22% in public administration and public enterprises and in Zone Franche employment, lower in
private formal employment (10%) and almost non-existent in informal wage employment. Even fewer
individuals have received promotions—only 5% in the highest case, public administration. This is not
unexpected since we are considering only relatively recent arrivals in these enterprises.
Table 20 presents marginal effects from men’s and women’s probits for having received on-the-
job training. Better educated workers are more likely to be trained by their employers, and the probability
also is rising in the time spent in the firm. The estimates for the dummy variables for sector, which are
our main interest, show the change in the probability of training resulting from being in the indicated
sector relative to being in informal wage employment, the base category. All the included sector
dummies are positive and significant for both men and women, indicating that likelihood of training is
higher in all types of formal employment than in informal employment. Statistical comparisons of the
formal sector dummy effects indicate that the Zone Franche generally does well on this score. For both
men and women, the likelihood of training is as high in Zone Franche employment as in public
administration or public enterprises and greater than in private formal employment. We also ran separate
probits for each sector and included a gender dummy. There were no gender differences in training
propensities controlling for differences in male and female worker characteristics in any sector other than
informal wage employment, where women were actually more likely to receive training than men.
Table 21 shows for the same sample the marginal effects from probit regressions for the
probability of having received a promotion. As with training, promotion is more likely in each of the
formal wage sectors relative to informal wage employment, for both genders. However, women in Zone
Franche enterprises are more likely to be promoted than those in private formal employment. For men,
the point estimate is highest for the Zone Franche than for any other sector, and as with women, the effect
of Zone Franche is statistically larger than private formal employment. Note that these results are by and
23
large consistent with the impacts of occupational experience in our earnings regressions—promotion and
higher pay with seniority obviously being related outcomes. Recall that earnings of Zone Franche
employees were seen to increase with experience at rates statistically similar to elsewhere in the formal
economy. However, in contrast to the lack of gender differences in occupational experience impacts in
the wage regressions (and in the training probit models as well), the sector-specific promotion probits
reveal that in two cases—public administration and Zone Franche—males appear more likely than
equivalently qualified females to receive promotions (both effects significant at 10% only).
Thus the analysis of training and promotion, though based only on a sample of relatively
inexperienced employees, suggest that Zone Franche employers make investments in their workers.
Promotion among this group is rare in general, but rates in Zone Franche are comparable to elsewhere in
the formal economy. These findings are at odds with the notion that export processing employment in
Madagascar consists of dead-end jobs with no prospects for advancement—but the evidently high rate of
turnover cautions against too favorable an assessment. Ultimately, it remains too early in the
development of export processing manufacturing in Madagascar to fairly assess this hypothesis. With
respect to specifically to the training results, we should take note of Kusago and Tzannatos’s (1998)
observation that training in export processing manufacturing tends to be task-specific and may be of little
use to the employee if she does not stay in the industry. Again, longer term observation of the sector will
be needed to see if a pattern emerges of technology upgrading accompanied by appropriate workforce
training emerges, as well as of training to enable Malagashe to move increasingly into management
positions.
5. Summary and conclusions
Whether export processing zones are beneficial for development, and for women in particular,
remains a subject of debate and controversy. We have attempted to analyze part of the question—the
labor market impacts—using unique time-series labor force survey data from a unique (for Africa)
environment: urban Madagascar, in which the export processing sector or Zone Franche grew very
24
rapidly over most of the period examined. Employment in the Zone Franche exhibits some basic patterns
seen in the early stages of export processing industries elsewhere in the developing world: the workforce
is predominantly female, semi-skilled (in terms of education background), and young. In contrast to (at
least some) other contexts, being married is not a barrier to women’s employment in this sector, and while
having young children is negatively associated with entry, the impact is similar to that for other types of
formal wage employment, including in the public sector.
Also as seen in other contexts, export processing employment represents a significant step up in
pay for women (those with low but not zero levels of schooling) who would otherwise be likely to be
found in very poorly remunerated informal sector work. This conclusion is strengthened by the fact that
we use micro data and earnings regressions to establish these sector wage premia, in contrast to most
earlier studies of EPZs. Men in the Zone Franche also enjoy a wage premium over their counterparts in
the informal sector, though not as large as women. Growth of the Zone Franche may have significant
impacts on poverty because it provides relatively high wage opportunities for those with relatively low
levels of schooling (at least by urban standards), who are more likely to poor and otherwise relegated to
the informal sector. Further, by disproportionately drawing women from the low wage informal sector
(where the gender pay gap is very large) to relatively well paid export processing jobs (where pay is not
only higher but also similar for men and women with similar qualifications), Zone Franche growth—if it
is able to continue—has the potential to contribute substantially to improved overall gender equity in
earnings in the urban economy.
Further, along many dimensions—availability of paid leave and health care, access to union
membership, rates of employer provided training and promotions—jobs in the export processing zone are
‘high quality’ jobs, comparable to or even superior to other parts of the formal sector. Additions to
schooling and experience are rewarded with increases in earnings at rates generally comparable to
elsewhere in the urban labor market. However, there are some troubling signs as well. Hours of work are
very long in the sector, and turnover is high—a trait held in common with export processions zones
elsewhere. Although we have data for a seven year period (1995-2002), this period essentially
25
corresponds to the start and early (if very rapid) growth of the export processing zone in Madagascar.
Most workers in the sector therefore cannot have been with their firms for more than a few years.
Therefore we are unable to judge whether the sector will prove to be a source of long term employment
(for women especially) characterized by continued investments in worker human capital and job
advancement, or instead conform more to the stereotypical negative picture of offering only short term
dead end jobs providing few transferable skills.
Nor, given the nature of our data, can we address the related concerns of whether firms will
upgrade to more sophisticated technology while providing the appropriate training for employees, and
whether Malagashe will be trained in significant numbers to move into management positions. These
changes in turn may have differential impacts by gender. Longer term observation will be required to
assess these outcomes.
Finally, it is appropriate to close with the reminder that export processing zone expansion has
broader potential impacts that, while important, are well beyond the scope of this paper to investigate.
These include the potential spillover effects on other sectors of the economy, whether positive--e.g.,
though backward industrial linkages—or negative—e.g., through competition for labor and other
resources, or by increasing the tax pressure on domestic enterprises that do not enjoy the exemptions of
enterprises in the EPZ. As noted in the Introduction, experiences throughout the developing world
suggest that while there are potentially large employment and foreign exchange benefits to EPZs, the
record on issues such as technology transfer, backward linkages, and overall contribution to growth is
decidedly mixed (see Kusago and Tzannatos 1998; Cling and Letilly 2001). What we have been able to
show in this paper is that in the labor market, at least so far, the expansion of the export processing zone
has had favorable impacts on economic opportunities, especially for those without high levels of
schooling and for women.
26
References
Appleton, S., J. Hoddinott, and J. Knight.1996. “Primary Education as an Input into Post-PrimaryEducation: A Neglected Benefit”. Oxford Bulletin of Economics and Statistics58.
Appleton, S., J. Hoddinott, P. Krishnan, and K. Max. .1995. Does the Labor Market Explain LowerSchooling? Evidence From Three African Countries. Center for the Study of African Economies.
Cling, J.P. and G. Letilly 2001 “Export Processsing Zones : A threatened instrument for global economy insertion ?” DIAL working paper DT/2001/17 Paris: DIAL
Cling, Jean-Pierre,Razafindrakoto, M., and Roubaud F: “Export Processing Zones in Madagascar: An Endangered Success Story” DIAL working paper DT/2004/02. Paris: DIAL
Glick, P. 1999. “Patterns of Employment and Earnings in Madagascar.” Cornell University Food and Nutrition Policy Program Working Paper No. 92. Ithaca, NY.
Glick, P. and M. Razakamanantsoa. 2001 “The Distribution of Social Services in Madagascar, 1993-99”Cornell Food and Nutrition Policy Program Working Paper No. 128. 2001
Glick, P., Randrianasolo, J.B., and F. Roubaud Forthcoming. The Urban Labor Market in Madagascar through Growth and Crisis, 1993-2002 Cornell Food and Nutrition Policy Program Working Paper.
Greenhalgh, S. (1985). Sexual stratification: The other side of "growth with equity" in East Asia. Populationand Development Review. 11(2), 265-314.
International Monetary Fund. 2003. “Madagascar: Selected Issues and Statistical Appendix”. IMFCountry Report No. 03/7: Washington.
Knight, J., R. Sabot, and D. Hovey. 1992. “Is the Rate of Return to Primary Schooling Really26 Percent?” Journal of African Economies 1:192-205.
Kusago, T, and Z. Tzannatos. 1998. “Export Processing Zones: A Review in Need of Update” Social Protection Discussion Paper No. 9802. World Bank.
Lee, L.F. 1983. "Generalized Econometric Models with Selectivity." Econometrica 51: 507-512.
MADIO (1995-1999). L'emploi, le chômage et les conditions d'activité dans l'agglomérationd'Antananarivo. Enquête 1-2-3, premiers résultats de la phase 1 sur l'emploi, Instat/Madio, Madagascar.
Moll, P. 1995. “The Collapse of Primary Schooling Returns in South Africa 1960-90.Oxford Bulletin of Economics and Statistics 58
Nicita, A. and S. Razzaz . 2003.”Who Benefits and How Much? How Gender Affects Welfare Impacts of a Booming Textile Industry”(WPS# 3029) World Bank.
Pearson, R. (1995). Male bias and women's work in Mexico's border industries. In Diane Elson, (Ed.), Male bias in the development process (pp. 133-163) Manchester, UK: Manchester University Press.
27
Rakotomanana F., Ramilison E. and Roubaud F. (2000), « La mise en place d’une enquête annuelle surl’emploi à Madagascar : un exemple pour l’Afrique Sub-saharienne », Stateco n°95/96/97, INSEE, pp.25-40.
Ramilison Eric Norbert (2003) Impact de la crise politico-économique de 2002 sur l’emploi et les conditions d’activité des méenages de l’agglomération d’Antananarivo: Projet MADIO
Razafindrakoto M. and Roubaud F. (2003), « Two original poverty monitoring tools: the 1-2-3 surveysand the Rural Observatories », in Cling J.-P., Razafindrakoto M. and Roubaud F. (eds), New International Poverty Reduction Strategies, London/ New-York, Routledge, chapter XIII, pp. 313-339.
Razafindrakoto M. and Roubaud F. (2002), « Les zones franches à Madagascar : atouts et contraintes d’une insertion mondiale réussie », Afrique Contemporaine n° 202/203, avril-septembre, pp.147-163.
Razafindrakoto M. and Roubaud F. (2001), « Vingt ans de réforme de la fonction publique àMadagascar », in Raffinot M. and Roubaud F. (eds.), Les fonctionnaires du Sud : sacrifiés ou protégés ?,Autrepart n°20, pp.43-60.
Razafindrakoto M. and Roubaud F. (1999), « La dynamique du marché du travail dans l’agglomérationd’Antananarivo entre 1995 et 1999 : la croissance économique profite-t-elle aux ménages ? », Economiede Madagascar n°4, BCM/INSTAT, Madagascar, pp.103-137.
Razafindrakoto M. and Roubaud F. (1997), « Les entreprises franches à Madagascar : économied’enclave ou promesse d’une nouvelle prospérité ? », Economie de Madagascar n°2, BCM/INSTAT, pp.217-248.
Roubaud F., ed. (2002). Madagascar après la tourmente: regards sur dix ans de transitions politique etéconomique, special issue, Afrique Contemporaine n° 202/203, april-september, pp. 3-163.
Salaf, J. (1990). Women, the family, and the state: Hong Kong, Taiwan, Singapore Newly IndustrializedCountries in Asia. In S. Stichter, and J. L. Papart (Eds.), Women , employment and the family in the international division of labour. Philadelphia: Temple University Press.
Seguino, S. (1997). Export-led growth and the persistence of gender inequality in the newly industrialized economies. In J. Rives, & M. Youseif, (Eds.), Economic Dimensions of Gender Inequality(pp. 11-33). Westport, CT: Prager.
Schultz, T.P. 2001. “Why Governments Should Invest More to Educate Girls.” World Development30(2):207-25.
28
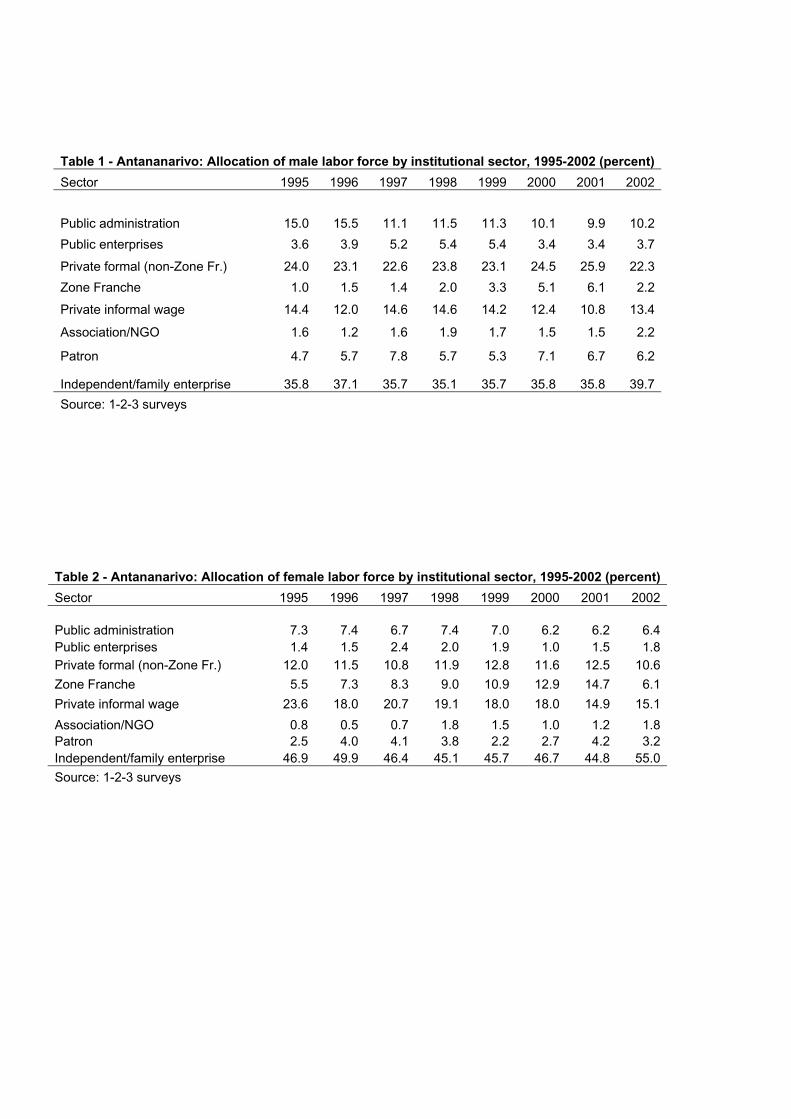
Table 1 - Antananarivo: Allocation of male labor force by institutional sector, 1995-2002 (percent)
Sector 1995 1996 1997 1998 1999 2000 2001 2002
Public administration 15.0 15.5 11.1 11.5 11.3 10.1 9.9 10.2
Public enterprises 3.6 3.9 5.2 5.4 5.4 3.4 3.4 3.7
Private formal (non-Zone Fr.) 24.0 23.1 22.6 23.8 23.1 24.5 25.9 22.3
Zone Franche 1.0 1.5 1.4 2.0 3.3 5.1 6.1 2.2
Private informal wage 14.4 12.0 14.6 14.6 14.2 12.4 10.8 13.4
Association/NGO 1.6 1.2 1.6 1.9 1.7 1.5 1.5 2.2
Patron 4.7 5.7 7.8 5.7 5.3 7.1 6.7 6.2
Independent/family enterprise 35.8 37.1 35.7 35.1 35.7 35.8 35.8 39.7
Source: 1-2-3 surveys
Table 2 - Antananarivo: Allocation of female labor force by institutional sector, 1995-2002 (percent)
Sector 1995 1996 1997 1998 1999 2000 2001 2002
Public administration 7.3 7.4 6.7 7.4 7.0 6.2 6.2 6.4Public enterprises 1.4 1.5 2.4 2.0 1.9 1.0 1.5 1.8Private formal (non-Zone Fr.) 12.0 11.5 10.8 11.9 12.8 11.6 12.5 10.6
Zone Franche 5.5 7.3 8.3 9.0 10.9 12.9 14.7 6.1
Private informal wage 23.6 18.0 20.7 19.1 18.0 18.0 14.9 15.1
Association/NGO 0.8 0.5 0.7 1.8 1.5 1.0 1.2 1.8Patron 2.5 4.0 4.1 3.8 2.2 2.7 4.2 3.2Independent/family enterprise 46.9 49.9 46.4 45.1 45.7 46.7 44.8 55.0
Source: 1-2-3 surveys
30
Table 3 - Antananarivo: Characteristics of the labor force by institutional sector, 2001
Characteristic Public
administrationPublic
enterprises
Privateformal (non-
Zone Fr.) Zone
Franche
Privateinformal
wage
Independent/ family
enterprise
AllFemale 0.36 0.28 0.30 0.69 0.55 0.53Age 44.4 40.8 35.2 27.4 31.3 34.7Years of schooling 11.7 10.2 9.3 7.8 5.7 6.6Married 0.82 0.71 0.60 0.46 0.39 0.61Migrant (within last 5 yrs) 0.09 0.05 0.05 0.08 0.11 0.06Secondary activity in past yra 0.17 0.12 0.12 0.03 0.14 0.15First job 0.59 0.54 0.70 0.80 0.72 0.87
MaleAge 43.9 41.8 35.5 26.3 31.4 34.1Years of schooling 11.4 10.4 8.9 8.1 6.2 6.7Married 0.87 0.78 0.67 0.45 0.49 0.59Migrant (within last 5 yrs) 0.09 0.06 0.05 0.10 0.07 0.06Secondary activity in past yra 0.21 0.14 0.11 0.03 0.19 0.15First job 0.56 0.50 0.67 0.81 0.76 0.85
Female Age 45.3 38.1 34.4 28.0 31.3 35.2Years of schooling 12.0 9.7 10.3 7.7 5.3 6.4Married 0.75 0.52 0.44 0.46 0.30 0.63Migrant (within last 5 yrs) 0.09 0.03 0.06 0.07 0.15 0.05Secondary activity in past yra 0.11 0.07 0.13 0.03 0.10 0.14First job 0.63 0.63 0.77 0.79 0.69 0.88
a engaged in a work activity in addition to the indicated employment in the past year.
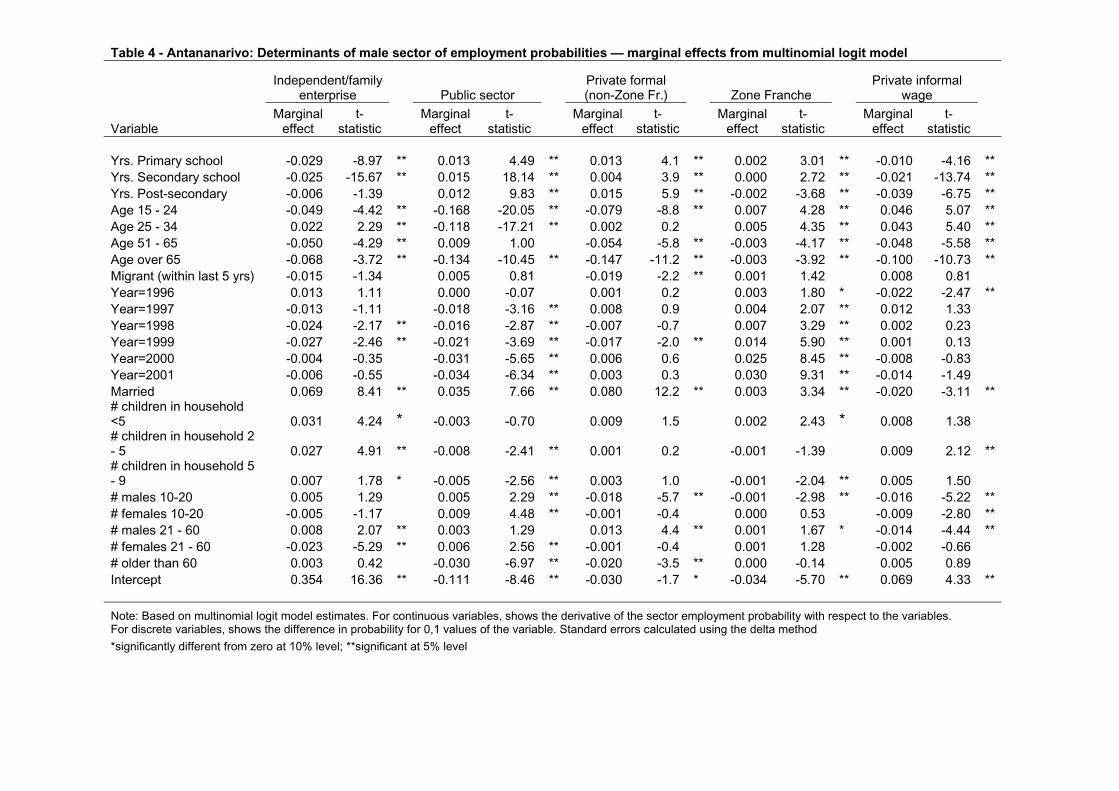
Table 4 - Antananarivo: Determinants of male sector of employment probabilities — marginal effects from multinomial logit model
Independent/familyenterprise Public sector
Private formal (non-Zone Fr.) Zone Franche
Private informal wage
Variable Marginal
effect t-
statistic Marginal
effect t-
statisticMarginal
effect t-
statisticMarginal
effect t-
statisticMarginal
effect t-
statistic
Yrs. Primary school -0.029 -8.97 ** 0.013 4.49 ** 0.013 4.1 ** 0.002 3.01 ** -0.010 -4.16 **Yrs. Secondary school -0.025 -15.67 ** 0.015 18.14 ** 0.004 3.9 ** 0.000 2.72 ** -0.021 -13.74 **Yrs. Post-secondary -0.006 -1.39 0.012 9.83 ** 0.015 5.9 ** -0.002 -3.68 ** -0.039 -6.75 **Age 15 - 24 -0.049 -4.42 ** -0.168 -20.05 ** -0.079 -8.8 ** 0.007 4.28 ** 0.046 5.07 **Age 25 - 34 0.022 2.29 ** -0.118 -17.21 ** 0.002 0.2 0.005 4.35 ** 0.043 5.40 **Age 51 - 65 -0.050 -4.29 ** 0.009 1.00 -0.054 -5.8 ** -0.003 -4.17 ** -0.048 -5.58 **Age over 65 -0.068 -3.72 ** -0.134 -10.45 ** -0.147 -11.2 ** -0.003 -3.92 ** -0.100 -10.73 **Migrant (within last 5 yrs) -0.015 -1.34 0.005 0.81
-0.019 -2.2 ** 0.001 1.42 0.008 0.81Year=1996 0.013 1.11 0.000 -0.07 0.001 0.2 0.003 1.80 * -0.022 -2.47 **Year=1997 -0.013 -1.11 -0.018 -3.16 ** 0.008 0.9 0.004 2.07 ** 0.012 1.33Year=1998 -0.024 -2.17 ** -0.016 -2.87 ** -0.007 -0.7 0.007 3.29 ** 0.002 0.23Year=1999 -0.027 -2.46 ** -0.021 -3.69 ** -0.017 -2.0 ** 0.014 5.90 ** 0.001 0.13Year=2000 -0.004 -0.35 -0.031 -5.65 ** 0.006 0.6 0.025 8.45 ** -0.008 -0.83Year=2001 -0.006 -0.55 -0.034 -6.34 ** 0.003 0.3 0.030 9.31 ** -0.014 -1.49Married 0.069 8.41 ** 0.035 7.66 ** 0.080 12.2 ** 0.003 3.34 ** -0.020 -3.11 **# children in household <5 0.031 *4.24 -0.003 -0.70 0.009 1.5 0.002 2.43 * 0.008 1.38# children in household 2 - 5 0.027 4.91 ** -0.008 -2.41 ** 0.001 0.2 -0.001 -1.39 0.009 2.12 **# children in household 5 - 9 0.007 1.78 * -0.005 -2.56 ** 0.003 1.0 -0.001 -2.04 ** 0.005 1.50# males 10-20 0.005 1.29 0.005 2.29 ** -0.018 -5.7 ** -0.001 -2.98 ** -0.016 -5.22 **# females 10-20 -0.005 -1.17 0.009 4.48 ** -0.001 -0.4 0.000 0.53 -0.009 -2.80 **# males 21 - 60 0.008 2.07 ** 0.003 1.29 0.013 4.4 ** 0.001 1.67 * -0.014 -4.44 **# females 21 - 60 -0.023 -5.29 ** 0.006 2.56 ** -0.001 -0.4 0.001 1.28 -0.002 -0.66# older than 60 0.003 0.42 -0.030 -6.97 ** -0.020 -3.5 ** 0.000 -0.14 0.005 0.89Intercept 0.354 16.36 ** -0.111 -8.46 ** -0.030 -1.7 -0.034* -5.70 ** 0.069 4.33 **
Note: Based on multinomial logit model estimates. For continuous variables, shows the derivative of the sector employment probability with respect to the variables. For discrete variables, shows the difference in probability for 0,1 values of the variable. Standard errors calculated using the delta method
*significantly different from zero at 10% level; **significant at 5% level
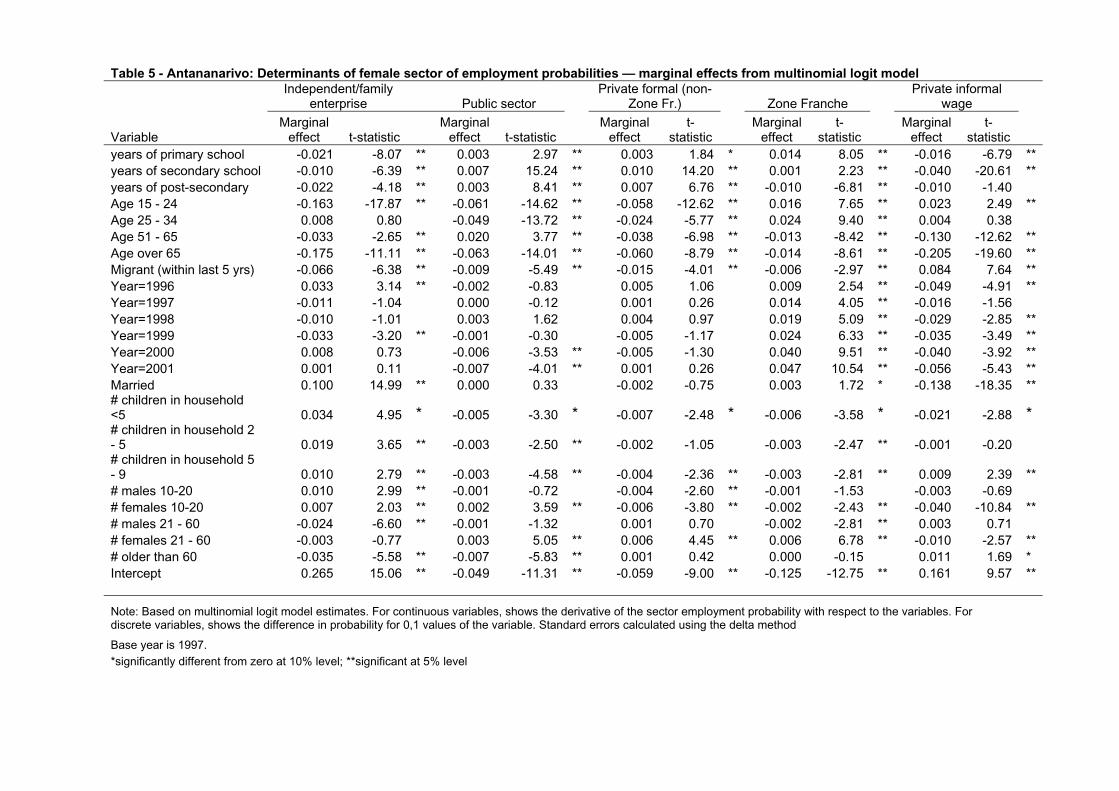
Table 5 - Antananarivo: Determinants of female sector of employment probabilities — marginal effects from multinomial logit modelIndependent/family
enterprise Public sector Private formal (non-
Zone Fr.) Zone Franche Private informal
wage
Variable Marginal
effect t-statistic Marginal
effect t-statisticMarginal
effect t-
statisticMarginal
effect t-
statisticMarginal
effect t-
statisticyears of primary school -0.021 -8.07 ** 0.003 2.97 ** 0.003 1.84 * 0.014 8.05 ** -0.016 -6.79 **years of secondary school -0.010 -6.39 ** 0.007 15.24 ** 0.010
14.20 ** 0.001 2.23 ** -0.040 -20.61 **years of post-secondary -0.022 -4.18 ** 0.003 8.41 ** 0.007 6.76 ** -0.010 -6.81 ** -0.010 -1.40Age 15 - 24 -0.163 -17.87 ** -0.061 -14.62 ** -0.058 -12.62 ** 0.016 7.65 ** 0.023 2.49 **Age 25 - 34 0.008 0.80 -0.049 -13.72 ** -0.024 -5.77 ** 0.024 9.40 ** 0.004 0.38Age 51 - 65 -0.033 -2.65 ** 0.020 3.77 ** -0.038 -6.98 ** -0.013 -8.42 ** -0.130 -12.62 **Age over 65 -0.175 -11.11 ** -0.063 -14.01 ** -0.060 -8.79 ** -0.014 -8.61 ** -0.205 -19.60 **Migrant (within last 5 yrs) -0.066 -6.38 ** -0.009 -5.49 ** -0.015 -4.01 ** -0.006 -2.97 ** 0.084 7.64 **Year=1996 0.033 3.14 ** -0.002 -0.83 0.005 1.06 0.009 2.54 ** -0.049 -4.91 **Year=1997 -0.011 -1.04 0.000 -0.12 0.001 0.26 0.014 4.05 ** -0.016 -1.56Year=1998 -0.010 -1.01 0.003 1.62 0.004 0.97 0.019 5.09 ** -0.029 -2.85 **Year=1999 -0.033 -3.20 ** -0.001 -0.30 -0.005 -1.17 0.024 6.33 ** -0.035 -3.49 **Year=2000 0.008 0.73 -0.006 -3.53 ** -0.005 -1.30 0.040 9.51 ** -0.040 -3.92 **Year=2001 0.001 0.11 -0.007 -4.01 ** 0.001 0.26 0.047 10.54 ** -0.056 -5.43 **Married 0.100 14.99 ** 0.000 0.33 -0.002 -0.75 0.003 1.72 * -0.138 -18.35 **# children in household <5 0.034 *4.95 -0.005 -3.30 * -0.007 -2.48 * -0.006 -3.58 * -0.021 -2.88 *# children in household 2 - 5 0.019 3.65 ** -0.003 -2.50 ** -0.002 -1.05 -0.003 -2.47 ** -0.001 -0.20# children in household 5 - 9 0.010 2.79 ** -0.003 -4.58 ** -0.004 -2.36 ** -0.003 -2.81 ** 0.009 2.39 **# males 10-20 0.010 2.99 ** -0.001 -0.72 -0.004 -2.60 ** -0.001 -1.53 -0.003 -0.69# females 10-20 0.007 2.03 ** 0.002 3.59 ** -0.006 -3.80 ** -0.002 -2.43 ** -0.040 -10.84 **# males 21 - 60 -0.024 -6.60 ** -0.001 -1.32 0.001 0.70 -0.002 -2.81 ** 0.003 0.71# females 21 - 60 -0.003 -0.77 0.003 5.05 ** 0.006 4.45 ** 0.006 6.78 ** -0.010 -2.57 **# older than 60 -0.035 -5.58 ** -0.007 -5.83 ** 0.001 0.42 0.000 -0.15 0.011 1.69 *Intercept 0.265 15.06 ** -0.049 -11.31 ** -0.059 -9.00 ** -0.125 -12.75 ** 0.161 9.57 **
Note: Based on multinomial logit model estimates. For continuous variables, shows the derivative of the sector employment probability with respect to the variables. For discrete variables, shows the difference in probability for 0,1 values of the variable. Standard errors calculated using the delta method
Base year is 1997. *significantly different from zero at 10% level; **significant at 5% level
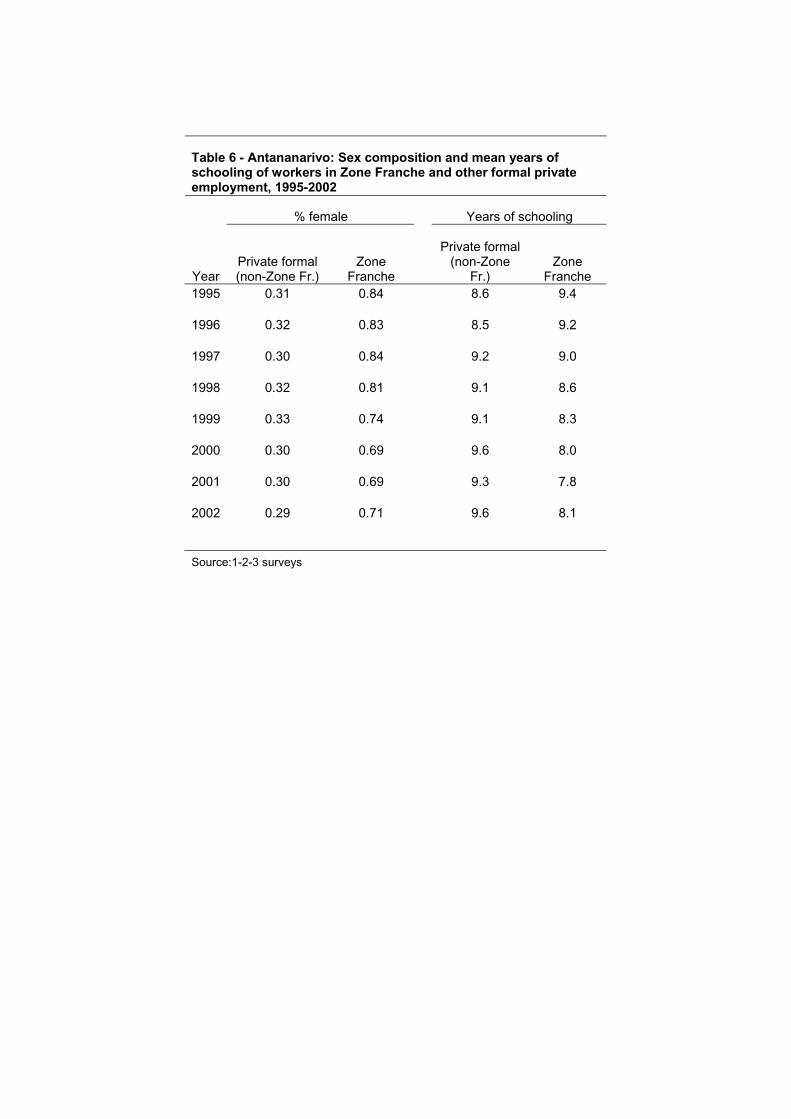
Table 6 - Antananarivo: Sex composition and mean years of schooling of workers in Zone Franche and other formal private employment, 1995-2002
% female Years of schooling
YearPrivate formal (non-Zone Fr.)
ZoneFranche
Private formal (non-Zone
Fr.)Zone
Franche 1995 0.31 0.84 8.6 9.4
1996 0.32 0.83 8.5 9.2
1997 0.30 0.84 9.2 9.0
1998 0.32 0.81 9.1 8.6
1999 0.33 0.74 9.1 8.3
2000 0.30 0.69 9.6 8.0
2001 0.30 0.69 9.3 7.8
2002 0.29 0.71 9.6 8.1
Source:1-2-3 surveys
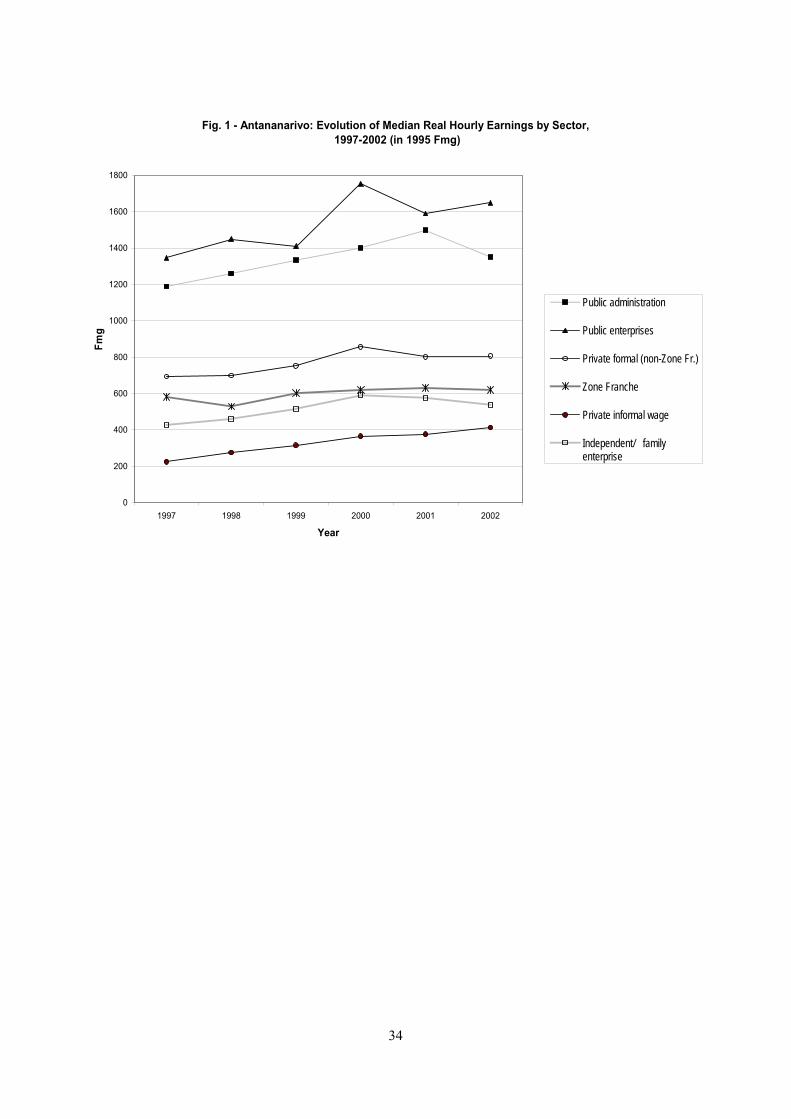
Fig. 1 - Antananarivo: Evolution of Median Real Hourly Earnings by Sector, 1997-2002 (in 1995 Fmg)
0
200
400
600
800
1000
1200
1400
1600
1800
1997 1998 1999 2000 2001 2002
Year
Fm
g
Public administration
Public enterprises
Private formal (non-Zone Fr.)
Zone Franche
Private informal wage
Independent/ familyenterprise
34
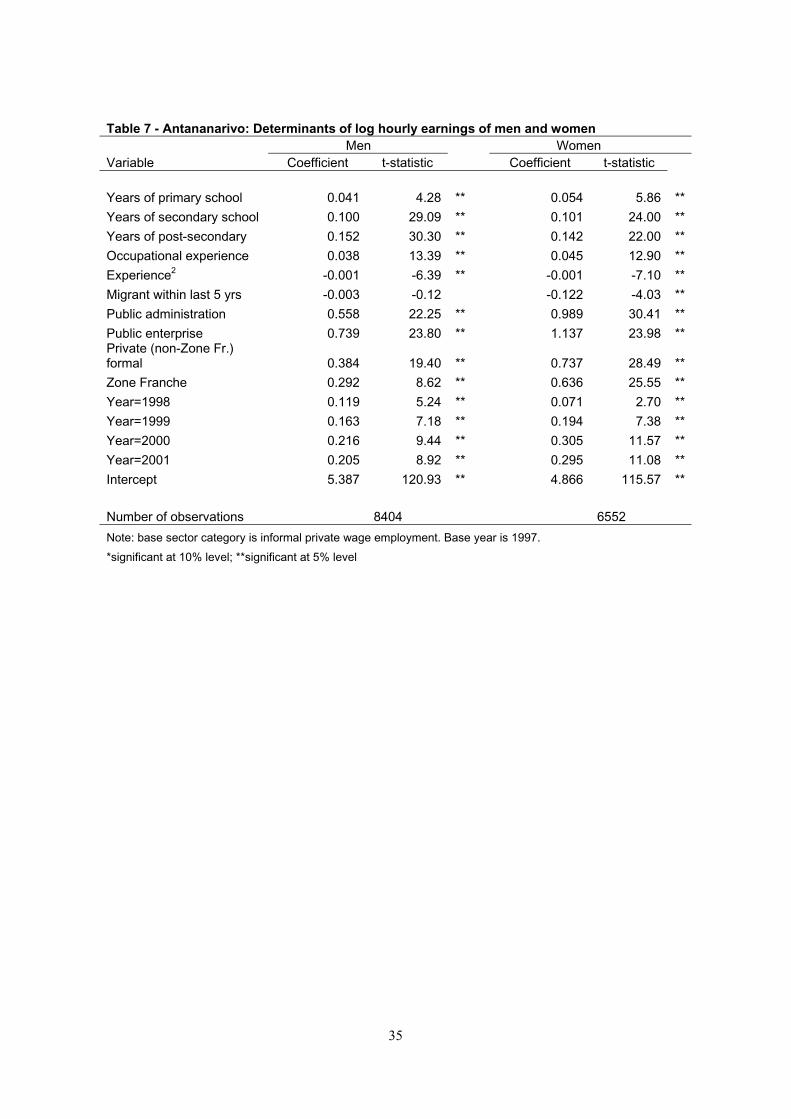
Table 7 - Antananarivo: Determinants of log hourly earnings of men and womenMen Women
Variable Coefficient t-statistic Coefficient t-statistic
Years of primary school 0.041 4.28 ** 0.054 5.86 **
Years of secondary school 0.100 29.09 ** 0.101 24.00 **
Years of post-secondary 0.152 30.30 ** 0.142 22.00 **
Occupational experience 0.038 13.39 ** 0.045 12.90 **
Experience2 -0.001 -6.39 ** -0.001 -7.10 **
Migrant within last 5 yrs -0.003 -0.12 -0.122 -4.03 **
Public administration 0.558 22.25 ** 0.989 30.41 **
Public enterprise 0.739 23.80 ** 1.137 23.98 **Private (non-Zone Fr.)formal 0.384 19.40 ** 0.737 28.49 **
Zone Franche 0.292 8.62 ** 0.636 25.55 **
Year=1998 0.119 5.24 ** 0.071 2.70 **
Year=1999 0.163 7.18 ** 0.194 7.38 **
Year=2000 0.216 9.44 ** 0.305 11.57 **
Year=2001 0.205 8.92 ** 0.295 11.08 **
Intercept 5.387 120.93 ** 4.866 115.57 **
Number of observations 8404 6552
Note: base sector category is informal private wage employment. Base year is 1997.
*significant at 10% level; **significant at 5% level
35
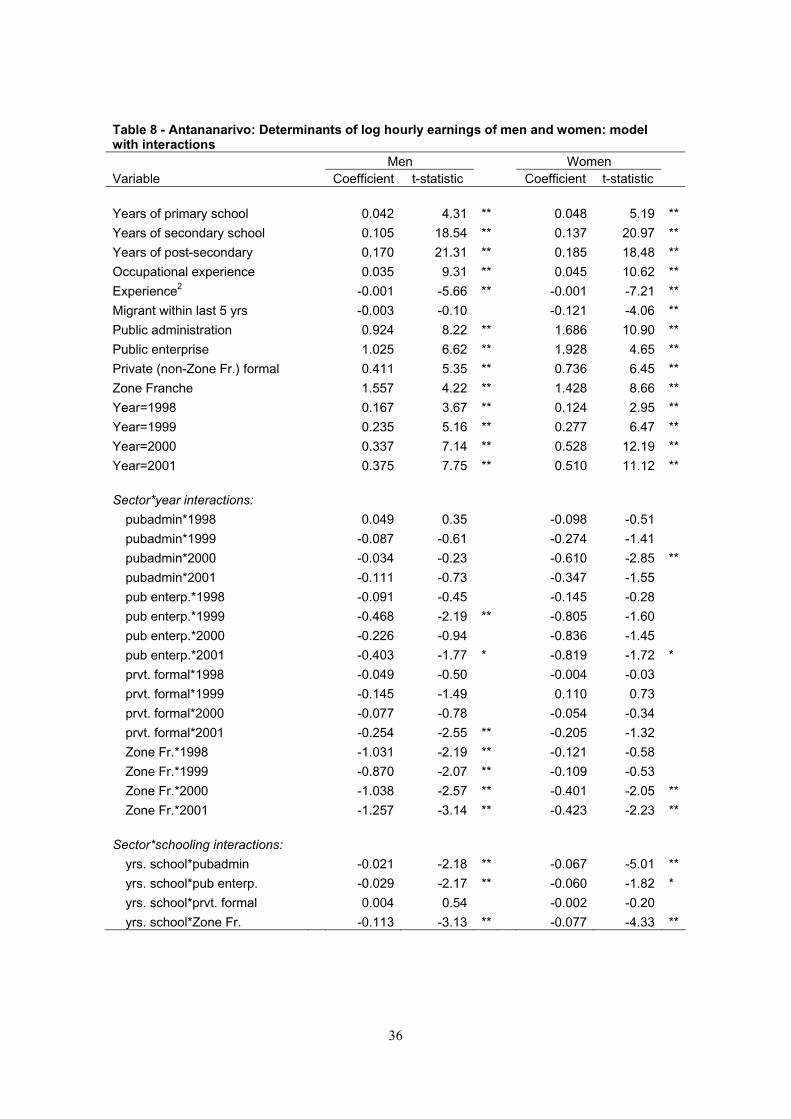
Table 8 - Antananarivo: Determinants of log hourly earnings of men and women: model with interactions
Men WomenVariable Coefficient t-statistic Coefficient t-statistic
Years of primary school 0.042 4.31 ** 0.048 5.19 **
Years of secondary school 0.105 18.54 ** 0.137 20.97 **
Years of post-secondary 0.170 21.31 ** 0.185 18.48 **
Occupational experience 0.035 9.31 ** 0.045 10.62 **
Experience2 -0.001 -5.66 ** -0.001 -7.21 **
Migrant within last 5 yrs -0.003 -0.10 -0.121 -4.06 **
Public administration 0.924 8.22 ** 1.686 10.90 **
Public enterprise 1.025 6.62 ** 1.928 4.65 **
Private (non-Zone Fr.) formal 0.411 5.35 ** 0.736 6.45 **
Zone Franche 1.557 4.22 ** 1.428 8.66 **
Year=1998 0.167 3.67 ** 0.124 2.95 **
Year=1999 0.235 5.16 ** 0.277 6.47 **
Year=2000 0.337 7.14 ** 0.528 12.19 **
Year=2001 0.375 7.75 ** 0.510 11.12 **
Sector*year interactions:
pubadmin*1998 0.049 0.35 -0.098 -0.51
pubadmin*1999 -0.087 -0.61 -0.274 -1.41
pubadmin*2000 -0.034 -0.23 -0.610 -2.85 **
pubadmin*2001 -0.111 -0.73 -0.347 -1.55
pub enterp.*1998 -0.091 -0.45 -0.145 -0.28
pub enterp.*1999 -0.468 -2.19 ** -0.805 -1.60
pub enterp.*2000 -0.226 -0.94 -0.836 -1.45
pub enterp.*2001 -0.403 -1.77 * -0.819 -1.72 *
prvt. formal*1998 -0.049 -0.50 -0.004 -0.03
prvt. formal*1999 -0.145 -1.49 0.110 0.73
prvt. formal*2000 -0.077 -0.78 -0.054 -0.34
prvt. formal*2001 -0.254 -2.55 ** -0.205 -1.32
Zone Fr.*1998 -1.031 -2.19 ** -0.121 -0.58
Zone Fr.*1999 -0.870 -2.07 ** -0.109 -0.53
Zone Fr.*2000 -1.038 -2.57 ** -0.401 -2.05 **
Zone Fr.*2001 -1.257 -3.14 ** -0.423 -2.23 **
Sector*schooling interactions:
yrs. school*pubadmin -0.021 -2.18 ** -0.067 -5.01 **
yrs. school*pub enterp. -0.029 -2.17 ** -0.060 -1.82 *
yrs. school*prvt. formal 0.004 0.54 -0.002 -0.20
yrs. school*Zone Fr. -0.113 -3.13 ** -0.077 -4.33 **
36
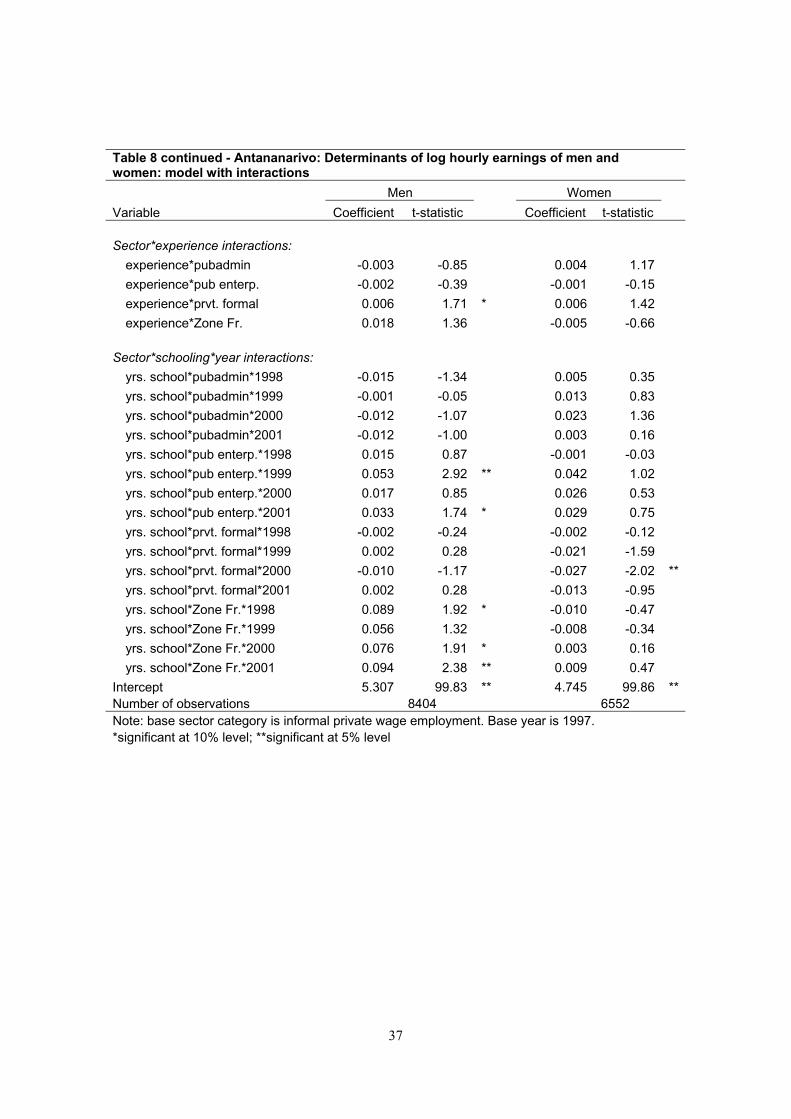
Table 8 continued - Antananarivo: Determinants of log hourly earnings of men and women: model with interactions
Men Women
Variable Coefficient t-statistic Coefficient t-statistic
Sector*experience interactions:
experience*pubadmin -0.003 -0.85 0.004 1.17
experience*pub enterp. -0.002 -0.39 -0.001 -0.15
experience*prvt. formal 0.006 1.71 * 0.006 1.42
experience*Zone Fr. 0.018 1.36 -0.005 -0.66
Sector*schooling*year interactions:
yrs. school*pubadmin*1998 -0.015 -1.34 0.005 0.35
yrs. school*pubadmin*1999 -0.001 -0.05 0.013 0.83
yrs. school*pubadmin*2000 -0.012 -1.07 0.023 1.36
yrs. school*pubadmin*2001 -0.012 -1.00 0.003 0.16
yrs. school*pub enterp.*1998 0.015 0.87 -0.001 -0.03
yrs. school*pub enterp.*1999 0.053 2.92 ** 0.042 1.02
yrs. school*pub enterp.*2000 0.017 0.85 0.026 0.53
yrs. school*pub enterp.*2001 0.033 1.74 * 0.029 0.75
yrs. school*prvt. formal*1998 -0.002 -0.24 -0.002 -0.12
yrs. school*prvt. formal*1999 0.002 0.28 -0.021 -1.59
yrs. school*prvt. formal*2000 -0.010 -1.17 -0.027 -2.02 **
yrs. school*prvt. formal*2001 0.002 0.28 -0.013 -0.95
yrs. school*Zone Fr.*1998 0.089 1.92 * -0.010 -0.47
yrs. school*Zone Fr.*1999 0.056 1.32 -0.008 -0.34
yrs. school*Zone Fr.*2000 0.076 1.91 * 0.003 0.16
yrs. school*Zone Fr.*2001 0.094 2.38 ** 0.009 0.47
Intercept 5.307 99.83 ** 4.745 99.86 **Number of observations 8404 6552Note: base sector category is informal private wage employment. Base year is 1997.*significant at 10% level; **significant at 5% level
37
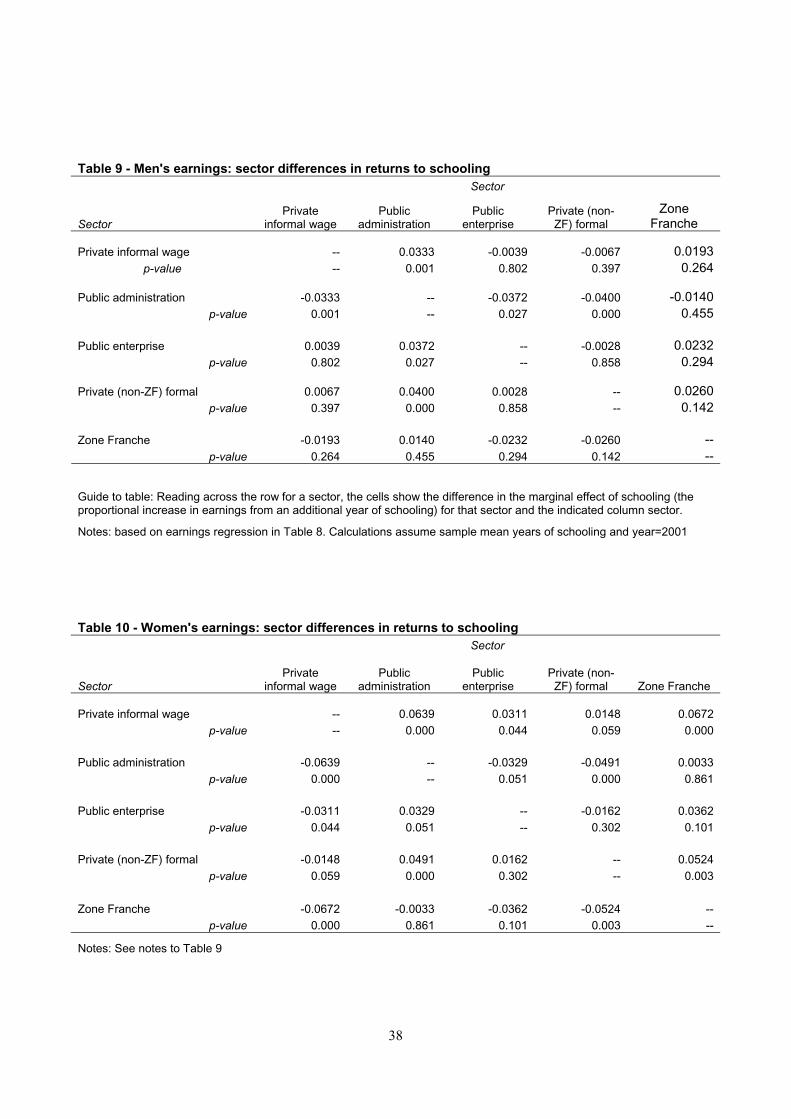
Table 9 - Men's earnings: sector differences in returns to schoolingSector
SectorPrivate
informal wagePublic
administrationPublic
enterprisePrivate (non-ZF) formal
ZoneFranche
Private informal wage -- 0.0333 -0.0039 -0.0067 0.0193p-value -- 0.001 0.802 0.397 0.264
Public administration -0.0333 -- -0.0372 -0.0400 -0.0140p-value 0.001 -- 0.027 0.000 0.455
Public enterprise 0.0039 0.0372 -- -0.0028 0.0232p-value 0.802 0.027 -- 0.858 0.294
Private (non-ZF) formal 0.0067 0.0400 0.0028 -- 0.0260p-value 0.397 0.000 0.858 -- 0.142
Zone Franche -0.0193 0.0140 -0.0232 -0.0260 --p-value 0.264 0.455 0.294 0.142 --
Guide to table: Reading across the row for a sector, the cells show the difference in the marginal effect of schooling (the proportional increase in earnings from an additional year of schooling) for that sector and the indicated column sector.
Notes: based on earnings regression in Table 8. Calculations assume sample mean years of schooling and year=2001
Table 10 - Women's earnings: sector differences in returns to schoolingSector
SectorPrivate
informal wagePublic
administrationPublic
enterprisePrivate (non-ZF) formal Zone Franche
Private informal wage -- 0.0639 0.0311 0.0148 0.0672p-value -- 0.000 0.044 0.059 0.000
Public administration -0.0639 -- -0.0329 -0.0491 0.0033p-value 0.000 -- 0.051 0.000 0.861
Public enterprise -0.0311 0.0329 -- -0.0162 0.0362p-value 0.044 0.051 -- 0.302 0.101
Private (non-ZF) formal -0.0148 0.0491 0.0162 -- 0.0524p-value 0.059 0.000 0.302 -- 0.003
Zone Franche -0.0672 -0.0033 -0.0362 -0.0524 --p-value 0.000 0.861 0.101 0.003 --
Notes: See notes to Table 9
38
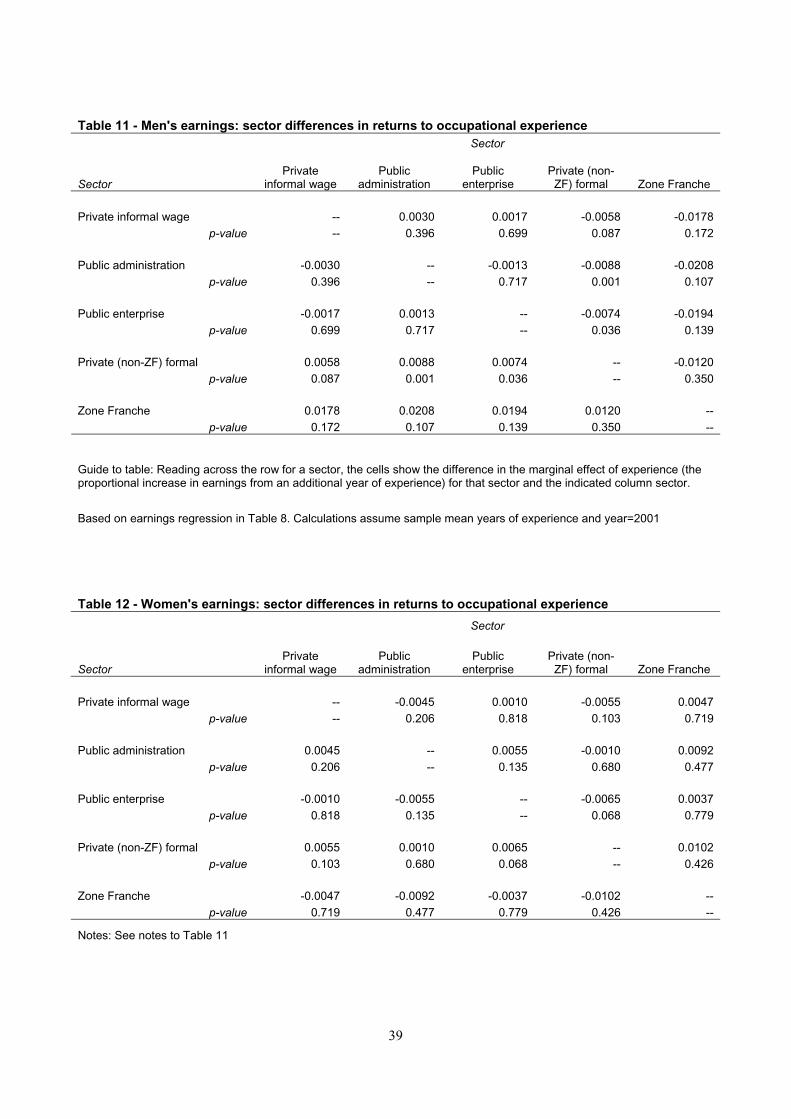
Table 11 - Men's earnings: sector differences in returns to occupational experienceSector
SectorPrivate
informal wagePublic
administrationPublic
enterprisePrivate (non-ZF) formal Zone Franche
Private informal wage -- 0.0030 0.0017 -0.0058 -0.0178p-value -- 0.396 0.699 0.087 0.172
Public administration -0.0030 -- -0.0013 -0.0088 -0.0208p-value 0.396 -- 0.717 0.001 0.107
Public enterprise -0.0017 0.0013 -- -0.0074 -0.0194p-value 0.699 0.717 -- 0.036 0.139
Private (non-ZF) formal 0.0058 0.0088 0.0074 -- -0.0120p-value 0.087 0.001 0.036 -- 0.350
Zone Franche 0.0178 0.0208 0.0194 0.0120 --p-value 0.172 0.107 0.139 0.350 --
Guide to table: Reading across the row for a sector, the cells show the difference in the marginal effect of experience (theproportional increase in earnings from an additional year of experience) for that sector and the indicated column sector.
Based on earnings regression in Table 8. Calculations assume sample mean years of experience and year=2001
Table 12 - Women's earnings: sector differences in returns to occupational experience
Sector
SectorPrivate
informal wagePublic
administrationPublic
enterprisePrivate (non-ZF) formal Zone Franche
Private informal wage -- -0.0045 0.0010 -0.0055 0.0047p-value -- 0.206 0.818 0.103 0.719
Public administration 0.0045 -- 0.0055 -0.0010 0.0092p-value 0.206 -- 0.135 0.680 0.477
Public enterprise -0.0010 -0.0055 -- -0.0065 0.0037p-value 0.818 0.135 -- 0.068 0.779
Private (non-ZF) formal 0.0055 0.0010 0.0065 -- 0.0102p-value 0.103 0.680 0.068 -- 0.426
Zone Franche -0.0047 -0.0092 -0.0037 -0.0102 --p-value 0.719 0.477 0.779 0.426 --
Notes: See notes to Table 11
39
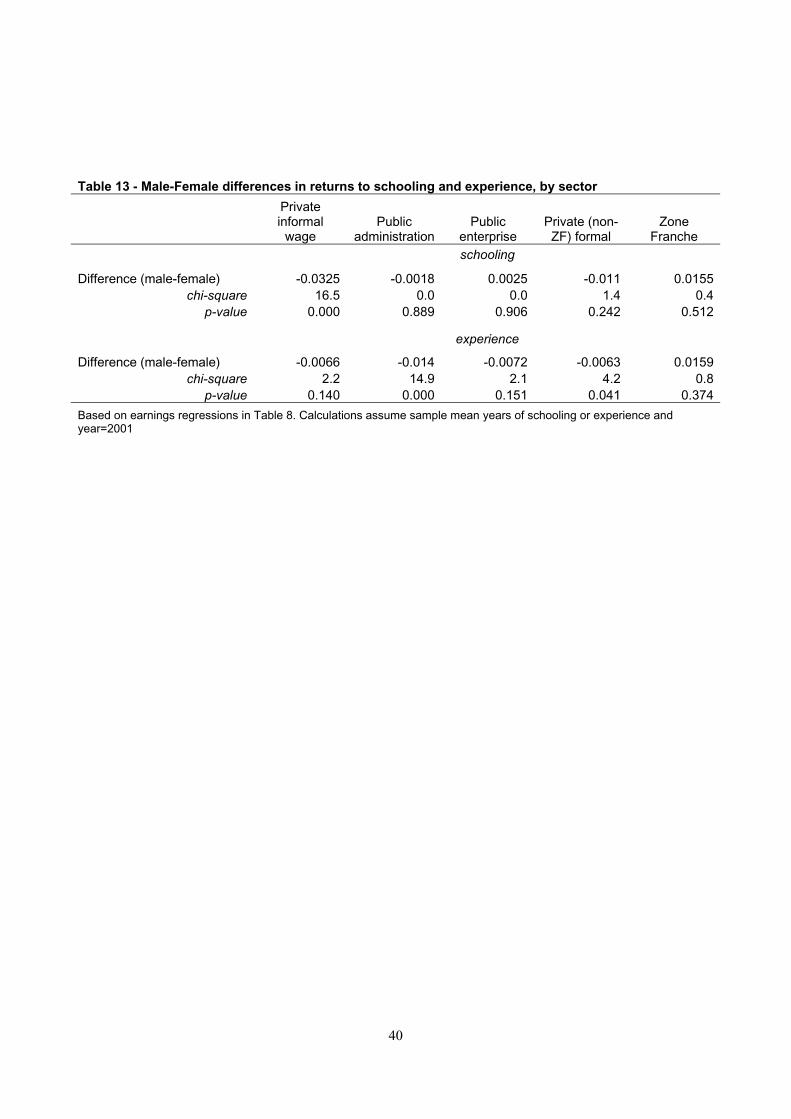
Table 13 - Male-Female differences in returns to schooling and experience, by sector
Privateinformal
wagePublic
administrationPublic
enterprisePrivate (non-
ZF) formalZone
Francheschooling
Difference (male-female) -0.0325 -0.0018 0.0025 -0.011 0.0155chi-square 16.5 0.0 0.0 1.4 0.4
p-value 0.000 0.889 0.906 0.242 0.512
experience
Difference (male-female) -0.0066 -0.014 -0.0072 -0.0063 0.0159chi-square 2.2 14.9 2.1 4.2 0.8
p-value 0.140 0.000 0.151 0.041 0.374
Based on earnings regressions in Table 8. Calculations assume sample mean years of schooling or experience andyear=2001
40
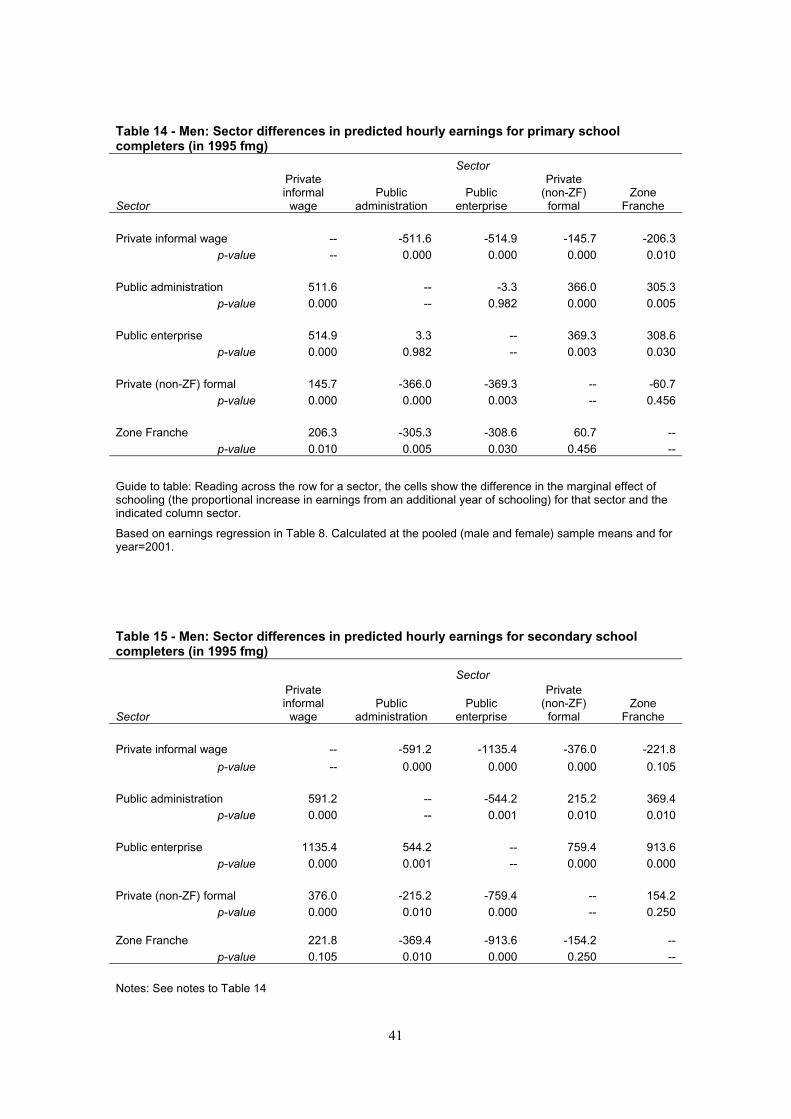
Table 14 - Men: Sector differences in predicted hourly earnings for primary school completers (in 1995 fmg)
Sector
Sector
Privateinformal
wagePublic
administrationPublic
enterprise
Private(non-ZF)formal
ZoneFranche
Private informal wage -- -511.6 -514.9 -145.7 -206.3p-value -- 0.000 0.000 0.000 0.010
Public administration 511.6 -- -3.3 366.0 305.3p-value 0.000 -- 0.982 0.000 0.005
Public enterprise 514.9 3.3 -- 369.3 308.6p-value 0.000 0.982 -- 0.003 0.030
Private (non-ZF) formal 145.7 -366.0 -369.3 -- -60.7p-value 0.000 0.000 0.003 -- 0.456
Zone Franche 206.3 -305.3 -308.6 60.7 --p-value 0.010 0.005 0.030 0.456 --
Guide to table: Reading across the row for a sector, the cells show the difference in the marginal effect of schooling (the proportional increase in earnings from an additional year of schooling) for that sector and the indicated column sector.
Based on earnings regression in Table 8. Calculated at the pooled (male and female) sample means and for year=2001.
Table 15 - Men: Sector differences in predicted hourly earnings for secondary school completers (in 1995 fmg)
Sector
Sector
Privateinformal
wagePublic
administrationPublic
enterprise
Private(non-ZF)formal
ZoneFranche
Private informal wage -- -591.2 -1135.4 -376.0 -221.8
p-value -- 0.000 0.000 0.000 0.105
Public administration 591.2 -- -544.2 215.2 369.4p-value 0.000 -- 0.001 0.010 0.010
Public enterprise 1135.4 544.2 -- 759.4 913.6p-value 0.000 0.001 -- 0.000 0.000
Private (non-ZF) formal 376.0 -215.2 -759.4 -- 154.2p-value 0.000 0.010 0.000 -- 0.250
Zone Franche 221.8 -369.4 -913.6 -154.2 --p-value 0.105 0.010 0.000 0.250 --
Notes: See notes to Table 14
41
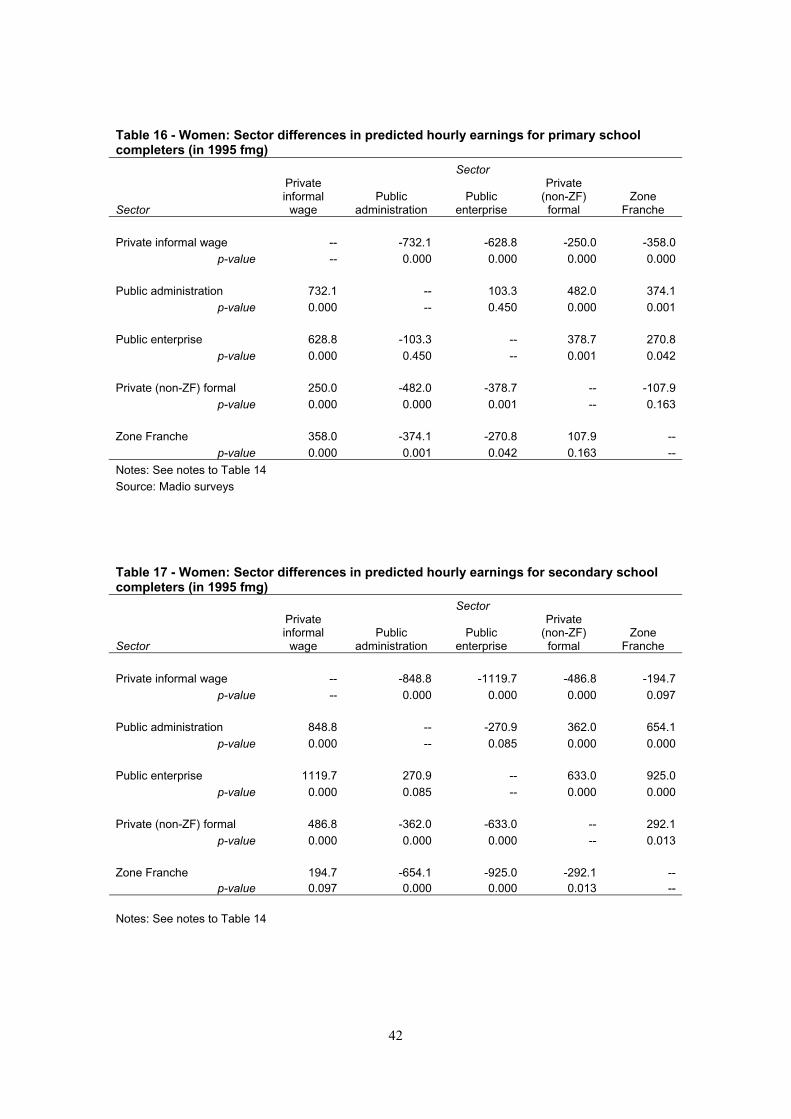
Table 16 - Women: Sector differences in predicted hourly earnings for primary school completers (in 1995 fmg)
Sector
Sector
Privateinformal
wagePublic
administrationPublic
enterprise
Private(non-ZF)formal
ZoneFranche
Private informal wage -- -732.1 -628.8 -250.0 -358.0p-value -- 0.000 0.000 0.000 0.000
Public administration 732.1 -- 103.3 482.0 374.1p-value 0.000 -- 0.450 0.000 0.001
Public enterprise 628.8 -103.3 -- 378.7 270.8p-value 0.000 0.450 -- 0.001 0.042
Private (non-ZF) formal 250.0 -482.0 -378.7 -- -107.9p-value 0.000 0.000 0.001 -- 0.163
Zone Franche 358.0 -374.1 -270.8 107.9 --p-value 0.000 0.001 0.042 0.163 --
Notes: See notes to Table 14Source: Madio surveys
Table 17 - Women: Sector differences in predicted hourly earnings for secondary school completers (in 1995 fmg)
Sector
Sector
Privateinformal
wagePublic
administrationPublic
enterprise
Private(non-ZF)formal
ZoneFranche
Private informal wage -- -848.8 -1119.7 -486.8 -194.7p-value -- 0.000 0.000 0.000 0.097
Public administration 848.8 -- -270.9 362.0 654.1p-value 0.000 -- 0.085 0.000 0.000
Public enterprise 1119.7 270.9 -- 633.0 925.0p-value 0.000 0.085 -- 0.000 0.000
Private (non-ZF) formal 486.8 -362.0 -633.0 -- 292.1p-value 0.000 0.000 0.000 -- 0.013
Zone Franche 194.7 -654.1 -925.0 -292.1 --p-value 0.097 0.000 0.000 0.013 --
Notes: See notes to Table 14
42
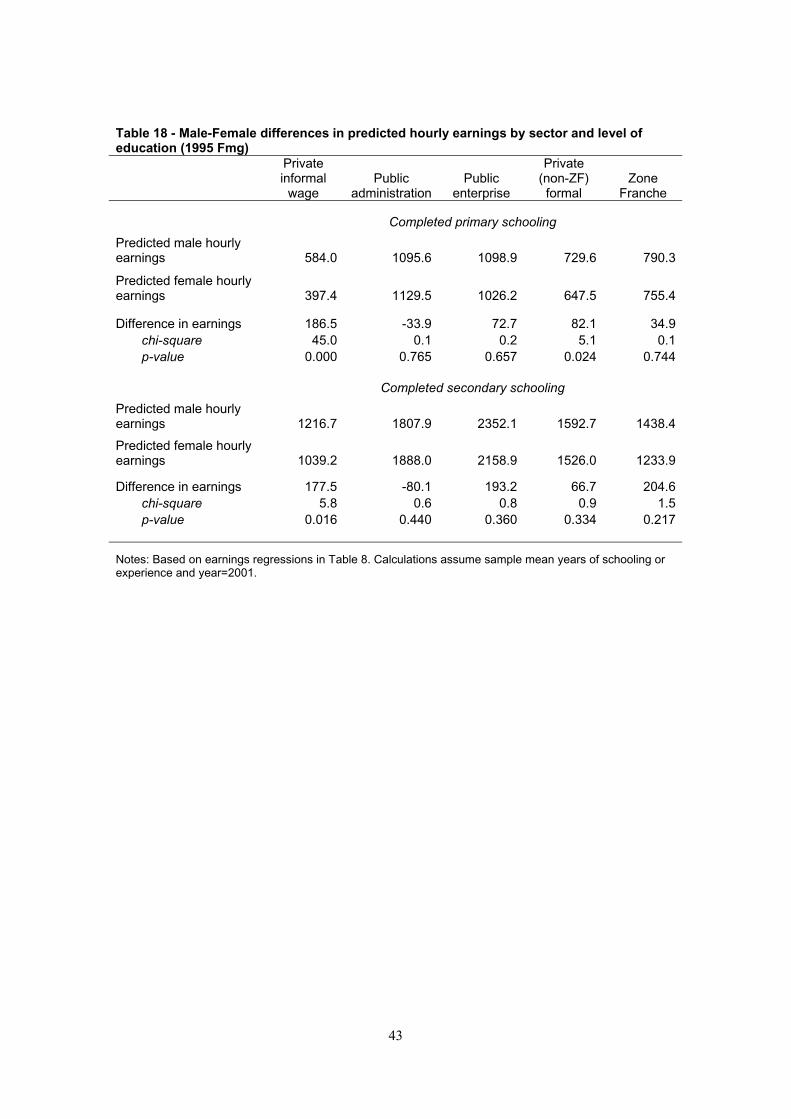
Table 18 - Male-Female differences in predicted hourly earnings by sector and level of education (1995 Fmg)
Privateinformal
wagePublic
administrationPublic
enterprise
Private(non-ZF)formal
ZoneFranche
Completed primary schooling
Predicted male hourly earnings 584.0 1095.6 1098.9 729.6 790.3
Predicted female hourlyearnings 397.4 1129.5 1026.2 647.5 755.4
Difference in earnings 186.5 -33.9 72.7 82.1 34.9chi-square 45.0 0.1 0.2 5.1 0.1p-value 0.000 0.765 0.657 0.024 0.744
Completed secondary schooling
Predicted male hourly earnings 1216.7 1807.9 2352.1 1592.7 1438.4
Predicted female hourlyearnings 1039.2 1888.0 2158.9 1526.0 1233.9
Difference in earnings 177.5 -80.1 193.2 66.7 204.6chi-square 5.8 0.6 0.8 0.9 1.5p-value 0.016 0.440 0.360 0.334 0.217
Notes: Based on earnings regressions in Table 8. Calculations assume sample mean years of schooling or experience and year=2001.
43

Table 19 - Antananarivo: Job benefits/characteristics by sector, 2001
Benefit or characteristicPublic
administrationPublic
enterprises
Privateformal
(non-ZoneFr.)
ZoneFranche
Privateinformal
wage
Entitled to paid leave (%) 0.85 0.81 0.52 0.79 0.08Recieves health care benefits(%) 0.64 0.78 0.46 0.83 0.12
Union present in workplace (%) 0.44 0.59 0.16 0.42 0.00
Belongs to union (%) 0.18 0.39 0.08 0.13 0.00Has 'continuous' employment(%) 0.99 0.93 0.95 1.00 0.81
Has employment contract (%) 0.97 0.92 0.68 0.93 0.11
Hours of work per month (mean) 161 172 187 211 180
Source: 1-2-3 surveys
44
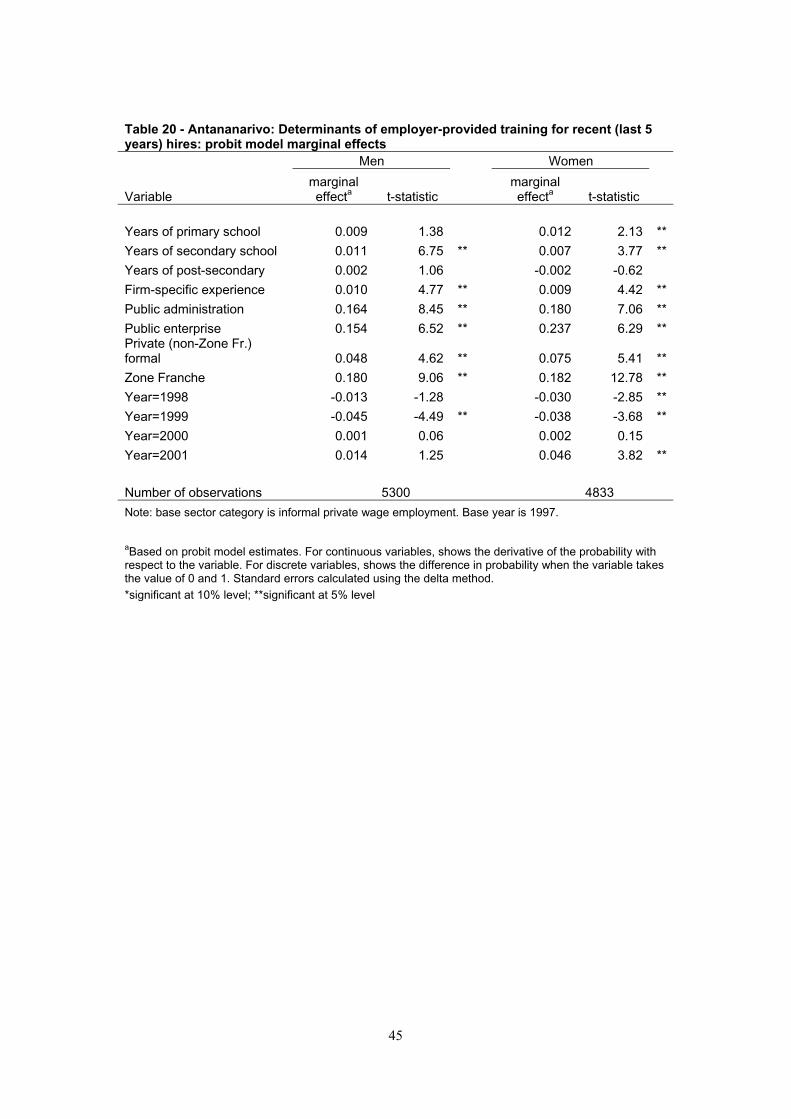
Table 20 - Antananarivo: Determinants of employer-provided training for recent (last 5 years) hires: probit model marginal effects
Men Women
Variablemarginaleffecta t-statistic
marginaleffecta t-statistic
Years of primary school 0.009 1.38 0.012 2.13 **
Years of secondary school 0.011 6.75 ** 0.007 3.77 **
Years of post-secondary 0.002 1.06 -0.002 -0.62
Firm-specific experience 0.010 4.77 ** 0.009 4.42 **
Public administration 0.164 8.45 ** 0.180 7.06 **
Public enterprise 0.154 6.52 ** 0.237 6.29 **Private (non-Zone Fr.)formal 0.048 4.62 ** 0.075 5.41 **
Zone Franche 0.180 9.06 ** 0.182 12.78 **
Year=1998 -0.013 -1.28 -0.030 -2.85 **
Year=1999 -0.045 -4.49 ** -0.038 -3.68 **
Year=2000 0.001 0.06 0.002 0.15
Year=2001 0.014 1.25 0.046 3.82 **
Number of observations 5300 4833
Note: base sector category is informal private wage employment. Base year is 1997.
aBased on probit model estimates. For continuous variables, shows the derivative of the probability withrespect to the variable. For discrete variables, shows the difference in probability when the variable takesthe value of 0 and 1. Standard errors calculated using the delta method.*significant at 10% level; **significant at 5% level
45
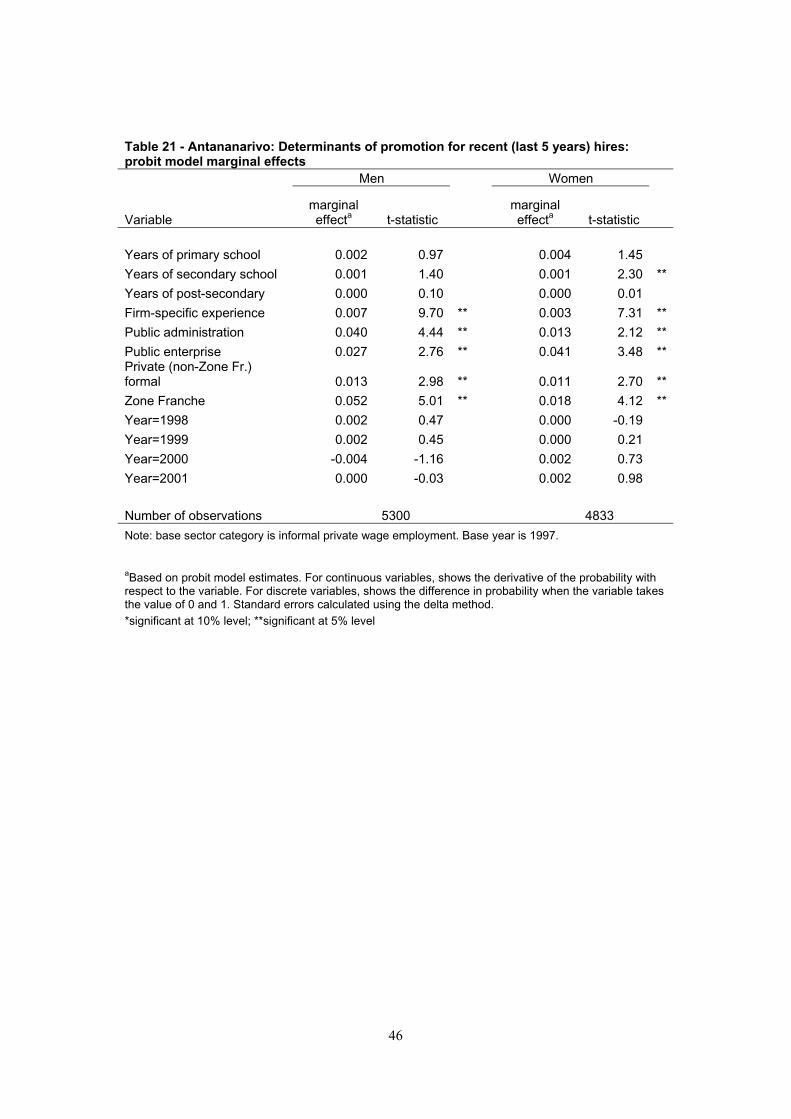
Table 21 - Antananarivo: Determinants of promotion for recent (last 5 years) hires: probit model marginal effects
Men Women
Variablemarginaleffecta t-statistic
marginaleffecta t-statistic
Years of primary school 0.002 0.97 0.004 1.45
Years of secondary school 0.001 1.40 0.001 2.30 **
Years of post-secondary 0.000 0.10 0.000 0.01
Firm-specific experience 0.007 9.70 ** 0.003 7.31 **
Public administration 0.040 4.44 ** 0.013 2.12 **
Public enterprise 0.027 2.76 ** 0.041 3.48 **Private (non-Zone Fr.)formal 0.013 2.98 ** 0.011 2.70 **
Zone Franche 0.052 5.01 ** 0.018 4.12 **
Year=1998 0.002 0.47 0.000 -0.19
Year=1999 0.002 0.45 0.000 0.21
Year=2000 -0.004 -1.16 0.002 0.73
Year=2001 0.000 -0.03 0.002 0.98
Number of observations 5300 4833
Note: base sector category is informal private wage employment. Base year is 1997.
aBased on probit model estimates. For continuous variables, shows the derivative of the probability withrespect to the variable. For discrete variables, shows the difference in probability when the variable takesthe value of 0 and 1. Standard errors calculated using the delta method.*significant at 10% level; **significant at 5% level
46