Embed Size (px)
Citation preview
Export Potential Analysis of Thailand to determine the 10 most potential product groups
for international trading with TurkeySeptember 2014
PART 1.0. Introduction 04
1.1. Background 05
1.2. Objective of Study 06
1.3. Methodology 07
1.4. Data Resources 10
1.5. Harmonized System Code (HS) 11
1.6. Glossary 12
PART 2.0. Country Backgrounds 14
2.1. Thailand 15
2.2. Turkey 17
2.3. Global Competitiveness 19
2.4. Globally Accepted Comparative Indicators & Rankings 20
PART 3.0. Thailand & Turkey – Trade Relation 21
3.1. Thailand & Turkey – Bilateral Trading Development of 2009-2013 Period 22
PART 4.0. Assessment of Current Trade Opportunities between Thailand and Turkey 23
4.1. Current Export Potential Assessment of Thailand 25
4.2. Current Market Share and Volume Gap Analysis 27
4.3. Product Diversification Gap Analysis 29
PART 5.0. Assessment of Most Potential Products for Future Export Growth in Turkey 29
5.1. Export Potential Assessment of Thailand – Export Potential Analysis 31
5.2. Initial Results of Most Potential Product Groups 35
5.3. Selection 40
PART 6.0. Trade Indicators of The Most Potential Product Groups 42
PART 7.0. Conclusion 61
CONTENT

INTRODUCTION
PART
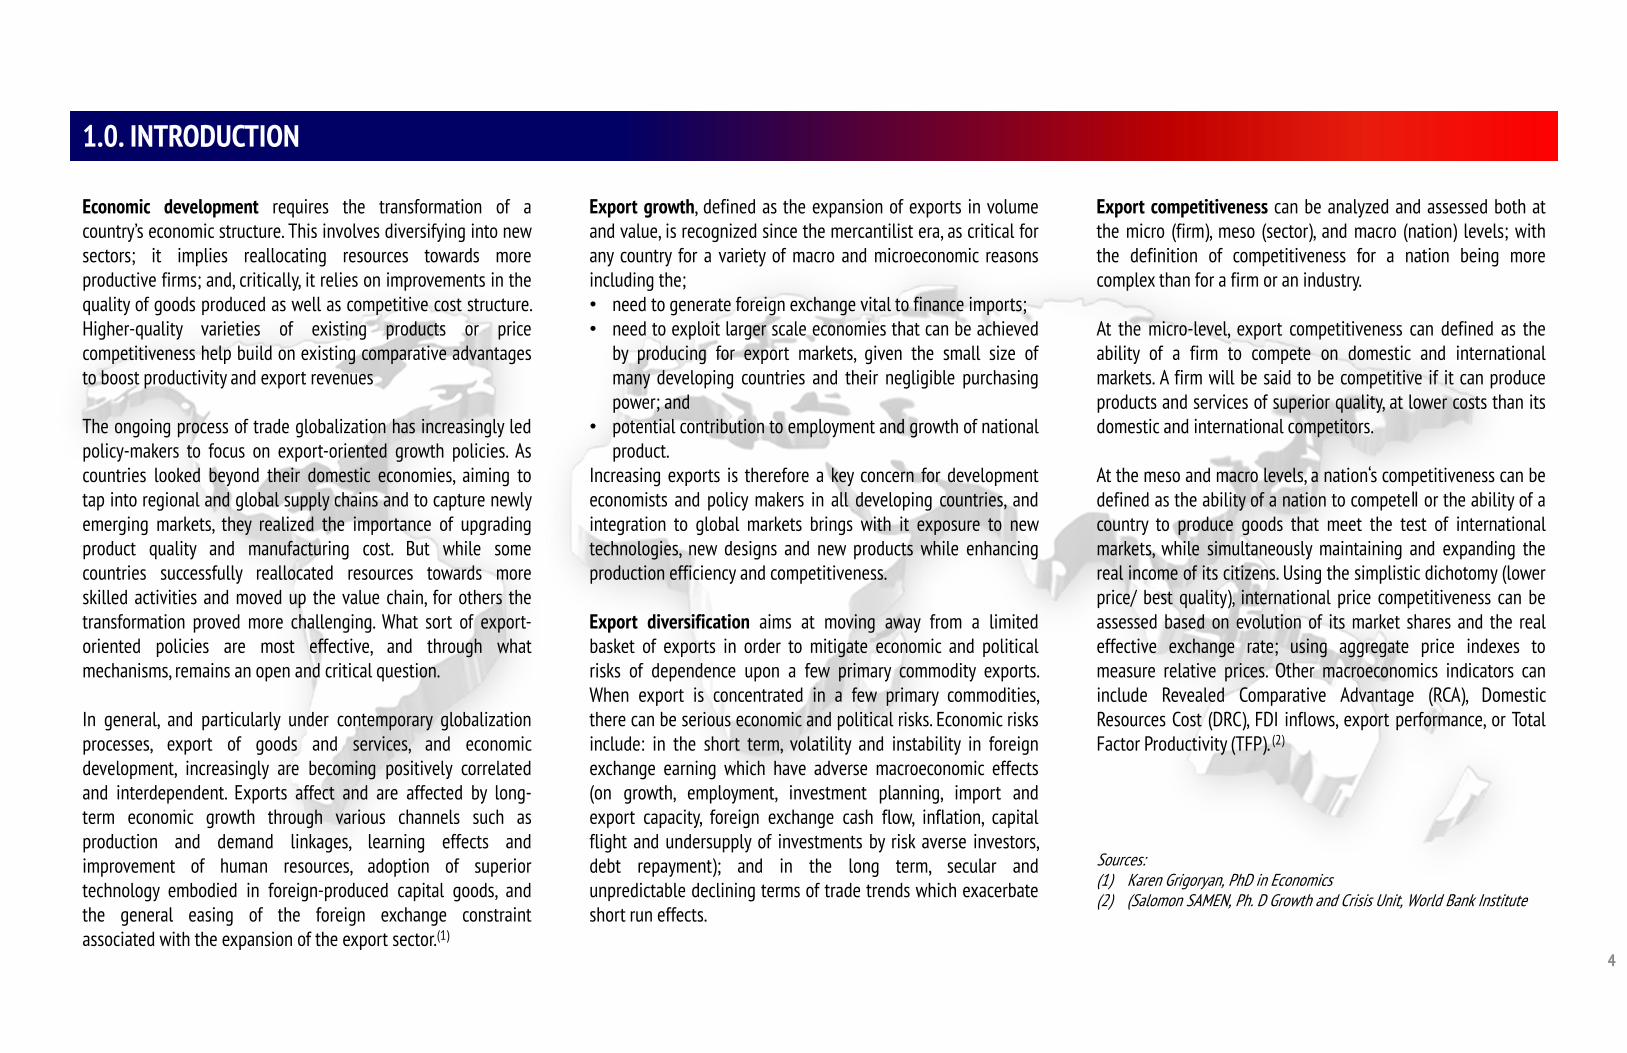
Economic development requires the transformation of acountry’s economic structure. This involves diversifying into newsectors; it implies reallocating resources towards moreproductive firms; and, critically, it relies on improvements in thequality of goods produced as well as competitive cost structure.Higher-quality varieties of existing products or pricecompetitiveness help build on existing comparative advantagesto boost productivity and export revenues
The ongoing process of trade globalization has increasingly ledpolicy-makers to focus on export-oriented growth policies. Ascountries looked beyond their domestic economies, aiming totap into regional and global supply chains and to capture newlyemerging markets, they realized the importance of upgradingproduct quality and manufacturing cost. But while somecountries successfully reallocated resources towards moreskilled activities and moved up the value chain, for others thetransformation proved more challenging. What sort of export-oriented policies are most effective, and through whatmechanisms, remains an open and critical question.
In general, and particularly under contemporary globalizationprocesses, export of goods and services, and economicdevelopment, increasingly are becoming positively correlatedand interdependent. Exports affect and are affected by long-term economic growth through various channels such asproduction and demand linkages, learning effects andimprovement of human resources, adoption of superiortechnology embodied in foreign-produced capital goods, andthe general easing of the foreign exchange constraintassociated with the expansion of the export sector.(1)
Export competitiveness can be analyzed and assessed both atthe micro (firm), meso (sector), and macro (nation) levels; withthe definition of competitiveness for a nation being morecomplex than for a firm or an industry.
At the micro-level, export competitiveness can defined as theability of a firm to compete on domestic and internationalmarkets. A firm will be said to be competitive if it can produceproducts and services of superior quality, at lower costs than itsdomestic and international competitors.
At the meso and macro levels, a nation‘s competitiveness can bedefined as the ability of a nation to competeǁ or the ability of acountry to produce goods that meet the test of internationalmarkets, while simultaneously maintaining and expanding thereal income of its citizens. Using the simplistic dichotomy (lowerprice/ best quality), international price competitiveness can beassessed based on evolution of its market shares and the realeffective exchange rate; using aggregate price indexes tomeasure relative prices. Other macroeconomics indicators caninclude Revealed Comparative Advantage (RCA), DomesticResources Cost (DRC), FDI inflows, export performance, or TotalFactor Productivity (TFP). (2)
Sources:(1) Karen Grigoryan, PhD in Economics(2) (Salomon SAMEN, Ph. D Growth and Crisis Unit, World Bank Institute
Export growth, defined as the expansion of exports in volumeand value, is recognized since the mercantilist era, as critical forany country for a variety of macro and microeconomic reasonsincluding the;• need to generate foreign exchange vital to finance imports;• need to exploit larger scale economies that can be achieved
by producing for export markets, given the small size ofmany developing countries and their negligible purchasingpower; and
• potential contribution to employment and growth of nationalproduct.
Increasing exports is therefore a key concern for developmenteconomists and policy makers in all developing countries, andintegration to global markets brings with it exposure to newtechnologies, new designs and new products while enhancingproduction efficiency and competitiveness.
Export diversification aims at moving away from a limitedbasket of exports in order to mitigate economic and politicalrisks of dependence upon a few primary commodity exports.When export is concentrated in a few primary commodities,there can be serious economic and political risks. Economic risksinclude: in the short term, volatility and instability in foreignexchange earning which have adverse macroeconomic effects(on growth, employment, investment planning, import andexport capacity, foreign exchange cash flow, inflation, capitalflight and undersupply of investments by risk averse investors,debt repayment); and in the long term, secular andunpredictable declining terms of trade trends which exacerbateshort run effects.
1.0. INTRODUCTION
4
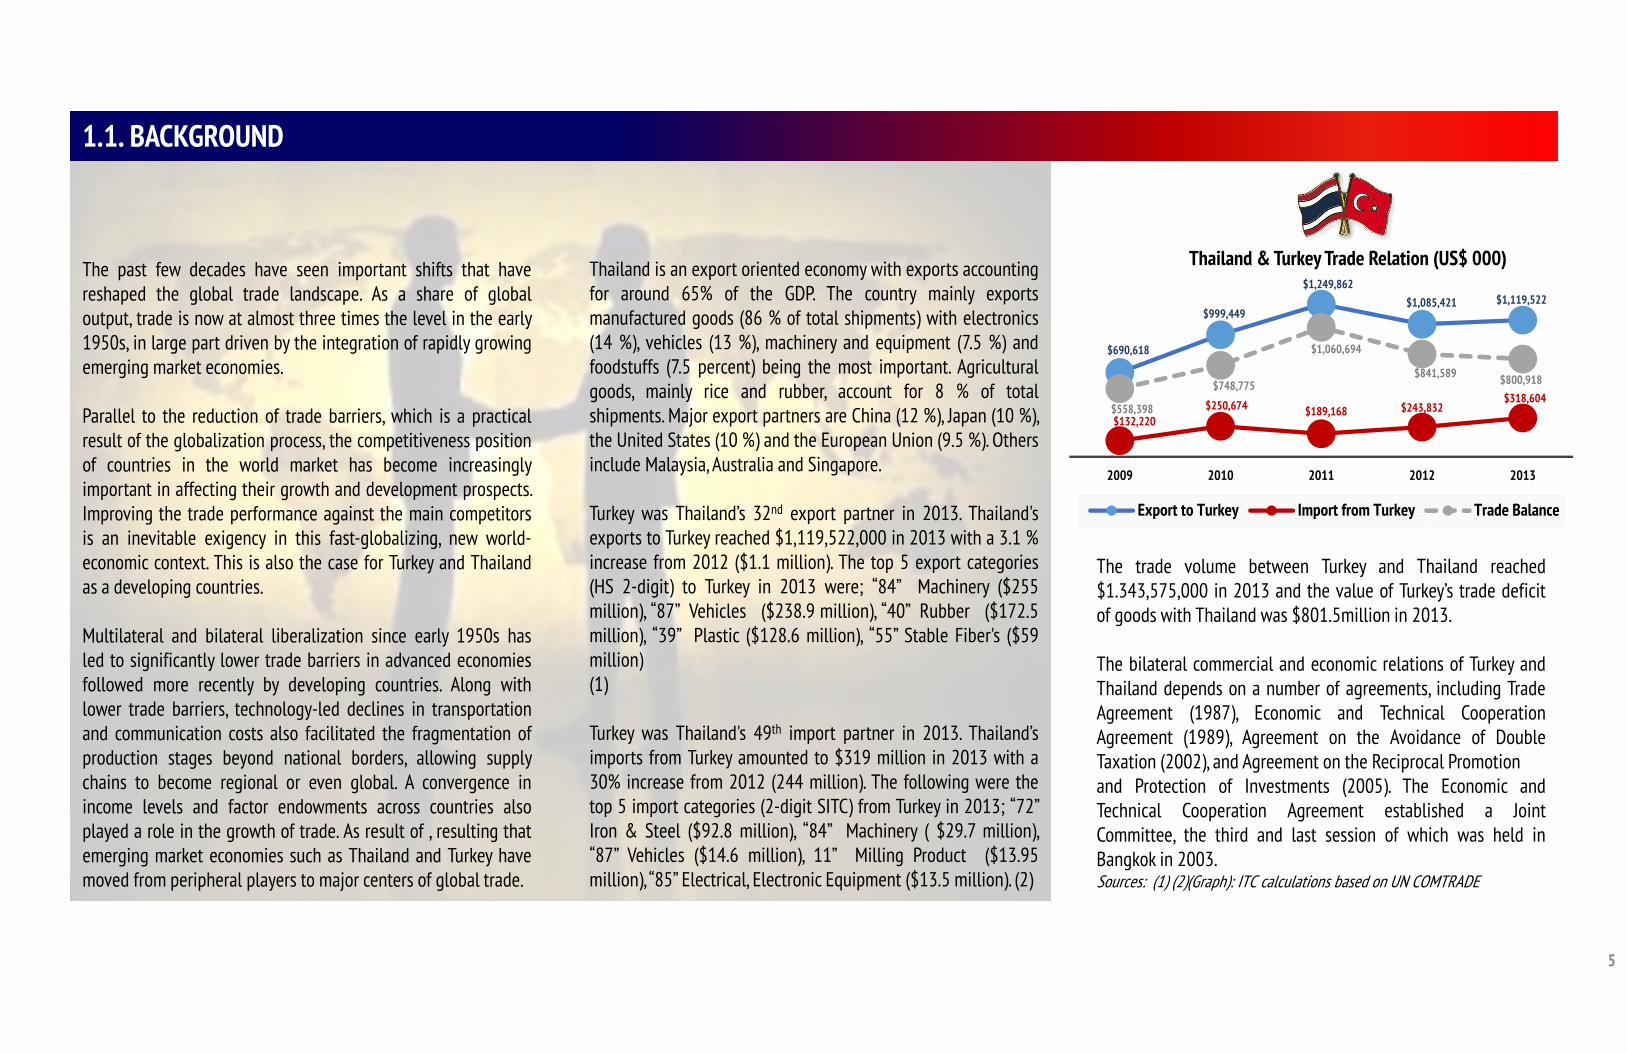
Thailand is an export oriented economy with exports accountingfor around 65% of the GDP. The country mainly exportsmanufactured goods (86 % of total shipments) with electronics(14 %), vehicles (13 %), machinery and equipment (7.5 %) andfoodstuffs (7.5 percent) being the most important. Agriculturalgoods, mainly rice and rubber, account for 8 % of totalshipments. Major export partners are China (12 %), Japan (10 %),the United States (10 %) and the European Union (9.5 %). Othersinclude Malaysia, Australia and Singapore.
Turkey was Thailand’s 32nd export partner in 2013. Thailand'sexports to Turkey reached $1,119,522,000 in 2013 with a 3.1 %increase from 2012 ($1.1 million). The top 5 export categories(HS 2-digit) to Turkey in 2013 were; “84” Machinery ($255million), “87” Vehicles ($238.9 million), “40” Rubber ($172.5million), “39” Plastic ($128.6 million), “55” Stable Fiber's ($59million)(1)
Turkey was Thailand's 49th import partner in 2013. Thailand’simports from Turkey amounted to $319 million in 2013 with a30% increase from 2012 (244 million). The following were thetop 5 import categories (2-digit SITC) from Turkey in 2013; “72”Iron & Steel ($92.8 million), “84” Machinery ( $29.7 million),“87” Vehicles ($14.6 million), 11” Milling Product ($13.95million),“85” Electrical, Electronic Equipment ($13.5 million). (2)
The past few decades have seen important shifts that havereshaped the global trade landscape. As a share of globaloutput, trade is now at almost three times the level in the early1950s, in large part driven by the integration of rapidly growingemerging market economies.
Parallel to the reduction of trade barriers, which is a practicalresult of the globalization process, the competitiveness positionof countries in the world market has become increasinglyimportant in affecting their growth and development prospects.Improving the trade performance against the main competitorsis an inevitable exigency in this fast-globalizing, new world-economic context. This is also the case for Turkey and Thailandas a developing countries.
Multilateral and bilateral liberalization since early 1950s hasled to significantly lower trade barriers in advanced economiesfollowed more recently by developing countries. Along withlower trade barriers, technology-led declines in transportationand communication costs also facilitated the fragmentation ofproduction stages beyond national borders, allowing supplychains to become regional or even global. A convergence inincome levels and factor endowments across countries alsoplayed a role in the growth of trade. As result of , resulting thatemerging market economies such as Thailand and Turkey havemoved from peripheral players to major centers of global trade.
The trade volume between Turkey and Thailand reached$1.343,575,000 in 2013 and the value of Turkey’s trade deficitof goods with Thailand was $801.5million in 2013.
The bilateral commercial and economic relations of Turkey andThailand depends on a number of agreements, including TradeAgreement (1987), Economic and Technical CooperationAgreement (1989), Agreement on the Avoidance of DoubleTaxation (2002), and Agreement on the Reciprocal Promotionand Protection of Investments (2005). The Economic andTechnical Cooperation Agreement established a JointCommittee, the third and last session of which was held inBangkok in 2003.Sources: (1) (2)(Graph): ITC calculations based on UN COMTRADE
1.1. BACKGROUND
5
$690,618
$999,449
$1,249,862 $1,085,421 $1,119,522
$132,220 $250,674 $189,168 $243,832
$318,604 $558,398
$748,775
$1,060,694
$841,589 $800,918
2009 2010 2011 2012 2013
Thailand & Turkey Trade Relation (US$ 000)
Export to Turkey Import from Turkey Trade Balance
6
1.2. OBJECTIVE OF THE STUDY
Every research project should have a defined and explicitobjective which clearly states why the research is being carriedout. All other aspects of planning and carrying out the researchflow from this objective.
One of the key challenges for countries and companiesdeveloping their export markets is “what to sell” and “where tosell” decisions. Particularly in choosing the most suitableproduct and target country combination require solid knowledgeof export market potential and competitiveness of homeindustry.
At this stage, especially mid-small size companies expecteffective guidance and fact based encouragement from theirinstitutions to overcome lack of market and non-market issuesof target country. Initial assessment of export market requiremore detailed information then basic statistical indicators at theevaluation stage in getting exporting off the ground, such asincreasing your familiarization with the export market,developing your products/services to meet customer needs,determining your distribution, pricing and promotion strategiesand dealing with freight and other exporting practicalities.
This study aims to investigate Turkish market to provide Thaientrepreneurs with an actionable information regarding highexport potential products of Thailand for Turkey. Thai businesspeople whom already decided to pursue export opportunitiesbased on their company’s key capabilities, strengths andweaknesses will benefit from this study to start evaluatingopportunities in Turkey for most potential products for export.
This study is designed for small to medium-sized businesseswhom have assessed their readiness to export and are ready toplan their export strategies for Turkish market. It providesleading indicators for most potential product groups within theframework of Thailand's competitive and comparativeadvantages. Thai companies, having gathered the researchfindings on most potential product groups, can then start tonarrow down the list of potential products to achieve the mostsuitable portfolio to activate the export practices and expandlater. At this point, you can undertake more intensiveassessment, and complete the evaluation of exportopportunities for Turkey. On the basis of this analysis Thaiexporters should be able to gauge the gap between theircurrent capabilities and Turkish market potential.
This study will address the requirement of the first step that isto find out whether your products have any potential for Turkishmarket and to assess the strength of your competitors. Thisstudy will conclude the most potential product categories ofThailand based on the scientific methodology of “ExportPotential Assessment” and 5 years of export and import data ofThailand and Turkey.
Following the finding of “what can be sold”, Thai entrepreneurswill encounter legal, financial, market entry, local partneringand logistical challenges. The Royal Thai Government aims topromote a disciplined, professional approach from the startthat will help export community overcome these challenges.Exporting can then develop into a highly profitable newphase of growth.
Business Community of Thailand and export promotinginstitutions will need clear and accurate information about thevarious political, economic and cultural factors that willpotentially affect their operations in Turkish market. Somefactors to consider include:
Geographical Factors• country, state, region, time zones, urban/rural location
logistical considerations e.g. freight and distributionchannels,
• economic, political, and legal environmental factors,• regulations including quarantine, labelling standards,
standards and consumer protection rules, duties, taxes.Demographic Factors• Age, gender, income, family structure, occupation, cultural
beliefs.Market Factors• market size, availability of local manufacturers, agents,
distributors and suppliers• competition analysis major competitors, similar products, key
brands• market characteristicsConsequently, understanding a market’s key characteristicsrequires gathering a broad range of primary and secondaryresearch.
7
1.3. METHODOLOGY
Diversifying the economy and broadening the export basetowards high-growth and high-employment-growth sectors iscritical for future development and poverty alleviation in manydeveloping countries. Governments often need to complementgeneral (“horizontal”) policies that improve the overall businessenvironment by more targeted, sector-specific policies.
Identifying sectors on which to put priority is necessary for asound allocation of limited public resources. Governments,donors and other stakeholders need to make an informeddecision on which priority sectors to select, and thus need toassess the export potential of individual sectors.
Knowing what to export is as important as knowing where toexport. Markets differ in terms of demand and market accessconditions. Thus, even promising products may not perform welleverywhere. Since the penetration of new markets involvesentry costs, it is crucial to identify and to target markets wherethe country’s export products are competitive. The identificationof high-potential sectors is therefore complemented by theidentification of attractive markets.
METHODOLOGY & STUDY Selecting ProductsDepending on the situation of the country, two differentapproaches are available to identify products with highpotential for exports – the Export Potential Index and theProduct Diversification Index.
The Export Potential Index suits countries with a broad exportbase and whose aim is to increase revenues generated byexisting export products. The Index identifies among all existingproducts those with good export potential based on a country’sexport performance and world demand.
Export Performance is measured by three sub-indicators:• Comparative advantage: calculated as the share of the
product in total national exports as compared to the share ofthis product in world exports, the indicator shows in whichproducts the country is competitive compared with othercountries in the world. (Revealed Competitive Advantage)
• Growth of comparative advantage: calculated as the annualgrowth of comparative advantage over the last five years, theindicator shows in which products the country has recentlybecome competitive.
• (Change in) trade balance: calculated as the (absolutechange in the) share of the trade balance for each product inthe country’s total trade, the indicator controls for re-exportsand thus focuses on products that are (increasingly)produced in the country.
Combining these sub-indicators into a composite index,this first step of the analysis provides information aboutbest performing sectors.
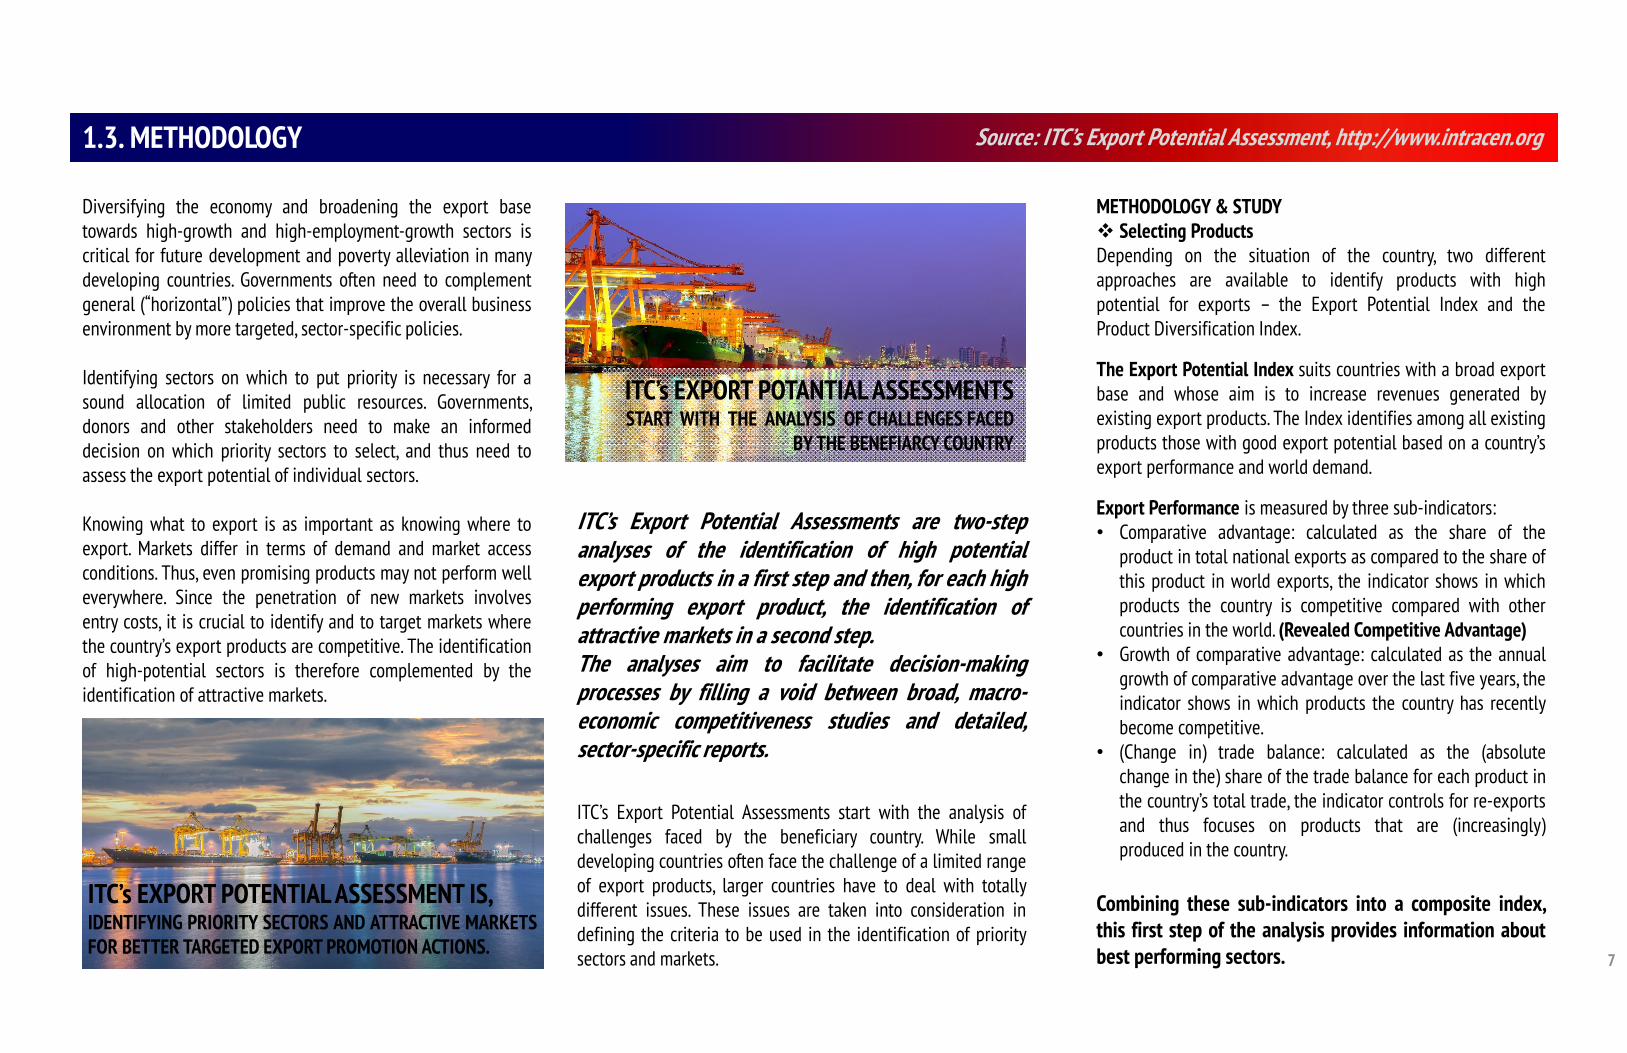
ITC’s Export Potential Assessments are two-stepanalyses of the identification of high potentialexport products in a first step and then, for each highperforming export product, the identification ofattractive markets in a second step.The analyses aim to facilitate decision-makingprocesses by filling a void between broad, macro-economic competitiveness studies and detailed,sector-specific reports.
ITC’s Export Potential Assessments start with the analysis ofchallenges faced by the beneficiary country. While smalldeveloping countries often face the challenge of a limited rangeof export products, larger countries have to deal with totallydifferent issues. These issues are taken into consideration indefining the criteria to be used in the identification of prioritysectors and markets.
ITC’s EXPORT POTENTIAL ASSESSMENT IS,IDENTIFYING PRIORITY SECTORS AND ATTRACTIVE MARKETSFOR BETTER TARGETED EXPORT PROMOTION ACTIONS.
ITC’s EXPORT POTANTIAL ASSESSMENTS START WITH THE ANALYSIS OF CHALLENGES FACED
BY THE BENEFIARCY COUNTRY
Source: ITC’s Export Potential Assessment, http://www.intracen.org
8
1.3. METHODOLOGY
The expected impact of the Export Potential Assessment is a better understanding of global markets and the identification of market opportunities that are not fully exploited.
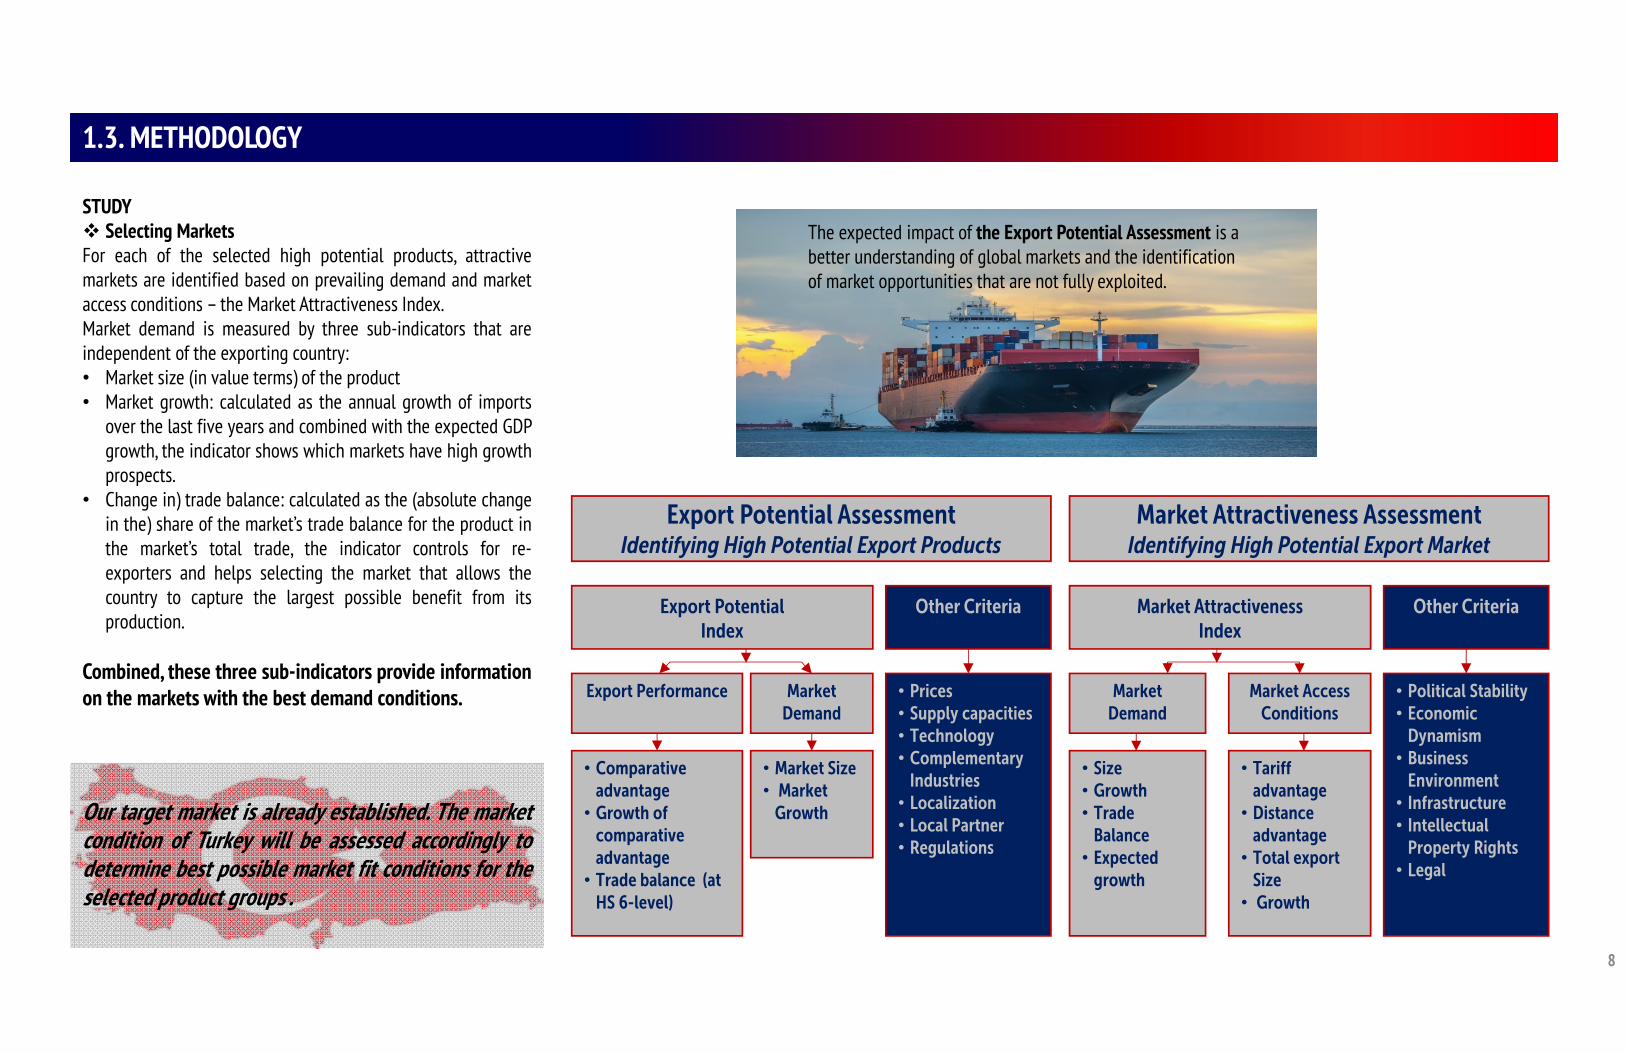
STUDY Selecting MarketsFor each of the selected high potential products, attractivemarkets are identified based on prevailing demand and marketaccess conditions – the Market Attractiveness Index.Market demand is measured by three sub-indicators that areindependent of the exporting country:• Market size (in value terms) of the product• Market growth: calculated as the annual growth of imports
over the last five years and combined with the expected GDPgrowth, the indicator shows which markets have high growthprospects.
• Change in) trade balance: calculated as the (absolute changein the) share of the market’s trade balance for the product inthe market’s total trade, the indicator controls for re-exporters and helps selecting the market that allows thecountry to capture the largest possible benefit from itsproduction.
Combined, these three sub-indicators provide informationon the markets with the best demand conditions.
Our target market is already established. The marketcondition of Turkey will be assessed accordingly todetermine best possible market fit conditions for theselected product groups .
Market Attractiveness AssessmentIdentifying High Potential Export Market
Market AttractivenessIndex
Other Criteria
Market Demand
Market Access Conditions
• Size • Growth • Trade
Balance• Expected
growth
• Tariff advantage• Distance
advantage• Total export
Size • Growth
• Political Stability• Economic
Dynamism• Business
Environment• Infrastructure• Intellectual
Property Rights• Legal
Export Potential AssessmentIdentifying High Potential Export Products
Export Potential Index
Other Criteria
Export Performance Market Demand
• Comparative advantage• Growth of
comparative advantage• Trade balance (at
HS 6-level)
• Market Size • Market
Growth
• Prices• Supply capacities• Technology• Complementary
Industries• Localization• Local Partner• Regulations
9
1.3. METHODOLOGY
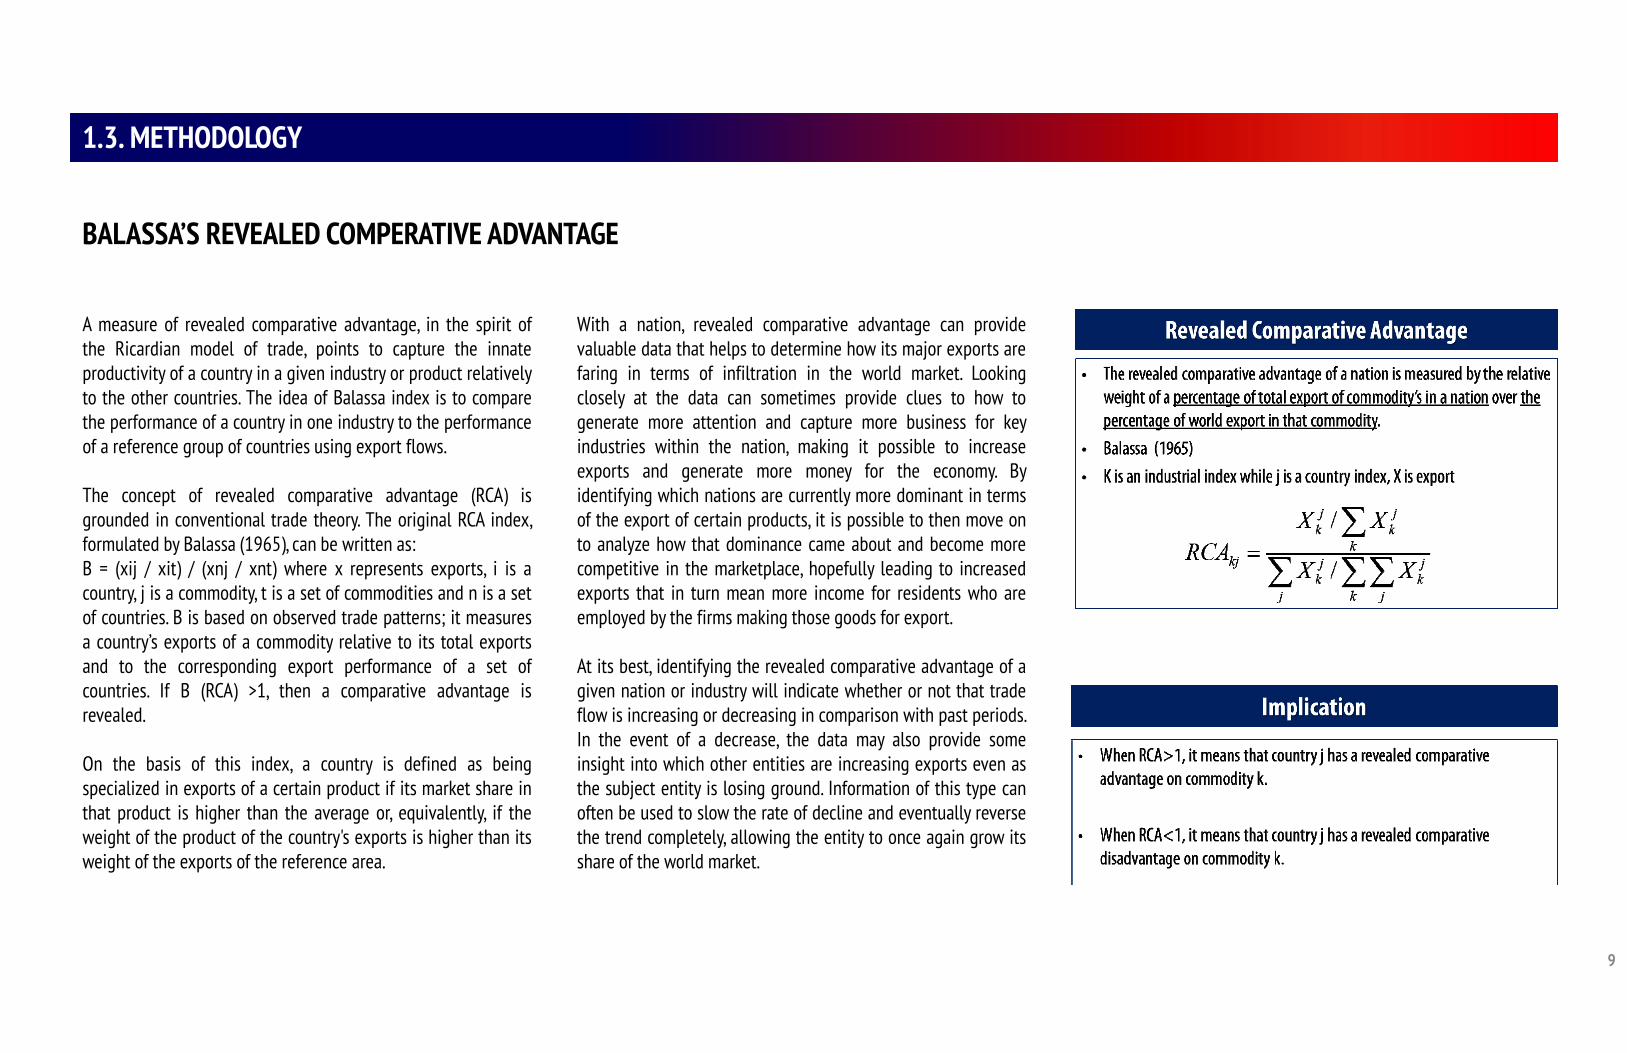
A measure of revealed comparative advantage, in the spirit ofthe Ricardian model of trade, points to capture the innateproductivity of a country in a given industry or product relativelyto the other countries. The idea of Balassa index is to comparethe performance of a country in one industry to the performanceof a reference group of countries using export flows.
The concept of revealed comparative advantage (RCA) isgrounded in conventional trade theory. The original RCA index,formulated by Balassa (1965), can be written as:B = (xij / xit) / (xnj / xnt) where x represents exports, i is acountry, j is a commodity, t is a set of commodities and n is a setof countries. B is based on observed trade patterns; it measuresa country’s exports of a commodity relative to its total exportsand to the corresponding export performance of a set ofcountries. If B (RCA) >1, then a comparative advantage isrevealed.
On the basis of this index, a country is defined as beingspecialized in exports of a certain product if its market share inthat product is higher than the average or, equivalently, if theweight of the product of the country's exports is higher than itsweight of the exports of the reference area.
With a nation, revealed comparative advantage can providevaluable data that helps to determine how its major exports arefaring in terms of infiltration in the world market. Lookingclosely at the data can sometimes provide clues to how togenerate more attention and capture more business for keyindustries within the nation, making it possible to increaseexports and generate more money for the economy. Byidentifying which nations are currently more dominant in termsof the export of certain products, it is possible to then move onto analyze how that dominance came about and become morecompetitive in the marketplace, hopefully leading to increasedexports that in turn mean more income for residents who areemployed by the firms making those goods for export.
At its best, identifying the revealed comparative advantage of agiven nation or industry will indicate whether or not that tradeflow is increasing or decreasing in comparison with past periods.In the event of a decrease, the data may also provide someinsight into which other entities are increasing exports even asthe subject entity is losing ground. Information of this type canoften be used to slow the rate of decline and eventually reversethe trend completely, allowing the entity to once again grow itsshare of the world market.
BALASSA’S REVEALED COMPERATIVE ADVANTAGE
10
1.3. DATA SOURCES
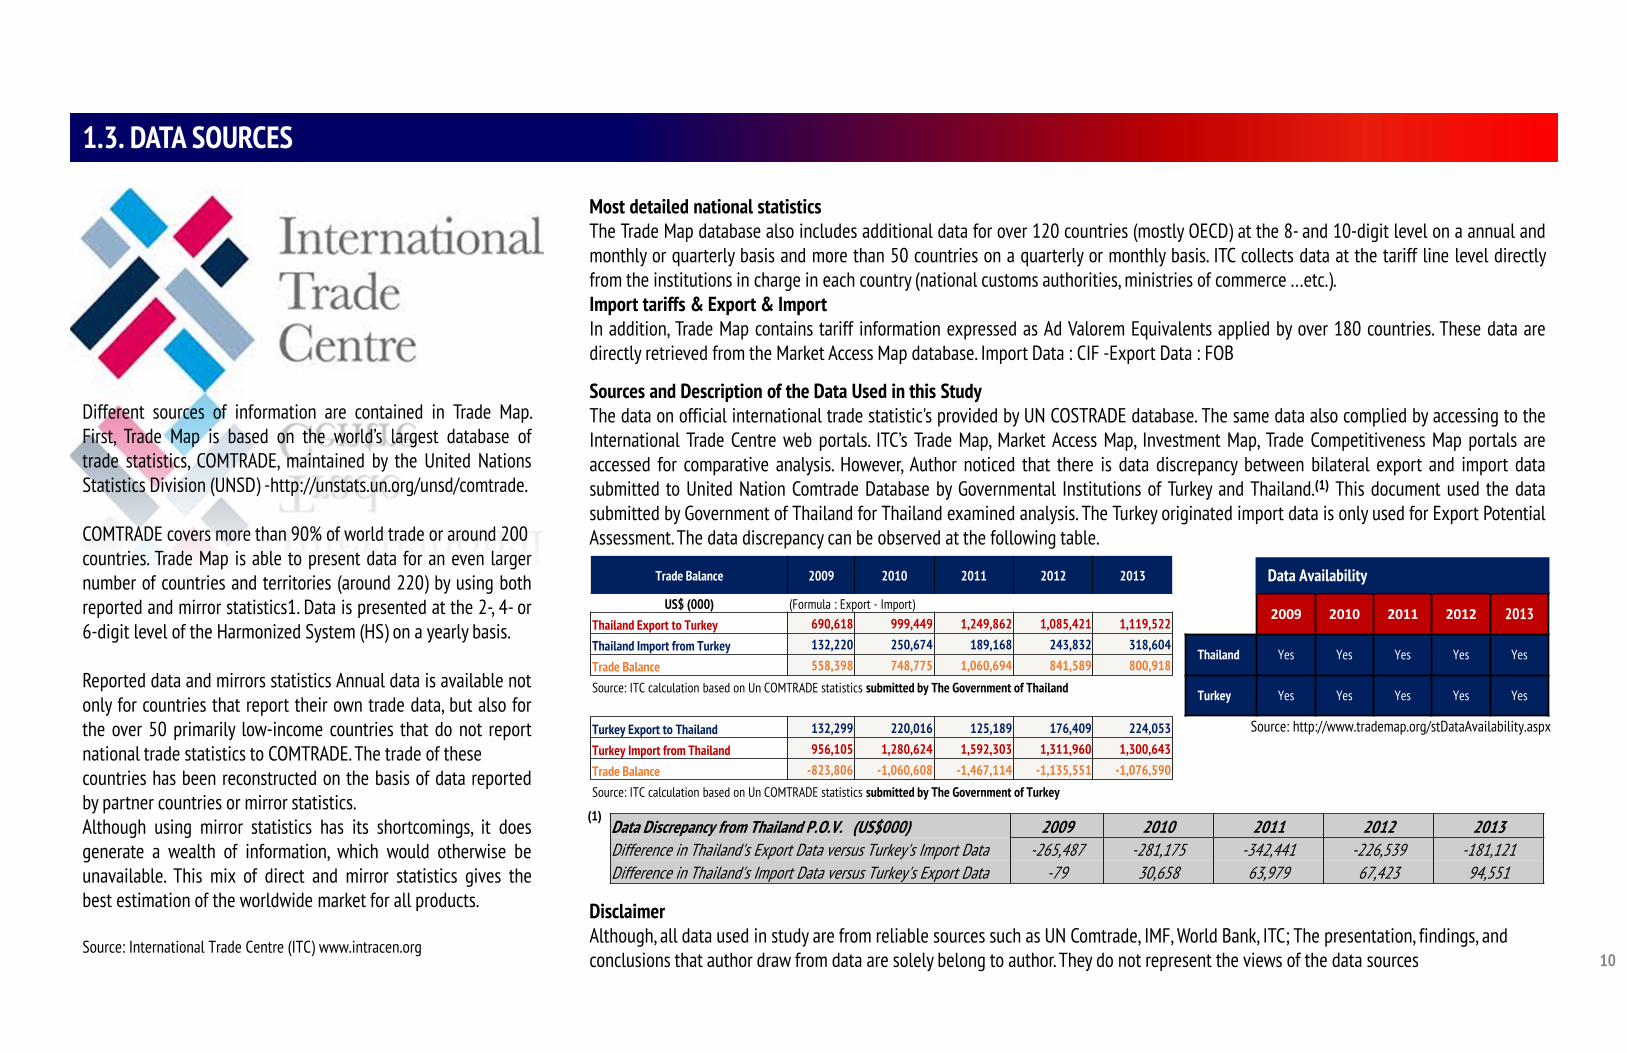
Different sources of information are contained in Trade Map.First, Trade Map is based on the world’s largest database oftrade statistics, COMTRADE, maintained by the United NationsStatistics Division (UNSD) -http://unstats.un.org/unsd/comtrade.
COMTRADE covers more than 90% of world trade or around 200countries. Trade Map is able to present data for an even largernumber of countries and territories (around 220) by using bothreported and mirror statistics1. Data is presented at the 2-, 4- or6-digit level of the Harmonized System (HS) on a yearly basis.
Reported data and mirrors statistics Annual data is available notonly for countries that report their own trade data, but also forthe over 50 primarily low-income countries that do not reportnational trade statistics to COMTRADE. The trade of thesecountries has been reconstructed on the basis of data reportedby partner countries or mirror statistics.Although using mirror statistics has its shortcomings, it doesgenerate a wealth of information, which would otherwise beunavailable. This mix of direct and mirror statistics gives thebest estimation of the worldwide market for all products.
Source: International Trade Centre (ITC) www.intracen.org
Most detailed national statisticsThe Trade Map database also includes additional data for over 120 countries (mostly OECD) at the 8- and 10-digit level on a annual andmonthly or quarterly basis and more than 50 countries on a quarterly or monthly basis. ITC collects data at the tariff line level directlyfrom the institutions in charge in each country (national customs authorities, ministries of commerce …etc.).Import tariffs & Export & ImportIn addition, Trade Map contains tariff information expressed as Ad Valorem Equivalents applied by over 180 countries. These data aredirectly retrieved from the Market Access Map database. Import Data : CIF -Export Data : FOB
2009 2010 2011 2012 2013
Thailand Yes Yes Yes Yes Yes
Turkey Yes Yes Yes Yes Yes
Source: http://www.trademap.org/stDataAvailability.aspx
Sources and Description of the Data Used in this StudyThe data on official international trade statistic's provided by UN COSTRADE database. The same data also complied by accessing to theInternational Trade Centre web portals. ITC’s Trade Map, Market Access Map, Investment Map, Trade Competitiveness Map portals areaccessed for comparative analysis. However, Author noticed that there is data discrepancy between bilateral export and import datasubmitted to United Nation Comtrade Database by Governmental Institutions of Turkey and Thailand.(1) This document used the datasubmitted by Government of Thailand for Thailand examined analysis. The Turkey originated import data is only used for Export PotentialAssessment.The data discrepancy can be observed at the following table.
Data Discrepancy from Thailand P.O.V. (US$000) 2009 2010 2011 2012 2013Difference in Thailand's Export Data versus Turkey's Import Data -265,487 -281,175 -342,441 -226,539 -181,121Difference in Thailand's Import Data versus Turkey's Export Data -79 30,658 63,979 67,423 94,551
(1)
Trade Balance 2009 2010 2011 2012 2013
US$ (000) (Formula : Export - Import)Thailand Export to Turkey 690,618 999,449 1,249,862 1,085,421 1,119,522
Thailand Import from Turkey 132,220 250,674 189,168 243,832 318,604
Trade Balance 558,398 748,775 1,060,694 841,589 800,918
Source: ITC calculation based on Un COMTRADE statistics submitted by The Government of Thailand
Turkey Export to Thailand 132,299 220,016 125,189 176,409 224,053
Turkey Import from Thailand 956,105 1,280,624 1,592,303 1,311,960 1,300,643
Trade Balance -823,806 -1,060,608 -1,467,114 -1,135,551 -1,076,590
Source: ITC calculation based on Un COMTRADE statistics submitted by The Government of Turkey
Data Availability
DisclaimerAlthough, all data used in study are from reliable sources such as UN Comtrade, IMF, World Bank, ITC; The presentation, findings, and conclusions that author draw from data are solely belong to author. They do not represent the views of the data sources
11
1.4. HARMONIZED SYSTEM CODE (HS)
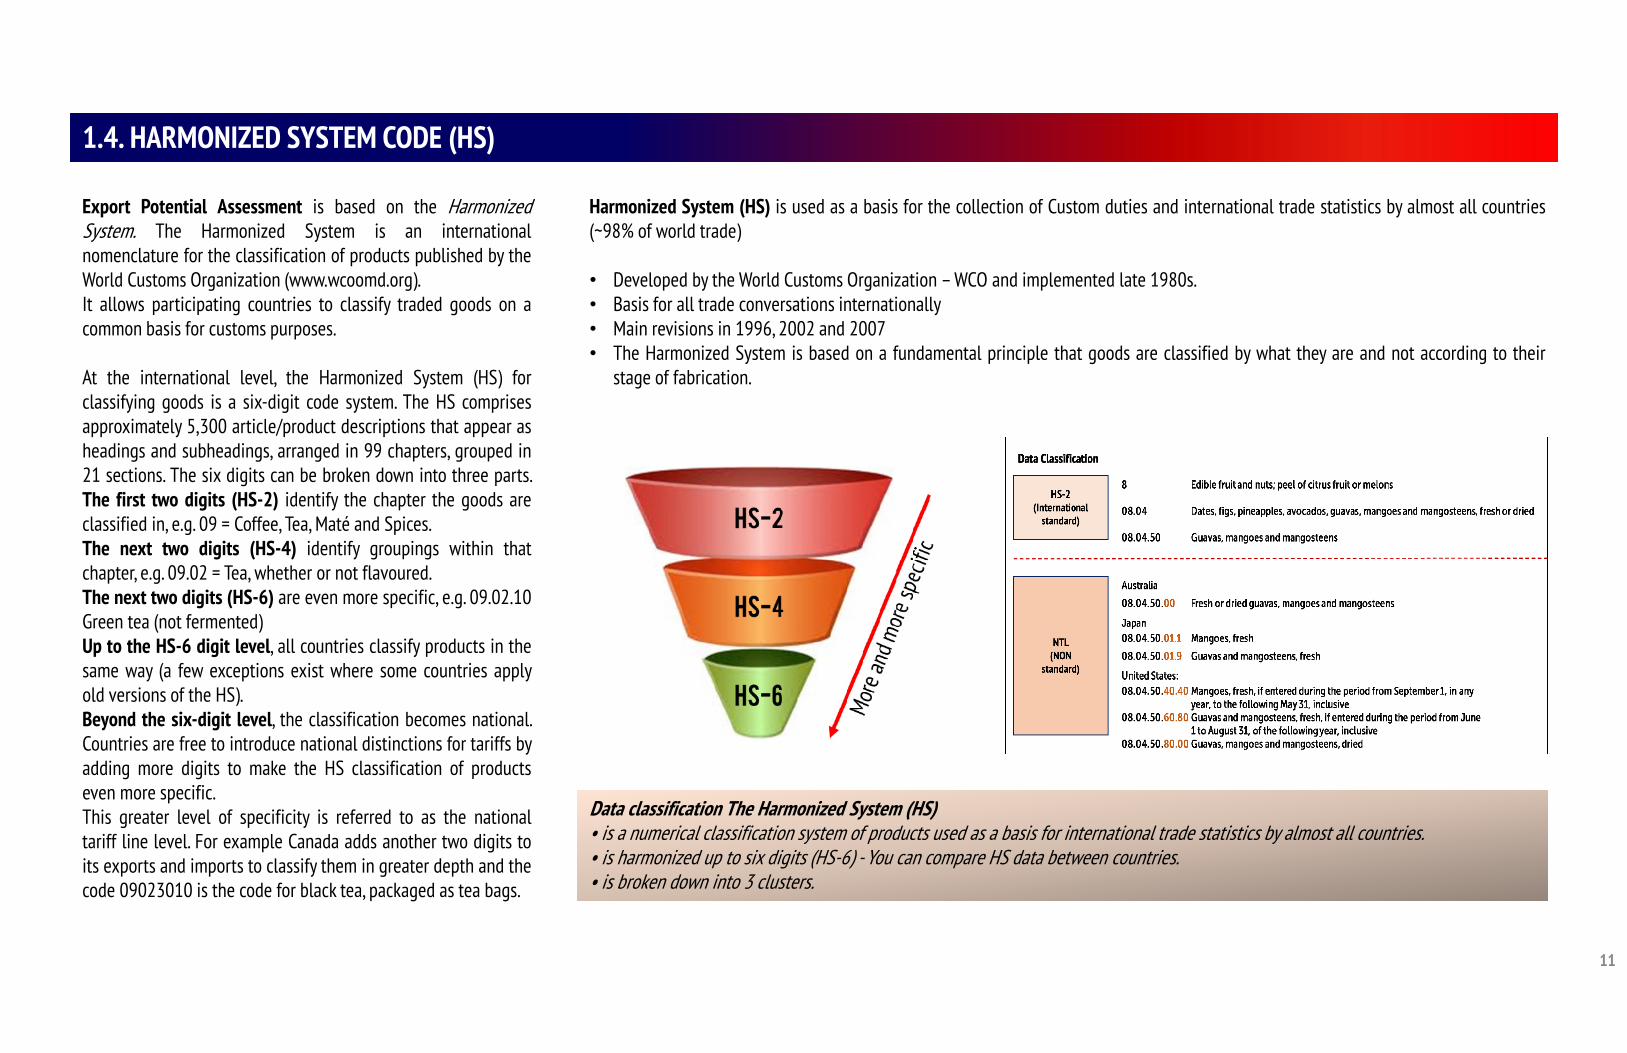
Export Potential Assessment is based on the HarmonizedSystem. The Harmonized System is an internationalnomenclature for the classification of products published by theWorld Customs Organization (www.wcoomd.org).It allows participating countries to classify traded goods on acommon basis for customs purposes.
At the international level, the Harmonized System (HS) forclassifying goods is a six-digit code system. The HS comprisesapproximately 5,300 article/product descriptions that appear asheadings and subheadings, arranged in 99 chapters, grouped in21 sections. The six digits can be broken down into three parts.The first two digits (HS-2) identify the chapter the goods areclassified in, e.g. 09 = Coffee, Tea, Maté and Spices.The next two digits (HS-4) identify groupings within thatchapter, e.g. 09.02 = Tea, whether or not flavoured.The next two digits (HS-6) are even more specific, e.g. 09.02.10Green tea (not fermented)Up to the HS-6 digit level, all countries classify products in thesame way (a few exceptions exist where some countries applyold versions of the HS).Beyond the six-digit level, the classification becomes national.Countries are free to introduce national distinctions for tariffs byadding more digits to make the HS classification of productseven more specific.This greater level of specificity is referred to as the nationaltariff line level. For example Canada adds another two digits toits exports and imports to classify them in greater depth and thecode 09023010 is the code for black tea, packaged as tea bags.
Harmonized System (HS) is used as a basis for the collection of Custom duties and international trade statistics by almost all countries(~98% of world trade)
• Developed by the World Customs Organization – WCO and implemented late 1980s.• Basis for all trade conversations internationally• Main revisions in 1996, 2002 and 2007• The Harmonized System is based on a fundamental principle that goods are classified by what they are and not according to their
stage of fabrication.
Data classification The Harmonized System (HS)• is a numerical classification system of products used as a basis for international trade statistics by almost all countries.• is harmonized up to six digits (HS-6) - You can compare HS data between countries.• is broken down into 3 clusters.
12
1.5. GLOSSARY
Abbreviation Description
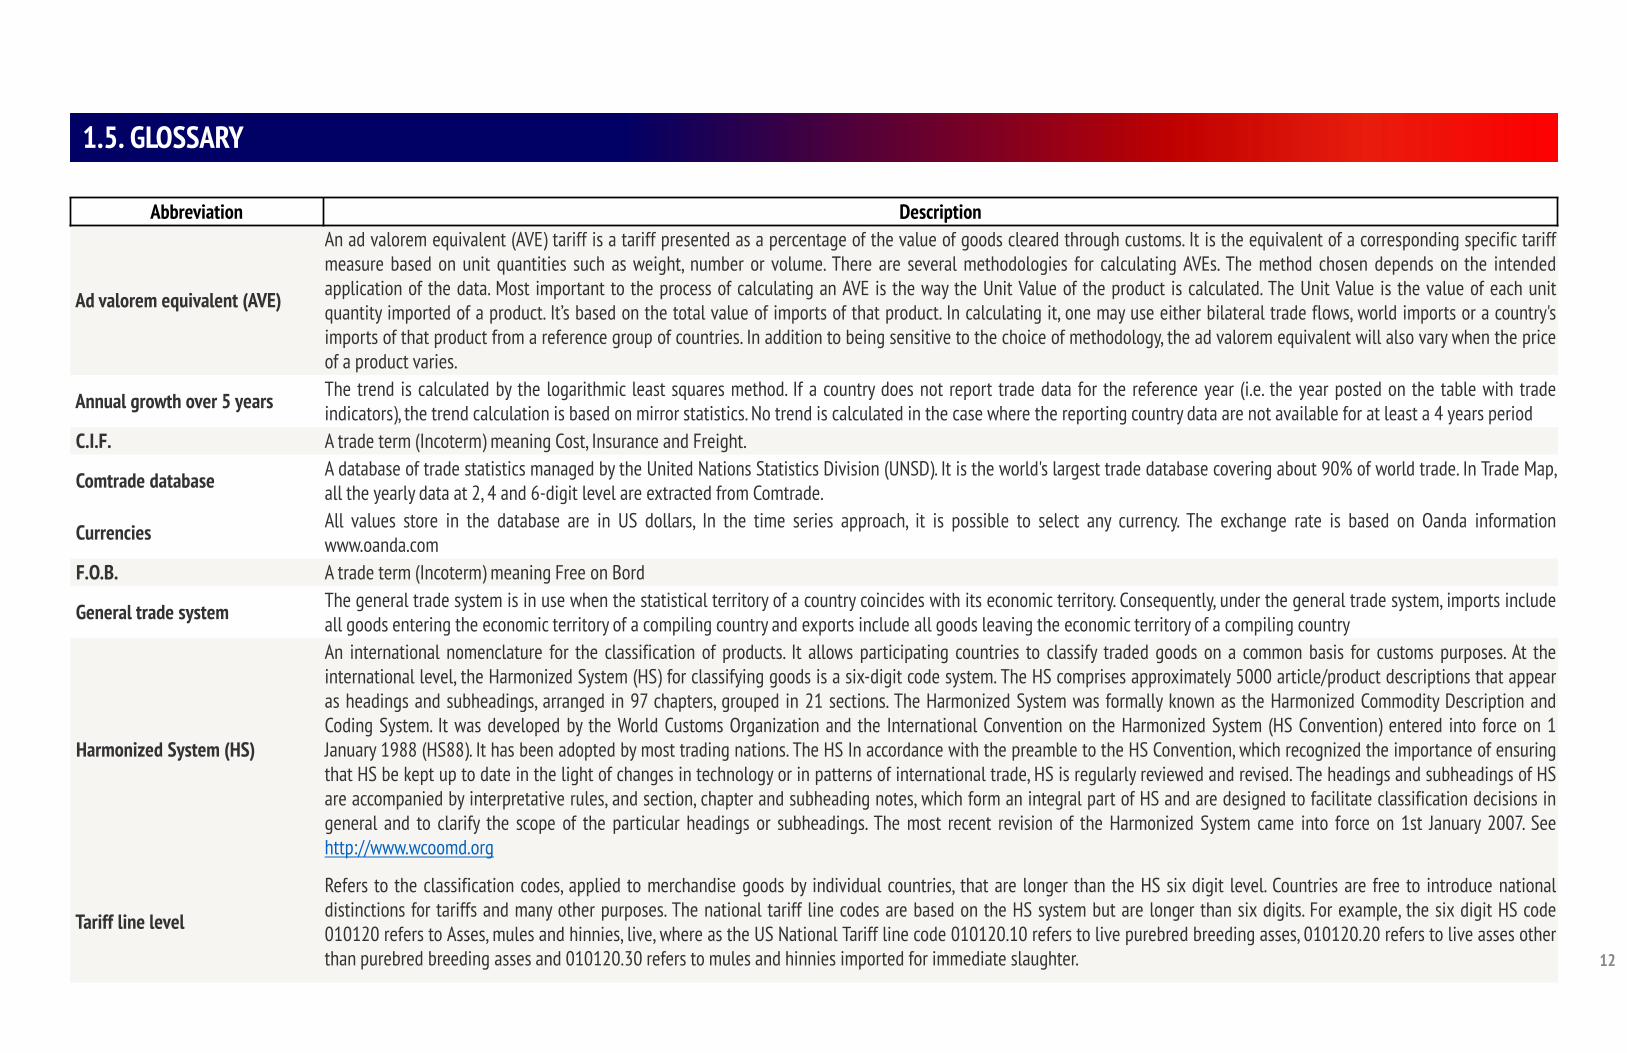
Ad valorem equivalent (AVE)
An ad valorem equivalent (AVE) tariff is a tariff presented as a percentage of the value of goods cleared through customs. It is the equivalent of a corresponding specific tariffmeasure based on unit quantities such as weight, number or volume. There are several methodologies for calculating AVEs. The method chosen depends on the intendedapplication of the data. Most important to the process of calculating an AVE is the way the Unit Value of the product is calculated. The Unit Value is the value of each unitquantity imported of a product. It’s based on the total value of imports of that product. In calculating it, one may use either bilateral trade flows, world imports or a country'simports of that product from a reference group of countries. In addition to being sensitive to the choice of methodology, the ad valorem equivalent will also vary when the priceof a product varies.
Annual growth over 5 years The trend is calculated by the logarithmic least squares method. If a country does not report trade data for the reference year (i.e. the year posted on the table with tradeindicators), the trend calculation is based on mirror statistics. No trend is calculated in the case where the reporting country data are not available for at least a 4 years period
C.I.F. A trade term (Incoterm) meaning Cost, Insurance and Freight.
Comtrade database A database of trade statistics managed by the United Nations Statistics Division (UNSD). It is the world's largest trade database covering about 90% of world trade. In Trade Map,all the yearly data at 2, 4 and 6-digit level are extracted from Comtrade.
Currencies All values store in the database are in US dollars, In the time series approach, it is possible to select any currency. The exchange rate is based on Oanda informationwww.oanda.com
F.O.B. A trade term (Incoterm) meaning Free on Bord
General trade system The general trade system is in use when the statistical territory of a country coincides with its economic territory. Consequently, under the general trade system, imports includeall goods entering the economic territory of a compiling country and exports include all goods leaving the economic territory of a compiling country
Harmonized System (HS)
An international nomenclature for the classification of products. It allows participating countries to classify traded goods on a common basis for customs purposes. At theinternational level, the Harmonized System (HS) for classifying goods is a six-digit code system. The HS comprises approximately 5000 article/product descriptions that appearas headings and subheadings, arranged in 97 chapters, grouped in 21 sections. The Harmonized System was formally known as the Harmonized Commodity Description andCoding System. It was developed by the World Customs Organization and the International Convention on the Harmonized System (HS Convention) entered into force on 1January 1988 (HS88). It has been adopted by most trading nations. The HS In accordance with the preamble to the HS Convention, which recognized the importance of ensuringthat HS be kept up to date in the light of changes in technology or in patterns of international trade, HS is regularly reviewed and revised. The headings and subheadings of HSare accompanied by interpretative rules, and section, chapter and subheading notes, which form an integral part of HS and are designed to facilitate classification decisions ingeneral and to clarify the scope of the particular headings or subheadings. The most recent revision of the Harmonized System came into force on 1st January 2007. Seehttp://www.wcoomd.org
Tariff line level
Refers to the classification codes, applied to merchandise goods by individual countries, that are longer than the HS six digit level. Countries are free to introduce nationaldistinctions for tariffs and many other purposes. The national tariff line codes are based on the HS system but are longer than six digits. For example, the six digit HS code010120 refers to Asses, mules and hinnies, live, where as the US National Tariff line code 010120.10 refers to live purebred breeding asses, 010120.20 refers to live asses otherthan purebred breeding asses and 010120.30 refers to mules and hinnies imported for immediate slaughter.
13
1.5. GLOSSARY
Abbreviation Description
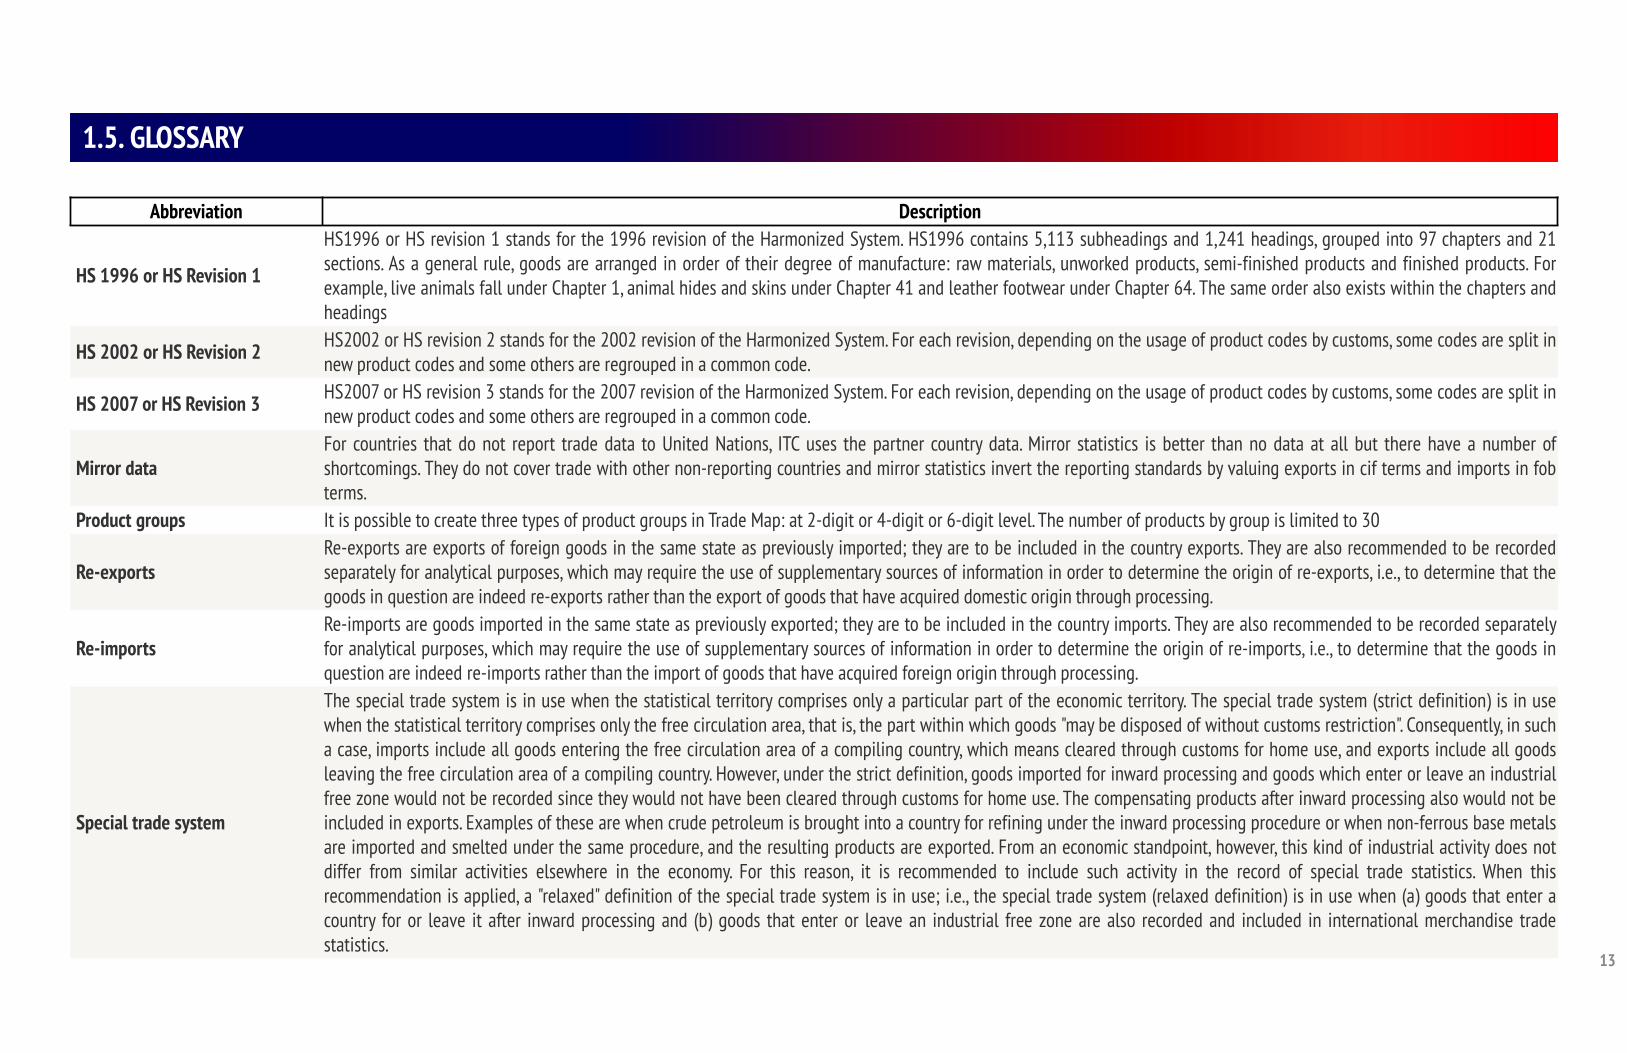
HS 1996 or HS Revision 1
HS1996 or HS revision 1 stands for the 1996 revision of the Harmonized System. HS1996 contains 5,113 subheadings and 1,241 headings, grouped into 97 chapters and 21sections. As a general rule, goods are arranged in order of their degree of manufacture: raw materials, unworked products, semi-finished products and finished products. Forexample, live animals fall under Chapter 1, animal hides and skins under Chapter 41 and leather footwear under Chapter 64. The same order also exists within the chapters andheadings
HS 2002 or HS Revision 2 HS2002 or HS revision 2 stands for the 2002 revision of the Harmonized System. For each revision, depending on the usage of product codes by customs, some codes are split innew product codes and some others are regrouped in a common code.
HS 2007 or HS Revision 3 HS2007 or HS revision 3 stands for the 2007 revision of the Harmonized System. For each revision, depending on the usage of product codes by customs, some codes are split innew product codes and some others are regrouped in a common code.
Mirror dataFor countries that do not report trade data to United Nations, ITC uses the partner country data. Mirror statistics is better than no data at all but there have a number ofshortcomings. They do not cover trade with other non-reporting countries and mirror statistics invert the reporting standards by valuing exports in cif terms and imports in fobterms.
Product groups It is possible to create three types of product groups in Trade Map: at 2-digit or 4-digit or 6-digit level. The number of products by group is limited to 30
Re-exportsRe-exports are exports of foreign goods in the same state as previously imported; they are to be included in the country exports. They are also recommended to be recordedseparately for analytical purposes, which may require the use of supplementary sources of information in order to determine the origin of re-exports, i.e., to determine that thegoods in question are indeed re-exports rather than the export of goods that have acquired domestic origin through processing.
Re-importsRe-imports are goods imported in the same state as previously exported; they are to be included in the country imports. They are also recommended to be recorded separatelyfor analytical purposes, which may require the use of supplementary sources of information in order to determine the origin of re-imports, i.e., to determine that the goods inquestion are indeed re-imports rather than the import of goods that have acquired foreign origin through processing.
Special trade system
The special trade system is in use when the statistical territory comprises only a particular part of the economic territory. The special trade system (strict definition) is in usewhen the statistical territory comprises only the free circulation area, that is, the part within which goods "may be disposed of without customs restriction". Consequently, in sucha case, imports include all goods entering the free circulation area of a compiling country, which means cleared through customs for home use, and exports include all goodsleaving the free circulation area of a compiling country. However, under the strict definition, goods imported for inward processing and goods which enter or leave an industrialfree zone would not be recorded since they would not have been cleared through customs for home use. The compensating products after inward processing also would not beincluded in exports. Examples of these are when crude petroleum is brought into a country for refining under the inward processing procedure or when non-ferrous base metalsare imported and smelted under the same procedure, and the resulting products are exported. From an economic standpoint, however, this kind of industrial activity does notdiffer from similar activities elsewhere in the economy. For this reason, it is recommended to include such activity in the record of special trade statistics. When thisrecommendation is applied, a "relaxed" definition of the special trade system is in use; i.e., the special trade system (relaxed definition) is in use when (a) goods that enter acountry for or leave it after inward processing and (b) goods that enter or leave an industrial free zone are also recorded and included in international merchandise tradestatistics.

PARTCOUNTRY OVERVIEW
15
2.1. THAILAND
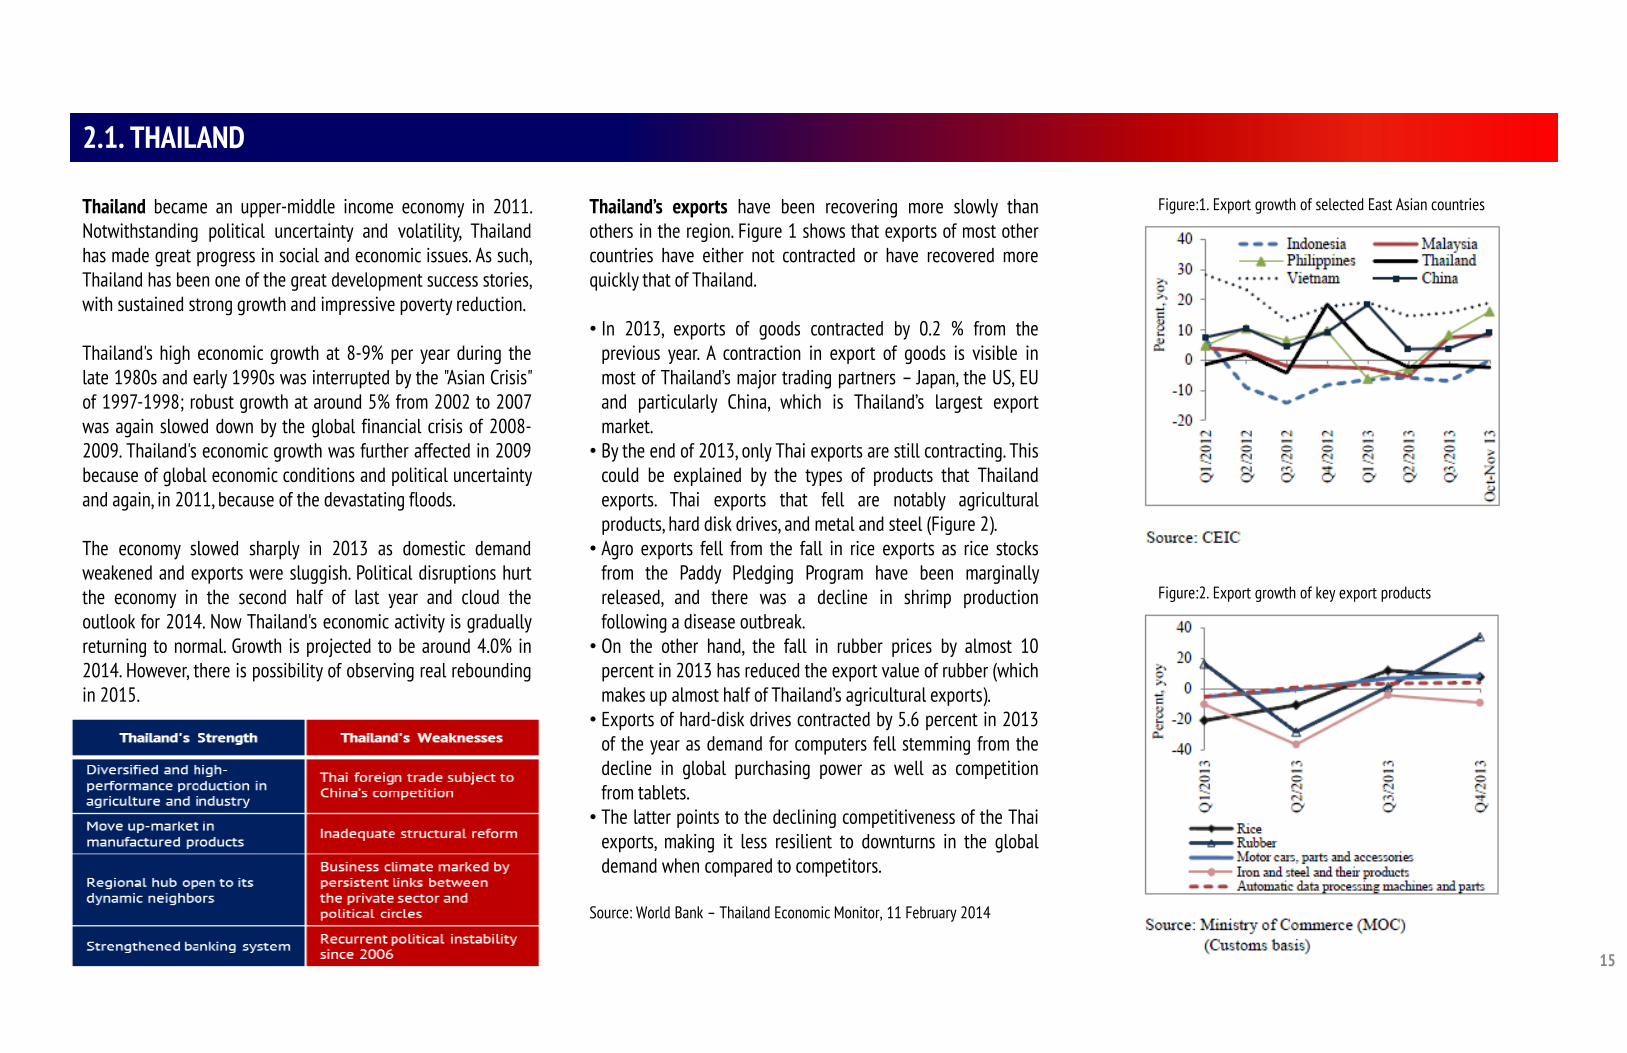
Thailand became an upper-middle income economy in 2011.Notwithstanding political uncertainty and volatility, Thailandhas made great progress in social and economic issues. As such,Thailand has been one of the great development success stories,with sustained strong growth and impressive poverty reduction.
Thailand's high economic growth at 8-9% per year during thelate 1980s and early 1990s was interrupted by the "Asian Crisis"of 1997-1998; robust growth at around 5% from 2002 to 2007was again slowed down by the global financial crisis of 2008-2009. Thailand's economic growth was further affected in 2009because of global economic conditions and political uncertaintyand again, in 2011, because of the devastating floods.
The economy slowed sharply in 2013 as domestic demandweakened and exports were sluggish. Political disruptions hurtthe economy in the second half of last year and cloud theoutlook for 2014. Now Thailand's economic activity is graduallyreturning to normal. Growth is projected to be around 4.0% in2014. However, there is possibility of observing real reboundingin 2015.
Thailand’s exports have been recovering more slowly thanothers in the region. Figure 1 shows that exports of most othercountries have either not contracted or have recovered morequickly that of Thailand.
• In 2013, exports of goods contracted by 0.2 % from theprevious year. A contraction in export of goods is visible inmost of Thailand’s major trading partners – Japan, the US, EUand particularly China, which is Thailand’s largest exportmarket.• By the end of 2013, only Thai exports are still contracting. This
could be explained by the types of products that Thailandexports. Thai exports that fell are notably agriculturalproducts, hard disk drives, and metal and steel (Figure 2).• Agro exports fell from the fall in rice exports as rice stocks
from the Paddy Pledging Program have been marginallyreleased, and there was a decline in shrimp productionfollowing a disease outbreak.• On the other hand, the fall in rubber prices by almost 10
percent in 2013 has reduced the export value of rubber (whichmakes up almost half of Thailand’s agricultural exports).• Exports of hard-disk drives contracted by 5.6 percent in 2013
of the year as demand for computers fell stemming from thedecline in global purchasing power as well as competitionfrom tablets.• The latter points to the declining competitiveness of the Thai
exports, making it less resilient to downturns in the globaldemand when compared to competitors.
Source: World Bank – Thailand Economic Monitor, 11 February 2014
Figure:1. Export growth of selected East Asian countries
Figure:2. Export growth of key export products
16
2.1. THAILAND – EXPORT OVERVIEW
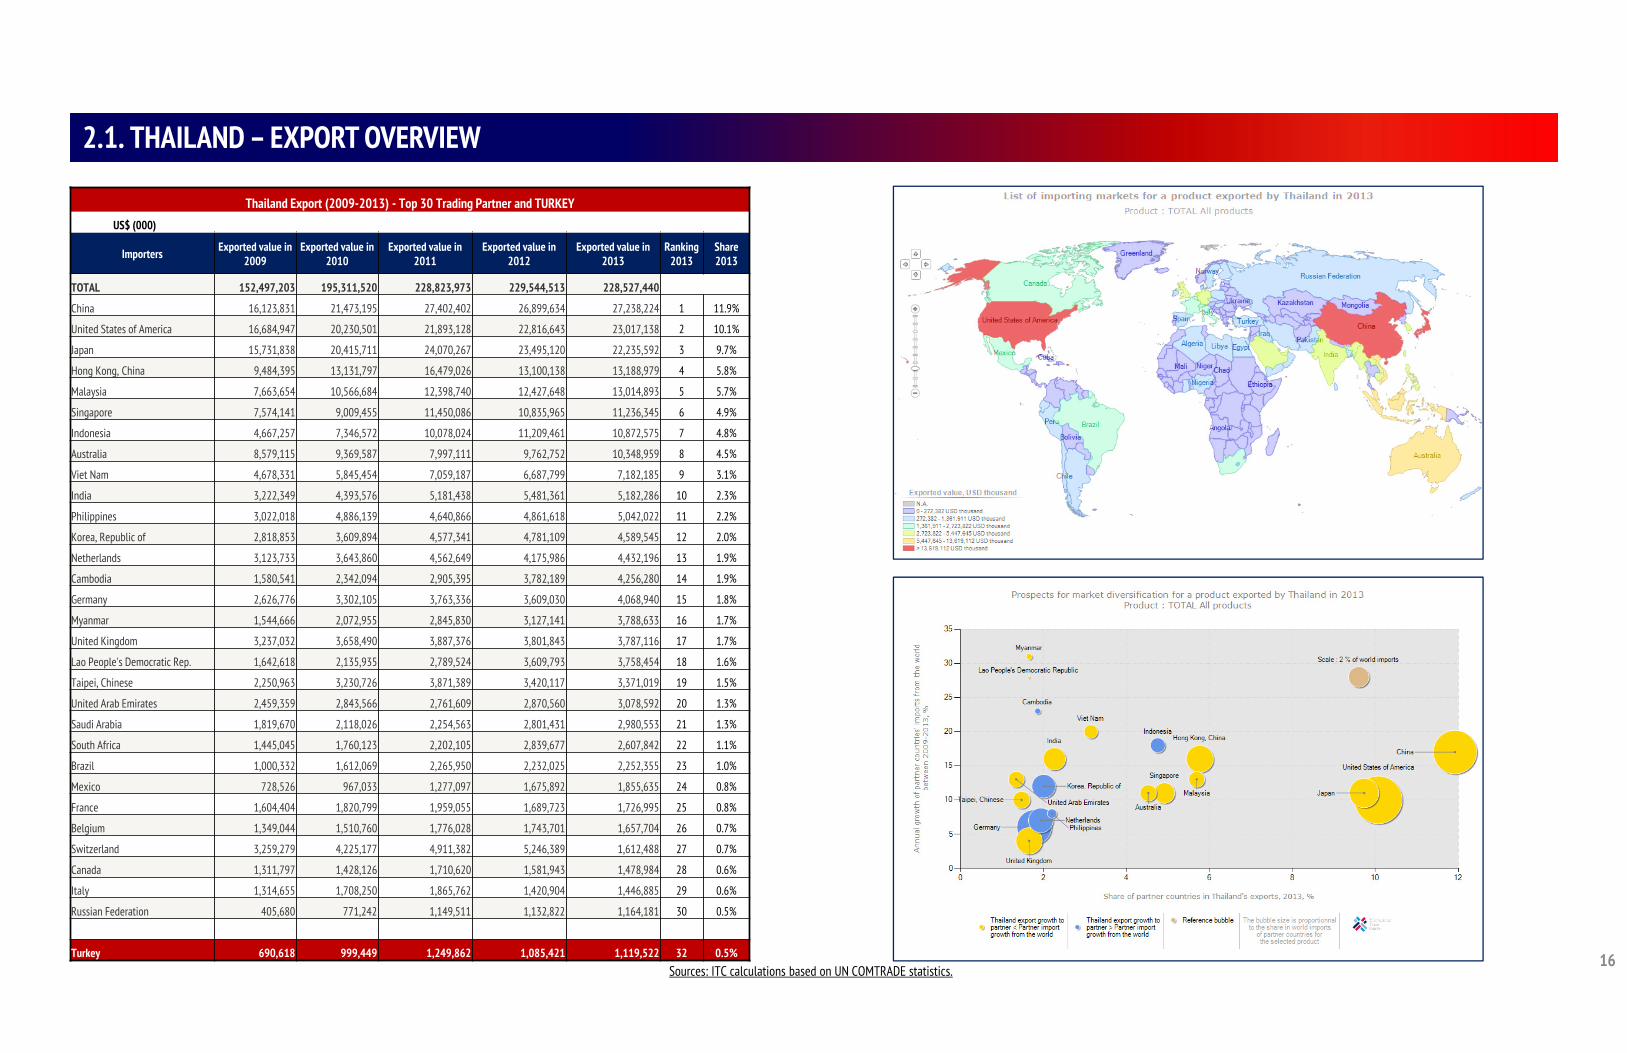
Thailand Export (2009-2013) - Top 30 Trading Partner and TURKEYUS$ (000)
Importers Exported value in 2009
Exported value in 2010
Exported value in 2011
Exported value in 2012
Exported value in 2013
Ranking 2013
Share 2013
TOTAL 152,497,203 195,311,520 228,823,973 229,544,513 228,527,440
China 16,123,831 21,473,195 27,402,402 26,899,634 27,238,224 1 11.9%
United States of America 16,684,947 20,230,501 21,893,128 22,816,643 23,017,138 2 10.1%
Japan 15,731,838 20,415,711 24,070,267 23,495,120 22,235,592 3 9.7%
Hong Kong, China 9,484,395 13,131,797 16,479,026 13,100,138 13,188,979 4 5.8%
Malaysia 7,663,654 10,566,684 12,398,740 12,427,648 13,014,893 5 5.7%
Singapore 7,574,141 9,009,455 11,450,086 10,835,965 11,236,345 6 4.9%
Indonesia 4,667,257 7,346,572 10,078,024 11,209,461 10,872,575 7 4.8%
Australia 8,579,115 9,369,587 7,997,111 9,762,752 10,348,959 8 4.5%
Viet Nam 4,678,331 5,845,454 7,059,187 6,687,799 7,182,185 9 3.1%
India 3,222,349 4,393,576 5,181,438 5,481,361 5,182,286 10 2.3%
Philippines 3,022,018 4,886,139 4,640,866 4,861,618 5,042,022 11 2.2%
Korea, Republic of 2,818,853 3,609,894 4,577,341 4,781,109 4,589,545 12 2.0%
Netherlands 3,123,733 3,643,860 4,562,649 4,175,986 4,432,196 13 1.9%
Cambodia 1,580,541 2,342,094 2,905,395 3,782,189 4,256,280 14 1.9%
Germany 2,626,776 3,302,105 3,763,336 3,609,030 4,068,940 15 1.8%
Myanmar 1,544,666 2,072,955 2,845,830 3,127,141 3,788,633 16 1.7%
United Kingdom 3,237,032 3,658,490 3,887,376 3,801,843 3,787,116 17 1.7%
Lao People's Democratic Rep. 1,642,618 2,135,935 2,789,524 3,609,793 3,758,454 18 1.6%
Taipei, Chinese 2,250,963 3,230,726 3,871,389 3,420,117 3,371,019 19 1.5%
United Arab Emirates 2,459,359 2,843,566 2,761,609 2,870,560 3,078,592 20 1.3%
Saudi Arabia 1,819,670 2,118,026 2,254,563 2,801,431 2,980,553 21 1.3%
South Africa 1,445,045 1,760,123 2,202,105 2,839,677 2,607,842 22 1.1%
Brazil 1,000,332 1,612,069 2,265,950 2,232,025 2,252,355 23 1.0%
Mexico 728,526 967,033 1,277,097 1,675,892 1,855,635 24 0.8%
France 1,604,404 1,820,799 1,959,055 1,689,723 1,726,995 25 0.8%
Belgium 1,349,044 1,510,760 1,776,028 1,743,701 1,657,704 26 0.7%
Switzerland 3,259,279 4,225,177 4,911,382 5,246,389 1,612,488 27 0.7%
Canada 1,311,797 1,428,126 1,710,620 1,581,943 1,478,984 28 0.6%
Italy 1,314,655 1,708,250 1,865,762 1,420,904 1,446,885 29 0.6%
Russian Federation 405,680 771,242 1,149,511 1,132,822 1,164,181 30 0.5%
Turkey 690,618 999,449 1,249,862 1,085,421 1,119,522 32 0.5%Sources: ITC calculations based on UN COMTRADE statistics.
17
2.2. TURKEY
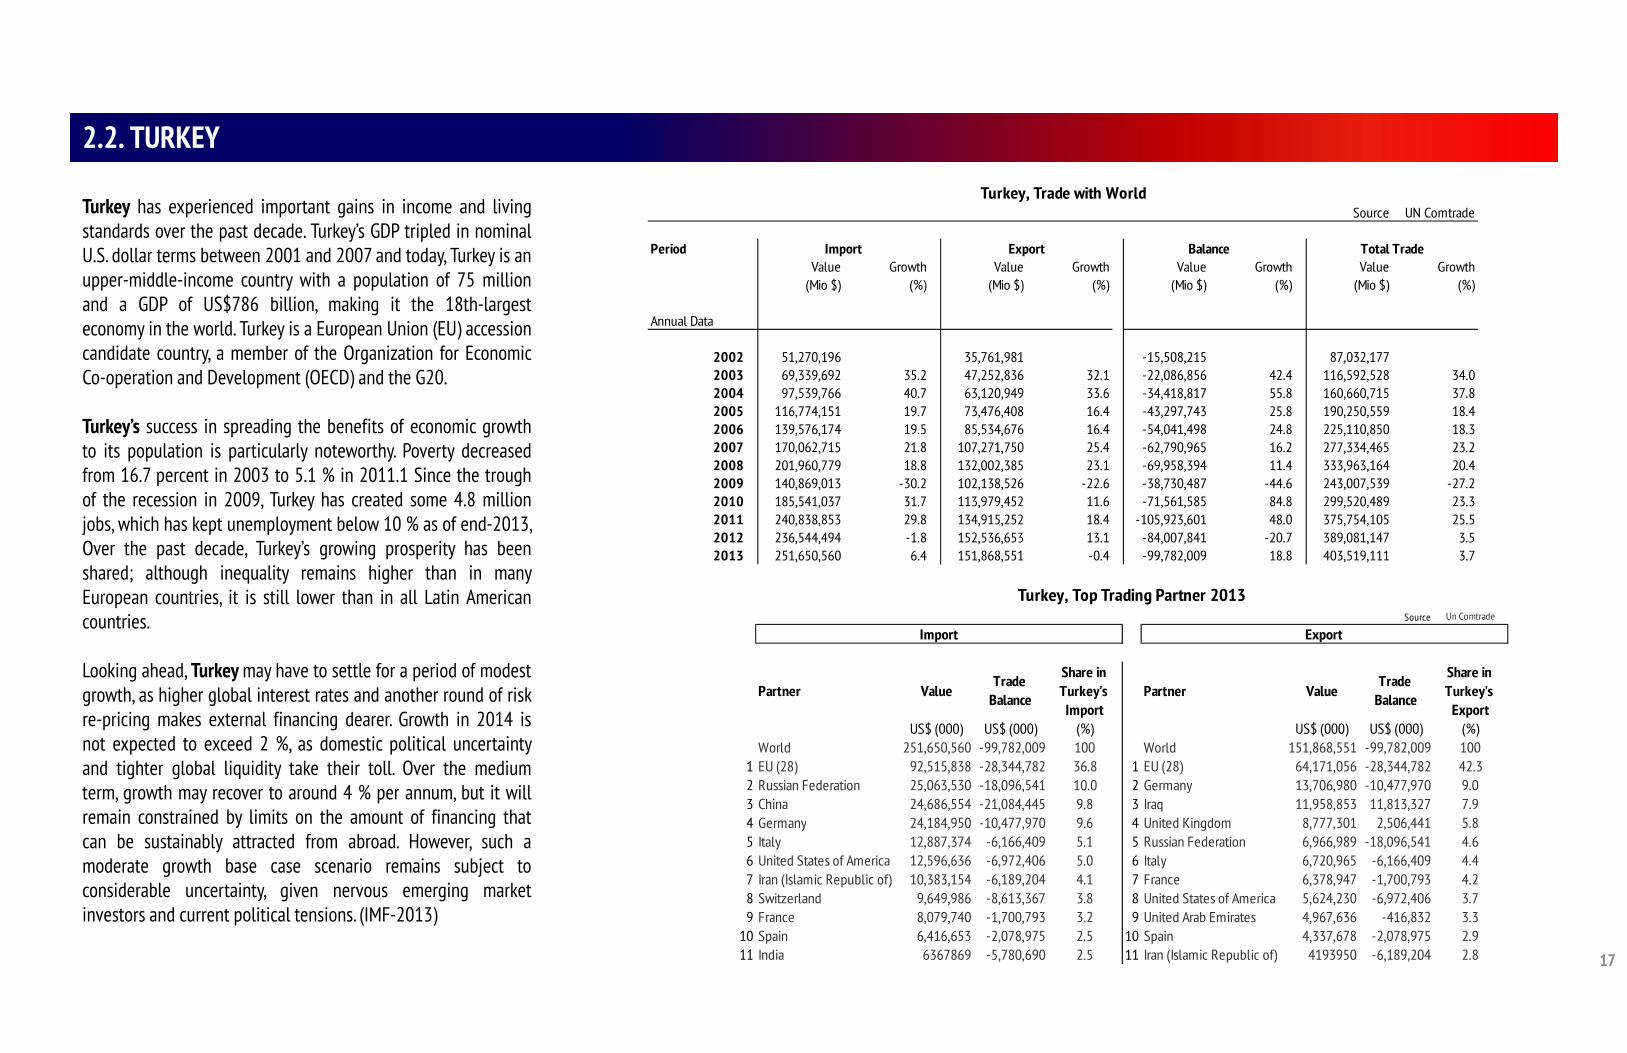
Turkey has experienced important gains in income and livingstandards over the past decade. Turkey’s GDP tripled in nominalU.S. dollar terms between 2001 and 2007 and today, Turkey is anupper-middle-income country with a population of 75 millionand a GDP of US$786 billion, making it the 18th-largesteconomy in the world. Turkey is a European Union (EU) accessioncandidate country, a member of the Organization for EconomicCo-operation and Development (OECD) and the G20.
Turkey’s success in spreading the benefits of economic growthto its population is particularly noteworthy. Poverty decreasedfrom 16.7 percent in 2003 to 5.1 % in 2011.1 Since the troughof the recession in 2009, Turkey has created some 4.8 millionjobs, which has kept unemployment below 10 % as of end-2013,Over the past decade, Turkey’s growing prosperity has beenshared; although inequality remains higher than in manyEuropean countries, it is still lower than in all Latin Americancountries.
Looking ahead, Turkey may have to settle for a period of modestgrowth, as higher global interest rates and another round of riskre-pricing makes external financing dearer. Growth in 2014 isnot expected to exceed 2 %, as domestic political uncertaintyand tighter global liquidity take their toll. Over the mediumterm, growth may recover to around 4 % per annum, but it willremain constrained by limits on the amount of financing thatcan be sustainably attracted from abroad. However, such amoderate growth base case scenario remains subject toconsiderable uncertainty, given nervous emerging marketinvestors and current political tensions. (IMF-2013)
Source UN Comtrade
PeriodValue Growth Value Growth Value Growth Value Growth
(Mio $) (%) (Mio $) (%) (Mio $) (%) (Mio $) (%)
Annual Data
2002 51,270,196 35,761,981 -15,508,215 87,032,1772003 69,339,692 35.2 47,252,836 32.1 -22,086,856 42.4 116,592,528 34.02004 97,539,766 40.7 63,120,949 33.6 -34,418,817 55.8 160,660,715 37.82005 116,774,151 19.7 73,476,408 16.4 -43,297,743 25.8 190,250,559 18.42006 139,576,174 19.5 85,534,676 16.4 -54,041,498 24.8 225,110,850 18.32007 170,062,715 21.8 107,271,750 25.4 -62,790,965 16.2 277,334,465 23.22008 201,960,779 18.8 132,002,385 23.1 -69,958,394 11.4 333,963,164 20.42009 140,869,013 -30.2 102,138,526 -22.6 -38,730,487 -44.6 243,007,539 -27.22010 185,541,037 31.7 113,979,452 11.6 -71,561,585 84.8 299,520,489 23.32011 240,838,853 29.8 134,915,252 18.4 -105,923,601 48.0 375,754,105 25.52012 236,544,494 -1.8 152,536,653 13.1 -84,007,841 -20.7 389,081,147 3.52013 251,650,560 6.4 151,868,551 -0.4 -99,782,009 18.8 403,519,111 3.7
Import Export Total Trade
Turkey, Trade with World
Balance
Source Un Comtrade
Partner ValueTrade
Balance
Share in Turkey's Import
Partner ValueTrade
Balance
Share in Turkey's
ExportUS$ (000) US$ (000) (%) US$ (000) US$ (000) (%)
World 251,650,560 -99,782,009 100 World 151,868,551 -99,782,009 1001 EU (28) 92,515,838 -28,344,782 36.8 1 EU (28) 64,171,056 -28,344,782 42.32 Russian Federation 25,063,530 -18,096,541 10.0 2 Germany 13,706,980 -10,477,970 9.03 China 24,686,554 -21,084,445 9.8 3 Iraq 11,958,853 11,813,327 7.94 Germany 24,184,950 -10,477,970 9.6 4 United Kingdom 8,777,301 2,506,441 5.85 Italy 12,887,374 -6,166,409 5.1 5 Russian Federation 6,966,989 -18,096,541 4.66 United States of America 12,596,636 -6,972,406 5.0 6 Italy 6,720,965 -6,166,409 4.47 Iran (Islamic Republic of) 10,383,154 -6,189,204 4.1 7 France 6,378,947 -1,700,793 4.28 Switzerland 9,649,986 -8,613,367 3.8 8 United States of America 5,624,230 -6,972,406 3.79 France 8,079,740 -1,700,793 3.2 9 United Arab Emirates 4,967,636 -416,832 3.3
10 Spain 6,416,653 -2,078,975 2.5 10 Spain 4,337,678 -2,078,975 2.911 India 6367869 -5,780,690 2.5 11 Iran (Islamic Republic of) 4193950 -6,189,204 2.8
Turkey, Top Trading Partner 2013
Import Export
18
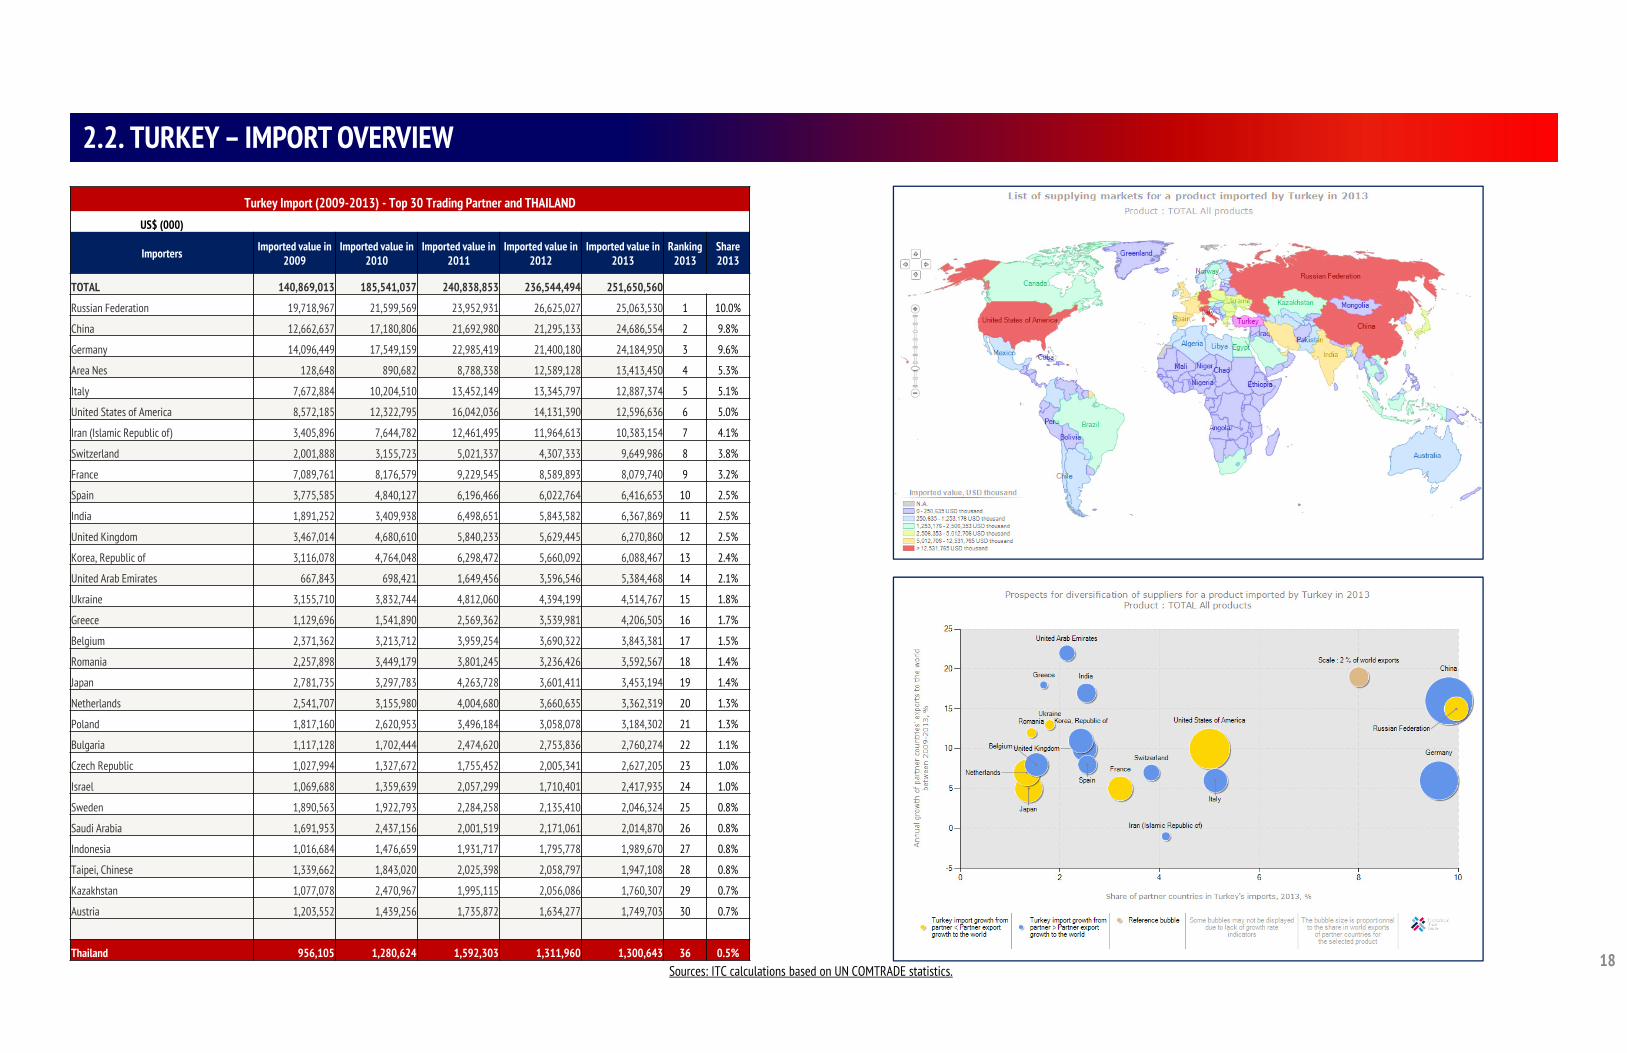
2.2. TURKEY – IMPORT OVERVIEW
Sources: ITC calculations based on UN COMTRADE statistics.
Turkey Import (2009-2013) - Top 30 Trading Partner and THAILANDUS$ (000)
Importers Imported value in 2009
Imported value in 2010
Imported value in 2011
Imported value in 2012
Imported value in 2013
Ranking 2013
Share 2013
TOTAL 140,869,013 185,541,037 240,838,853 236,544,494 251,650,560
Russian Federation 19,718,967 21,599,569 23,952,931 26,625,027 25,063,530 1 10.0%
China 12,662,637 17,180,806 21,692,980 21,295,133 24,686,554 2 9.8%
Germany 14,096,449 17,549,159 22,985,419 21,400,180 24,184,950 3 9.6%
Area Nes 128,648 890,682 8,788,338 12,589,128 13,413,450 4 5.3%
Italy 7,672,884 10,204,510 13,452,149 13,345,797 12,887,374 5 5.1%
United States of America 8,572,185 12,322,795 16,042,036 14,131,390 12,596,636 6 5.0%
Iran (Islamic Republic of) 3,405,896 7,644,782 12,461,495 11,964,613 10,383,154 7 4.1%
Switzerland 2,001,888 3,155,723 5,021,337 4,307,333 9,649,986 8 3.8%
France 7,089,761 8,176,579 9,229,545 8,589,893 8,079,740 9 3.2%
Spain 3,775,585 4,840,127 6,196,466 6,022,764 6,416,653 10 2.5%
India 1,891,252 3,409,938 6,498,651 5,843,582 6,367,869 11 2.5%
United Kingdom 3,467,014 4,680,610 5,840,233 5,629,445 6,270,860 12 2.5%
Korea, Republic of 3,116,078 4,764,048 6,298,472 5,660,092 6,088,467 13 2.4%
United Arab Emirates 667,843 698,421 1,649,456 3,596,546 5,384,468 14 2.1%
Ukraine 3,155,710 3,832,744 4,812,060 4,394,199 4,514,767 15 1.8%
Greece 1,129,696 1,541,890 2,569,362 3,539,981 4,206,505 16 1.7%
Belgium 2,371,362 3,213,712 3,959,254 3,690,322 3,843,381 17 1.5%
Romania 2,257,898 3,449,179 3,801,245 3,236,426 3,592,567 18 1.4%
Japan 2,781,735 3,297,783 4,263,728 3,601,411 3,453,194 19 1.4%
Netherlands 2,541,707 3,155,980 4,004,680 3,660,635 3,362,319 20 1.3%
Poland 1,817,160 2,620,953 3,496,184 3,058,078 3,184,302 21 1.3%
Bulgaria 1,117,128 1,702,444 2,474,620 2,753,836 2,760,274 22 1.1%
Czech Republic 1,027,994 1,327,672 1,755,452 2,005,341 2,627,205 23 1.0%
Israel 1,069,688 1,359,639 2,057,299 1,710,401 2,417,935 24 1.0%
Sweden 1,890,563 1,922,793 2,284,258 2,135,410 2,046,324 25 0.8%
Saudi Arabia 1,691,953 2,437,156 2,001,519 2,171,061 2,014,870 26 0.8%
Indonesia 1,016,684 1,476,659 1,931,717 1,795,778 1,989,670 27 0.8%
Taipei, Chinese 1,339,662 1,843,020 2,025,398 2,058,797 1,947,108 28 0.8%
Kazakhstan 1,077,078 2,470,967 1,995,115 2,056,086 1,760,307 29 0.7%
Austria 1,203,552 1,439,256 1,735,872 1,634,277 1,749,703 30 0.7%
Thailand 956,105 1,280,624 1,592,303 1,311,960 1,300,643 36 0.5%
19
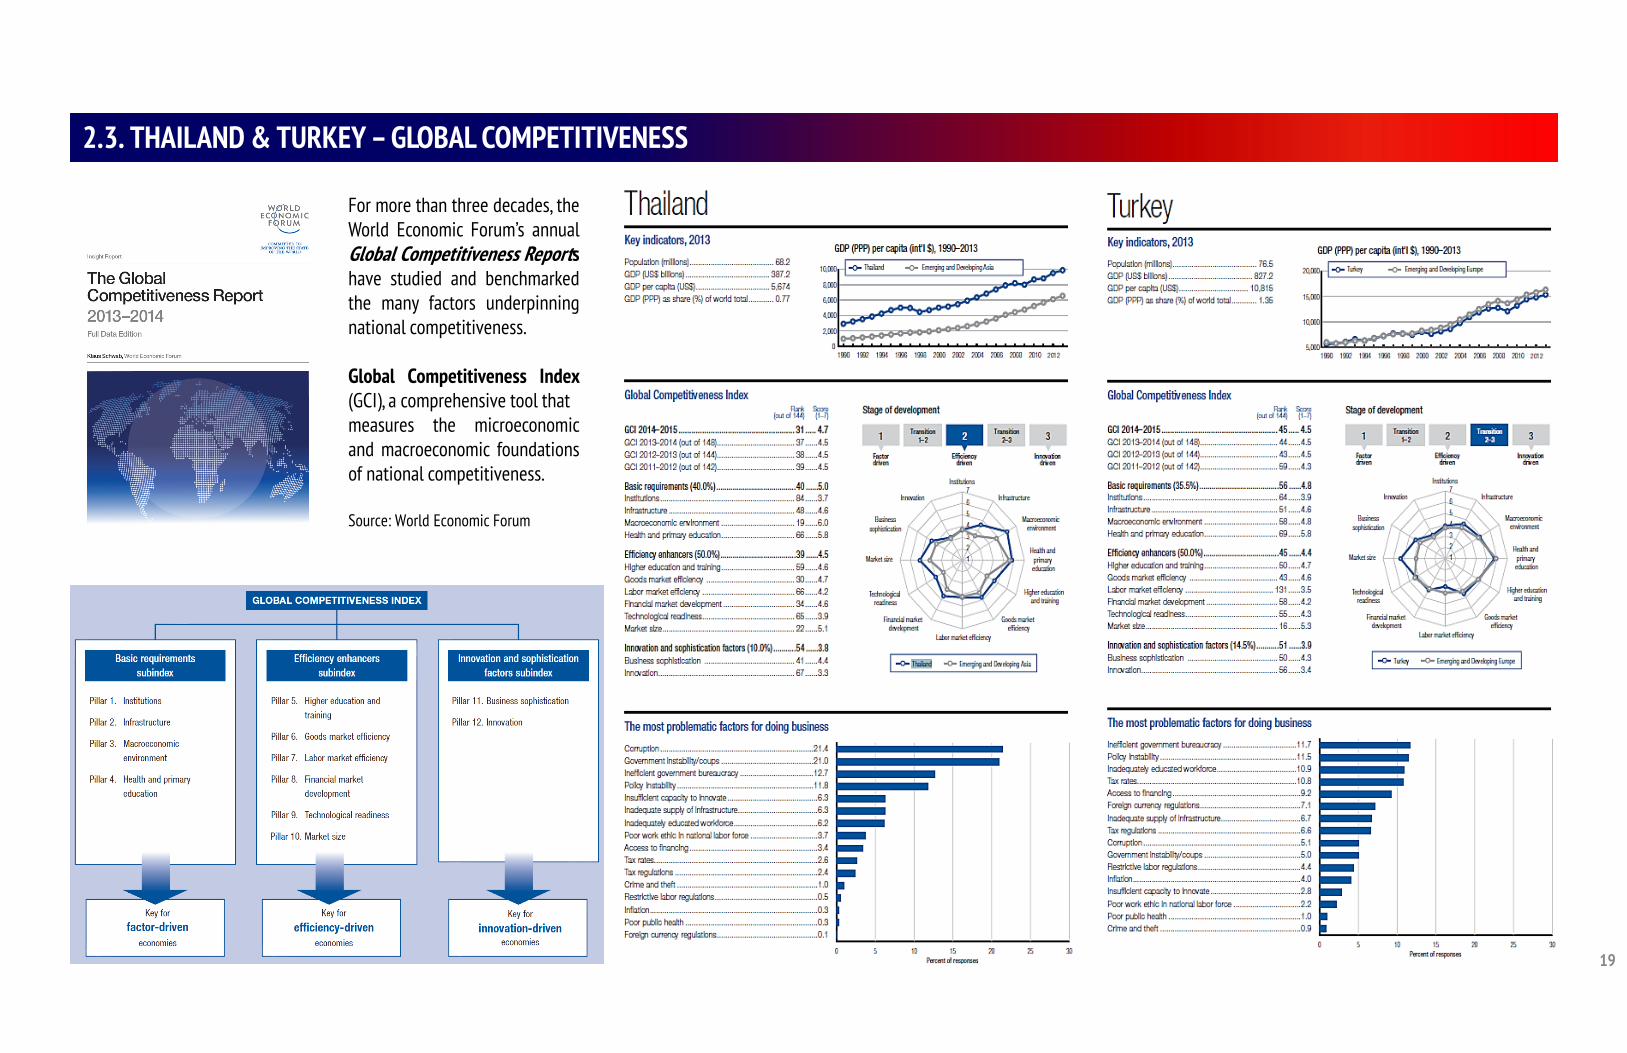
2.3. THAILAND & TURKEY – GLOBAL COMPETITIVENESS
For more than three decades, theWorld Economic Forum’s annualGlobal Competitiveness Reportshave studied and benchmarkedthe many factors underpinningnational competitiveness.
Global Competitiveness Index(GCI), a comprehensive tool thatmeasures the microeconomicand macroeconomic foundationsof national competitiveness.
Source: World Economic Forum
Thailand Year Turkey Year
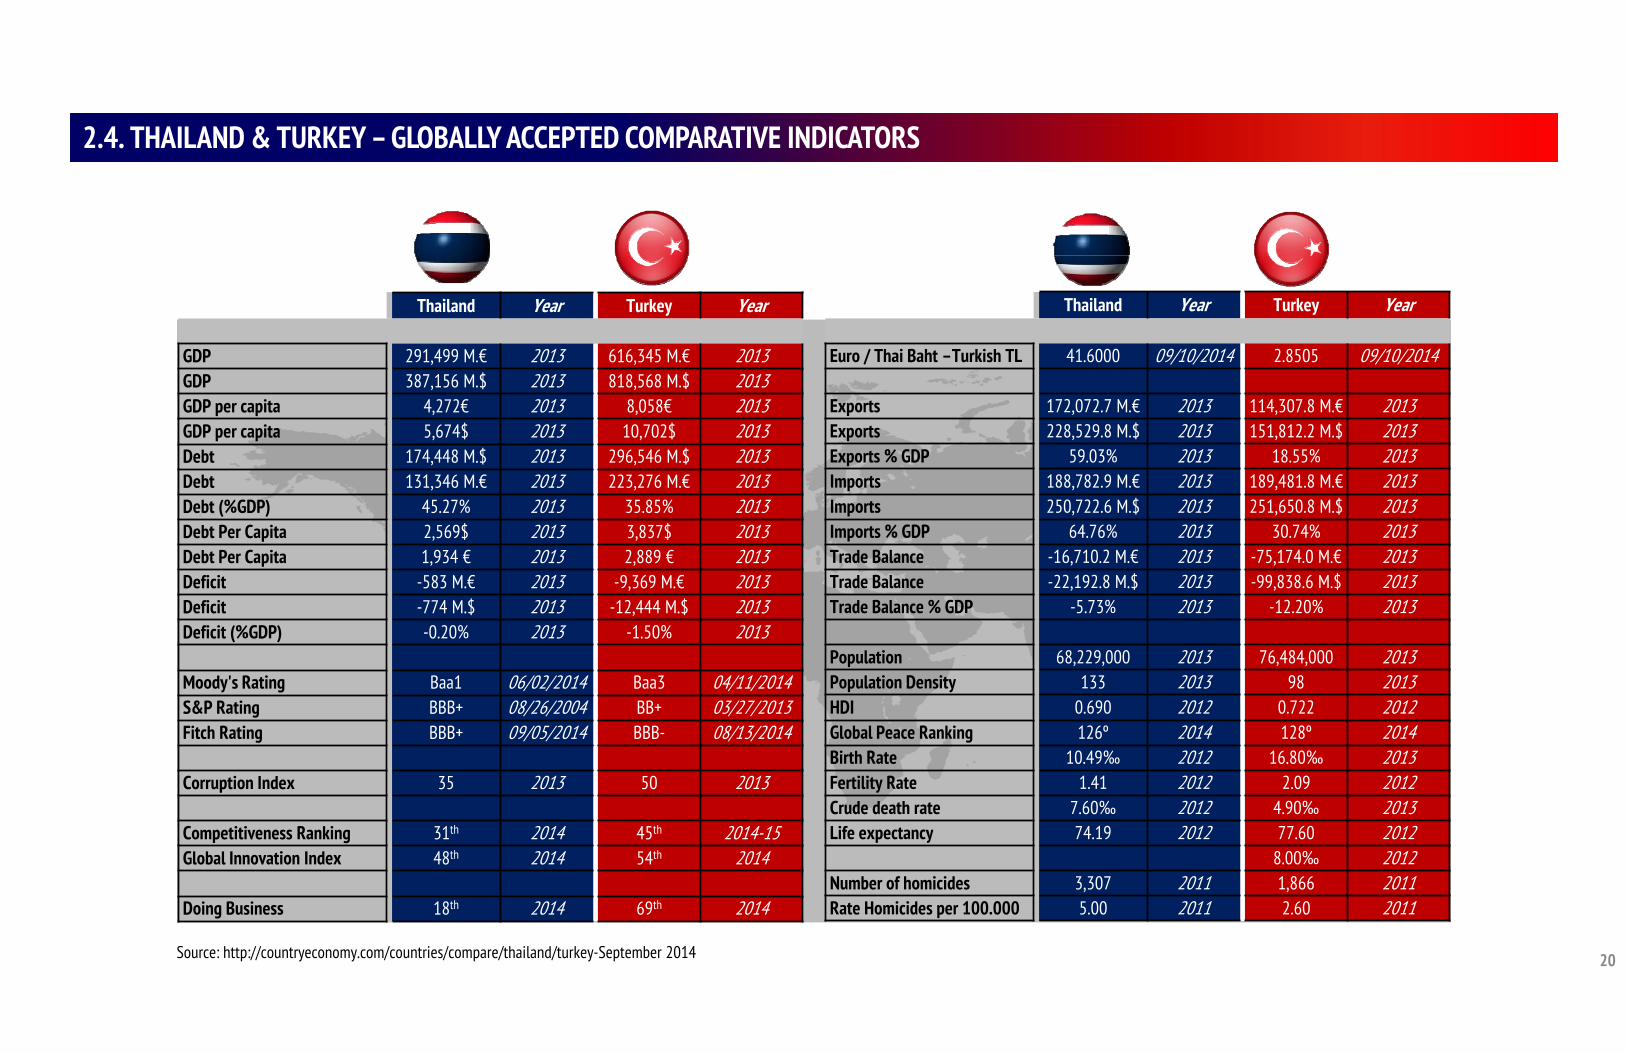
GDP 291,499 M.€ 2013 616,345 M.€ 2013GDP 387,156 M.$ 2013 818,568 M.$ 2013GDP per capita 4,272€ 2013 8,058€ 2013GDP per capita 5,674$ 2013 10,702$ 2013Debt 174,448 M.$ 2013 296,546 M.$ 2013Debt 131,346 M.€ 2013 223,276 M.€ 2013Debt (%GDP) 45.27% 2013 35.85% 2013Debt Per Capita 2,569$ 2013 3,837$ 2013Debt Per Capita 1,934 € 2013 2,889 € 2013Deficit -583 M.€ 2013 -9,369 M.€ 2013Deficit -774 M.$ 2013 -12,444 M.$ 2013Deficit (%GDP) -0.20% 2013 -1.50% 2013
Moody's Rating Baa1 06/02/2014 Baa3 04/11/2014S&P Rating BBB+ 08/26/2004 BB+ 03/27/2013Fitch Rating BBB+ 09/05/2014 BBB- 08/13/2014
Corruption Index 35 2013 50 2013
Competitiveness Ranking 31th 2014 45th 2014-15Global Innovation Index 48th 2014 54th 2014
Doing Business 18th 2014 69th 2014
20
2.4. THAILAND & TURKEY – GLOBALLY ACCEPTED COMPARATIVE INDICATORS
Thailand Year Turkey Year
Euro / Thai Baht –Turkish TL 41.6000 09/10/2014 2.8505 09/10/2014
Exports 172,072.7 M.€ 2013 114,307.8 M.€ 2013Exports 228,529.8 M.$ 2013 151,812.2 M.$ 2013Exports % GDP 59.03% 2013 18.55% 2013Imports 188,782.9 M.€ 2013 189,481.8 M.€ 2013Imports 250,722.6 M.$ 2013 251,650.8 M.$ 2013Imports % GDP 64.76% 2013 30.74% 2013Trade Balance -16,710.2 M.€ 2013 -75,174.0 M.€ 2013Trade Balance -22,192.8 M.$ 2013 -99,838.6 M.$ 2013Trade Balance % GDP -5.73% 2013 -12.20% 2013
Population 68,229,000 2013 76,484,000 2013Population Density 133 2013 98 2013HDI 0.690 2012 0.722 2012Global Peace Ranking 126º 2014 128º 2014Birth Rate 10.49‰ 2012 16.80‰ 2013Fertility Rate 1.41 2012 2.09 2012Crude death rate 7.60‰ 2012 4.90‰ 2013Life expectancy 74.19 2012 77.60 2012
8.00‰ 2012Number of homicides 3,307 2011 1,866 2011Rate Homicides per 100.000 5.00 2011 2.60 2011
Source: http://countryeconomy.com/countries/compare/thailand/turkey-September 2014
ANALYSIS OF TRADE OPPORTUNITIES BETWEEN THAILAND AND TURKEY
PART
Top 10 Product Groups Exported to Turkey
Product Code (HS2) Product label
Thailand's Exports to Turkey
Value in 2013
US$(000)
Average of 2009-2013
'84 Machinery 254,998 181,635'87 Vehicles 238,864 169,592'40 Rubber and articles thereof 172,494 165,947'39 Plastics and articles thereof 128,649 155,236'55 Manmade staple fibres 59,171 110,090'71 Pearls, precious stones, metals, coins, 34,511 31,051'54 Manmade filaments 23,086 25,764'85 Electrical, electronic equipment 30,077 22,858'52 Cotton 18,378 19,974'29 Organic chemicals 13,772 18,748
22
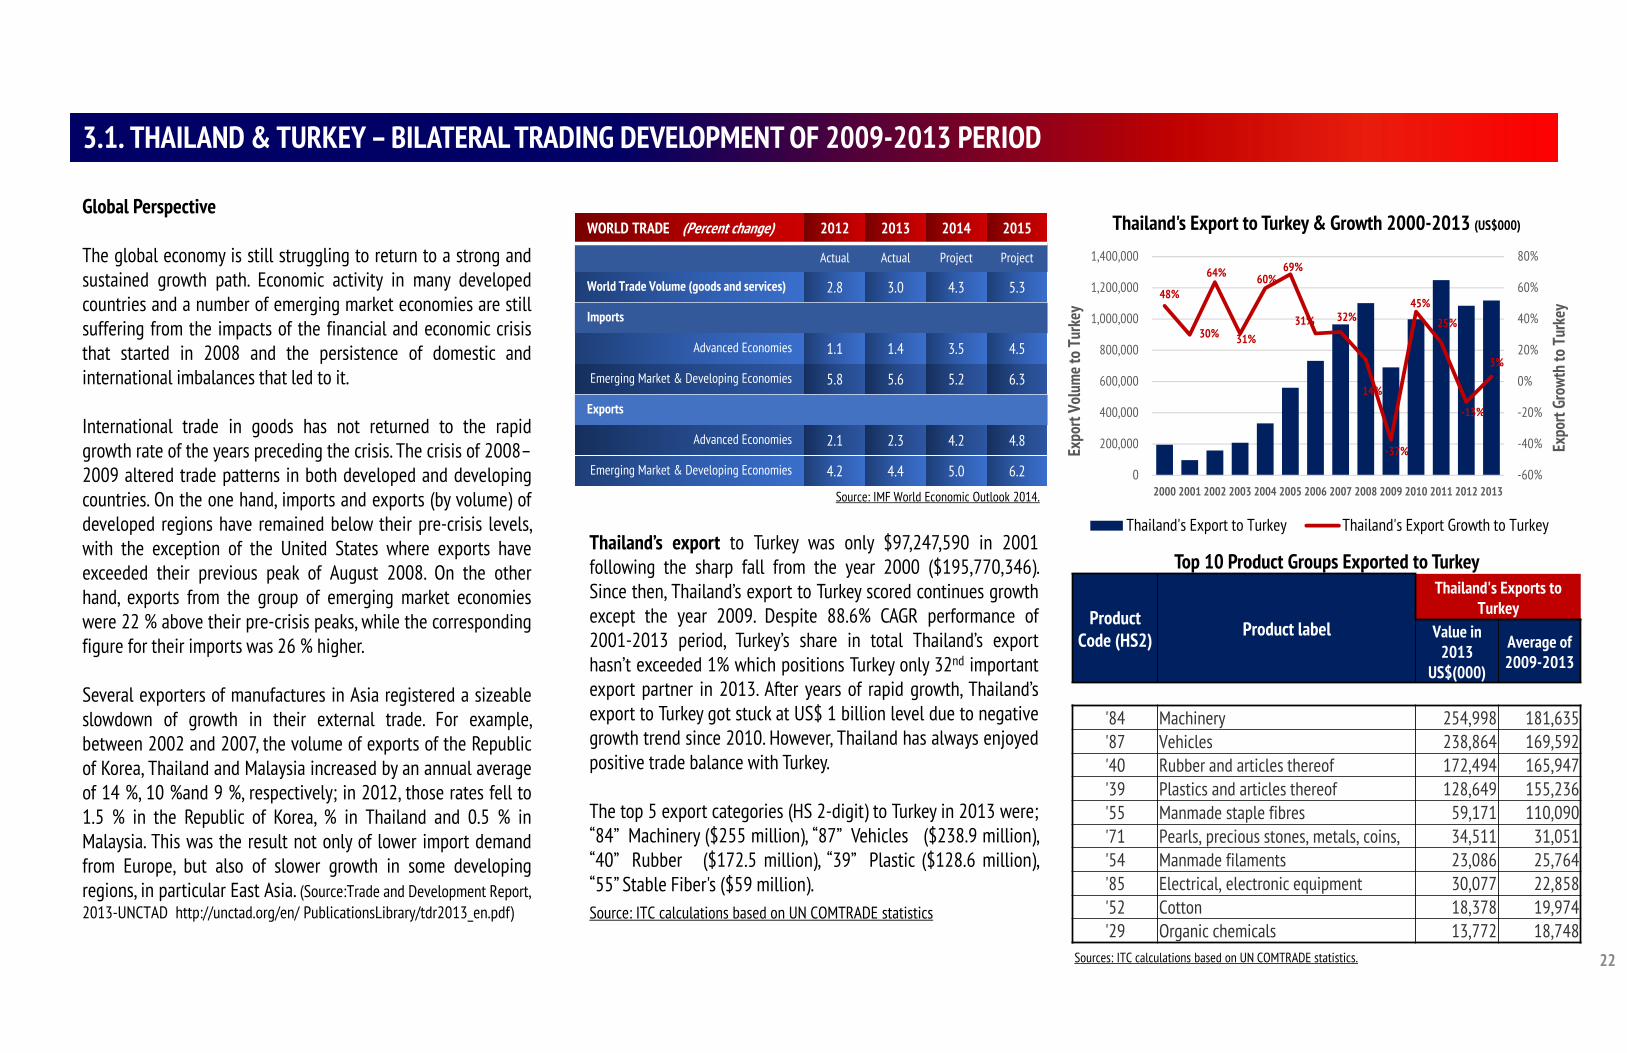
3.1. THAILAND & TURKEY – BILATERAL TRADING DEVELOPMENT OF 2009-2013 PERIOD
Global Perspective
The global economy is still struggling to return to a strong andsustained growth path. Economic activity in many developedcountries and a number of emerging market economies are stillsuffering from the impacts of the financial and economic crisisthat started in 2008 and the persistence of domestic andinternational imbalances that led to it.
International trade in goods has not returned to the rapidgrowth rate of the years preceding the crisis. The crisis of 2008–2009 altered trade patterns in both developed and developingcountries. On the one hand, imports and exports (by volume) ofdeveloped regions have remained below their pre-crisis levels,with the exception of the United States where exports haveexceeded their previous peak of August 2008. On the otherhand, exports from the group of emerging market economieswere 22 % above their pre-crisis peaks, while the correspondingfigure for their imports was 26 % higher.
Several exporters of manufactures in Asia registered a sizeableslowdown of growth in their external trade. For example,between 2002 and 2007, the volume of exports of the Republicof Korea, Thailand and Malaysia increased by an annual averageof 14 %, 10 %and 9 %, respectively; in 2012, those rates fell to1.5 % in the Republic of Korea, % in Thailand and 0.5 % inMalaysia. This was the result not only of lower import demandfrom Europe, but also of slower growth in some developingregions, in particular East Asia. (Source:Trade and Development Report,2013-UNCTAD http://unctad.org/en/ PublicationsLibrary/tdr2013_en.pdf)
Thailand’s export to Turkey was only $97,247,590 in 2001following the sharp fall from the year 2000 ($195,770,346).Since then, Thailand’s export to Turkey scored continues growthexcept the year 2009. Despite 88.6% CAGR performance of2001-2013 period, Turkey’s share in total Thailand’s exporthasn’t exceeded 1% which positions Turkey only 32nd importantexport partner in 2013. After years of rapid growth, Thailand’sexport to Turkey got stuck at US$ 1 billion level due to negativegrowth trend since 2010. However, Thailand has always enjoyedpositive trade balance with Turkey.
The top 5 export categories (HS 2-digit) to Turkey in 2013 were;“84” Machinery ($255 million), “87” Vehicles ($238.9 million),“40” Rubber ($172.5 million), “39” Plastic ($128.6 million),“55” Stable Fiber's ($59 million).Source: ITC calculations based on UN COMTRADE statistics
WORLD TRADE (Percent change) 2012 2013 2014 2015
Actual Actual Project Project
World Trade Volume (goods and services) 2.8 3.0 4.3 5.3
Imports
Advanced Economies 1.1 1.4 3.5 4.5
Emerging Market & Developing Economies 5.8 5.6 5.2 6.3
Exports
Advanced Economies 2.1 2.3 4.2 4.8
Emerging Market & Developing Economies 4.2 4.4 5.0 6.2
Sources: ITC calculations based on UN COMTRADE statistics.
Source: IMF World Economic Outlook 2014.
48%
30%
64%
31%
60%69%
31% 32%
14%
-37%
45%
25%
-13%
3%
-60%
-40%
-20%
0%
20%
40%
60%
80%
0
200,000
400,000
600,000
800,000
1,000,000
1,200,000
1,400,000
2000 2001 2002 2003 2004 2005 2006 2007 2008 2009 2010 2011 2012 2013
Expo
rt Gr
owth
to T
urke
y
Expo
rt Vo
lum
e to
Turk
ey
Thailand's Export to Turkey & Growth 2000-2013 (US$000)
Thailand's Export to Turkey Thailand's Export Growth to Turkey
5%
117%
25%
70%
12%
-25%
107%
-30%
73%
-34%
90%
-25%
29%
31%
-60%
-40%
-20%
0%
20%
40%
60%
80%
100%
120%
140%
0
50,000
100,000
150,000
200,000
250,000
300,000
350,000
2000 2001 2002 2003 2004 2005 2006 2007 2008 2009 2010 2011 2012 2013
Impo
rt Gr
owth
from
Tur
key
Impo
rt Vo
lum
e fro
m T
urke
y
Thailand's Import from Turkey & Growth 2000-2013
Thailand's Import from Turkey Thailand's Import Growth from Turkey
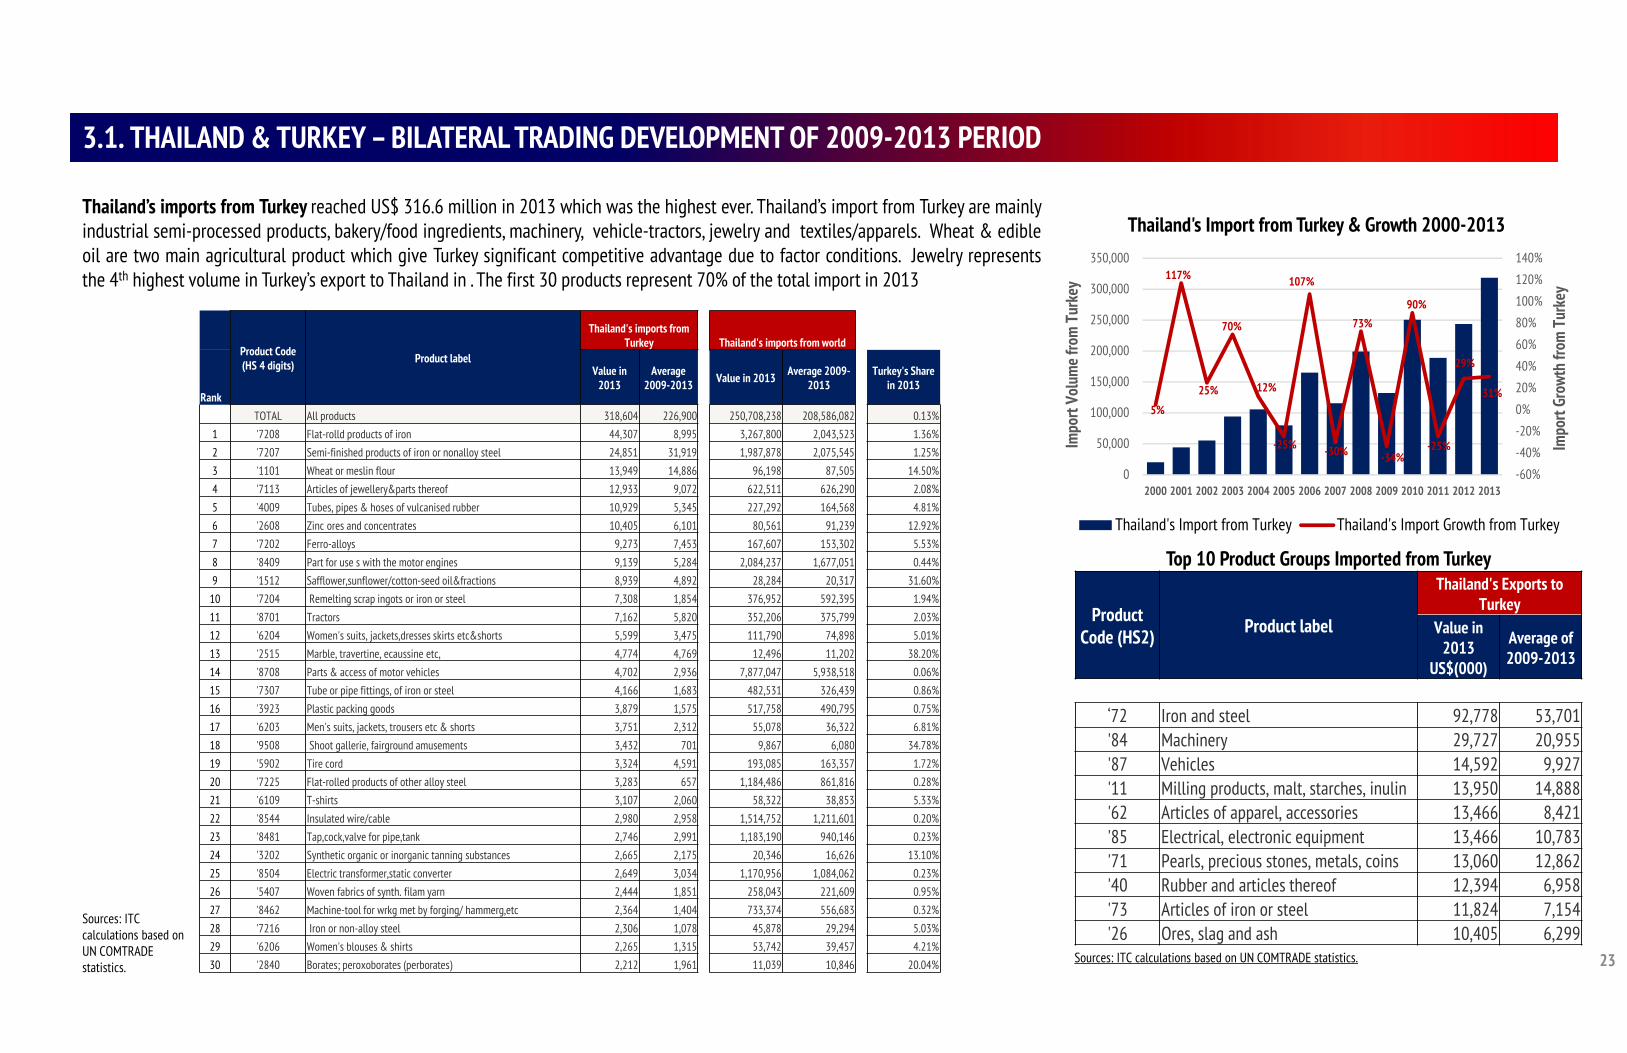
Top 10 Product Groups Imported from Turkey
Product Code (HS2) Product label
Thailand's Exports to Turkey
Value in 2013
US$(000)
Average of 2009-2013
'72 Iron and steel 92778 53701.4‘72 Iron and steel 92,778 53,701'84 Machinery 29,727 20,955'87 Vehicles 14,592 9,927'11 Milling products, malt, starches, inulin 13,950 14,888'62 Articles of apparel, accessories 13,466 8,421'85 Electrical, electronic equipment 13,466 10,783'71 Pearls, precious stones, metals, coins 13,060 12,862'40 Rubber and articles thereof 12,394 6,958'73 Articles of iron or steel 11,824 7,154'26 Ores, slag and ash 10,405 6,299
Thailand’s imports from Turkey reached US$ 316.6 million in 2013 which was the highest ever. Thailand’s import from Turkey are mainlyindustrial semi-processed products, bakery/food ingredients, machinery, vehicle-tractors, jewelry and textiles/apparels. Wheat & edibleoil are two main agricultural product which give Turkey significant competitive advantage due to factor conditions. Jewelry representsthe 4th highest volume in Turkey’s export to Thailand in . The first 30 products represent 70% of the total import in 2013
23
3.1. THAILAND & TURKEY – BILATERAL TRADING DEVELOPMENT OF 2009-2013 PERIOD
Sources: ITC calculations based on UN COMTRADE statistics.
Product Code (HS 4 digits) Product label
Thailand's imports from Turkey Thailand's imports from world
Rank
Value in 2013
Average 2009-2013 Value in 2013 Average 2009-
2013Turkey's Share
in 2013
TOTAL All products 318,604 226,900 250,708,238 208,586,082 0.13%1 '7208 Flat-rolld products of iron 44,307 8,995 3,267,800 2,043,523 1.36%2 '7207 Semi-finished products of iron or nonalloy steel 24,851 31,919 1,987,878 2,075,545 1.25%3 '1101 Wheat or meslin flour 13,949 14,886 96,198 87,505 14.50%4 '7113 Articles of jewellery&parts thereof 12,933 9,072 622,511 626,290 2.08%5 '4009 Tubes, pipes & hoses of vulcanised rubber 10,929 5,345 227,292 164,568 4.81%6 '2608 Zinc ores and concentrates 10,405 6,101 80,561 91,239 12.92%7 '7202 Ferro-alloys 9,273 7,453 167,607 153,302 5.53%8 '8409 Part for use s with the motor engines 9,139 5,284 2,084,237 1,677,051 0.44%9 '1512 Safflower,sunflower/cotton-seed oil&fractions 8,939 4,892 28,284 20,317 31.60%
10 '7204 Remelting scrap ingots or iron or steel 7,308 1,854 376,952 592,395 1.94%11 '8701 Tractors 7,162 5,820 352,206 375,799 2.03%12 '6204 Women's suits, jackets,dresses skirts etc&shorts 5,599 3,475 111,790 74,898 5.01%13 '2515 Marble, travertine, ecaussine etc, 4,774 4,769 12,496 11,202 38.20%14 '8708 Parts & access of motor vehicles 4,702 2,936 7,877,047 5,938,518 0.06%15 '7307 Tube or pipe fittings, of iron or steel 4,166 1,683 482,531 326,439 0.86%16 '3923 Plastic packing goods 3,879 1,575 517,758 490,795 0.75%17 '6203 Men's suits, jackets, trousers etc & shorts 3,751 2,312 55,078 36,322 6.81%18 '9508 Shoot gallerie, fairground amusements 3,432 701 9,867 6,080 34.78%19 '5902 Tire cord 3,324 4,591 193,085 163,357 1.72%20 '7225 Flat-rolled products of other alloy steel 3,283 657 1,184,486 861,816 0.28%21 '6109 T-shirts 3,107 2,060 58,322 38,853 5.33%22 '8544 Insulated wire/cable 2,980 2,958 1,514,752 1,211,601 0.20%23 '8481 Tap,cock,valve for pipe,tank 2,746 2,991 1,183,190 940,146 0.23%24 '3202 Synthetic organic or inorganic tanning substances 2,665 2,175 20,346 16,626 13.10%25 '8504 Electric transformer,static converter 2,649 3,034 1,170,956 1,084,062 0.23%26 '5407 Woven fabrics of synth. filam yarn 2,444 1,851 258,043 221,609 0.95%27 '8462 Machine-tool for wrkg met by forging/ hammerg,etc 2,364 1,404 733,374 556,683 0.32%28 '7216 Iron or non-alloy steel 2,306 1,078 45,878 29,294 5.03%29 '6206 Women's blouses & shirts 2,265 1,315 53,742 39,457 4.21%30 '2840 Borates; peroxoborates (perborates) 2,212 1,961 11,039 10,846 20.04%
Sources: ITC calculations based on UN COMTRADE statistics.
ASSESSMENT OF CURRENT TRADE OPPORTUNITIES BETWEEN THAILAND AND TURKEY
PART
25
4.1. CURRENT EXPORT POTENTIAL ASSESSMENT OF THAILAND FOR TURKEY
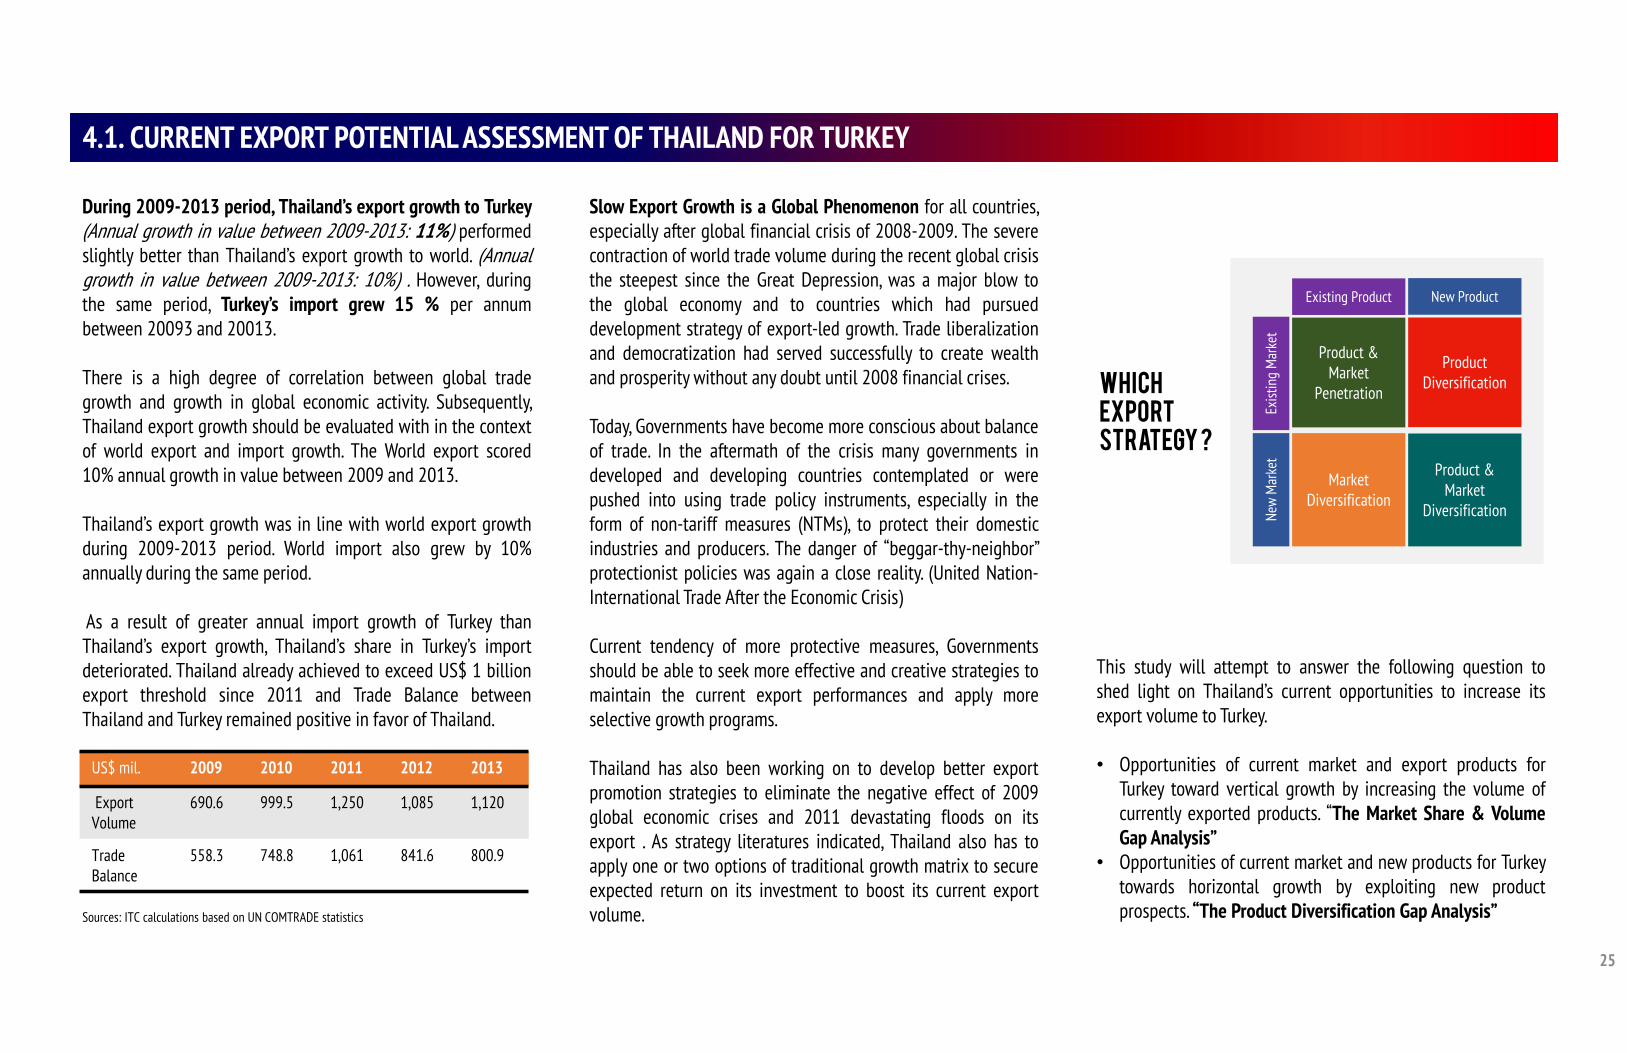
During 2009-2013 period, Thailand’s export growth to Turkey(Annual growth in value between 2009-2013: 11%) performedslightly better than Thailand’s export growth to world. (Annualgrowth in value between 2009-2013: 10%) . However, duringthe same period, Turkey’s import grew 15 % per annumbetween 20093 and 20013.
There is a high degree of correlation between global tradegrowth and growth in global economic activity. Subsequently,Thailand export growth should be evaluated with in the contextof world export and import growth. The World export scored10% annual growth in value between 2009 and 2013.
Thailand’s export growth was in line with world export growthduring 2009-2013 period. World import also grew by 10%annually during the same period.
As a result of greater annual import growth of Turkey thanThailand’s export growth, Thailand’s share in Turkey’s importdeteriorated. Thailand already achieved to exceed US$ 1 billionexport threshold since 2011 and Trade Balance betweenThailand and Turkey remained positive in favor of Thailand.
Slow Export Growth is a Global Phenomenon for all countries,especially after global financial crisis of 2008-2009. The severecontraction of world trade volume during the recent global crisisthe steepest since the Great Depression, was a major blow tothe global economy and to countries which had pursueddevelopment strategy of export-led growth. Trade liberalizationand democratization had served successfully to create wealthand prosperity without any doubt until 2008 financial crises.
Today, Governments have become more conscious about balanceof trade. In the aftermath of the crisis many governments indeveloped and developing countries contemplated or werepushed into using trade policy instruments, especially in theform of non-tariff measures (NTMs), to protect their domesticindustries and producers. The danger of “beggar-thy-neighbor”protectionist policies was again a close reality. (United Nation-International Trade After the Economic Crisis)
Current tendency of more protective measures, Governmentsshould be able to seek more effective and creative strategies tomaintain the current export performances and apply moreselective growth programs.
Thailand has also been working on to develop better exportpromotion strategies to eliminate the negative effect of 2009global economic crises and 2011 devastating floods on itsexport . As strategy literatures indicated, Thailand also has toapply one or two options of traditional growth matrix to secureexpected return on its investment to boost its current exportvolume.
US$ mil. 2009 2010 2011 2012 2013
ExportVolume
690.6 999.5 1,250 1,085 1,120
Trade Balance
558.3 748.8 1,061 841.6 800.9
Sources: ITC calculations based on UN COMTRADE statistics
This study will attempt to answer the following question toshed light on Thailand’s current opportunities to increase itsexport volume to Turkey.
• Opportunities of current market and export products forTurkey toward vertical growth by increasing the volume ofcurrently exported products. “The Market Share & VolumeGap Analysis”
• Opportunities of current market and new products for Turkeytowards horizontal growth by exploiting new productprospects. “The Product Diversification Gap Analysis”
Product & Market
Penetration
Market Diversification
Product & Market
Diversification
Existing Product
Exist
ing
Mar
ket
New
Mar
ket
Product Diversification
New Product
Which Export Strategy ?
26
4.1. CURRENT EXPORT POTENTIAL ASSESSMENT OF THAILAND – SELECTED SECTOR PERFORMANCE DEVELOPMENT (2009-2012)
*Net exports, per capita exports, share in world market, product diversification, market diversification. ** Absolute change of world market share (% points p.a)
Ranking of international competitiveness in terms of statics indicators (Current index)*and the change in world market share (percentage points)**
Thailand Trade Performance Index - 2012 Thailand Trade Performance Index - 2009
Current Index* Change in World Market Share**
Secto
r (ex
port
2009
in U
S$ m
illio
n)
Secto
r (ex
port
2012
in U
S$ m
illio
n)
Sources: ITC Trade Competitiveness Map-Thailand
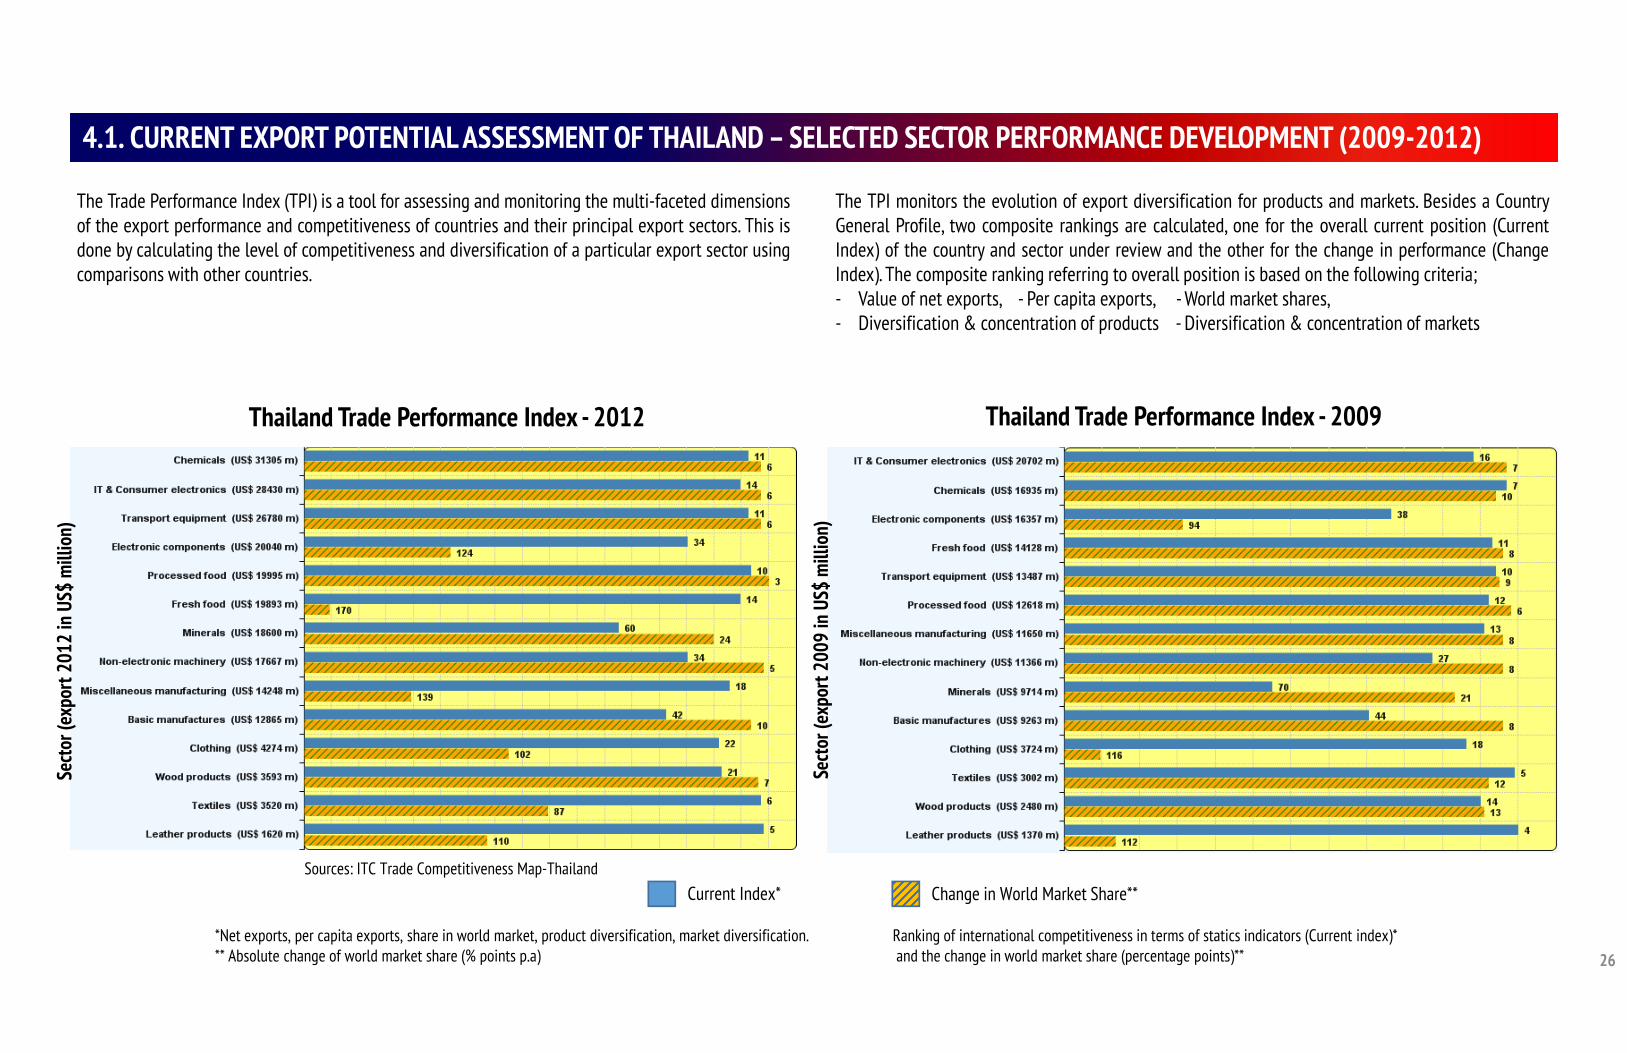
The Trade Performance Index (TPI) is a tool for assessing and monitoring the multi-faceted dimensionsof the export performance and competitiveness of countries and their principal export sectors. This isdone by calculating the level of competitiveness and diversification of a particular export sector usingcomparisons with other countries.
The TPI monitors the evolution of export diversification for products and markets. Besides a CountryGeneral Profile, two composite rankings are calculated, one for the overall current position (CurrentIndex) of the country and sector under review and the other for the change in performance (ChangeIndex). The composite ranking referring to overall position is based on the following criteria;- Value of net exports, - Per capita exports, - World market shares,- Diversification & concentration of products - Diversification & concentration of markets
27
4.2. CURRENT MARKET SHARE & VOLUME GAP ANALYSIS
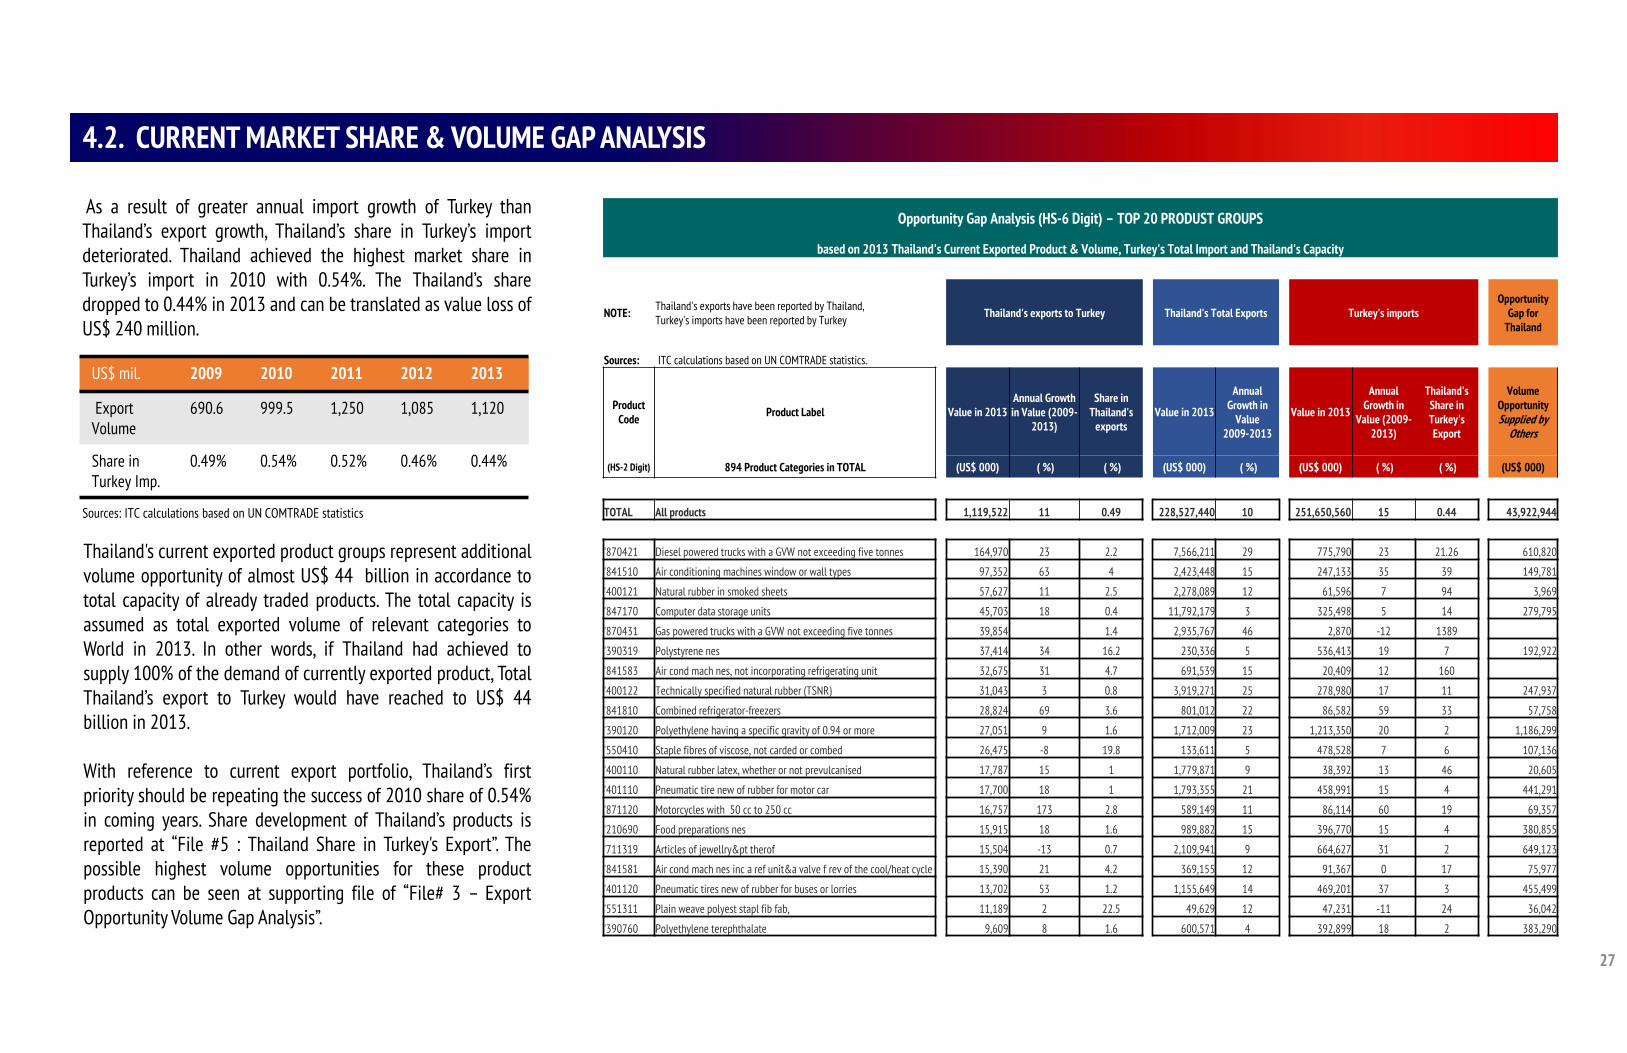
As a result of greater annual import growth of Turkey thanThailand’s export growth, Thailand’s share in Turkey’s importdeteriorated. Thailand achieved the highest market share inTurkey’s import in 2010 with 0.54%. The Thailand’s sharedropped to 0.44% in 2013 and can be translated as value loss ofUS$ 240 million.
US$ mil. 2009 2010 2011 2012 2013
ExportVolume
690.6 999.5 1,250 1,085 1,120
Share in Turkey Imp.
0.49% 0.54% 0.52% 0.46% 0.44%
Sources: ITC calculations based on UN COMTRADE statistics
Thailand's current exported product groups represent additionalvolume opportunity of almost US$ 44 billion in accordance tototal capacity of already traded products. The total capacity isassumed as total exported volume of relevant categories toWorld in 2013. In other words, if Thailand had achieved tosupply 100% of the demand of currently exported product, TotalThailand’s export to Turkey would have reached to US$ 44billion in 2013.
With reference to current export portfolio, Thailand’s firstpriority should be repeating the success of 2010 share of 0.54%in coming years. Share development of Thailand’s products isreported at “File #5 : Thailand Share in Turkey's Export”. Thepossible highest volume opportunities for these productproducts can be seen at supporting file of “File# 3 – ExportOpportunity Volume Gap Analysis”.
Opportunity Gap Analysis (HS-6 Digit) – TOP 20 PRODUST GROUPS
based on 2013 Thailand's Current Exported Product & Volume, Turkey's Total Import and Thailand's Capacity
NOTE: Thailand's exports have been reported by Thailand, Turkey's imports have been reported by Turkey Thailand's exports to Turkey Thailand's Total Exports Turkey's imports
Opportunity Gap for
Thailand
Sources: ITC calculations based on UN COMTRADE statistics.
Product Code Product Label Value in 2013
Annual Growth in Value (2009-
2013)
Share in Thailand's
exportsValue in 2013
Annual Growth in
Value 2009-2013
Value in 2013
Annual Growth in
Value (2009-2013)
Thailand's Share in Turkey's Export
Volume Opportunity Supplied by
Others
(HS-2 Digit) 894 Product Categories in TOTAL (US$ 000) ( %) ( %) (US$ 000) ( %) (US$ 000) ( %) ( %) (US$ 000)
TOTAL All products 1,119,522 11 0.49 228,527,440 10 251,650,560 15 0.44 43,922,944
'870421 Diesel powered trucks with a GVW not exceeding five tonnes 164,970 23 2.2 7,566,211 29 775,790 23 21.26 610,820
'841510 Air conditioning machines window or wall types 97,352 63 4 2,423,448 15 247,133 35 39 149,781
'400121 Natural rubber in smoked sheets 57,627 11 2.5 2,278,089 12 61,596 7 94 3,969
'847170 Computer data storage units 45,703 18 0.4 11,792,179 3 325,498 5 14 279,795
'870431 Gas powered trucks with a GVW not exceeding five tonnes 39,854 1.4 2,935,767 46 2,870 -12 1389
'390319 Polystyrene nes 37,414 34 16.2 230,336 5 536,413 19 7 192,922
'841583 Air cond mach nes, not incorporating refrigerating unit 32,675 31 4.7 691,539 15 20,409 12 160
'400122 Technically specified natural rubber (TSNR) 31,043 3 0.8 3,919,271 25 278,980 17 11 247,937
'841810 Combined refrigerator-freezers 28,824 69 3.6 801,012 22 86,582 59 33 57,758
'390120 Polyethylene having a specific gravity of 0.94 or more 27,051 9 1.6 1,712,009 23 1,213,350 20 2 1,186,299
'550410 Staple fibres of viscose, not carded or combed 26,475 -8 19.8 133,611 5 478,528 7 6 107,136
'400110 Natural rubber latex, whether or not prevulcanised 17,787 15 1 1,779,871 9 38,392 13 46 20,605
'401110 Pneumatic tire new of rubber for motor car 17,700 18 1 1,793,355 21 458,991 15 4 441,291
'871120 Motorcycles with 50 cc to 250 cc 16,757 173 2.8 589,149 11 86,114 60 19 69,357
'210690 Food preparations nes 15,915 18 1.6 989,882 15 396,770 15 4 380,855
'711319 Articles of jewellry&pt therof 15,504 -13 0.7 2,109,941 9 664,627 31 2 649,123
'841581 Air cond mach nes inc a ref unit&a valve f rev of the cool/heat cycle 15,390 21 4.2 369,155 12 91,367 0 17 75,977
'401120 Pneumatic tires new of rubber for buses or lorries 13,702 53 1.2 1,155,649 14 469,201 37 3 455,499
'551311 Plain weave polyest stapl fib fab, 11,189 2 22.5 49,629 12 47,231 -11 24 36,042
'390760 Polyethylene terephthalate 9,609 8 1.6 600,571 4 392,899 18 2 383,290
28
4.2. CURRENT MARKET SHARE & VOLUME GAP ANALYSIS
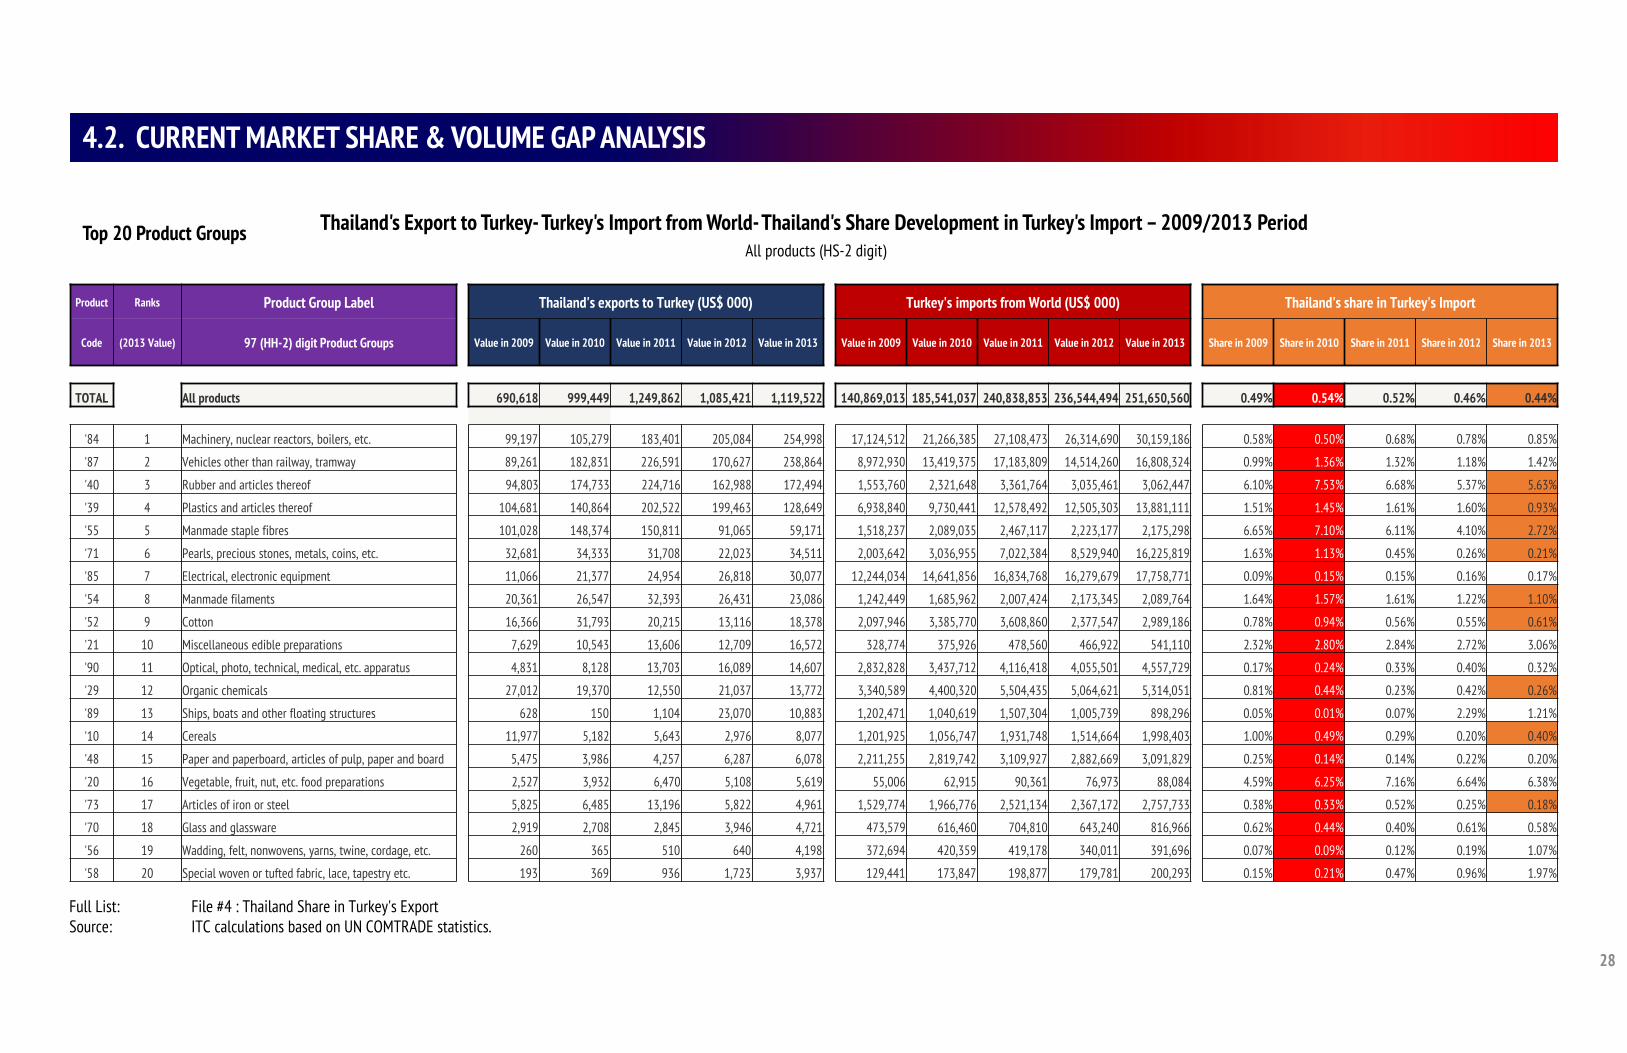
Thailand's Export to Turkey- Turkey's Import from World-Thailand's Share Development in Turkey's Import – 2009/2013 PeriodAll products (HS-2 digit)
Product Ranks Product Group Label Thailand's exports to Turkey (US$ 000) Turkey's imports from World (US$ 000) Thailand's share in Turkey's Import
Code (2013 Value) 97 (HH-2) digit Product Groups Value in 2009 Value in 2010 Value in 2011 Value in 2012 Value in 2013 Value in 2009 Value in 2010 Value in 2011 Value in 2012 Value in 2013 Share in 2009 Share in 2010 Share in 2011 Share in 2012 Share in 2013
TOTAL All products 690,618 999,449 1,249,862 1,085,421 1,119,522 140,869,013 185,541,037 240,838,853 236,544,494 251,650,560 0.49% 0.54% 0.52% 0.46% 0.44%
'84 1 Machinery, nuclear reactors, boilers, etc. 99,197 105,279 183,401 205,084 254,998 17,124,512 21,266,385 27,108,473 26,314,690 30,159,186 0.58% 0.50% 0.68% 0.78% 0.85%
'87 2 Vehicles other than railway, tramway 89,261 182,831 226,591 170,627 238,864 8,972,930 13,419,375 17,183,809 14,514,260 16,808,324 0.99% 1.36% 1.32% 1.18% 1.42%
'40 3 Rubber and articles thereof 94,803 174,733 224,716 162,988 172,494 1,553,760 2,321,648 3,361,764 3,035,461 3,062,447 6.10% 7.53% 6.68% 5.37% 5.63%
'39 4 Plastics and articles thereof 104,681 140,864 202,522 199,463 128,649 6,938,840 9,730,441 12,578,492 12,505,303 13,881,111 1.51% 1.45% 1.61% 1.60% 0.93%
'55 5 Manmade staple fibres 101,028 148,374 150,811 91,065 59,171 1,518,237 2,089,035 2,467,117 2,223,177 2,175,298 6.65% 7.10% 6.11% 4.10% 2.72%
'71 6 Pearls, precious stones, metals, coins, etc. 32,681 34,333 31,708 22,023 34,511 2,003,642 3,036,955 7,022,384 8,529,940 16,225,819 1.63% 1.13% 0.45% 0.26% 0.21%
'85 7 Electrical, electronic equipment 11,066 21,377 24,954 26,818 30,077 12,244,034 14,641,856 16,834,768 16,279,679 17,758,771 0.09% 0.15% 0.15% 0.16% 0.17%
'54 8 Manmade filaments 20,361 26,547 32,393 26,431 23,086 1,242,449 1,685,962 2,007,424 2,173,345 2,089,764 1.64% 1.57% 1.61% 1.22% 1.10%
'52 9 Cotton 16,366 31,793 20,215 13,116 18,378 2,097,946 3,385,770 3,608,860 2,377,547 2,989,186 0.78% 0.94% 0.56% 0.55% 0.61%
'21 10 Miscellaneous edible preparations 7,629 10,543 13,606 12,709 16,572 328,774 375,926 478,560 466,922 541,110 2.32% 2.80% 2.84% 2.72% 3.06%
'90 11 Optical, photo, technical, medical, etc. apparatus 4,831 8,128 13,703 16,089 14,607 2,832,828 3,437,712 4,116,418 4,055,501 4,557,729 0.17% 0.24% 0.33% 0.40% 0.32%
'29 12 Organic chemicals 27,012 19,370 12,550 21,037 13,772 3,340,589 4,400,320 5,504,435 5,064,621 5,314,051 0.81% 0.44% 0.23% 0.42% 0.26%
'89 13 Ships, boats and other floating structures 628 150 1,104 23,070 10,883 1,202,471 1,040,619 1,507,304 1,005,739 898,296 0.05% 0.01% 0.07% 2.29% 1.21%
'10 14 Cereals 11,977 5,182 5,643 2,976 8,077 1,201,925 1,056,747 1,931,748 1,514,664 1,998,403 1.00% 0.49% 0.29% 0.20% 0.40%
'48 15 Paper and paperboard, articles of pulp, paper and board 5,475 3,986 4,257 6,287 6,078 2,211,255 2,819,742 3,109,927 2,882,669 3,091,829 0.25% 0.14% 0.14% 0.22% 0.20%
'20 16 Vegetable, fruit, nut, etc. food preparations 2,527 3,932 6,470 5,108 5,619 55,006 62,915 90,361 76,973 88,084 4.59% 6.25% 7.16% 6.64% 6.38%
'73 17 Articles of iron or steel 5,825 6,485 13,196 5,822 4,961 1,529,774 1,966,776 2,521,134 2,367,172 2,757,733 0.38% 0.33% 0.52% 0.25% 0.18%
'70 18 Glass and glassware 2,919 2,708 2,845 3,946 4,721 473,579 616,460 704,810 643,240 816,966 0.62% 0.44% 0.40% 0.61% 0.58%
'56 19 Wadding, felt, nonwovens, yarns, twine, cordage, etc. 260 365 510 640 4,198 372,694 420,359 419,178 340,011 391,696 0.07% 0.09% 0.12% 0.19% 1.07%
'58 20 Special woven or tufted fabric, lace, tapestry etc. 193 369 936 1,723 3,937 129,441 173,847 198,877 179,781 200,293 0.15% 0.21% 0.47% 0.96% 1.97%
Full List: File #4 : Thailand Share in Turkey's ExportSource: ITC calculations based on UN COMTRADE statistics.
Top 20 Product Groups
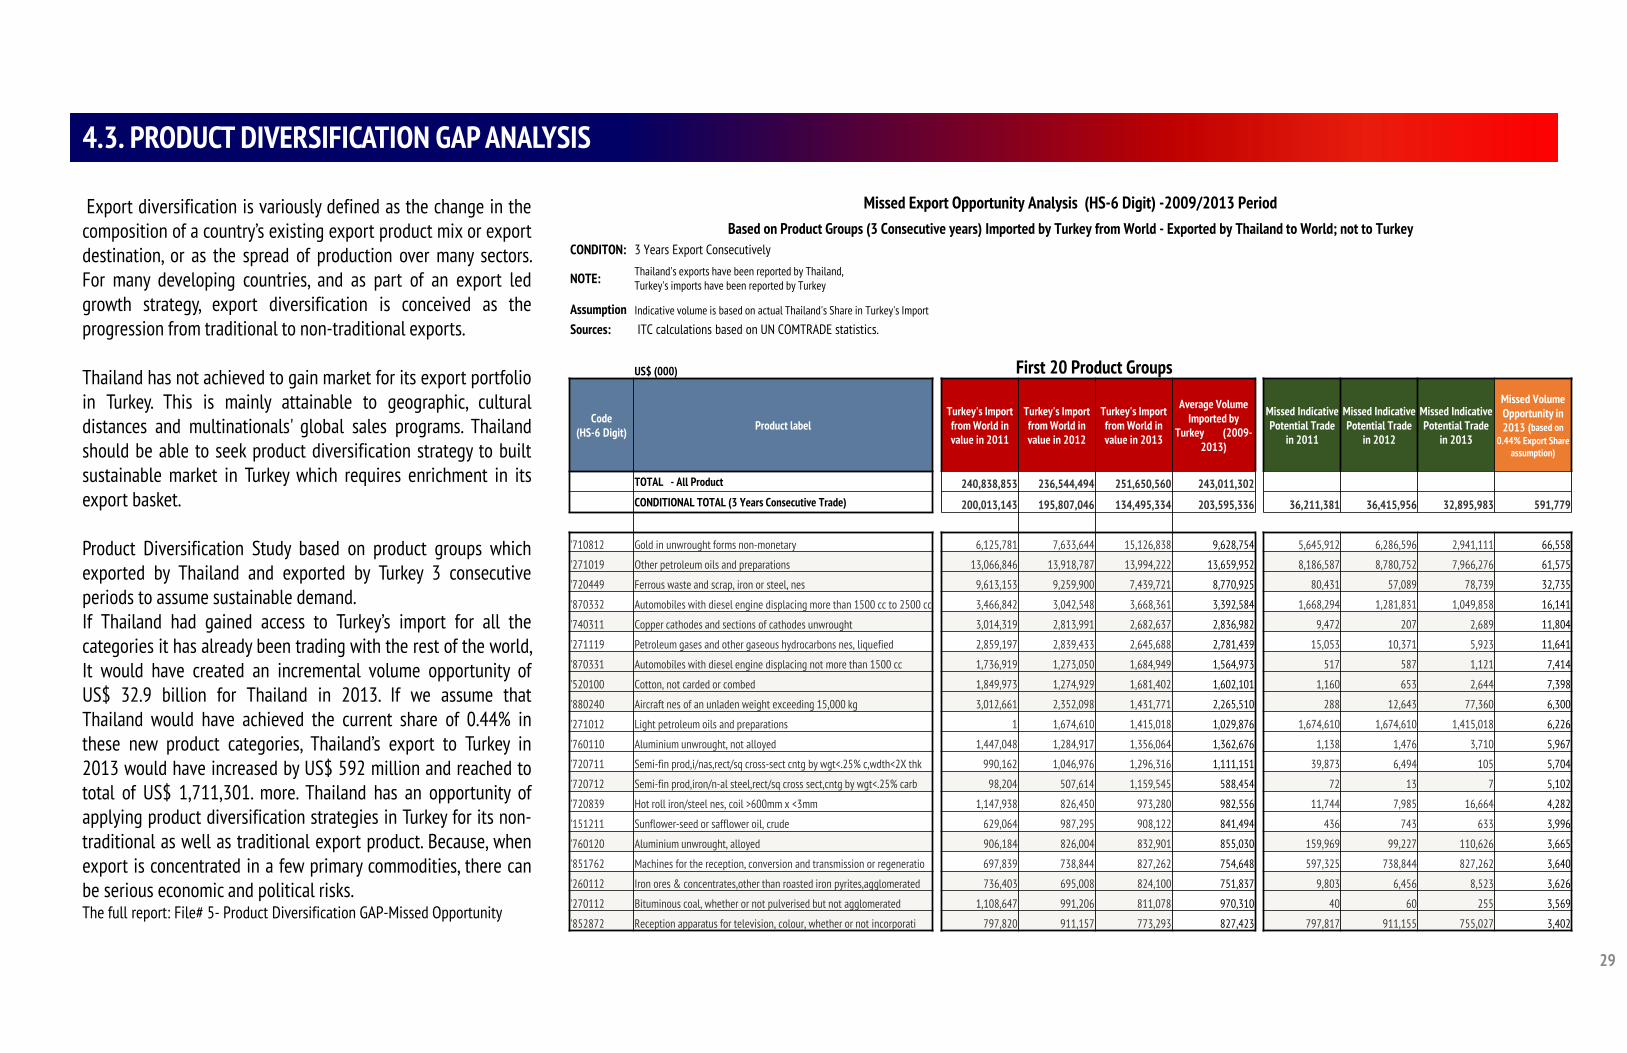
Missed Export Opportunity Analysis (HS-6 Digit) -2009/2013 PeriodBased on Product Groups (3 Consecutive years) Imported by Turkey from World - Exported by Thailand to World; not to Turkey
CONDITON: 3 Years Export Consecutively
NOTE: Thailand's exports have been reported by Thailand, Turkey's imports have been reported by Turkey
Assumption Indicative volume is based on actual Thailand's Share in Turkey's Import
Sources: ITC calculations based on UN COMTRADE statistics.
US$ (000)
Code (HS-6 Digit) Product label
Turkey's Import from World in value in 2011
Turkey's Import from World in value in 2012
Turkey's Import from World in value in 2013
Average Volume Imported by
Turkey (2009-2013)
Missed Indicative Potential Trade
in 2011
Missed Indicative Potential Trade
in 2012
Missed Indicative Potential Trade
in 2013
Missed Volume Opportunity in 2013 (based on
0.44% Export Share assumption)
TOTAL - All Product 240,838,853 236,544,494 251,650,560 243,011,302 0 0 227,407,918 227,813,707CONDITIONAL TOTAL (3 Years Consecutive Trade) 200,013,143 195,807,046 134,495,334 203,595,336 36,211,381 36,415,956 32,895,983 591,779
'710812 Gold in unwrought forms non-monetary 6,125,781 7,633,644 15,126,838 9,628,754 5,645,912 6,286,596 2,941,111 66,558
'271019 Other petroleum oils and preparations 13,066,846 13,918,787 13,994,222 13,659,952 8,186,587 8,780,752 7,966,276 61,575
'720449 Ferrous waste and scrap, iron or steel, nes 9,613,153 9,259,900 7,439,721 8,770,925 80,431 57,089 78,739 32,735
'870332 Automobiles with diesel engine displacing more than 1500 cc to 2500 cc 3,466,842 3,042,548 3,668,361 3,392,584 1,668,294 1,281,831 1,049,858 16,141
'740311 Copper cathodes and sections of cathodes unwrought 3,014,319 2,813,991 2,682,637 2,836,982 9,472 207 2,689 11,804
'271119 Petroleum gases and other gaseous hydrocarbons nes, liquefied 2,859,197 2,839,433 2,645,688 2,781,439 15,053 10,371 5,923 11,641
'870331 Automobiles with diesel engine displacing not more than 1500 cc 1,736,919 1,273,050 1,684,949 1,564,973 517 587 1,121 7,414
'520100 Cotton, not carded or combed 1,849,973 1,274,929 1,681,402 1,602,101 1,160 653 2,644 7,398
'880240 Aircraft nes of an unladen weight exceeding 15,000 kg 3,012,661 2,352,098 1,431,771 2,265,510 288 12,643 77,360 6,300
'271012 Light petroleum oils and preparations 1 1,674,610 1,415,018 1,029,876 1,674,610 1,674,610 1,415,018 6,226
'760110 Aluminium unwrought, not alloyed 1,447,048 1,284,917 1,356,064 1,362,676 1,138 1,476 3,710 5,967
'720711 Semi-fin prod,i/nas,rect/sq cross-sect cntg by wgt<.25% c,wdth<2X thk 990,162 1,046,976 1,296,316 1,111,151 39,873 6,494 105 5,704
'720712 Semi-fin prod,iron/n-al steel,rect/sq cross sect,cntg by wgt<.25% carb 98,204 507,614 1,159,545 588,454 72 13 7 5,102
'720839 Hot roll iron/steel nes, coil >600mm x <3mm 1,147,938 826,450 973,280 982,556 11,744 7,985 16,664 4,282
'151211 Sunflower-seed or safflower oil, crude 629,064 987,295 908,122 841,494 436 743 633 3,996
'760120 Aluminium unwrought, alloyed 906,184 826,004 832,901 855,030 159,969 99,227 110,626 3,665
'851762 Machines for the reception, conversion and transmission or regeneratio 697,839 738,844 827,262 754,648 597,325 738,844 827,262 3,640
'260112 Iron ores & concentrates,other than roasted iron pyrites,agglomerated 736,403 695,008 824,100 751,837 9,803 6,456 8,523 3,626
'270112 Bituminous coal, whether or not pulverised but not agglomerated 1,108,647 991,206 811,078 970,310 40 60 255 3,569
'852872 Reception apparatus for television, colour, whether or not incorporati 797,820 911,157 773,293 827,423 797,817 911,155 755,027 3,402
29
4.3. PRODUCT DIVERSIFICATION GAP ANALYSIS
Export diversification is variously defined as the change in thecomposition of a country’s existing export product mix or exportdestination, or as the spread of production over many sectors.For many developing countries, and as part of an export ledgrowth strategy, export diversification is conceived as theprogression from traditional to non-traditional exports.
Thailand has not achieved to gain market for its export portfolioin Turkey. This is mainly attainable to geographic, culturaldistances and multinationals' global sales programs. Thailandshould be able to seek product diversification strategy to builtsustainable market in Turkey which requires enrichment in itsexport basket.
Product Diversification Study based on product groups whichexported by Thailand and exported by Turkey 3 consecutiveperiods to assume sustainable demand.If Thailand had gained access to Turkey’s import for all thecategories it has already been trading with the rest of the world,It would have created an incremental volume opportunity ofUS$ 32.9 billion for Thailand in 2013. If we assume thatThailand would have achieved the current share of 0.44% inthese new product categories, Thailand’s export to Turkey in2013 would have increased by US$ 592 million and reached tototal of US$ 1,711,301. more. Thailand has an opportunity ofapplying product diversification strategies in Turkey for its non-traditional as well as traditional export product. Because, whenexport is concentrated in a few primary commodities, there canbe serious economic and political risks.The full report: File# 5- Product Diversification GAP-Missed Opportunity
First 20 Product Groups

ASSESSMENT OF MOST POTANTIAL PRODUCTS FOR FUTURE EXPORT GROWTH IN TURKEY
PART
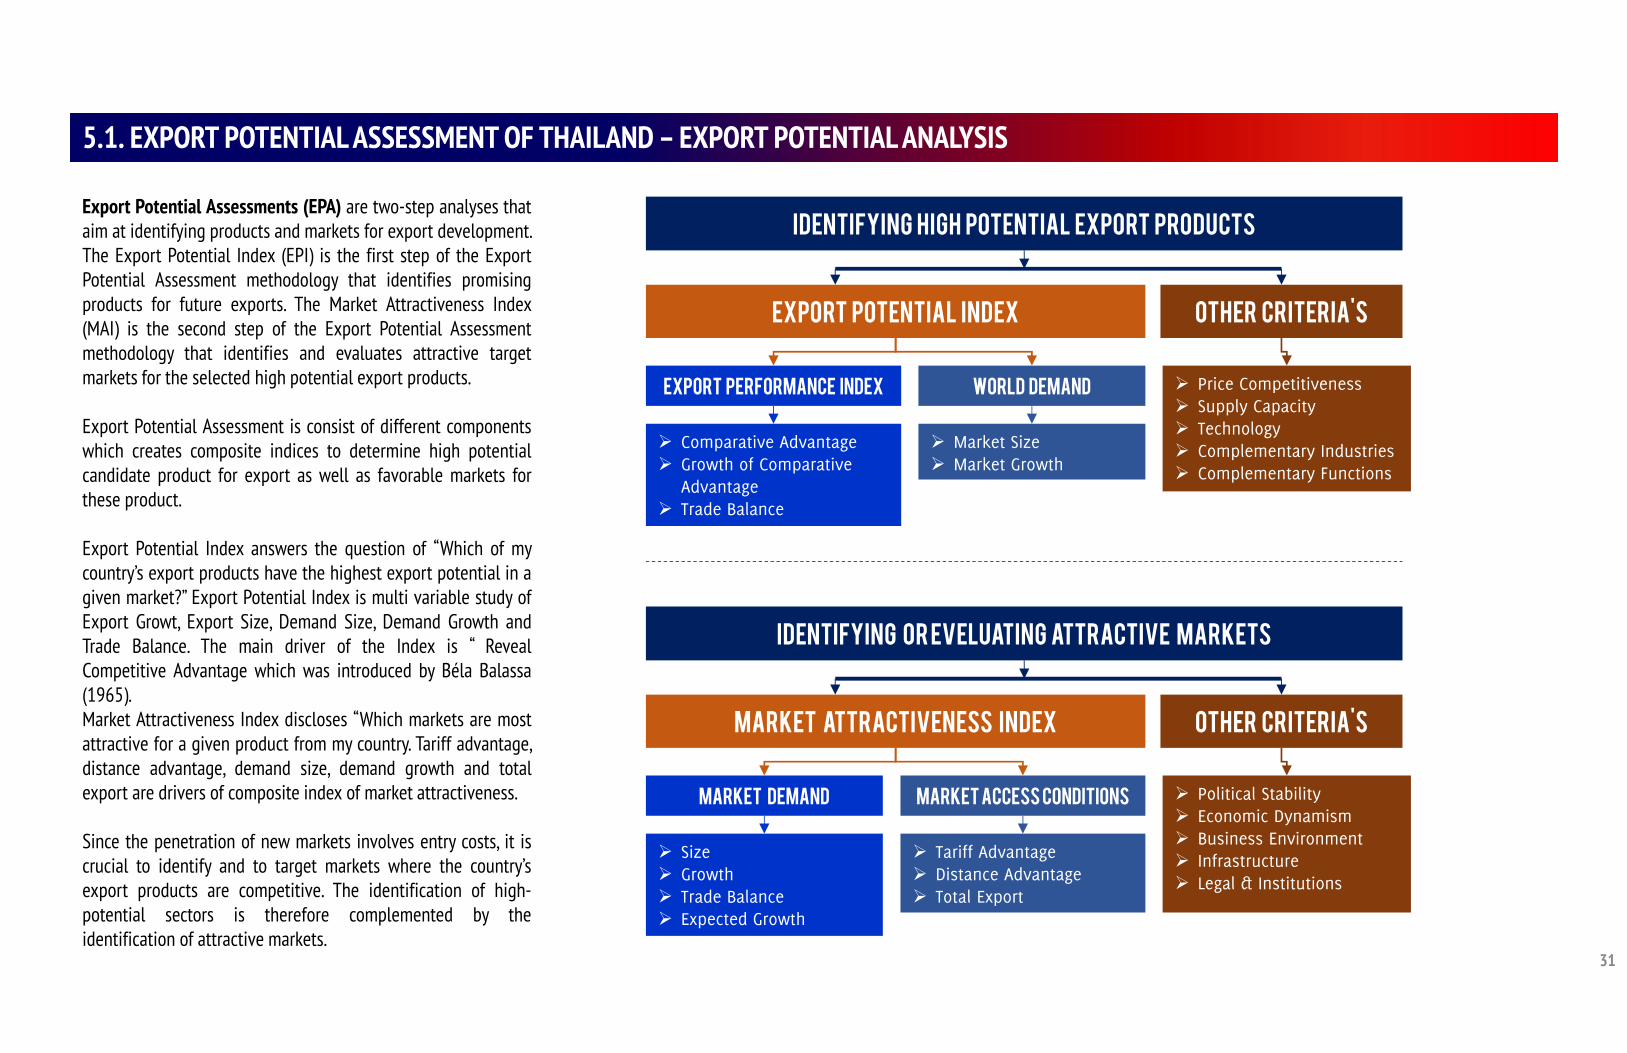
31
5.1. EXPORT POTENTIAL ASSESSMENT OF THAILAND – EXPORT POTENTIAL ANALYSIS
Export Potential Assessments (EPA) are two-step analyses thataim at identifying products and markets for export development.The Export Potential Index (EPI) is the first step of the ExportPotential Assessment methodology that identifies promisingproducts for future exports. The Market Attractiveness Index(MAI) is the second step of the Export Potential Assessmentmethodology that identifies and evaluates attractive targetmarkets for the selected high potential export products.
Export Potential Assessment is consist of different componentswhich creates composite indices to determine high potentialcandidate product for export as well as favorable markets forthese product.
Export Potential Index answers the question of “Which of mycountry’s export products have the highest export potential in agiven market?” Export Potential Index is multi variable study ofExport Growt, Export Size, Demand Size, Demand Growth andTrade Balance. The main driver of the Index is “ RevealCompetitive Advantage which was introduced by Béla Balassa(1965).Market Attractiveness Index discloses “Which markets are mostattractive for a given product from my country. Tariff advantage,distance advantage, demand size, demand growth and totalexport are drivers of composite index of market attractiveness.
Since the penetration of new markets involves entry costs, it iscrucial to identify and to target markets where the country’sexport products are competitive. The identification of high-potential sectors is therefore complemented by theidentification of attractive markets.
Export Potential Index
Identifying High Potential Export Products
Other criteria's
Export Performance index World demand
Comparative Advantage Growth of Comparative
Advantage Trade Balance
Market Size Market Growth
Price Competitiveness Supply Capacity Technology Complementary Industries Complementary Functions
Market Attractiveness Index
Identifying or EVELUATING Attractive Markets
Other criteria's
Market Demand Market Access Conditions
Size Growth Trade Balance Expected Growth
Tariff Advantage Distance Advantage Total Export
Political Stability Economic Dynamism Business Environment Infrastructure Legal & Institutions
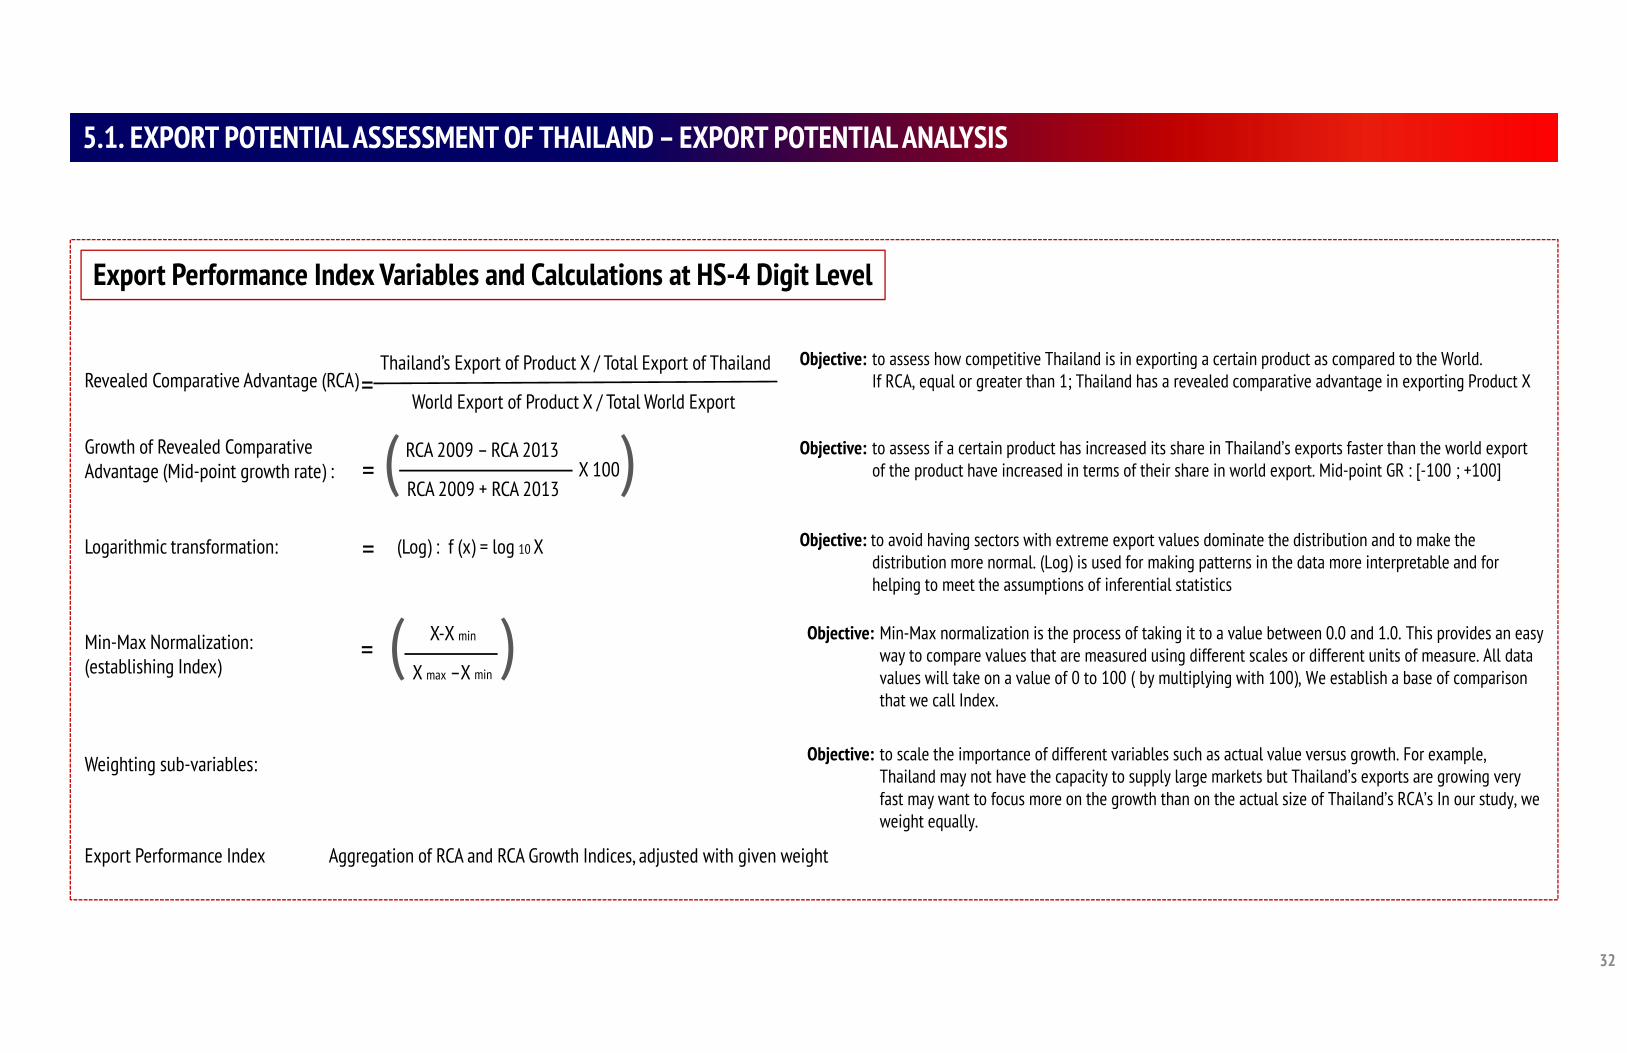
32
5.1. EXPORT POTENTIAL ASSESSMENT OF THAILAND – EXPORT POTENTIAL ANALYSIS
Revealed Comparative Advantage (RCA)Thailand’s Export of Product X / Total Export of Thailand
World Export of Product X / Total World Export
Objective: to assess how competitive Thailand is in exporting a certain product as compared to the World.If RCA, equal or greater than 1; Thailand has a revealed comparative advantage in exporting Product X
Logarithmic transformation: (Log) : f (x) = log 10 X
Objective: to assess if a certain product has increased its share in Thailand’s exports faster than the world export of the product have increased in terms of their share in world export. Mid-point GR : [-100 ; +100]
Growth of Revealed Comparative Advantage (Mid-point growth rate) :
RCA 2009 – RCA 2013
RCA 2009 + RCA 2013X 100( )
Min-Max Normalization:(establishing Index)
X-X min
X max –X min( ) Objective: Min-Max normalization is the process of taking it to a value between 0.0 and 1.0. This provides an easy
way to compare values that are measured using different scales or different units of measure. All data values will take on a value of 0 to 100 ( by multiplying with 100), We establish a base of comparison that we call Index.
Objective: to avoid having sectors with extreme export values dominate the distribution and to make the distribution more normal. (Log) is used for making patterns in the data more interpretable and for helping to meet the assumptions of inferential statistics
Weighting sub-variables: Objective: to scale the importance of different variables such as actual value versus growth. For example, Thailand may not have the capacity to supply large markets but Thailand’s exports are growing very fast may want to focus more on the growth than on the actual size of Thailand’s RCA’s In our study, we weight equally.
Export Performance Index Aggregation of RCA and RCA Growth Indices, adjusted with given weight
Export Performance Index Variables and Calculations at HS-4 Digit Level
=
=
=
=
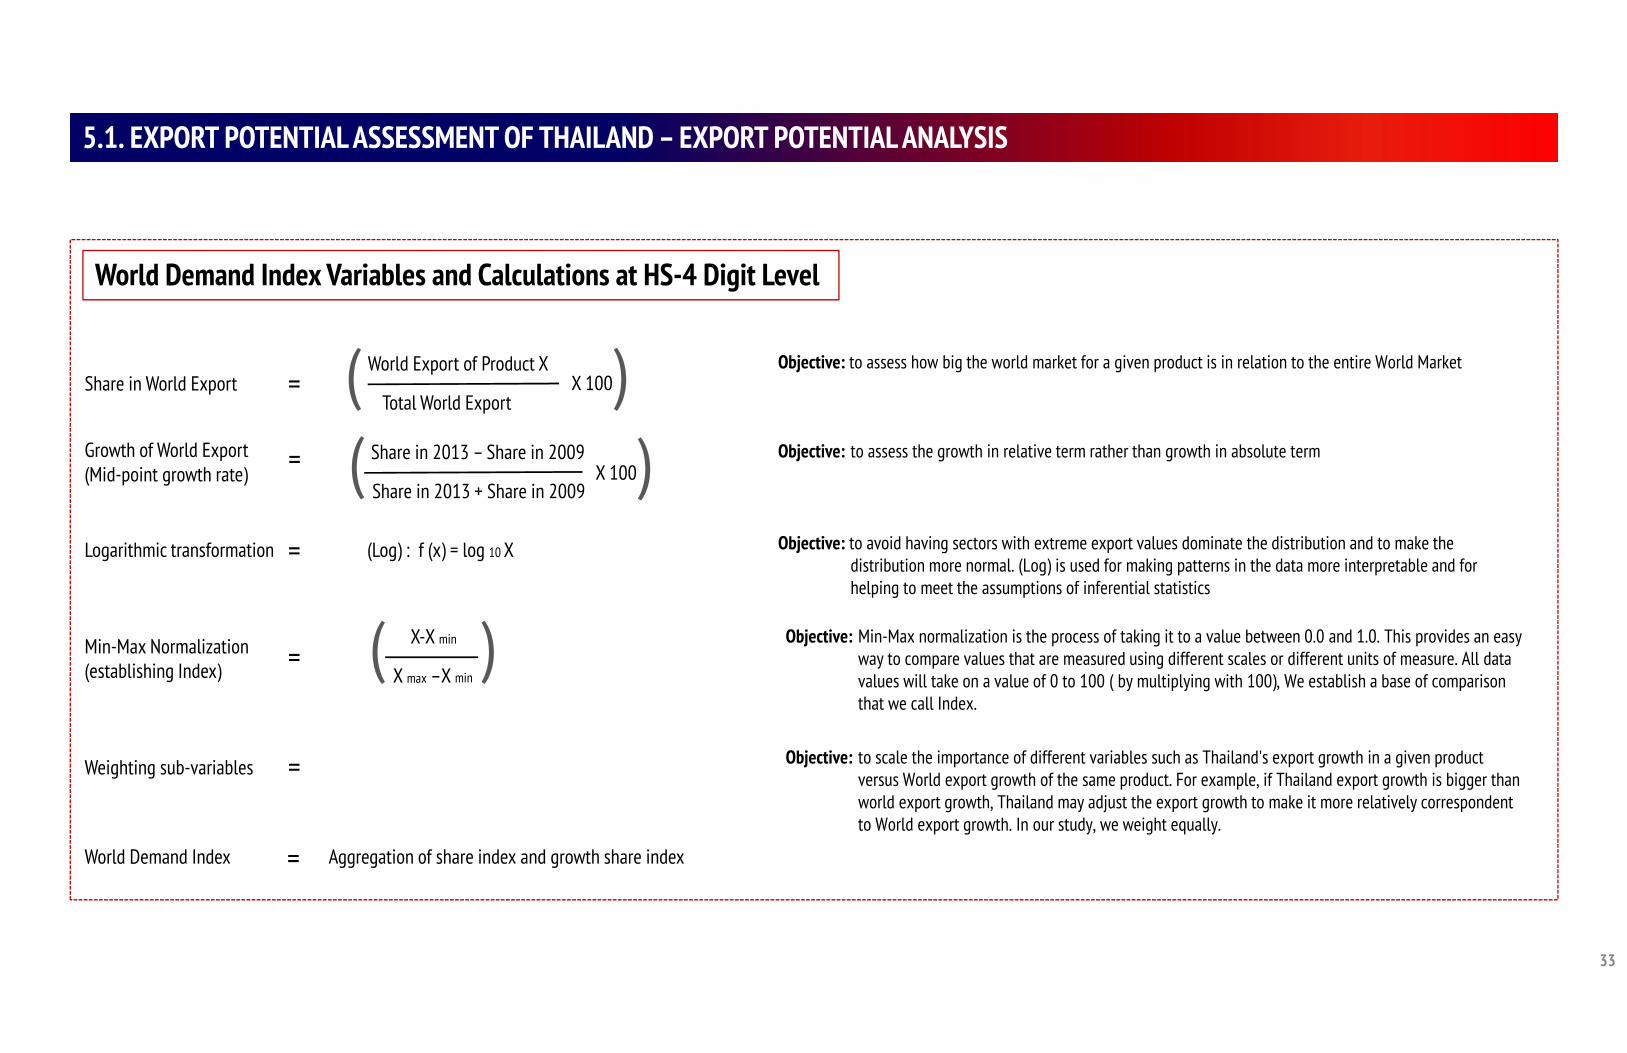
33
5.1. EXPORT POTENTIAL ASSESSMENT OF THAILAND – EXPORT POTENTIAL ANALYSIS
Share in World ExportObjective: to assess how big the world market for a given product is in relation to the entire World Market
Logarithmic transformation (Log) : f (x) = log 10 X
Objective: to assess the growth in relative term rather than growth in absolute termGrowth of World Export(Mid-point growth rate)
World Export of Product X
Total World ExportX 100( )
Min-Max Normalization(establishing Index)
X-X min
X max –X min( ) Objective: Min-Max normalization is the process of taking it to a value between 0.0 and 1.0. This provides an easy
way to compare values that are measured using different scales or different units of measure. All data values will take on a value of 0 to 100 ( by multiplying with 100), We establish a base of comparison that we call Index.
Objective: to avoid having sectors with extreme export values dominate the distribution and to make the distribution more normal. (Log) is used for making patterns in the data more interpretable and for helping to meet the assumptions of inferential statistics
Weighting sub-variables Objective: to scale the importance of different variables such as Thailand's export growth in a given product versus World export growth of the same product. For example, if Thailand export growth is bigger than world export growth, Thailand may adjust the export growth to make it more relatively correspondent to World export growth. In our study, we weight equally.
World Demand Index Aggregation of share index and growth share index
World Demand Index Variables and Calculations at HS-4 Digit Level
Share in 2013 – Share in 2009
Share in 2013 + Share in 2009X 100( )
=
=
=
=
=
=
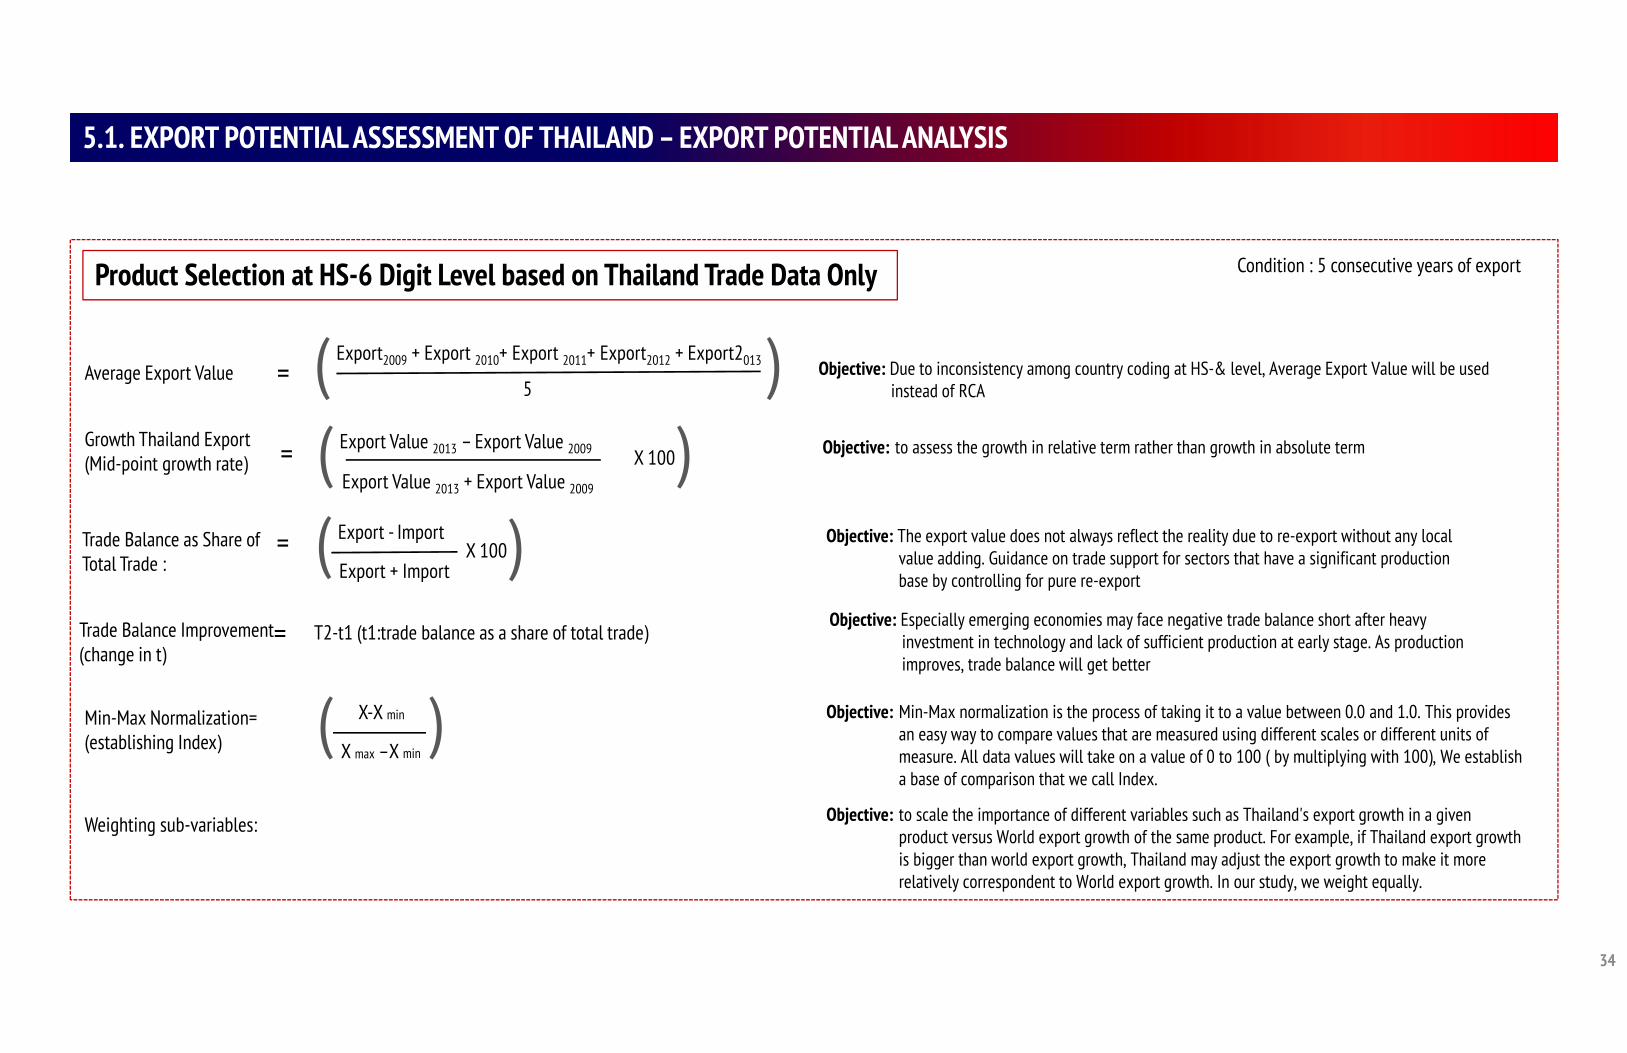
34
5.1. EXPORT POTENTIAL ASSESSMENT OF THAILAND – EXPORT POTENTIAL ANALYSIS
Average Export Value Objective: Due to inconsistency among country coding at HS-& level, Average Export Value will be used instead of RCA
Objective: to assess the growth in relative term rather than growth in absolute termGrowth Thailand Export(Mid-point growth rate)
Export2009 + Export 2010+ Export 2011+ Export2012 + Export2013
5( )
Min-Max Normalization=(establishing Index)
X-X min
X max –X min( ) Objective: Min-Max normalization is the process of taking it to a value between 0.0 and 1.0. This provides
an easy way to compare values that are measured using different scales or different units of measure. All data values will take on a value of 0 to 100 ( by multiplying with 100), We establish a base of comparison that we call Index.
Weighting sub-variables: Objective: to scale the importance of different variables such as Thailand's export growth in a given product versus World export growth of the same product. For example, if Thailand export growth is bigger than world export growth, Thailand may adjust the export growth to make it more relatively correspondent to World export growth. In our study, we weight equally.
Product Selection at HS-6 Digit Level based on Thailand Trade Data Only
Export Value 2013 – Export Value 2009
Export Value 2013 + Export Value 2009
X 100( )
Condition : 5 consecutive years of export
Objective: The export value does not always reflect the reality due to re-export without any local value adding. Guidance on trade support for sectors that have a significant production base by controlling for pure re-export
Trade Balance as Share ofTotal Trade :
=
=
= Export - Import
Export + ImportX 100( )
Trade Balance Improvement(change in t)
= T2-t1 (t1:trade balance as a share of total trade)Objective: Especially emerging economies may face negative trade balance short after heavy
investment in technology and lack of sufficient production at early stage. As production improves, trade balance will get better
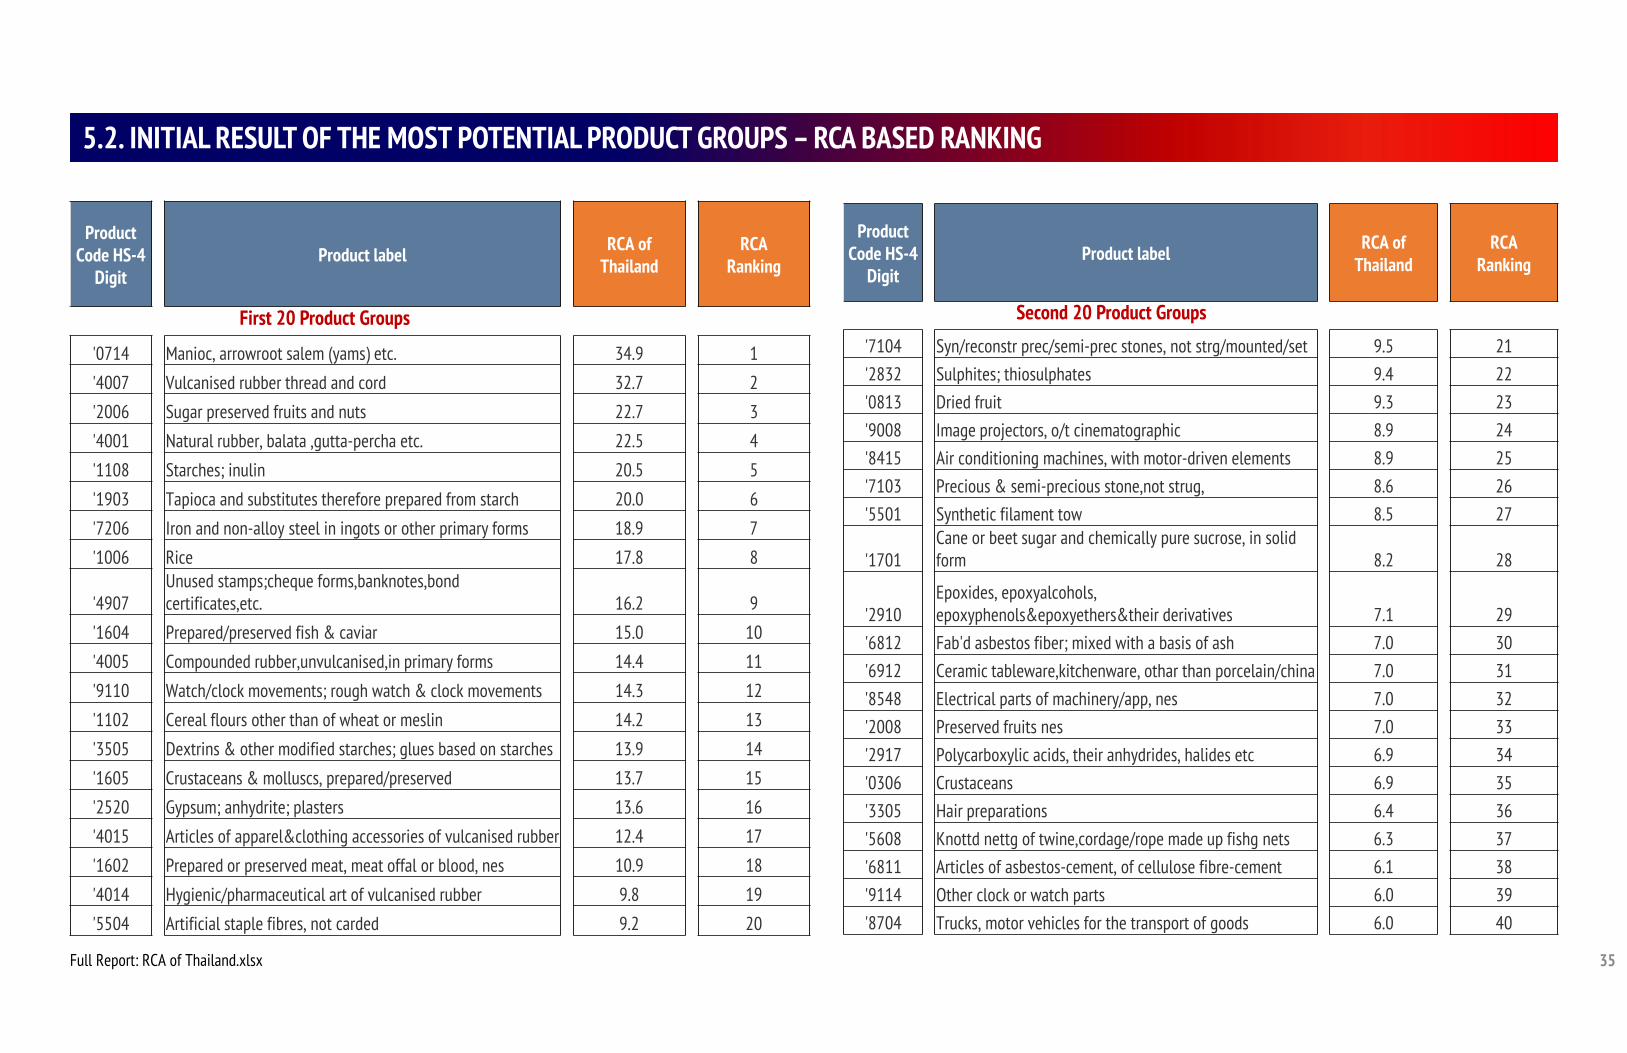
35
5.2. INITIAL RESULT OF THE MOST POTENTIAL PRODUCT GROUPS – RCA BASED RANKING
Product Code HS-4
DigitProduct label RCA of
ThailandRCA
Ranking
'0714 Manioc, arrowroot salem (yams) etc. 34.9 1
'4007 Vulcanised rubber thread and cord 32.7 2
'2006 Sugar preserved fruits and nuts 22.7 3
'4001 Natural rubber, balata ,gutta-percha etc. 22.5 4
'1108 Starches; inulin 20.5 5
'1903 Tapioca and substitutes therefore prepared from starch 20.0 6
'7206 Iron and non-alloy steel in ingots or other primary forms 18.9 7
'1006 Rice 17.8 8
'4907Unused stamps;cheque forms,banknotes,bond certificates,etc. 16.2 9
'1604 Prepared/preserved fish & caviar 15.0 10
'4005 Compounded rubber,unvulcanised,in primary forms 14.4 11
'9110 Watch/clock movements; rough watch & clock movements 14.3 12
'1102 Cereal flours other than of wheat or meslin 14.2 13
'3505 Dextrins & other modified starches; glues based on starches 13.9 14
'1605 Crustaceans & molluscs, prepared/preserved 13.7 15
'2520 Gypsum; anhydrite; plasters 13.6 16
'4015 Articles of apparel&clothing accessories of vulcanised rubber 12.4 17
'1602 Prepared or preserved meat, meat offal or blood, nes 10.9 18
'4014 Hygienic/pharmaceutical art of vulcanised rubber 9.8 19
'5504 Artificial staple fibres, not carded 9.2 20
Product Code HS-4
DigitProduct label RCA of
ThailandRCA
Ranking
'7104 Syn/reconstr prec/semi-prec stones, not strg/mounted/set 9.5 21'2832 Sulphites; thiosulphates 9.4 22'0813 Dried fruit 9.3 23'9008 Image projectors, o/t cinematographic 8.9 24'8415 Air conditioning machines, with motor-driven elements 8.9 25'7103 Precious & semi-precious stone,not strug, 8.6 26'5501 Synthetic filament tow 8.5 27
'1701Cane or beet sugar and chemically pure sucrose, in solid form 8.2 28
'2910Epoxides, epoxyalcohols, epoxyphenols&epoxyethers&their derivatives 7.1 29
'6812 Fab'd asbestos fiber; mixed with a basis of ash 7.0 30'6912 Ceramic tableware,kitchenware, othar than porcelain/china 7.0 31'8548 Electrical parts of machinery/app, nes 7.0 32'2008 Preserved fruits nes 7.0 33'2917 Polycarboxylic acids, their anhydrides, halides etc 6.9 34'0306 Crustaceans 6.9 35'3305 Hair preparations 6.4 36'5608 Knottd nettg of twine,cordage/rope made up fishg nets 6.3 37'6811 Articles of asbestos-cement, of cellulose fibre-cement 6.1 38'9114 Other clock or watch parts 6.0 39'8704 Trucks, motor vehicles for the transport of goods 6.0 40
Full Report: RCA of Thailand.xlsx
First 20 Product Groups Second 20 Product Groups
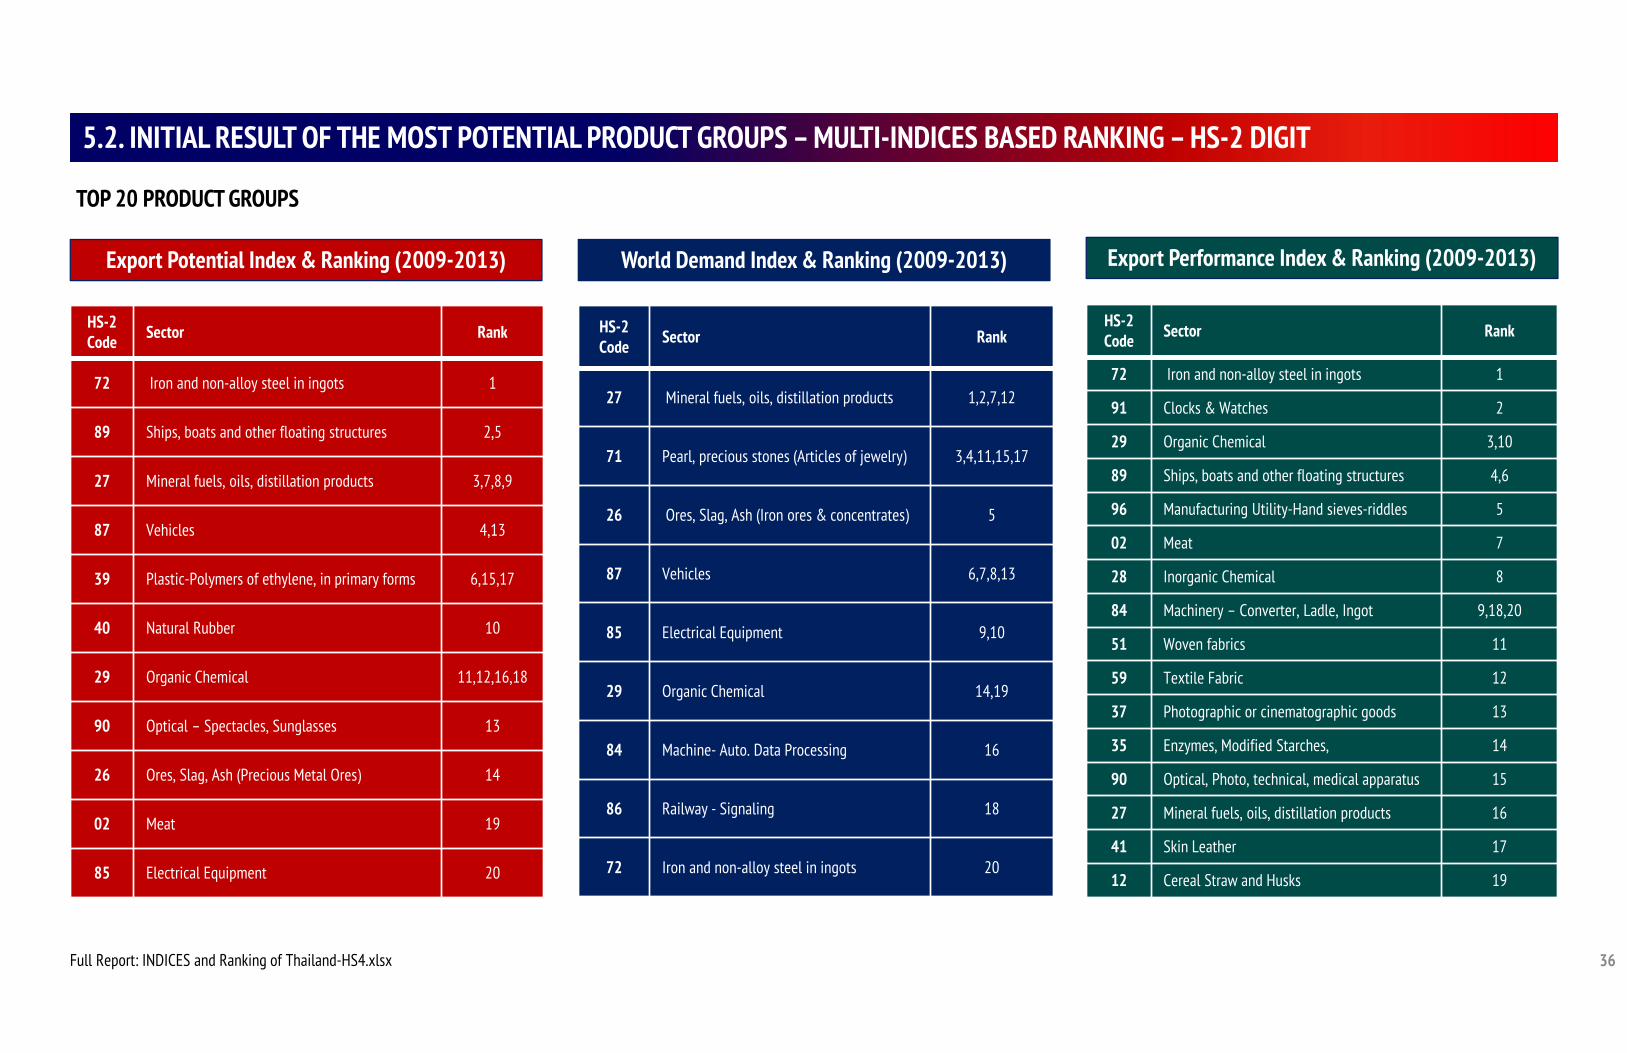
36
5.2. INITIAL RESULT OF THE MOST POTENTIAL PRODUCT GROUPS – MULTI-INDICES BASED RANKING – HS-2 DIGIT
Full Report: INDICES and Ranking of Thailand-HS4.xlsx
TOP 20 PRODUCT GROUPS
Export Potential Index & Ranking (2009-2013) World Demand Index & Ranking (2009-2013) Export Performance Index & Ranking (2009-2013)
HS-2 Code Sector Rank
72 Iron and non-alloy steel in ingots 1
89 Ships, boats and other floating structures 2,5
27 Mineral fuels, oils, distillation products 3,7,8,9
87 Vehicles 4,13
39 Plastic-Polymers of ethylene, in primary forms 6,15,17
40 Natural Rubber 10
29 Organic Chemical 11,12,16,18
90 Optical – Spectacles, Sunglasses 13
26 Ores, Slag, Ash (Precious Metal Ores) 14
02 Meat 19
85 Electrical Equipment 20
HS-2 Code Sector Rank
27 Mineral fuels, oils, distillation products 1,2,7,12
71 Pearl, precious stones (Articles of jewelry) 3,4,11,15,17
26 Ores, Slag, Ash (Iron ores & concentrates) 5
87 Vehicles 6,7,8,13
85 Electrical Equipment 9,10
29 Organic Chemical 14,19
84 Machine- Auto. Data Processing 16
86 Railway - Signaling 18
72 Iron and non-alloy steel in ingots 20
HS-2 Code Sector Rank
72 Iron and non-alloy steel in ingots 1
91 Clocks & Watches 2
29 Organic Chemical 3,10
89 Ships, boats and other floating structures 4,6
96 Manufacturing Utility-Hand sieves-riddles 5
02 Meat 7
28 Inorganic Chemical 8
84 Machinery – Converter, Ladle, Ingot 9,18,20
51 Woven fabrics 11
59 Textile Fabric 12
37 Photographic or cinematographic goods 13
35 Enzymes, Modified Starches, 14
90 Optical, Photo, technical, medical apparatus 15
27 Mineral fuels, oils, distillation products 16
41 Skin Leather 17
12 Cereal Straw and Husks 19
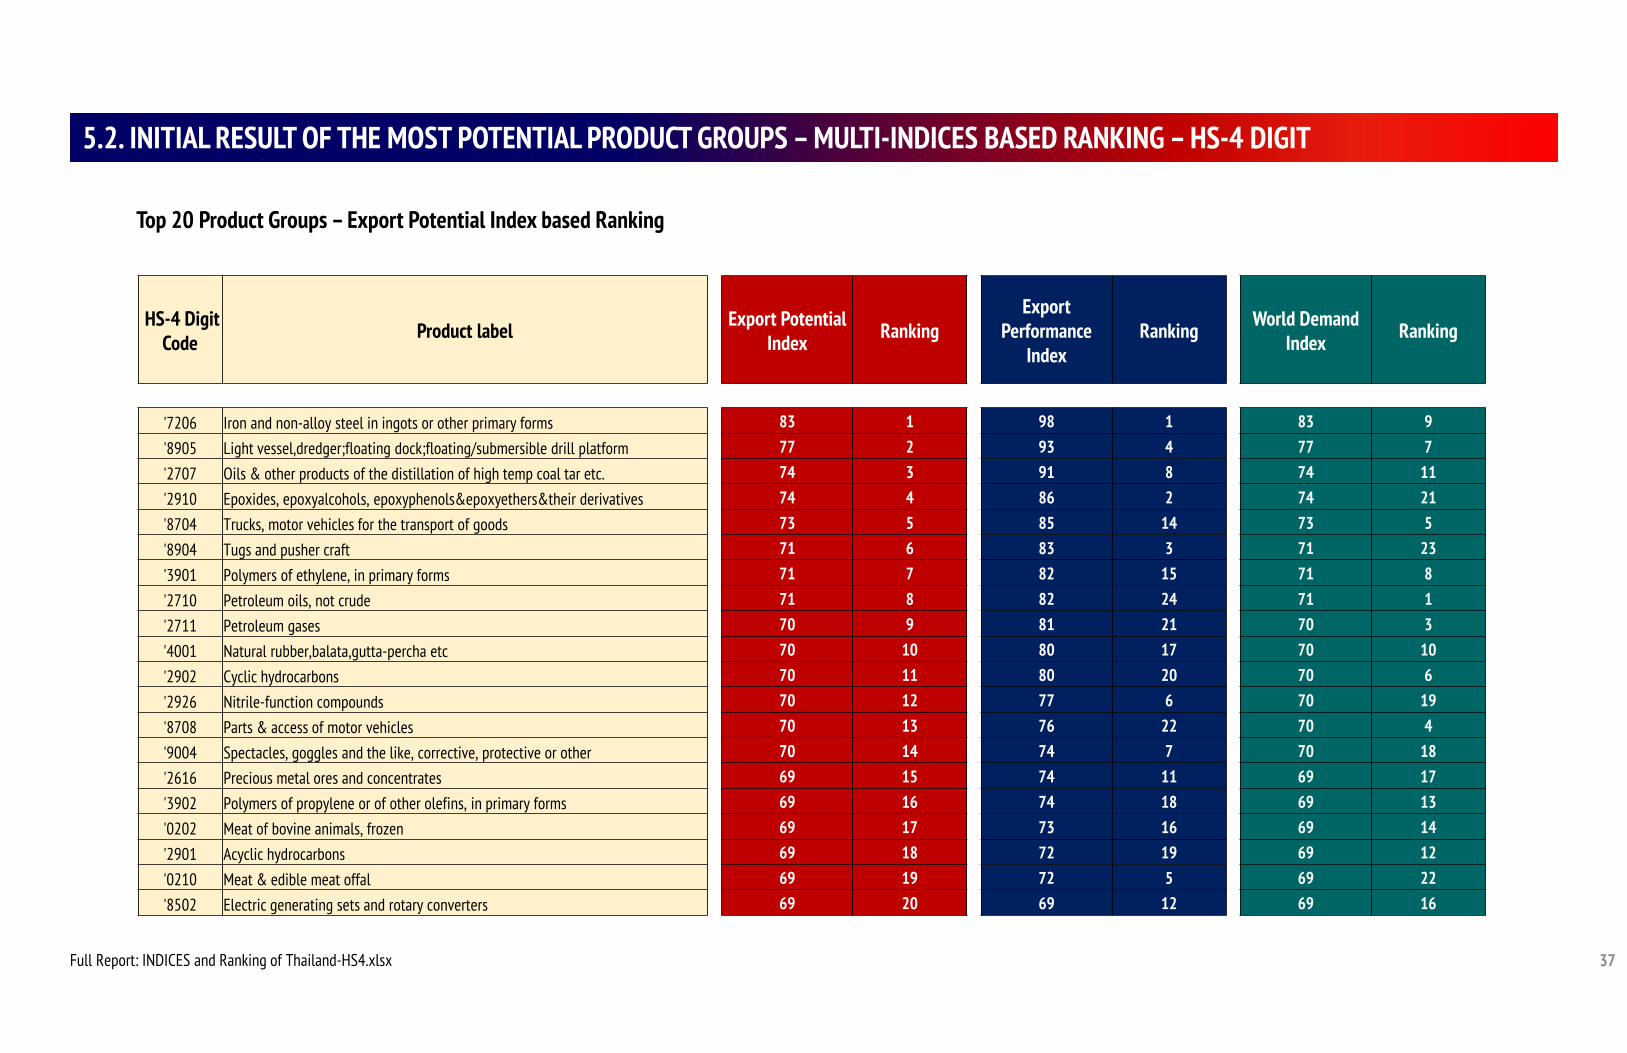
37
5.2. INITIAL RESULT OF THE MOST POTENTIAL PRODUCT GROUPS – MULTI-INDICES BASED RANKING – HS-4 DIGIT
Full Report: INDICES and Ranking of Thailand-HS4.xlsx
Top 20 Product Groups – Export Potential Index based Ranking
HS-4 Digit Code Product label Export Potential
Index RankingExport
Performance Index
Ranking World Demand Index Ranking
'7206 Iron and non-alloy steel in ingots or other primary forms 83 1 98 1 83 9'8905 Light vessel,dredger;floating dock;floating/submersible drill platform 77 2 93 4 77 7'2707 Oils & other products of the distillation of high temp coal tar etc. 74 3 91 8 74 11'2910 Epoxides, epoxyalcohols, epoxyphenols&epoxyethers&their derivatives 74 4 86 2 74 21'8704 Trucks, motor vehicles for the transport of goods 73 5 85 14 73 5'8904 Tugs and pusher craft 71 6 83 3 71 23'3901 Polymers of ethylene, in primary forms 71 7 82 15 71 8'2710 Petroleum oils, not crude 71 8 82 24 71 1'2711 Petroleum gases 70 9 81 21 70 3'4001 Natural rubber,balata,gutta-percha etc 70 10 80 17 70 10'2902 Cyclic hydrocarbons 70 11 80 20 70 6'2926 Nitrile-function compounds 70 12 77 6 70 19'8708 Parts & access of motor vehicles 70 13 76 22 70 4'9004 Spectacles, goggles and the like, corrective, protective or other 70 14 74 7 70 18'2616 Precious metal ores and concentrates 69 15 74 11 69 17'3902 Polymers of propylene or of other olefins, in primary forms 69 16 74 18 69 13'0202 Meat of bovine animals, frozen 69 17 73 16 69 14'2901 Acyclic hydrocarbons 69 18 72 19 69 12'0210 Meat & edible meat offal 69 19 72 5 69 22'8502 Electric generating sets and rotary converters 69 20 69 12 69 16
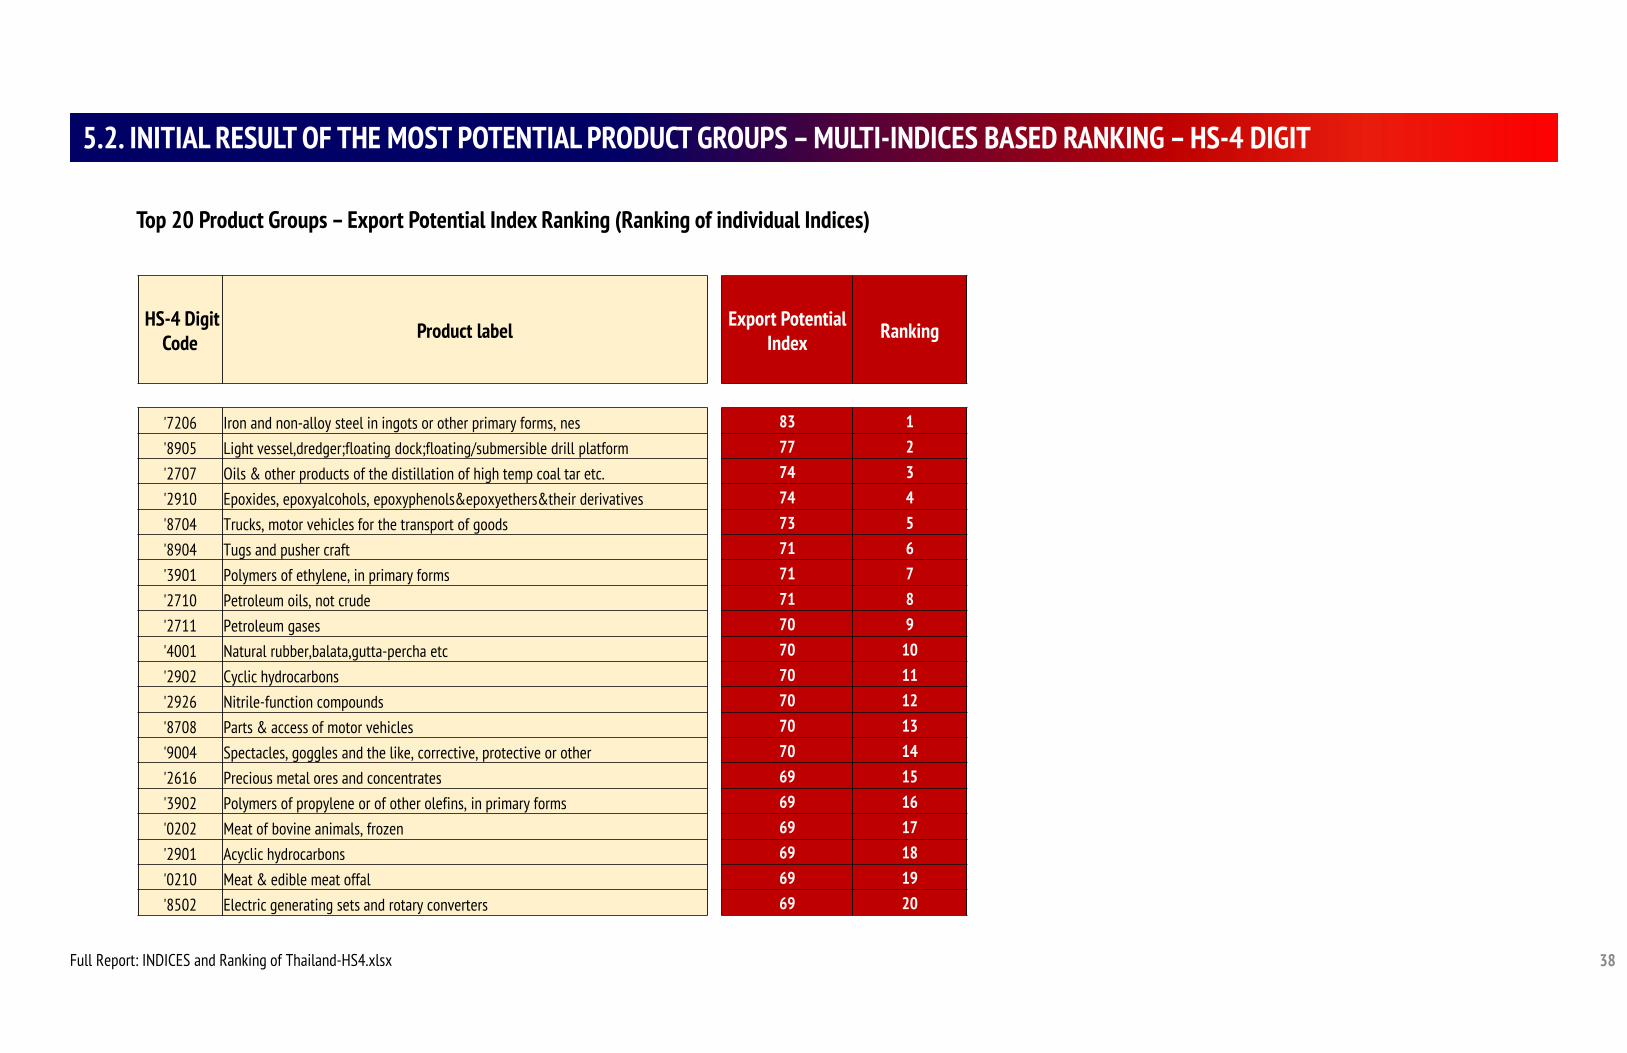
38
5.2. INITIAL RESULT OF THE MOST POTENTIAL PRODUCT GROUPS – MULTI-INDICES BASED RANKING – HS-4 DIGIT
Full Report: INDICES and Ranking of Thailand-HS4.xlsx
Top 20 Product Groups – Export Potential Index Ranking (Ranking of individual Indices)
HS-4 Digit Code Product label Export Potential
Index Ranking
'7206 Iron and non-alloy steel in ingots or other primary forms, nes 83 1'8905 Light vessel,dredger;floating dock;floating/submersible drill platform 77 2'2707 Oils & other products of the distillation of high temp coal tar etc. 74 3'2910 Epoxides, epoxyalcohols, epoxyphenols&epoxyethers&their derivatives 74 4'8704 Trucks, motor vehicles for the transport of goods 73 5'8904 Tugs and pusher craft 71 6'3901 Polymers of ethylene, in primary forms 71 7'2710 Petroleum oils, not crude 71 8'2711 Petroleum gases 70 9'4001 Natural rubber,balata,gutta-percha etc 70 10'2902 Cyclic hydrocarbons 70 11'2926 Nitrile-function compounds 70 12'8708 Parts & access of motor vehicles 70 13'9004 Spectacles, goggles and the like, corrective, protective or other 70 14'2616 Precious metal ores and concentrates 69 15'3902 Polymers of propylene or of other olefins, in primary forms 69 16'0202 Meat of bovine animals, frozen 69 17'2901 Acyclic hydrocarbons 69 18'0210 Meat & edible meat offal 69 19'8502 Electric generating sets and rotary converters 69 20
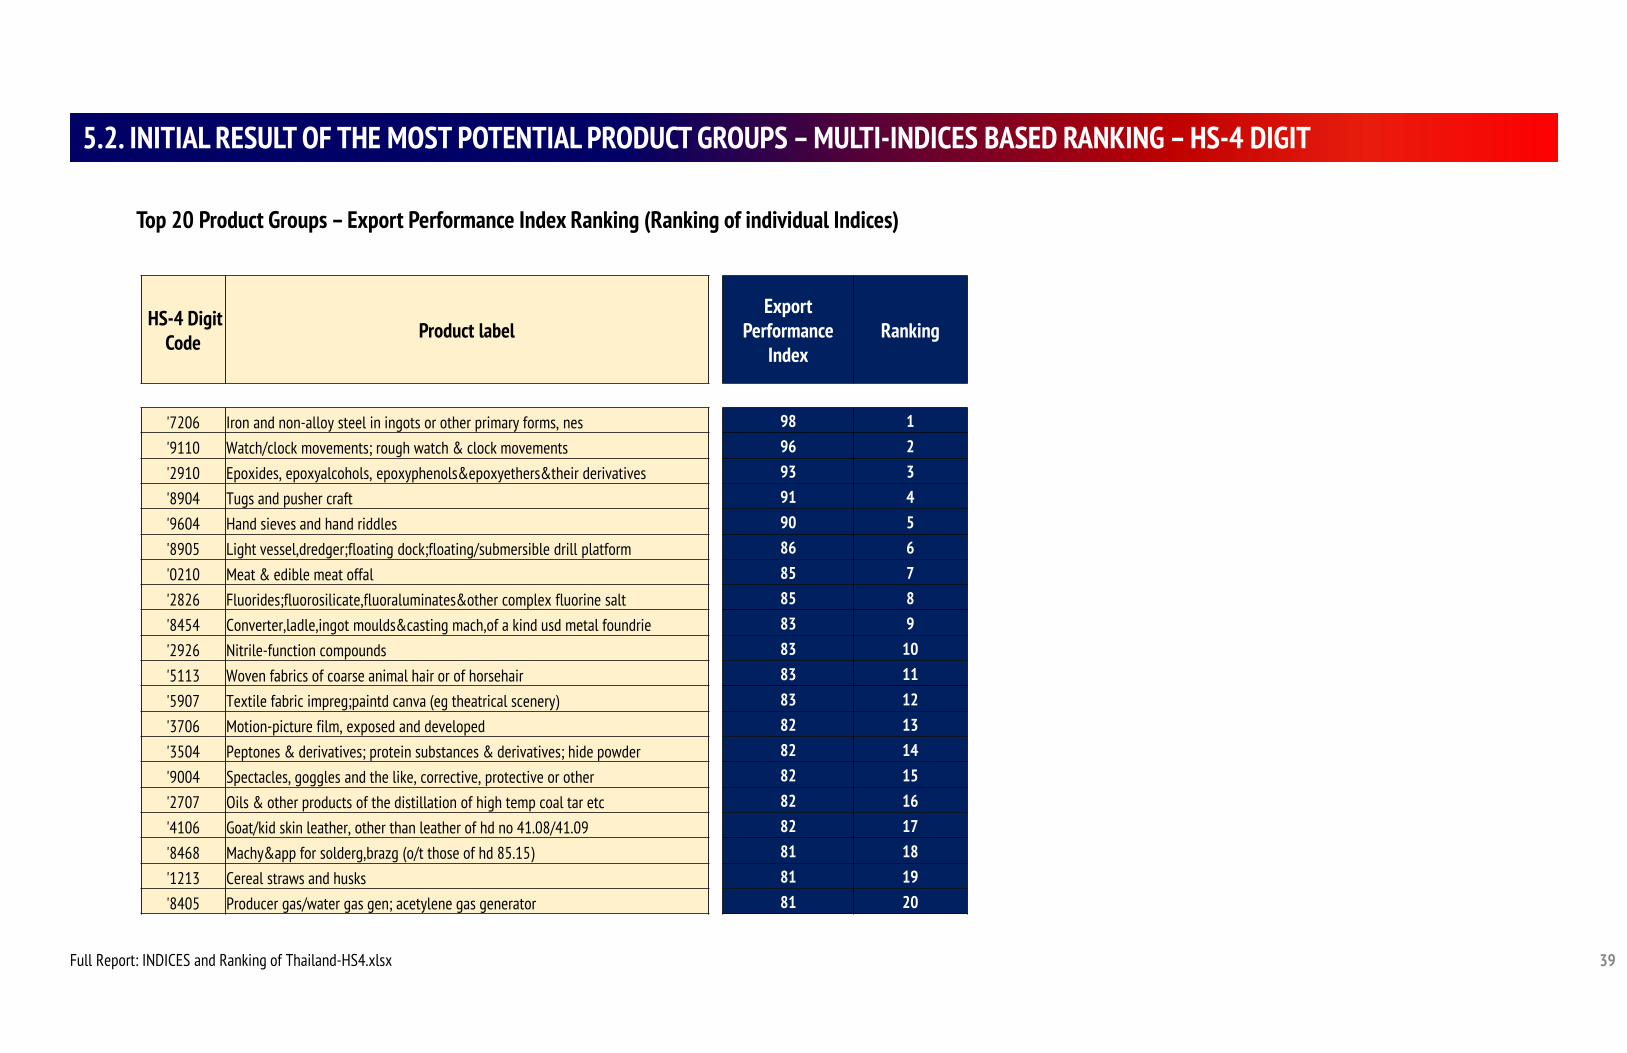
39
5.2. INITIAL RESULT OF THE MOST POTENTIAL PRODUCT GROUPS – MULTI-INDICES BASED RANKING – HS-4 DIGIT
Full Report: INDICES and Ranking of Thailand-HS4.xlsx
Top 20 Product Groups – Export Performance Index Ranking (Ranking of individual Indices)
HS-4 Digit Code Product label
Export Performance
IndexRanking
'7206 Iron and non-alloy steel in ingots or other primary forms, nes 98 1'9110 Watch/clock movements; rough watch & clock movements 96 2'2910 Epoxides, epoxyalcohols, epoxyphenols&epoxyethers&their derivatives 93 3'8904 Tugs and pusher craft 91 4'9604 Hand sieves and hand riddles 90 5'8905 Light vessel,dredger;floating dock;floating/submersible drill platform 86 6'0210 Meat & edible meat offal 85 7'2826 Fluorides;fluorosilicate,fluoraluminates&other complex fluorine salt 85 8'8454 Converter,ladle,ingot moulds&casting mach,of a kind usd metal foundrie 83 9'2926 Nitrile-function compounds 83 10'5113 Woven fabrics of coarse animal hair or of horsehair 83 11'5907 Textile fabric impreg;paintd canva (eg theatrical scenery) 83 12'3706 Motion-picture film, exposed and developed 82 13'3504 Peptones & derivatives; protein substances & derivatives; hide powder 82 14'9004 Spectacles, goggles and the like, corrective, protective or other 82 15'2707 Oils & other products of the distillation of high temp coal tar etc 82 16'4106 Goat/kid skin leather, other than leather of hd no 41.08/41.09 82 17'8468 Machy&app for solderg,brazg (o/t those of hd 85.15) 81 18'1213 Cereal straws and husks 81 19'8405 Producer gas/water gas gen; acetylene gas generator 81 20
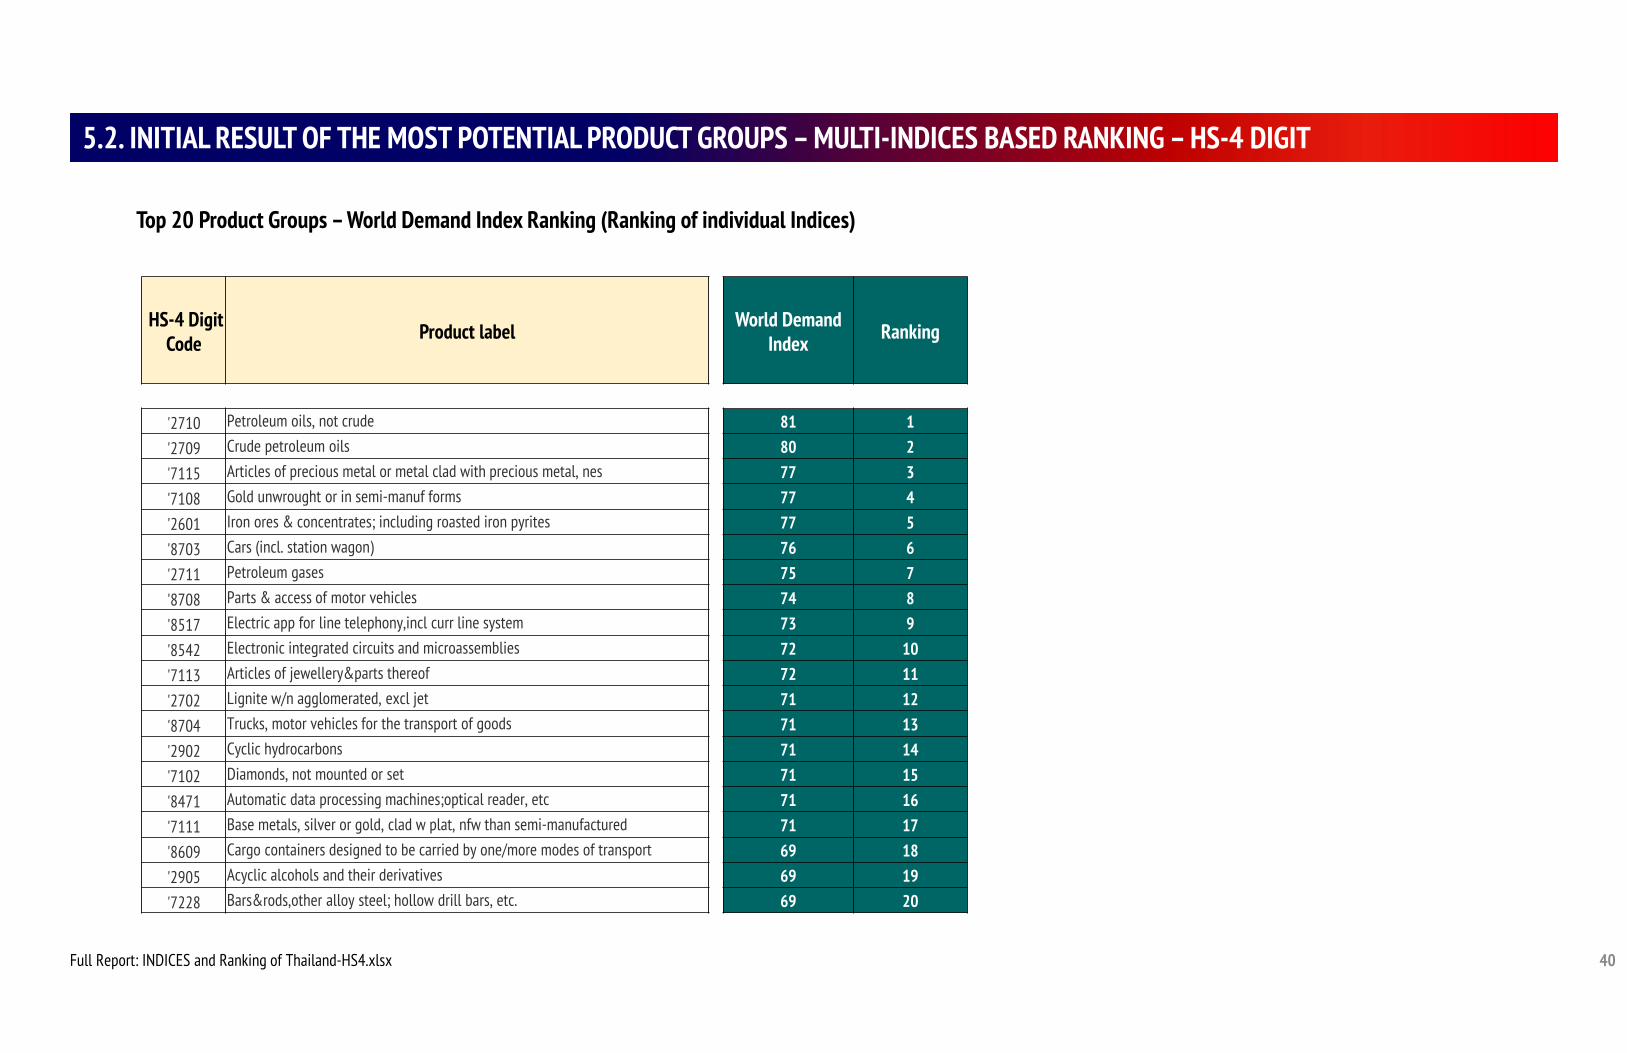
HS-4 Digit Code Product label World Demand
Index Ranking
'2710 Petroleum oils, not crude 81 1'2709 Crude petroleum oils 80 2'7115 Articles of precious metal or metal clad with precious metal, nes 77 3'7108 Gold unwrought or in semi-manuf forms 77 4'2601 Iron ores & concentrates; including roasted iron pyrites 77 5'8703 Cars (incl. station wagon) 76 6'2711 Petroleum gases 75 7'8708 Parts & access of motor vehicles 74 8'8517 Electric app for line telephony,incl curr line system 73 9'8542 Electronic integrated circuits and microassemblies 72 10'7113 Articles of jewellery&parts thereof 72 11'2702 Lignite w/n agglomerated, excl jet 71 12'8704 Trucks, motor vehicles for the transport of goods 71 13'2902 Cyclic hydrocarbons 71 14'7102 Diamonds, not mounted or set 71 15'8471 Automatic data processing machines;optical reader, etc 71 16'7111 Base metals, silver or gold, clad w plat, nfw than semi-manufactured 71 17'8609 Cargo containers designed to be carried by one/more modes of transport 69 18'2905 Acyclic alcohols and their derivatives 69 19'7228 Bars&rods,other alloy steel; hollow drill bars, etc. 69 20
40
5.2. INITIAL RESULT OF THE MOST POTENTIAL PRODUCT GROUPS – MULTI-INDICES BASED RANKING – HS-4 DIGIT
Full Report: INDICES and Ranking of Thailand-HS4.xlsx
Top 20 Product Groups – World Demand Index Ranking (Ranking of individual Indices)
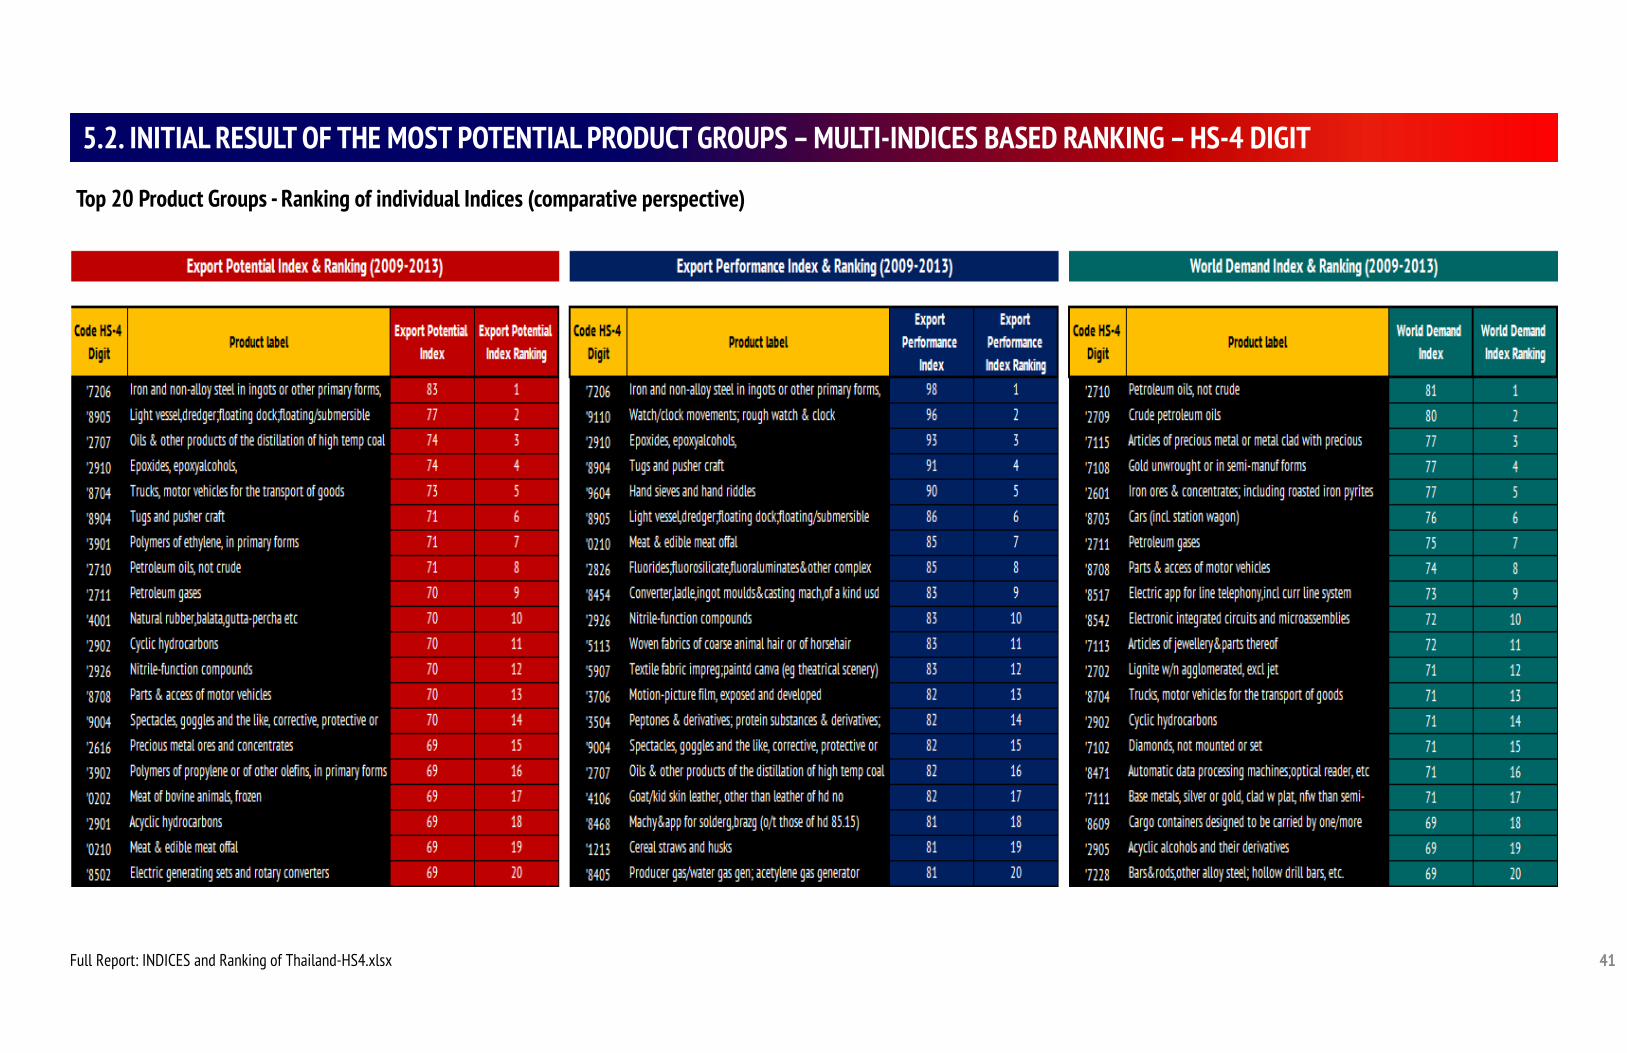
41
5.2. INITIAL RESULT OF THE MOST POTENTIAL PRODUCT GROUPS – MULTI-INDICES BASED RANKING – HS-4 DIGIT
Full Report: INDICES and Ranking of Thailand-HS4.xlsx
Top 20 Product Groups - Ranking of individual Indices (comparative perspective)
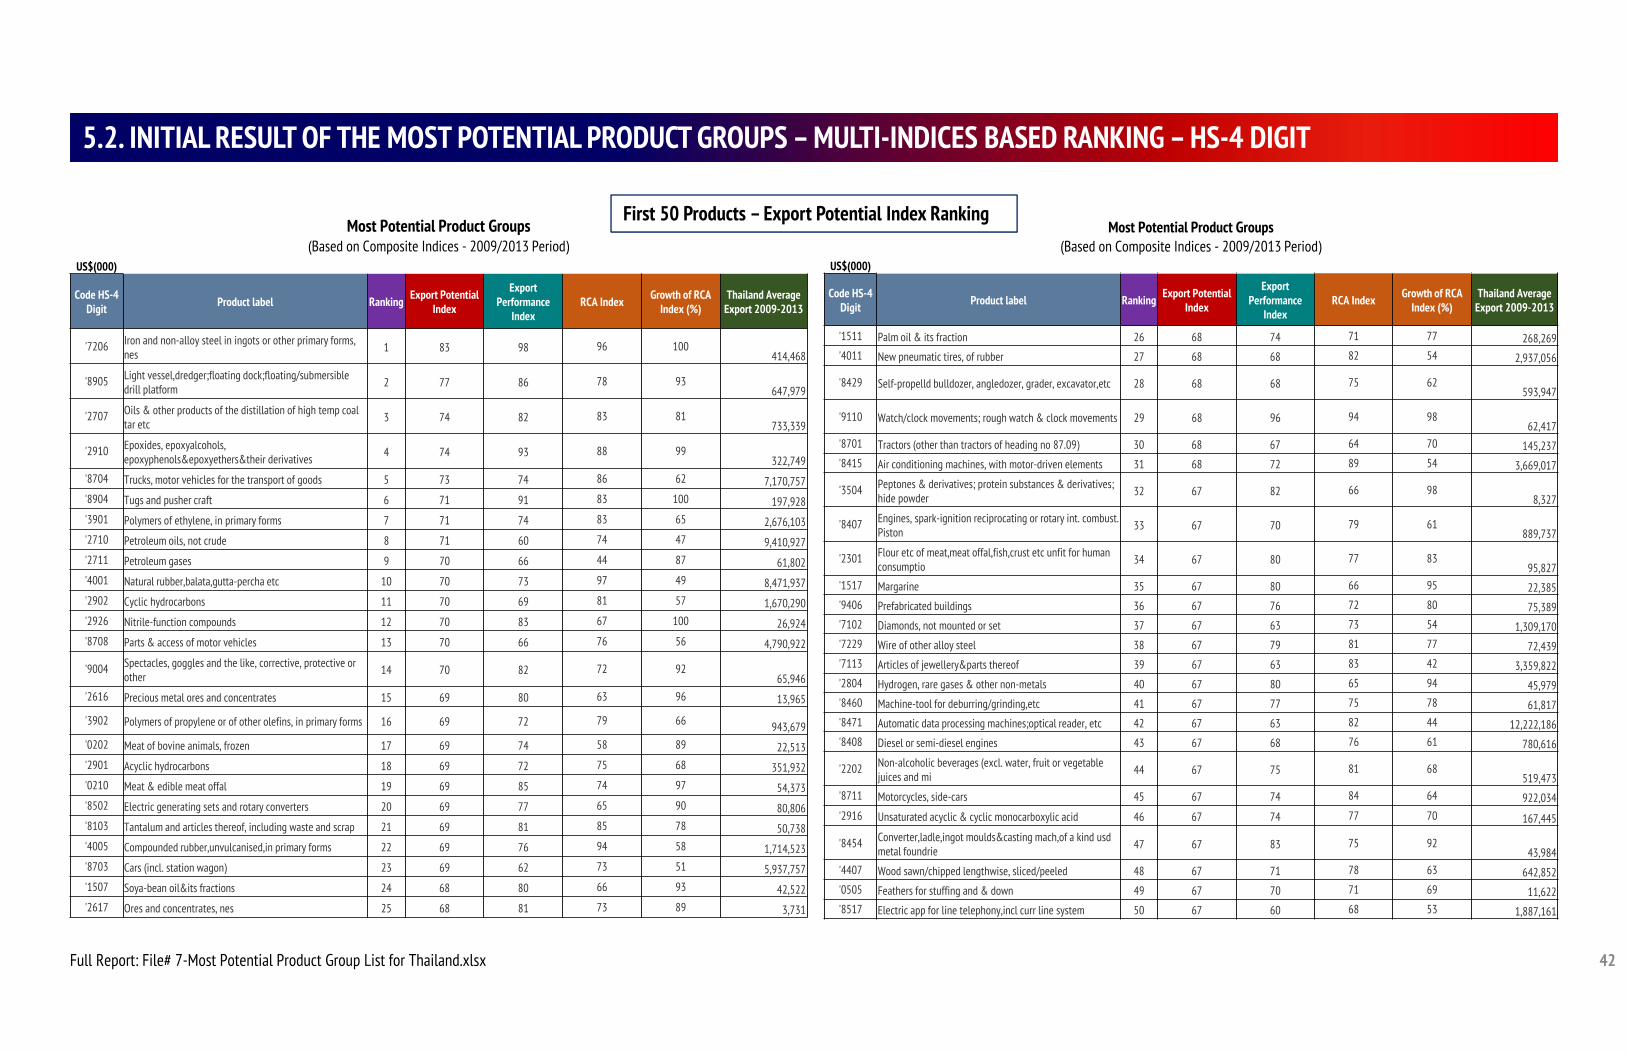
42
5.2. INITIAL RESULT OF THE MOST POTENTIAL PRODUCT GROUPS – MULTI-INDICES BASED RANKING – HS-4 DIGIT
Full Report: File# 7-Most Potential Product Group List for Thailand.xlsx
Most Potential Product Groups(Based on Composite Indices - 2009/2013 Period)
US$(000)
Code HS-4 Digit Product label Ranking Export Potential
Index
Export Performance
IndexRCA Index Growth of RCA
Index (%)Thailand Average
Export 2009-2013
'7206 Iron and non-alloy steel in ingots or other primary forms, nes 1 83 98 96 100
414,468
'8905 Light vessel,dredger;floating dock;floating/submersible drill platform 2 77 86 78 93
647,979
'2707 Oils & other products of the distillation of high temp coal tar etc 3 74 82 83 81
733,339
'2910 Epoxides, epoxyalcohols, epoxyphenols&epoxyethers&their derivatives 4 74 93 88 99
322,749'8704 Trucks, motor vehicles for the transport of goods 5 73 74 86 62 7,170,757'8904 Tugs and pusher craft 6 71 91 83 100 197,928'3901 Polymers of ethylene, in primary forms 7 71 74 83 65 2,676,103'2710 Petroleum oils, not crude 8 71 60 74 47 9,410,927'2711 Petroleum gases 9 70 66 44 87 61,802'4001 Natural rubber,balata,gutta-percha etc 10 70 73 97 49 8,471,937'2902 Cyclic hydrocarbons 11 70 69 81 57 1,670,290'2926 Nitrile-function compounds 12 70 83 67 100 26,924'8708 Parts & access of motor vehicles 13 70 66 76 56 4,790,922
'9004 Spectacles, goggles and the like, corrective, protective or other 14 70 82 72 92
65,946'2616 Precious metal ores and concentrates 15 69 80 63 96 13,965
'3902 Polymers of propylene or of other olefins, in primary forms 16 69 72 79 66 943,679'0202 Meat of bovine animals, frozen 17 69 74 58 89 22,513'2901 Acyclic hydrocarbons 18 69 72 75 68 351,932'0210 Meat & edible meat offal 19 69 85 74 97 54,373'8502 Electric generating sets and rotary converters 20 69 77 65 90 80,806'8103 Tantalum and articles thereof, including waste and scrap 21 69 81 85 78 50,738'4005 Compounded rubber,unvulcanised,in primary forms 22 69 76 94 58 1,714,523'8703 Cars (incl. station wagon) 23 69 62 73 51 5,937,757'1507 Soya-bean oil&its fractions 24 68 80 66 93 42,522'2617 Ores and concentrates, nes 25 68 81 73 89 3,731
Most Potential Product Groups(Based on Composite Indices - 2009/2013 Period)
US$(000)
Code HS-4 Digit Product label Ranking Export Potential
Index
Export Performance
IndexRCA Index Growth of RCA
Index (%)Thailand Average
Export 2009-2013
'1511 Palm oil & its fraction 26 68 74 71 77 268,269'4011 New pneumatic tires, of rubber 27 68 68 82 54 2,937,056
'8429 Self-propelld bulldozer, angledozer, grader, excavator,etc 28 68 68 75 62593,947
'9110 Watch/clock movements; rough watch & clock movements 29 68 96 94 9862,417
'8701 Tractors (other than tractors of heading no 87.09) 30 68 67 64 70 145,237'8415 Air conditioning machines, with motor-driven elements 31 68 72 89 54 3,669,017
'3504 Peptones & derivatives; protein substances & derivatives; hide powder 32 67 82 66 98
8,327
'8407 Engines, spark-ignition reciprocating or rotary int. combust. Piston 33 67 70 79 61
889,737
'2301 Flour etc of meat,meat offal,fish,crust etc unfit for human consumptio 34 67 80 77 83
95,827'1517 Margarine 35 67 80 66 95 22,385'9406 Prefabricated buildings 36 67 76 72 80 75,389'7102 Diamonds, not mounted or set 37 67 63 73 54 1,309,170'7229 Wire of other alloy steel 38 67 79 81 77 72,439'7113 Articles of jewellery&parts thereof 39 67 63 83 42 3,359,822'2804 Hydrogen, rare gases & other non-metals 40 67 80 65 94 45,979'8460 Machine-tool for deburring/grinding,etc 41 67 77 75 78 61,817'8471 Automatic data processing machines;optical reader, etc 42 67 63 82 44 12,222,186'8408 Diesel or semi-diesel engines 43 67 68 76 61 780,616
'2202 Non-alcoholic beverages (excl. water, fruit or vegetable juices and mi 44 67 75 81 68
519,473'8711 Motorcycles, side-cars 45 67 74 84 64 922,034'2916 Unsaturated acyclic & cyclic monocarboxylic acid 46 67 74 77 70 167,445
'8454 Converter,ladle,ingot moulds&casting mach,of a kind usd metal foundrie 47 67 83 75 92
43,984'4407 Wood sawn/chipped lengthwise, sliced/peeled 48 67 71 78 63 642,852'0505 Feathers for stuffing and & down 49 67 70 71 69 11,622'8517 Electric app for line telephony,incl curr line system 50 67 60 68 53 1,887,161
First 50 Products – Export Potential Index Ranking
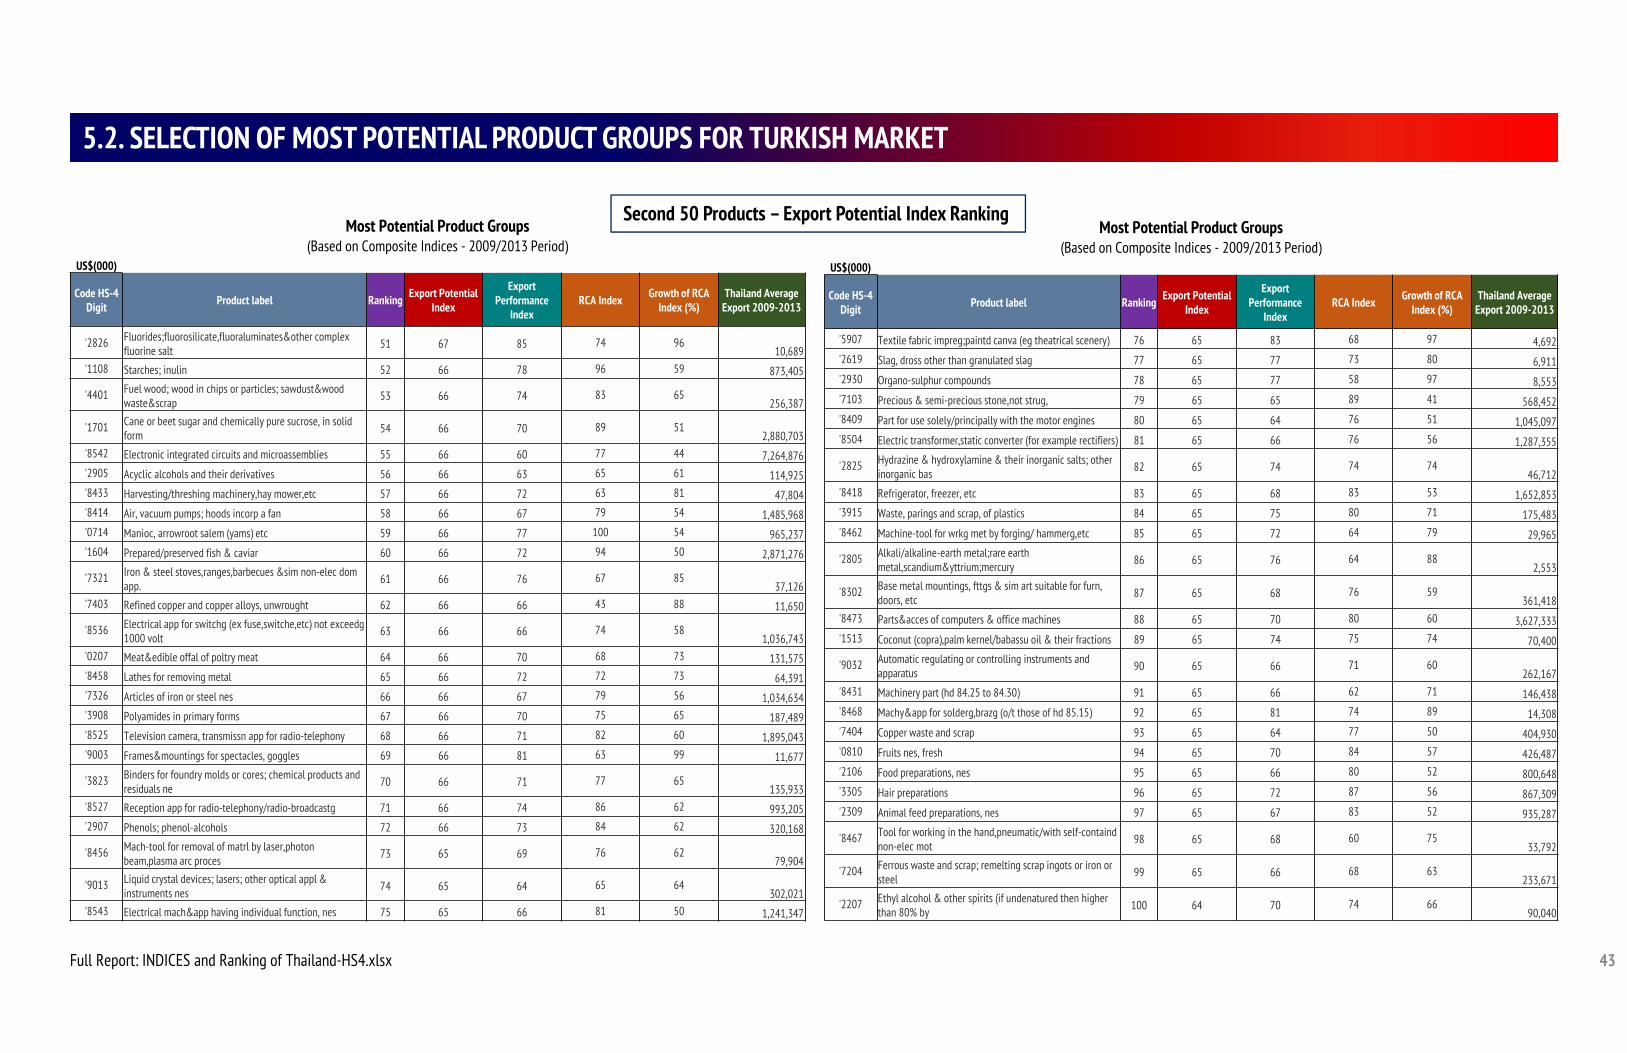
43
5.2. SELECTION OF MOST POTENTIAL PRODUCT GROUPS FOR TURKISH MARKET
Full Report: INDICES and Ranking of Thailand-HS4.xlsx
Most Potential Product Groups(Based on Composite Indices - 2009/2013 Period)
US$(000)
Code HS-4 Digit Product label Ranking Export Potential
Index
Export Performance
IndexRCA Index Growth of RCA
Index (%)Thailand Average
Export 2009-2013
'2826 Fluorides;fluorosilicate,fluoraluminates&other complex fluorine salt 51 67 85 74 96
10,689'1108 Starches; inulin 52 66 78 96 59 873,405
'4401 Fuel wood; wood in chips or particles; sawdust&wood waste&scrap 53 66 74 83 65
256,387
'1701 Cane or beet sugar and chemically pure sucrose, in solid form 54 66 70 89 51
2,880,703'8542 Electronic integrated circuits and microassemblies 55 66 60 77 44 7,264,876'2905 Acyclic alcohols and their derivatives 56 66 63 65 61 114,925'8433 Harvesting/threshing machinery,hay mower,etc 57 66 72 63 81 47,804'8414 Air, vacuum pumps; hoods incorp a fan 58 66 67 79 54 1,485,968'0714 Manioc, arrowroot salem (yams) etc 59 66 77 100 54 965,237'1604 Prepared/preserved fish & caviar 60 66 72 94 50 2,871,276
'7321 Iron & steel stoves,ranges,barbecues &sim non-elec dom app. 61 66 76 67 85
37,126'7403 Refined copper and copper alloys, unwrought 62 66 66 43 88 11,650
'8536 Electrical app for switchg (ex fuse,switche,etc) not exceedg 1000 volt 63 66 66 74 58
1,036,743'0207 Meat&edible offal of poltry meat 64 66 70 68 73 131,575'8458 Lathes for removing metal 65 66 72 72 73 64,391'7326 Articles of iron or steel nes 66 66 67 79 56 1,034,634'3908 Polyamides in primary forms 67 66 70 75 65 187,489'8525 Television camera, transmissn app for radio-telephony 68 66 71 82 60 1,895,043'9003 Frames&mountings for spectacles, goggles 69 66 81 63 99 11,677
'3823 Binders for foundry molds or cores; chemical products and residuals ne 70 66 71 77 65
135,933'8527 Reception app for radio-telephony/radio-broadcastg 71 66 74 86 62 993,205'2907 Phenols; phenol-alcohols 72 66 73 84 62 320,168
'8456 Mach-tool for removal of matrl by laser,photon beam,plasma arc proces 73 65 69 76 62
79,904
'9013 Liquid crystal devices; lasers; other optical appl & instruments nes 74 65 64 65 64
302,021'8543 Electrical mach&app having individual function, nes 75 65 66 81 50 1,241,347
Most Potential Product Groups(Based on Composite Indices - 2009/2013 Period)
US$(000)
Code HS-4 Digit Product label Ranking Export Potential
Index
Export Performance
IndexRCA Index Growth of RCA
Index (%)Thailand Average
Export 2009-2013
'5907 Textile fabric impreg;paintd canva (eg theatrical scenery) 76 65 83 68 97 4,692'2619 Slag, dross other than granulated slag 77 65 77 73 80 6,911'2930 Organo-sulphur compounds 78 65 77 58 97 8,553'7103 Precious & semi-precious stone,not strug, 79 65 65 89 41 568,452'8409 Part for use solely/principally with the motor engines 80 65 64 76 51 1,045,097'8504 Electric transformer,static converter (for example rectifiers) 81 65 66 76 56 1,287,355
'2825 Hydrazine & hydroxylamine & their inorganic salts; other inorganic bas 82 65 74 74 74
46,712'8418 Refrigerator, freezer, etc 83 65 68 83 53 1,652,853'3915 Waste, parings and scrap, of plastics 84 65 75 80 71 175,483'8462 Machine-tool for wrkg met by forging/ hammerg,etc 85 65 72 64 79 29,965
'2805 Alkali/alkaline-earth metal;rare earth metal,scandium&yttrium;mercury 86 65 76 64 88
2,553
'8302 Base metal mountings, fttgs & sim art suitable for furn, doors, etc 87 65 68 76 59
361,418'8473 Parts&acces of computers & office machines 88 65 70 80 60 3,627,333'1513 Coconut (copra),palm kernel/babassu oil & their fractions 89 65 74 75 74 70,400
'9032 Automatic regulating or controlling instruments and apparatus 90 65 66 71 60
262,167'8431 Machinery part (hd 84.25 to 84.30) 91 65 66 62 71 146,438'8468 Machy&app for solderg,brazg (o/t those of hd 85.15) 92 65 81 74 89 14,308'7404 Copper waste and scrap 93 65 64 77 50 404,930'0810 Fruits nes, fresh 94 65 70 84 57 426,487'2106 Food preparations, nes 95 65 66 80 52 800,648'3305 Hair preparations 96 65 72 87 56 867,309'2309 Animal feed preparations, nes 97 65 67 83 52 935,287
'8467 Tool for working in the hand,pneumatic/with self-containd non-elec mot 98 65 68 60 75
33,792
'7204 Ferrous waste and scrap; remelting scrap ingots or iron or steel 99 65 66 68 63
233,671
'2207 Ethyl alcohol & other spirits (if undenatured then higher than 80% by 100 64 70 74 66
90,040
Second 50 Products – Export Potential Index Ranking
44
5.3. SELECTION OF MOST POTENTIAL PRODUCT GROUPS FOR TURKISH MARKET
The identification of priority sectors and products of Thailand to export to Turkey is based upon the ITC EPA methodology. I have adapted the standard methodology for Thailand’s endoveur to discovermainly new product by combining gathered and calculated information on export performance, market demand and market conditions for priority sectors selection.
Of course, export readiness should start with the domestic market. Any company that is contemplating of going into export business should first succeed on the domestic market before attempting to goon the export market as well as trading condition of target country. Thailand’s export to Turkey has promising ground to further through product diversification. Based on methodology applied, thefollowing product groups represents comparative advantages to built sustainable trade relation with Turkey. Selection criteria's are;
1- Competitive eligibility : 5 years consecutive international trading history,2- Required RCA performance : Revealed Comparative advantage should be higher than3- Export Potential Index : >60 to overcome geographical distance difficulties4- Export Performance Index : >60 to assume exporting capabilities5- World Demand Index : >60 to secure future growth5-6- Market Size : Turkey should be offering attractive market size and growth opportunities7- Globally Managed Business : Globally managed operations such as automotive, consumer electronics etc. are not considered due to centralized export activities.8- Heavy Regulation : Flexible non-market realities9- Tariffs : Comparable and achievable tariff barriers except bilateral trade agreement10- Localization requirement : Non or limited localization prerequisites.
Turkey’s imports for a specific product are considered as offering interesting export potential for Thailand by making sure of that either sufficient volume and/or import growth in the short and longerterm.Most potential product groups for Thailand to further improve its trade balance with Turkey reflects manufacturing capabilities as well as inherited agricultural strength.
The selection is mainly based on calculated composite indices in relation to global export dynamics and bilateral trade opportunities. The effects of tariffs and bilateral trade agreement with othercountries should be considered via more comprehensive studies to clarify entry barriers and obstacles against neutral competition.
Selection Criteria's
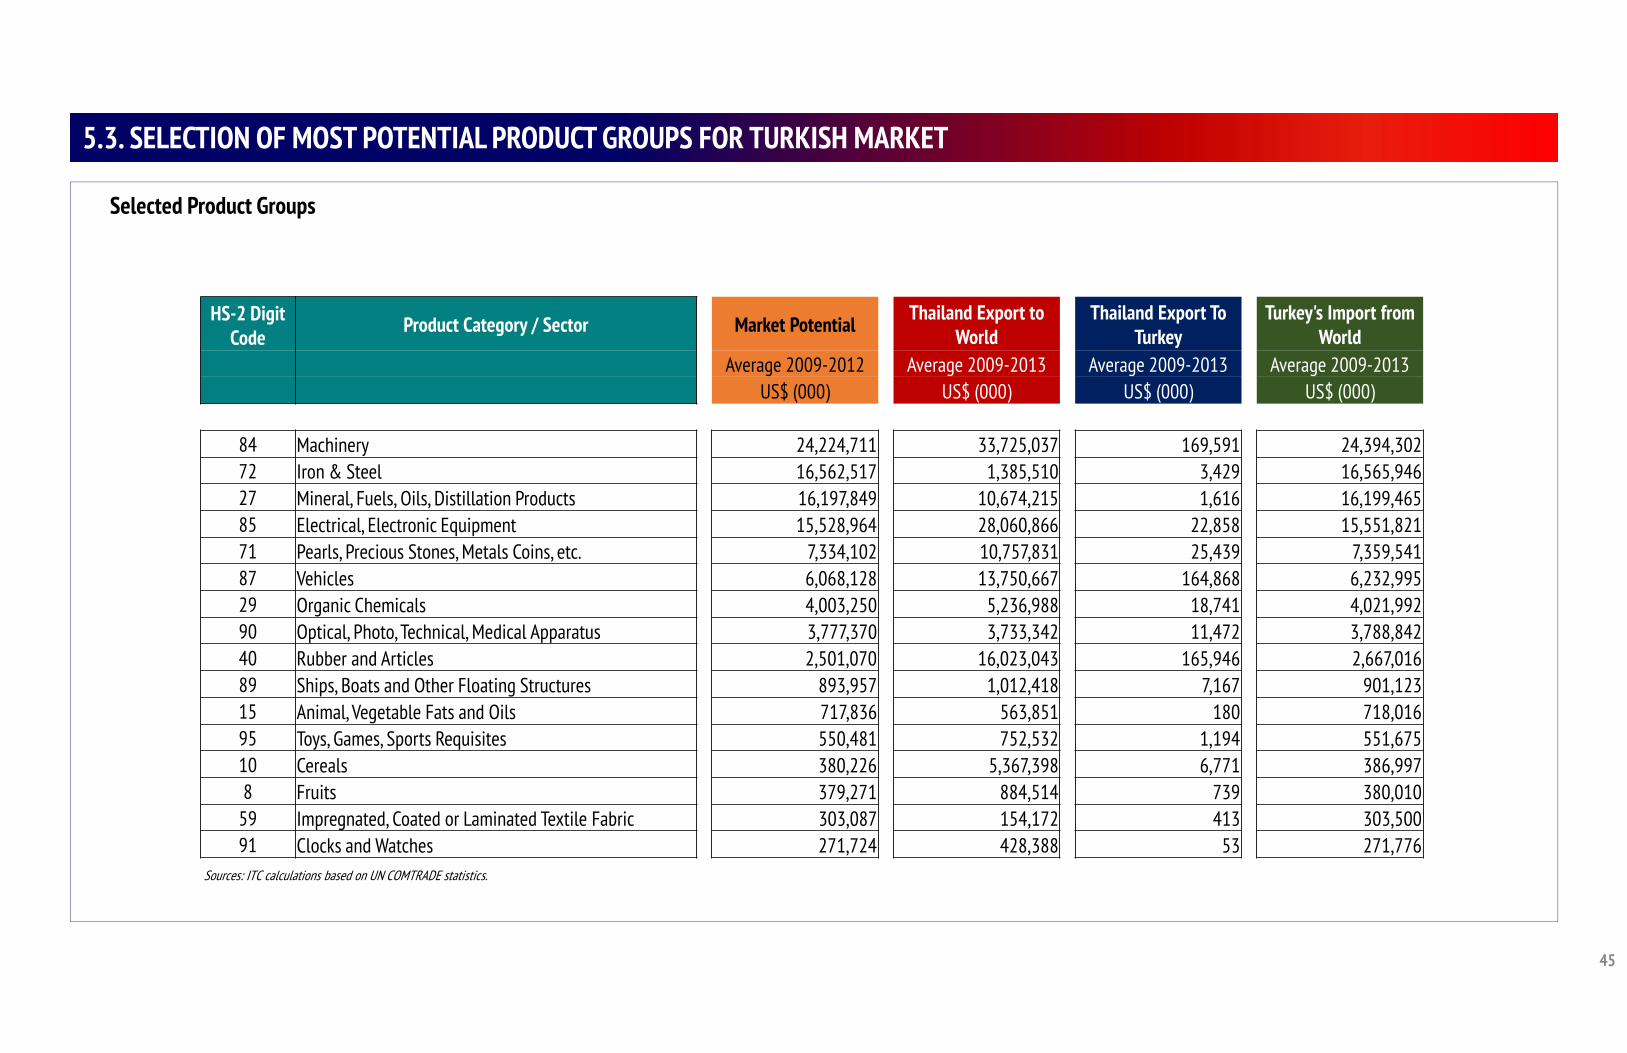
45
5.3. SELECTION OF MOST POTENTIAL PRODUCT GROUPS FOR TURKISH MARKET
HS-2 Digit Code Product Category / Sector Market Potential Thailand Export to
World Thailand Export To
TurkeyTurkey's Import from
World Average 2009-2012 Average 2009-2013 Average 2009-2013 Average 2009-2013
US$ (000) US$ (000) US$ (000) US$ (000)
84 Machinery 24,224,711 33,725,037 169,591 24,394,30272 Iron & Steel 16,562,517 1,385,510 3,429 16,565,94627 Mineral, Fuels, Oils, Distillation Products 16,197,849 10,674,215 1,616 16,199,46585 Electrical, Electronic Equipment 15,528,964 28,060,866 22,858 15,551,82171 Pearls, Precious Stones, Metals Coins, etc. 7,334,102 10,757,831 25,439 7,359,54187 Vehicles 6,068,128 13,750,667 164,868 6,232,99529 Organic Chemicals 4,003,250 5,236,988 18,741 4,021,99290 Optical, Photo, Technical, Medical Apparatus 3,777,370 3,733,342 11,472 3,788,84240 Rubber and Articles 2,501,070 16,023,043 165,946 2,667,01689 Ships, Boats and Other Floating Structures 893,957 1,012,418 7,167 901,12315 Animal, Vegetable Fats and Oils 717,836 563,851 180 718,01695 Toys, Games, Sports Requisites 550,481 752,532 1,194 551,67510 Cereals 380,226 5,367,398 6,771 386,9978 Fruits 379,271 884,514 739 380,010
59 Impregnated, Coated or Laminated Textile Fabric 303,087 154,172 413 303,50091 Clocks and Watches 271,724 428,388 53 271,776
Sources: ITC calculations based on UN COMTRADE statistics.
Selected Product Groups
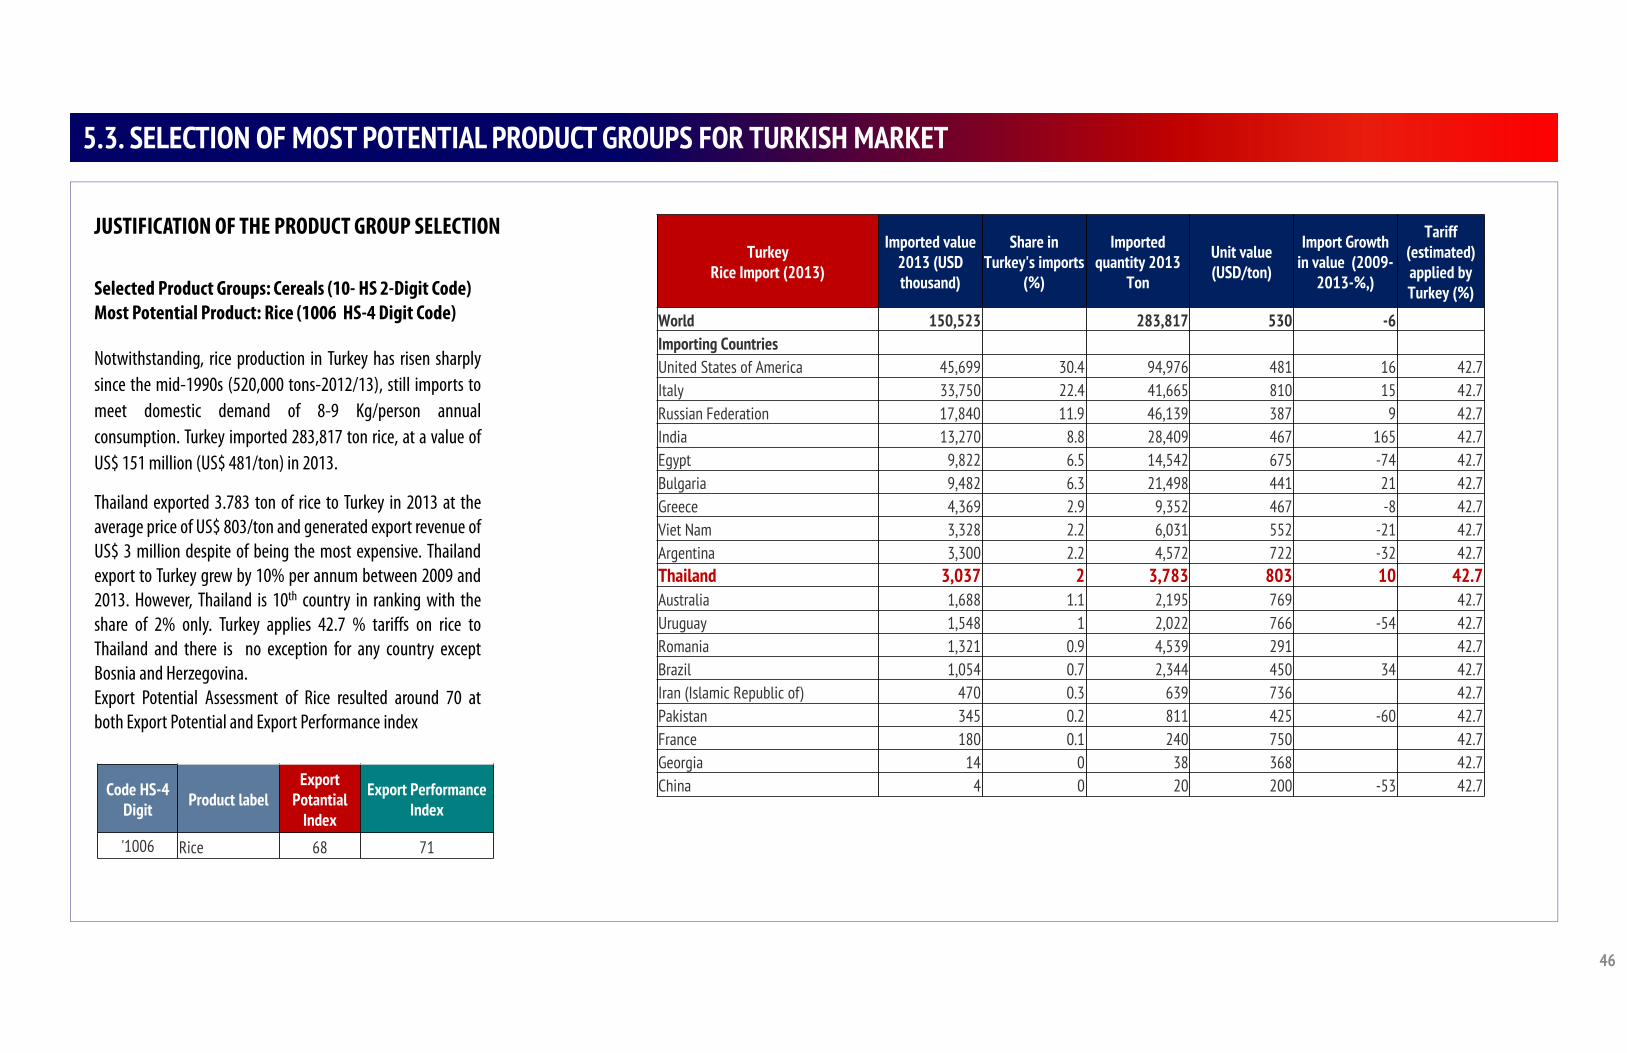
46
5.3. SELECTION OF MOST POTENTIAL PRODUCT GROUPS FOR TURKISH MARKET
JUSTIFICATION OF THE PRODUCT GROUP SELECTION
Selected Product Groups: Cereals (10- HS 2-Digit Code)Most Potential Product: Rice (1006 HS-4 Digit Code)
Notwithstanding, rice production in Turkey has risen sharplysince the mid-1990s (520,000 tons-2012/13), still imports tomeet domestic demand of 8-9 Kg/person annualconsumption. Turkey imported 283,817 ton rice, at a value ofUS$ 151 million (US$ 481/ton) in 2013.
Thailand exported 3.783 ton of rice to Turkey in 2013 at theaverage price of US$ 803/ton and generated export revenue ofUS$ 3 million despite of being the most expensive. Thailandexport to Turkey grew by 10% per annum between 2009 and2013. However, Thailand is 10th country in ranking with theshare of 2% only. Turkey applies 42.7 % tariffs on rice toThailand and there is no exception for any country exceptBosnia and Herzegovina.Export Potential Assessment of Rice resulted around 70 atboth Export Potential and Export Performance index
TurkeyRice Import (2013)
Imported value 2013 (USD thousand)
Share in Turkey's imports
(%)
Imported quantity 2013
Ton
Unit value (USD/ton)
Import Growth in value (2009-
2013-%,)
Tariff (estimated) applied by Turkey (%)
World 150,523 283,817 530 -6Importing CountriesUnited States of America 45,699 30.4 94,976 481 16 42.7Italy 33,750 22.4 41,665 810 15 42.7Russian Federation 17,840 11.9 46,139 387 9 42.7India 13,270 8.8 28,409 467 165 42.7Egypt 9,822 6.5 14,542 675 -74 42.7Bulgaria 9,482 6.3 21,498 441 21 42.7Greece 4,369 2.9 9,352 467 -8 42.7Viet Nam 3,328 2.2 6,031 552 -21 42.7Argentina 3,300 2.2 4,572 722 -32 42.7Thailand 3,037 2 3,783 803 10 42.7Australia 1,688 1.1 2,195 769 42.7Uruguay 1,548 1 2,022 766 -54 42.7Romania 1,321 0.9 4,539 291 42.7Brazil 1,054 0.7 2,344 450 34 42.7Iran (Islamic Republic of) 470 0.3 639 736 42.7Pakistan 345 0.2 811 425 -60 42.7France 180 0.1 240 750 42.7Georgia 14 0 38 368 42.7China 4 0 20 200 -53 42.7Code HS-4
Digit Product labelExport
Potantial Index
Export Performance Index
'1006 Rice 68 71
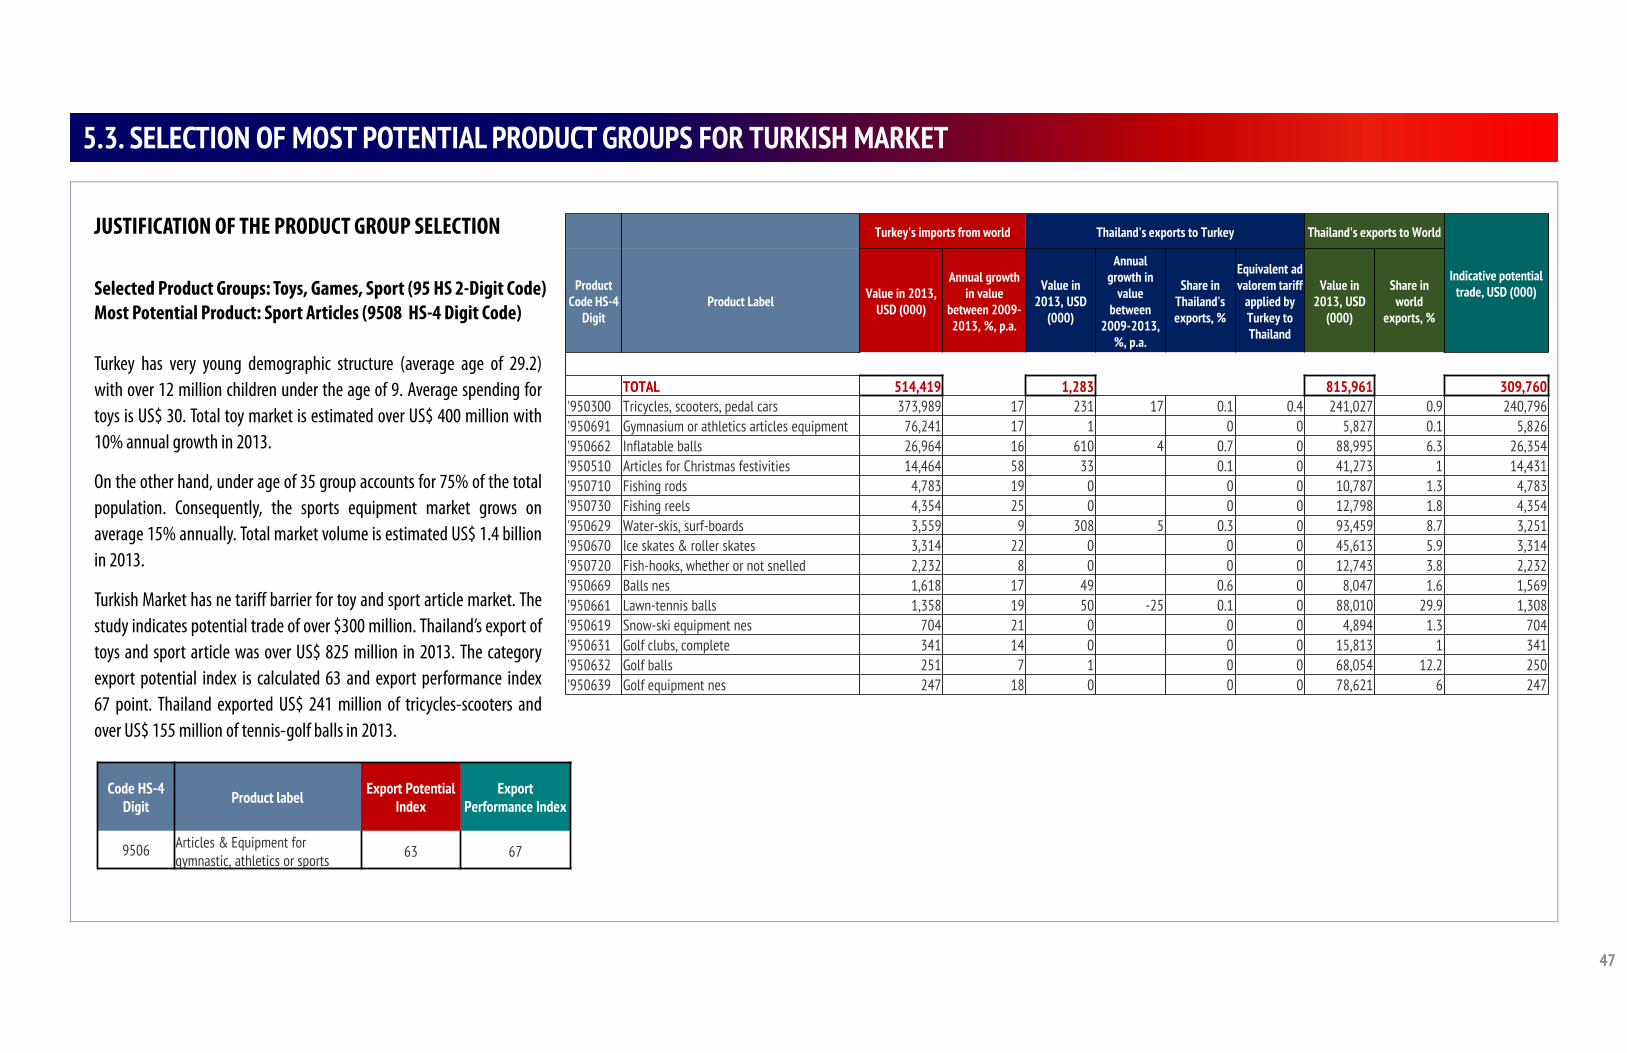
47
5.3. SELECTION OF MOST POTENTIAL PRODUCT GROUPS FOR TURKISH MARKET
JUSTIFICATION OF THE PRODUCT GROUP SELECTION
Selected Product Groups: Toys, Games, Sport (95 HS 2-Digit Code)Most Potential Product: Sport Articles (9508 HS-4 Digit Code)
Turkey has very young demographic structure (average age of 29.2)with over 12 million children under the age of 9. Average spending fortoys is US$ 30. Total toy market is estimated over US$ 400 million with10% annual growth in 2013.
On the other hand, under age of 35 group accounts for 75% of the totalpopulation. Consequently, the sports equipment market grows onaverage 15% annually. Total market volume is estimated US$ 1.4 billionin 2013.
Turkish Market has ne tariff barrier for toy and sport article market. Thestudy indicates potential trade of over $300 million. Thailand’s export oftoys and sport article was over US$ 825 million in 2013. The categoryexport potential index is calculated 63 and export performance index67 point. Thailand exported US$ 241 million of tricycles-scooters andover US$ 155 million of tennis-golf balls in 2013.
Code HS-4 Digit Product label Export Potential
IndexExport
Performance Index
9506 Articles & Equipment for gymnastic, athletics or sports 63 67
Turkey's imports from world Thailand's exports to Turkey Thailand's exports to World
Indicative potential trade, USD (000)Product
Code HS-4 Digit
Product Label Value in 2013, USD (000)
Annual growth in value
between 2009-2013, %, p.a.
Value in 2013, USD
(000)
Annual growth in
value between
2009-2013, %, p.a.
Share in Thailand's exports, %
Equivalent ad valorem tariff
applied by Turkey to Thailand
Value in 2013, USD
(000)
Share in world
exports, %
TOTAL 514,419 1,283 815,961 309,760'950300 Tricycles, scooters, pedal cars 373,989 17 231 17 0.1 0.4 241,027 0.9 240,796'950691 Gymnasium or athletics articles equipment 76,241 17 1 0 0 5,827 0.1 5,826'950662 Inflatable balls 26,964 16 610 4 0.7 0 88,995 6.3 26,354'950510 Articles for Christmas festivities 14,464 58 33 0.1 0 41,273 1 14,431'950710 Fishing rods 4,783 19 0 0 0 10,787 1.3 4,783'950730 Fishing reels 4,354 25 0 0 0 12,798 1.8 4,354'950629 Water-skis, surf-boards 3,559 9 308 5 0.3 0 93,459 8.7 3,251'950670 Ice skates & roller skates 3,314 22 0 0 0 45,613 5.9 3,314'950720 Fish-hooks, whether or not snelled 2,232 8 0 0 0 12,743 3.8 2,232'950669 Balls nes 1,618 17 49 0.6 0 8,047 1.6 1,569'950661 Lawn-tennis balls 1,358 19 50 -25 0.1 0 88,010 29.9 1,308'950619 Snow-ski equipment nes 704 21 0 0 0 4,894 1.3 704'950631 Golf clubs, complete 341 14 0 0 0 15,813 1 341'950632 Golf balls 251 7 1 0 0 68,054 12.2 250'950639 Golf equipment nes 247 18 0 0 0 78,621 6 247
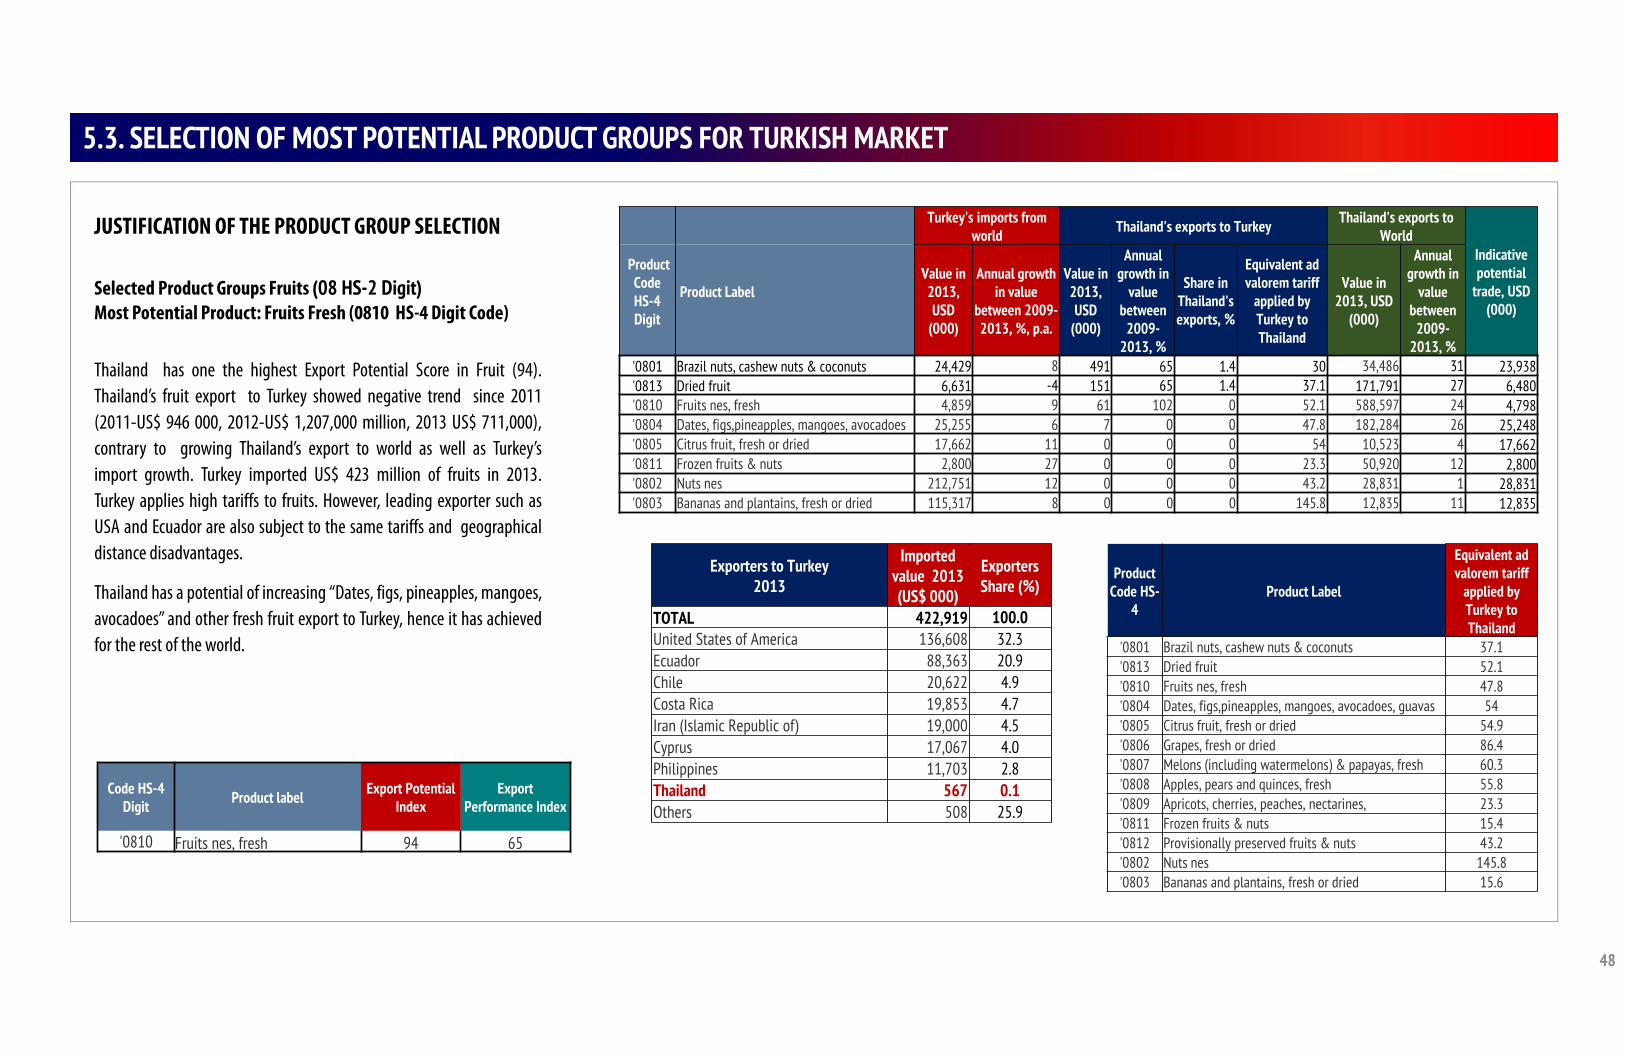
48
5.3. SELECTION OF MOST POTENTIAL PRODUCT GROUPS FOR TURKISH MARKET
JUSTIFICATION OF THE PRODUCT GROUP SELECTION
Selected Product Groups Fruits (08 HS-2 Digit)Most Potential Product: Fruits Fresh (0810 HS-4 Digit Code)
Thailand has one the highest Export Potential Score in Fruit (94).Thailand’s fruit export to Turkey showed negative trend since 2011(2011-US$ 946 000, 2012-US$ 1,207,000 million, 2013 US$ 711,000),contrary to growing Thailand’s export to world as well as Turkey’simport growth. Turkey imported US$ 423 million of fruits in 2013.Turkey applies high tariffs to fruits. However, leading exporter such asUSA and Ecuador are also subject to the same tariffs and geographicaldistance disadvantages.
Thailand has a potential of increasing “Dates, figs, pineapples, mangoes,avocadoes” and other fresh fruit export to Turkey, hence it has achievedfor the rest of the world.
Code HS-4 Digit Product label Export Potential
IndexExport
Performance Index
'0810 Fruits nes, fresh 94 65
Turkey's imports from world Thailand's exports to Turkey Thailand's exports to
WorldIndicative potential
trade, USD (000)
Product CodeHS-4Digit
Product LabelValue in 2013, USD
(000)
Annual growth in value
between 2009-2013, %, p.a.
Value in 2013, USD
(000)
Annual growth in
value between
2009-2013, %
Share in Thailand's exports, %
Equivalent ad valorem tariff
applied by Turkey to Thailand
Value in 2013, USD
(000)
Annual growth in
value between
2009-2013, %
'0801 Brazil nuts, cashew nuts & coconuts 24,429 8 491 65 1.4 30 34,486 31 23,938'0813 Dried fruit 6,631 -4 151 65 1.4 37.1 171,791 27 6,480'0810 Fruits nes, fresh 4,859 9 61 102 0 52.1 588,597 24 4,798'0804 Dates, figs,pineapples, mangoes, avocadoes 25,255 6 7 0 0 47.8 182,284 26 25,248'0805 Citrus fruit, fresh or dried 17,662 11 0 0 0 54 10,523 4 17,662'0811 Frozen fruits & nuts 2,800 27 0 0 0 23.3 50,920 12 2,800'0802 Nuts nes 212,751 12 0 0 0 43.2 28,831 1 28,831'0803 Bananas and plantains, fresh or dried 115,317 8 0 0 0 145.8 12,835 11 12,835
Exporters to Turkey2013
Imported value 2013 (US$ 000)
Exporters Share (%)
TOTAL 422,919 100.0United States of America 136,608 32.3Ecuador 88,363 20.9Chile 20,622 4.9Costa Rica 19,853 4.7Iran (Islamic Republic of) 19,000 4.5Cyprus 17,067 4.0Philippines 11,703 2.8Thailand 567 0.1Others 508 25.9
Product Code HS-
4Product Label
Equivalent ad valorem tariff
applied by Turkey to Thailand
'0801 Brazil nuts, cashew nuts & coconuts 37.1'0813 Dried fruit 52.1'0810 Fruits nes, fresh 47.8'0804 Dates, figs,pineapples, mangoes, avocadoes, guavas 54'0805 Citrus fruit, fresh or dried 54.9'0806 Grapes, fresh or dried 86.4'0807 Melons (including watermelons) & papayas, fresh 60.3'0808 Apples, pears and quinces, fresh 55.8'0809 Apricots, cherries, peaches, nectarines, 23.3'0811 Frozen fruits & nuts 15.4'0812 Provisionally preserved fruits & nuts 43.2'0802 Nuts nes 145.8'0803 Bananas and plantains, fresh or dried 15.6
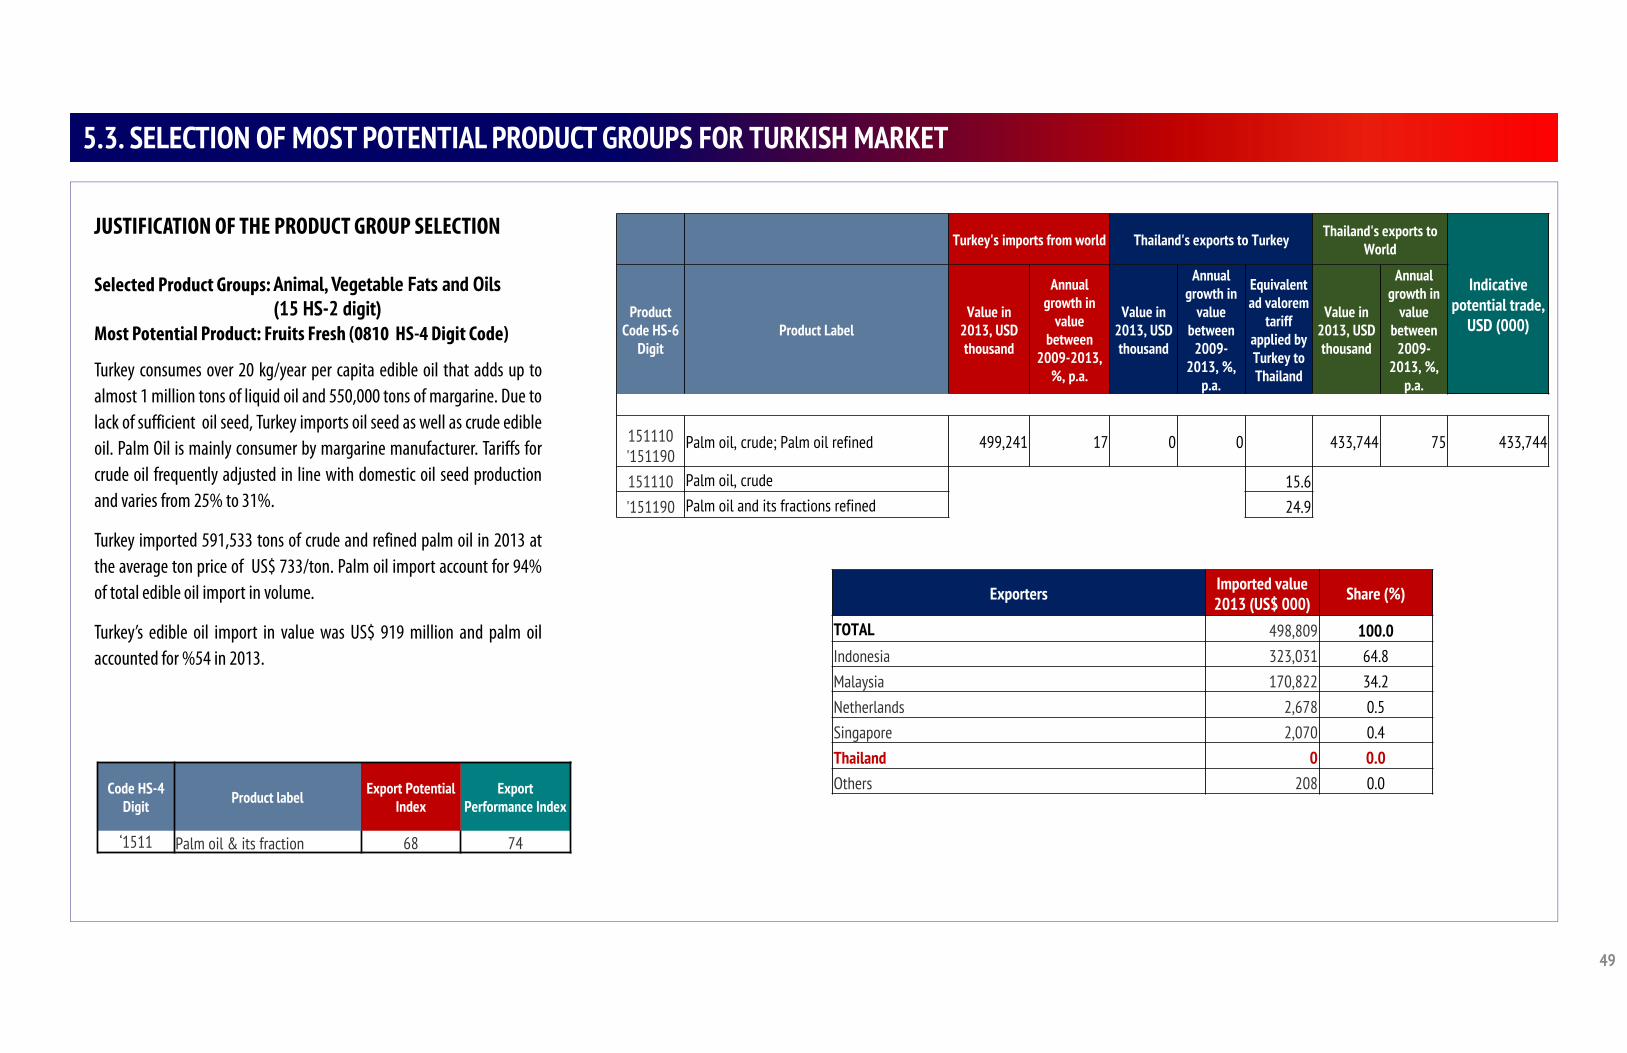
49
5.3. SELECTION OF MOST POTENTIAL PRODUCT GROUPS FOR TURKISH MARKET
JUSTIFICATION OF THE PRODUCT GROUP SELECTION
Selected Product Groups: Animal, Vegetable Fats and Oils (15 HS-2 digit)
Most Potential Product: Fruits Fresh (0810 HS-4 Digit Code)
Turkey consumes over 20 kg/year per capita edible oil that adds up toalmost 1 million tons of liquid oil and 550,000 tons of margarine. Due tolack of sufficient oil seed, Turkey imports oil seed as well as crude edibleoil. Palm Oil is mainly consumer by margarine manufacturer. Tariffs forcrude oil frequently adjusted in line with domestic oil seed productionand varies from 25% to 31%.
Turkey imported 591,533 tons of crude and refined palm oil in 2013 atthe average ton price of US$ 733/ton. Palm oil import account for 94%of total edible oil import in volume.
Turkey’s edible oil import in value was US$ 919 million and palm oilaccounted for %54 in 2013.
Code HS-4 Digit Product label Export Potential
IndexExport
Performance Index
‘1511 Palm oil & its fraction 68 74
Turkey's imports from world Thailand's exports to Turkey Thailand's exports to World
Indicative potential trade,
USD (000)Product
Code HS-6 Digit
Product LabelValue in
2013, USD thousand
Annual growth in
value between
2009-2013, %, p.a.
Value in 2013, USD thousand
Annual growth in
value between
2009-2013, %,
p.a.
Equivalent ad valorem
tariff applied by Turkey to Thailand
Value in 2013, USD thousand
Annual growth in
value between
2009-2013, %,
p.a.'0801 Brazil nuts, cashew nuts & coconuts 24429 8 491 65 30 34486 31
151110 '151190
Palm oil, crude; Palm oil refined 499,241 17 0 0 433,744 75 433,744
151110 Palm oil, crude 15.6'151190 Palm oil and its fractions refined 24.9
Exporters Imported value 2013 (US$ 000) Share (%)
TOTAL 498,809 100.0Indonesia 323,031 64.8Malaysia 170,822 34.2Netherlands 2,678 0.5Singapore 2,070 0.4Thailand 0 0.0Others 208 0.0
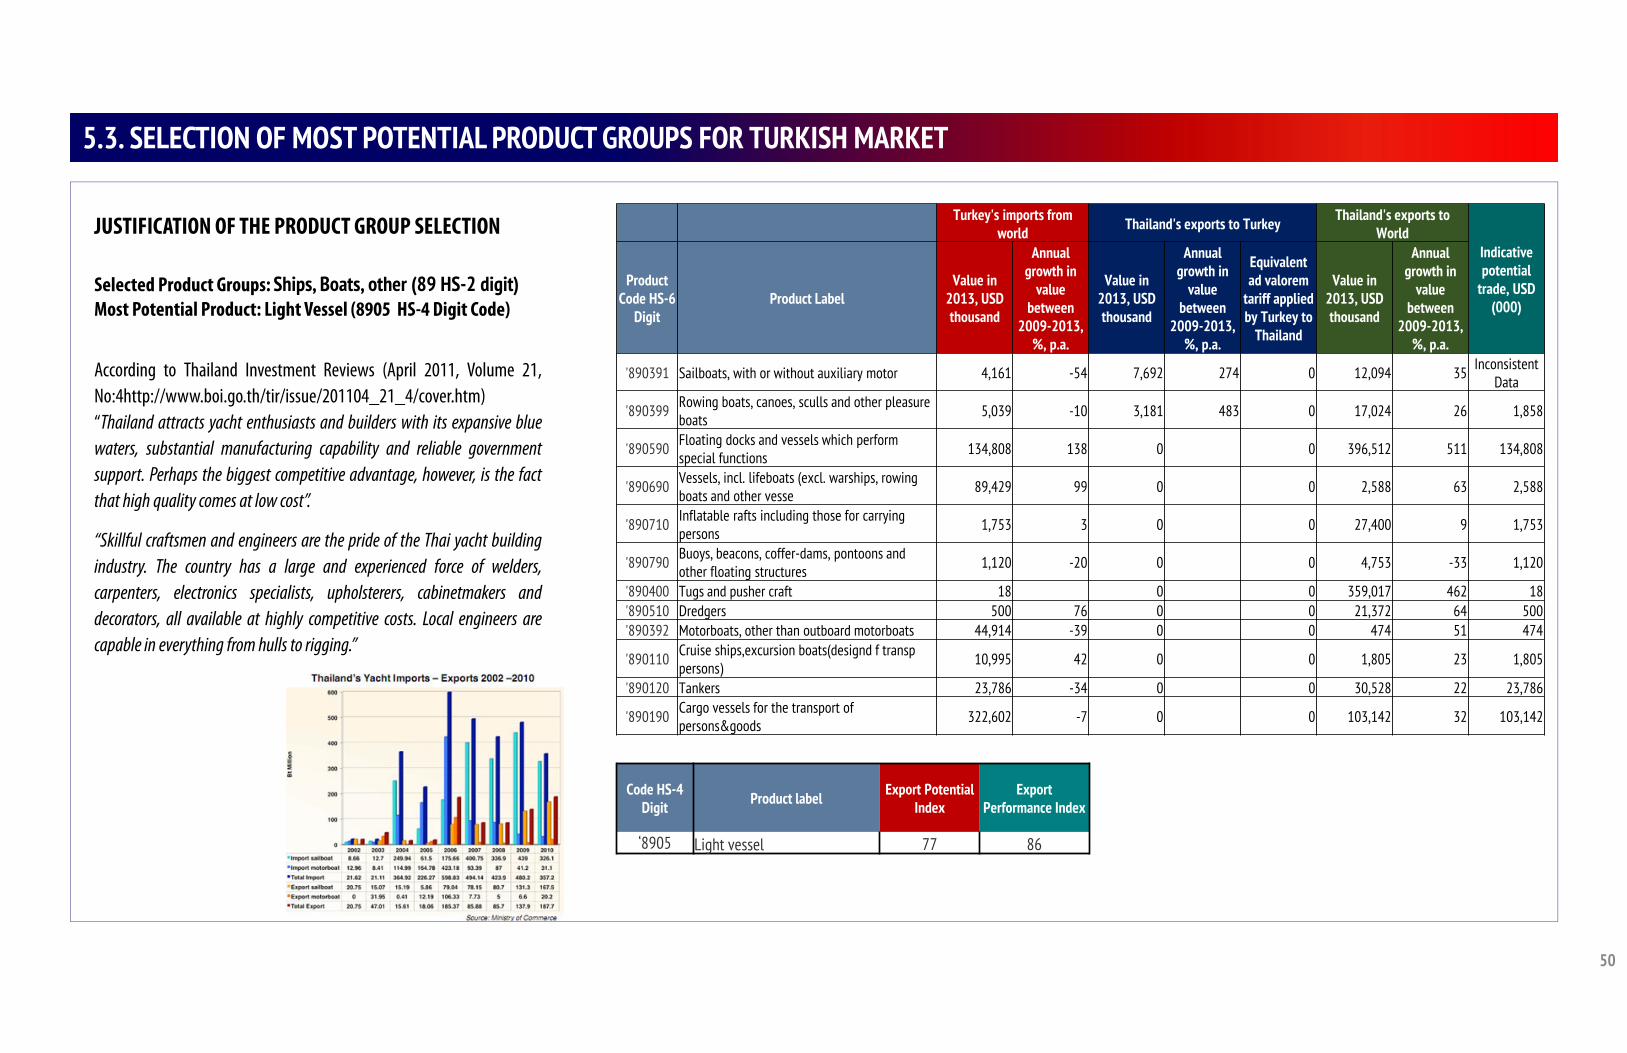
50
5.3. SELECTION OF MOST POTENTIAL PRODUCT GROUPS FOR TURKISH MARKET
JUSTIFICATION OF THE PRODUCT GROUP SELECTION
Selected Product Groups: Ships, Boats, other (89 HS-2 digit) Most Potential Product: Light Vessel (8905 HS-4 Digit Code)
According to Thailand Investment Reviews (April 2011, Volume 21,No:4http://www.boi.go.th/tir/issue/201104_21_4/cover.htm)“Thailand attracts yacht enthusiasts and builders with its expansive bluewaters, substantial manufacturing capability and reliable governmentsupport. Perhaps the biggest competitive advantage, however, is the factthat high quality comes at low cost”.
“Skillful craftsmen and engineers are the pride of the Thai yacht buildingindustry. The country has a large and experienced force of welders,carpenters, electronics specialists, upholsterers, cabinetmakers anddecorators, all available at highly competitive costs. Local engineers arecapable in everything from hulls to rigging.”
Code HS-4 Digit Product label Export Potential
IndexExport
Performance Index
‘8905 Light vessel 77 86
Turkey's imports from world Thailand's exports to Turkey Thailand's exports to
WorldIndicative potential
trade, USD (000)
Product Code HS-6
DigitProduct Label
Value in 2013, USD thousand
Annual growth in
value between
2009-2013, %, p.a.
Value in 2013, USD thousand
Annual growth in
value between
2009-2013, %, p.a.
Equivalent ad valorem
tariff applied by Turkey to
Thailand
Value in 2013, USD thousand
Annual growth in
value between
2009-2013, %, p.a.
'890391 Sailboats, with or without auxiliary motor 4,161 -54 7,692 274 0 12,094 35 Inconsistent Data
'890399 Rowing boats, canoes, sculls and other pleasure boats 5,039 -10 3,181 483 0 17,024 26 1,858
'890590 Floating docks and vessels which perform special functions 134,808 138 0 0 396,512 511 134,808
'890690 Vessels, incl. lifeboats (excl. warships, rowing boats and other vesse 89,429 99 0 0 2,588 63 2,588
'890710 Inflatable rafts including those for carrying persons 1,753 3 0 0 27,400 9 1,753
'890790 Buoys, beacons, coffer-dams, pontoons and other floating structures 1,120 -20 0 0 4,753 -33 1,120
'890400 Tugs and pusher craft 18 0 0 359,017 462 18'890510 Dredgers 500 76 0 0 21,372 64 500'890392 Motorboats, other than outboard motorboats 44,914 -39 0 0 474 51 474
'890110 Cruise ships,excursion boats(designd f transp persons) 10,995 42 0 0 1,805 23 1,805
'890120 Tankers 23,786 -34 0 0 30,528 22 23,786
'890190 Cargo vessels for the transport of persons&goods 322,602 -7 0 0 103,142 32 103,142
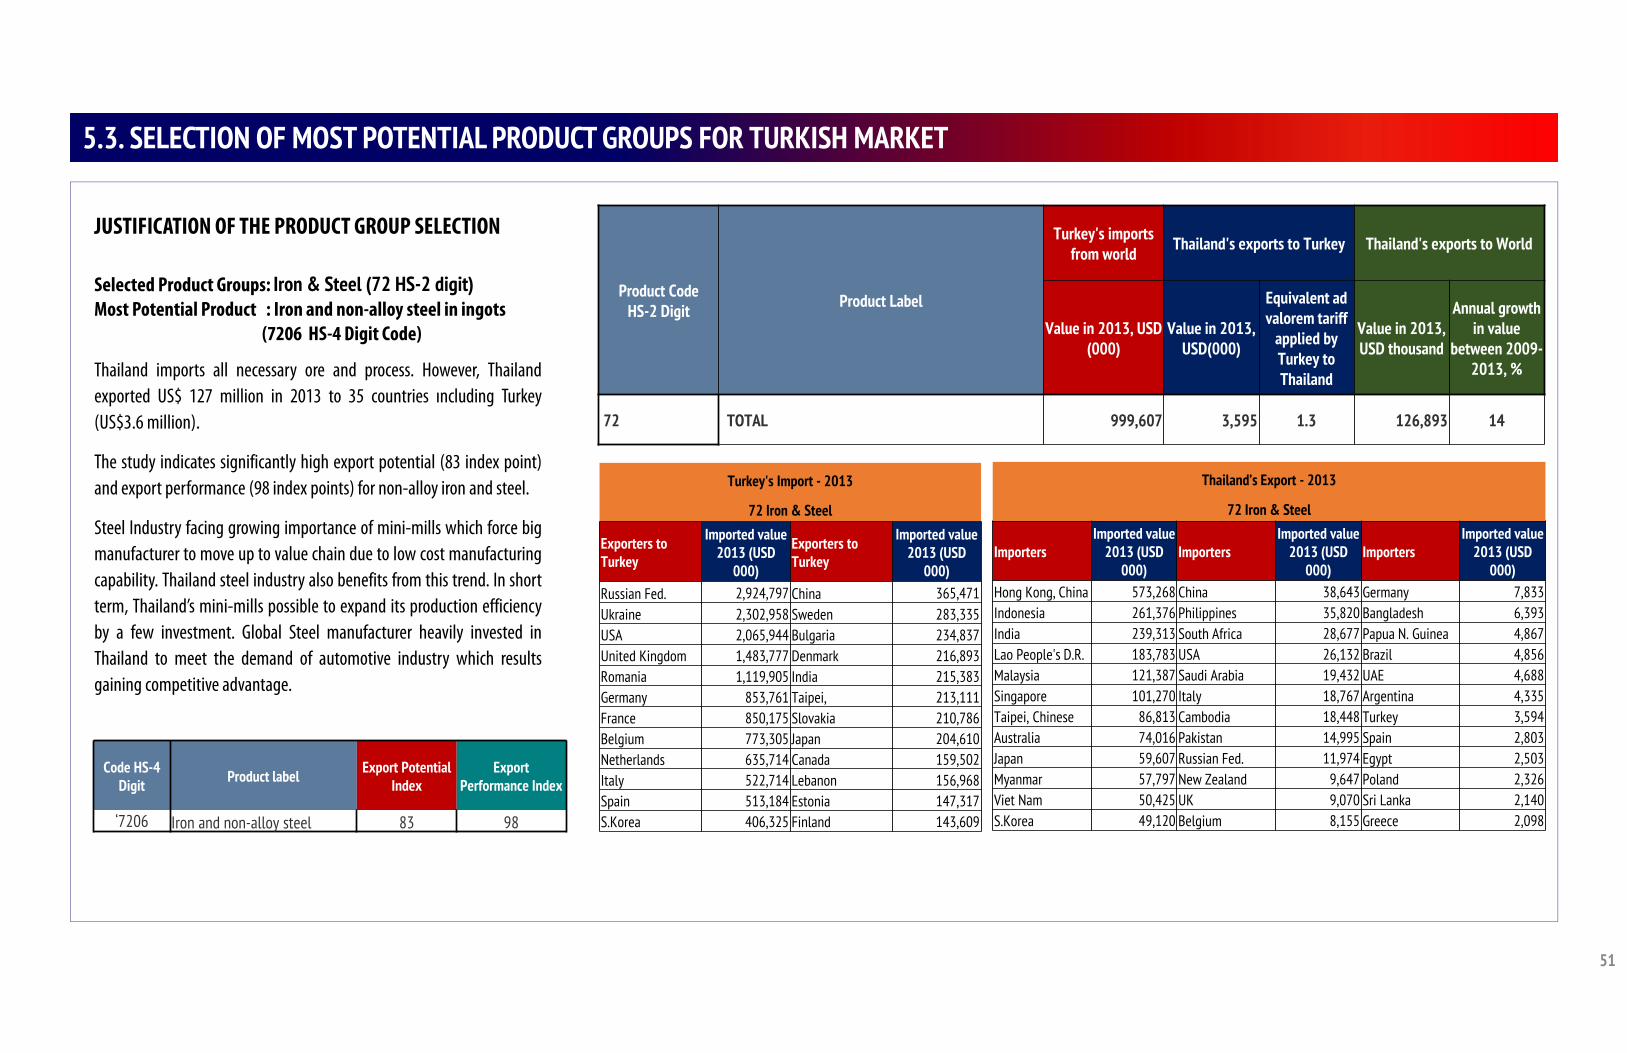
51
5.3. SELECTION OF MOST POTENTIAL PRODUCT GROUPS FOR TURKISH MARKET
JUSTIFICATION OF THE PRODUCT GROUP SELECTION
Selected Product Groups: Iron & Steel (72 HS-2 digit) Most Potential Product : Iron and non-alloy steel in ingots
(7206 HS-4 Digit Code)
Thailand imports all necessary ore and process. However, Thailandexported US$ 127 million in 2013 to 35 countries ıncluding Turkey(US$3.6 million).
The study indicates significantly high export potential (83 index point)and export performance (98 index points) for non-alloy iron and steel.
Steel Industry facing growing importance of mini-mills which force bigmanufacturer to move up to value chain due to low cost manufacturingcapability. Thailand steel industry also benefits from this trend. In shortterm, Thailand’s mini-mills possible to expand its production efficiencyby a few investment. Global Steel manufacturer heavily invested inThailand to meet the demand of automotive industry which resultsgaining competitive advantage.
Code HS-4 Digit Product label Export Potential
IndexExport
Performance Index
‘7206 Iron and non-alloy steel 83 98
Product CodeHS-2 Digit Product Label
Turkey's imports from world Thailand's exports to Turkey Thailand's exports to World
Value in 2013, USD (000)
Value in 2013, USD(000)
Equivalent ad valorem tariff
applied by Turkey to Thailand
Value in 2013, USD thousand
Annual growth in value
between 2009-2013, %
72 TOTAL 999,607 3,595 1.3 126,893 14
Thailand’s Export - 2013
72 Iron & Steel
ImportersImported value
2013 (USD 000)
ImportersImported value
2013 (USD 000)
ImportersImported value
2013 (USD 000)
Hong Kong, China 573,268 China 38,643 Germany 7,833Indonesia 261,376 Philippines 35,820 Bangladesh 6,393India 239,313 South Africa 28,677 Papua N. Guinea 4,867Lao People's D.R. 183,783 USA 26,132 Brazil 4,856Malaysia 121,387 Saudi Arabia 19,432 UAE 4,688Singapore 101,270 Italy 18,767 Argentina 4,335Taipei, Chinese 86,813 Cambodia 18,448 Turkey 3,594Australia 74,016 Pakistan 14,995 Spain 2,803Japan 59,607 Russian Fed. 11,974 Egypt 2,503Myanmar 57,797 New Zealand 9,647 Poland 2,326Viet Nam 50,425 UK 9,070 Sri Lanka 2,140S.Korea 49,120 Belgium 8,155 Greece 2,098
Turkey's Import - 2013
72 Iron & Steel
Exporters to Turkey
Imported value 2013 (USD
000)
Exporters to Turkey
Imported value 2013 (USD
000)Russian Fed. 2,924,797 China 365,471Ukraine 2,302,958 Sweden 283,335USA 2,065,944 Bulgaria 234,837United Kingdom 1,483,777 Denmark 216,893Romania 1,119,905 India 215,383Germany 853,761 Taipei, 213,111France 850,175 Slovakia 210,786Belgium 773,305 Japan 204,610Netherlands 635,714 Canada 159,502Italy 522,714 Lebanon 156,968Spain 513,184 Estonia 147,317S.Korea 406,325 Finland 143,609
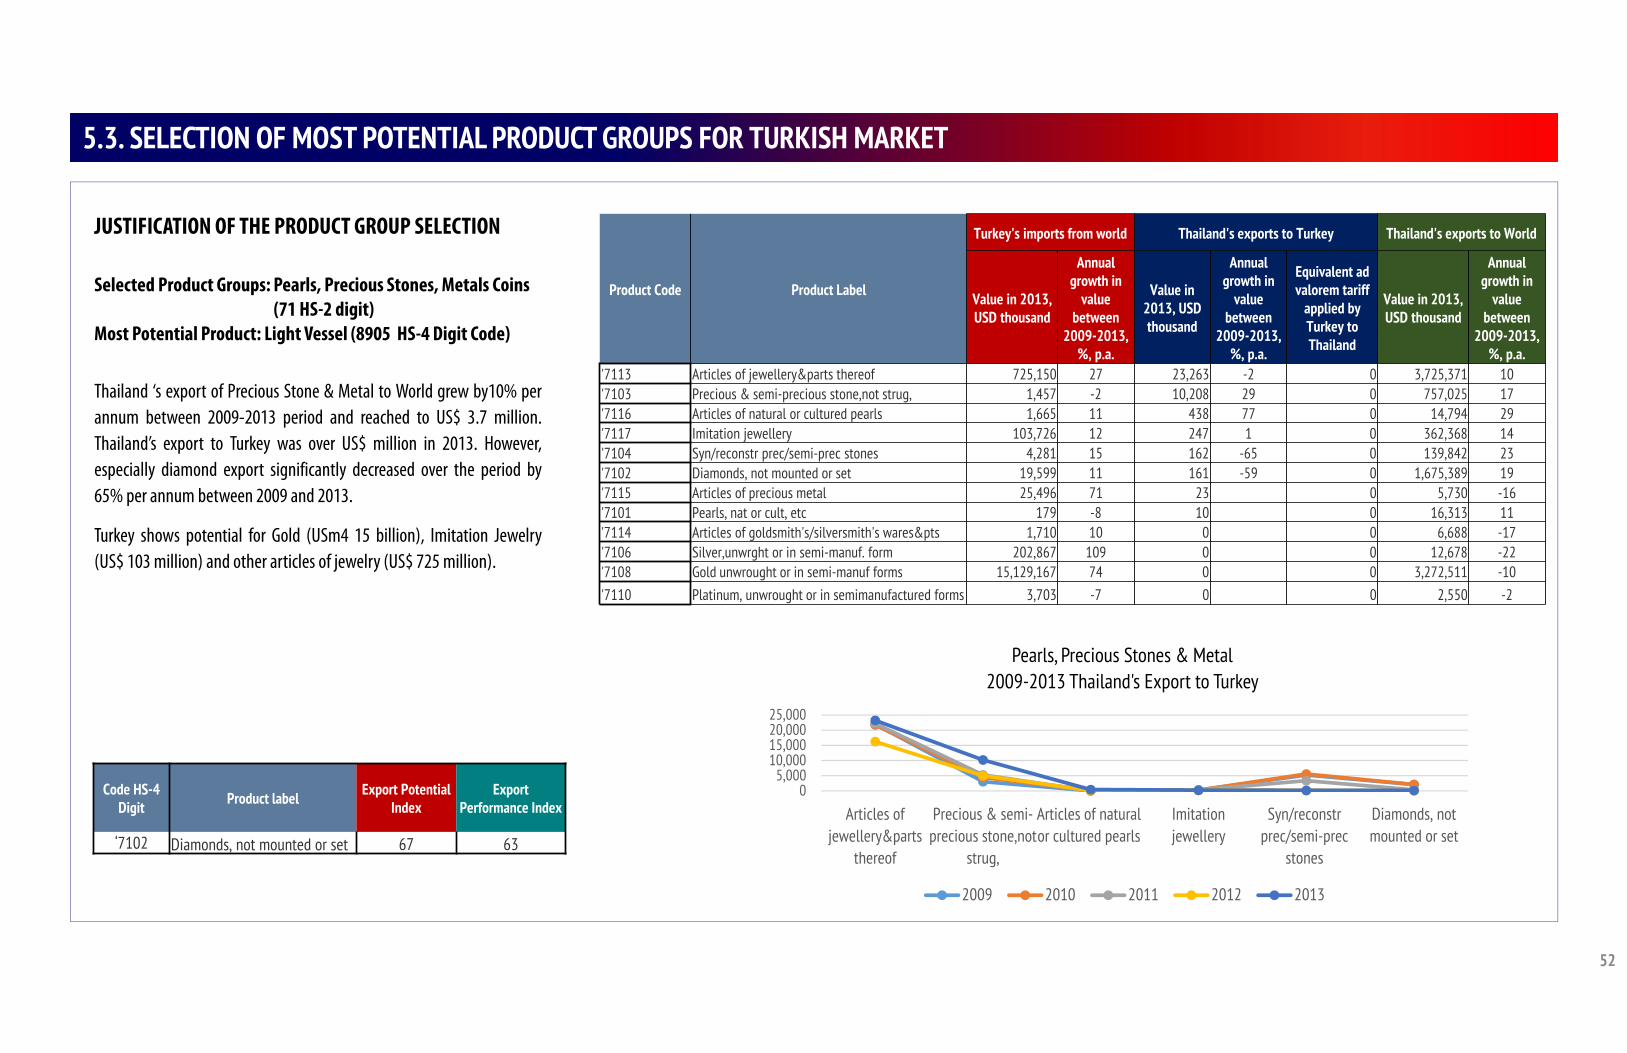
52
5.3. SELECTION OF MOST POTENTIAL PRODUCT GROUPS FOR TURKISH MARKET
JUSTIFICATION OF THE PRODUCT GROUP SELECTION
Selected Product Groups: Pearls, Precious Stones, Metals Coins(71 HS-2 digit)
Most Potential Product: Light Vessel (8905 HS-4 Digit Code)
Thailand ‘s export of Precious Stone & Metal to World grew by10% perannum between 2009-2013 period and reached to US$ 3.7 million.Thailand’s export to Turkey was over US$ million in 2013. However,especially diamond export significantly decreased over the period by65% per annum between 2009 and 2013.
Turkey shows potential for Gold (USm4 15 billion), Imitation Jewelry(US$ 103 million) and other articles of jewelry (US$ 725 million).
Code HS-4 Digit Product label Export Potential
IndexExport
Performance Index
‘7102 Diamonds, not mounted or set 67 63
Product Code Product Label
Turkey's imports from world Thailand's exports to Turkey Thailand's exports to World
Value in 2013, USD thousand
Annual growth in
value between
2009-2013, %, p.a.
Value in 2013, USD thousand
Annual growth in
value between
2009-2013, %, p.a.
Equivalent ad valorem tariff
applied by Turkey to Thailand
Value in 2013, USD thousand
Annual growth in
value between
2009-2013, %, p.a.
'7113 Articles of jewellery&parts thereof 725,150 27 23,263 -2 0 3,725,371 10'7103 Precious & semi-precious stone,not strug, 1,457 -2 10,208 29 0 757,025 17'7116 Articles of natural or cultured pearls 1,665 11 438 77 0 14,794 29'7117 Imitation jewellery 103,726 12 247 1 0 362,368 14'7104 Syn/reconstr prec/semi-prec stones 4,281 15 162 -65 0 139,842 23'7102 Diamonds, not mounted or set 19,599 11 161 -59 0 1,675,389 19'7115 Articles of precious metal 25,496 71 23 0 5,730 -16'7101 Pearls, nat or cult, etc 179 -8 10 0 16,313 11'7114 Articles of goldsmith's/silversmith's wares&pts 1,710 10 0 0 6,688 -17'7106 Silver,unwrght or in semi-manuf. form 202,867 109 0 0 12,678 -22'7108 Gold unwrought or in semi-manuf forms 15,129,167 74 0 0 3,272,511 -10'7110 Platinum, unwrought or in semimanufactured forms 3,703 -7 0 0 2,550 -2
05,000
10,00015,00020,00025,000
Articles ofjewellery&parts
thereof
Precious & semi-precious stone,not
strug,
Articles of naturalor cultured pearls
Imitationjewellery
Syn/reconstrprec/semi-prec
stones
Diamonds, notmounted or set
Pearls, Precious Stones & Metal2009-2013 Thailand's Export to Turkey
2009 2010 2011 2012 2013
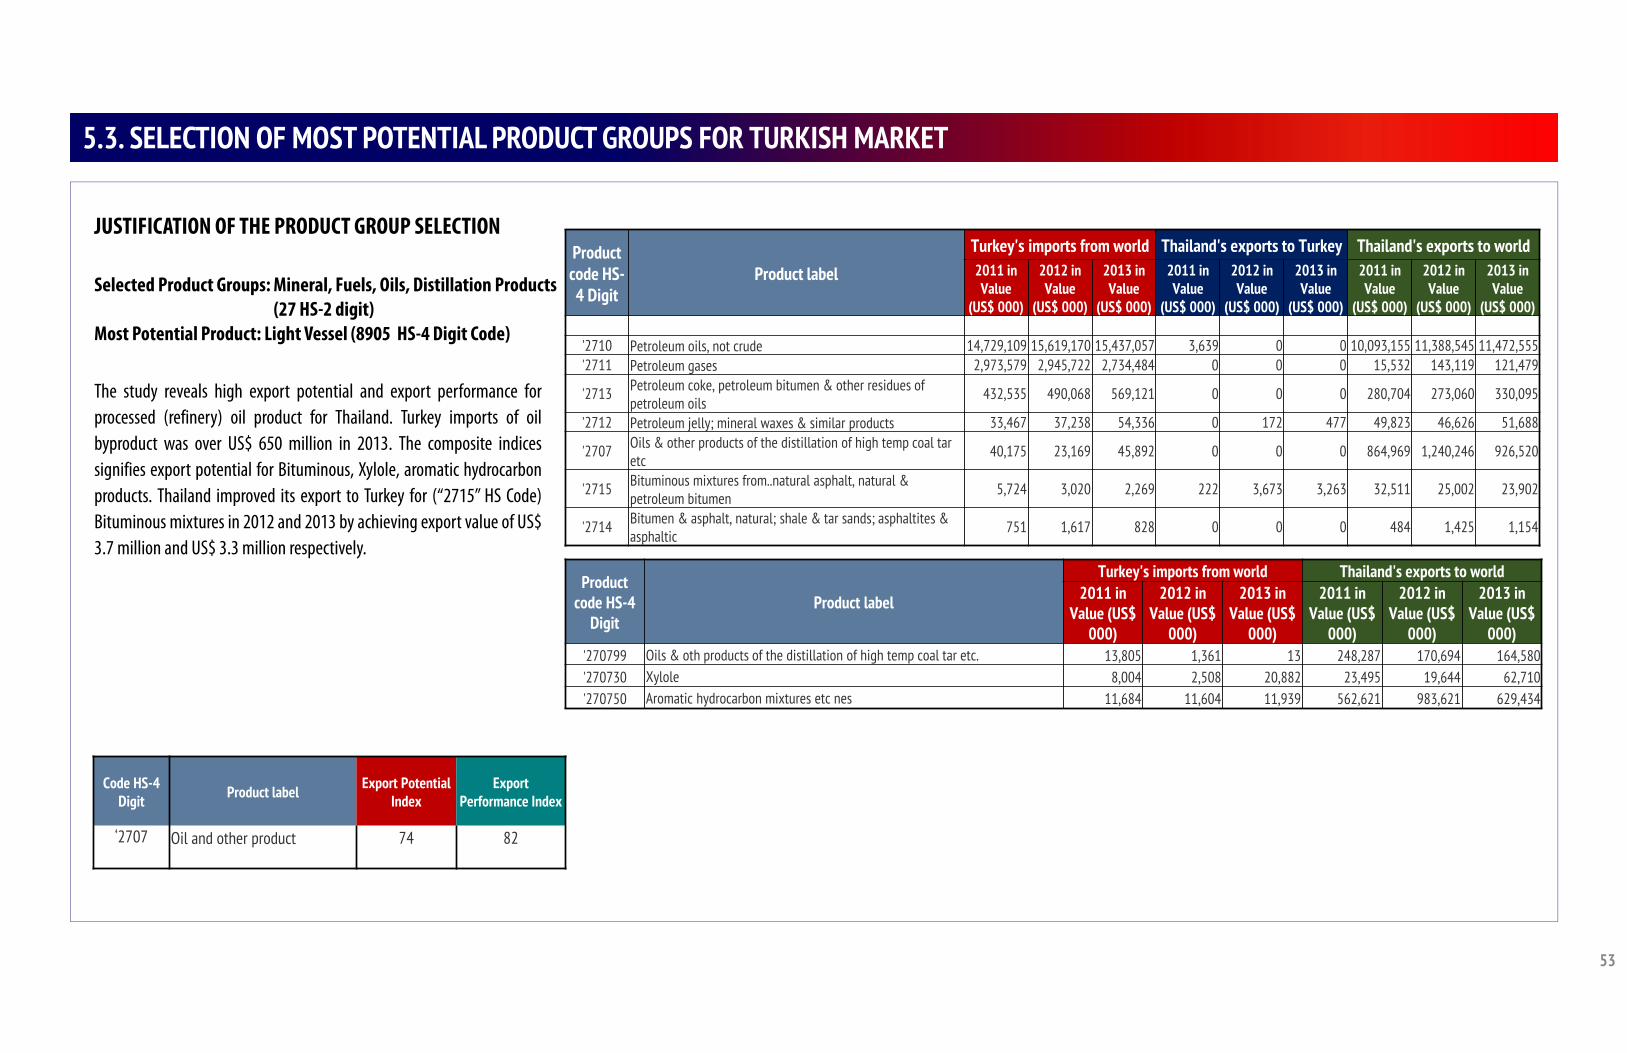
53
5.3. SELECTION OF MOST POTENTIAL PRODUCT GROUPS FOR TURKISH MARKET
JUSTIFICATION OF THE PRODUCT GROUP SELECTION
Selected Product Groups: Mineral, Fuels, Oils, Distillation Products(27 HS-2 digit)
Most Potential Product: Light Vessel (8905 HS-4 Digit Code)
The study reveals high export potential and export performance forprocessed (refinery) oil product for Thailand. Turkey imports of oilbyproduct was over US$ 650 million in 2013. The composite indicessignifies export potential for Bituminous, Xylole, aromatic hydrocarbonproducts. Thailand improved its export to Turkey for (“2715” HS Code)Bituminous mixtures in 2012 and 2013 by achieving export value of US$3.7 million and US$ 3.3 million respectively.
Code HS-4 Digit Product label Export Potential
IndexExport
Performance Index
‘2707 Oil and other product 74 82
Product code HS-4 Digit
Product labelTurkey's imports from world Thailand's exports to Turkey Thailand's exports to world2011 in Value
(US$ 000)
2012 in Value
(US$ 000)
2013 in Value
(US$ 000)
2011 in Value
(US$ 000)
2012 in Value
(US$ 000)
2013 in Value
(US$ 000)
2011 in Value
(US$ 000)
2012 in Value
(US$ 000)
2013 in Value
(US$ 000)
'2710 Petroleum oils, not crude 14,729,109 15,619,170 15,437,057 3,639 0 0 10,093,155 11,388,545 11,472,555'2711 Petroleum gases 2,973,579 2,945,722 2,734,484 0 0 0 15,532 143,119 121,479
'2713 Petroleum coke, petroleum bitumen & other residues of petroleum oils
432,535 490,068 569,121 0 0 0 280,704 273,060 330,095
'2712 Petroleum jelly; mineral waxes & similar products 33,467 37,238 54,336 0 172 477 49,823 46,626 51,688
'2707 Oils & other products of the distillation of high temp coal tar etc
40,175 23,169 45,892 0 0 0 864,969 1,240,246 926,520
'2715 Bituminous mixtures from..natural asphalt, natural & petroleum bitumen
5,724 3,020 2,269 222 3,673 3,263 32,511 25,002 23,902
'2714 Bitumen & asphalt, natural; shale & tar sands; asphaltites & asphaltic
751 1,617 828 0 0 0 484 1,425 1,154
Product code HS-4
DigitProduct label
Turkey's imports from world Thailand's exports to world2011 in
Value (US$ 000)
2012 in Value (US$
000)
2013 in Value (US$
000)
2011 in Value (US$
000)
2012 in Value (US$
000)
2013 in Value (US$
000)'270799 Oils & oth products of the distillation of high temp coal tar etc. 13,805 1,361 13 248,287 170,694 164,580'270730 Xylole 8,004 2,508 20,882 23,495 19,644 62,710'270750 Aromatic hydrocarbon mixtures etc nes 11,684 11,604 11,939 562,621 983,621 629,434
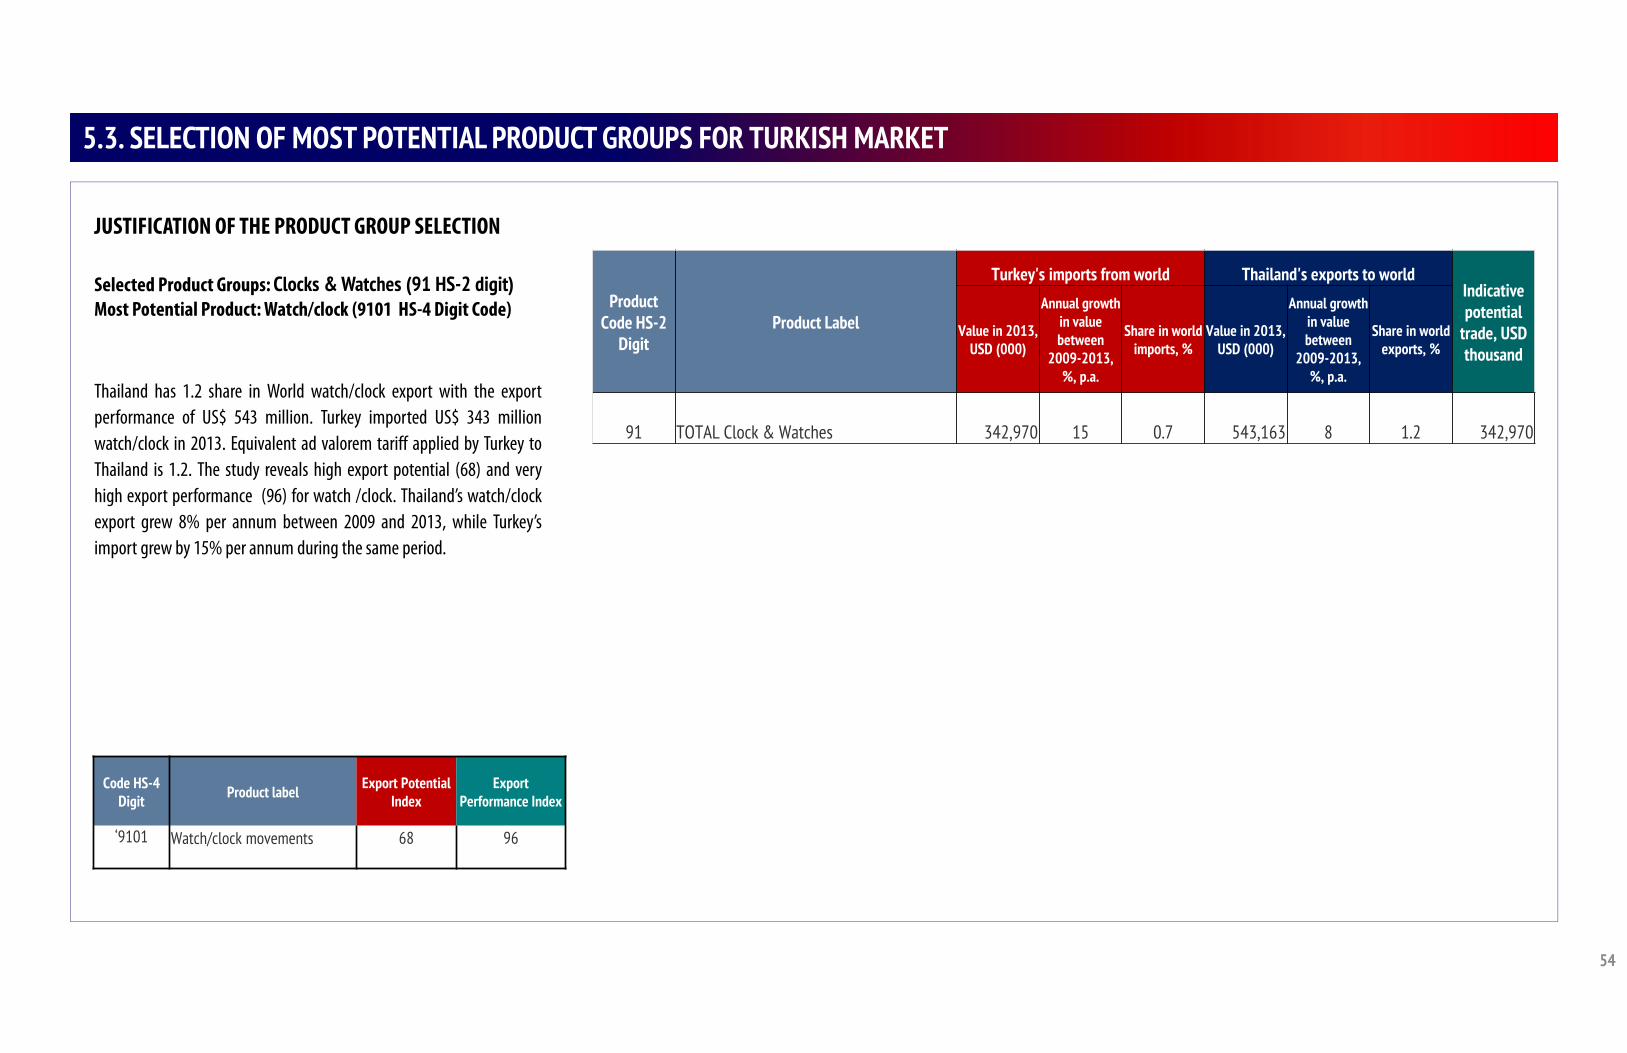
54
5.3. SELECTION OF MOST POTENTIAL PRODUCT GROUPS FOR TURKISH MARKET
JUSTIFICATION OF THE PRODUCT GROUP SELECTION
Selected Product Groups: Clocks & Watches (91 HS-2 digit) Most Potential Product: Watch/clock (9101 HS-4 Digit Code)
Thailand has 1.2 share in World watch/clock export with the exportperformance of US$ 543 million. Turkey imported US$ 343 millionwatch/clock in 2013. Equivalent ad valorem tariff applied by Turkey toThailand is 1.2. The study reveals high export potential (68) and veryhigh export performance (96) for watch /clock. Thailand’s watch/clockexport grew 8% per annum between 2009 and 2013, while Turkey’simport grew by 15% per annum during the same period.
Code HS-4 Digit Product label Export Potential
IndexExport
Performance Index
‘9101 Watch/clock movements 68 96
Product Code HS-2
DigitProduct Label
Turkey's imports from world Thailand's exports to worldIndicative potential
trade, USD thousand
Value in 2013, USD (000)
Annual growth in value between
2009-2013, %, p.a.
Share in world imports, %
Value in 2013, USD (000)
Annual growth in value between
2009-2013, %, p.a.
Share in world exports, %
91 TOTAL Clock & Watches 342,970 15 0.7 543,163 8 1.2 342,970
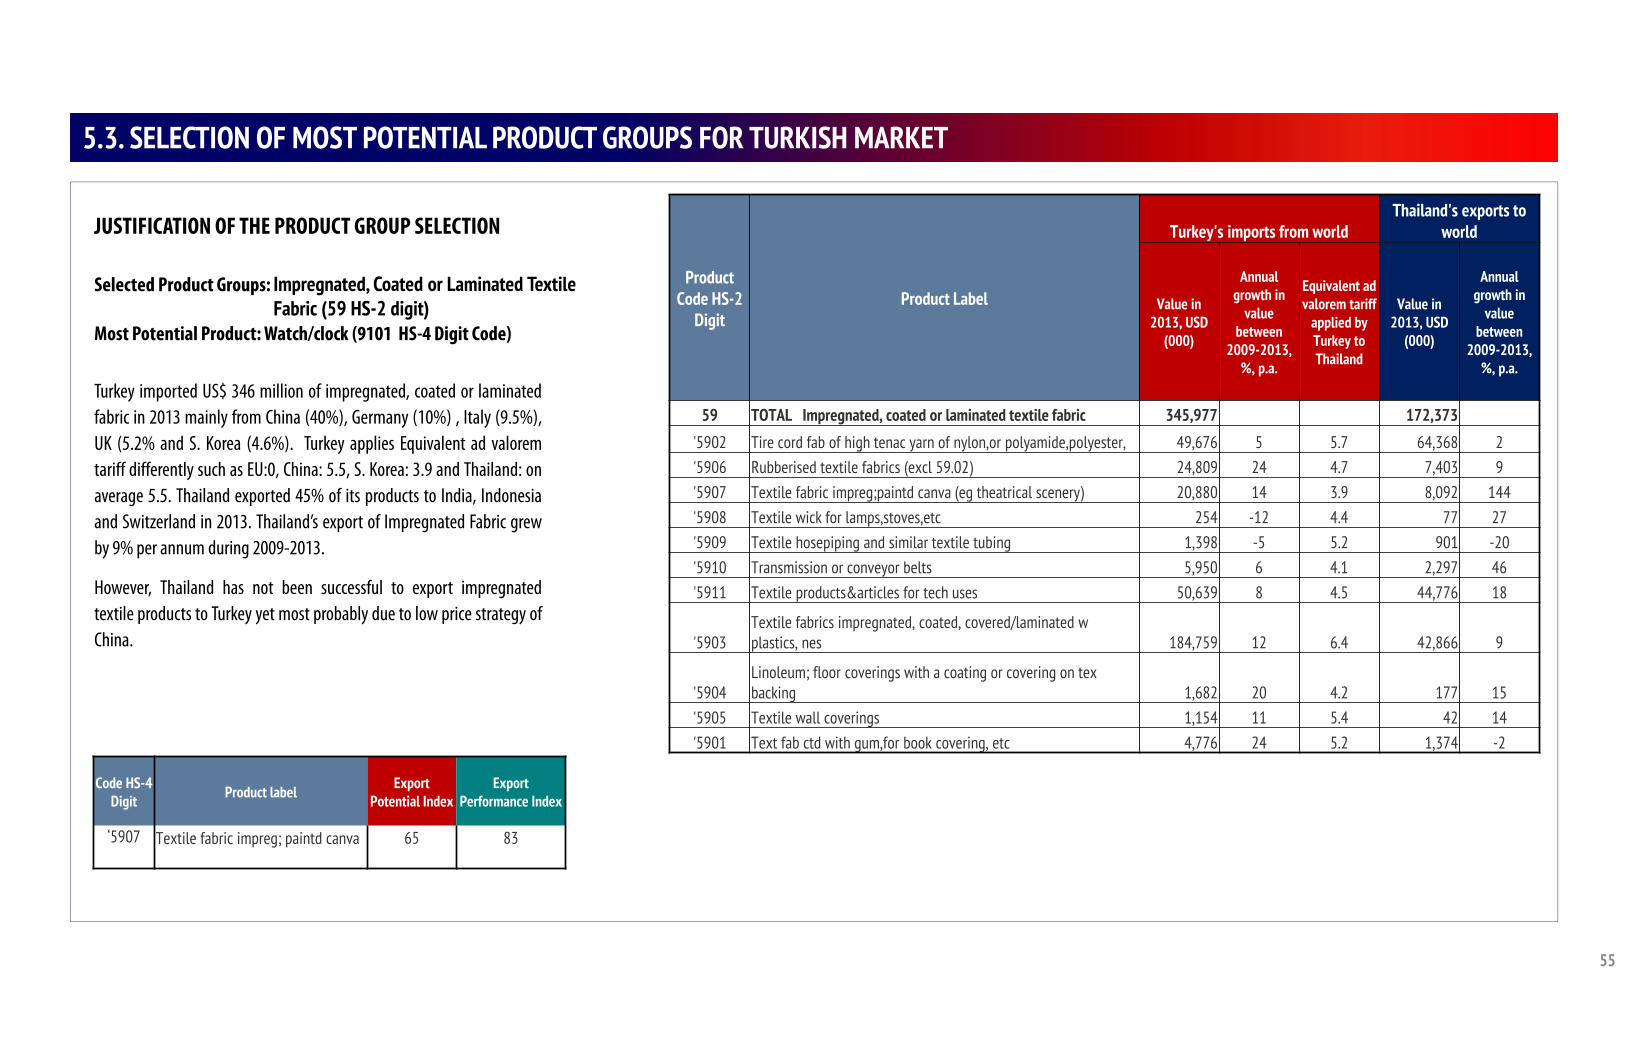
55
5.3. SELECTION OF MOST POTENTIAL PRODUCT GROUPS FOR TURKISH MARKET
JUSTIFICATION OF THE PRODUCT GROUP SELECTION
Selected Product Groups: Impregnated, Coated or Laminated Textile Fabric (59 HS-2 digit)
Most Potential Product: Watch/clock (9101 HS-4 Digit Code)
Turkey imported US$ 346 million of impregnated, coated or laminatedfabric in 2013 mainly from China (40%), Germany (10%) , Italy (9.5%),UK (5.2% and S. Korea (4.6%). Turkey applies Equivalent ad valoremtariff differently such as EU:0, China: 5.5, S. Korea: 3.9 and Thailand: onaverage 5.5. Thailand exported 45% of its products to India, Indonesiaand Switzerland in 2013. Thailand’s export of Impregnated Fabric grewby 9% per annum during 2009-2013.
However, Thailand has not been successful to export impregnatedtextile products to Turkey yet most probably due to low price strategy ofChina.
Code HS-4 Digit Product label Export
Potential IndexExport
Performance Index
‘5907 Textile fabric impreg; paintd canva 65 83
Product Code HS-2
DigitProduct Label
Turkey's imports from worldThailand's exports to
world
Value in 2013, USD
(000)
Annual growth in
value between
2009-2013, %, p.a.
Equivalent ad valorem tariff
applied by Turkey to Thailand
Value in 2013, USD
(000)
Annual growth in
value between
2009-2013, %, p.a.
59 TOTAL Impregnated, coated or laminated textile fabric 345,977 172,373
'5902 Tire cord fab of high tenac yarn of nylon,or polyamide,polyester, 49,676 5 5.7 64,368 2'5906 Rubberised textile fabrics (excl 59.02) 24,809 24 4.7 7,403 9'5907 Textile fabric impreg;paintd canva (eg theatrical scenery) 20,880 14 3.9 8,092 144'5908 Textile wick for lamps,stoves,etc 254 -12 4.4 77 27'5909 Textile hosepiping and similar textile tubing 1,398 -5 5.2 901 -20'5910 Transmission or conveyor belts 5,950 6 4.1 2,297 46'5911 Textile products&articles for tech uses 50,639 8 4.5 44,776 18
'5903Textile fabrics impregnated, coated, covered/laminated w plastics, nes 184,759 12 6.4 42,866 9
'5904Linoleum; floor coverings with a coating or covering on tex backing 1,682 20 4.2 177 15
'5905 Textile wall coverings 1,154 11 5.4 42 14'5901 Text fab ctd with gum,for book covering, etc 4,776 24 5.2 1,374 -2
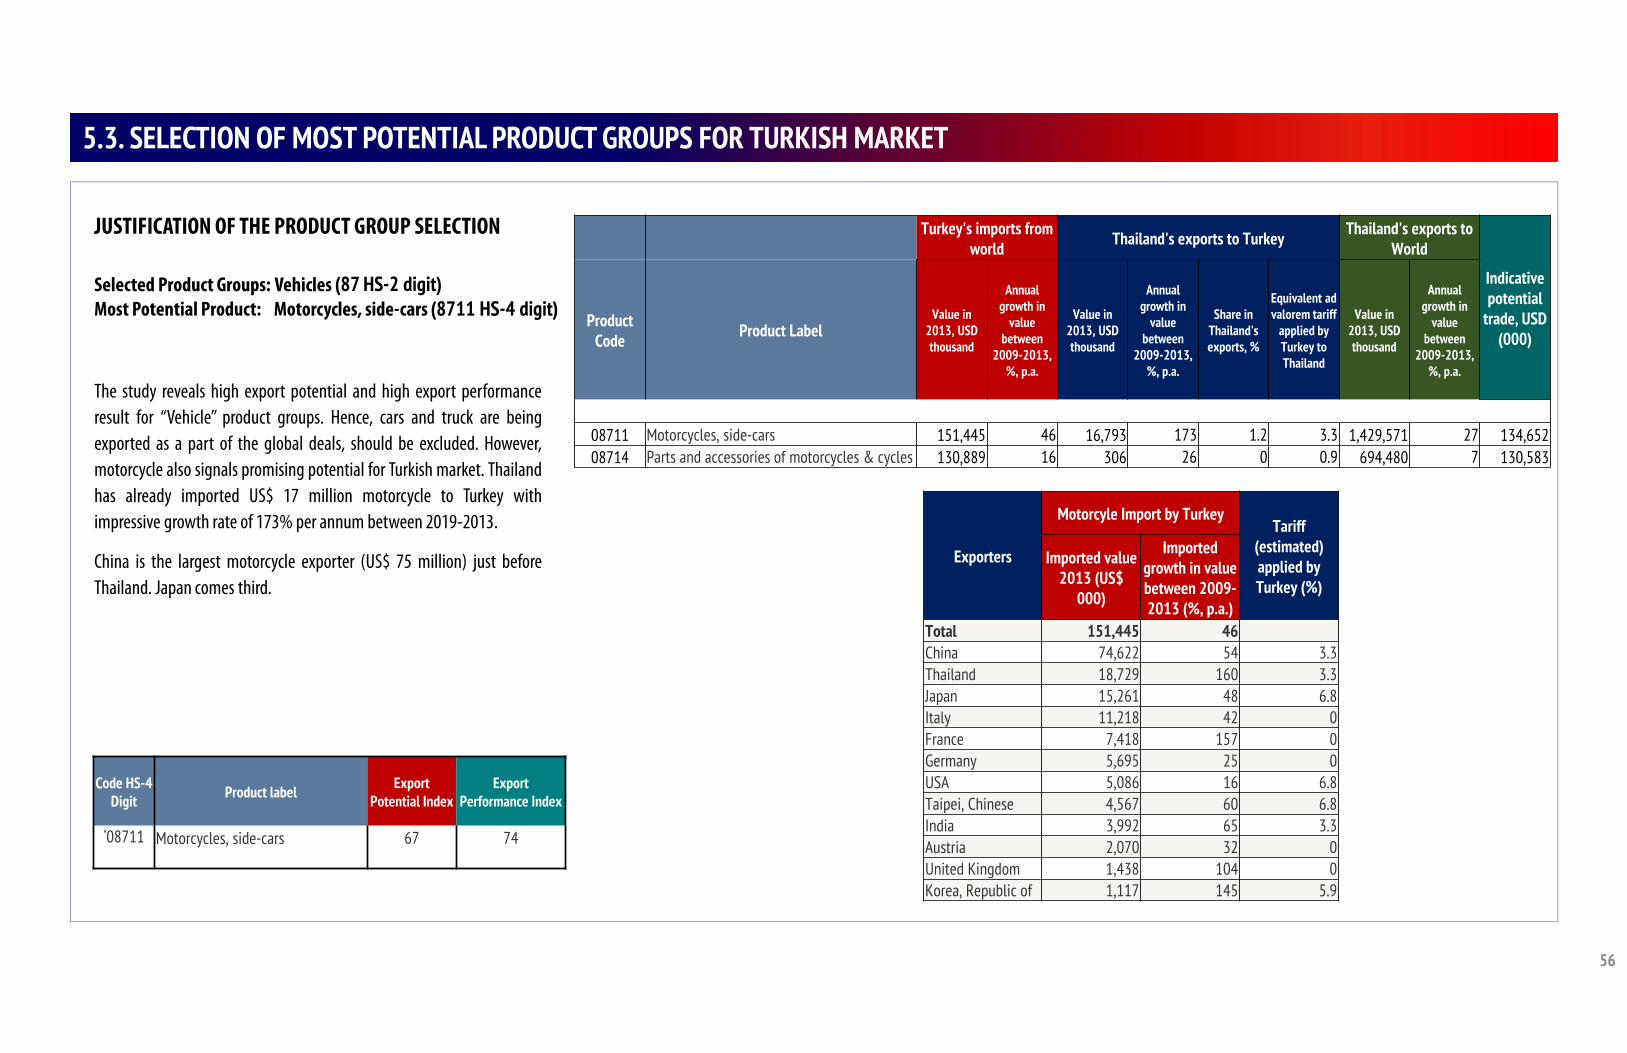
56
5.3. SELECTION OF MOST POTENTIAL PRODUCT GROUPS FOR TURKISH MARKET
JUSTIFICATION OF THE PRODUCT GROUP SELECTION
Selected Product Groups: Vehicles (87 HS-2 digit) Most Potential Product: Motorcycles, side-cars (8711 HS-4 digit)
The study reveals high export potential and high export performanceresult for “Vehicle” product groups. Hence, cars and truck are beingexported as a part of the global deals, should be excluded. However,motorcycle also signals promising potential for Turkish market. Thailandhas already imported US$ 17 million motorcycle to Turkey withimpressive growth rate of 173% per annum between 2019-2013.
China is the largest motorcycle exporter (US$ 75 million) just beforeThailand. Japan comes third.
Code HS-4 Digit Product label Export
Potential IndexExport
Performance Index
‘08711 Motorcycles, side-cars 67 74
Turkey's imports from world Thailand's exports to Turkey Thailand's exports to
World
Indicative potential
trade, USD (000)
Product Code Product Label
Value in 2013, USD thousand
Annual growth in
value between
2009-2013, %, p.a.
Value in 2013, USD thousand
Annual growth in
value between
2009-2013, %, p.a.
Share in Thailand's exports, %
Equivalent ad valorem tariff
applied by Turkey to Thailand
Value in 2013, USD thousand
Annual growth in
value between
2009-2013, %, p.a.
'0801 Brazil nuts, cashew nuts & coconuts 24429 8 491 65 1.4 30 34486 3108711 Motorcycles, side-cars 151,445 46 16,793 173 1.2 3.3 1,429,571 27 134,65208714 Parts and accessories of motorcycles & cycles 130,889 16 306 26 0 0.9 694,480 7 130,583
Exporters
Motorcyle Import by Turkey Tariff
(estimated) applied by Turkey (%)
Imported value 2013 (US$
000)
Imported growth in value between 2009-2013 (%, p.a.)
Total 151,445 46China 74,622 54 3.3Thailand 18,729 160 3.3Japan 15,261 48 6.8Italy 11,218 42 0France 7,418 157 0Germany 5,695 25 0USA 5,086 16 6.8Taipei, Chinese 4,567 60 6.8India 3,992 65 3.3Austria 2,070 32 0United Kingdom 1,438 104 0Korea, Republic of 1,117 145 5.9
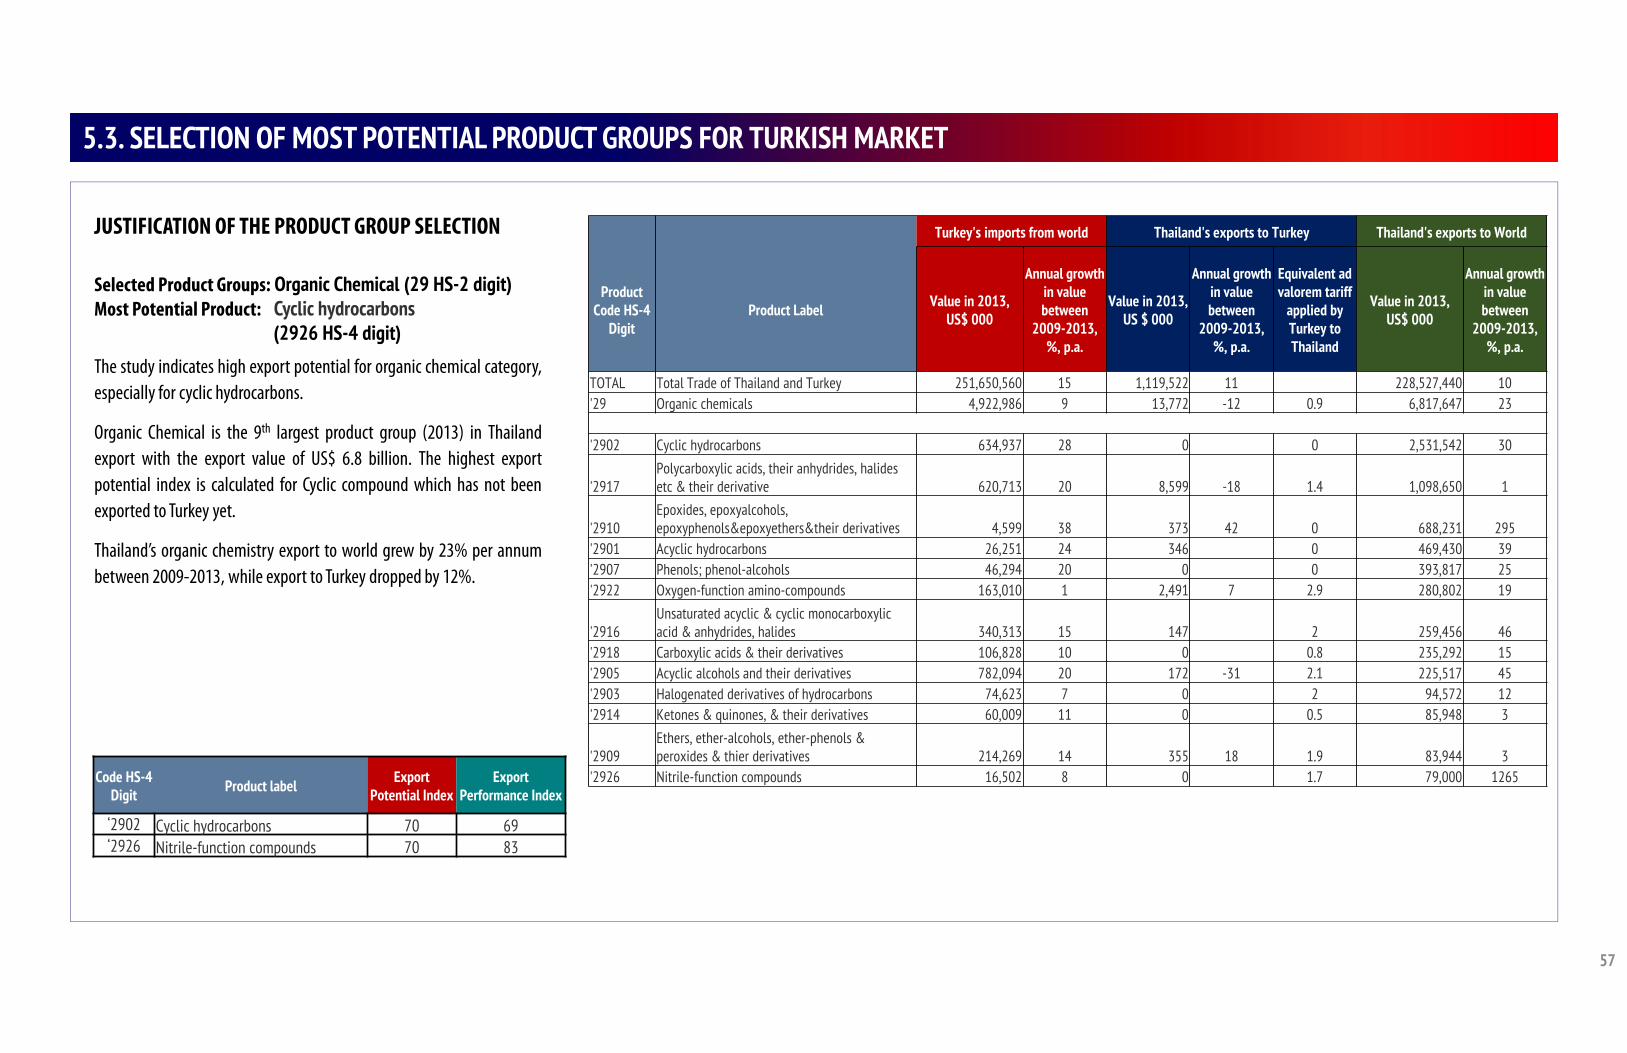
57
5.3. SELECTION OF MOST POTENTIAL PRODUCT GROUPS FOR TURKISH MARKET
JUSTIFICATION OF THE PRODUCT GROUP SELECTION
Selected Product Groups: Organic Chemical (29 HS-2 digit) Most Potential Product: Cyclic hydrocarbons
(2926 HS-4 digit)
The study indicates high export potential for organic chemical category,especially for cyclic hydrocarbons.
Organic Chemical is the 9th largest product group (2013) in Thailandexport with the export value of US$ 6.8 billion. The highest exportpotential index is calculated for Cyclic compound which has not beenexported to Turkey yet.
Thailand’s organic chemistry export to world grew by 23% per annumbetween 2009-2013, while export to Turkey dropped by 12%.
Code HS-4 Digit Product label Export
Potential IndexExport
Performance Index
‘2902 Cyclic hydrocarbons 70 69‘2926 Nitrile-function compounds 70 83
Turkey's imports from world Thailand's exports to Turkey Thailand's exports to World
Product Code HS-4
DigitProduct Label Value in 2013,
US$ 000
Annual growth in value between
2009-2013, %, p.a.
Value in 2013, US $ 000
Annual growth in value between
2009-2013, %, p.a.
Equivalent ad valorem tariff
applied by Turkey to Thailand
Value in 2013, US$ 000
Annual growth in value between
2009-2013, %, p.a.
TOTAL Total Trade of Thailand and Turkey 251,650,560 15 1,119,522 11 228,527,440 10'29 Organic chemicals 4,922,986 9 13,772 -12 0.9 6,817,647 23
'2902 Cyclic hydrocarbons 634,937 28 0 0 2,531,542 30
'2917Polycarboxylic acids, their anhydrides, halides etc & their derivative 620,713 20 8,599 -18 1.4 1,098,650 1
'2910Epoxides, epoxyalcohols, epoxyphenols&epoxyethers&their derivatives 4,599 38 373 42 0 688,231 295
'2901 Acyclic hydrocarbons 26,251 24 346 0 469,430 39'2907 Phenols; phenol-alcohols 46,294 20 0 0 393,817 25'2922 Oxygen-function amino-compounds 163,010 1 2,491 7 2.9 280,802 19
'2916Unsaturated acyclic & cyclic monocarboxylic acid & anhydrides, halides 340,313 15 147 2 259,456 46
'2918 Carboxylic acids & their derivatives 106,828 10 0 0.8 235,292 15'2905 Acyclic alcohols and their derivatives 782,094 20 172 -31 2.1 225,517 45'2903 Halogenated derivatives of hydrocarbons 74,623 7 0 2 94,572 12'2914 Ketones & quinones, & their derivatives 60,009 11 0 0.5 85,948 3
'2909Ethers, ether-alcohols, ether-phenols & peroxides & thier derivatives 214,269 14 355 18 1.9 83,944 3
'2926 Nitrile-function compounds 16,502 8 0 1.7 79,000 1265
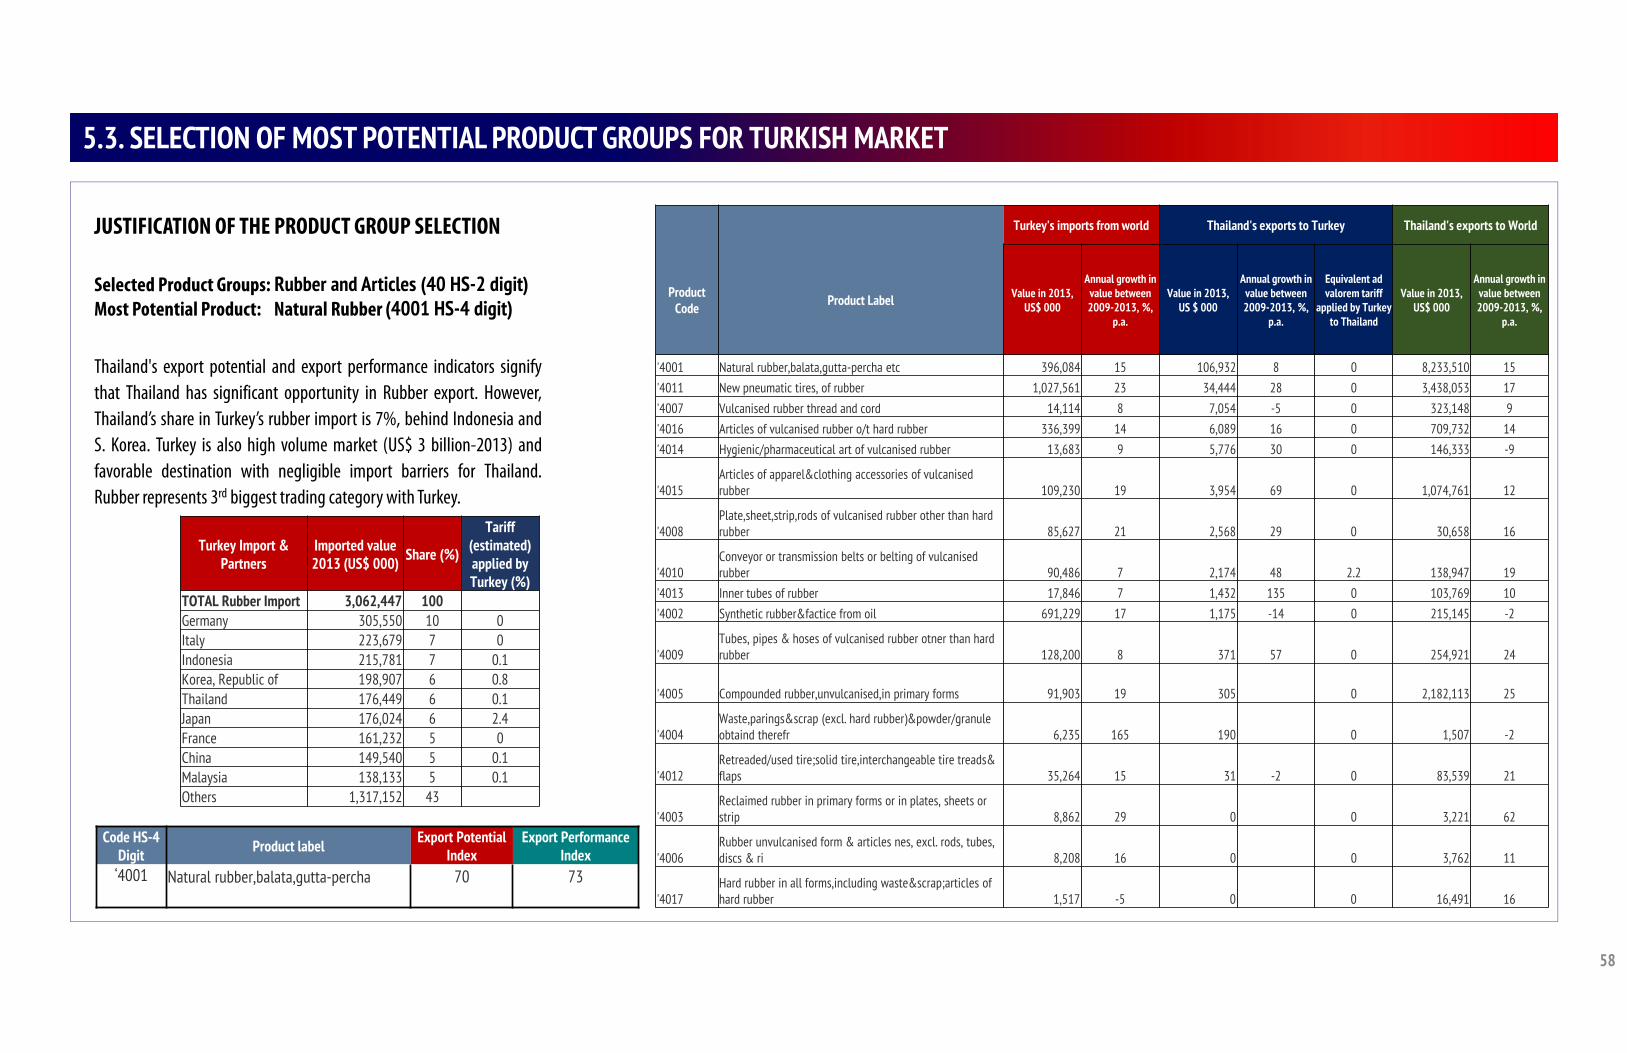
58
5.3. SELECTION OF MOST POTENTIAL PRODUCT GROUPS FOR TURKISH MARKET
JUSTIFICATION OF THE PRODUCT GROUP SELECTION
Selected Product Groups: Rubber and Articles (40 HS-2 digit) Most Potential Product: Natural Rubber (4001 HS-4 digit)
Thailand's export potential and export performance indicators signifythat Thailand has significant opportunity in Rubber export. However,Thailand’s share in Turkey’s rubber import is 7%, behind Indonesia andS. Korea. Turkey is also high volume market (US$ 3 billion-2013) andfavorable destination with negligible import barriers for Thailand.Rubber represents 3rd biggest trading category with Turkey.
Code HS-4 Digit Product label Export Potential
IndexExport Performance
Index‘4001 Natural rubber,balata,gutta-percha 70 73
Turkey's imports from world Thailand's exports to Turkey Thailand's exports to World
Product Code Product Label Value in 2013,
US$ 000
Annual growth in value between 2009-2013, %,
p.a.
Value in 2013, US $ 000
Annual growth in value between 2009-2013, %,
p.a.
Equivalent ad valorem tariff
applied by Turkey to Thailand
Value in 2013, US$ 000
Annual growth in value between 2009-2013, %,
p.a.
'4001 Natural rubber,balata,gutta-percha etc 396,084 15 106,932 8 0 8,233,510 15'4011 New pneumatic tires, of rubber 1,027,561 23 34,444 28 0 3,438,053 17'4007 Vulcanised rubber thread and cord 14,114 8 7,054 -5 0 323,148 9'4016 Articles of vulcanised rubber o/t hard rubber 336,399 14 6,089 16 0 709,732 14'4014 Hygienic/pharmaceutical art of vulcanised rubber 13,683 9 5,776 30 0 146,333 -9
'4015Articles of apparel&clothing accessories of vulcanised rubber 109,230 19 3,954 69 0 1,074,761 12
'4008Plate,sheet,strip,rods of vulcanised rubber other than hard rubber 85,627 21 2,568 29 0 30,658 16
'4010Conveyor or transmission belts or belting of vulcanised rubber 90,486 7 2,174 48 2.2 138,947 19
'4013 Inner tubes of rubber 17,846 7 1,432 135 0 103,769 10'4002 Synthetic rubber&factice from oil 691,229 17 1,175 -14 0 215,145 -2
'4009Tubes, pipes & hoses of vulcanised rubber otner than hard rubber 128,200 8 371 57 0 254,921 24
'4005 Compounded rubber,unvulcanised,in primary forms 91,903 19 305 0 2,182,113 25
'4004Waste,parings&scrap (excl. hard rubber)&powder/granule obtaind therefr 6,235 165 190 0 1,507 -2
'4012Retreaded/used tire;solid tire,interchangeable tire treads& flaps 35,264 15 31 -2 0 83,539 21
'4003Reclaimed rubber in primary forms or in plates, sheets or strip 8,862 29 0 0 3,221 62
'4006Rubber unvulcanised form & articles nes, excl. rods, tubes, discs & ri 8,208 16 0 0 3,762 11
'4017Hard rubber in all forms,including waste&scrap;articles of hard rubber 1,517 -5 0 0 16,491 16
Turkey Import & Partners
Imported value 2013 (US$ 000) Share (%)
Tariff (estimated) applied by Turkey (%)
TOTAL Rubber Import 3,062,447 100Germany 305,550 10 0Italy 223,679 7 0Indonesia 215,781 7 0.1Korea, Republic of 198,907 6 0.8Thailand 176,449 6 0.1Japan 176,024 6 2.4France 161,232 5 0China 149,540 5 0.1Malaysia 138,133 5 0.1Others 1,317,152 43
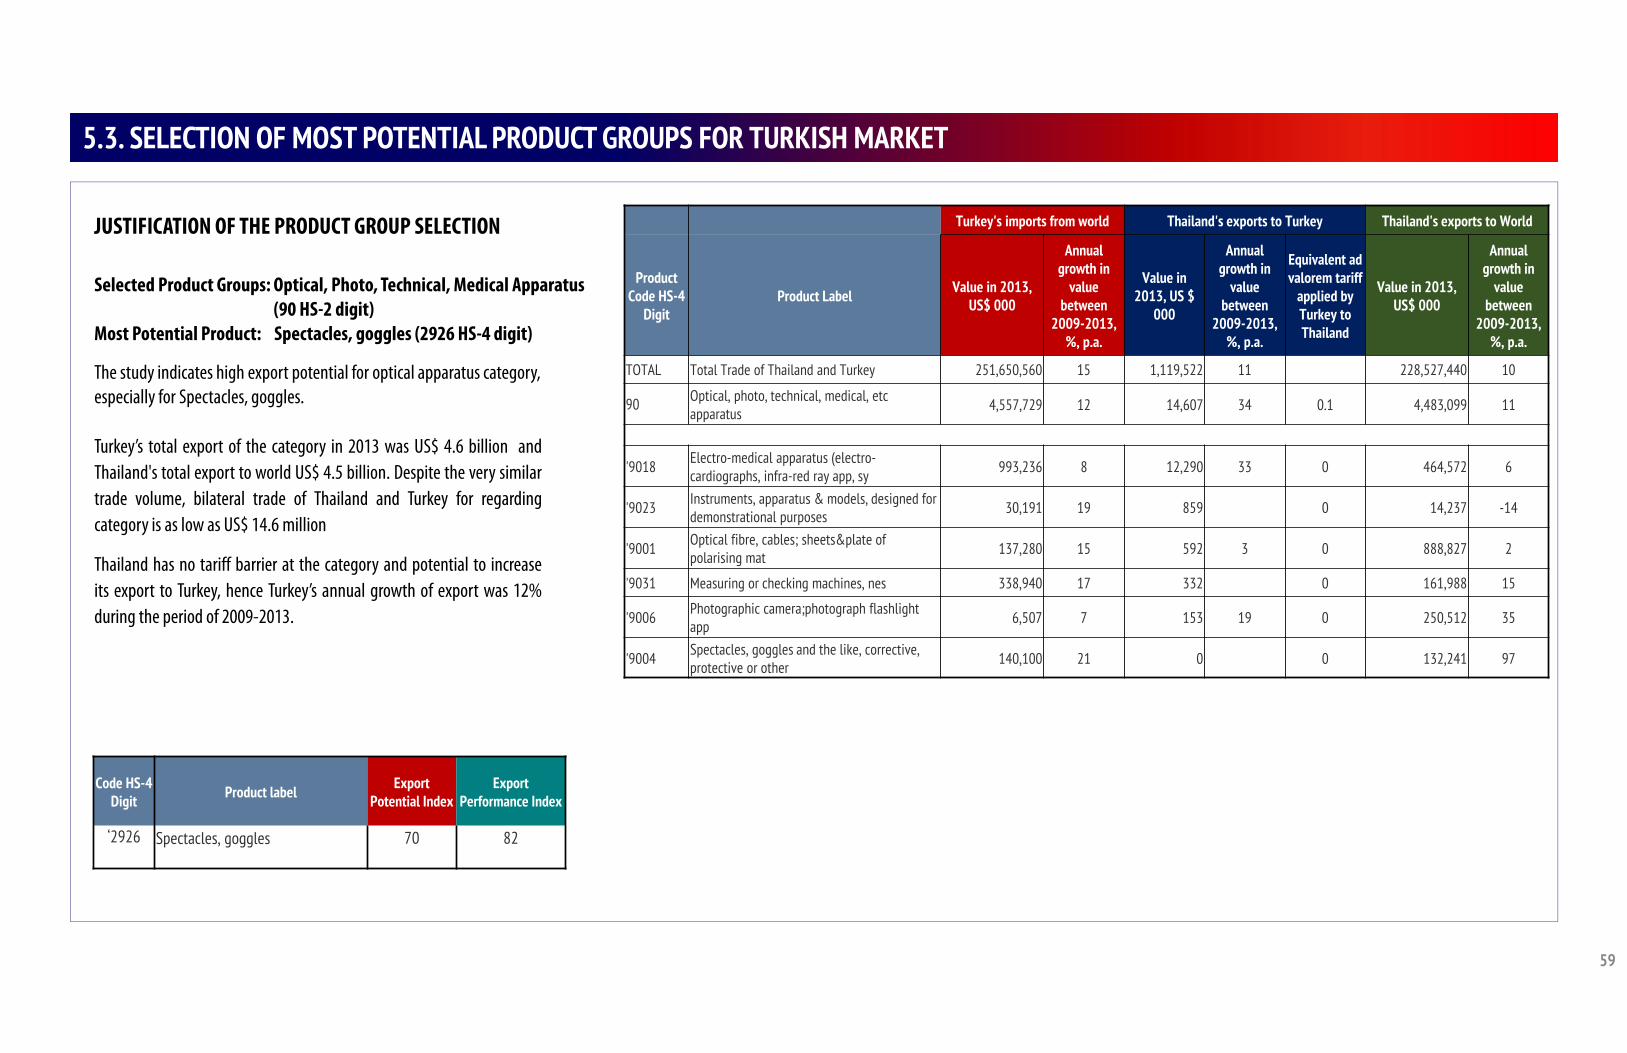
59
5.3. SELECTION OF MOST POTENTIAL PRODUCT GROUPS FOR TURKISH MARKET
JUSTIFICATION OF THE PRODUCT GROUP SELECTION
Selected Product Groups: Optical, Photo, Technical, Medical Apparatus (90 HS-2 digit)
Most Potential Product: Spectacles, goggles (2926 HS-4 digit)
The study indicates high export potential for optical apparatus category, especially for Spectacles, goggles.
Turkey’s total export of the category in 2013 was US$ 4.6 billion andThailand's total export to world US$ 4.5 billion. Despite the very similartrade volume, bilateral trade of Thailand and Turkey for regardingcategory is as low as US$ 14.6 million
Thailand has no tariff barrier at the category and potential to increaseits export to Turkey, hence Turkey’s annual growth of export was 12%during the period of 2009-2013.
Code HS-4 Digit Product label Export
Potential IndexExport
Performance Index
‘2926 Spectacles, goggles 70 82
Turkey's imports from world Thailand's exports to Turkey Thailand's exports to World
Product Code HS-4
DigitProduct Label Value in 2013,
US$ 000
Annual growth in
value between
2009-2013, %, p.a.
Value in 2013, US $
000
Annual growth in
value between
2009-2013, %, p.a.
Equivalent ad valorem tariff
applied by Turkey to Thailand
Value in 2013, US$ 000
Annual growth in
value between
2009-2013, %, p.a.
TOTAL Total Trade of Thailand and Turkey 251,650,560 15 1,119,522 11 228,527,440 10
90 Optical, photo, technical, medical, etc apparatus 4,557,729 12 14,607 34 0.1 4,483,099 11
'9018 Electro-medical apparatus (electro-cardiographs, infra-red ray app, sy 993,236 8 12,290 33 0 464,572 6
'9023 Instruments, apparatus & models, designed for demonstrational purposes 30,191 19 859 0 14,237 -14
'9001 Optical fibre, cables; sheets&plate of polarising mat 137,280 15 592 3 0 888,827 2
'9031 Measuring or checking machines, nes 338,940 17 332 0 161,988 15
'9006 Photographic camera;photograph flashlight app 6,507 7 153 19 0 250,512 35
'9004 Spectacles, goggles and the like, corrective, protective or other 140,100 21 0 0 132,241 97
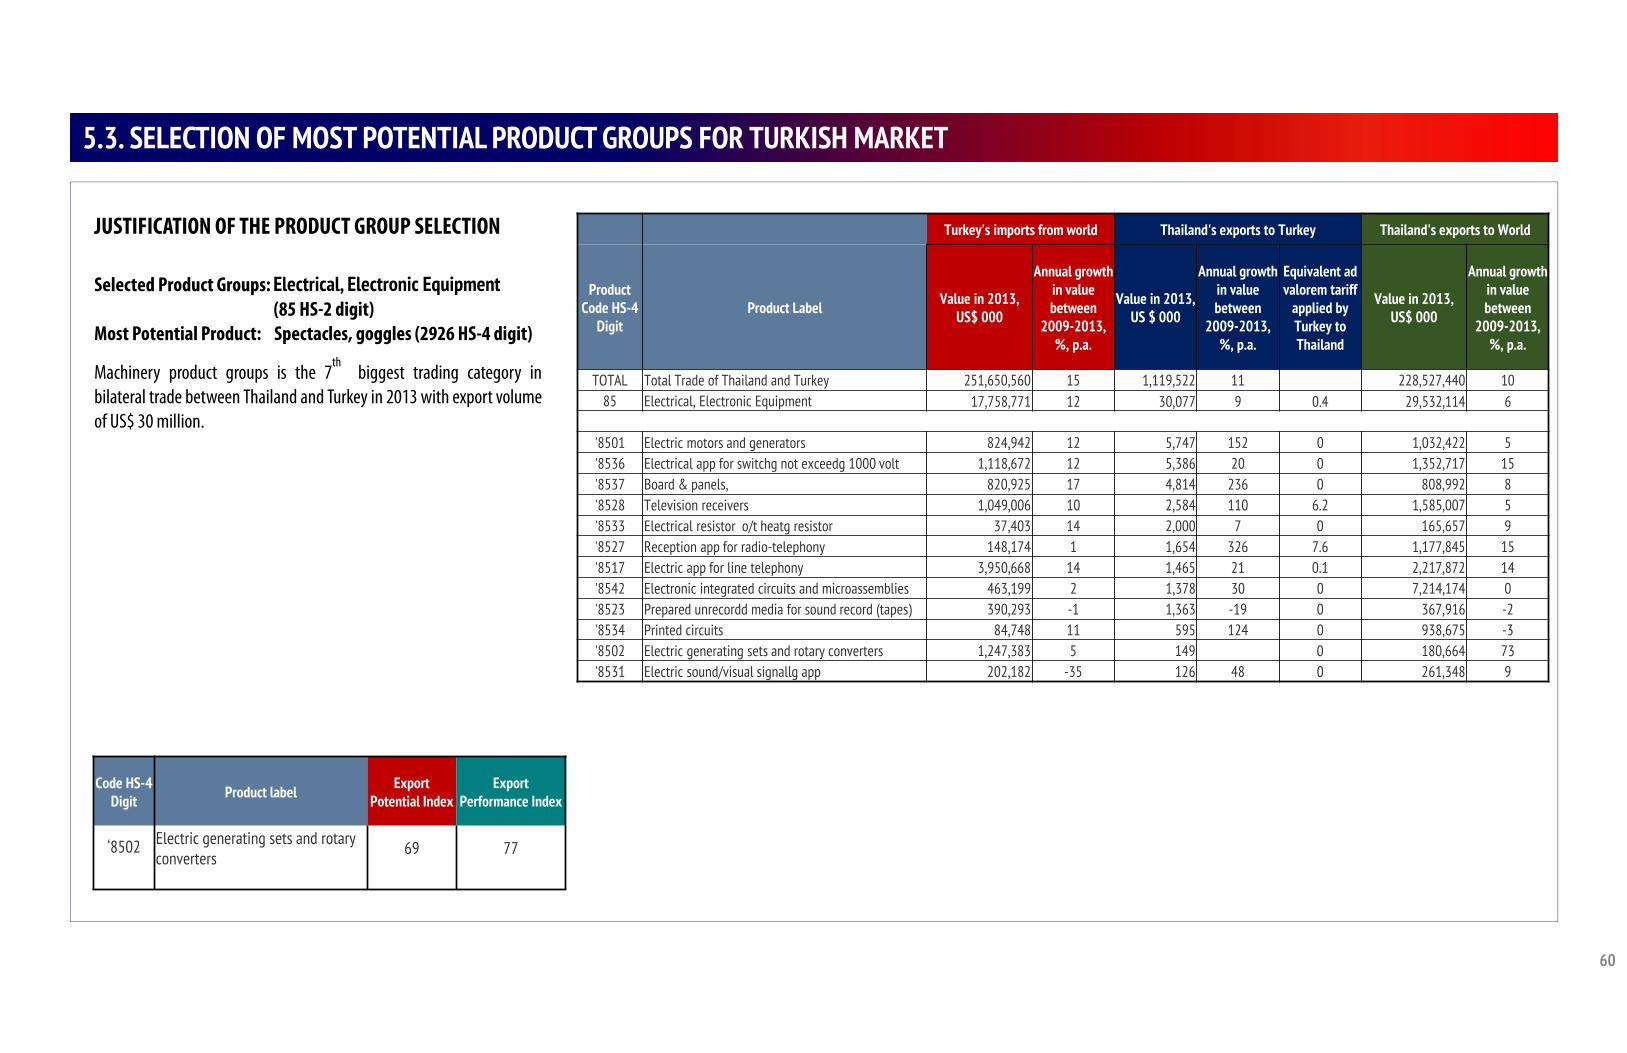
60
5.3. SELECTION OF MOST POTENTIAL PRODUCT GROUPS FOR TURKISH MARKET
JUSTIFICATION OF THE PRODUCT GROUP SELECTION
Selected Product Groups: Electrical, Electronic Equipment(85 HS-2 digit)
Most Potential Product: Spectacles, goggles (2926 HS-4 digit)
Machinery product groups is the 7th
biggest trading category inbilateral trade between Thailand and Turkey in 2013 with export volumeof US$ 30 million.
Code HS-4 Digit Product label Export
Potential IndexExport
Performance Index
‘8502 Electric generating sets and rotary converters 69 77
Turkey's imports from world Thailand's exports to Turkey Thailand's exports to World
Product Code HS-4
DigitProduct Label Value in 2013,
US$ 000
Annual growth in value between
2009-2013, %, p.a.
Value in 2013, US $ 000
Annual growth in value between
2009-2013, %, p.a.
Equivalent ad valorem tariff
applied by Turkey to Thailand
Value in 2013, US$ 000
Annual growth in value between
2009-2013, %, p.a.
TOTAL Total Trade of Thailand and Turkey 251,650,560 15 1,119,522 11 228,527,440 1085 Electrical, Electronic Equipment 17,758,771 12 30,077 9 0.4 29,532,114 6
'8501 Electric motors and generators 824,942 12 5,747 152 0 1,032,422 5'8536 Electrical app for switchg not exceedg 1000 volt 1,118,672 12 5,386 20 0 1,352,717 15'8537 Board & panels, 820,925 17 4,814 236 0 808,992 8'8528 Television receivers 1,049,006 10 2,584 110 6.2 1,585,007 5'8533 Electrical resistor o/t heatg resistor 37,403 14 2,000 7 0 165,657 9'8527 Reception app for radio-telephony 148,174 1 1,654 326 7.6 1,177,845 15'8517 Electric app for line telephony 3,950,668 14 1,465 21 0.1 2,217,872 14'8542 Electronic integrated circuits and microassemblies 463,199 2 1,378 30 0 7,214,174 0'8523 Prepared unrecordd media for sound record (tapes) 390,293 -1 1,363 -19 0 367,916 -2'8534 Printed circuits 84,748 11 595 124 0 938,675 -3'8502 Electric generating sets and rotary converters 1,247,383 5 149 0 180,664 73'8531 Electric sound/visual signallg app 202,182 -35 126 48 0 261,348 9
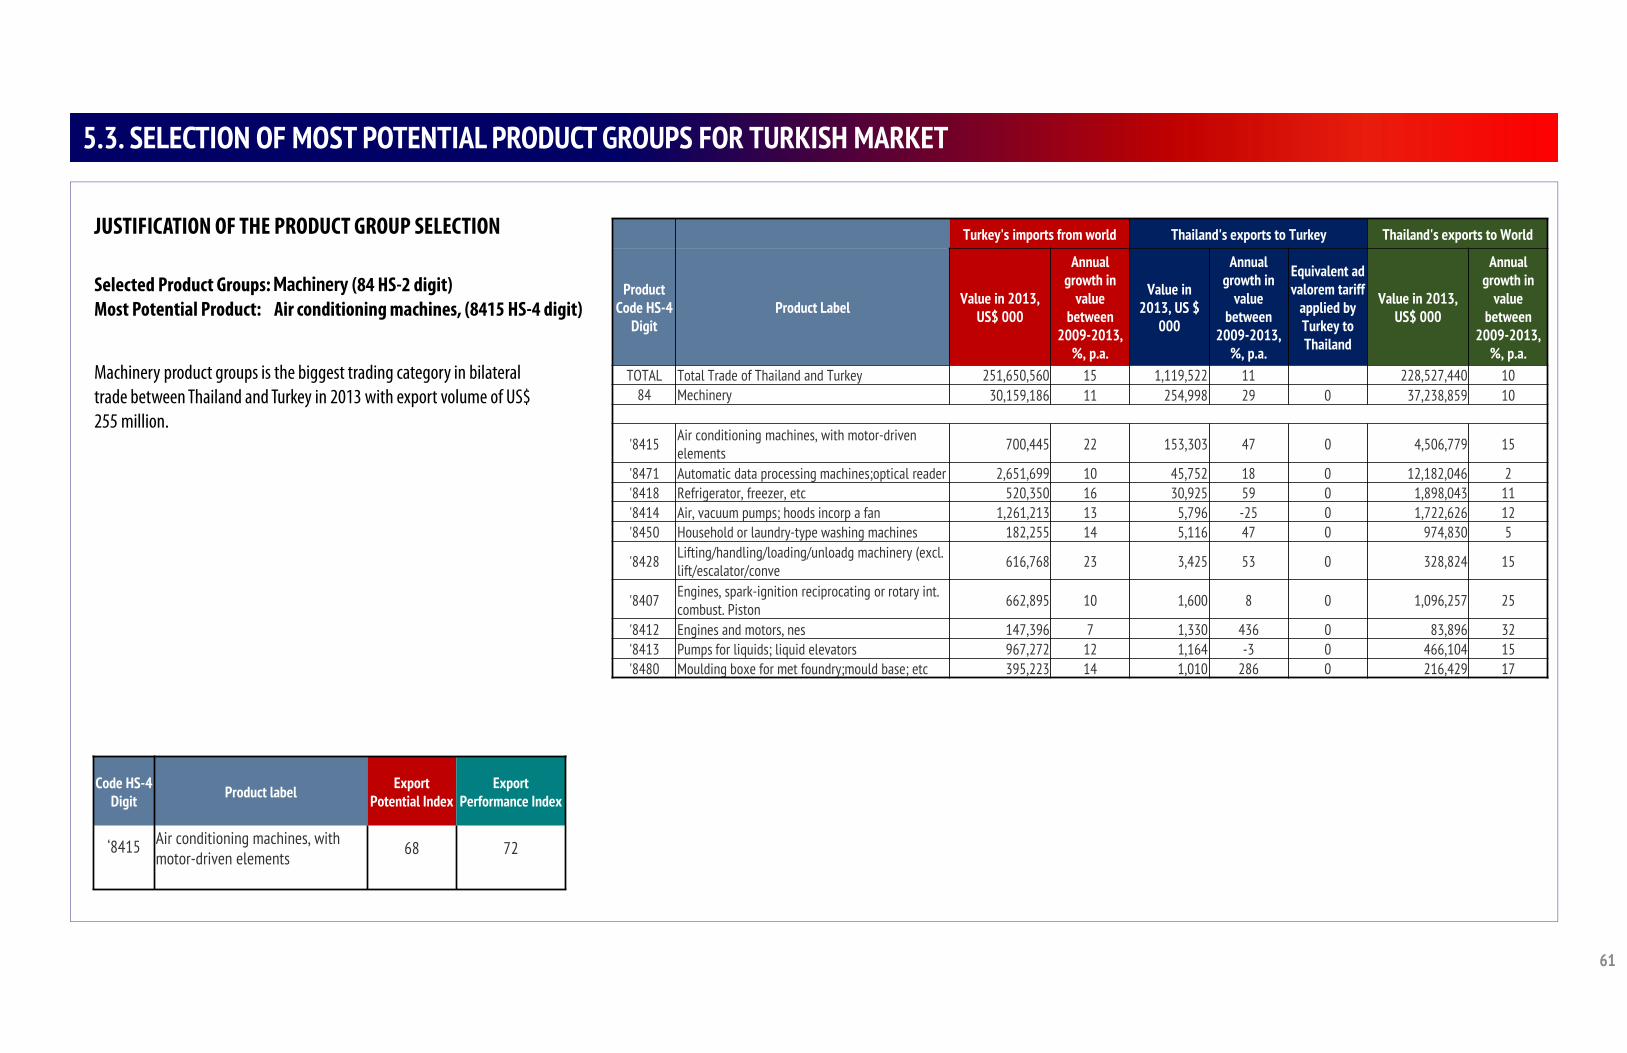
61
5.3. SELECTION OF MOST POTENTIAL PRODUCT GROUPS FOR TURKISH MARKET
JUSTIFICATION OF THE PRODUCT GROUP SELECTION
Selected Product Groups: Machinery (84 HS-2 digit) Most Potential Product: Air conditioning machines, (8415 HS-4 digit)
Machinery product groups is the biggest trading category in bilateral trade between Thailand and Turkey in 2013 with export volume of US$ 255 million.
Code HS-4 Digit Product label Export
Potential IndexExport
Performance Index
‘8415 Air conditioning machines, with motor-driven elements 68 72
Turkey's imports from world Thailand's exports to Turkey Thailand's exports to World
Product Code HS-4
DigitProduct Label Value in 2013,
US$ 000
Annual growth in
value between
2009-2013, %, p.a.
Value in 2013, US $
000
Annual growth in
value between
2009-2013, %, p.a.
Equivalent ad valorem tariff
applied by Turkey to Thailand
Value in 2013, US$ 000
Annual growth in
value between
2009-2013, %, p.a.
TOTAL Total Trade of Thailand and Turkey 251,650,560 15 1,119,522 11 228,527,440 1084 Mechinery 30,159,186 11 254,998 29 0 37,238,859 10
'8415 Air conditioning machines, with motor-driven elements 700,445 22 153,303 47 0 4,506,779 15
'8471 Automatic data processing machines;optical reader 2,651,699 10 45,752 18 0 12,182,046 2'8418 Refrigerator, freezer, etc 520,350 16 30,925 59 0 1,898,043 11'8414 Air, vacuum pumps; hoods incorp a fan 1,261,213 13 5,796 -25 0 1,722,626 12'8450 Household or laundry-type washing machines 182,255 14 5,116 47 0 974,830 5
'8428 Lifting/handling/loading/unloadg machinery (excl. lift/escalator/conve 616,768 23 3,425 53 0 328,824 15
'8407 Engines, spark-ignition reciprocating or rotary int. combust. Piston 662,895 10 1,600 8 0 1,096,257 25
'8412 Engines and motors, nes 147,396 7 1,330 436 0 83,896 32'8413 Pumps for liquids; liquid elevators 967,272 12 1,164 -3 0 466,104 15'8480 Moulding boxe for met foundry;mould base; etc 395,223 14 1,010 286 0 216,429 17
TRADE INDICATORS OF THE MOST POTENTIAL PRODUCT GROUPS
PART
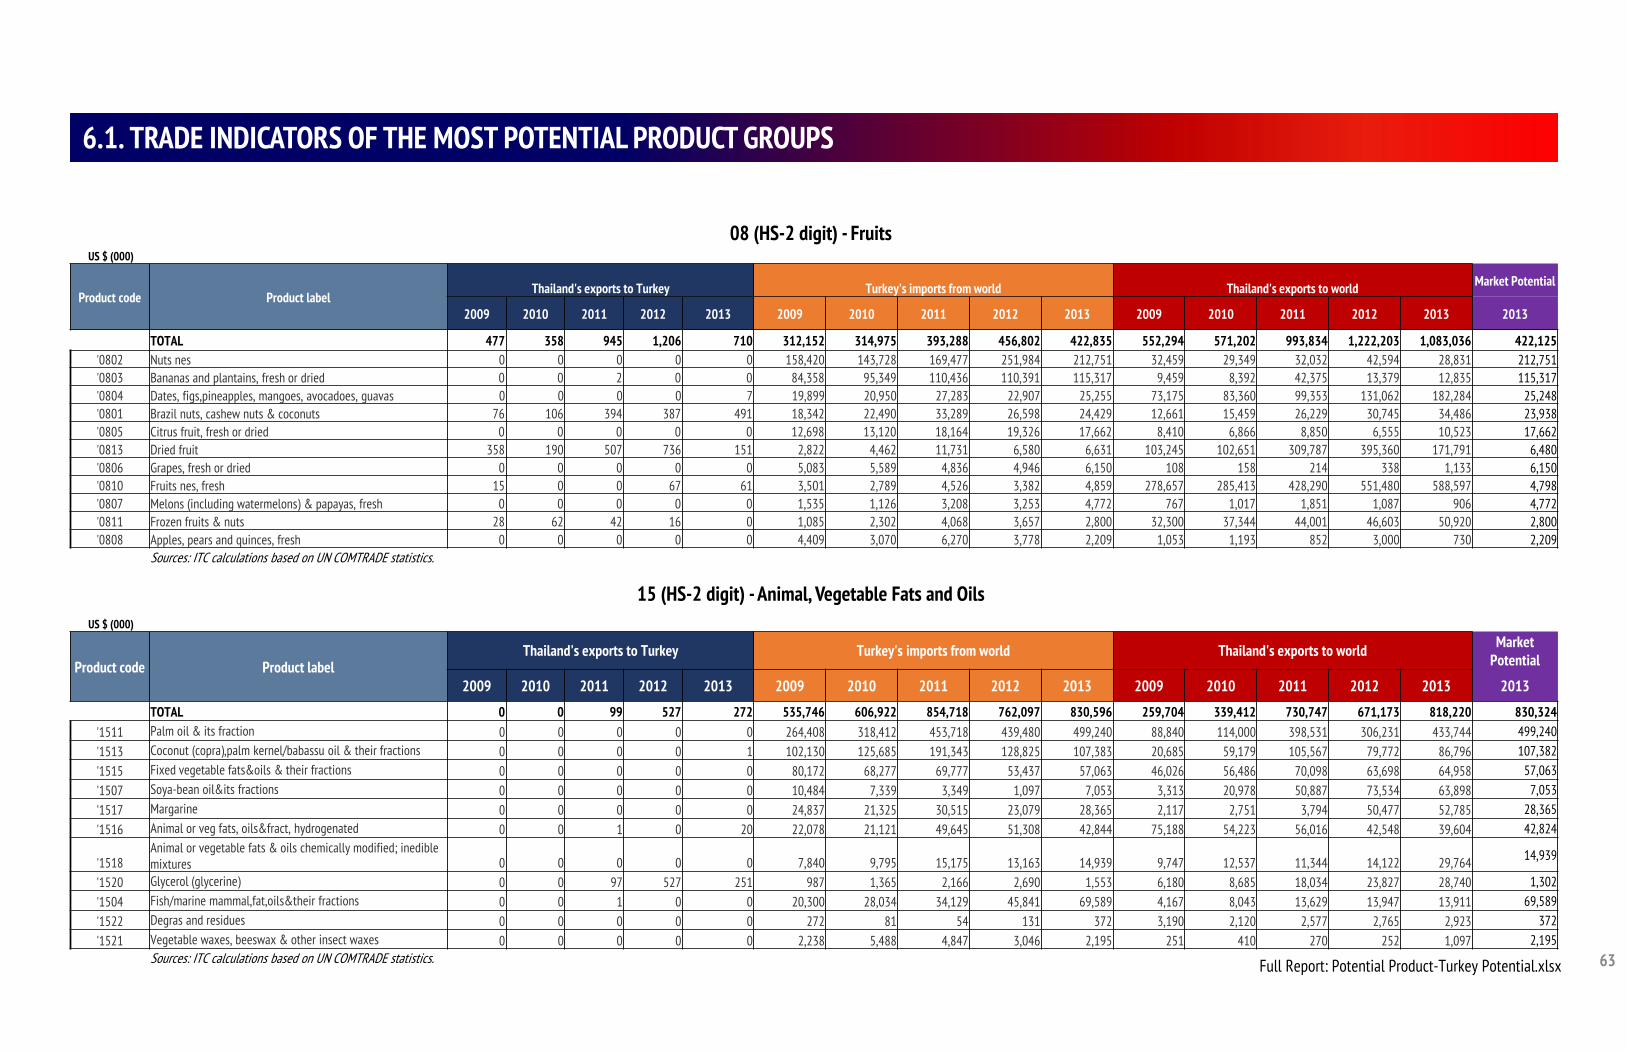
63
6.1. TRADE INDICATORS OF THE MOST POTENTIAL PRODUCT GROUPS
15 (HS-2 digit) - Animal, Vegetable Fats and OilsUS $ (000)
Product code Product labelThailand's exports to Turkey Turkey's imports from world Thailand's exports to world Market
Potential
2009 2010 2011 2012 2013 2009 2010 2011 2012 2013 2009 2010 2011 2012 2013 2013
TOTAL 0 0 99 527 272 535,746 606,922 854,718 762,097 830,596 259,704 339,412 730,747 671,173 818,220 830,324'1511 Palm oil & its fraction 0 0 0 0 0 264,408 318,412 453,718 439,480 499,240 88,840 114,000 398,531 306,231 433,744 499,240'1513 Coconut (copra),palm kernel/babassu oil & their fractions 0 0 0 0 1 102,130 125,685 191,343 128,825 107,383 20,685 59,179 105,567 79,772 86,796 107,382'1515 Fixed vegetable fats&oils & their fractions 0 0 0 0 0 80,172 68,277 69,777 53,437 57,063 46,026 56,486 70,098 63,698 64,958 57,063'1507 Soya-bean oil&its fractions 0 0 0 0 0 10,484 7,339 3,349 1,097 7,053 3,313 20,978 50,887 73,534 63,898 7,053'1517 Margarine 0 0 0 0 0 24,837 21,325 30,515 23,079 28,365 2,117 2,751 3,794 50,477 52,785 28,365'1516 Animal or veg fats, oils&fract, hydrogenated 0 0 1 0 20 22,078 21,121 49,645 51,308 42,844 75,188 54,223 56,016 42,548 39,604 42,824
'1518Animal or vegetable fats & oils chemically modified; inedible mixtures 0 0 0 0 0 7,840 9,795 15,175 13,163 14,939 9,747 12,537 11,344 14,122 29,764 14,939
'1520 Glycerol (glycerine) 0 0 97 527 251 987 1,365 2,166 2,690 1,553 6,180 8,685 18,034 23,827 28,740 1,302'1504 Fish/marine mammal,fat,oils&their fractions 0 0 1 0 0 20,300 28,034 34,129 45,841 69,589 4,167 8,043 13,629 13,947 13,911 69,589'1522 Degras and residues 0 0 0 0 0 272 81 54 131 372 3,190 2,120 2,577 2,765 2,923 372'1521 Vegetable waxes, beeswax & other insect waxes 0 0 0 0 0 2,238 5,488 4,847 3,046 2,195 251 410 270 252 1,097 2,195
Sources: ITC calculations based on UN COMTRADE statistics.
08 (HS-2 digit) - FruitsUS $ (000)
Product code Product labelThailand's exports to Turkey Turkey's imports from world Thailand's exports to world Market Potential
2009 2010 2011 2012 2013 2009 2010 2011 2012 2013 2009 2010 2011 2012 2013 2013
TOTAL 477 358 945 1,206 710 312,152 314,975 393,288 456,802 422,835 552,294 571,202 993,834 1,222,203 1,083,036 422,125'0802 Nuts nes 0 0 0 0 0 158,420 143,728 169,477 251,984 212,751 32,459 29,349 32,032 42,594 28,831 212,751'0803 Bananas and plantains, fresh or dried 0 0 2 0 0 84,358 95,349 110,436 110,391 115,317 9,459 8,392 42,375 13,379 12,835 115,317'0804 Dates, figs,pineapples, mangoes, avocadoes, guavas 0 0 0 0 7 19,899 20,950 27,283 22,907 25,255 73,175 83,360 99,353 131,062 182,284 25,248'0801 Brazil nuts, cashew nuts & coconuts 76 106 394 387 491 18,342 22,490 33,289 26,598 24,429 12,661 15,459 26,229 30,745 34,486 23,938'0805 Citrus fruit, fresh or dried 0 0 0 0 0 12,698 13,120 18,164 19,326 17,662 8,410 6,866 8,850 6,555 10,523 17,662'0813 Dried fruit 358 190 507 736 151 2,822 4,462 11,731 6,580 6,631 103,245 102,651 309,787 395,360 171,791 6,480'0806 Grapes, fresh or dried 0 0 0 0 0 5,083 5,589 4,836 4,946 6,150 108 158 214 338 1,133 6,150'0810 Fruits nes, fresh 15 0 0 67 61 3,501 2,789 4,526 3,382 4,859 278,657 285,413 428,290 551,480 588,597 4,798'0807 Melons (including watermelons) & papayas, fresh 0 0 0 0 0 1,535 1,126 3,208 3,253 4,772 767 1,017 1,851 1,087 906 4,772'0811 Frozen fruits & nuts 28 62 42 16 0 1,085 2,302 4,068 3,657 2,800 32,300 37,344 44,001 46,603 50,920 2,800'0808 Apples, pears and quinces, fresh 0 0 0 0 0 4,409 3,070 6,270 3,778 2,209 1,053 1,193 852 3,000 730 2,209
Sources: ITC calculations based on UN COMTRADE statistics.
Full Report: Potential Product-Turkey Potential.xlsx
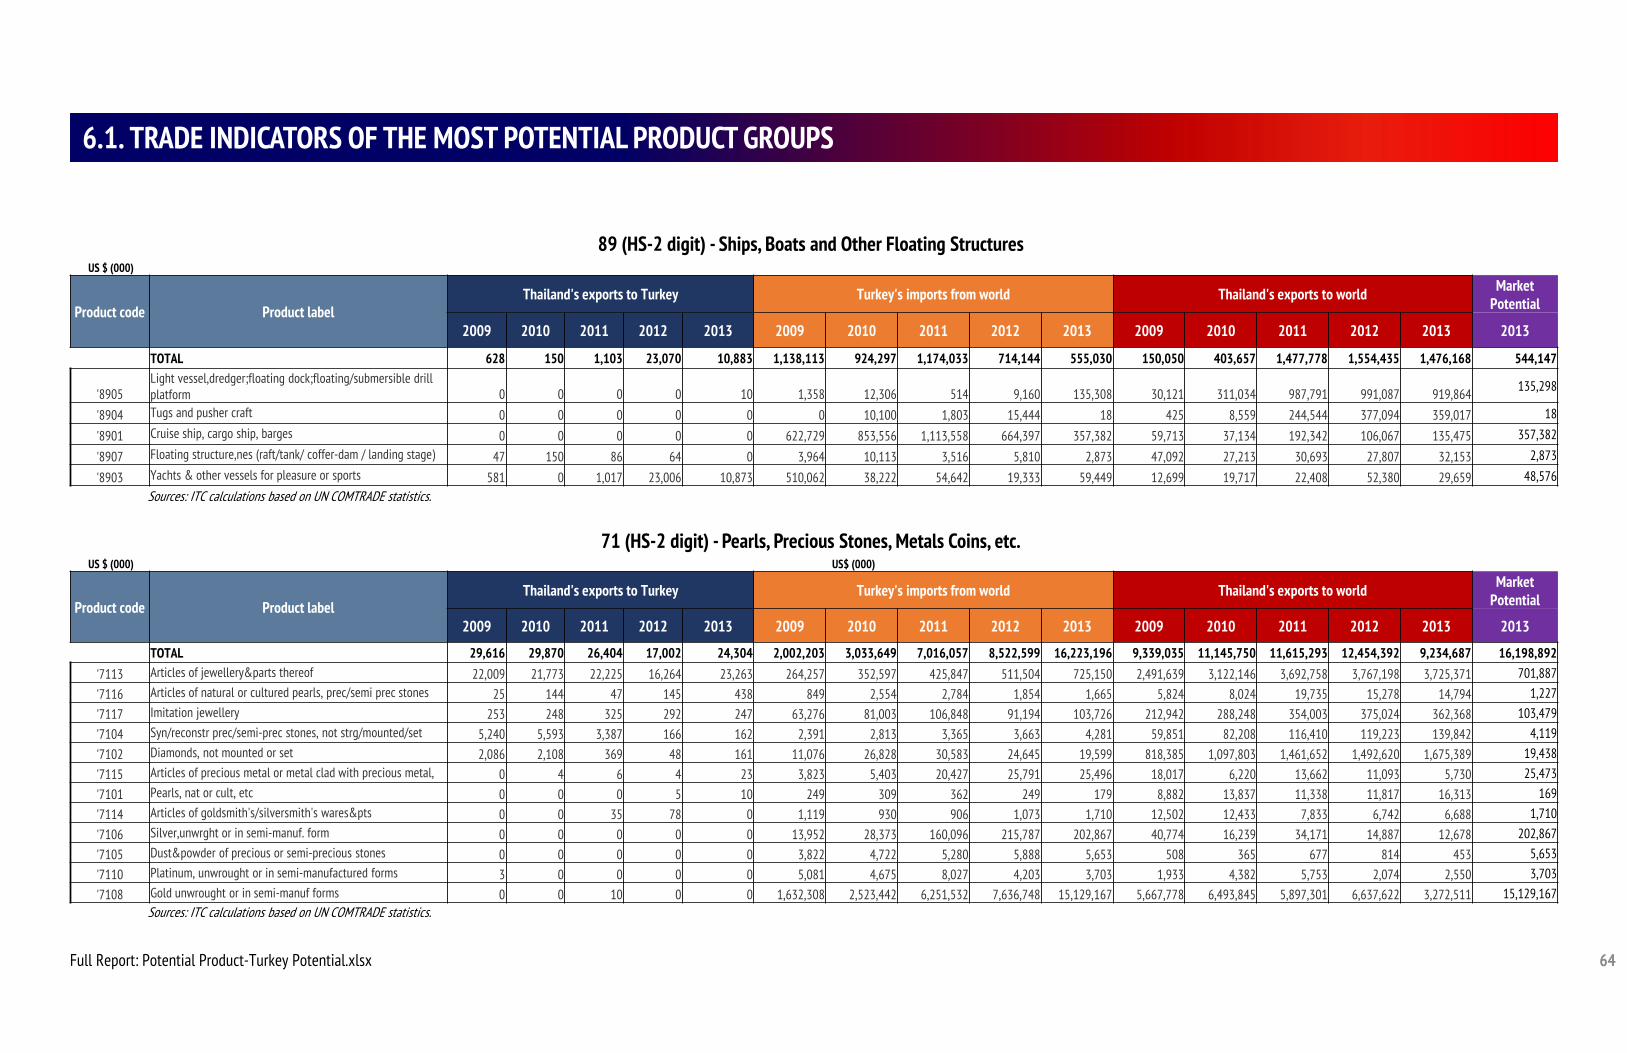
64
6.1. TRADE INDICATORS OF THE MOST POTENTIAL PRODUCT GROUPS
89 (HS-2 digit) - Ships, Boats and Other Floating StructuresUS $ (000)
Product code Product labelThailand's exports to Turkey Turkey's imports from world Thailand's exports to world Market
Potential
2009 2010 2011 2012 2013 2009 2010 2011 2012 2013 2009 2010 2011 2012 2013 2013
TOTAL 628 150 1,103 23,070 10,883 1,138,113 924,297 1,174,033 714,144 555,030 150,050 403,657 1,477,778 1,554,435 1,476,168 544,147
'8905Light vessel,dredger;floating dock;floating/submersible drill platform 0 0 0 0 10 1,358 12,306 514 9,160 135,308 30,121 311,034 987,791 991,087 919,864 135,298
'8904 Tugs and pusher craft 0 0 0 0 0 0 10,100 1,803 15,444 18 425 8,559 244,544 377,094 359,017 18
'8901 Cruise ship, cargo ship, barges 0 0 0 0 0 622,729 853,556 1,113,558 664,397 357,382 59,713 37,134 192,342 106,067 135,475 357,382
'8907 Floating structure,nes (raft/tank/ coffer-dam / landing stage) 47 150 86 64 0 3,964 10,113 3,516 5,810 2,873 47,092 27,213 30,693 27,807 32,153 2,873
'8903 Yachts & other vessels for pleasure or sports 581 0 1,017 23,006 10,873 510,062 38,222 54,642 19,333 59,449 12,699 19,717 22,408 52,380 29,659 48,576
71 (HS-2 digit) - Pearls, Precious Stones, Metals Coins, etc.US $ (000) US$ (000)
Product code Product labelThailand's exports to Turkey Turkey's imports from world Thailand's exports to world Market
Potential
2009 2010 2011 2012 2013 2009 2010 2011 2012 2013 2009 2010 2011 2012 2013 2013
TOTAL 29,616 29,870 26,404 17,002 24,304 2,002,203 3,033,649 7,016,057 8,522,599 16,223,196 9,339,035 11,145,750 11,615,293 12,454,392 9,234,687 16,198,892'7113 Articles of jewellery&parts thereof 22,009 21,773 22,225 16,264 23,263 264,257 352,597 425,847 511,504 725,150 2,491,639 3,122,146 3,692,758 3,767,198 3,725,371 701,887'7116 Articles of natural or cultured pearls, prec/semi prec stones 25 144 47 145 438 849 2,554 2,784 1,854 1,665 5,824 8,024 19,735 15,278 14,794 1,227'7117 Imitation jewellery 253 248 325 292 247 63,276 81,003 106,848 91,194 103,726 212,942 288,248 354,003 375,024 362,368 103,479'7104 Syn/reconstr prec/semi-prec stones, not strg/mounted/set 5,240 5,593 3,387 166 162 2,391 2,813 3,365 3,663 4,281 59,851 82,208 116,410 119,223 139,842 4,119
'7102 Diamonds, not mounted or set 2,086 2,108 369 48 161 11,076 26,828 30,583 24,645 19,599 818,385 1,097,803 1,461,652 1,492,620 1,675,389 19,438'7115 Articles of precious metal or metal clad with precious metal, 0 4 6 4 23 3,823 5,403 20,427 25,791 25,496 18,017 6,220 13,662 11,093 5,730 25,473'7101 Pearls, nat or cult, etc 0 0 0 5 10 249 309 362 249 179 8,882 13,837 11,338 11,817 16,313 169'7114 Articles of goldsmith's/silversmith's wares&pts 0 0 35 78 0 1,119 930 906 1,073 1,710 12,502 12,433 7,833 6,742 6,688 1,710
'7106 Silver,unwrght or in semi-manuf. form 0 0 0 0 0 13,952 28,373 160,096 215,787 202,867 40,774 16,239 34,171 14,887 12,678 202,867'7105 Dust&powder of precious or semi-precious stones 0 0 0 0 0 3,822 4,722 5,280 5,888 5,653 508 365 677 814 453 5,653'7110 Platinum, unwrought or in semi-manufactured forms 3 0 0 0 0 5,081 4,675 8,027 4,203 3,703 1,933 4,382 5,753 2,074 2,550 3,703'7108 Gold unwrought or in semi-manuf forms 0 0 10 0 0 1,632,308 2,523,442 6,251,532 7,636,748 15,129,167 5,667,778 6,493,845 5,897,301 6,637,622 3,272,511 15,129,167
Sources: ITC calculations based on UN COMTRADE statistics.
Sources: ITC calculations based on UN COMTRADE statistics.
Full Report: Potential Product-Turkey Potential.xlsx
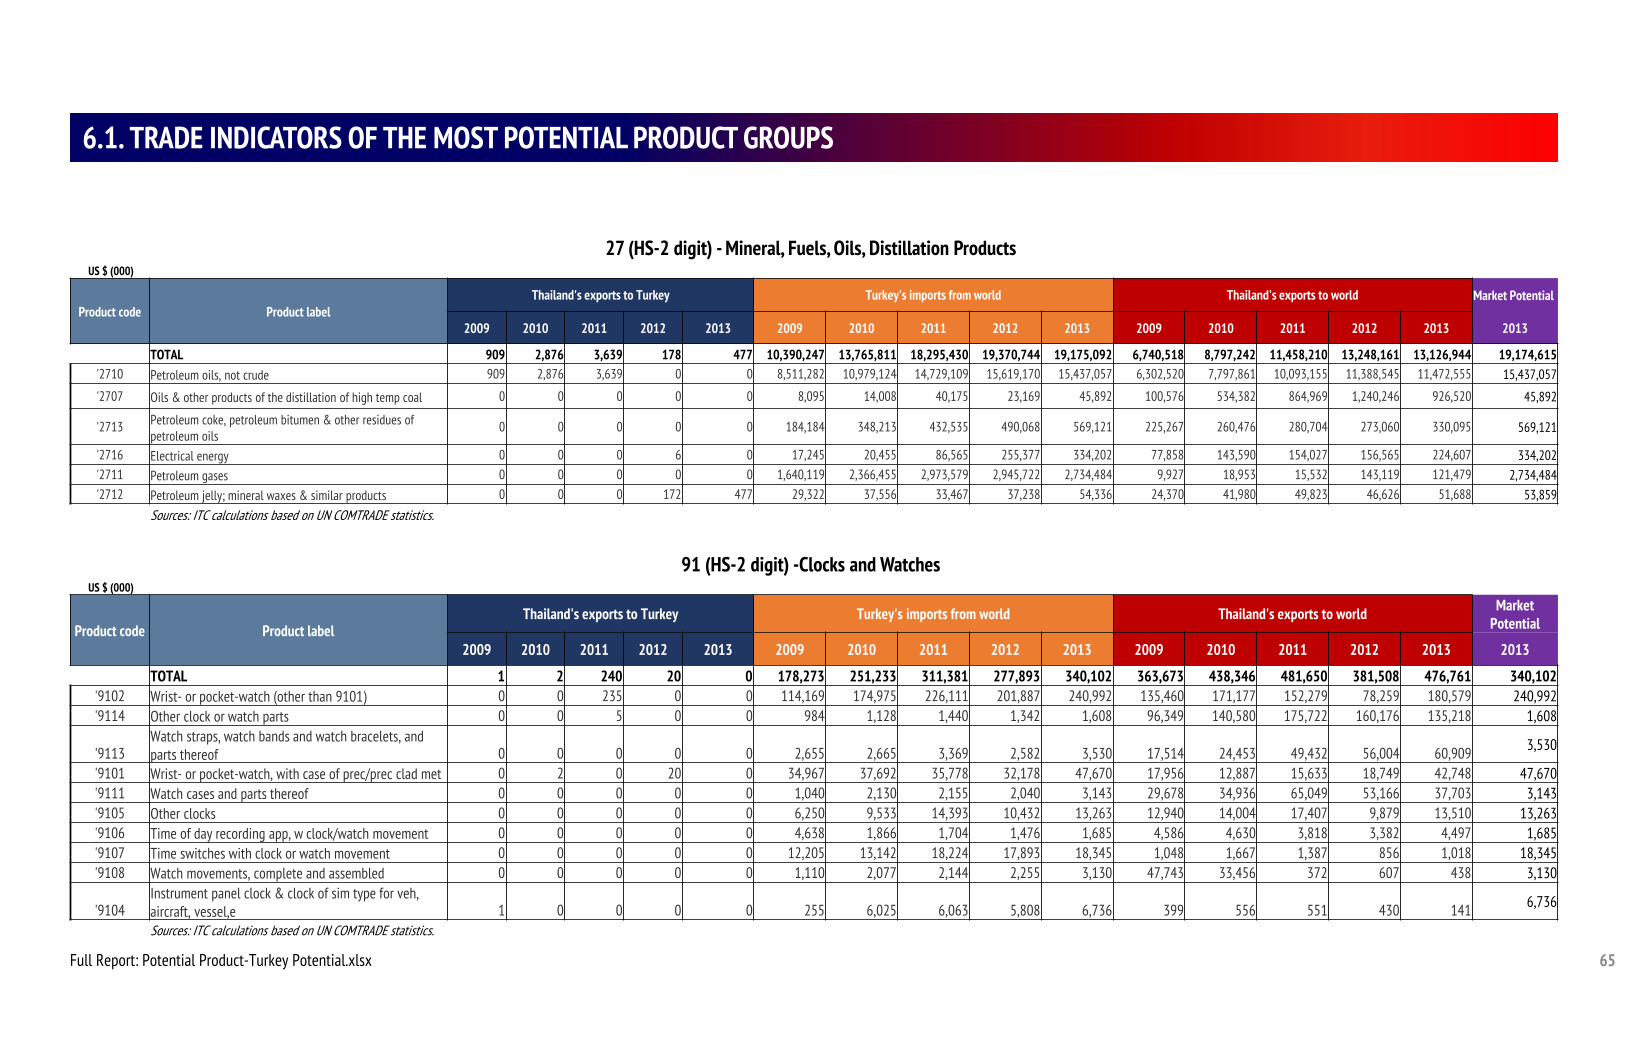
65
6.1. TRADE INDICATORS OF THE MOST POTENTIAL PRODUCT GROUPS
27 (HS-2 digit) - Mineral, Fuels, Oils, Distillation ProductsUS $ (000)
Product code Product labelThailand's exports to Turkey Turkey's imports from world Thailand's exports to world Market Potential
2009 2010 2011 2012 2013 2009 2010 2011 2012 2013 2009 2010 2011 2012 2013 2013
TOTAL 909 2,876 3,639 178 477 10,390,247 13,765,811 18,295,430 19,370,744 19,175,092 6,740,518 8,797,242 11,458,210 13,248,161 13,126,944 19,174,615'2710 Petroleum oils, not crude 909 2,876 3,639 0 0 8,511,282 10,979,124 14,729,109 15,619,170 15,437,057 6,302,520 7,797,861 10,093,155 11,388,545 11,472,555 15,437,057
'2707 Oils & other products of the distillation of high temp coal 0 0 0 0 0 8,095 14,008 40,175 23,169 45,892 100,576 534,382 864,969 1,240,246 926,520 45,892
'2713 Petroleum coke, petroleum bitumen & other residues of petroleum oils
0 0 0 0 0 184,184 348,213 432,535 490,068 569,121 225,267 260,476 280,704 273,060 330,095 569,121
'2716 Electrical energy 0 0 0 6 0 17,245 20,455 86,565 255,377 334,202 77,858 143,590 154,027 156,565 224,607 334,202'2711 Petroleum gases 0 0 0 0 0 1,640,119 2,366,455 2,973,579 2,945,722 2,734,484 9,927 18,953 15,532 143,119 121,479 2,734,484'2712 Petroleum jelly; mineral waxes & similar products 0 0 0 172 477 29,322 37,556 33,467 37,238 54,336 24,370 41,980 49,823 46,626 51,688 53,859
Sources: ITC calculations based on UN COMTRADE statistics.
91 (HS-2 digit) -Clocks and WatchesUS $ (000)
Product code Product labelThailand's exports to Turkey Turkey's imports from world Thailand's exports to world Market
Potential
2009 2010 2011 2012 2013 2009 2010 2011 2012 2013 2009 2010 2011 2012 2013 2013
TOTAL 1 2 240 20 0 178,273 251,233 311,381 277,893 340,102 363,673 438,346 481,650 381,508 476,761 340,102'9102 Wrist- or pocket-watch (other than 9101) 0 0 235 0 0 114,169 174,975 226,111 201,887 240,992 135,460 171,177 152,279 78,259 180,579 240,992'9114 Other clock or watch parts 0 0 5 0 0 984 1,128 1,440 1,342 1,608 96,349 140,580 175,722 160,176 135,218 1,608
'9113Watch straps, watch bands and watch bracelets, and parts thereof 0 0 0 0 0 2,655 2,665 3,369 2,582 3,530 17,514 24,453 49,432 56,004 60,909 3,530
'9101 Wrist- or pocket-watch, with case of prec/prec clad met 0 2 0 20 0 34,967 37,692 35,778 32,178 47,670 17,956 12,887 15,633 18,749 42,748 47,670'9111 Watch cases and parts thereof 0 0 0 0 0 1,040 2,130 2,155 2,040 3,143 29,678 34,936 65,049 53,166 37,703 3,143'9105 Other clocks 0 0 0 0 0 6,250 9,533 14,393 10,432 13,263 12,940 14,004 17,407 9,879 13,510 13,263'9106 Time of day recording app, w clock/watch movement 0 0 0 0 0 4,638 1,866 1,704 1,476 1,685 4,586 4,630 3,818 3,382 4,497 1,685'9107 Time switches with clock or watch movement 0 0 0 0 0 12,205 13,142 18,224 17,893 18,345 1,048 1,667 1,387 856 1,018 18,345'9108 Watch movements, complete and assembled 0 0 0 0 0 1,110 2,077 2,144 2,255 3,130 47,743 33,456 372 607 438 3,130
'9104Instrument panel clock & clock of sim type for veh, aircraft, vessel,e 1 0 0 0 0 255 6,025 6,063 5,808 6,736 399 556 551 430 141 6,736
Sources: ITC calculations based on UN COMTRADE statistics.
Full Report: Potential Product-Turkey Potential.xlsx
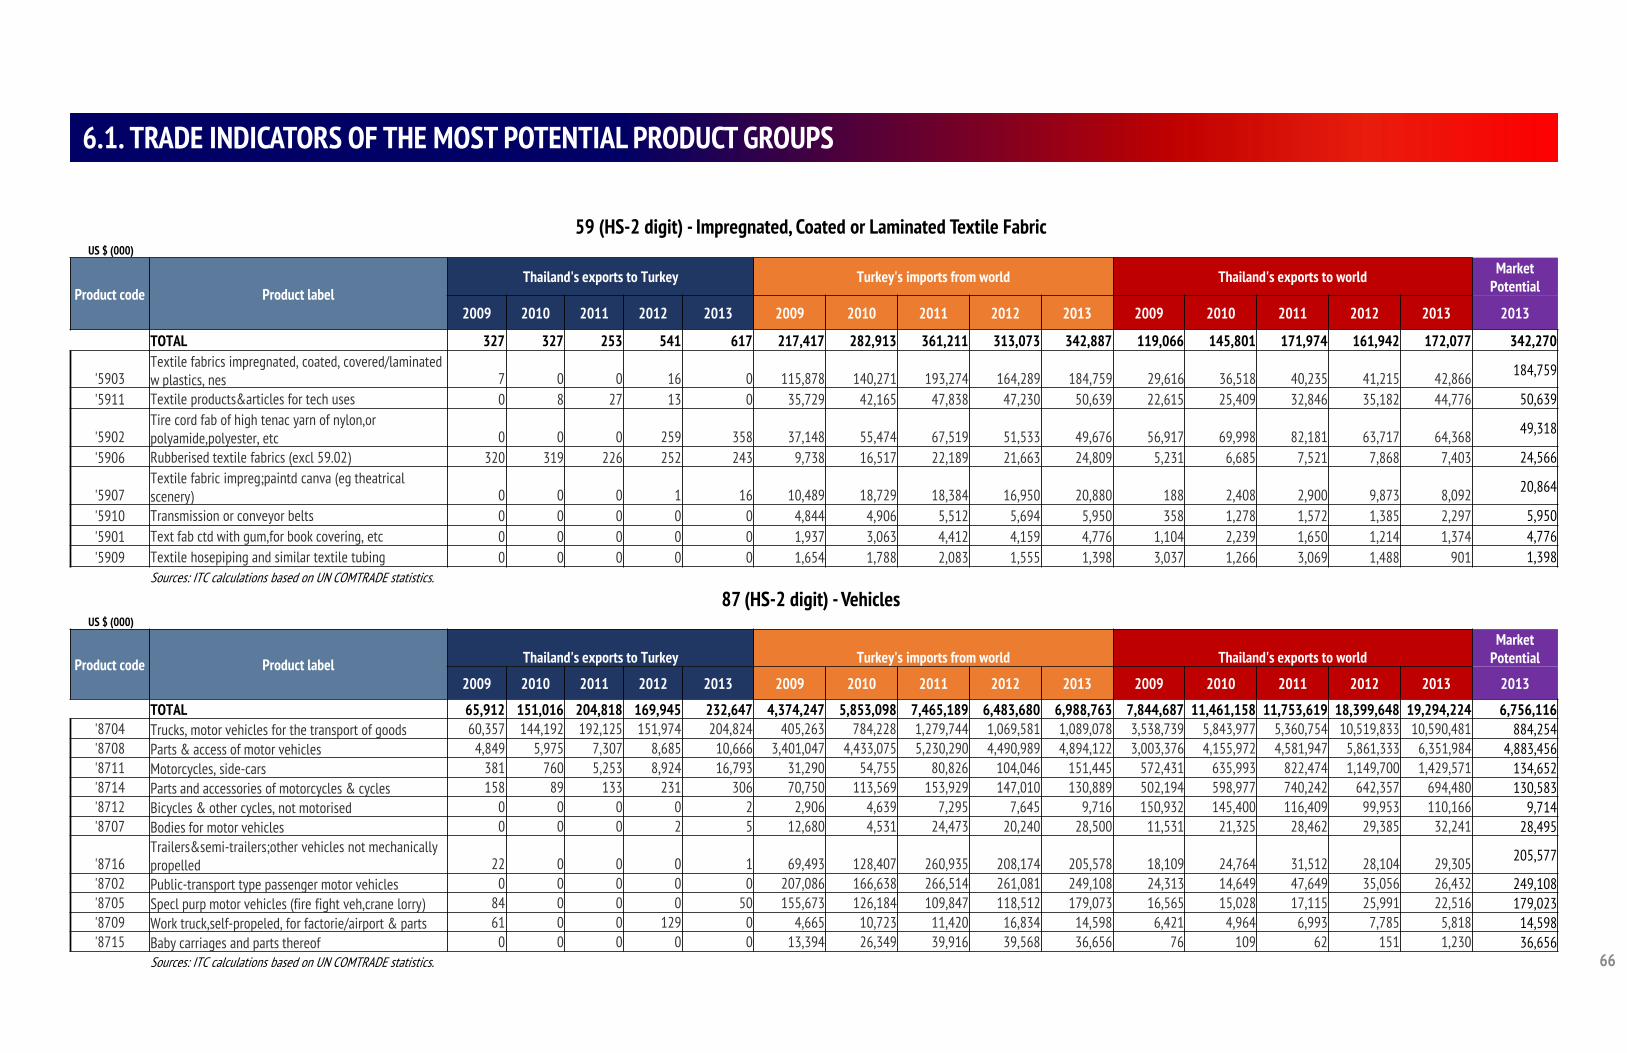
66
6.1. TRADE INDICATORS OF THE MOST POTENTIAL PRODUCT GROUPS
59 (HS-2 digit) - Impregnated, Coated or Laminated Textile FabricUS $ (000)
Product code Product labelThailand's exports to Turkey Turkey's imports from world Thailand's exports to world Market
Potential
2009 2010 2011 2012 2013 2009 2010 2011 2012 2013 2009 2010 2011 2012 2013 2013
TOTAL 327 327 253 541 617 217,417 282,913 361,211 313,073 342,887 119,066 145,801 171,974 161,942 172,077 342,270
'5903Textile fabrics impregnated, coated, covered/laminated w plastics, nes 7 0 0 16 0 115,878 140,271 193,274 164,289 184,759 29,616 36,518 40,235 41,215 42,866 184,759
'5911 Textile products&articles for tech uses 0 8 27 13 0 35,729 42,165 47,838 47,230 50,639 22,615 25,409 32,846 35,182 44,776 50,639
'5902Tire cord fab of high tenac yarn of nylon,or polyamide,polyester, etc 0 0 0 259 358 37,148 55,474 67,519 51,533 49,676 56,917 69,998 82,181 63,717 64,368 49,318
'5906 Rubberised textile fabrics (excl 59.02) 320 319 226 252 243 9,738 16,517 22,189 21,663 24,809 5,231 6,685 7,521 7,868 7,403 24,566
'5907Textile fabric impreg;paintd canva (eg theatrical scenery) 0 0 0 1 16 10,489 18,729 18,384 16,950 20,880 188 2,408 2,900 9,873 8,092 20,864
'5910 Transmission or conveyor belts 0 0 0 0 0 4,844 4,906 5,512 5,694 5,950 358 1,278 1,572 1,385 2,297 5,950'5901 Text fab ctd with gum,for book covering, etc 0 0 0 0 0 1,937 3,063 4,412 4,159 4,776 1,104 2,239 1,650 1,214 1,374 4,776'5909 Textile hosepiping and similar textile tubing 0 0 0 0 0 1,654 1,788 2,083 1,555 1,398 3,037 1,266 3,069 1,488 901 1,398
Sources: ITC calculations based on UN COMTRADE statistics.
87 (HS-2 digit) - VehiclesUS $ (000)
Product code Product label Thailand's exports to Turkey Turkey's imports from world Thailand's exports to worldMarket
Potential
2009 2010 2011 2012 2013 2009 2010 2011 2012 2013 2009 2010 2011 2012 2013 2013
TOTAL 65,912 151,016 204,818 169,945 232,647 4,374,247 5,853,098 7,465,189 6,483,680 6,988,763 7,844,687 11,461,158 11,753,619 18,399,648 19,294,224 6,756,116'8704 Trucks, motor vehicles for the transport of goods 60,357 144,192 192,125 151,974 204,824 405,263 784,228 1,279,744 1,069,581 1,089,078 3,538,739 5,843,977 5,360,754 10,519,833 10,590,481 884,254'8708 Parts & access of motor vehicles 4,849 5,975 7,307 8,685 10,666 3,401,047 4,433,075 5,230,290 4,490,989 4,894,122 3,003,376 4,155,972 4,581,947 5,861,333 6,351,984 4,883,456'8711 Motorcycles, side-cars 381 760 5,253 8,924 16,793 31,290 54,755 80,826 104,046 151,445 572,431 635,993 822,474 1,149,700 1,429,571 134,652'8714 Parts and accessories of motorcycles & cycles 158 89 133 231 306 70,750 113,569 153,929 147,010 130,889 502,194 598,977 740,242 642,357 694,480 130,583'8712 Bicycles & other cycles, not motorised 0 0 0 0 2 2,906 4,639 7,295 7,645 9,716 150,932 145,400 116,409 99,953 110,166 9,714'8707 Bodies for motor vehicles 0 0 0 2 5 12,680 4,531 24,473 20,240 28,500 11,531 21,325 28,462 29,385 32,241 28,495
'8716Trailers&semi-trailers;other vehicles not mechanically propelled 22 0 0 0 1 69,493 128,407 260,935 208,174 205,578 18,109 24,764 31,512 28,104 29,305 205,577
'8702 Public-transport type passenger motor vehicles 0 0 0 0 0 207,086 166,638 266,514 261,081 249,108 24,313 14,649 47,649 35,056 26,432 249,108'8705 Specl purp motor vehicles (fire fight veh,crane lorry) 84 0 0 0 50 155,673 126,184 109,847 118,512 179,073 16,565 15,028 17,115 25,991 22,516 179,023'8709 Work truck,self-propeled, for factorie/airport & parts 61 0 0 129 0 4,665 10,723 11,420 16,834 14,598 6,421 4,964 6,993 7,785 5,818 14,598'8715 Baby carriages and parts thereof 0 0 0 0 0 13,394 26,349 39,916 39,568 36,656 76 109 62 151 1,230 36,656
Sources: ITC calculations based on UN COMTRADE statistics.
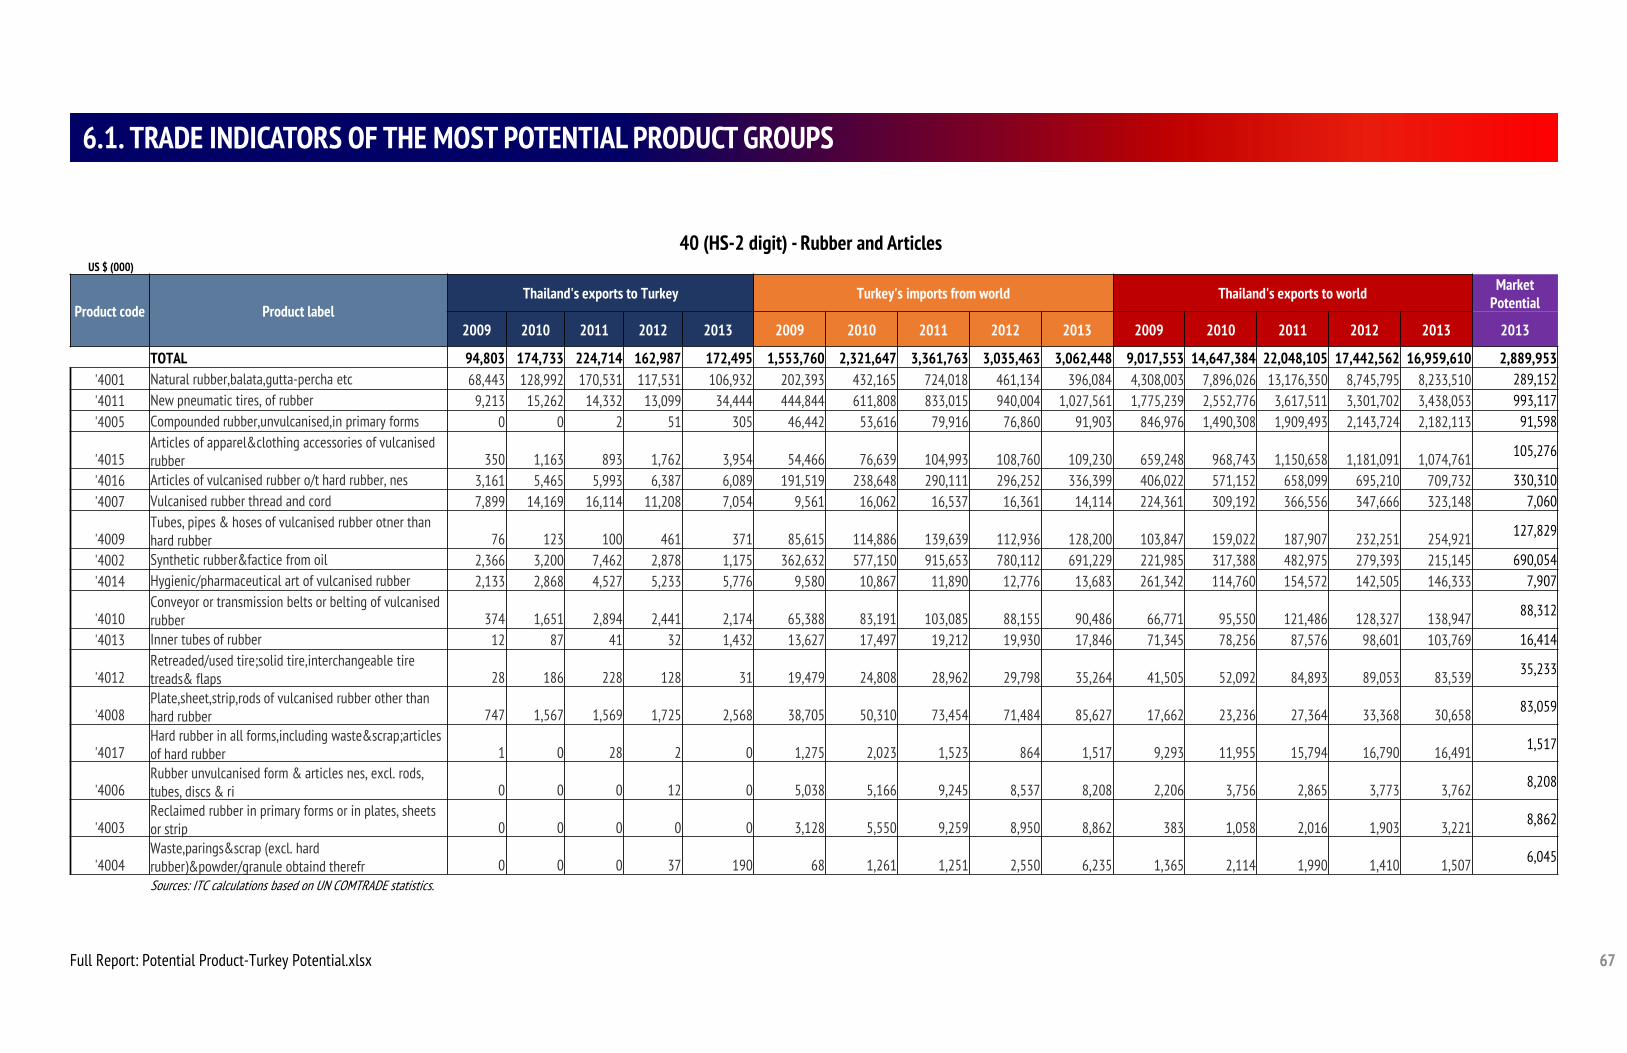
67
6.1. TRADE INDICATORS OF THE MOST POTENTIAL PRODUCT GROUPS
40 (HS-2 digit) - Rubber and ArticlesUS $ (000)
Product code Product labelThailand's exports to Turkey Turkey's imports from world Thailand's exports to world Market
Potential
2009 2010 2011 2012 2013 2009 2010 2011 2012 2013 2009 2010 2011 2012 2013 2013
TOTAL 94,803 174,733 224,714 162,987 172,495 1,553,760 2,321,647 3,361,763 3,035,463 3,062,448 9,017,553 14,647,384 22,048,105 17,442,562 16,959,610 2,889,953'4001 Natural rubber,balata,gutta-percha etc 68,443 128,992 170,531 117,531 106,932 202,393 432,165 724,018 461,134 396,084 4,308,003 7,896,026 13,176,350 8,745,795 8,233,510 289,152'4011 New pneumatic tires, of rubber 9,213 15,262 14,332 13,099 34,444 444,844 611,808 833,015 940,004 1,027,561 1,775,239 2,552,776 3,617,511 3,301,702 3,438,053 993,117'4005 Compounded rubber,unvulcanised,in primary forms 0 0 2 51 305 46,442 53,616 79,916 76,860 91,903 846,976 1,490,308 1,909,493 2,143,724 2,182,113 91,598
'4015Articles of apparel&clothing accessories of vulcanised rubber 350 1,163 893 1,762 3,954 54,466 76,639 104,993 108,760 109,230 659,248 968,743 1,150,658 1,181,091 1,074,761 105,276
'4016 Articles of vulcanised rubber o/t hard rubber, nes 3,161 5,465 5,993 6,387 6,089 191,519 238,648 290,111 296,252 336,399 406,022 571,152 658,099 695,210 709,732 330,310'4007 Vulcanised rubber thread and cord 7,899 14,169 16,114 11,208 7,054 9,561 16,062 16,537 16,361 14,114 224,361 309,192 366,556 347,666 323,148 7,060
'4009Tubes, pipes & hoses of vulcanised rubber otner than hard rubber 76 123 100 461 371 85,615 114,886 139,639 112,936 128,200 103,847 159,022 187,907 232,251 254,921 127,829
'4002 Synthetic rubber&factice from oil 2,366 3,200 7,462 2,878 1,175 362,632 577,150 915,653 780,112 691,229 221,985 317,388 482,975 279,393 215,145 690,054'4014 Hygienic/pharmaceutical art of vulcanised rubber 2,133 2,868 4,527 5,233 5,776 9,580 10,867 11,890 12,776 13,683 261,342 114,760 154,572 142,505 146,333 7,907
'4010Conveyor or transmission belts or belting of vulcanised rubber 374 1,651 2,894 2,441 2,174 65,388 83,191 103,085 88,155 90,486 66,771 95,550 121,486 128,327 138,947 88,312
'4013 Inner tubes of rubber 12 87 41 32 1,432 13,627 17,497 19,212 19,930 17,846 71,345 78,256 87,576 98,601 103,769 16,414
'4012Retreaded/used tire;solid tire,interchangeable tire treads& flaps 28 186 228 128 31 19,479 24,808 28,962 29,798 35,264 41,505 52,092 84,893 89,053 83,539 35,233
'4008Plate,sheet,strip,rods of vulcanised rubber other than hard rubber 747 1,567 1,569 1,725 2,568 38,705 50,310 73,454 71,484 85,627 17,662 23,236 27,364 33,368 30,658 83,059
'4017Hard rubber in all forms,including waste&scrap;articles of hard rubber 1 0 28 2 0 1,275 2,023 1,523 864 1,517 9,293 11,955 15,794 16,790 16,491 1,517
'4006Rubber unvulcanised form & articles nes, excl. rods, tubes, discs & ri 0 0 0 12 0 5,038 5,166 9,245 8,537 8,208 2,206 3,756 2,865 3,773 3,762 8,208
'4003Reclaimed rubber in primary forms or in plates, sheets or strip 0 0 0 0 0 3,128 5,550 9,259 8,950 8,862 383 1,058 2,016 1,903 3,221 8,862
'4004Waste,parings&scrap (excl. hard rubber)&powder/granule obtaind therefr 0 0 0 37 190 68 1,261 1,251 2,550 6,235 1,365 2,114 1,990 1,410 1,507 6,045
Sources: ITC calculations based on UN COMTRADE statistics.
Full Report: Potential Product-Turkey Potential.xlsx
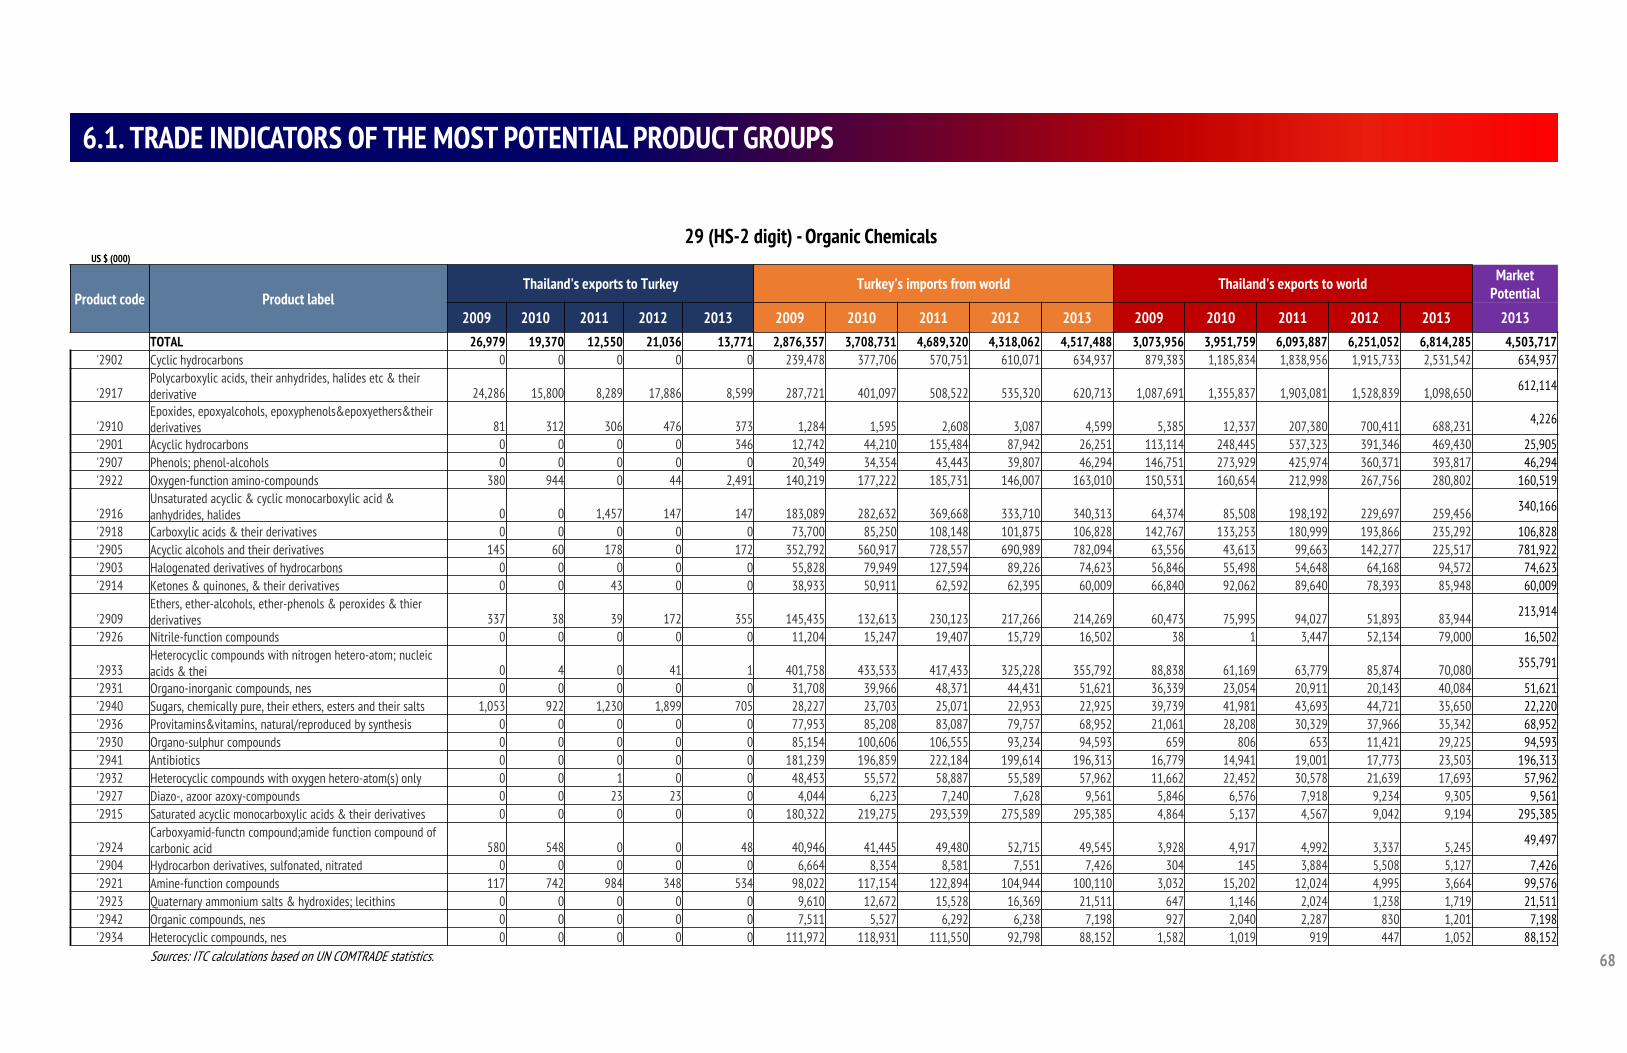
68
6.1. TRADE INDICATORS OF THE MOST POTENTIAL PRODUCT GROUPS
29 (HS-2 digit) - Organic ChemicalsUS $ (000)
Product code Product labelThailand's exports to Turkey Turkey's imports from world Thailand's exports to world Market
Potential
2009 2010 2011 2012 2013 2009 2010 2011 2012 2013 2009 2010 2011 2012 2013 2013TOTAL 26,979 19,370 12,550 21,036 13,771 2,876,357 3,708,731 4,689,320 4,318,062 4,517,488 3,073,956 3,951,759 6,093,887 6,251,052 6,814,285 4,503,717
'2902 Cyclic hydrocarbons 0 0 0 0 0 239,478 377,706 570,751 610,071 634,937 879,383 1,185,834 1,838,956 1,915,733 2,531,542 634,937
'2917Polycarboxylic acids, their anhydrides, halides etc & their derivative 24,286 15,800 8,289 17,886 8,599 287,721 401,097 508,522 535,320 620,713 1,087,691 1,355,837 1,903,081 1,528,839 1,098,650 612,114
'2910Epoxides, epoxyalcohols, epoxyphenols&epoxyethers&their derivatives 81 312 306 476 373 1,284 1,595 2,608 3,087 4,599 5,385 12,337 207,380 700,411 688,231 4,226
'2901 Acyclic hydrocarbons 0 0 0 0 346 12,742 44,210 155,484 87,942 26,251 113,114 248,445 537,323 391,346 469,430 25,905'2907 Phenols; phenol-alcohols 0 0 0 0 0 20,349 34,354 43,443 39,807 46,294 146,751 273,929 425,974 360,371 393,817 46,294'2922 Oxygen-function amino-compounds 380 944 0 44 2,491 140,219 177,222 185,731 146,007 163,010 150,531 160,654 212,998 267,756 280,802 160,519
'2916Unsaturated acyclic & cyclic monocarboxylic acid & anhydrides, halides 0 0 1,457 147 147 183,089 282,632 369,668 333,710 340,313 64,374 85,508 198,192 229,697 259,456 340,166
'2918 Carboxylic acids & their derivatives 0 0 0 0 0 73,700 85,250 108,148 101,875 106,828 142,767 133,253 180,999 193,866 235,292 106,828'2905 Acyclic alcohols and their derivatives 145 60 178 0 172 352,792 560,917 728,557 690,989 782,094 63,556 43,613 99,663 142,277 225,517 781,922'2903 Halogenated derivatives of hydrocarbons 0 0 0 0 0 55,828 79,949 127,594 89,226 74,623 56,846 55,498 54,648 64,168 94,572 74,623'2914 Ketones & quinones, & their derivatives 0 0 43 0 0 38,933 50,911 62,592 62,395 60,009 66,840 92,062 89,640 78,393 85,948 60,009
'2909Ethers, ether-alcohols, ether-phenols & peroxides & thier derivatives 337 38 39 172 355 145,435 132,613 230,123 217,266 214,269 60,473 75,995 94,027 51,893 83,944 213,914
'2926 Nitrile-function compounds 0 0 0 0 0 11,204 15,247 19,407 15,729 16,502 38 1 3,447 52,134 79,000 16,502
'2933Heterocyclic compounds with nitrogen hetero-atom; nucleic acids & thei 0 4 0 41 1 401,758 433,533 417,433 325,228 355,792 88,838 61,169 63,779 85,874 70,080 355,791
'2931 Organo-inorganic compounds, nes 0 0 0 0 0 31,708 39,966 48,371 44,431 51,621 36,339 23,054 20,911 20,143 40,084 51,621'2940 Sugars, chemically pure, their ethers, esters and their salts 1,053 922 1,230 1,899 705 28,227 23,703 25,071 22,953 22,925 39,739 41,981 43,693 44,721 35,650 22,220'2936 Provitamins&vitamins, natural/reproduced by synthesis 0 0 0 0 0 77,953 85,208 83,087 79,757 68,952 21,061 28,208 30,329 37,966 35,342 68,952'2930 Organo-sulphur compounds 0 0 0 0 0 85,154 100,606 106,555 93,234 94,593 659 806 653 11,421 29,225 94,593'2941 Antibiotics 0 0 0 0 0 181,239 196,859 222,184 199,614 196,313 16,779 14,941 19,001 17,773 23,503 196,313'2932 Heterocyclic compounds with oxygen hetero-atom(s) only 0 0 1 0 0 48,453 55,572 58,887 55,589 57,962 11,662 22,452 30,578 21,639 17,693 57,962'2927 Diazo-, azoor azoxy-compounds 0 0 23 23 0 4,044 6,223 7,240 7,628 9,561 5,846 6,576 7,918 9,234 9,305 9,561'2915 Saturated acyclic monocarboxylic acids & their derivatives 0 0 0 0 0 180,322 219,275 293,539 275,589 295,385 4,864 5,137 4,567 9,042 9,194 295,385
'2924Carboxyamid-functn compound;amide function compound of carbonic acid 580 548 0 0 48 40,946 41,445 49,480 52,715 49,545 3,928 4,917 4,992 3,337 5,245 49,497
'2904 Hydrocarbon derivatives, sulfonated, nitrated 0 0 0 0 0 6,664 8,354 8,581 7,551 7,426 304 145 3,884 5,508 5,127 7,426'2921 Amine-function compounds 117 742 984 348 534 98,022 117,154 122,894 104,944 100,110 3,032 15,202 12,024 4,995 3,664 99,576'2923 Quaternary ammonium salts & hydroxides; lecithins 0 0 0 0 0 9,610 12,672 15,528 16,369 21,511 647 1,146 2,024 1,238 1,719 21,511'2942 Organic compounds, nes 0 0 0 0 0 7,511 5,527 6,292 6,238 7,198 927 2,040 2,287 830 1,201 7,198'2934 Heterocyclic compounds, nes 0 0 0 0 0 111,972 118,931 111,550 92,798 88,152 1,582 1,019 919 447 1,052 88,152
Sources: ITC calculations based on UN COMTRADE statistics.
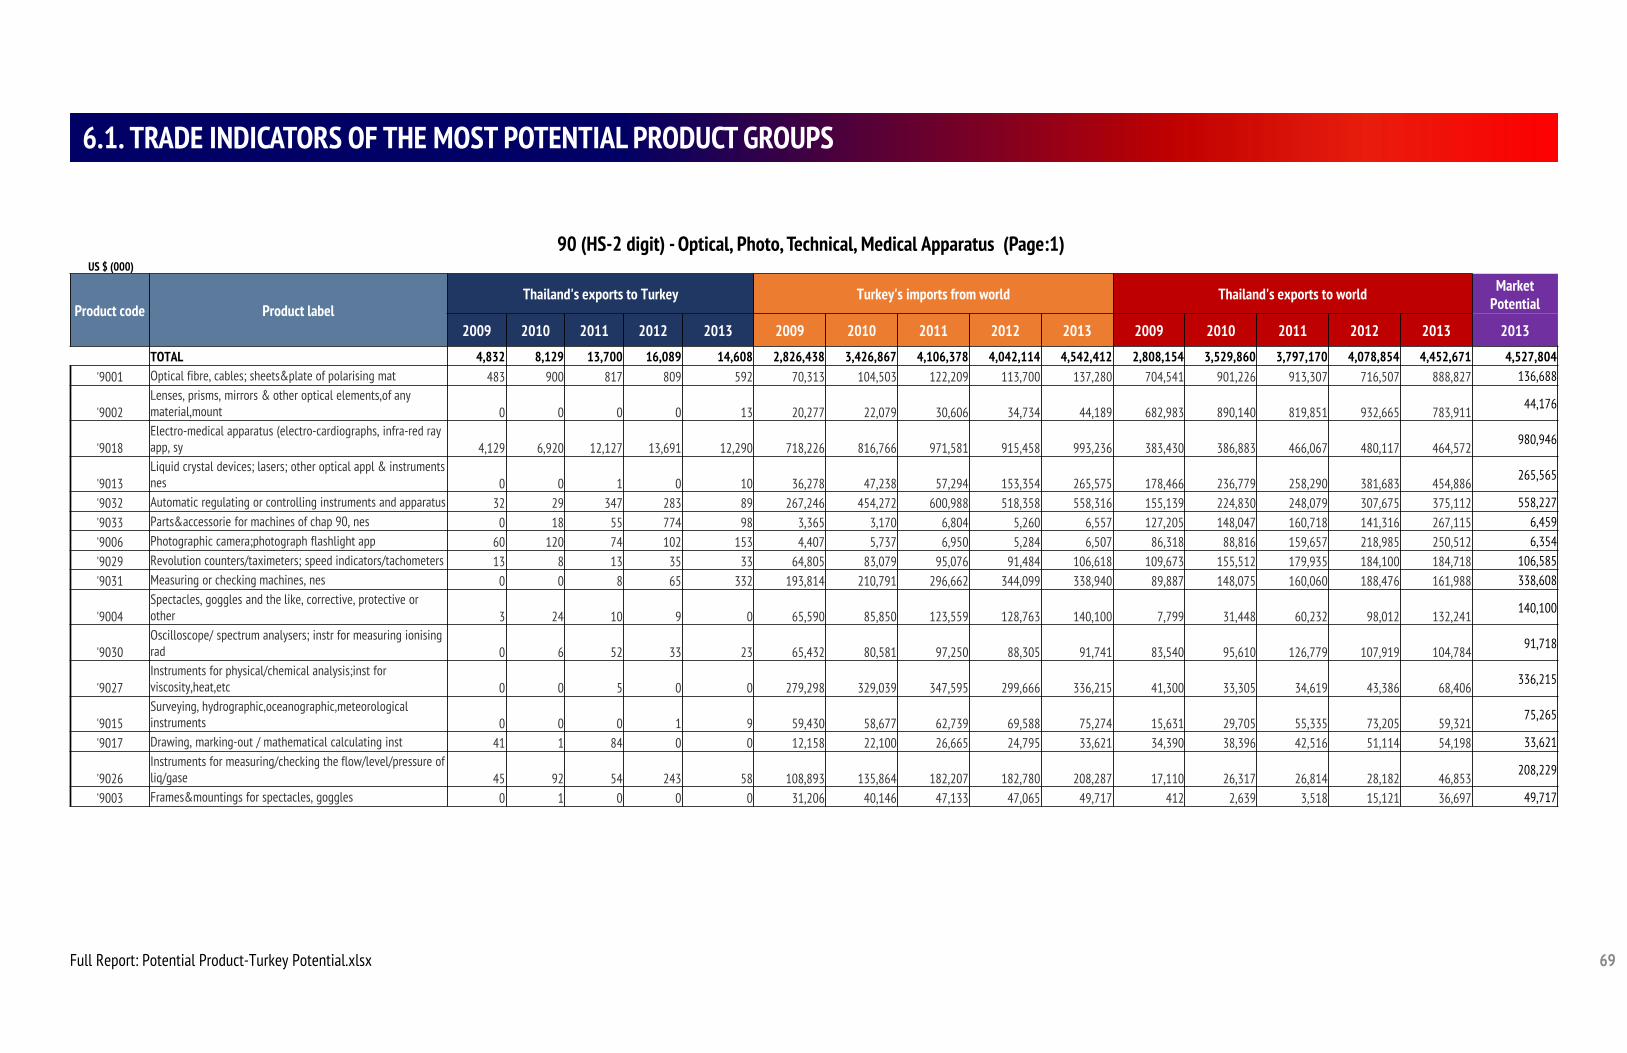
69
6.1. TRADE INDICATORS OF THE MOST POTENTIAL PRODUCT GROUPS
90 (HS-2 digit) - Optical, Photo, Technical, Medical Apparatus (Page:1) US $ (000)
Product code Product labelThailand's exports to Turkey Turkey's imports from world Thailand's exports to world Market
Potential
2009 2010 2011 2012 2013 2009 2010 2011 2012 2013 2009 2010 2011 2012 2013 2013
TOTAL 4,832 8,129 13,700 16,089 14,608 2,826,438 3,426,867 4,106,378 4,042,114 4,542,412 2,808,154 3,529,860 3,797,170 4,078,854 4,452,671 4,527,804'9001 Optical fibre, cables; sheets&plate of polarising mat 483 900 817 809 592 70,313 104,503 122,209 113,700 137,280 704,541 901,226 913,307 716,507 888,827 136,688
'9002Lenses, prisms, mirrors & other optical elements,of any material,mount 0 0 0 0 13 20,277 22,079 30,606 34,734 44,189 682,983 890,140 819,851 932,665 783,911
44,176
'9018Electro-medical apparatus (electro-cardiographs, infra-red ray app, sy 4,129 6,920 12,127 13,691 12,290 718,226 816,766 971,581 915,458 993,236 383,430 386,883 466,067 480,117 464,572
980,946
'9013Liquid crystal devices; lasers; other optical appl & instruments nes 0 0 1 0 10 36,278 47,238 57,294 153,354 265,575 178,466 236,779 258,290 381,683 454,886
265,565
'9032 Automatic regulating or controlling instruments and apparatus 32 29 347 283 89 267,246 454,272 600,988 518,358 558,316 155,139 224,830 248,079 307,675 375,112 558,227'9033 Parts&accessorie for machines of chap 90, nes 0 18 55 774 98 3,365 3,170 6,804 5,260 6,557 127,205 148,047 160,718 141,316 267,115 6,459'9006 Photographic camera;photograph flashlight app 60 120 74 102 153 4,407 5,737 6,950 5,284 6,507 86,318 88,816 159,657 218,985 250,512 6,354'9029 Revolution counters/taximeters; speed indicators/tachometers 13 8 13 35 33 64,805 83,079 95,076 91,484 106,618 109,673 155,512 179,935 184,100 184,718 106,585'9031 Measuring or checking machines, nes 0 0 8 65 332 193,814 210,791 296,662 344,099 338,940 89,887 148,075 160,060 188,476 161,988 338,608
'9004Spectacles, goggles and the like, corrective, protective or other 3 24 10 9 0 65,590 85,850 123,559 128,763 140,100 7,799 31,448 60,232 98,012 132,241
140,100
'9030Oscilloscope/ spectrum analysers; instr for measuring ionising rad 0 6 52 33 23 65,432 80,581 97,250 88,305 91,741 83,540 95,610 126,779 107,919 104,784
91,718
'9027Instruments for physical/chemical analysis;inst for viscosity,heat,etc 0 0 5 0 0 279,298 329,039 347,595 299,666 336,215 41,300 33,305 34,619 43,386 68,406
336,215
'9015Surveying, hydrographic,oceanographic,meteorological instruments 0 0 0 1 9 59,430 58,677 62,739 69,588 75,274 15,631 29,705 55,335 73,205 59,321
75,265
'9017 Drawing, marking-out / mathematical calculating inst 41 1 84 0 0 12,158 22,100 26,665 24,795 33,621 34,390 38,396 42,516 51,114 54,198 33,621
'9026Instruments for measuring/checking the flow/level/pressure of liq/gase 45 92 54 243 58 108,893 135,864 182,207 182,780 208,287 17,110 26,317 26,814 28,182 46,853
208,229
'9003 Frames&mountings for spectacles, goggles 0 1 0 0 0 31,206 40,146 47,133 47,065 49,717 412 2,639 3,518 15,121 36,697 49,717
Full Report: Potential Product-Turkey Potential.xlsx
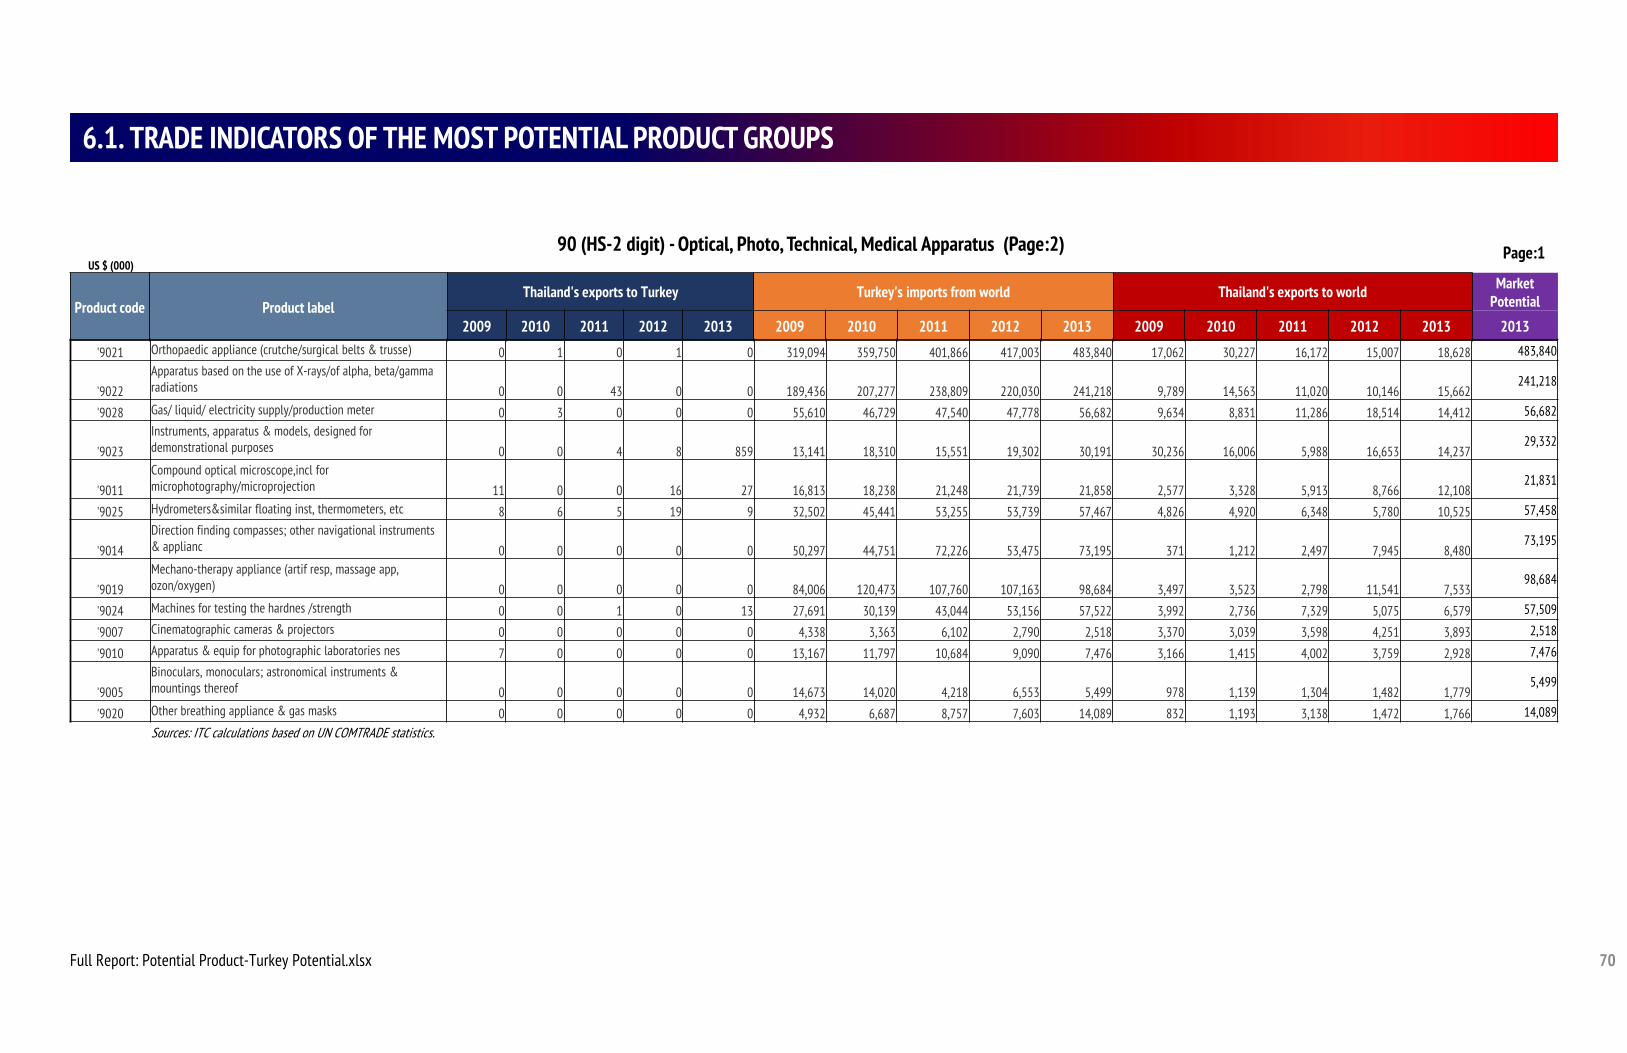
70
6.1. TRADE INDICATORS OF THE MOST POTENTIAL PRODUCT GROUPS
90 (HS-2 digit) - Optical, Photo, Technical, Medical Apparatus (Page:2)US $ (000)
Product code Product labelThailand's exports to Turkey Turkey's imports from world Thailand's exports to world Market
Potential
2009 2010 2011 2012 2013 2009 2010 2011 2012 2013 2009 2010 2011 2012 2013 2013
'9021 Orthopaedic appliance (crutche/surgical belts & trusse) 0 1 0 1 0 319,094 359,750 401,866 417,003 483,840 17,062 30,227 16,172 15,007 18,628 483,840
'9022Apparatus based on the use of X-rays/of alpha, beta/gamma radiations 0 0 43 0 0 189,436 207,277 238,809 220,030 241,218 9,789 14,563 11,020 10,146 15,662
241,218
'9028 Gas/ liquid/ electricity supply/production meter 0 3 0 0 0 55,610 46,729 47,540 47,778 56,682 9,634 8,831 11,286 18,514 14,412 56,682
'9023Instruments, apparatus & models, designed for demonstrational purposes 0 0 4 8 859 13,141 18,310 15,551 19,302 30,191 30,236 16,006 5,988 16,653 14,237
29,332
'9011Compound optical microscope,incl for microphotography/microprojection 11 0 0 16 27 16,813 18,238 21,248 21,739 21,858 2,577 3,328 5,913 8,766 12,108
21,831
'9025 Hydrometers&similar floating inst, thermometers, etc 8 6 5 19 9 32,502 45,441 53,255 53,739 57,467 4,826 4,920 6,348 5,780 10,525 57,458
'9014Direction finding compasses; other navigational instruments & applianc 0 0 0 0 0 50,297 44,751 72,226 53,475 73,195 371 1,212 2,497 7,945 8,480
73,195
'9019Mechano-therapy appliance (artif resp, massage app, ozon/oxygen) 0 0 0 0 0 84,006 120,473 107,760 107,163 98,684 3,497 3,523 2,798 11,541 7,533
98,684
'9024 Machines for testing the hardnes /strength 0 0 1 0 13 27,691 30,139 43,044 53,156 57,522 3,992 2,736 7,329 5,075 6,579 57,509
'9007 Cinematographic cameras & projectors 0 0 0 0 0 4,338 3,363 6,102 2,790 2,518 3,370 3,039 3,598 4,251 3,893 2,518
'9010 Apparatus & equip for photographic laboratories nes 7 0 0 0 0 13,167 11,797 10,684 9,090 7,476 3,166 1,415 4,002 3,759 2,928 7,476
'9005Binoculars, monoculars; astronomical instruments & mountings thereof 0 0 0 0 0 14,673 14,020 4,218 6,553 5,499 978 1,139 1,304 1,482 1,779
5,499
'9020 Other breathing appliance & gas masks 0 0 0 0 0 4,932 6,687 8,757 7,603 14,089 832 1,193 3,138 1,472 1,766 14,089Sources: ITC calculations based on UN COMTRADE statistics.
Page:1
Full Report: Potential Product-Turkey Potential.xlsx
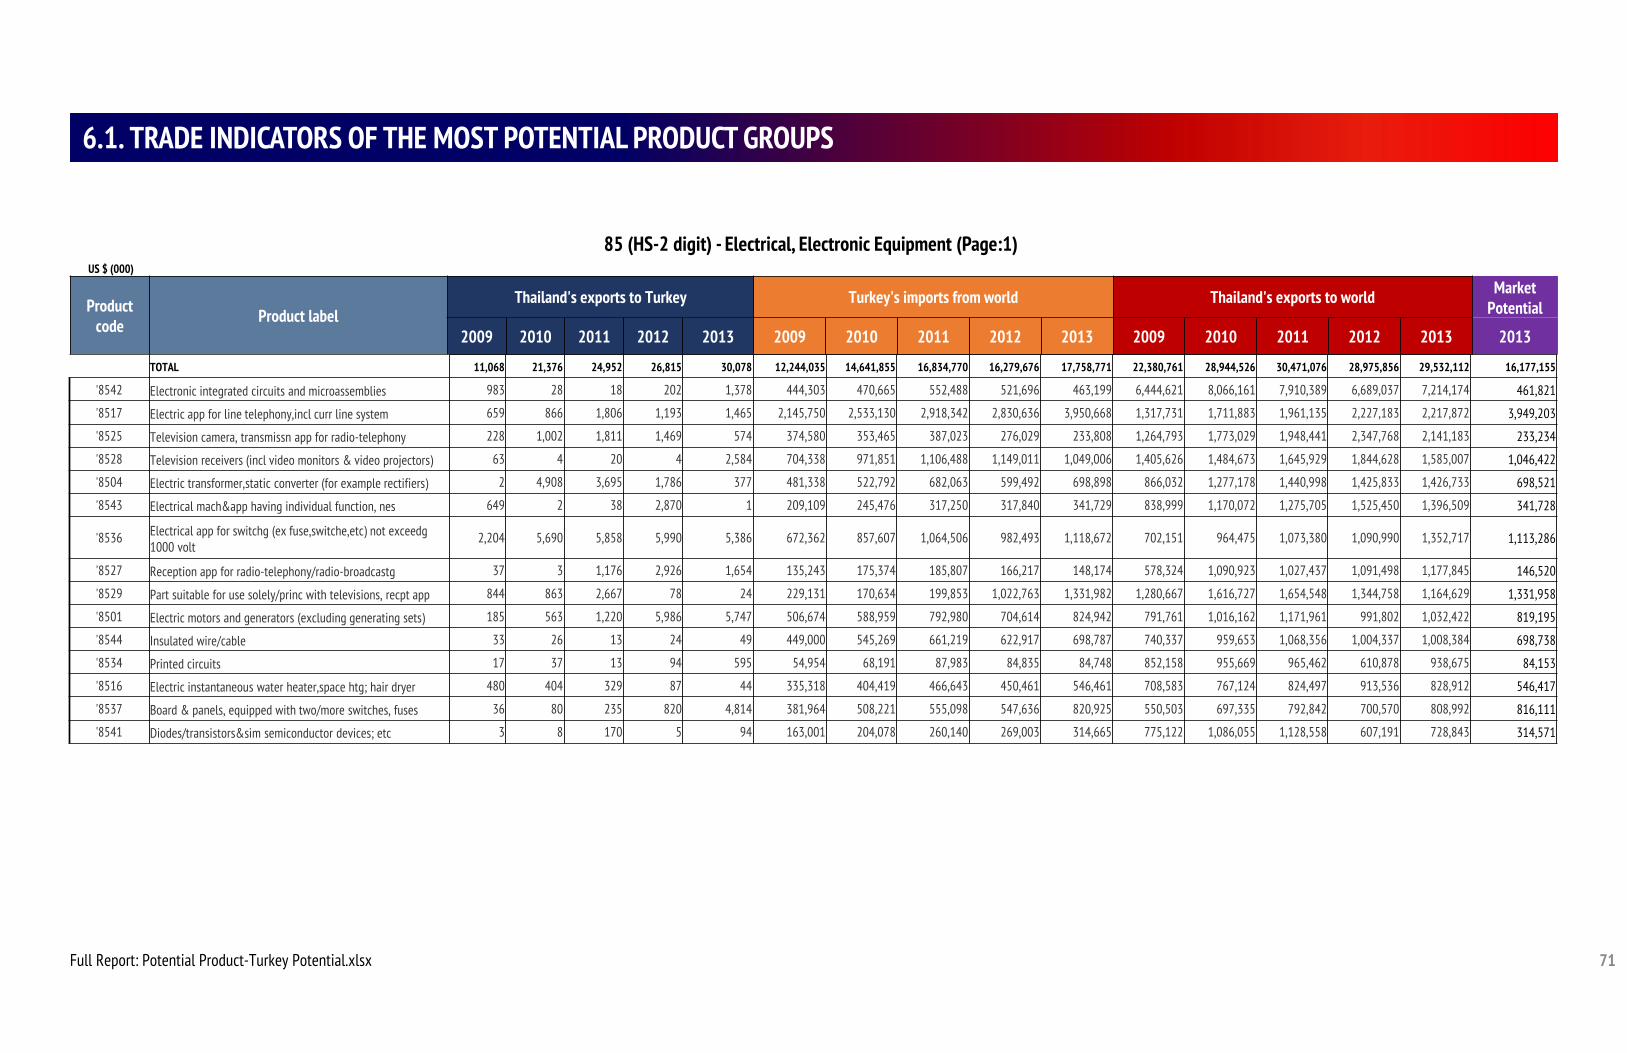
71
6.1. TRADE INDICATORS OF THE MOST POTENTIAL PRODUCT GROUPS
85 (HS-2 digit) - Electrical, Electronic Equipment (Page:1)US $ (000)
Product code Product label
Thailand's exports to Turkey Turkey's imports from world Thailand's exports to world Market Potential
2009 2010 2011 2012 2013 2009 2010 2011 2012 2013 2009 2010 2011 2012 2013 2013
TOTAL 11,068 21,376 24,952 26,815 30,078 12,244,035 14,641,855 16,834,770 16,279,676 17,758,771 22,380,761 28,944,526 30,471,076 28,975,856 29,532,112 16,177,155
'8542 Electronic integrated circuits and microassemblies 983 28 18 202 1,378 444,303 470,665 552,488 521,696 463,199 6,444,621 8,066,161 7,910,389 6,689,037 7,214,174 461,821
'8517 Electric app for line telephony,incl curr line system 659 866 1,806 1,193 1,465 2,145,750 2,533,130 2,918,342 2,830,636 3,950,668 1,317,731 1,711,883 1,961,135 2,227,183 2,217,872 3,949,203
'8525 Television camera, transmissn app for radio-telephony 228 1,002 1,811 1,469 574 374,580 353,465 387,023 276,029 233,808 1,264,793 1,773,029 1,948,441 2,347,768 2,141,183 233,234
'8528 Television receivers (incl video monitors & video projectors) 63 4 20 4 2,584 704,338 971,851 1,106,488 1,149,011 1,049,006 1,405,626 1,484,673 1,645,929 1,844,628 1,585,007 1,046,422
'8504 Electric transformer,static converter (for example rectifiers) 2 4,908 3,695 1,786 377 481,338 522,792 682,063 599,492 698,898 866,032 1,277,178 1,440,998 1,425,833 1,426,733 698,521
'8543 Electrical mach&app having individual function, nes 649 2 38 2,870 1 209,109 245,476 317,250 317,840 341,729 838,999 1,170,072 1,275,705 1,525,450 1,396,509 341,728
'8536 Electrical app for switchg (ex fuse,switche,etc) not exceedg 1000 volt
2,204 5,690 5,858 5,990 5,386 672,362 857,607 1,064,506 982,493 1,118,672 702,151 964,475 1,073,380 1,090,990 1,352,717 1,113,286
'8527 Reception app for radio-telephony/radio-broadcastg 37 3 1,176 2,926 1,654 135,243 175,374 185,807 166,217 148,174 578,324 1,090,923 1,027,437 1,091,498 1,177,845 146,520
'8529 Part suitable for use solely/princ with televisions, recpt app 844 863 2,667 78 24 229,131 170,634 199,853 1,022,763 1,331,982 1,280,667 1,616,727 1,654,548 1,344,758 1,164,629 1,331,958
'8501 Electric motors and generators (excluding generating sets) 185 563 1,220 5,986 5,747 506,674 588,959 792,980 704,614 824,942 791,761 1,016,162 1,171,961 991,802 1,032,422 819,195
'8544 Insulated wire/cable 33 26 13 24 49 449,000 545,269 661,219 622,917 698,787 740,337 959,653 1,068,356 1,004,337 1,008,384 698,738
'8534 Printed circuits 17 37 13 94 595 54,954 68,191 87,983 84,835 84,748 852,158 955,669 965,462 610,878 938,675 84,153
'8516 Electric instantaneous water heater,space htg; hair dryer 480 404 329 87 44 335,318 404,419 466,643 450,461 546,461 708,583 767,124 824,497 913,536 828,912 546,417
'8537 Board & panels, equipped with two/more switches, fuses 36 80 235 820 4,814 381,964 508,221 555,098 547,636 820,925 550,503 697,335 792,842 700,570 808,992 816,111
'8541 Diodes/transistors&sim semiconductor devices; etc 3 8 170 5 94 163,001 204,078 260,140 269,003 314,665 775,122 1,086,055 1,128,558 607,191 728,843 314,571
Full Report: Potential Product-Turkey Potential.xlsx
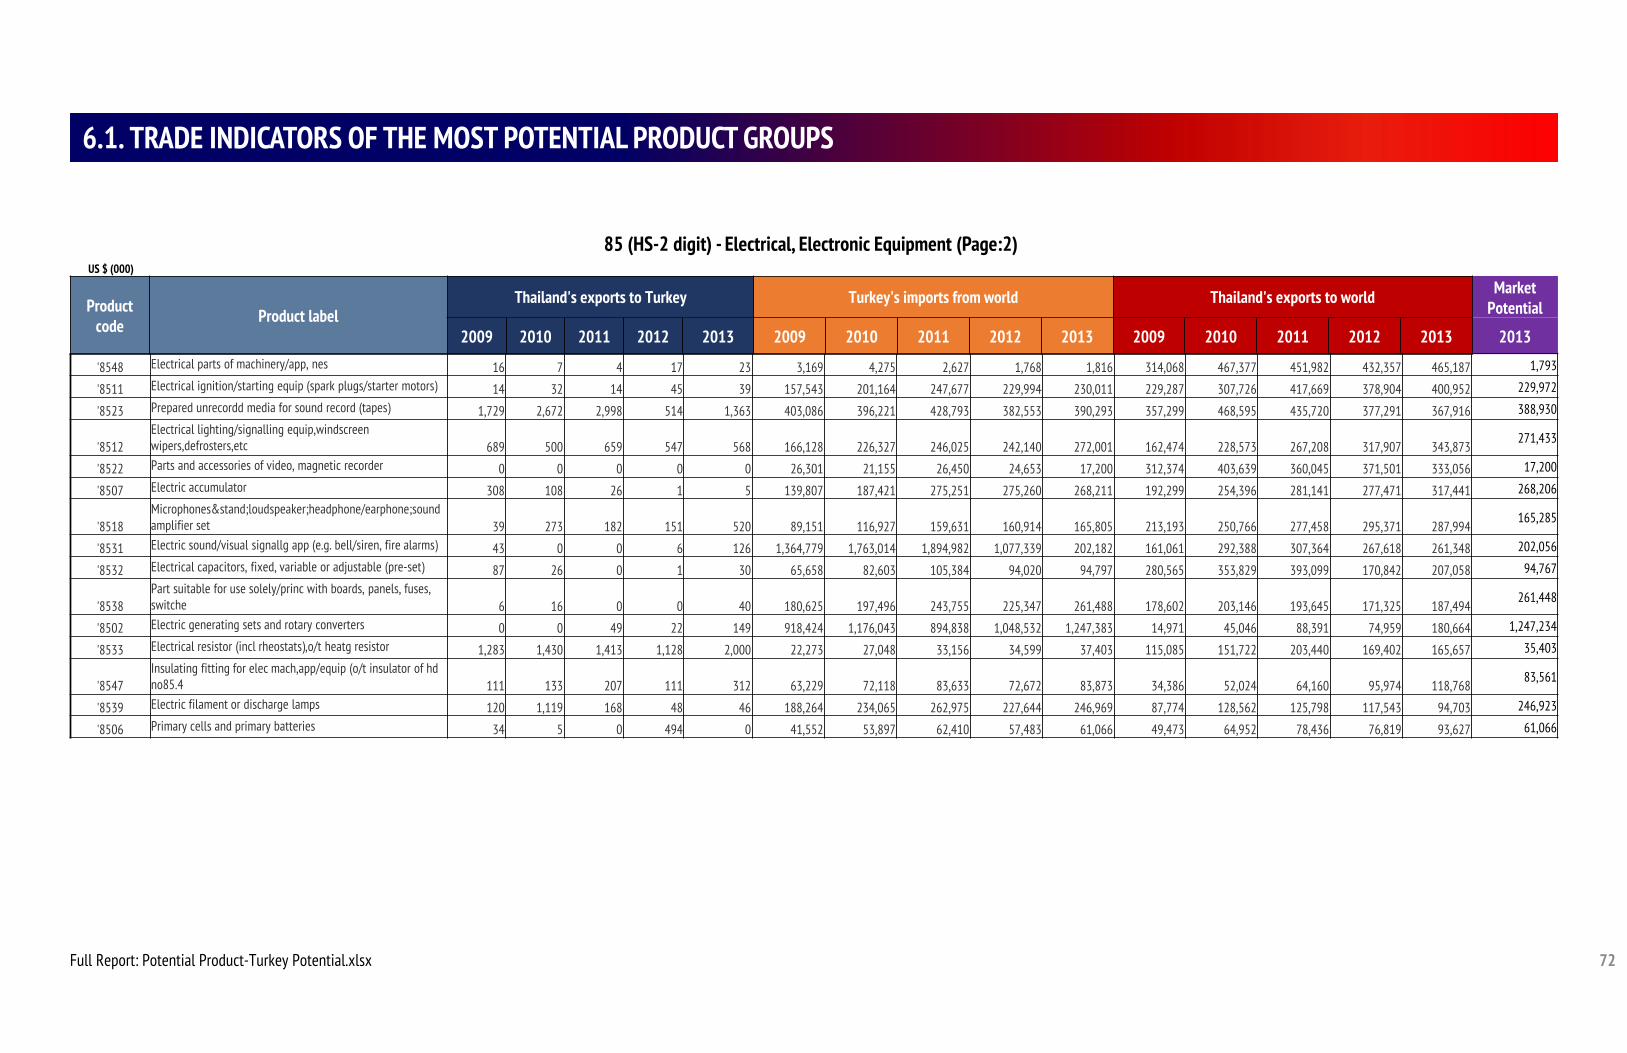
72
6.1. TRADE INDICATORS OF THE MOST POTENTIAL PRODUCT GROUPS
85 (HS-2 digit) - Electrical, Electronic Equipment (Page:2)US $ (000)
Product code Product label
Thailand's exports to Turkey Turkey's imports from world Thailand's exports to world Market Potential
2009 2010 2011 2012 2013 2009 2010 2011 2012 2013 2009 2010 2011 2012 2013 2013
'8548 Electrical parts of machinery/app, nes 16 7 4 17 23 3,169 4,275 2,627 1,768 1,816 314,068 467,377 451,982 432,357 465,187 1,793
'8511 Electrical ignition/starting equip (spark plugs/starter motors) 14 32 14 45 39 157,543 201,164 247,677 229,994 230,011 229,287 307,726 417,669 378,904 400,952 229,972
'8523 Prepared unrecordd media for sound record (tapes) 1,729 2,672 2,998 514 1,363 403,086 396,221 428,793 382,553 390,293 357,299 468,595 435,720 377,291 367,916 388,930
'8512Electrical lighting/signalling equip,windscreen wipers,defrosters,etc 689 500 659 547 568 166,128 226,327 246,025 242,140 272,001 162,474 228,573 267,208 317,907 343,873
271,433
'8522 Parts and accessories of video, magnetic recorder 0 0 0 0 0 26,301 21,155 26,450 24,653 17,200 312,374 403,639 360,045 371,501 333,056 17,200
'8507 Electric accumulator 308 108 26 1 5 139,807 187,421 275,251 275,260 268,211 192,299 254,396 281,141 277,471 317,441 268,206
'8518Microphones&stand;loudspeaker;headphone/earphone;sound amplifier set 39 273 182 151 520 89,151 116,927 159,631 160,914 165,805 213,193 250,766 277,458 295,371 287,994
165,285
'8531 Electric sound/visual signallg app (e.g. bell/siren, fire alarms) 43 0 0 6 126 1,364,779 1,763,014 1,894,982 1,077,339 202,182 161,061 292,388 307,364 267,618 261,348 202,056
'8532 Electrical capacitors, fixed, variable or adjustable (pre-set) 87 26 0 1 30 65,658 82,603 105,384 94,020 94,797 280,565 353,829 393,099 170,842 207,058 94,767
'8538Part suitable for use solely/princ with boards, panels, fuses, switche 6 16 0 0 40 180,625 197,496 243,755 225,347 261,488 178,602 203,146 193,645 171,325 187,494
261,448
'8502 Electric generating sets and rotary converters 0 0 49 22 149 918,424 1,176,043 894,838 1,048,532 1,247,383 14,971 45,046 88,391 74,959 180,664 1,247,234
'8533 Electrical resistor (incl rheostats),o/t heatg resistor 1,283 1,430 1,413 1,128 2,000 22,273 27,048 33,156 34,599 37,403 115,085 151,722 203,440 169,402 165,657 35,403
'8547Insulating fitting for elec mach,app/equip (o/t insulator of hd no85.4 111 133 207 111 312 63,229 72,118 83,633 72,672 83,873 34,386 52,024 64,160 95,974 118,768
83,561
'8539 Electric filament or discharge lamps 120 1,119 168 48 46 188,264 234,065 262,975 227,644 246,969 87,774 128,562 125,798 117,543 94,703 246,923
'8506 Primary cells and primary batteries 34 5 0 494 0 41,552 53,897 62,410 57,483 61,066 49,473 64,952 78,436 76,819 93,627 61,066
Full Report: Potential Product-Turkey Potential.xlsx
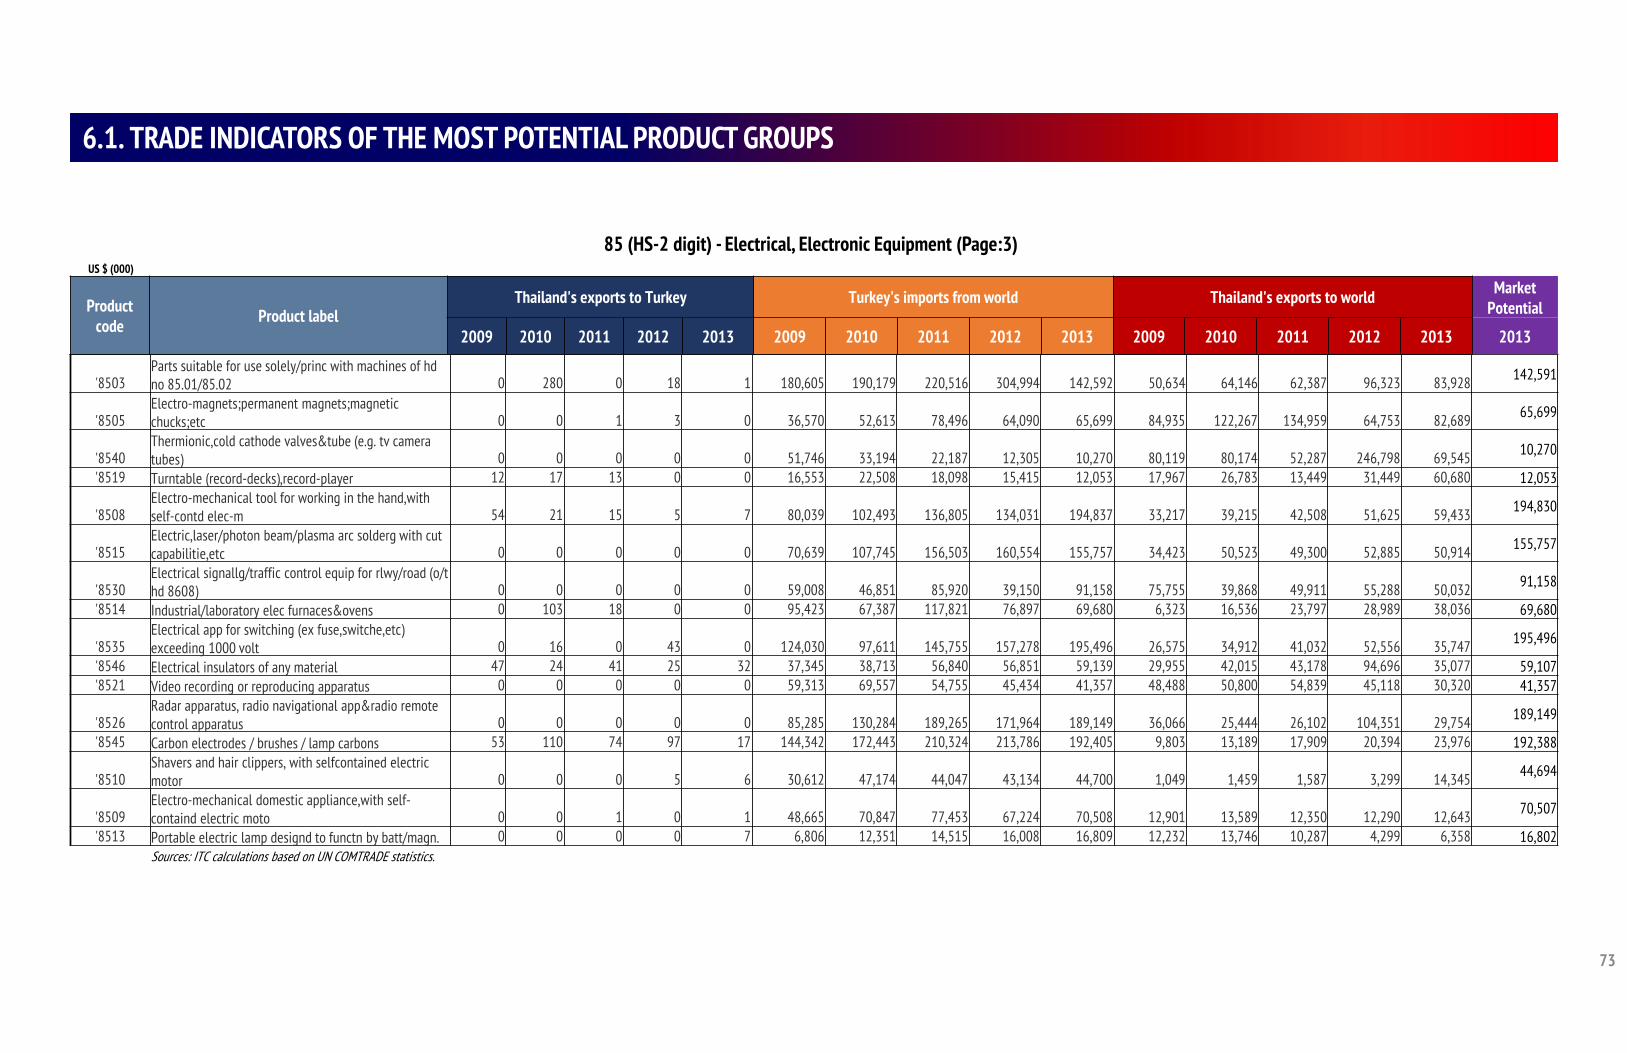
73
6.1. TRADE INDICATORS OF THE MOST POTENTIAL PRODUCT GROUPS
85 (HS-2 digit) - Electrical, Electronic Equipment (Page:3)US $ (000)
Product code Product label
Thailand's exports to Turkey Turkey's imports from world Thailand's exports to world Market Potential
2009 2010 2011 2012 2013 2009 2010 2011 2012 2013 2009 2010 2011 2012 2013 2013
'8503Parts suitable for use solely/princ with machines of hd no 85.01/85.02 0 280 0 18 1 180,605 190,179 220,516 304,994 142,592 50,634 64,146 62,387 96,323 83,928 142,591
'8505Electro-magnets;permanent magnets;magnetic chucks;etc 0 0 1 3 0 36,570 52,613 78,496 64,090 65,699 84,935 122,267 134,959 64,753 82,689 65,699
'8540Thermionic,cold cathode valves&tube (e.g. tv camera tubes) 0 0 0 0 0 51,746 33,194 22,187 12,305 10,270 80,119 80,174 52,287 246,798 69,545 10,270
'8519 Turntable (record-decks),record-player 12 17 13 0 0 16,553 22,508 18,098 15,415 12,053 17,967 26,783 13,449 31,449 60,680 12,053
'8508Electro-mechanical tool for working in the hand,with self-contd elec-m 54 21 15 5 7 80,039 102,493 136,805 134,031 194,837 33,217 39,215 42,508 51,625 59,433 194,830
'8515Electric,laser/photon beam/plasma arc solderg with cut capabilitie,etc 0 0 0 0 0 70,639 107,745 156,503 160,554 155,757 34,423 50,523 49,300 52,885 50,914 155,757
'8530Electrical signallg/traffic control equip for rlwy/road (o/t hd 8608) 0 0 0 0 0 59,008 46,851 85,920 39,150 91,158 75,755 39,868 49,911 55,288 50,032 91,158
'8514 Industrial/laboratory elec furnaces&ovens 0 103 18 0 0 95,423 67,387 117,821 76,897 69,680 6,323 16,536 23,797 28,989 38,036 69,680
'8535Electrical app for switching (ex fuse,switche,etc) exceeding 1000 volt 0 16 0 43 0 124,030 97,611 145,755 157,278 195,496 26,575 34,912 41,032 52,556 35,747 195,496
'8546 Electrical insulators of any material 47 24 41 25 32 37,345 38,713 56,840 56,851 59,139 29,955 42,015 43,178 94,696 35,077 59,107'8521 Video recording or reproducing apparatus 0 0 0 0 0 59,313 69,557 54,755 45,434 41,357 48,488 50,800 54,839 45,118 30,320 41,357
'8526Radar apparatus, radio navigational app&radio remote control apparatus 0 0 0 0 0 85,285 130,284 189,265 171,964 189,149 36,066 25,444 26,102 104,351 29,754 189,149
'8545 Carbon electrodes / brushes / lamp carbons 53 110 74 97 17 144,342 172,443 210,324 213,786 192,405 9,803 13,189 17,909 20,394 23,976 192,388
'8510Shavers and hair clippers, with selfcontained electric motor 0 0 0 5 6 30,612 47,174 44,047 43,134 44,700 1,049 1,459 1,587 3,299 14,345 44,694
'8509Electro-mechanical domestic appliance,with self-containd electric moto 0 0 1 0 1 48,665 70,847 77,453 67,224 70,508 12,901 13,589 12,350 12,290 12,643 70,507
'8513 Portable electric lamp designd to functn by batt/magn. 0 0 0 0 7 6,806 12,351 14,515 16,008 16,809 12,232 13,746 10,287 4,299 6,358 16,802Sources: ITC calculations based on UN COMTRADE statistics.
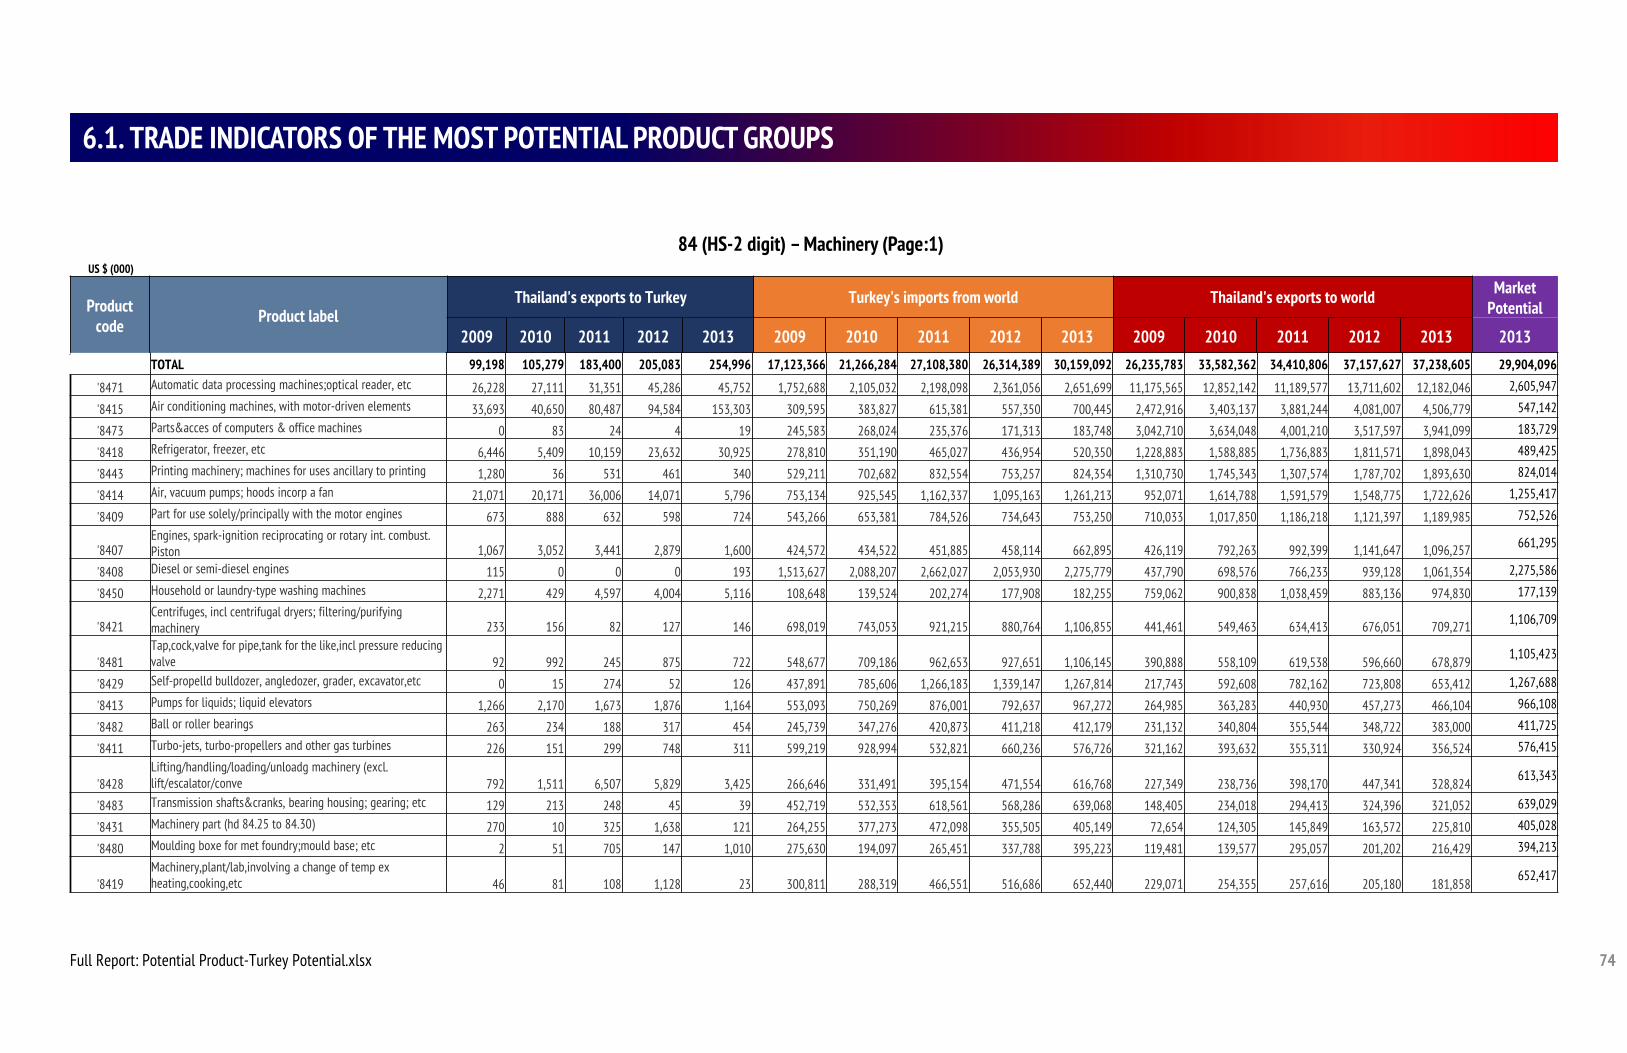
74
6.1. TRADE INDICATORS OF THE MOST POTENTIAL PRODUCT GROUPS
84 (HS-2 digit) – Machinery (Page:1)US $ (000)
Product code Product label
Thailand's exports to Turkey Turkey's imports from world Thailand's exports to world Market Potential
2009 2010 2011 2012 2013 2009 2010 2011 2012 2013 2009 2010 2011 2012 2013 2013TOTAL 99,198 105,279 183,400 205,083 254,996 17,123,366 21,266,284 27,108,380 26,314,389 30,159,092 26,235,783 33,582,362 34,410,806 37,157,627 37,238,605 29,904,096
'8471 Automatic data processing machines;optical reader, etc 26,228 27,111 31,351 45,286 45,752 1,752,688 2,105,032 2,198,098 2,361,056 2,651,699 11,175,565 12,852,142 11,189,577 13,711,602 12,182,046 2,605,947
'8415 Air conditioning machines, with motor-driven elements 33,693 40,650 80,487 94,584 153,303 309,595 383,827 615,381 557,350 700,445 2,472,916 3,403,137 3,881,244 4,081,007 4,506,779 547,142
'8473 Parts&acces of computers & office machines 0 83 24 4 19 245,583 268,024 235,376 171,313 183,748 3,042,710 3,634,048 4,001,210 3,517,597 3,941,099 183,729
'8418 Refrigerator, freezer, etc 6,446 5,409 10,159 23,632 30,925 278,810 351,190 465,027 436,954 520,350 1,228,883 1,588,885 1,736,883 1,811,571 1,898,043 489,425
'8443 Printing machinery; machines for uses ancillary to printing 1,280 36 531 461 340 529,211 702,682 832,554 753,257 824,354 1,310,730 1,745,343 1,307,574 1,787,702 1,893,630 824,014
'8414 Air, vacuum pumps; hoods incorp a fan 21,071 20,171 36,006 14,071 5,796 753,134 925,545 1,162,337 1,095,163 1,261,213 952,071 1,614,788 1,591,579 1,548,775 1,722,626 1,255,417
'8409 Part for use solely/principally with the motor engines 673 888 632 598 724 543,266 653,381 784,526 734,643 753,250 710,033 1,017,850 1,186,218 1,121,397 1,189,985 752,526
'8407Engines, spark-ignition reciprocating or rotary int. combust. Piston 1,067 3,052 3,441 2,879 1,600 424,572 434,522 451,885 458,114 662,895 426,119 792,263 992,399 1,141,647 1,096,257 661,295
'8408 Diesel or semi-diesel engines 115 0 0 0 193 1,513,627 2,088,207 2,662,027 2,053,930 2,275,779 437,790 698,576 766,233 939,128 1,061,354 2,275,586
'8450 Household or laundry-type washing machines 2,271 429 4,597 4,004 5,116 108,648 139,524 202,274 177,908 182,255 759,062 900,838 1,038,459 883,136 974,830 177,139
'8421Centrifuges, incl centrifugal dryers; filtering/purifying machinery 233 156 82 127 146 698,019 743,053 921,215 880,764 1,106,855 441,461 549,463 634,413 676,051 709,271 1,106,709
'8481Tap,cock,valve for pipe,tank for the like,incl pressure reducing valve 92 992 245 875 722 548,677 709,186 962,653 927,651 1,106,145 390,888 558,109 619,538 596,660 678,879
1,105,423
'8429 Self-propelld bulldozer, angledozer, grader, excavator,etc 0 15 274 52 126 437,891 785,606 1,266,183 1,339,147 1,267,814 217,743 592,608 782,162 723,808 653,412 1,267,688
'8413 Pumps for liquids; liquid elevators 1,266 2,170 1,673 1,876 1,164 553,093 750,269 876,001 792,637 967,272 264,985 363,283 440,930 457,273 466,104 966,108
'8482 Ball or roller bearings 263 234 188 317 454 245,739 347,276 420,873 411,218 412,179 231,132 340,804 355,544 348,722 383,000 411,725
'8411 Turbo-jets, turbo-propellers and other gas turbines 226 151 299 748 311 599,219 928,994 532,821 660,236 576,726 321,162 393,632 355,311 330,924 356,524 576,415
'8428Lifting/handling/loading/unloadg machinery (excl. lift/escalator/conve 792 1,511 6,507 5,829 3,425 266,646 331,491 395,154 471,554 616,768 227,349 238,736 398,170 447,341 328,824
613,343
'8483 Transmission shafts&cranks, bearing housing; gearing; etc 129 213 248 45 39 452,719 532,353 618,561 568,286 639,068 148,405 234,018 294,413 324,396 321,052 639,029
'8431 Machinery part (hd 84.25 to 84.30) 270 10 325 1,638 121 264,255 377,273 472,098 355,505 405,149 72,654 124,305 145,849 163,572 225,810 405,028
'8480 Moulding boxe for met foundry;mould base; etc 2 51 705 147 1,010 275,630 194,097 265,451 337,788 395,223 119,481 139,577 295,057 201,202 216,429 394,213
'8419Machinery,plant/lab,involving a change of temp ex heating,cooking,etc 46 81 108 1,128 23 300,811 288,319 466,551 516,686 652,440 229,071 254,355 257,616 205,180 181,858
652,417
Full Report: Potential Product-Turkey Potential.xlsx
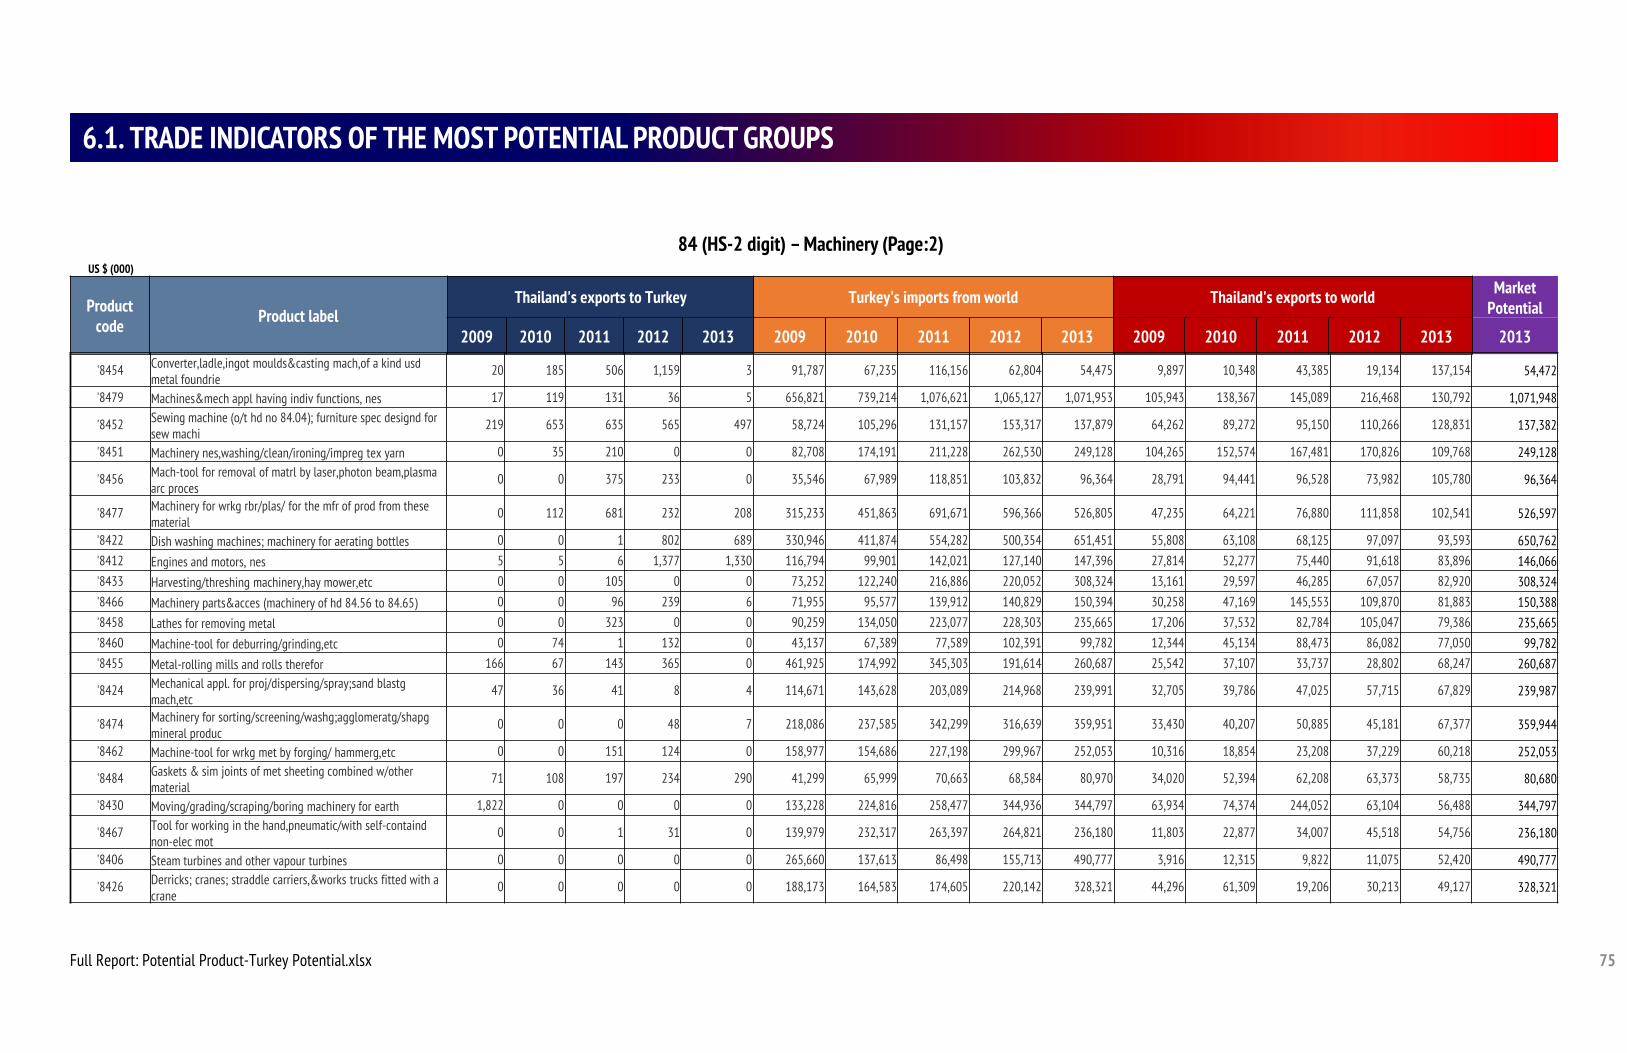
75
6.1. TRADE INDICATORS OF THE MOST POTENTIAL PRODUCT GROUPS
84 (HS-2 digit) – Machinery (Page:2)US $ (000)
Product code Product label
Thailand's exports to Turkey Turkey's imports from world Thailand's exports to world Market Potential
2009 2010 2011 2012 2013 2009 2010 2011 2012 2013 2009 2010 2011 2012 2013 2013
'8454 Converter,ladle,ingot moulds&casting mach,of a kind usd metal foundrie
20 185 506 1,159 3 91,787 67,235 116,156 62,804 54,475 9,897 10,348 43,385 19,134 137,154 54,472
'8479 Machines&mech appl having indiv functions, nes 17 119 131 36 5 656,821 739,214 1,076,621 1,065,127 1,071,953 105,943 138,367 145,089 216,468 130,792 1,071,948
'8452 Sewing machine (o/t hd no 84.04); furniture spec designd for sew machi
219 653 635 565 497 58,724 105,296 131,157 153,317 137,879 64,262 89,272 95,150 110,266 128,831 137,382
'8451 Machinery nes,washing/clean/ironing/impreg tex yarn 0 35 210 0 0 82,708 174,191 211,228 262,530 249,128 104,265 152,574 167,481 170,826 109,768 249,128
'8456 Mach-tool for removal of matrl by laser,photon beam,plasma arc proces
0 0 375 233 0 35,546 67,989 118,851 103,832 96,364 28,791 94,441 96,528 73,982 105,780 96,364
'8477 Machinery for wrkg rbr/plas/ for the mfr of prod from these material
0 112 681 232 208 315,233 451,863 691,671 596,366 526,805 47,235 64,221 76,880 111,858 102,541 526,597
'8422 Dish washing machines; machinery for aerating bottles 0 0 1 802 689 330,946 411,874 554,282 500,354 651,451 55,808 63,108 68,125 97,097 93,593 650,762'8412 Engines and motors, nes 5 5 6 1,377 1,330 116,794 99,901 142,021 127,140 147,396 27,814 52,277 75,440 91,618 83,896 146,066'8433 Harvesting/threshing machinery,hay mower,etc 0 0 105 0 0 73,252 122,240 216,886 220,052 308,324 13,161 29,597 46,285 67,057 82,920 308,324'8466 Machinery parts&acces (machinery of hd 84.56 to 84.65) 0 0 96 239 6 71,955 95,577 139,912 140,829 150,394 30,258 47,169 145,553 109,870 81,883 150,388'8458 Lathes for removing metal 0 0 323 0 0 90,259 134,050 223,077 228,303 235,665 17,206 37,532 82,784 105,047 79,386 235,665'8460 Machine-tool for deburring/grinding,etc 0 74 1 132 0 43,137 67,389 77,589 102,391 99,782 12,344 45,134 88,473 86,082 77,050 99,782'8455 Metal-rolling mills and rolls therefor 166 67 143 365 0 461,925 174,992 345,303 191,614 260,687 25,542 37,107 33,737 28,802 68,247 260,687
'8424 Mechanical appl. for proj/dispersing/spray;sand blastg mach,etc
47 36 41 8 4 114,671 143,628 203,089 214,968 239,991 32,705 39,786 47,025 57,715 67,829 239,987
'8474 Machinery for sorting/screening/washg;agglomeratg/shapg mineral produc
0 0 0 48 7 218,086 237,585 342,299 316,639 359,951 33,430 40,207 50,885 45,181 67,377 359,944
'8462 Machine-tool for wrkg met by forging/ hammerg,etc 0 0 151 124 0 158,977 154,686 227,198 299,967 252,053 10,316 18,854 23,208 37,229 60,218 252,053
'8484 Gaskets & sim joints of met sheeting combined w/other material
71 108 197 234 290 41,299 65,999 70,663 68,584 80,970 34,020 52,394 62,208 63,373 58,735 80,680
'8430 Moving/grading/scraping/boring machinery for earth 1,822 0 0 0 0 133,228 224,816 258,477 344,936 344,797 63,934 74,374 244,052 63,104 56,488 344,797
'8467 Tool for working in the hand,pneumatic/with self-containd non-elec mot
0 0 1 31 0 139,979 232,317 263,397 264,821 236,180 11,803 22,877 34,007 45,518 54,756 236,180
'8406 Steam turbines and other vapour turbines 0 0 0 0 0 265,660 137,613 86,498 155,713 490,777 3,916 12,315 9,822 11,075 52,420 490,777
'8426 Derricks; cranes; straddle carriers,&works trucks fitted with a crane
0 0 0 0 0 188,173 164,583 174,605 220,142 328,321 44,296 61,309 19,206 30,213 49,127 328,321
Full Report: Potential Product-Turkey Potential.xlsx
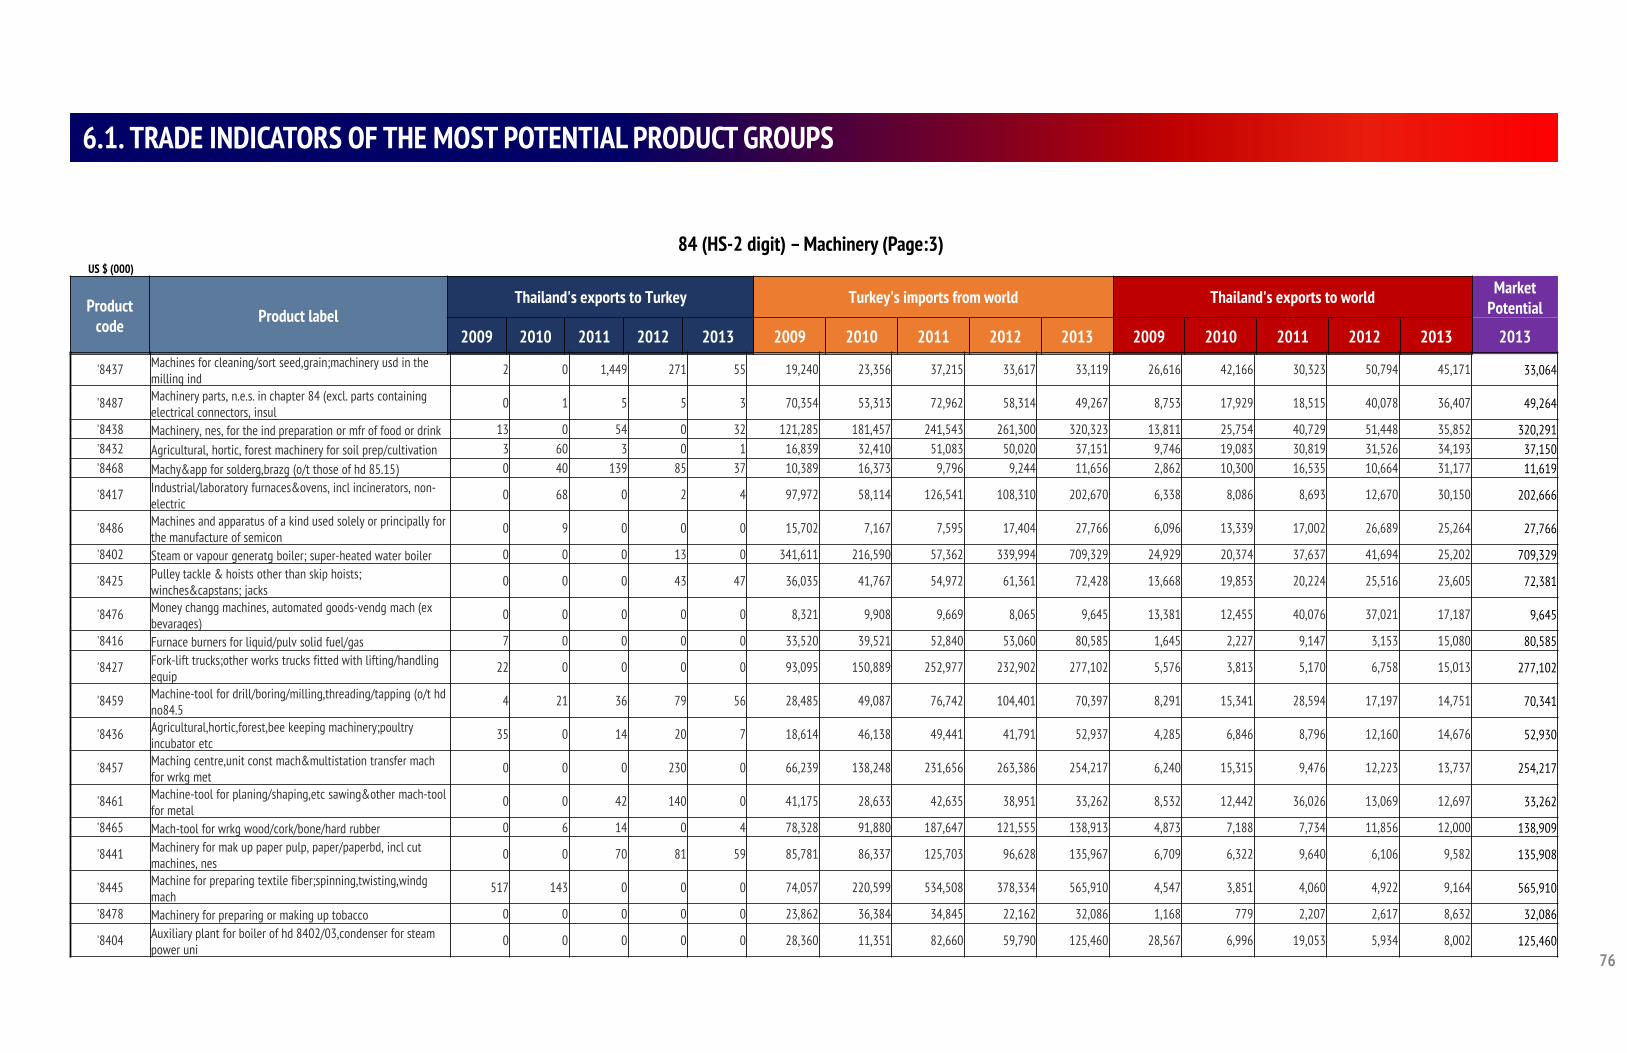
76
6.1. TRADE INDICATORS OF THE MOST POTENTIAL PRODUCT GROUPS
84 (HS-2 digit) – Machinery (Page:3)US $ (000)
Product code Product label
Thailand's exports to Turkey Turkey's imports from world Thailand's exports to world Market Potential
2009 2010 2011 2012 2013 2009 2010 2011 2012 2013 2009 2010 2011 2012 2013 2013
'8437 Machines for cleaning/sort seed,grain;machinery usd in the milling ind
2 0 1,449 271 55 19,240 23,356 37,215 33,617 33,119 26,616 42,166 30,323 50,794 45,171 33,064
'8487 Machinery parts, n.e.s. in chapter 84 (excl. parts containing electrical connectors, insul
0 1 5 5 3 70,354 53,313 72,962 58,314 49,267 8,753 17,929 18,515 40,078 36,407 49,264
'8438 Machinery, nes, for the ind preparation or mfr of food or drink 13 0 54 0 32 121,285 181,457 241,543 261,300 320,323 13,811 25,754 40,729 51,448 35,852 320,291'8432 Agricultural, hortic, forest machinery for soil prep/cultivation 3 60 3 0 1 16,839 32,410 51,083 50,020 37,151 9,746 19,083 30,819 31,526 34,193 37,150'8468 Machy&app for solderg,brazg (o/t those of hd 85.15) 0 40 139 85 37 10,389 16,373 9,796 9,244 11,656 2,862 10,300 16,535 10,664 31,177 11,619
'8417 Industrial/laboratory furnaces&ovens, incl incinerators, non-electric
0 68 0 2 4 97,972 58,114 126,541 108,310 202,670 6,338 8,086 8,693 12,670 30,150 202,666
'8486 Machines and apparatus of a kind used solely or principally for the manufacture of semicon
0 9 0 0 0 15,702 7,167 7,595 17,404 27,766 6,096 13,339 17,002 26,689 25,264 27,766
'8402 Steam or vapour generatg boiler; super-heated water boiler 0 0 0 13 0 341,611 216,590 57,362 339,994 709,329 24,929 20,374 37,637 41,694 25,202 709,329
'8425 Pulley tackle & hoists other than skip hoists; winches&capstans; jacks
0 0 0 43 47 36,035 41,767 54,972 61,361 72,428 13,668 19,853 20,224 25,516 23,605 72,381
'8476 Money changg machines, automated goods-vendg mach (ex bevarages)
0 0 0 0 0 8,321 9,908 9,669 8,065 9,645 13,381 12,455 40,076 37,021 17,187 9,645
'8416 Furnace burners for liquid/pulv solid fuel/gas 7 0 0 0 0 33,520 39,521 52,840 53,060 80,585 1,645 2,227 9,147 3,153 15,080 80,585
'8427 Fork-lift trucks;other works trucks fitted with lifting/handling equip
22 0 0 0 0 93,095 150,889 252,977 232,902 277,102 5,576 3,813 5,170 6,758 15,013 277,102
'8459 Machine-tool for drill/boring/milling,threading/tapping (o/t hd no84.5
4 21 36 79 56 28,485 49,087 76,742 104,401 70,397 8,291 15,341 28,594 17,197 14,751 70,341
'8436 Agricultural,hortic,forest,bee keeping machinery;poultry incubator etc
35 0 14 20 7 18,614 46,138 49,441 41,791 52,937 4,285 6,846 8,796 12,160 14,676 52,930
'8457 Maching centre,unit const mach&multistation transfer mach for wrkg met
0 0 0 230 0 66,239 138,248 231,656 263,386 254,217 6,240 15,315 9,476 12,223 13,737 254,217
'8461 Machine-tool for planing/shaping,etc sawing&other mach-tool for metal
0 0 42 140 0 41,175 28,633 42,635 38,951 33,262 8,532 12,442 36,026 13,069 12,697 33,262
'8465 Mach-tool for wrkg wood/cork/bone/hard rubber 0 6 14 0 4 78,328 91,880 187,647 121,555 138,913 4,873 7,188 7,734 11,856 12,000 138,909
'8441 Machinery for mak up paper pulp, paper/paperbd, incl cut machines, nes
0 0 70 81 59 85,781 86,337 125,703 96,628 135,967 6,709 6,322 9,640 6,106 9,582 135,908
'8445 Machine for preparing textile fiber;spinning,twisting,windg mach
517 143 0 0 0 74,057 220,599 534,508 378,334 565,910 4,547 3,851 4,060 4,922 9,164 565,910
'8478 Machinery for preparing or making up tobacco 0 0 0 0 0 23,862 36,384 34,845 22,162 32,086 1,168 779 2,207 2,617 8,632 32,086
'8404 Auxiliary plant for boiler of hd 8402/03,condenser for steam power uni
0 0 0 0 0 28,360 11,351 82,660 59,790 125,460 28,567 6,996 19,053 5,934 8,002 125,460
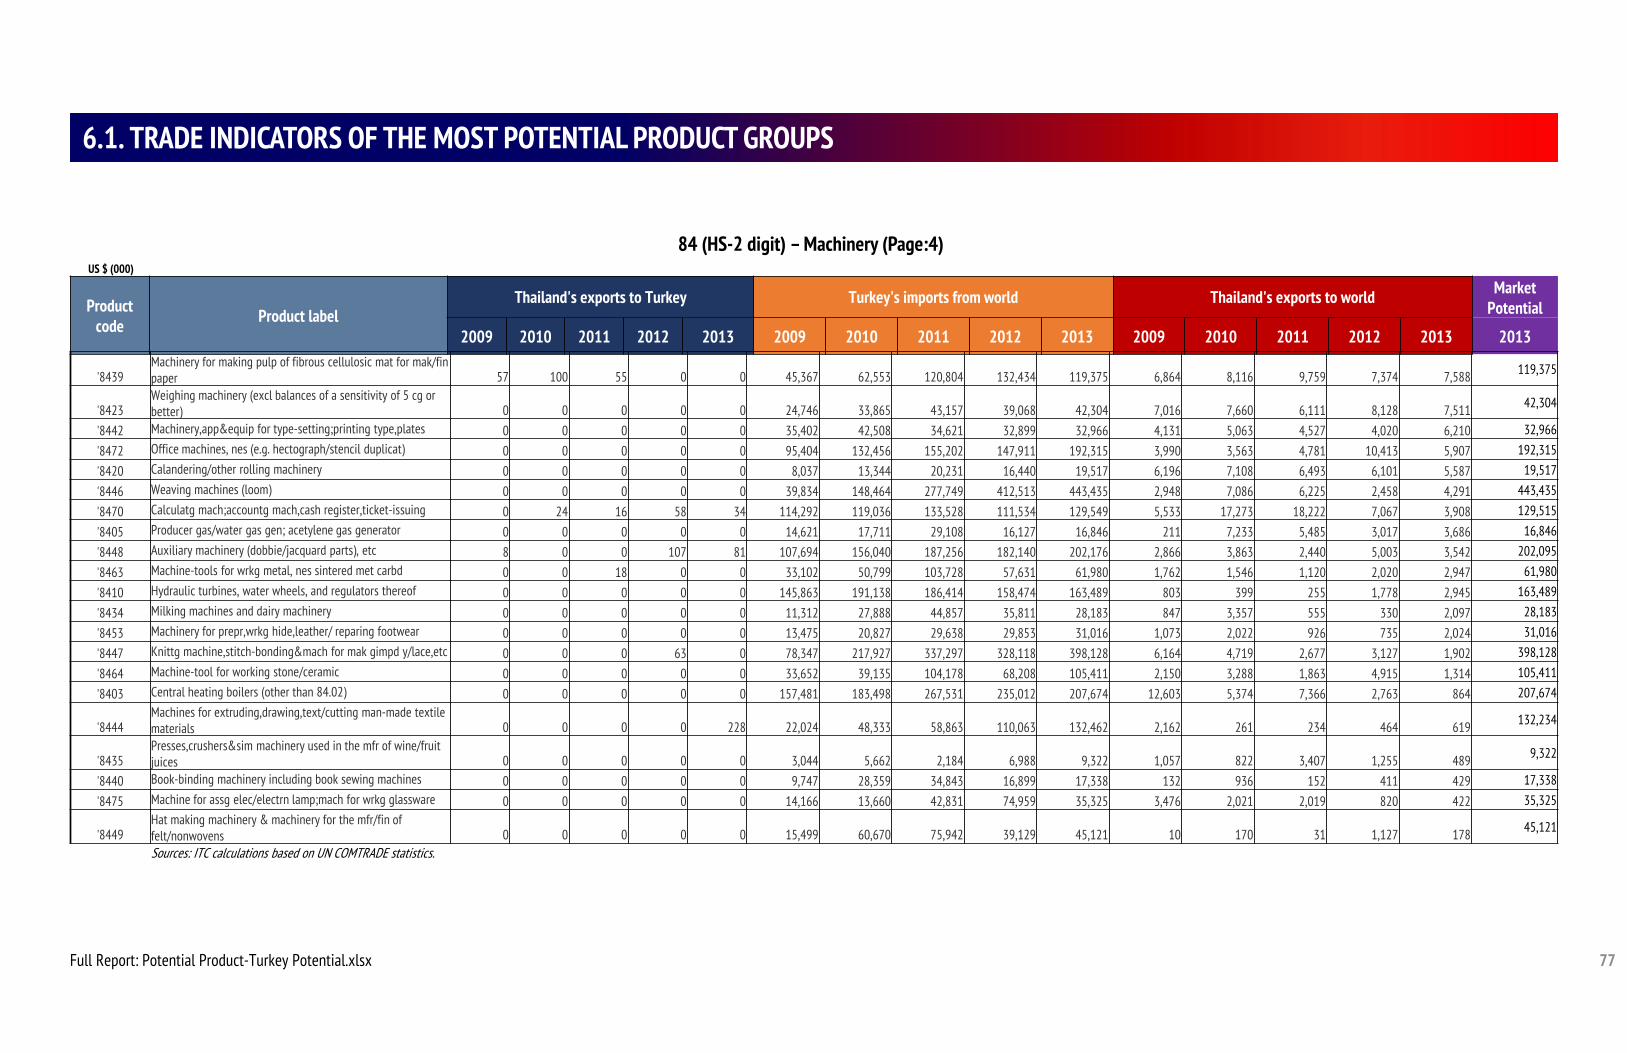
77
6.1. TRADE INDICATORS OF THE MOST POTENTIAL PRODUCT GROUPS
84 (HS-2 digit) – Machinery (Page:4)US $ (000)
Product code Product label
Thailand's exports to Turkey Turkey's imports from world Thailand's exports to world Market Potential
2009 2010 2011 2012 2013 2009 2010 2011 2012 2013 2009 2010 2011 2012 2013 2013
'8439Machinery for making pulp of fibrous cellulosic mat for mak/fin paper 57 100 55 0 0 45,367 62,553 120,804 132,434 119,375 6,864 8,116 9,759 7,374 7,588 119,375
'8423Weighing machinery (excl balances of a sensitivity of 5 cg or better) 0 0 0 0 0 24,746 33,865 43,157 39,068 42,304 7,016 7,660 6,111 8,128 7,511 42,304
'8442 Machinery,app&equip for type-setting;printing type,plates 0 0 0 0 0 35,402 42,508 34,621 32,899 32,966 4,131 5,063 4,527 4,020 6,210 32,966
'8472 Office machines, nes (e.g. hectograph/stencil duplicat) 0 0 0 0 0 95,404 132,456 155,202 147,911 192,315 3,990 3,563 4,781 10,413 5,907 192,315
'8420 Calandering/other rolling machinery 0 0 0 0 0 8,037 13,344 20,231 16,440 19,517 6,196 7,108 6,493 6,101 5,587 19,517
'8446 Weaving machines (loom) 0 0 0 0 0 39,834 148,464 277,749 412,513 443,435 2,948 7,086 6,225 2,458 4,291 443,435
'8470 Calculatg mach;accountg mach,cash register,ticket-issuing 0 24 16 58 34 114,292 119,036 133,528 111,534 129,549 5,533 17,273 18,222 7,067 3,908 129,515
'8405 Producer gas/water gas gen; acetylene gas generator 0 0 0 0 0 14,621 17,711 29,108 16,127 16,846 211 7,233 5,485 3,017 3,686 16,846
'8448 Auxiliary machinery (dobbie/jacquard parts), etc 8 0 0 107 81 107,694 156,040 187,256 182,140 202,176 2,866 3,863 2,440 5,003 3,542 202,095
'8463 Machine-tools for wrkg metal, nes sintered met carbd 0 0 18 0 0 33,102 50,799 103,728 57,631 61,980 1,762 1,546 1,120 2,020 2,947 61,980
'8410 Hydraulic turbines, water wheels, and regulators thereof 0 0 0 0 0 145,863 191,138 186,414 158,474 163,489 803 399 255 1,778 2,945 163,489
'8434 Milking machines and dairy machinery 0 0 0 0 0 11,312 27,888 44,857 35,811 28,183 847 3,357 555 330 2,097 28,183
'8453 Machinery for prepr,wrkg hide,leather/ reparing footwear 0 0 0 0 0 13,475 20,827 29,638 29,853 31,016 1,073 2,022 926 735 2,024 31,016
'8447 Knittg machine,stitch-bonding&mach for mak gimpd y/lace,etc 0 0 0 63 0 78,347 217,927 337,297 328,118 398,128 6,164 4,719 2,677 3,127 1,902 398,128
'8464 Machine-tool for working stone/ceramic 0 0 0 0 0 33,652 39,135 104,178 68,208 105,411 2,150 3,288 1,863 4,915 1,314 105,411
'8403 Central heating boilers (other than 84.02) 0 0 0 0 0 157,481 183,498 267,531 235,012 207,674 12,603 5,374 7,366 2,763 864 207,674
'8444Machines for extruding,drawing,text/cutting man-made textile materials 0 0 0 0 228 22,024 48,333 58,863 110,063 132,462 2,162 261 234 464 619 132,234
'8435Presses,crushers&sim machinery used in the mfr of wine/fruit juices 0 0 0 0 0 3,044 5,662 2,184 6,988 9,322 1,057 822 3,407 1,255 489 9,322
'8440 Book-binding machinery including book sewing machines 0 0 0 0 0 9,747 28,359 34,843 16,899 17,338 132 936 152 411 429 17,338
'8475 Machine for assg elec/electrn lamp;mach for wrkg glassware 0 0 0 0 0 14,166 13,660 42,831 74,959 35,325 3,476 2,021 2,019 820 422 35,325
'8449Hat making machinery & machinery for the mfr/fin of felt/nonwovens 0 0 0 0 0 15,499 60,670 75,942 39,129 45,121 10 170 31 1,127 178 45,121
Sources: ITC calculations based on UN COMTRADE statistics.
Full Report: Potential Product-Turkey Potential.xlsx
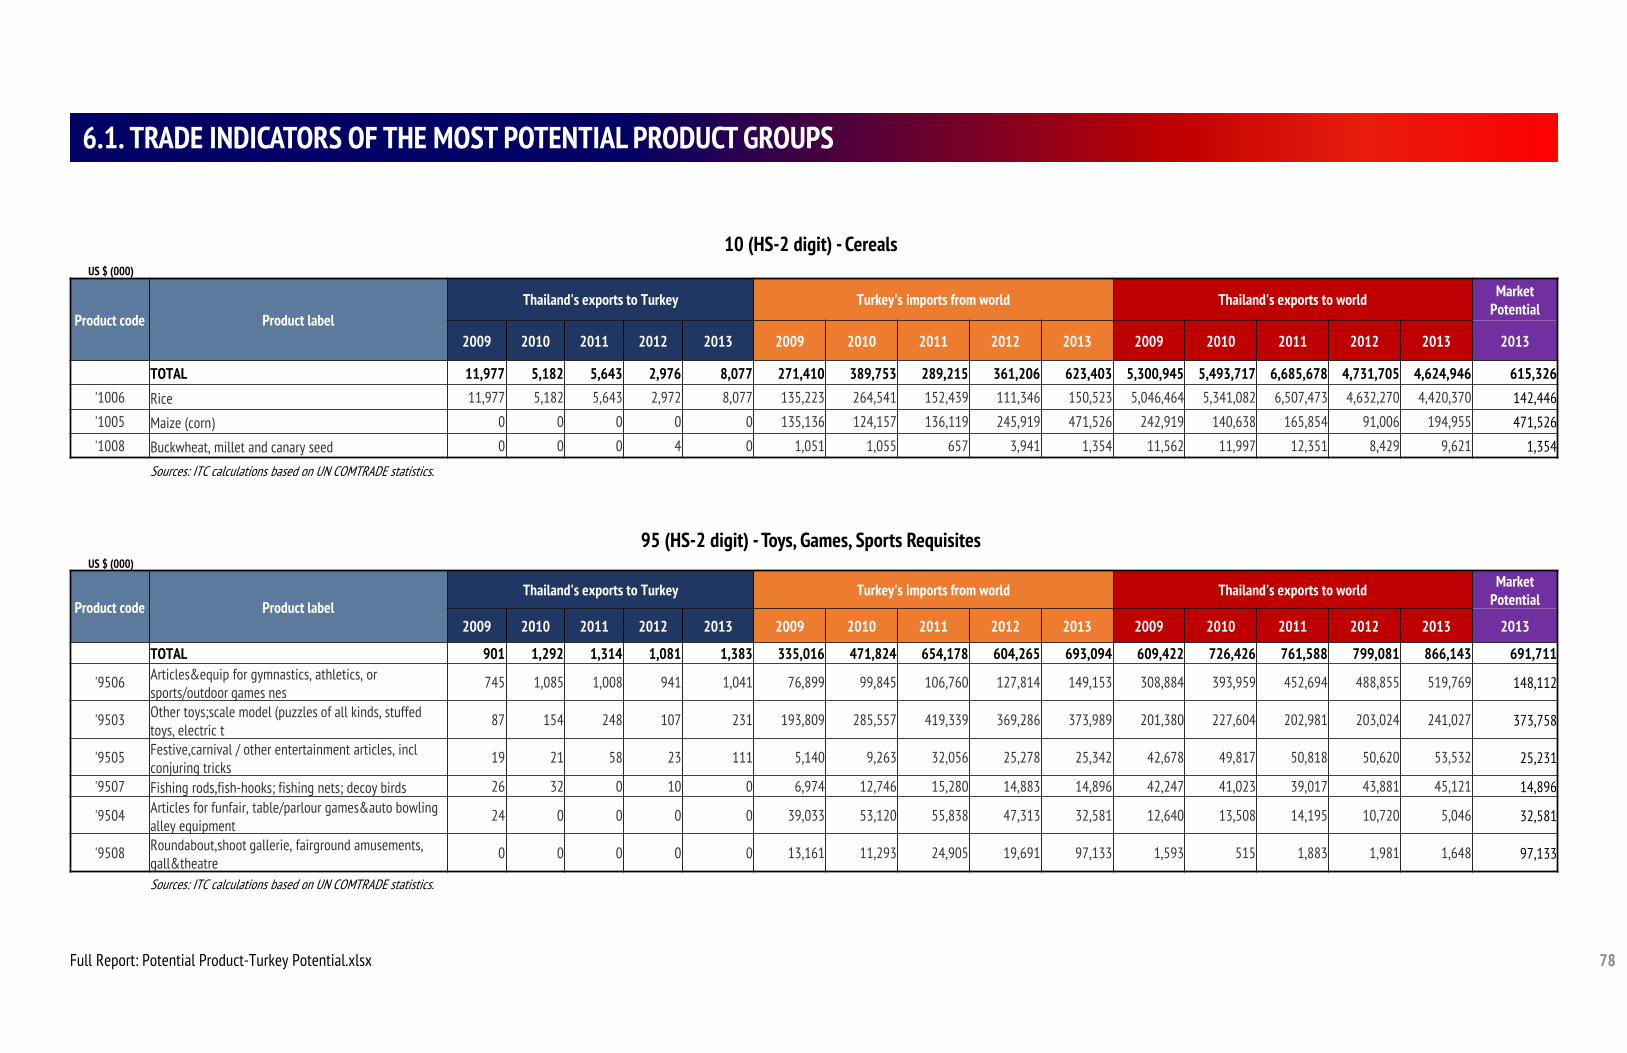
78
6.1. TRADE INDICATORS OF THE MOST POTENTIAL PRODUCT GROUPS
10 (HS-2 digit) - CerealsUS $ (000)
Product code Product labelThailand's exports to Turkey Turkey's imports from world Thailand's exports to world Market
Potential
2009 2010 2011 2012 2013 2009 2010 2011 2012 2013 2009 2010 2011 2012 2013 2013
TOTAL 11,977 5,182 5,643 2,976 8,077 271,410 389,753 289,215 361,206 623,403 5,300,945 5,493,717 6,685,678 4,731,705 4,624,946 615,326'1006 Rice 11,977 5,182 5,643 2,972 8,077 135,223 264,541 152,439 111,346 150,523 5,046,464 5,341,082 6,507,473 4,632,270 4,420,370 142,446
'1005 Maize (corn) 0 0 0 0 0 135,136 124,157 136,119 245,919 471,526 242,919 140,638 165,854 91,006 194,955 471,526
'1008 Buckwheat, millet and canary seed 0 0 0 4 0 1,051 1,055 657 3,941 1,354 11,562 11,997 12,351 8,429 9,621 1,354
Sources: ITC calculations based on UN COMTRADE statistics.
95 (HS-2 digit) - Toys, Games, Sports RequisitesUS $ (000)
Product code Product labelThailand's exports to Turkey Turkey's imports from world Thailand's exports to world Market
Potential
2009 2010 2011 2012 2013 2009 2010 2011 2012 2013 2009 2010 2011 2012 2013 2013
TOTAL 901 1,292 1,314 1,081 1,383 335,016 471,824 654,178 604,265 693,094 609,422 726,426 761,588 799,081 866,143 691,711
'9506 Articles&equip for gymnastics, athletics, or sports/outdoor games nes
745 1,085 1,008 941 1,041 76,899 99,845 106,760 127,814 149,153 308,884 393,959 452,694 488,855 519,769 148,112
'9503 Other toys;scale model (puzzles of all kinds, stuffed toys, electric t
87 154 248 107 231 193,809 285,557 419,339 369,286 373,989 201,380 227,604 202,981 203,024 241,027 373,758
'9505 Festive,carnival / other entertainment articles, incl conjuring tricks
19 21 58 23 111 5,140 9,263 32,056 25,278 25,342 42,678 49,817 50,818 50,620 53,532 25,231
'9507 Fishing rods,fish-hooks; fishing nets; decoy birds 26 32 0 10 0 6,974 12,746 15,280 14,883 14,896 42,247 41,023 39,017 43,881 45,121 14,896
'9504 Articles for funfair, table/parlour games&auto bowling alley equipment
24 0 0 0 0 39,033 53,120 55,838 47,313 32,581 12,640 13,508 14,195 10,720 5,046 32,581
'9508 Roundabout,shoot gallerie, fairground amusements, gall&theatre
0 0 0 0 0 13,161 11,293 24,905 19,691 97,133 1,593 515 1,883 1,981 1,648 97,133
Sources: ITC calculations based on UN COMTRADE statistics.
Full Report: Potential Product-Turkey Potential.xlsx
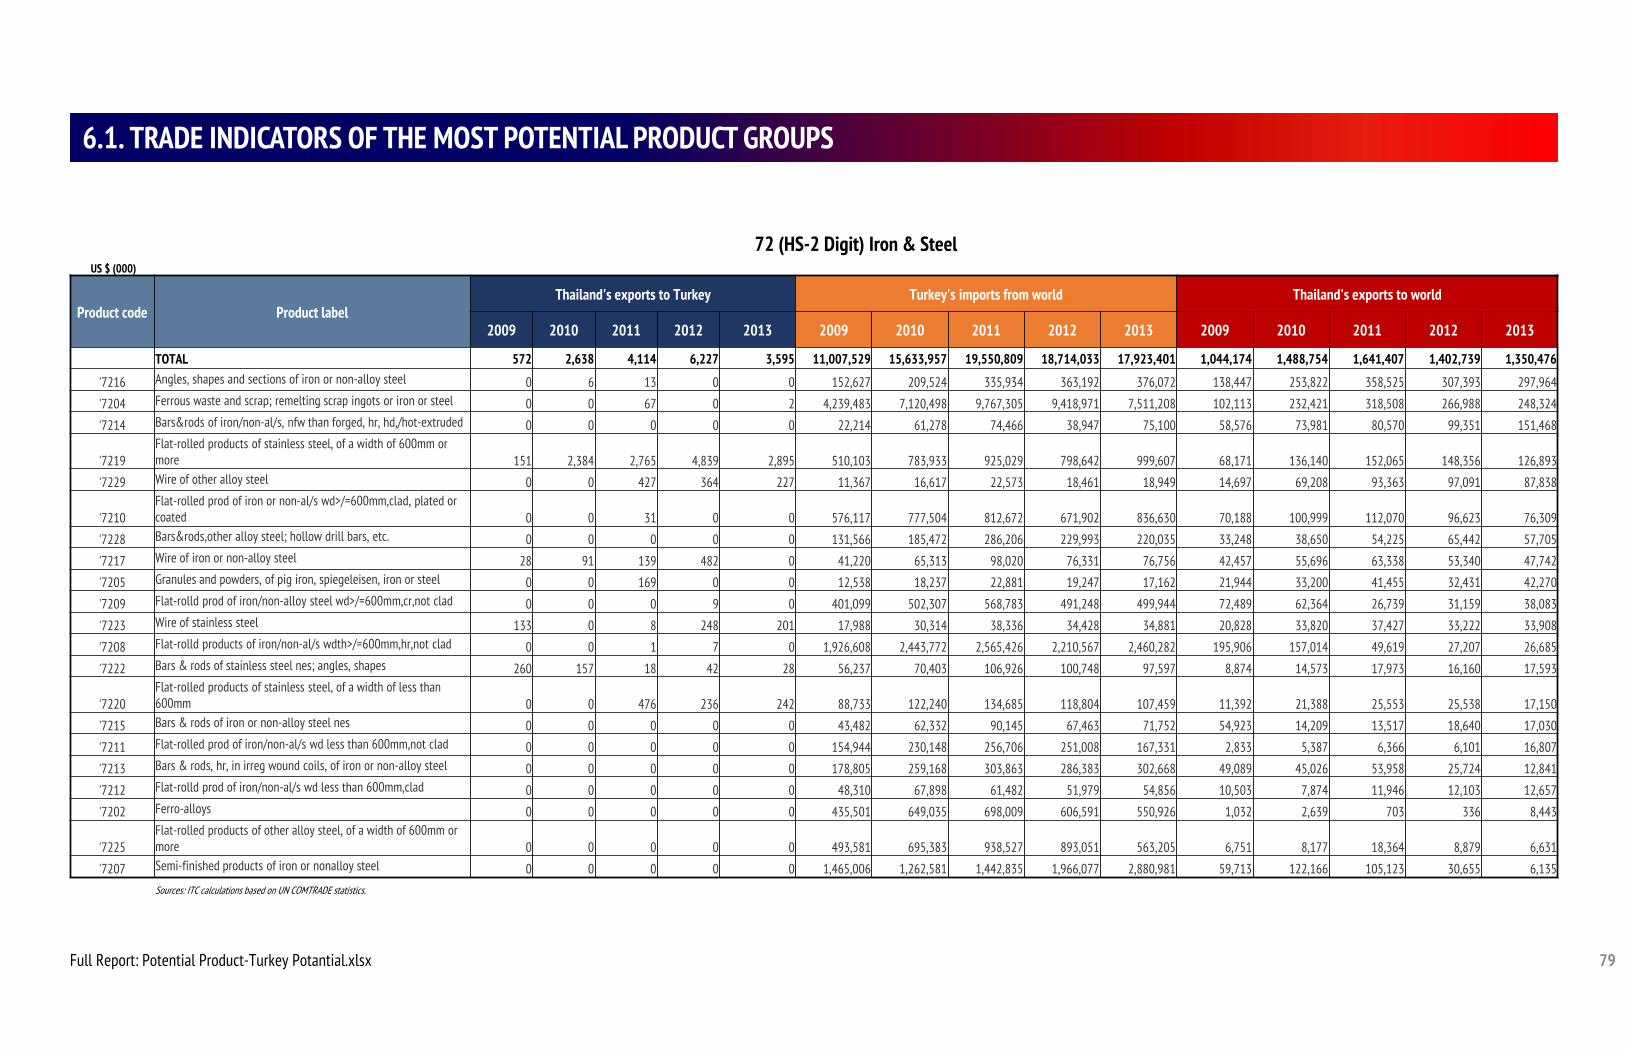
79
6.1. TRADE INDICATORS OF THE MOST POTENTIAL PRODUCT GROUPS
72 (HS-2 Digit) Iron & SteelUS $ (000)
Product code Product labelThailand's exports to Turkey Turkey's imports from world Thailand's exports to world
2009 2010 2011 2012 2013 2009 2010 2011 2012 2013 2009 2010 2011 2012 2013
TOTAL 572 2,638 4,114 6,227 3,595 11,007,529 15,633,957 19,550,809 18,714,033 17,923,401 1,044,174 1,488,754 1,641,407 1,402,739 1,350,476
'7216 Angles, shapes and sections of iron or non-alloy steel 0 6 13 0 0 152,627 209,524 335,934 363,192 376,072 138,447 253,822 358,525 307,393 297,964
'7204 Ferrous waste and scrap; remelting scrap ingots or iron or steel 0 0 67 0 2 4,239,483 7,120,498 9,767,305 9,418,971 7,511,208 102,113 232,421 318,508 266,988 248,324
'7214 Bars&rods of iron/non-al/s, nfw than forged, hr, hd,/hot-extruded 0 0 0 0 0 22,214 61,278 74,466 38,947 75,100 58,576 73,981 80,570 99,351 151,468
'7219Flat-rolled products of stainless steel, of a width of 600mm or more 151 2,384 2,765 4,839 2,895 510,103 783,933 925,029 798,642 999,607 68,171 136,140 152,065 148,356 126,893
'7229 Wire of other alloy steel 0 0 427 364 227 11,367 16,617 22,573 18,461 18,949 14,697 69,208 93,363 97,091 87,838
'7210Flat-rolled prod of iron or non-al/s wd>/=600mm,clad, plated or coated 0 0 31 0 0 576,117 777,504 812,672 671,902 836,630 70,188 100,999 112,070 96,623 76,309
'7228 Bars&rods,other alloy steel; hollow drill bars, etc. 0 0 0 0 0 131,566 185,472 286,206 229,993 220,035 33,248 38,650 54,225 65,442 57,705
'7217 Wire of iron or non-alloy steel 28 91 139 482 0 41,220 65,313 98,020 76,331 76,756 42,457 55,696 63,338 53,340 47,742
'7205 Granules and powders, of pig iron, spiegeleisen, iron or steel 0 0 169 0 0 12,538 18,237 22,881 19,247 17,162 21,944 33,200 41,455 32,431 42,270
'7209 Flat-rolld prod of iron/non-alloy steel wd>/=600mm,cr,not clad 0 0 0 9 0 401,099 502,307 568,783 491,248 499,944 72,489 62,364 26,739 31,159 38,083
'7223 Wire of stainless steel 133 0 8 248 201 17,988 30,314 38,336 34,428 34,881 20,828 33,820 37,427 33,222 33,908
'7208 Flat-rolld products of iron/non-al/s wdth>/=600mm,hr,not clad 0 0 1 7 0 1,926,608 2,443,772 2,565,426 2,210,567 2,460,282 195,906 157,014 49,619 27,207 26,685
'7222 Bars & rods of stainless steel nes; angles, shapes 260 157 18 42 28 56,237 70,403 106,926 100,748 97,597 8,874 14,573 17,973 16,160 17,593
'7220Flat-rolled products of stainless steel, of a width of less than 600mm 0 0 476 236 242 88,733 122,240 134,685 118,804 107,459 11,392 21,388 25,553 25,538 17,150
'7215 Bars & rods of iron or non-alloy steel nes 0 0 0 0 0 43,482 62,332 90,145 67,463 71,752 54,923 14,209 13,517 18,640 17,030
'7211 Flat-rolled prod of iron/non-al/s wd less than 600mm,not clad 0 0 0 0 0 154,944 230,148 256,706 251,008 167,331 2,833 5,387 6,366 6,101 16,807
'7213 Bars & rods, hr, in irreg wound coils, of iron or non-alloy steel 0 0 0 0 0 178,805 259,168 303,863 286,383 302,668 49,089 45,026 53,958 25,724 12,841
'7212 Flat-rolld prod of iron/non-al/s wd less than 600mm,clad 0 0 0 0 0 48,310 67,898 61,482 51,979 54,856 10,503 7,874 11,946 12,103 12,657
'7202 Ferro-alloys 0 0 0 0 0 435,501 649,035 698,009 606,591 550,926 1,032 2,639 703 336 8,443
'7225Flat-rolled products of other alloy steel, of a width of 600mm or more 0 0 0 0 0 493,581 695,383 938,527 893,051 563,205 6,751 8,177 18,364 8,879 6,631
'7207 Semi-finished products of iron or nonalloy steel 0 0 0 0 0 1,465,006 1,262,581 1,442,835 1,966,077 2,880,981 59,713 122,166 105,123 30,655 6,135Sources: ITC calculations based on UN COMTRADE statistics.
Full Report: Potential Product-Turkey Potantial.xlsx
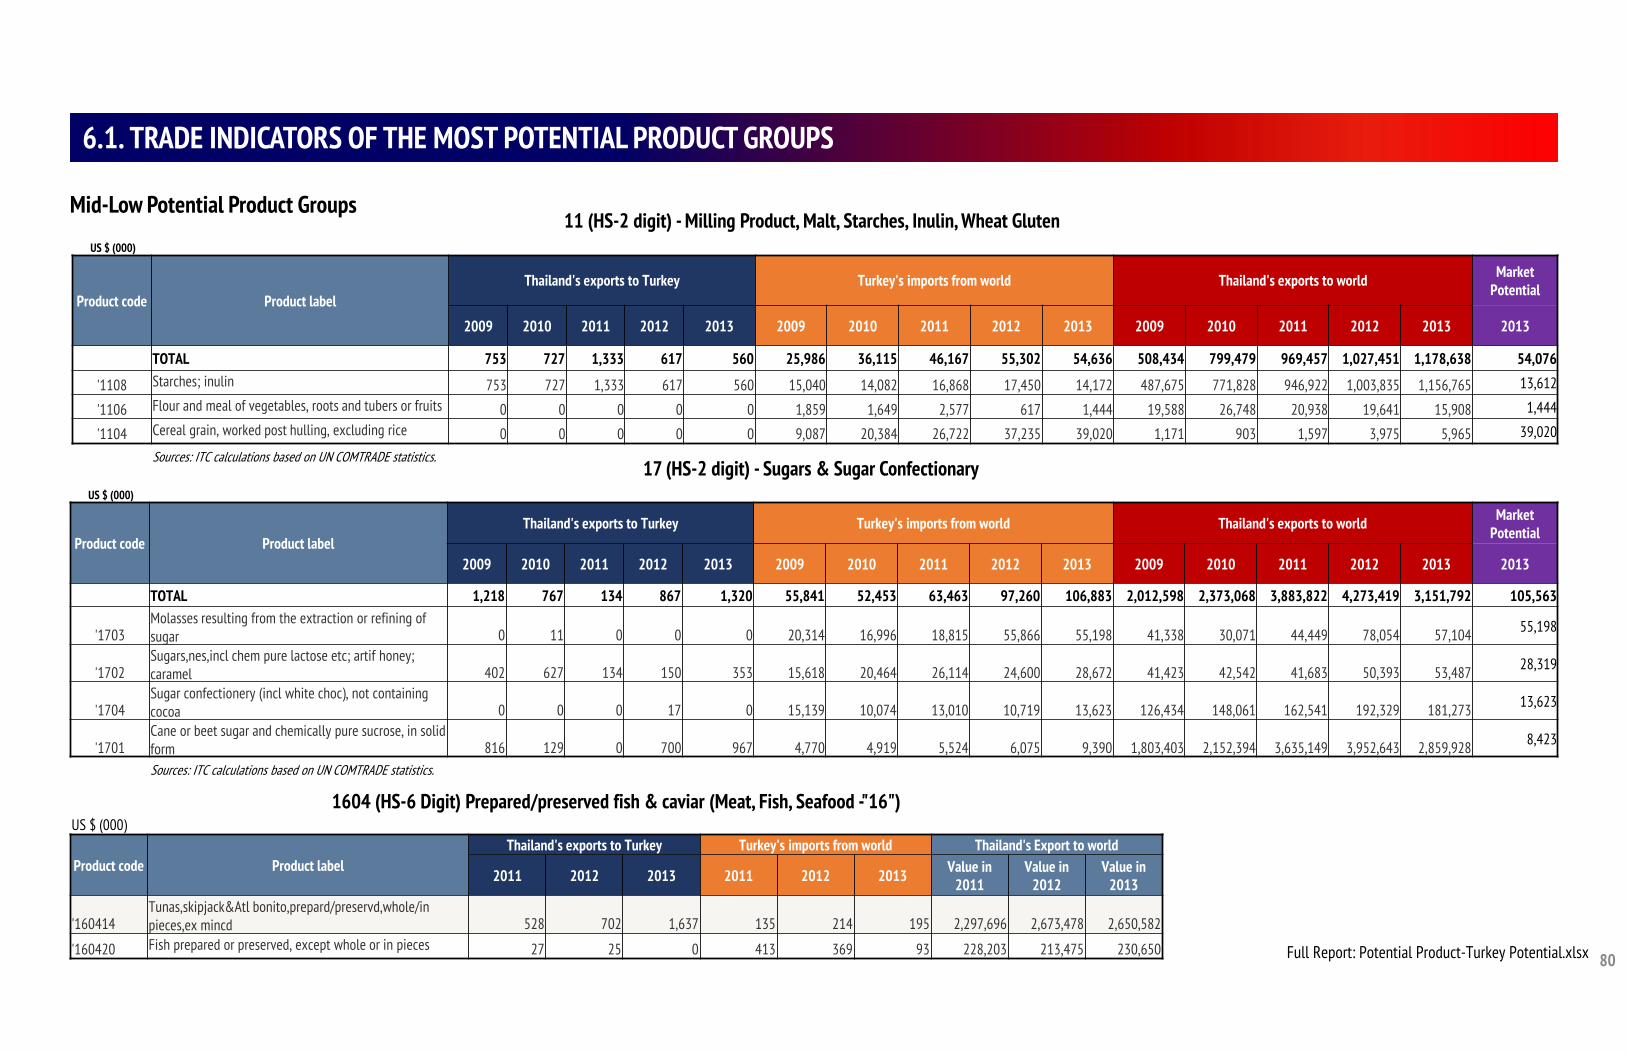
80
6.1. TRADE INDICATORS OF THE MOST POTENTIAL PRODUCT GROUPS
11 (HS-2 digit) - Milling Product, Malt, Starches, Inulin, Wheat GlutenUS $ (000)
Product code Product labelThailand's exports to Turkey Turkey's imports from world Thailand's exports to world Market
Potential
2009 2010 2011 2012 2013 2009 2010 2011 2012 2013 2009 2010 2011 2012 2013 2013
TOTAL 753 727 1,333 617 560 25,986 36,115 46,167 55,302 54,636 508,434 799,479 969,457 1,027,451 1,178,638 54,076
'1108 Starches; inulin 753 727 1,333 617 560 15,040 14,082 16,868 17,450 14,172 487,675 771,828 946,922 1,003,835 1,156,765 13,612
'1106 Flour and meal of vegetables, roots and tubers or fruits 0 0 0 0 0 1,859 1,649 2,577 617 1,444 19,588 26,748 20,938 19,641 15,908 1,444
'1104 Cereal grain, worked post hulling, excluding rice 0 0 0 0 0 9,087 20,384 26,722 37,235 39,020 1,171 903 1,597 3,975 5,965 39,020
Sources: ITC calculations based on UN COMTRADE statistics.17 (HS-2 digit) - Sugars & Sugar Confectionary
US $ (000)
Product code Product labelThailand's exports to Turkey Turkey's imports from world Thailand's exports to world Market
Potential
2009 2010 2011 2012 2013 2009 2010 2011 2012 2013 2009 2010 2011 2012 2013 2013
TOTAL 1,218 767 134 867 1,320 55,841 52,453 63,463 97,260 106,883 2,012,598 2,373,068 3,883,822 4,273,419 3,151,792 105,563
'1703Molasses resulting from the extraction or refining of sugar 0 11 0 0 0 20,314 16,996 18,815 55,866 55,198 41,338 30,071 44,449 78,054 57,104 55,198
'1702Sugars,nes,incl chem pure lactose etc; artif honey; caramel 402 627 134 150 353 15,618 20,464 26,114 24,600 28,672 41,423 42,542 41,683 50,393 53,487 28,319
'1704Sugar confectionery (incl white choc), not containing cocoa 0 0 0 17 0 15,139 10,074 13,010 10,719 13,623 126,434 148,061 162,541 192,329 181,273 13,623
'1701Cane or beet sugar and chemically pure sucrose, in solid form 816 129 0 700 967 4,770 4,919 5,524 6,075 9,390 1,803,403 2,152,394 3,635,149 3,952,643 2,859,928 8,423
Sources: ITC calculations based on UN COMTRADE statistics.
Mid-Low Potential Product Groups
Full Report: Potential Product-Turkey Potential.xlsx
1604 (HS-6 Digit) Prepared/preserved fish & caviar (Meat, Fish, Seafood -"16")US $ (000)
Product code Product labelThailand's exports to Turkey Turkey's imports from world Thailand's Export to world
2011 2012 2013 2011 2012 2013 Value in 2011
Value in 2012
Value in 2013
'160414Tunas,skipjack&Atl bonito,prepard/preservd,whole/in pieces,ex mincd 528 702 1,637 135 214 195 2,297,696 2,673,478 2,650,582
'160420 Fish prepared or preserved, except whole or in pieces 27 25 0 413 369 93 228,203 213,475 230,650

CONCLUSION
PART
82
6.1. CONCLUSION
This study aimed at identifying the most potential product groups which add incremental export volume to current Thailand’ export to Turkey. Explanatory research suggests product groups and sectors that have good potential for exports to Turkey as well as helping Thailand to diversify its current export basket.
Based on an augmented Export Potential Assessment methodology, I have selected 16 products with good prospects of export success in Turkish market. The selected product groups represent different industrial and agricultural products of Thailand’s.
In addition to presentation driven report, all related excel file which the study grounded on are also delivered to support further studies.
Findings of this report based ın United Nations UN Comtrade database and ITC which is the joint agency of the World Trade Organization and the United Nations methodologies and analysis. The study has not truly inclusive of the effect of tariffs and local market dynamics which requires different approach and data set.
Understanding the structure and evolution of international markets is essential for both firms and trade support institutions which need to identify which sectors and partner countries to prioritize and which development strategies to focus on. Detailed analysis of trade statistics helps them gauge a country’s competitiveness and identify priority products and export markets. However, export development strategies need more than that for effective launch or sustainable market establishment.
The Author hopes that the study will contribute to the trade support institutions of Thailand to create better opportunities for Thai Exporters and to add value to Thai Business success.
September 2014

APPENDIX
PART
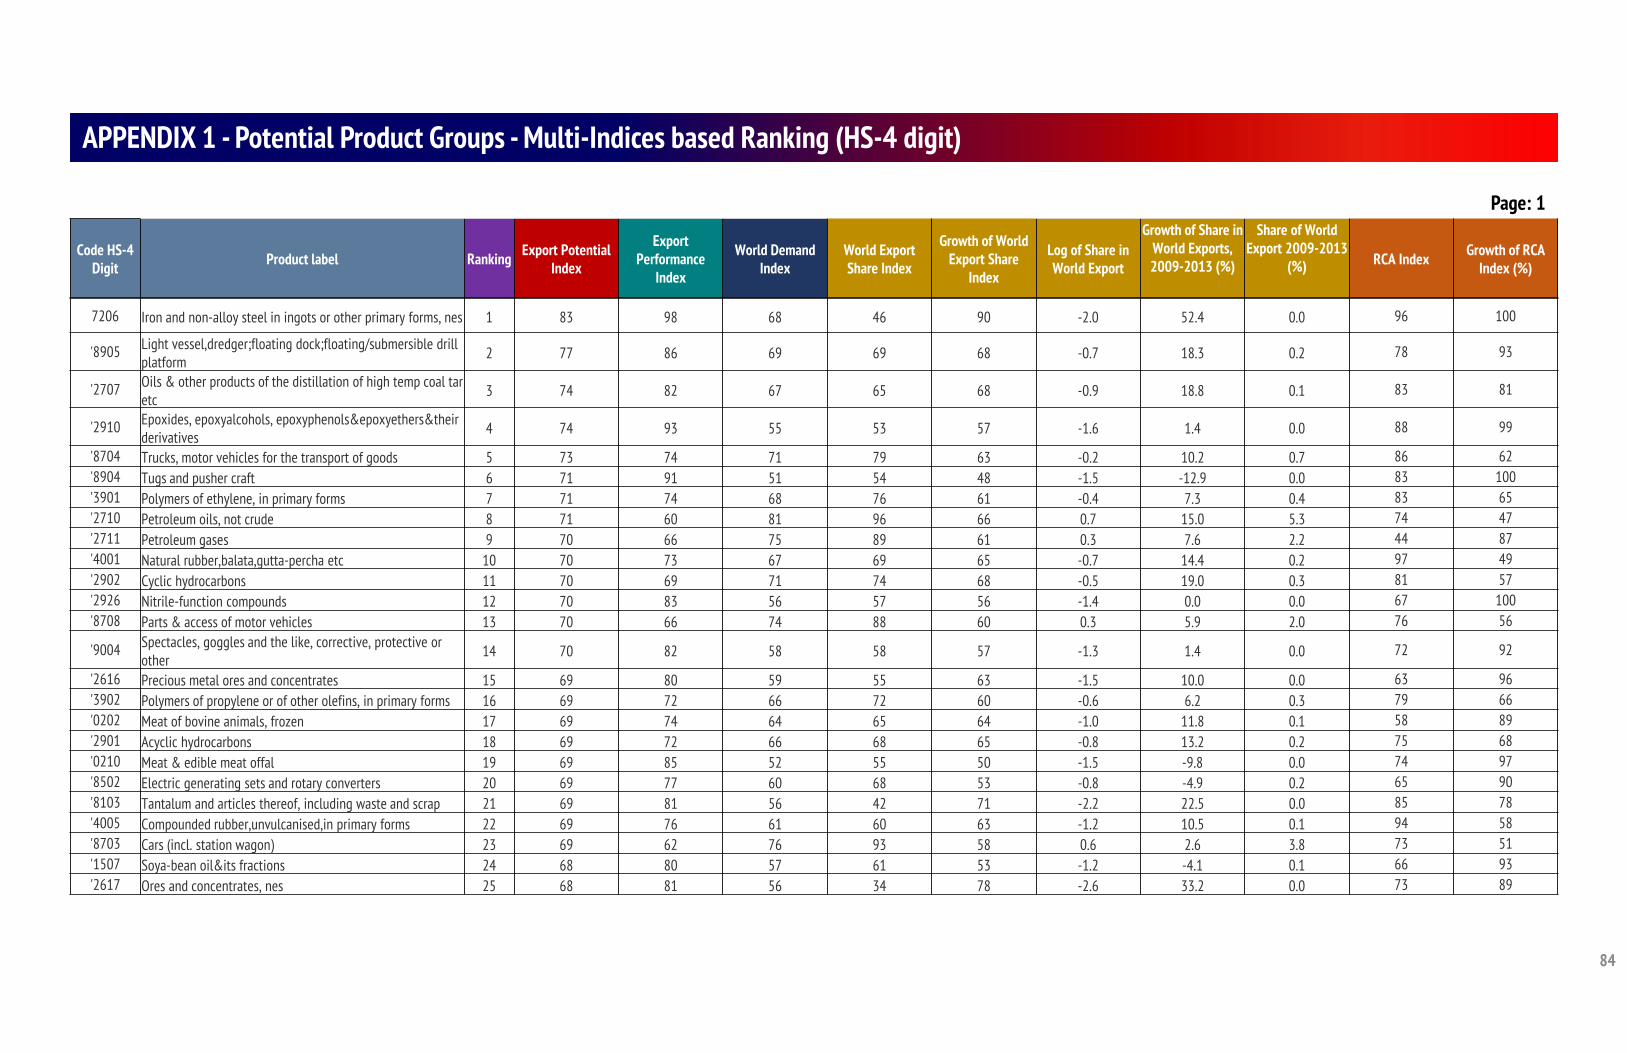
84
APPENDIX 1 - Potential Product Groups - Multi-Indices based Ranking (HS-4 digit)
Code HS-4 Digit Product label Ranking Export Potential
Index
Export Performance
Index
World Demand Index
World Export Share Index
Growth of World Export Share
Index
Log of Share in World Export
Growth of Share in World Exports, 2009-2013 (%)
Share of World Export 2009-2013
(%) RCA Index Growth of RCA Index (%)
Page: 1
7206 Iron and non-alloy steel in ingots or other primary forms, nes 1 83 98 68 46 90 -2.0 52.4 0.0 96 100
'8905 Light vessel,dredger;floating dock;floating/submersible drill platform 2 77 86 69 69 68 -0.7 18.3 0.2 78 93
'2707 Oils & other products of the distillation of high temp coal tar etc 3 74 82 67 65 68 -0.9 18.8 0.1 83 81
'2910 Epoxides, epoxyalcohols, epoxyphenols&epoxyethers&their derivatives 4 74 93 55 53 57 -1.6 1.4 0.0 88 99
'8704 Trucks, motor vehicles for the transport of goods 5 73 74 71 79 63 -0.2 10.2 0.7 86 62'8904 Tugs and pusher craft 6 71 91 51 54 48 -1.5 -12.9 0.0 83 100'3901 Polymers of ethylene, in primary forms 7 71 74 68 76 61 -0.4 7.3 0.4 83 65'2710 Petroleum oils, not crude 8 71 60 81 96 66 0.7 15.0 5.3 74 47'2711 Petroleum gases 9 70 66 75 89 61 0.3 7.6 2.2 44 87'4001 Natural rubber,balata,gutta-percha etc 10 70 73 67 69 65 -0.7 14.4 0.2 97 49'2902 Cyclic hydrocarbons 11 70 69 71 74 68 -0.5 19.0 0.3 81 57'2926 Nitrile-function compounds 12 70 83 56 57 56 -1.4 0.0 0.0 67 100'8708 Parts & access of motor vehicles 13 70 66 74 88 60 0.3 5.9 2.0 76 56
'9004 Spectacles, goggles and the like, corrective, protective or other 14 70 82 58 58 57 -1.3 1.4 0.0 72 92
'2616 Precious metal ores and concentrates 15 69 80 59 55 63 -1.5 10.0 0.0 63 96'3902 Polymers of propylene or of other olefins, in primary forms 16 69 72 66 72 60 -0.6 6.2 0.3 79 66'0202 Meat of bovine animals, frozen 17 69 74 64 65 64 -1.0 11.8 0.1 58 89'2901 Acyclic hydrocarbons 18 69 72 66 68 65 -0.8 13.2 0.2 75 68'0210 Meat & edible meat offal 19 69 85 52 55 50 -1.5 -9.8 0.0 74 97'8502 Electric generating sets and rotary converters 20 69 77 60 68 53 -0.8 -4.9 0.2 65 90'8103 Tantalum and articles thereof, including waste and scrap 21 69 81 56 42 71 -2.2 22.5 0.0 85 78'4005 Compounded rubber,unvulcanised,in primary forms 22 69 76 61 60 63 -1.2 10.5 0.1 94 58'8703 Cars (incl. station wagon) 23 69 62 76 93 58 0.6 2.6 3.8 73 51'1507 Soya-bean oil&its fractions 24 68 80 57 61 53 -1.2 -4.1 0.1 66 93'2617 Ores and concentrates, nes 25 68 81 56 34 78 -2.6 33.2 0.0 73 89
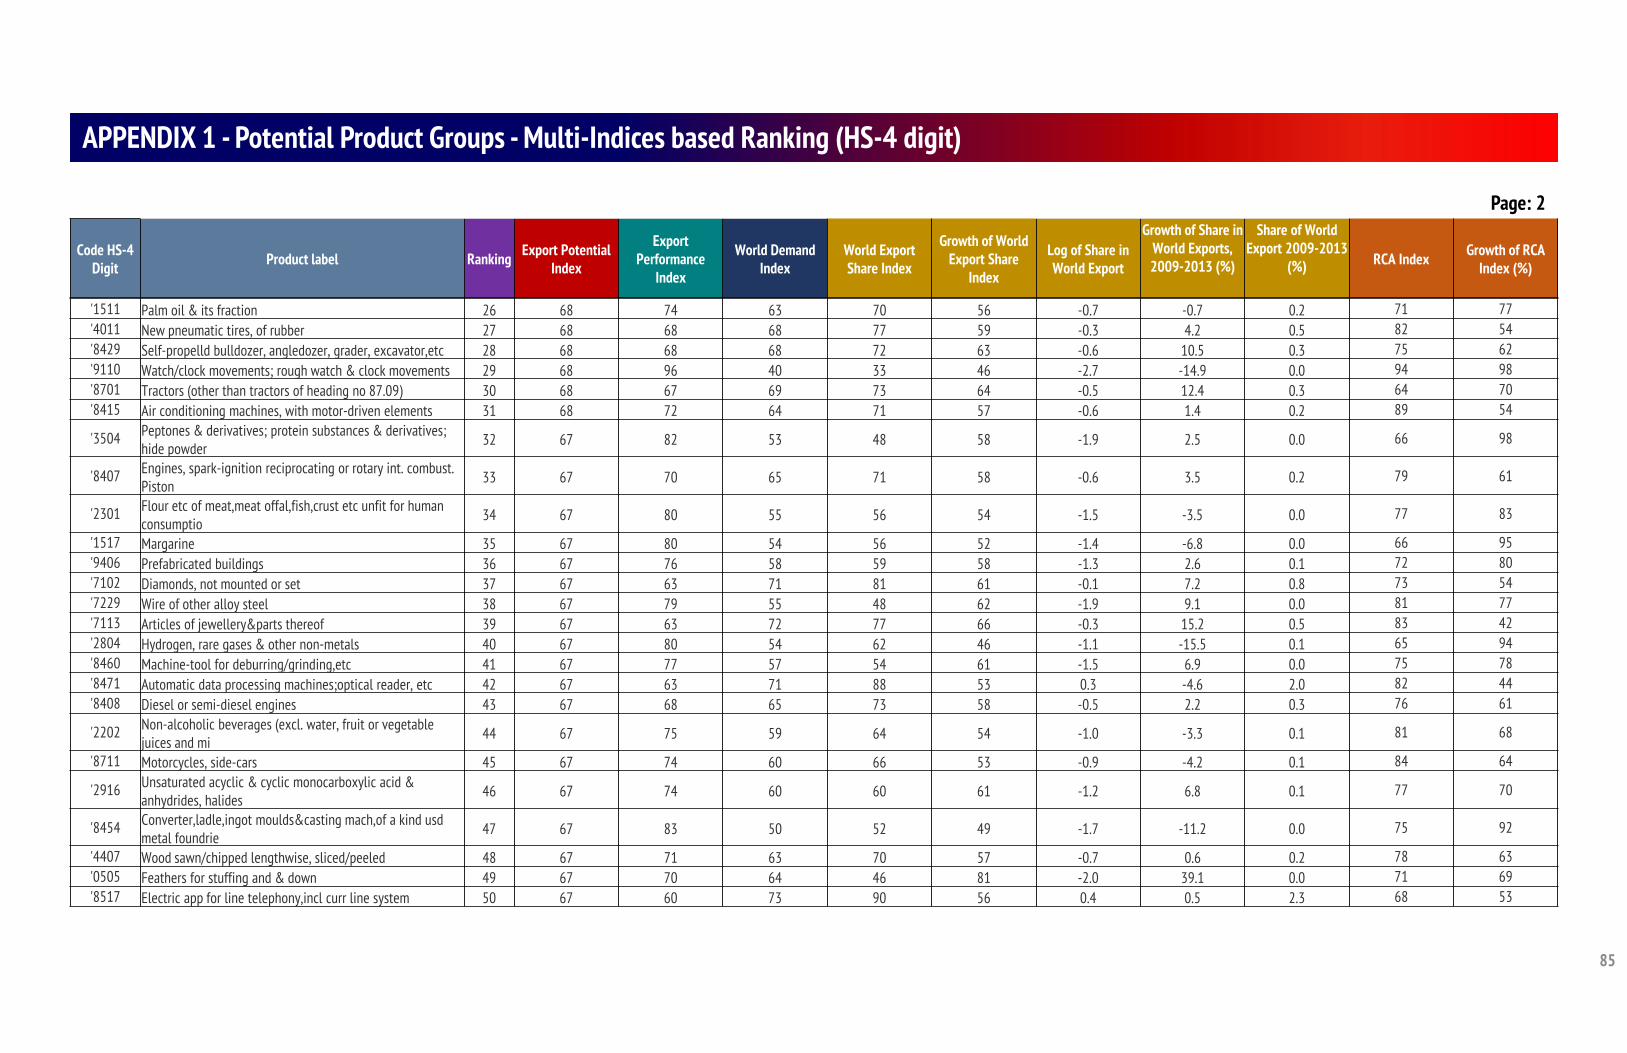
85
APPENDIX 1 - Potential Product Groups - Multi-Indices based Ranking (HS-4 digit)
Code HS-4 Digit Product label Ranking Export Potential
Index
Export Performance
Index
World Demand Index
World Export Share Index
Growth of World Export Share
Index
Log of Share in World Export
Growth of Share in World Exports, 2009-2013 (%)
Share of World Export 2009-2013
(%) RCA Index Growth of RCA Index (%)
Page: 2
'1511 Palm oil & its fraction 26 68 74 63 70 56 -0.7 -0.7 0.2 71 77'4011 New pneumatic tires, of rubber 27 68 68 68 77 59 -0.3 4.2 0.5 82 54'8429 Self-propelld bulldozer, angledozer, grader, excavator,etc 28 68 68 68 72 63 -0.6 10.5 0.3 75 62'9110 Watch/clock movements; rough watch & clock movements 29 68 96 40 33 46 -2.7 -14.9 0.0 94 98'8701 Tractors (other than tractors of heading no 87.09) 30 68 67 69 73 64 -0.5 12.4 0.3 64 70'8415 Air conditioning machines, with motor-driven elements 31 68 72 64 71 57 -0.6 1.4 0.2 89 54
'3504 Peptones & derivatives; protein substances & derivatives; hide powder 32 67 82 53 48 58 -1.9 2.5 0.0 66 98
'8407 Engines, spark-ignition reciprocating or rotary int. combust. Piston 33 67 70 65 71 58 -0.6 3.5 0.2 79 61
'2301 Flour etc of meat,meat offal,fish,crust etc unfit for human consumptio 34 67 80 55 56 54 -1.5 -3.5 0.0 77 83
'1517 Margarine 35 67 80 54 56 52 -1.4 -6.8 0.0 66 95'9406 Prefabricated buildings 36 67 76 58 59 58 -1.3 2.6 0.1 72 80'7102 Diamonds, not mounted or set 37 67 63 71 81 61 -0.1 7.2 0.8 73 54'7229 Wire of other alloy steel 38 67 79 55 48 62 -1.9 9.1 0.0 81 77'7113 Articles of jewellery&parts thereof 39 67 63 72 77 66 -0.3 15.2 0.5 83 42'2804 Hydrogen, rare gases & other non-metals 40 67 80 54 62 46 -1.1 -15.5 0.1 65 94'8460 Machine-tool for deburring/grinding,etc 41 67 77 57 54 61 -1.5 6.9 0.0 75 78'8471 Automatic data processing machines;optical reader, etc 42 67 63 71 88 53 0.3 -4.6 2.0 82 44'8408 Diesel or semi-diesel engines 43 67 68 65 73 58 -0.5 2.2 0.3 76 61
'2202 Non-alcoholic beverages (excl. water, fruit or vegetable juices and mi 44 67 75 59 64 54 -1.0 -3.3 0.1 81 68
'8711 Motorcycles, side-cars 45 67 74 60 66 53 -0.9 -4.2 0.1 84 64
'2916 Unsaturated acyclic & cyclic monocarboxylic acid & anhydrides, halides 46 67 74 60 60 61 -1.2 6.8 0.1 77 70
'8454 Converter,ladle,ingot moulds&casting mach,of a kind usd metal foundrie 47 67 83 50 52 49 -1.7 -11.2 0.0 75 92
'4407 Wood sawn/chipped lengthwise, sliced/peeled 48 67 71 63 70 57 -0.7 0.6 0.2 78 63'0505 Feathers for stuffing and & down 49 67 70 64 46 81 -2.0 39.1 0.0 71 69'8517 Electric app for line telephony,incl curr line system 50 67 60 73 90 56 0.4 0.5 2.3 68 53
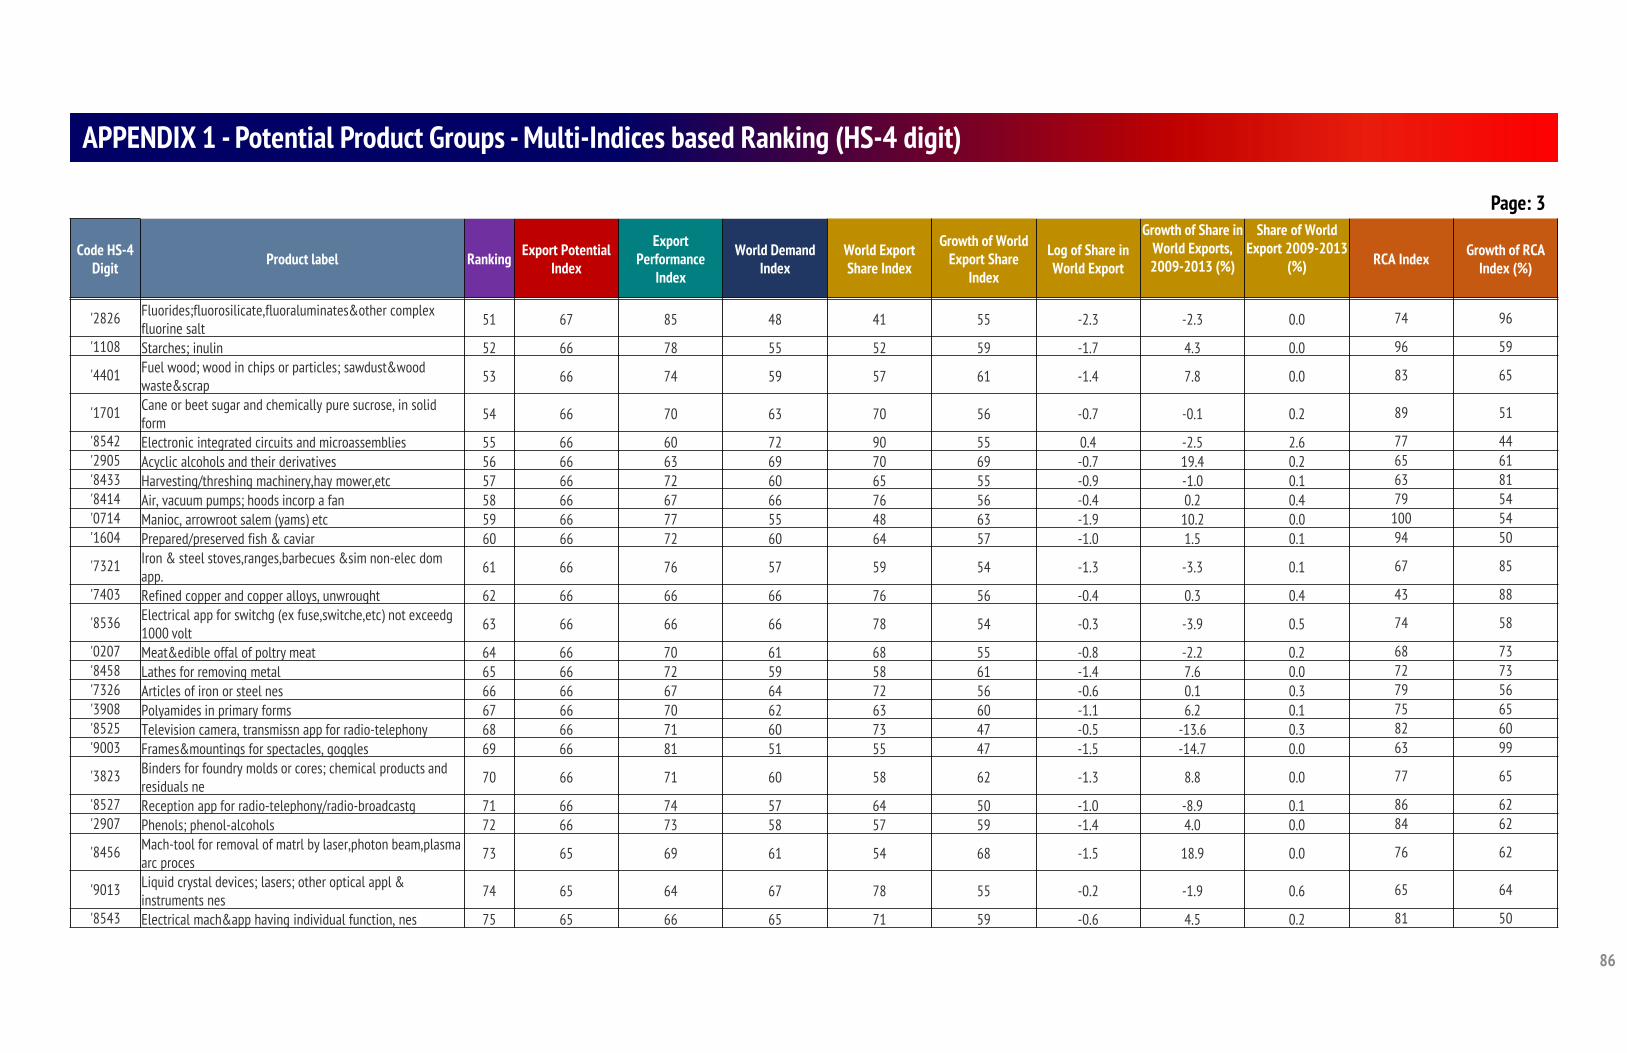
86
APPENDIX 1 - Potential Product Groups - Multi-Indices based Ranking (HS-4 digit)
Code HS-4 Digit Product label Ranking Export Potential
Index
Export Performance
Index
World Demand Index
World Export Share Index
Growth of World Export Share
Index
Log of Share in World Export
Growth of Share in World Exports, 2009-2013 (%)
Share of World Export 2009-2013
(%) RCA Index Growth of RCA Index (%)
Page: 3
'2826 Fluorides;fluorosilicate,fluoraluminates&other complex fluorine salt 51 67 85 48 41 55 -2.3 -2.3 0.0 74 96
'1108 Starches; inulin 52 66 78 55 52 59 -1.7 4.3 0.0 96 59
'4401 Fuel wood; wood in chips or particles; sawdust&wood waste&scrap 53 66 74 59 57 61 -1.4 7.8 0.0 83 65
'1701 Cane or beet sugar and chemically pure sucrose, in solid form 54 66 70 63 70 56 -0.7 -0.1 0.2 89 51
'8542 Electronic integrated circuits and microassemblies 55 66 60 72 90 55 0.4 -2.5 2.6 77 44'2905 Acyclic alcohols and their derivatives 56 66 63 69 70 69 -0.7 19.4 0.2 65 61'8433 Harvesting/threshing machinery,hay mower,etc 57 66 72 60 65 55 -0.9 -1.0 0.1 63 81'8414 Air, vacuum pumps; hoods incorp a fan 58 66 67 66 76 56 -0.4 0.2 0.4 79 54'0714 Manioc, arrowroot salem (yams) etc 59 66 77 55 48 63 -1.9 10.2 0.0 100 54'1604 Prepared/preserved fish & caviar 60 66 72 60 64 57 -1.0 1.5 0.1 94 50
'7321 Iron & steel stoves,ranges,barbecues &sim non-elec dom app. 61 66 76 57 59 54 -1.3 -3.3 0.1 67 85
'7403 Refined copper and copper alloys, unwrought 62 66 66 66 76 56 -0.4 0.3 0.4 43 88
'8536 Electrical app for switchg (ex fuse,switche,etc) not exceedg 1000 volt 63 66 66 66 78 54 -0.3 -3.9 0.5 74 58
'0207 Meat&edible offal of poltry meat 64 66 70 61 68 55 -0.8 -2.2 0.2 68 73'8458 Lathes for removing metal 65 66 72 59 58 61 -1.4 7.6 0.0 72 73'7326 Articles of iron or steel nes 66 66 67 64 72 56 -0.6 0.1 0.3 79 56'3908 Polyamides in primary forms 67 66 70 62 63 60 -1.1 6.2 0.1 75 65'8525 Television camera, transmissn app for radio-telephony 68 66 71 60 73 47 -0.5 -13.6 0.3 82 60'9003 Frames&mountings for spectacles, goggles 69 66 81 51 55 47 -1.5 -14.7 0.0 63 99
'3823 Binders for foundry molds or cores; chemical products and residuals ne 70 66 71 60 58 62 -1.3 8.8 0.0 77 65
'8527 Reception app for radio-telephony/radio-broadcastg 71 66 74 57 64 50 -1.0 -8.9 0.1 86 62'2907 Phenols; phenol-alcohols 72 66 73 58 57 59 -1.4 4.0 0.0 84 62
'8456 Mach-tool for removal of matrl by laser,photon beam,plasma arc proces 73 65 69 61 54 68 -1.5 18.9 0.0 76 62
'9013 Liquid crystal devices; lasers; other optical appl & instruments nes 74 65 64 67 78 55 -0.2 -1.9 0.6 65 64
'8543 Electrical mach&app having individual function, nes 75 65 66 65 71 59 -0.6 4.5 0.2 81 50
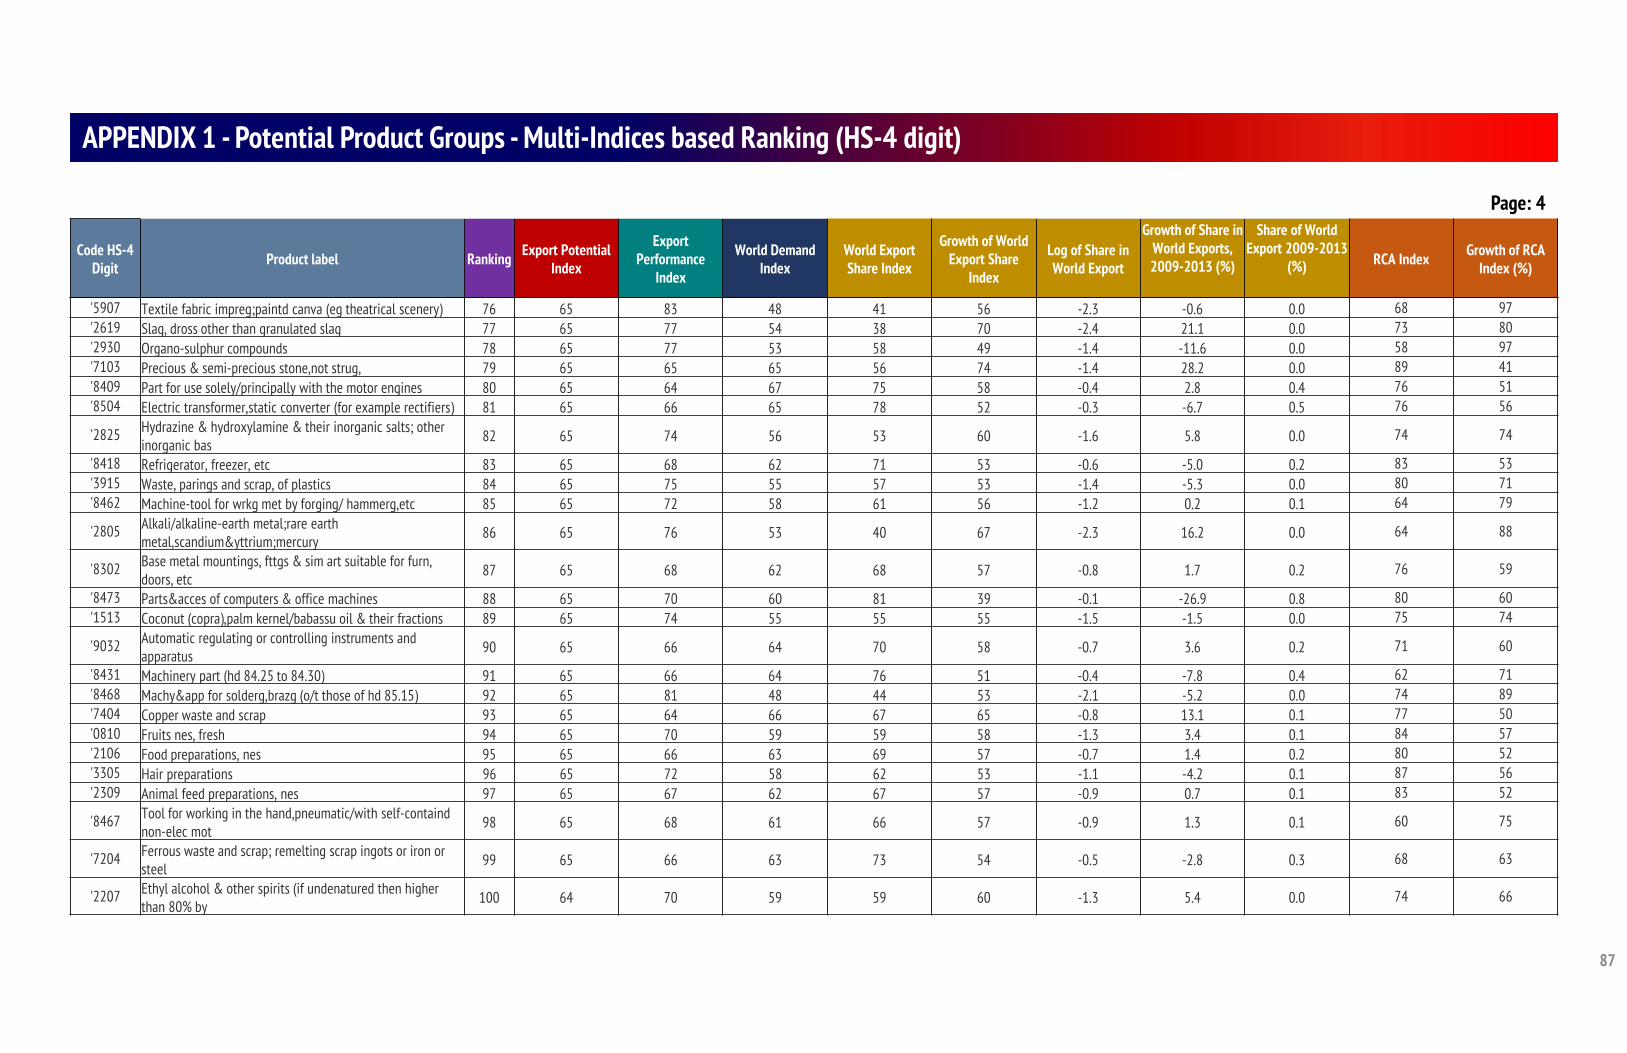
87
APPENDIX 1 - Potential Product Groups - Multi-Indices based Ranking (HS-4 digit)
Code HS-4 Digit Product label Ranking Export Potential
Index
Export Performance
Index
World Demand Index
World Export Share Index
Growth of World Export Share
Index
Log of Share in World Export
Growth of Share in World Exports, 2009-2013 (%)
Share of World Export 2009-2013
(%) RCA Index Growth of RCA Index (%)
Page: 4
'5907 Textile fabric impreg;paintd canva (eg theatrical scenery) 76 65 83 48 41 56 -2.3 -0.6 0.0 68 97'2619 Slag, dross other than granulated slag 77 65 77 54 38 70 -2.4 21.1 0.0 73 80'2930 Organo-sulphur compounds 78 65 77 53 58 49 -1.4 -11.6 0.0 58 97'7103 Precious & semi-precious stone,not strug, 79 65 65 65 56 74 -1.4 28.2 0.0 89 41'8409 Part for use solely/principally with the motor engines 80 65 64 67 75 58 -0.4 2.8 0.4 76 51'8504 Electric transformer,static converter (for example rectifiers) 81 65 66 65 78 52 -0.3 -6.7 0.5 76 56
'2825 Hydrazine & hydroxylamine & their inorganic salts; other inorganic bas 82 65 74 56 53 60 -1.6 5.8 0.0 74 74
'8418 Refrigerator, freezer, etc 83 65 68 62 71 53 -0.6 -5.0 0.2 83 53'3915 Waste, parings and scrap, of plastics 84 65 75 55 57 53 -1.4 -5.3 0.0 80 71'8462 Machine-tool for wrkg met by forging/ hammerg,etc 85 65 72 58 61 56 -1.2 0.2 0.1 64 79
'2805 Alkali/alkaline-earth metal;rare earth metal,scandium&yttrium;mercury 86 65 76 53 40 67 -2.3 16.2 0.0 64 88
'8302 Base metal mountings, fttgs & sim art suitable for furn, doors, etc 87 65 68 62 68 57 -0.8 1.7 0.2 76 59
'8473 Parts&acces of computers & office machines 88 65 70 60 81 39 -0.1 -26.9 0.8 80 60'1513 Coconut (copra),palm kernel/babassu oil & their fractions 89 65 74 55 55 55 -1.5 -1.5 0.0 75 74
'9032 Automatic regulating or controlling instruments and apparatus 90 65 66 64 70 58 -0.7 3.6 0.2 71 60
'8431 Machinery part (hd 84.25 to 84.30) 91 65 66 64 76 51 -0.4 -7.8 0.4 62 71'8468 Machy&app for solderg,brazg (o/t those of hd 85.15) 92 65 81 48 44 53 -2.1 -5.2 0.0 74 89'7404 Copper waste and scrap 93 65 64 66 67 65 -0.8 13.1 0.1 77 50'0810 Fruits nes, fresh 94 65 70 59 59 58 -1.3 3.4 0.1 84 57'2106 Food preparations, nes 95 65 66 63 69 57 -0.7 1.4 0.2 80 52'3305 Hair preparations 96 65 72 58 62 53 -1.1 -4.2 0.1 87 56'2309 Animal feed preparations, nes 97 65 67 62 67 57 -0.9 0.7 0.1 83 52
'8467 Tool for working in the hand,pneumatic/with self-containd non-elec mot 98 65 68 61 66 57 -0.9 1.3 0.1 60 75
'7204 Ferrous waste and scrap; remelting scrap ingots or iron or steel 99 65 66 63 73 54 -0.5 -2.8 0.3 68 63
'2207 Ethyl alcohol & other spirits (if undenatured then higher than 80% by 100 64 70 59 59 60 -1.3 5.4 0.0 74 66
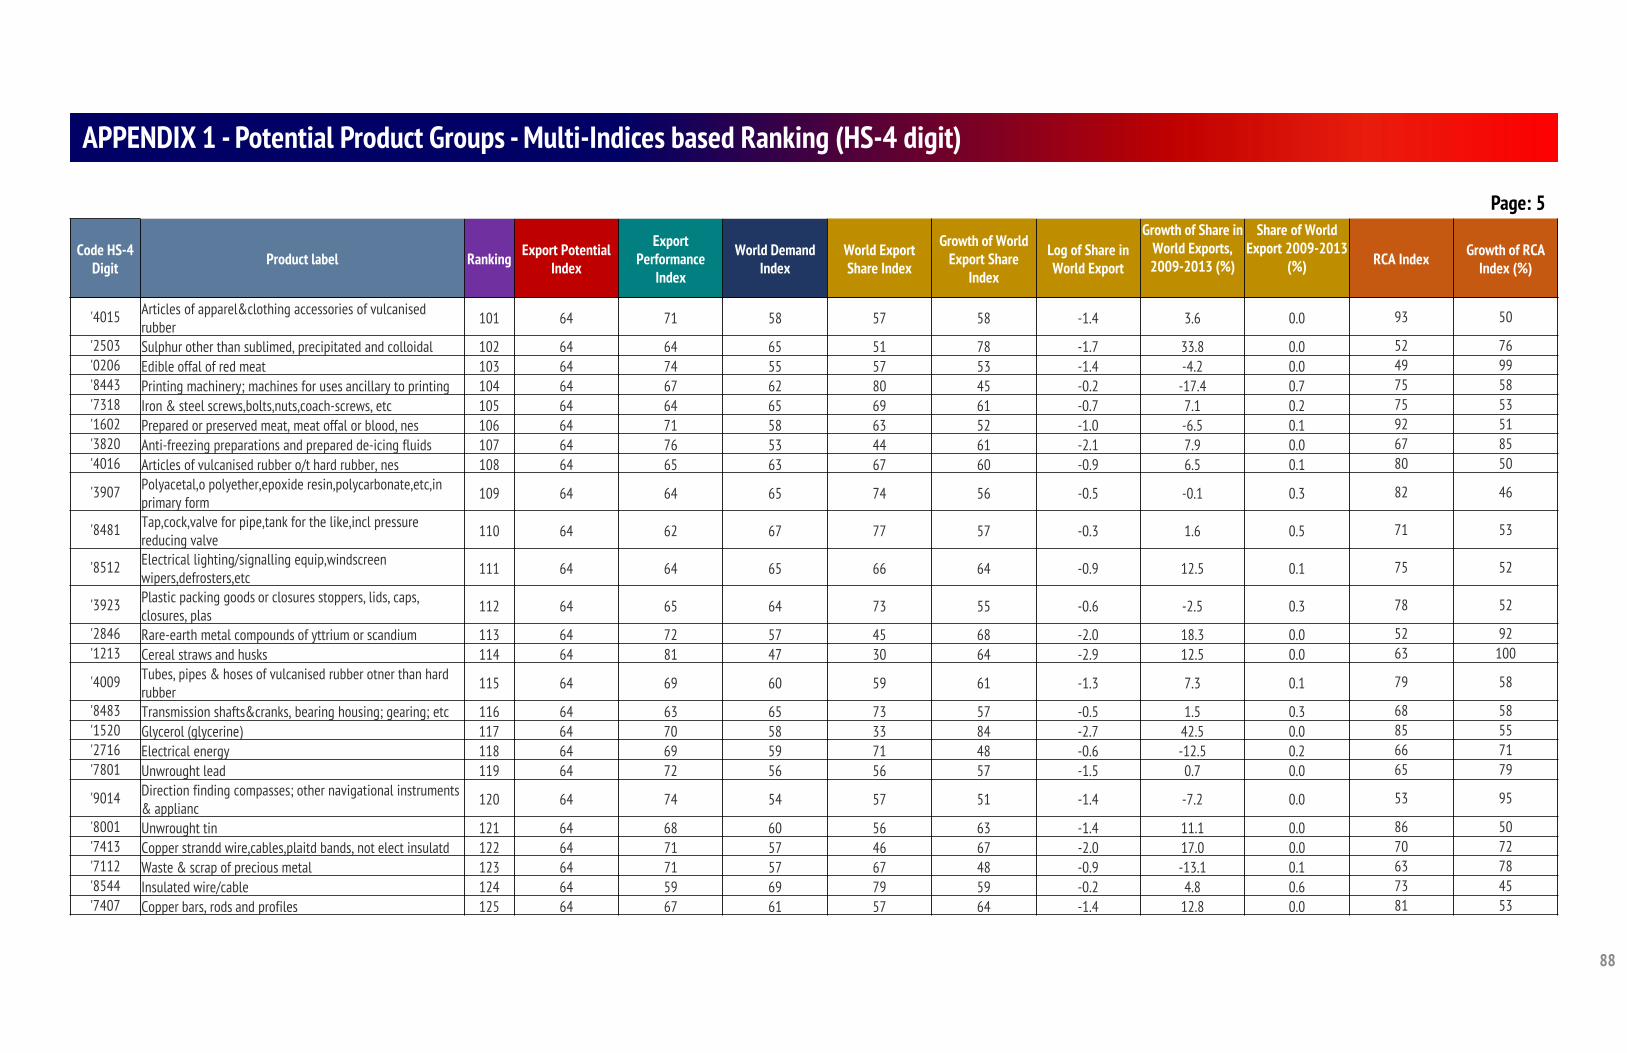
88
APPENDIX 1 - Potential Product Groups - Multi-Indices based Ranking (HS-4 digit)
Code HS-4 Digit Product label Ranking Export Potential
Index
Export Performance
Index
World Demand Index
World Export Share Index
Growth of World Export Share
Index
Log of Share in World Export
Growth of Share in World Exports, 2009-2013 (%)
Share of World Export 2009-2013
(%) RCA Index Growth of RCA Index (%)
Page: 5
'4015 Articles of apparel&clothing accessories of vulcanised rubber 101 64 71 58 57 58 -1.4 3.6 0.0 93 50
'2503 Sulphur other than sublimed, precipitated and colloidal 102 64 64 65 51 78 -1.7 33.8 0.0 52 76'0206 Edible offal of red meat 103 64 74 55 57 53 -1.4 -4.2 0.0 49 99'8443 Printing machinery; machines for uses ancillary to printing 104 64 67 62 80 45 -0.2 -17.4 0.7 75 58'7318 Iron & steel screws,bolts,nuts,coach-screws, etc 105 64 64 65 69 61 -0.7 7.1 0.2 75 53'1602 Prepared or preserved meat, meat offal or blood, nes 106 64 71 58 63 52 -1.0 -6.5 0.1 92 51'3820 Anti-freezing preparations and prepared de-icing fluids 107 64 76 53 44 61 -2.1 7.9 0.0 67 85'4016 Articles of vulcanised rubber o/t hard rubber, nes 108 64 65 63 67 60 -0.9 6.5 0.1 80 50
'3907 Polyacetal,o polyether,epoxide resin,polycarbonate,etc,in primary form 109 64 64 65 74 56 -0.5 -0.1 0.3 82 46
'8481 Tap,cock,valve for pipe,tank for the like,incl pressure reducing valve 110 64 62 67 77 57 -0.3 1.6 0.5 71 53
'8512 Electrical lighting/signalling equip,windscreen wipers,defrosters,etc 111 64 64 65 66 64 -0.9 12.5 0.1 75 52
'3923 Plastic packing goods or closures stoppers, lids, caps, closures, plas 112 64 65 64 73 55 -0.6 -2.5 0.3 78 52
'2846 Rare-earth metal compounds of yttrium or scandium 113 64 72 57 45 68 -2.0 18.3 0.0 52 92'1213 Cereal straws and husks 114 64 81 47 30 64 -2.9 12.5 0.0 63 100
'4009 Tubes, pipes & hoses of vulcanised rubber otner than hard rubber 115 64 69 60 59 61 -1.3 7.3 0.1 79 58
'8483 Transmission shafts&cranks, bearing housing; gearing; etc 116 64 63 65 73 57 -0.5 1.5 0.3 68 58'1520 Glycerol (glycerine) 117 64 70 58 33 84 -2.7 42.5 0.0 85 55'2716 Electrical energy 118 64 69 59 71 48 -0.6 -12.5 0.2 66 71'7801 Unwrought lead 119 64 72 56 56 57 -1.5 0.7 0.0 65 79
'9014 Direction finding compasses; other navigational instruments & applianc 120 64 74 54 57 51 -1.4 -7.2 0.0 53 95
'8001 Unwrought tin 121 64 68 60 56 63 -1.4 11.1 0.0 86 50'7413 Copper strandd wire,cables,plaitd bands, not elect insulatd 122 64 71 57 46 67 -2.0 17.0 0.0 70 72'7112 Waste & scrap of precious metal 123 64 71 57 67 48 -0.9 -13.1 0.1 63 78'8544 Insulated wire/cable 124 64 59 69 79 59 -0.2 4.8 0.6 73 45'7407 Copper bars, rods and profiles 125 64 67 61 57 64 -1.4 12.8 0.0 81 53
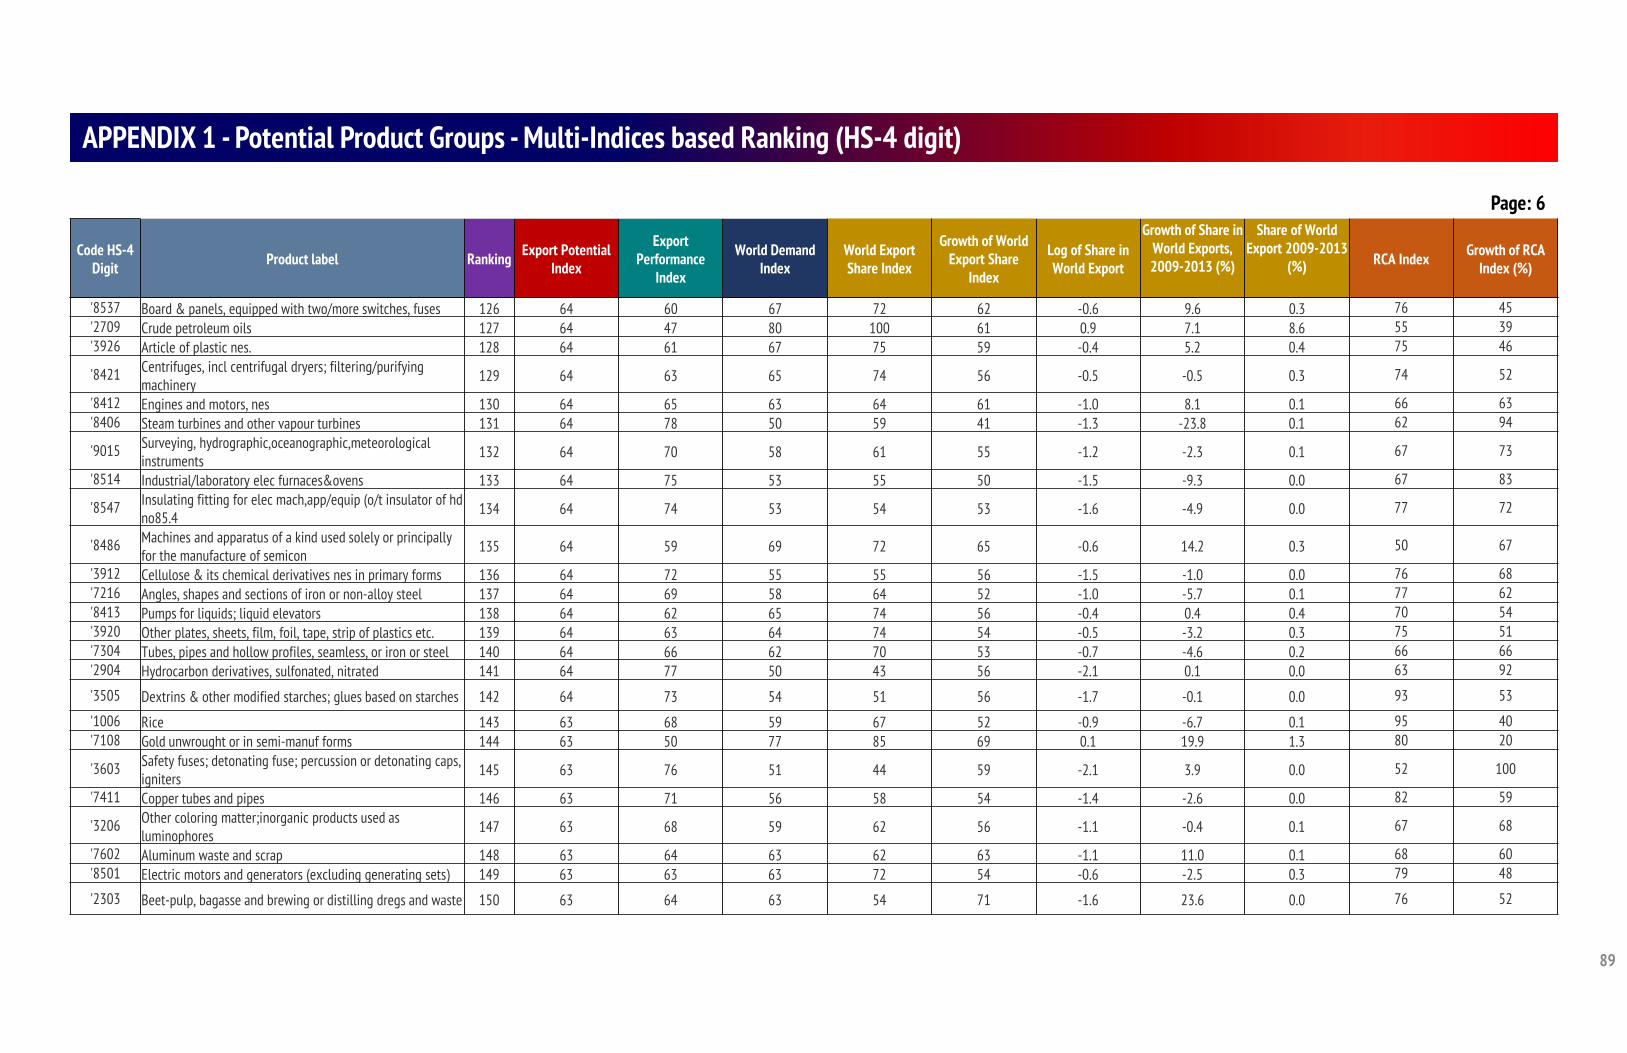
89
APPENDIX 1 - Potential Product Groups - Multi-Indices based Ranking (HS-4 digit)
Code HS-4 Digit Product label Ranking Export Potential
Index
Export Performance
Index
World Demand Index
World Export Share Index
Growth of World Export Share
Index
Log of Share in World Export
Growth of Share in World Exports, 2009-2013 (%)
Share of World Export 2009-2013
(%) RCA Index Growth of RCA Index (%)
Page: 6
'8537 Board & panels, equipped with two/more switches, fuses 126 64 60 67 72 62 -0.6 9.6 0.3 76 45'2709 Crude petroleum oils 127 64 47 80 100 61 0.9 7.1 8.6 55 39'3926 Article of plastic nes. 128 64 61 67 75 59 -0.4 5.2 0.4 75 46
'8421 Centrifuges, incl centrifugal dryers; filtering/purifying machinery 129 64 63 65 74 56 -0.5 -0.5 0.3 74 52
'8412 Engines and motors, nes 130 64 65 63 64 61 -1.0 8.1 0.1 66 63'8406 Steam turbines and other vapour turbines 131 64 78 50 59 41 -1.3 -23.8 0.1 62 94
'9015 Surveying, hydrographic,oceanographic,meteorological instruments 132 64 70 58 61 55 -1.2 -2.3 0.1 67 73
'8514 Industrial/laboratory elec furnaces&ovens 133 64 75 53 55 50 -1.5 -9.3 0.0 67 83
'8547 Insulating fitting for elec mach,app/equip (o/t insulator of hd no85.4 134 64 74 53 54 53 -1.6 -4.9 0.0 77 72
'8486 Machines and apparatus of a kind used solely or principally for the manufacture of semicon 135 64 59 69 72 65 -0.6 14.2 0.3 50 67
'3912 Cellulose & its chemical derivatives nes in primary forms 136 64 72 55 55 56 -1.5 -1.0 0.0 76 68'7216 Angles, shapes and sections of iron or non-alloy steel 137 64 69 58 64 52 -1.0 -5.7 0.1 77 62'8413 Pumps for liquids; liquid elevators 138 64 62 65 74 56 -0.4 0.4 0.4 70 54'3920 Other plates, sheets, film, foil, tape, strip of plastics etc. 139 64 63 64 74 54 -0.5 -3.2 0.3 75 51'7304 Tubes, pipes and hollow profiles, seamless, or iron or steel 140 64 66 62 70 53 -0.7 -4.6 0.2 66 66'2904 Hydrocarbon derivatives, sulfonated, nitrated 141 64 77 50 43 56 -2.1 0.1 0.0 63 92
'3505 Dextrins & other modified starches; glues based on starches 142 64 73 54 51 56 -1.7 -0.1 0.0 93 53
'1006 Rice 143 63 68 59 67 52 -0.9 -6.7 0.1 95 40'7108 Gold unwrought or in semi-manuf forms 144 63 50 77 85 69 0.1 19.9 1.3 80 20
'3603 Safety fuses; detonating fuse; percussion or detonating caps, igniters 145 63 76 51 44 59 -2.1 3.9 0.0 52 100
'7411 Copper tubes and pipes 146 63 71 56 58 54 -1.4 -2.6 0.0 82 59
'3206 Other coloring matter;inorganic products used as luminophores 147 63 68 59 62 56 -1.1 -0.4 0.1 67 68
'7602 Aluminum waste and scrap 148 63 64 63 62 63 -1.1 11.0 0.1 68 60'8501 Electric motors and generators (excluding generating sets) 149 63 63 63 72 54 -0.6 -2.5 0.3 79 48
'2303 Beet-pulp, bagasse and brewing or distilling dregs and waste 150 63 64 63 54 71 -1.6 23.6 0.0 76 52
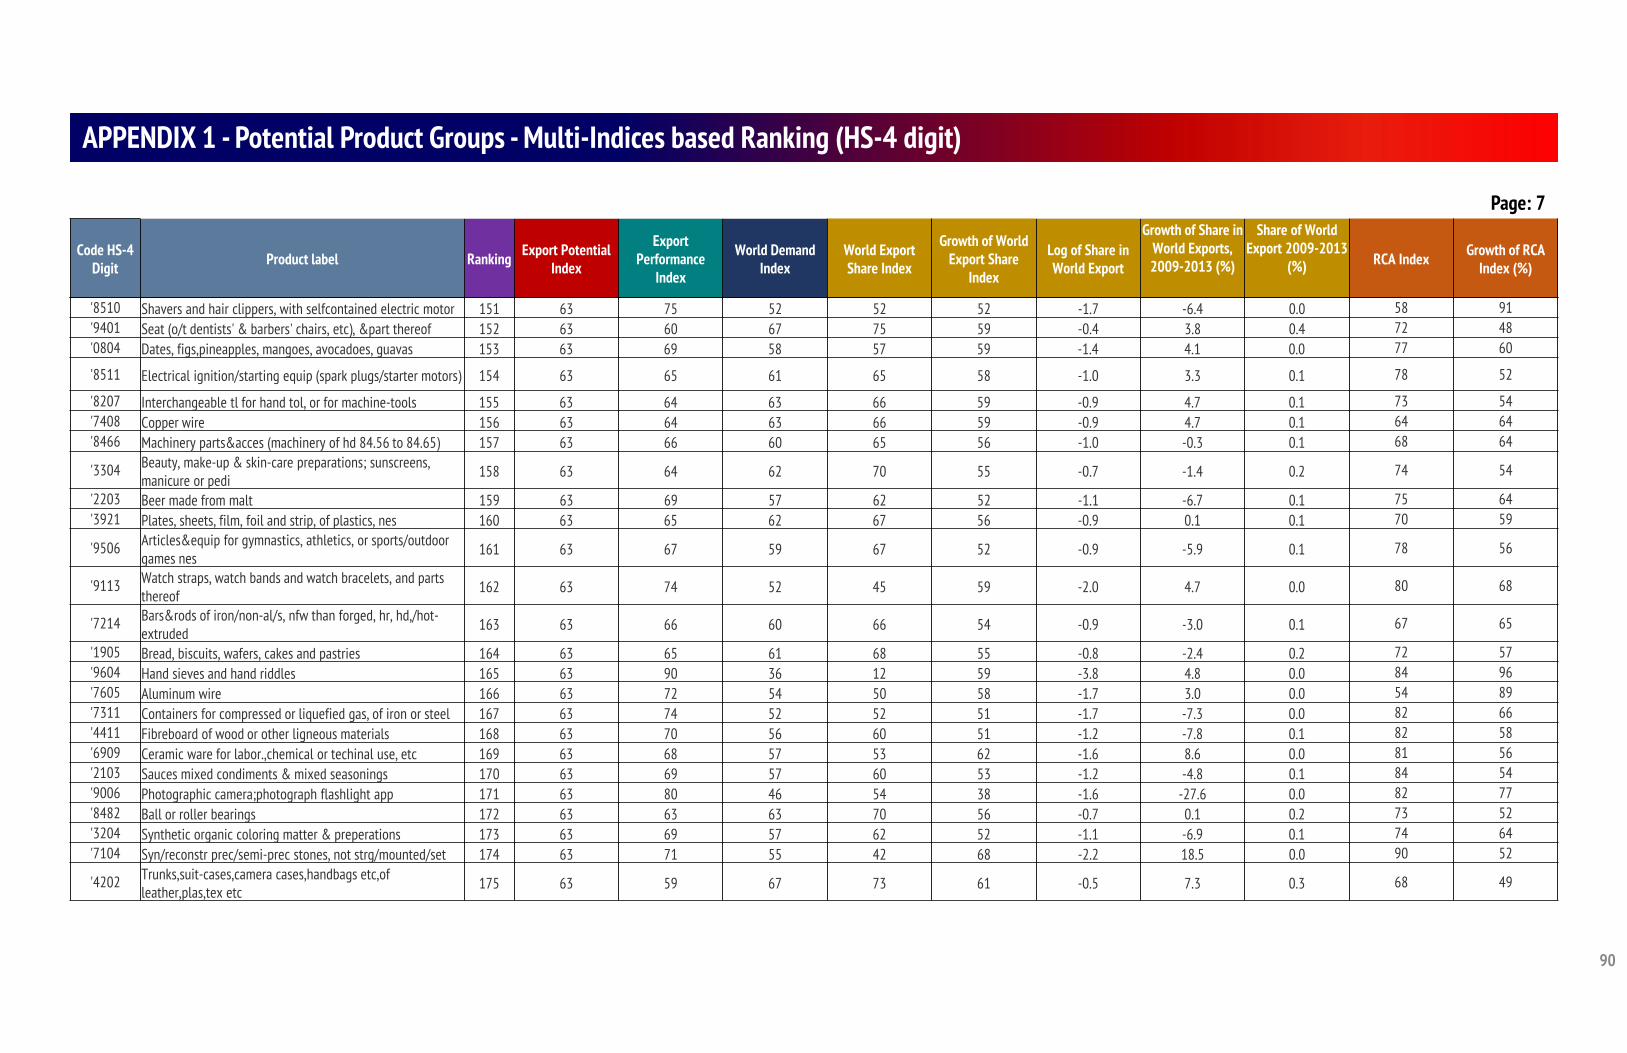
90
APPENDIX 1 - Potential Product Groups - Multi-Indices based Ranking (HS-4 digit)
Code HS-4 Digit Product label Ranking Export Potential
Index
Export Performance
Index
World Demand Index
World Export Share Index
Growth of World Export Share
Index
Log of Share in World Export
Growth of Share in World Exports, 2009-2013 (%)
Share of World Export 2009-2013
(%) RCA Index Growth of RCA Index (%)
Page: 7
'8510 Shavers and hair clippers, with selfcontained electric motor 151 63 75 52 52 52 -1.7 -6.4 0.0 58 91'9401 Seat (o/t dentists' & barbers' chairs, etc), &part thereof 152 63 60 67 75 59 -0.4 3.8 0.4 72 48'0804 Dates, figs,pineapples, mangoes, avocadoes, guavas 153 63 69 58 57 59 -1.4 4.1 0.0 77 60
'8511 Electrical ignition/starting equip (spark plugs/starter motors) 154 63 65 61 65 58 -1.0 3.3 0.1 78 52
'8207 Interchangeable tl for hand tol, or for machine-tools 155 63 64 63 66 59 -0.9 4.7 0.1 73 54'7408 Copper wire 156 63 64 63 66 59 -0.9 4.7 0.1 64 64'8466 Machinery parts&acces (machinery of hd 84.56 to 84.65) 157 63 66 60 65 56 -1.0 -0.3 0.1 68 64
'3304 Beauty, make-up & skin-care preparations; sunscreens, manicure or pedi 158 63 64 62 70 55 -0.7 -1.4 0.2 74 54
'2203 Beer made from malt 159 63 69 57 62 52 -1.1 -6.7 0.1 75 64'3921 Plates, sheets, film, foil and strip, of plastics, nes 160 63 65 62 67 56 -0.9 0.1 0.1 70 59
'9506 Articles&equip for gymnastics, athletics, or sports/outdoor games nes 161 63 67 59 67 52 -0.9 -5.9 0.1 78 56
'9113 Watch straps, watch bands and watch bracelets, and parts thereof 162 63 74 52 45 59 -2.0 4.7 0.0 80 68
'7214 Bars&rods of iron/non-al/s, nfw than forged, hr, hd,/hot-extruded 163 63 66 60 66 54 -0.9 -3.0 0.1 67 65
'1905 Bread, biscuits, wafers, cakes and pastries 164 63 65 61 68 55 -0.8 -2.4 0.2 72 57'9604 Hand sieves and hand riddles 165 63 90 36 12 59 -3.8 4.8 0.0 84 96'7605 Aluminum wire 166 63 72 54 50 58 -1.7 3.0 0.0 54 89'7311 Containers for compressed or liquefied gas, of iron or steel 167 63 74 52 52 51 -1.7 -7.3 0.0 82 66'4411 Fibreboard of wood or other ligneous materials 168 63 70 56 60 51 -1.2 -7.8 0.1 82 58'6909 Ceramic ware for labor.,chemical or techinal use, etc 169 63 68 57 53 62 -1.6 8.6 0.0 81 56'2103 Sauces mixed condiments & mixed seasonings 170 63 69 57 60 53 -1.2 -4.8 0.1 84 54'9006 Photographic camera;photograph flashlight app 171 63 80 46 54 38 -1.6 -27.6 0.0 82 77'8482 Ball or roller bearings 172 63 63 63 70 56 -0.7 0.1 0.2 73 52'3204 Synthetic organic coloring matter & preperations 173 63 69 57 62 52 -1.1 -6.9 0.1 74 64'7104 Syn/reconstr prec/semi-prec stones, not strg/mounted/set 174 63 71 55 42 68 -2.2 18.5 0.0 90 52
'4202 Trunks,suit-cases,camera cases,handbags etc,of leather,plas,tex etc 175 63 59 67 73 61 -0.5 7.3 0.3 68 49
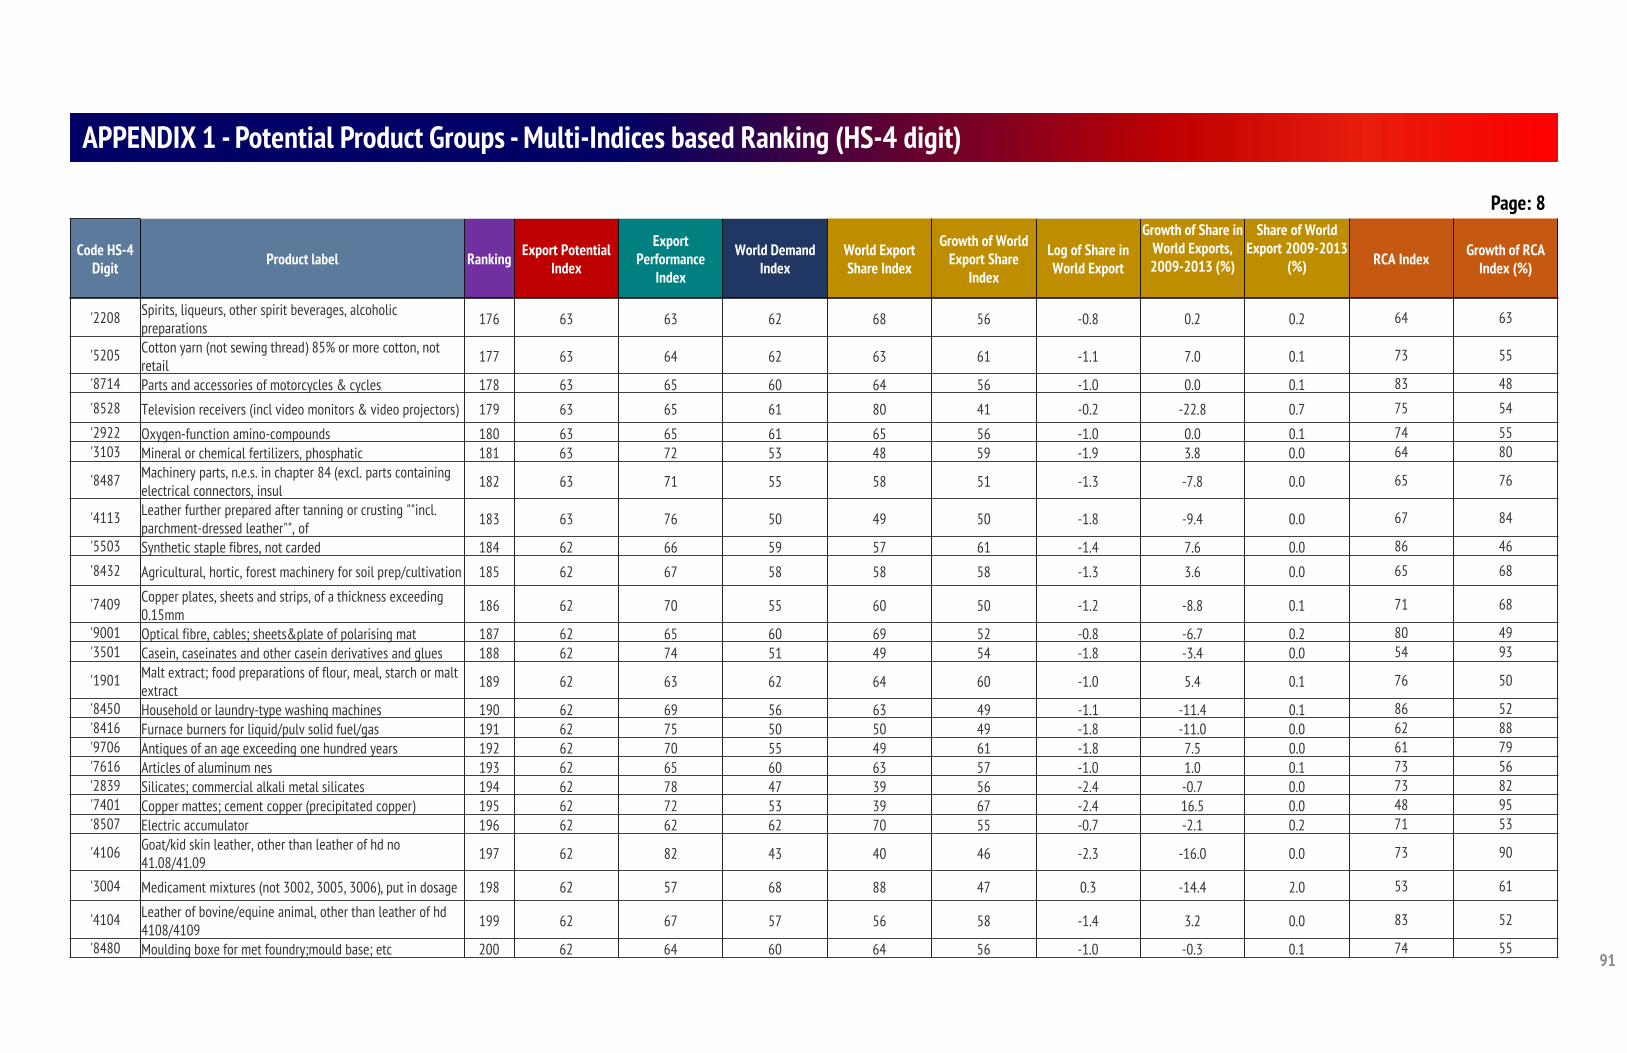
91
APPENDIX 1 - Potential Product Groups - Multi-Indices based Ranking (HS-4 digit)
Code HS-4 Digit Product label Ranking Export Potential
Index
Export Performance
Index
World Demand Index
World Export Share Index
Growth of World Export Share
Index
Log of Share in World Export
Growth of Share in World Exports, 2009-2013 (%)
Share of World Export 2009-2013
(%) RCA Index Growth of RCA Index (%)
Page: 8
'2208 Spirits, liqueurs, other spirit beverages, alcoholic preparations 176 63 63 62 68 56 -0.8 0.2 0.2 64 63
'5205 Cotton yarn (not sewing thread) 85% or more cotton, not retail 177 63 64 62 63 61 -1.1 7.0 0.1 73 55
'8714 Parts and accessories of motorcycles & cycles 178 63 65 60 64 56 -1.0 0.0 0.1 83 48
'8528 Television receivers (incl video monitors & video projectors) 179 63 65 61 80 41 -0.2 -22.8 0.7 75 54
'2922 Oxygen-function amino-compounds 180 63 65 61 65 56 -1.0 0.0 0.1 74 55'3103 Mineral or chemical fertilizers, phosphatic 181 63 72 53 48 59 -1.9 3.8 0.0 64 80
'8487 Machinery parts, n.e.s. in chapter 84 (excl. parts containing electrical connectors, insul 182 63 71 55 58 51 -1.3 -7.8 0.0 65 76
'4113 Leather further prepared after tanning or crusting ""incl. parchment-dressed leather"", of 183 63 76 50 49 50 -1.8 -9.4 0.0 67 84
'5503 Synthetic staple fibres, not carded 184 62 66 59 57 61 -1.4 7.6 0.0 86 46
'8432 Agricultural, hortic, forest machinery for soil prep/cultivation 185 62 67 58 58 58 -1.3 3.6 0.0 65 68
'7409 Copper plates, sheets and strips, of a thickness exceeding 0.15mm 186 62 70 55 60 50 -1.2 -8.8 0.1 71 68
'9001 Optical fibre, cables; sheets&plate of polarising mat 187 62 65 60 69 52 -0.8 -6.7 0.2 80 49'3501 Casein, caseinates and other casein derivatives and glues 188 62 74 51 49 54 -1.8 -3.4 0.0 54 93
'1901 Malt extract; food preparations of flour, meal, starch or malt extract 189 62 63 62 64 60 -1.0 5.4 0.1 76 50
'8450 Household or laundry-type washing machines 190 62 69 56 63 49 -1.1 -11.4 0.1 86 52'8416 Furnace burners for liquid/pulv solid fuel/gas 191 62 75 50 50 49 -1.8 -11.0 0.0 62 88'9706 Antiques of an age exceeding one hundred years 192 62 70 55 49 61 -1.8 7.5 0.0 61 79'7616 Articles of aluminum nes 193 62 65 60 63 57 -1.0 1.0 0.1 73 56'2839 Silicates; commercial alkali metal silicates 194 62 78 47 39 56 -2.4 -0.7 0.0 73 82'7401 Copper mattes; cement copper (precipitated copper) 195 62 72 53 39 67 -2.4 16.5 0.0 48 95'8507 Electric accumulator 196 62 62 62 70 55 -0.7 -2.1 0.2 71 53
'4106 Goat/kid skin leather, other than leather of hd no 41.08/41.09 197 62 82 43 40 46 -2.3 -16.0 0.0 73 90
'3004 Medicament mixtures (not 3002, 3005, 3006), put in dosage 198 62 57 68 88 47 0.3 -14.4 2.0 53 61
'4104 Leather of bovine/equine animal, other than leather of hd 4108/4109 199 62 67 57 56 58 -1.4 3.2 0.0 83 52
'8480 Moulding boxe for met foundry;mould base; etc 200 62 64 60 64 56 -1.0 -0.3 0.1 74 55
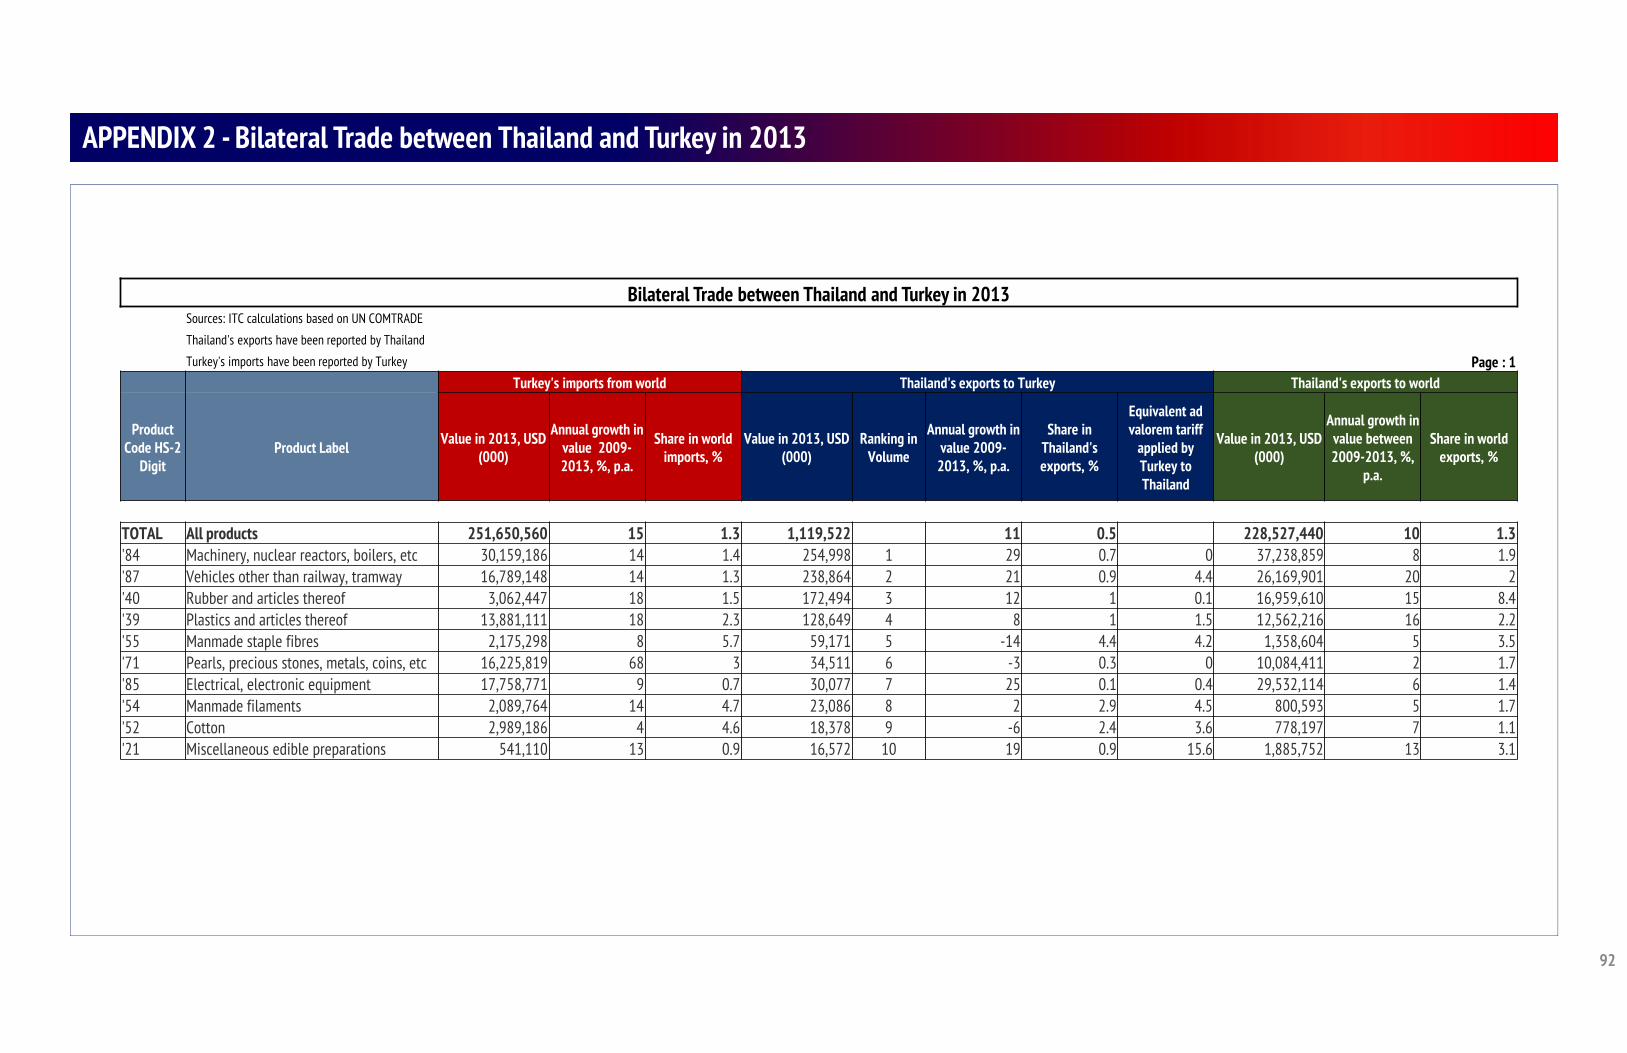
Bilateral Trade between Thailand and Turkey in 2013 Sources: ITC calculations based on UN COMTRADE
Thailand's exports have been reported by Thailand
Turkey's imports have been reported by Turkey Page : 1Turkey's imports from world Thailand's exports to Turkey Thailand's exports to world
Product Code HS-2
DigitProduct Label Value in 2013, USD
(000)
Annual growth in value 2009-2013, %, p.a.
Share in world imports, %
Value in 2013, USD (000)
Ranking in Volume
Annual growth in value 2009-
2013, %, p.a.
Share in Thailand's exports, %
Equivalent ad valorem tariff
applied by Turkey to Thailand
Value in 2013, USD (000)
Annual growth in value between 2009-2013, %,
p.a.
Share in world exports, %
TOTAL All products 251,650,560 15 1.3 1,119,522 11 0.5 228,527,440 10 1.3'84 Machinery, nuclear reactors, boilers, etc 30,159,186 14 1.4 254,998 1 29 0.7 0 37,238,859 8 1.9'87 Vehicles other than railway, tramway 16,789,148 14 1.3 238,864 2 21 0.9 4.4 26,169,901 20 2'40 Rubber and articles thereof 3,062,447 18 1.5 172,494 3 12 1 0.1 16,959,610 15 8.4'39 Plastics and articles thereof 13,881,111 18 2.3 128,649 4 8 1 1.5 12,562,216 16 2.2'55 Manmade staple fibres 2,175,298 8 5.7 59,171 5 -14 4.4 4.2 1,358,604 5 3.5'71 Pearls, precious stones, metals, coins, etc 16,225,819 68 3 34,511 6 -3 0.3 0 10,084,411 2 1.7'85 Electrical, electronic equipment 17,758,771 9 0.7 30,077 7 25 0.1 0.4 29,532,114 6 1.4'54 Manmade filaments 2,089,764 14 4.7 23,086 8 2 2.9 4.5 800,593 5 1.7'52 Cotton 2,989,186 4 4.6 18,378 9 -6 2.4 3.6 778,197 7 1.1'21 Miscellaneous edible preparations 541,110 13 0.9 16,572 10 19 0.9 15.6 1,885,752 13 3.1
92
APPENDIX 2 - Bilateral Trade between Thailand and Turkey in 2013
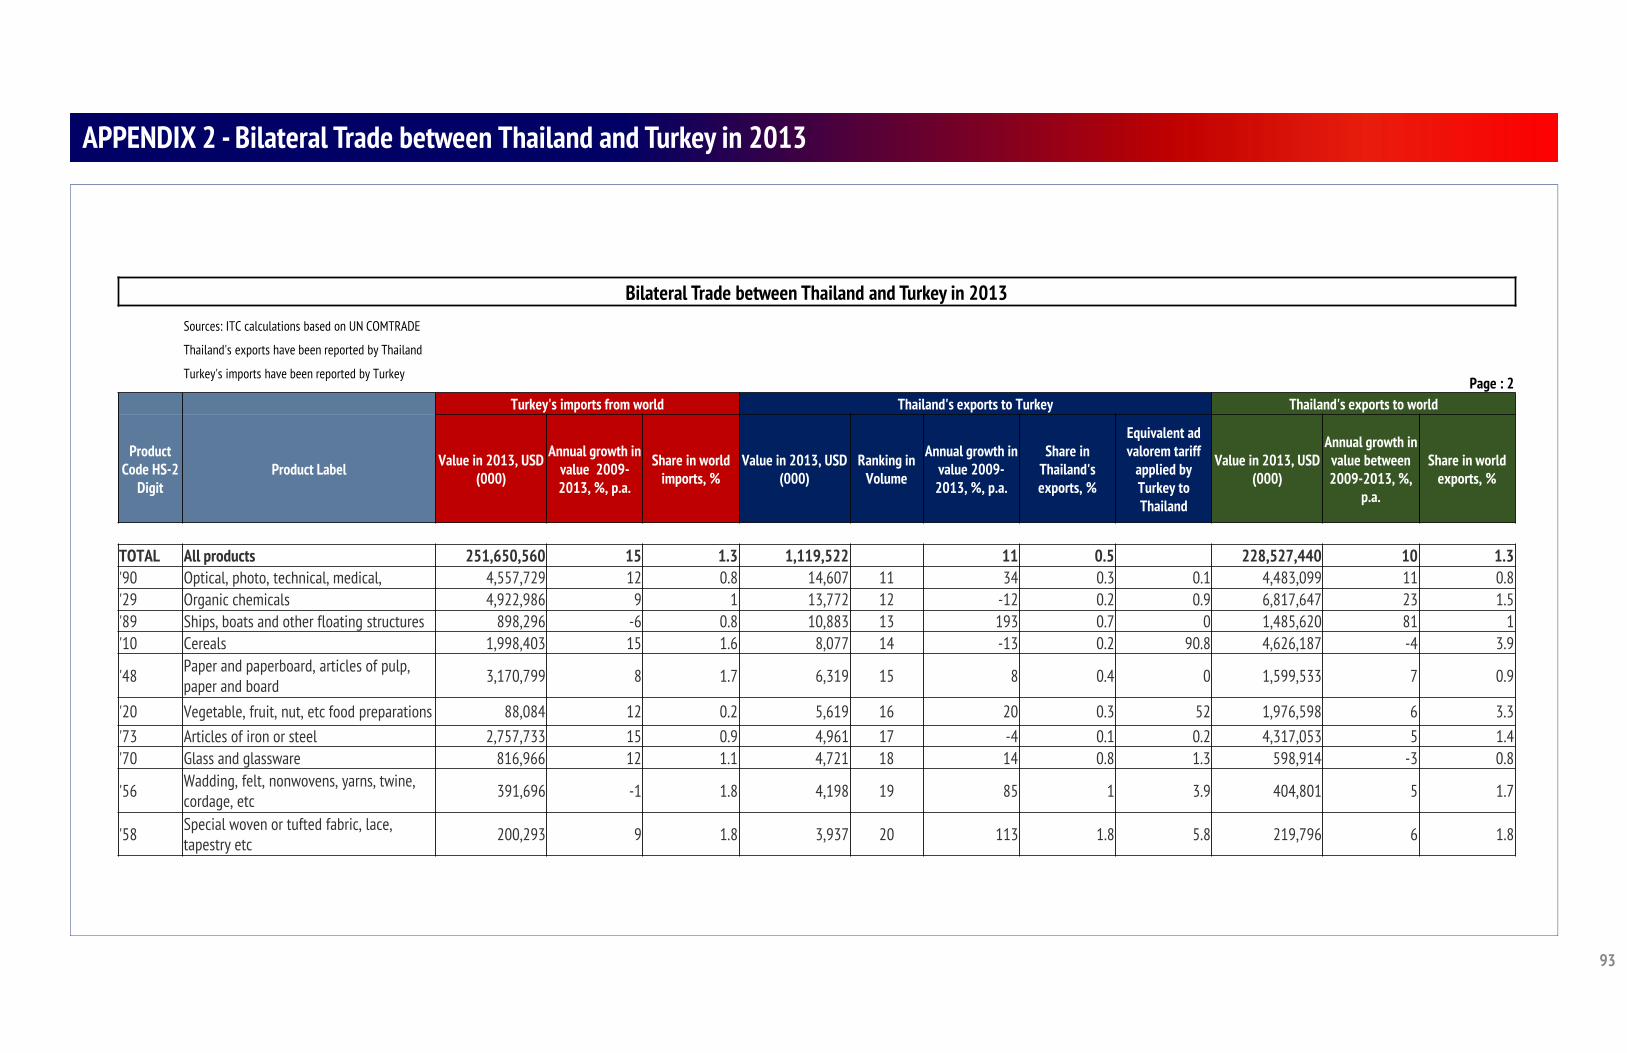
93
Bilateral Trade between Thailand and Turkey in 2013 Sources: ITC calculations based on UN COMTRADE
Thailand's exports have been reported by Thailand
Turkey's imports have been reported by TurkeyPage : 2
Turkey's imports from world Thailand's exports to Turkey Thailand's exports to world
Product Code HS-2
DigitProduct Label Value in 2013, USD
(000)
Annual growth in value 2009-2013, %, p.a.
Share in world imports, %
Value in 2013, USD (000)
Ranking in Volume
Annual growth in value 2009-
2013, %, p.a.
Share in Thailand's exports, %
Equivalent ad valorem tariff
applied by Turkey to Thailand
Value in 2013, USD (000)
Annual growth in value between 2009-2013, %,
p.a.
Share in world exports, %
TOTAL All products 251,650,560 15 1.3 1,119,522 11 0.5 228,527,440 10 1.3'90 Optical, photo, technical, medical, 4,557,729 12 0.8 14,607 11 34 0.3 0.1 4,483,099 11 0.8'29 Organic chemicals 4,922,986 9 1 13,772 12 -12 0.2 0.9 6,817,647 23 1.5'89 Ships, boats and other floating structures 898,296 -6 0.8 10,883 13 193 0.7 0 1,485,620 81 1'10 Cereals 1,998,403 15 1.6 8,077 14 -13 0.2 90.8 4,626,187 -4 3.9
'48 Paper and paperboard, articles of pulp, paper and board 3,170,799 8 1.7 6,319 15 8 0.4 0 1,599,533 7 0.9
'20 Vegetable, fruit, nut, etc food preparations 88,084 12 0.2 5,619 16 20 0.3 52 1,976,598 6 3.3'73 Articles of iron or steel 2,757,733 15 0.9 4,961 17 -4 0.1 0.2 4,317,053 5 1.4'70 Glass and glassware 816,966 12 1.1 4,721 18 14 0.8 1.3 598,914 -3 0.8
'56 Wadding, felt, nonwovens, yarns, twine, cordage, etc 391,696 -1 1.8 4,198 19 85 1 3.9 404,801 5 1.7
'58 Special woven or tufted fabric, lace, tapestry etc 200,293 9 1.8 3,937 20 113 1.8 5.8 219,796 6 1.8
APPENDIX 2 - Bilateral Trade between Thailand and Turkey in 2013
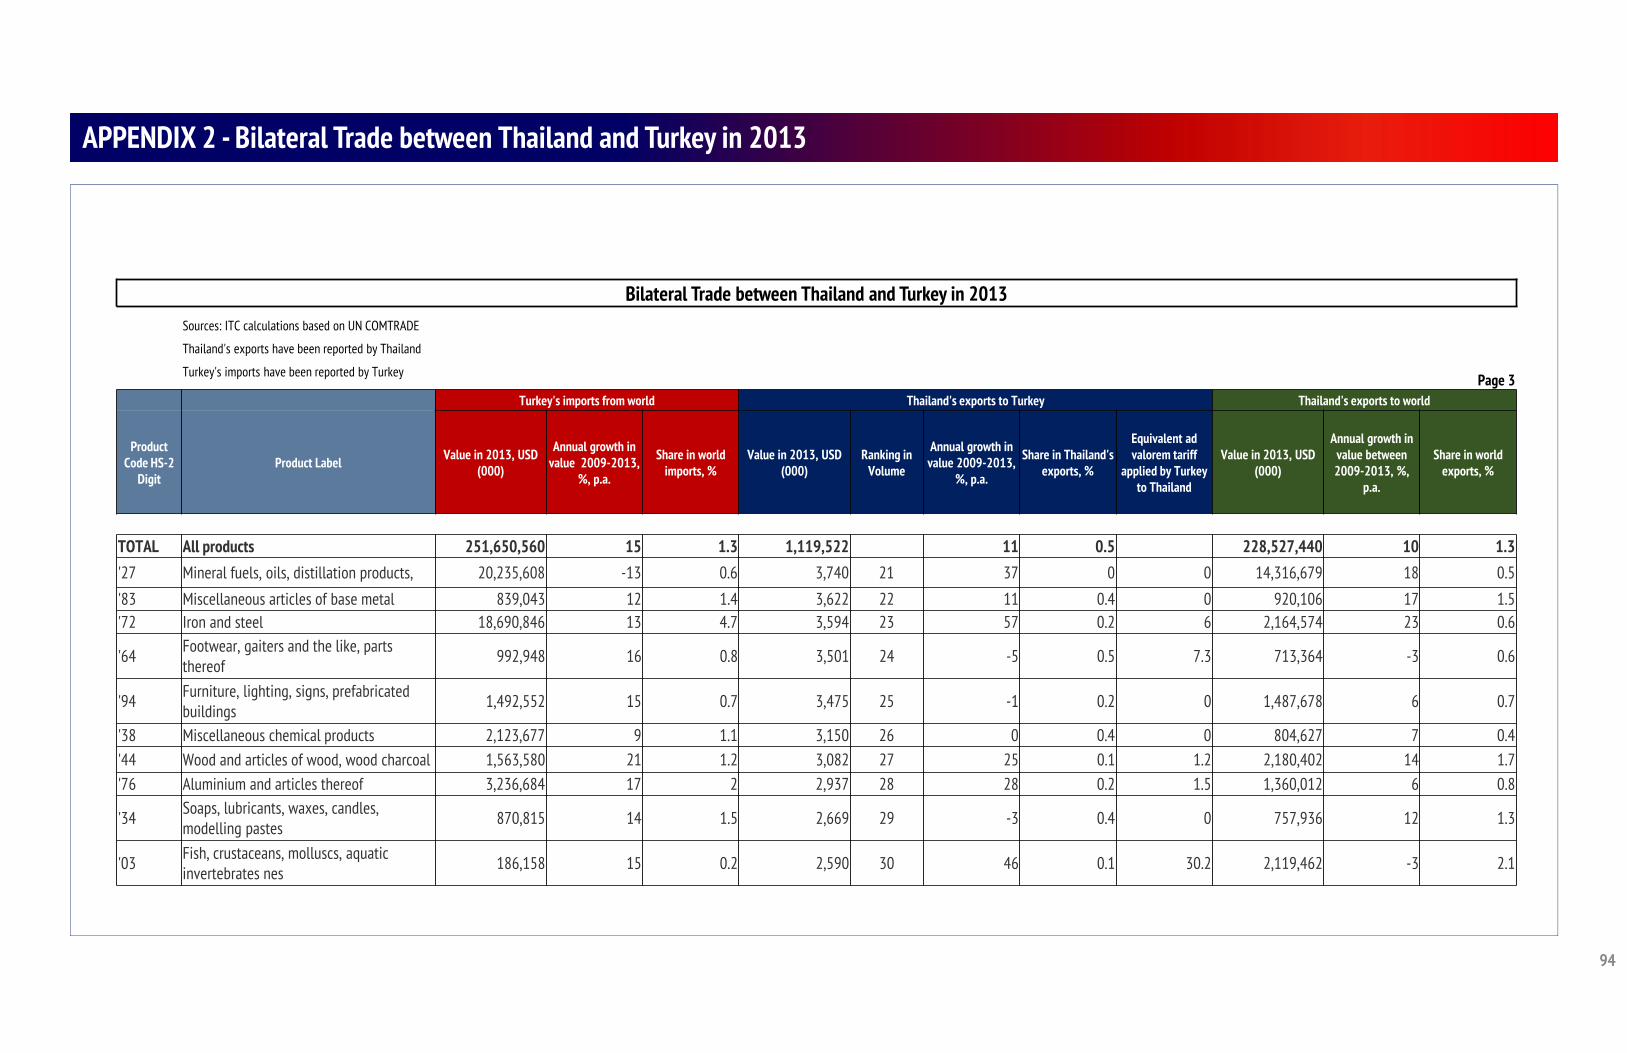
94
Bilateral Trade between Thailand and Turkey in 2013 Sources: ITC calculations based on UN COMTRADE
Thailand's exports have been reported by Thailand
Turkey's imports have been reported by Turkey Page 3Turkey's imports from world Thailand's exports to Turkey Thailand's exports to world
Product Code HS-2
DigitProduct Label Value in 2013, USD
(000)
Annual growth in value 2009-2013,
%, p.a.
Share in world imports, %
Value in 2013, USD (000)
Ranking in Volume
Annual growth in value 2009-2013,
%, p.a.
Share in Thailand's exports, %
Equivalent ad valorem tariff
applied by Turkey to Thailand
Value in 2013, USD (000)
Annual growth in value between 2009-2013, %,
p.a.
Share in world exports, %
TOTAL All products 251,650,560 15 1.3 1,119,522 11 0.5 228,527,440 10 1.3'27 Mineral fuels, oils, distillation products, 20,235,608 -13 0.6 3,740 21 37 0 0 14,316,679 18 0.5
'83 Miscellaneous articles of base metal 839,043 12 1.4 3,622 22 11 0.4 0 920,106 17 1.5'72 Iron and steel 18,690,846 13 4.7 3,594 23 57 0.2 6 2,164,574 23 0.6
'64 Footwear, gaiters and the like, parts thereof 992,948 16 0.8 3,501 24 -5 0.5 7.3 713,364 -3 0.6
'94 Furniture, lighting, signs, prefabricated buildings 1,492,552 15 0.7 3,475 25 -1 0.2 0 1,487,678 6 0.7
'38 Miscellaneous chemical products 2,123,677 9 1.1 3,150 26 0 0.4 0 804,627 7 0.4'44 Wood and articles of wood, wood charcoal 1,563,580 21 1.2 3,082 27 25 0.1 1.2 2,180,402 14 1.7'76 Aluminium and articles thereof 3,236,684 17 2 2,937 28 28 0.2 1.5 1,360,012 6 0.8
'34 Soaps, lubricants, waxes, candles, modelling pastes 870,815 14 1.5 2,669 29 -3 0.4 0 757,936 12 1.3
'03 Fish, crustaceans, molluscs, aquatic invertebrates nes 186,158 15 0.2 2,590 30 46 0.1 30.2 2,119,462 -3 2.1
APPENDIX 2 - Bilateral Trade between Thailand and Turkey in 2013
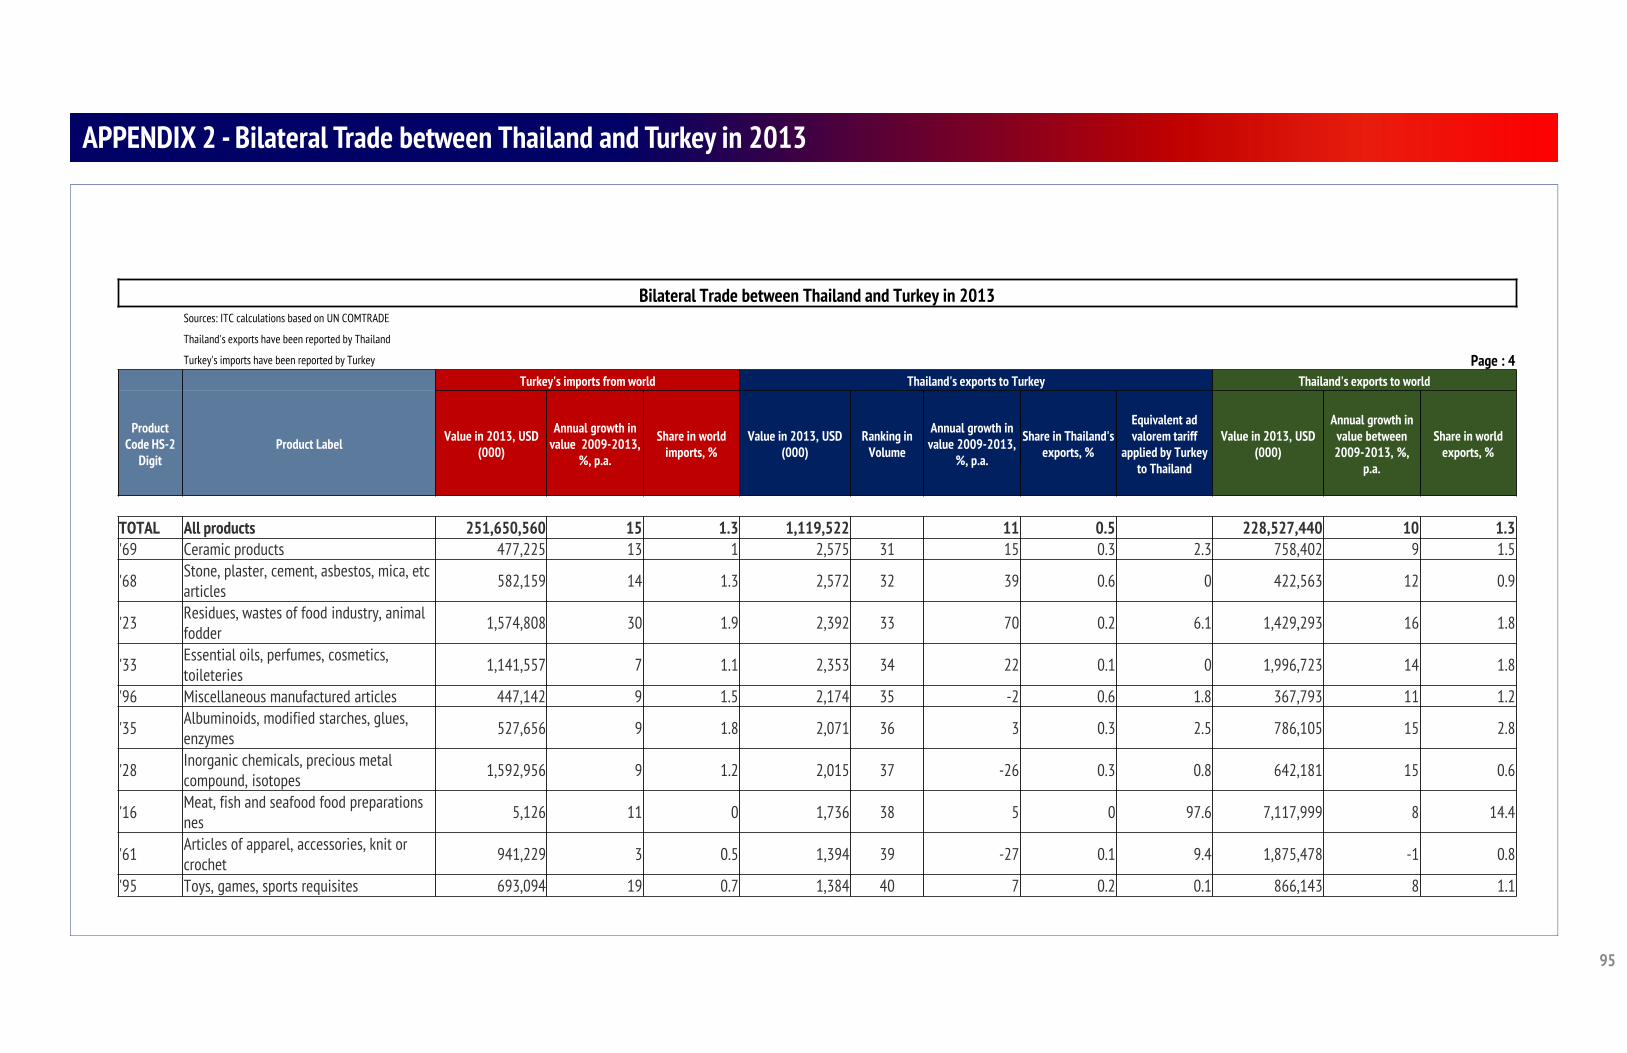
95
Bilateral Trade between Thailand and Turkey in 2013 Sources: ITC calculations based on UN COMTRADE
Thailand's exports have been reported by Thailand
Turkey's imports have been reported by Turkey Page : 4Turkey's imports from world Thailand's exports to Turkey Thailand's exports to world
Product Code HS-2
DigitProduct Label Value in 2013, USD
(000)
Annual growth in value 2009-2013,
%, p.a.
Share in world imports, %
Value in 2013, USD (000)
Ranking in Volume
Annual growth in value 2009-2013,
%, p.a.
Share in Thailand's exports, %
Equivalent ad valorem tariff
applied by Turkey to Thailand
Value in 2013, USD (000)
Annual growth in value between 2009-2013, %,
p.a.
Share in world exports, %
TOTAL All products 251,650,560 15 1.3 1,119,522 11 0.5 228,527,440 10 1.3'69 Ceramic products 477,225 13 1 2,575 31 15 0.3 2.3 758,402 9 1.5
'68 Stone, plaster, cement, asbestos, mica, etc articles 582,159 14 1.3 2,572 32 39 0.6 0 422,563 12 0.9
'23 Residues, wastes of food industry, animal fodder 1,574,808 30 1.9 2,392 33 70 0.2 6.1 1,429,293 16 1.8
'33 Essential oils, perfumes, cosmetics, toileteries 1,141,557 7 1.1 2,353 34 22 0.1 0 1,996,723 14 1.8
'96 Miscellaneous manufactured articles 447,142 9 1.5 2,174 35 -2 0.6 1.8 367,793 11 1.2
'35 Albuminoids, modified starches, glues, enzymes 527,656 9 1.8 2,071 36 3 0.3 2.5 786,105 15 2.8
'28 Inorganic chemicals, precious metal compound, isotopes 1,592,956 9 1.2 2,015 37 -26 0.3 0.8 642,181 15 0.6
'16 Meat, fish and seafood food preparations nes 5,126 11 0 1,736 38 5 0 97.6 7,117,999 8 14.4
'61 Articles of apparel, accessories, knit or crochet 941,229 3 0.5 1,394 39 -27 0.1 9.4 1,875,478 -1 0.8
'95 Toys, games, sports requisites 693,094 19 0.7 1,384 40 7 0.2 0.1 866,143 8 1.1
APPENDIX 2 - Bilateral Trade between Thailand and Turkey in 2013
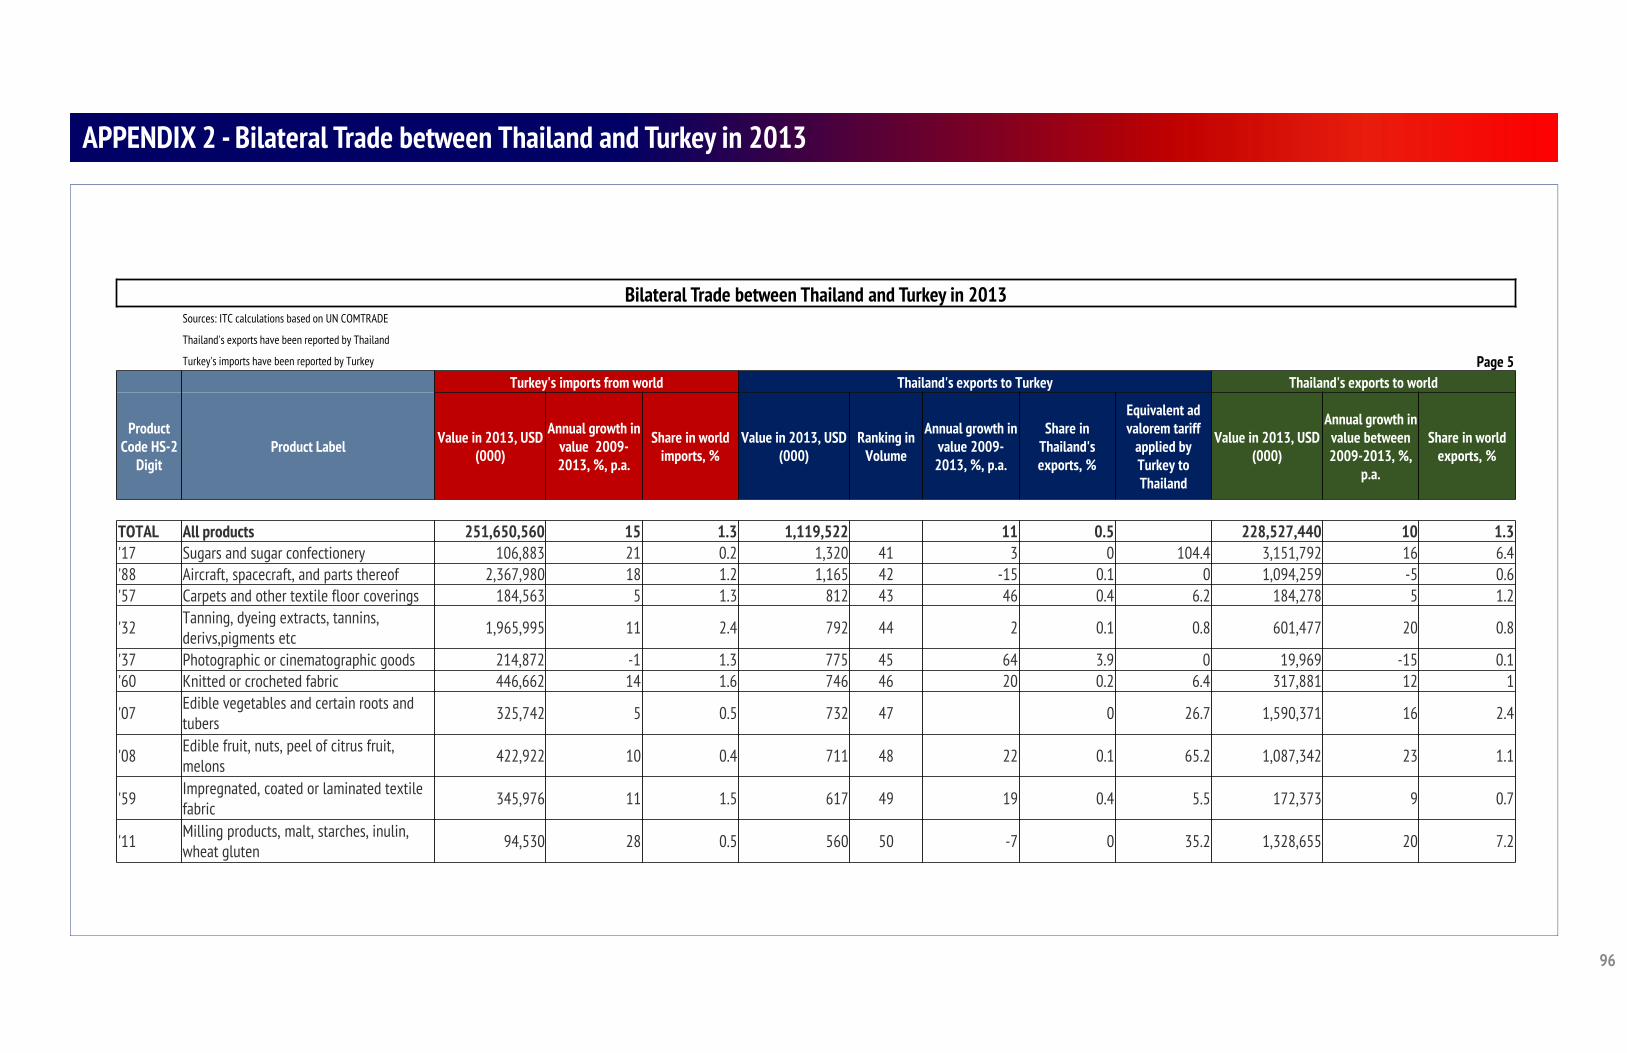
96
Bilateral Trade between Thailand and Turkey in 2013 Sources: ITC calculations based on UN COMTRADE
Thailand's exports have been reported by Thailand
Turkey's imports have been reported by Turkey Page 5Turkey's imports from world Thailand's exports to Turkey Thailand's exports to world
Product Code HS-2
DigitProduct Label Value in 2013, USD
(000)
Annual growth in value 2009-2013, %, p.a.
Share in world imports, %
Value in 2013, USD (000)
Ranking in Volume
Annual growth in value 2009-
2013, %, p.a.
Share in Thailand's exports, %
Equivalent ad valorem tariff
applied by Turkey to Thailand
Value in 2013, USD (000)
Annual growth in value between 2009-2013, %,
p.a.
Share in world exports, %
TOTAL All products 251,650,560 15 1.3 1,119,522 11 0.5 228,527,440 10 1.3'17 Sugars and sugar confectionery 106,883 21 0.2 1,320 41 3 0 104.4 3,151,792 16 6.4'88 Aircraft, spacecraft, and parts thereof 2,367,980 18 1.2 1,165 42 -15 0.1 0 1,094,259 -5 0.6'57 Carpets and other textile floor coverings 184,563 5 1.3 812 43 46 0.4 6.2 184,278 5 1.2
'32 Tanning, dyeing extracts, tannins, derivs,pigments etc 1,965,995 11 2.4 792 44 2 0.1 0.8 601,477 20 0.8
'37 Photographic or cinematographic goods 214,872 -1 1.3 775 45 64 3.9 0 19,969 -15 0.1'60 Knitted or crocheted fabric 446,662 14 1.6 746 46 20 0.2 6.4 317,881 12 1
'07 Edible vegetables and certain roots and tubers 325,742 5 0.5 732 47 0 26.7 1,590,371 16 2.4
'08 Edible fruit, nuts, peel of citrus fruit, melons 422,922 10 0.4 711 48 22 0.1 65.2 1,087,342 23 1.1
'59 Impregnated, coated or laminated textile fabric 345,976 11 1.5 617 49 19 0.4 5.5 172,373 9 0.7
'11 Milling products, malt, starches, inulin, wheat gluten 94,530 28 0.5 560 50 -7 0 35.2 1,328,655 20 7.2
APPENDIX 2 - Bilateral Trade between Thailand and Turkey in 2013
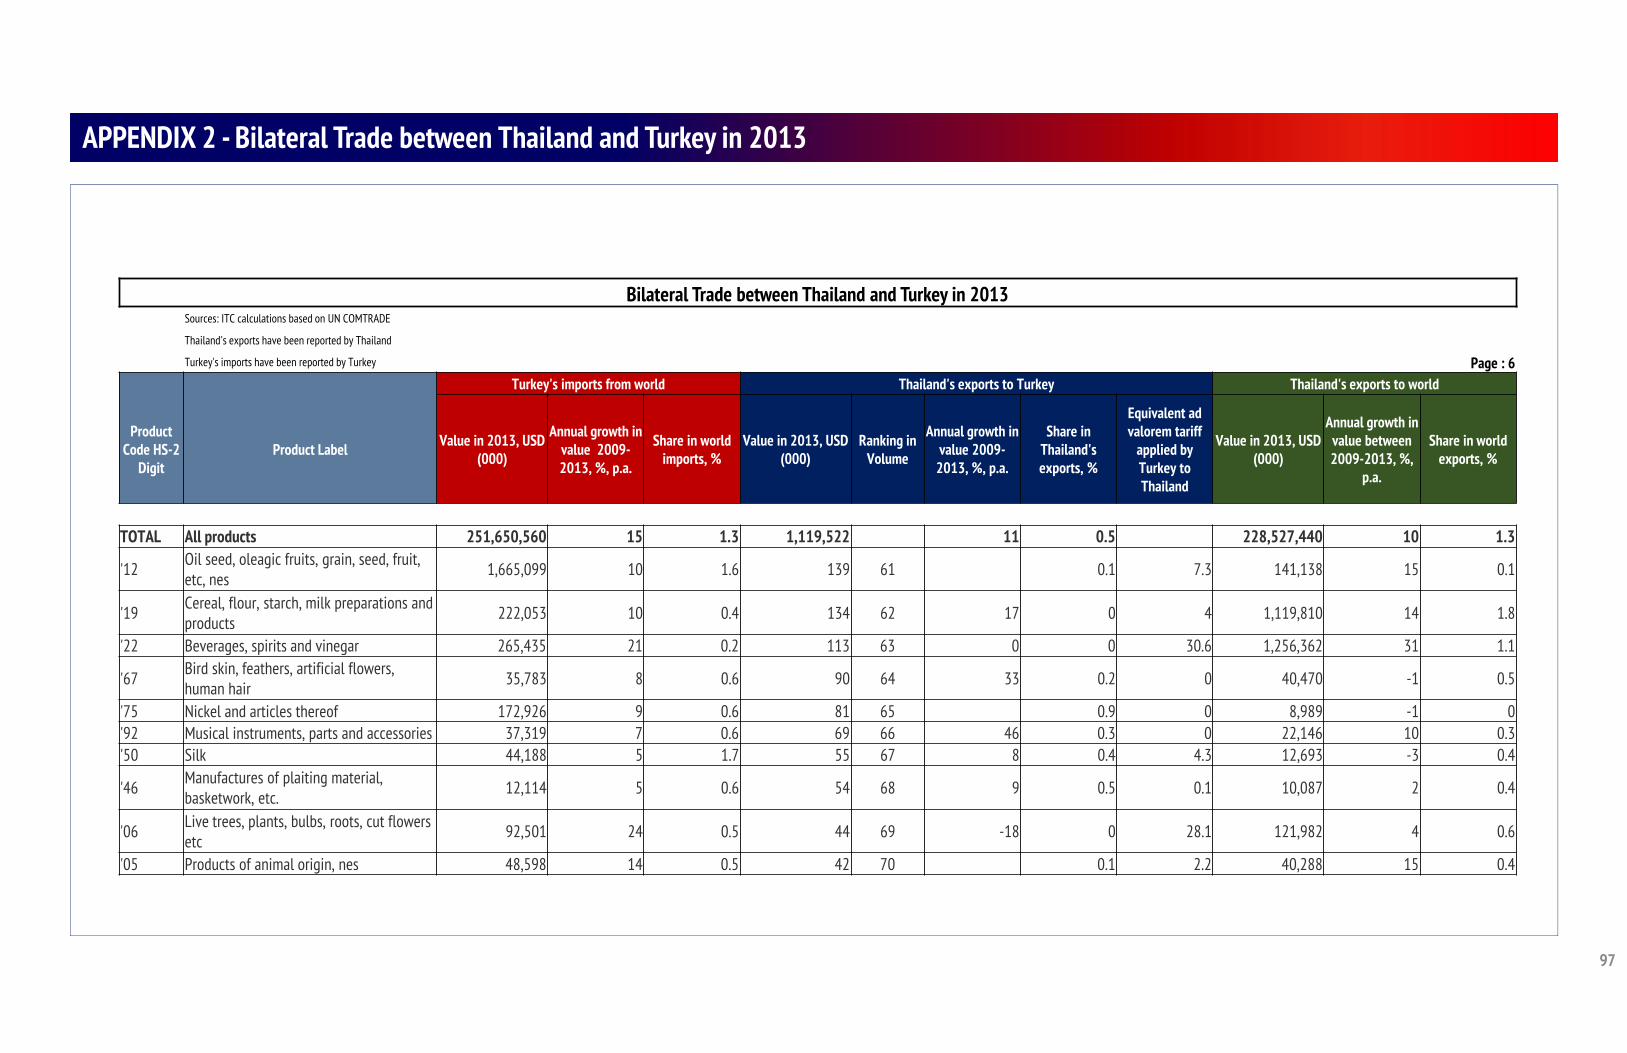
97
Bilateral Trade between Thailand and Turkey in 2013 Sources: ITC calculations based on UN COMTRADE
Thailand's exports have been reported by Thailand
Turkey's imports have been reported by Turkey Page : 6Turkey's imports from world Thailand's exports to Turkey Thailand's exports to world
Product Code HS-2
DigitProduct Label Value in 2013, USD
(000)
Annual growth in value 2009-2013, %, p.a.
Share in world imports, %
Value in 2013, USD (000)
Ranking in Volume
Annual growth in value 2009-
2013, %, p.a.
Share in Thailand's exports, %
Equivalent ad valorem tariff
applied by Turkey to Thailand
Value in 2013, USD (000)
Annual growth in value between 2009-2013, %,
p.a.
Share in world exports, %
TOTAL All products 251,650,560 15 1.3 1,119,522 11 0.5 228,527,440 10 1.3
'12 Oil seed, oleagic fruits, grain, seed, fruit, etc, nes 1,665,099 10 1.6 139 61 0.1 7.3 141,138 15 0.1
'19 Cereal, flour, starch, milk preparations and products 222,053 10 0.4 134 62 17 0 4 1,119,810 14 1.8
'22 Beverages, spirits and vinegar 265,435 21 0.2 113 63 0 0 30.6 1,256,362 31 1.1
'67 Bird skin, feathers, artificial flowers, human hair 35,783 8 0.6 90 64 33 0.2 0 40,470 -1 0.5
'75 Nickel and articles thereof 172,926 9 0.6 81 65 0.9 0 8,989 -1 0'92 Musical instruments, parts and accessories 37,319 7 0.6 69 66 46 0.3 0 22,146 10 0.3'50 Silk 44,188 5 1.7 55 67 8 0.4 4.3 12,693 -3 0.4
'46 Manufactures of plaiting material, basketwork, etc. 12,114 5 0.6 54 68 9 0.5 0.1 10,087 2 0.4
'06 Live trees, plants, bulbs, roots, cut flowers etc 92,501 24 0.5 44 69 -18 0 28.1 121,982 4 0.6
'05 Products of animal origin, nes 48,598 14 0.5 42 70 0.1 2.2 40,288 15 0.4
APPENDIX 2 - Bilateral Trade between Thailand and Turkey in 2013

98
Bilateral Trade between Thailand and Turkey in 2013 Sources: ITC calculations based on UN COMTRADE
Thailand's exports have been reported by Thailand
Turkey's imports have been reported by Turkey Page : 7Turkey's imports from world Thailand's exports to Turkey Thailand's exports to world
Product Code HS-2
DigitProduct Label Value in 2013, USD
(000)
Annual growth in value 2009-2013, %, p.a.
Share in world imports, %
Value in 2013, USD (000)
Ranking in Volume
Annual growth in value 2009-
2013, %, p.a.
Share in Thailand's exports, %
Equivalent ad valorem tariff
applied by Turkey to Thailand
Value in 2013, USD (000)
Annual growth in value between 2009-2013, %,
p.a.
Share in world exports, %
TOTAL All products 251,650,560 15 1.3 1,119,522 11 0.5 228,527,440 10 1.3'79 Zinc and articles thereof 520,797 17 3.9 41 71 -28 0.1 0.2 60,250 -3 0.5
'14 Vegetable plaiting materials, vegetable products 10,259 20 1 35 72 -34 0.6 0 5,420 5 0.7
'49 Printed books, newspapers, pictures etc 176,832 9 0.4 28 73 3 0 0 93,257 -58 0.2
'97 Works of art, collectors pieces and antiques 49,979 38 0.2 25 74 78 0.4 0 6,612 1 0
'31 Fertilizers 1,492,105 10 2 22 75 0 3.7 124,085 15 0.2
'25 Salt, sulphur, earth, stone, plaster, lime and cement 397,852 12 0.8 19 76 -21 0 0.1 859,929 2 1.9
'74 Copper and articles thereof 3,709,789 15 2.2 6 77 -48 0 0.5 1,402,953 21 0.9'45 Cork and articles of cork 7,604 10 0.4 3 78 2.4 0.5 125 8 0
'66 Umbrellas, walking-sticks, seat-sticks, whips, etc 33,601 2 1.1 2 79 0.1 1.2 2,965 5 0.1
'09 Coffee, tea, mate and spices 146,674 18 0.3 2 80 0 44.4 57,160 3 0.1
APPENDIX 2 - Bilateral Trade between Thailand and Turkey in 2013
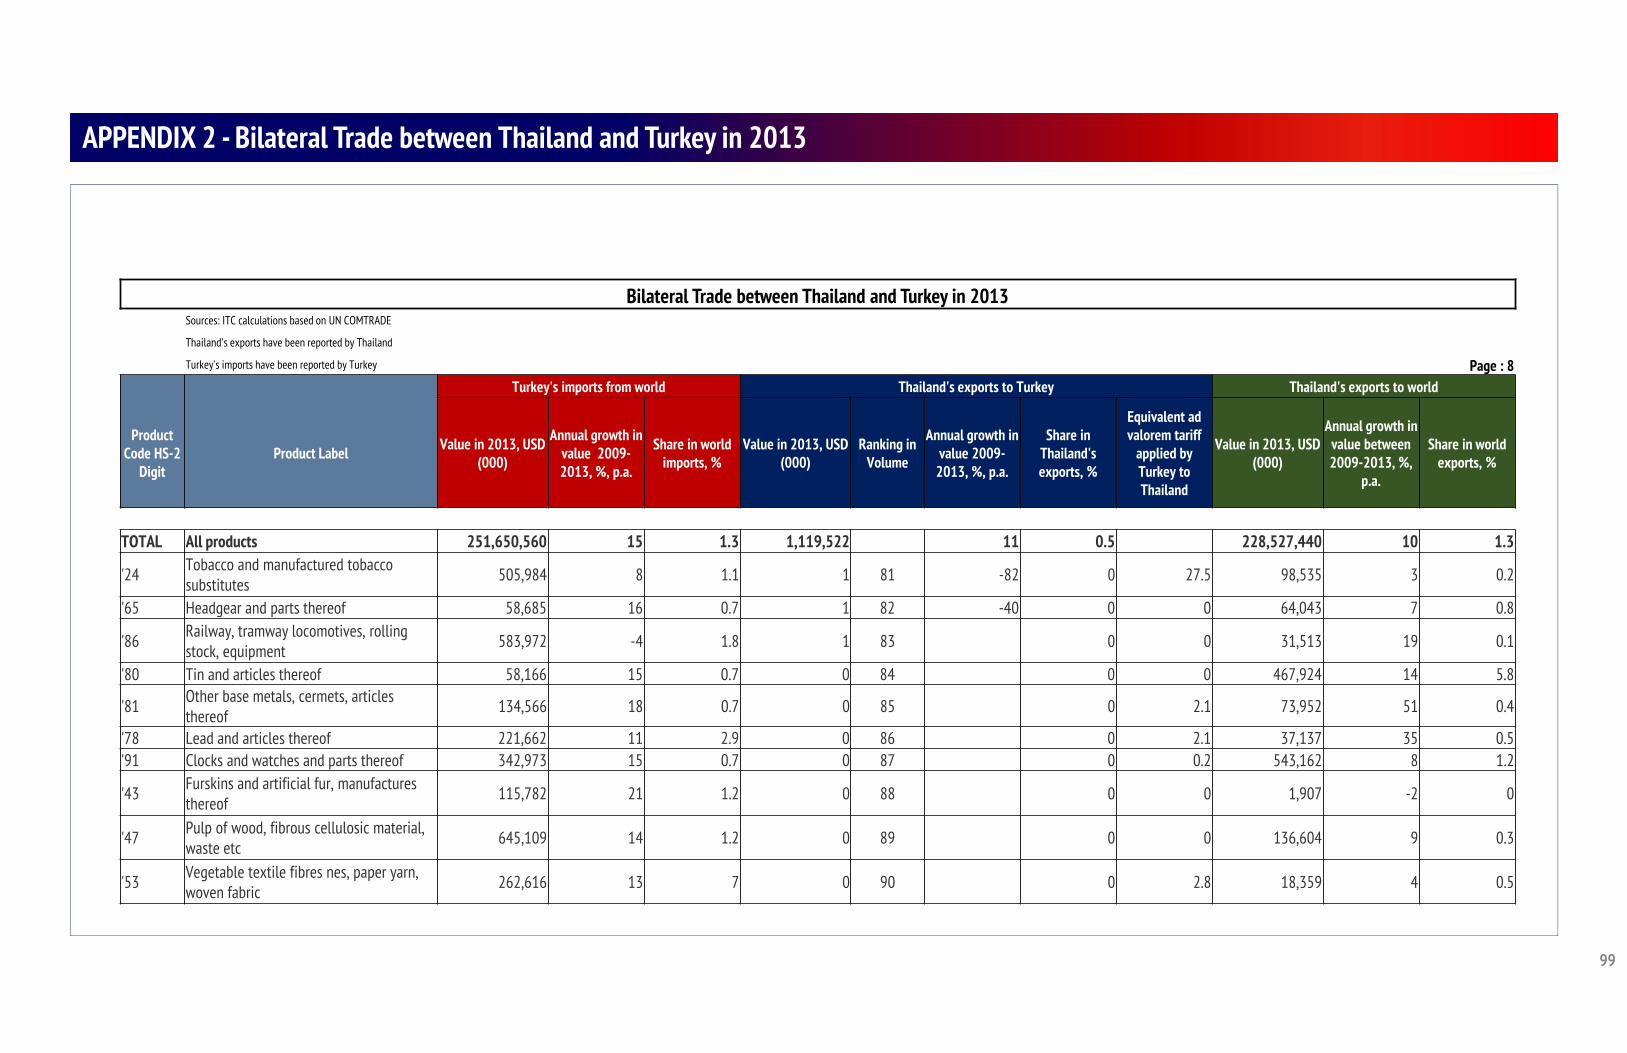
99
Bilateral Trade between Thailand and Turkey in 2013 Sources: ITC calculations based on UN COMTRADE
Thailand's exports have been reported by Thailand
Turkey's imports have been reported by Turkey Page : 8Turkey's imports from world Thailand's exports to Turkey Thailand's exports to world
Product Code HS-2
DigitProduct Label Value in 2013, USD
(000)
Annual growth in value 2009-2013, %, p.a.
Share in world imports, %
Value in 2013, USD (000)
Ranking in Volume
Annual growth in value 2009-
2013, %, p.a.
Share in Thailand's exports, %
Equivalent ad valorem tariff
applied by Turkey to Thailand
Value in 2013, USD (000)
Annual growth in value between 2009-2013, %,
p.a.
Share in world exports, %
TOTAL All products 251,650,560 15 1.3 1,119,522 11 0.5 228,527,440 10 1.3
'24 Tobacco and manufactured tobacco substitutes 505,984 8 1.1 1 81 -82 0 27.5 98,535 3 0.2
'65 Headgear and parts thereof 58,685 16 0.7 1 82 -40 0 0 64,043 7 0.8
'86 Railway, tramway locomotives, rolling stock, equipment 583,972 -4 1.8 1 83 0 0 31,513 19 0.1
'80 Tin and articles thereof 58,166 15 0.7 0 84 0 0 467,924 14 5.8
'81 Other base metals, cermets, articles thereof 134,566 18 0.7 0 85 0 2.1 73,952 51 0.4
'78 Lead and articles thereof 221,662 11 2.9 0 86 0 2.1 37,137 35 0.5'91 Clocks and watches and parts thereof 342,973 15 0.7 0 87 0 0.2 543,162 8 1.2
'43 Furskins and artificial fur, manufactures thereof 115,782 21 1.2 0 88 0 0 1,907 -2 0
'47 Pulp of wood, fibrous cellulosic material, waste etc 645,109 14 1.2 0 89 0 0 136,604 9 0.3
'53 Vegetable textile fibres nes, paper yarn, woven fabric 262,616 13 7 0 90 0 2.8 18,359 4 0.5
APPENDIX 2 - Bilateral Trade between Thailand and Turkey in 2013

100
Bilateral Trade between Thailand and Turkey in 2013 Sources: ITC calculations based on UN COMTRADE
Thailand's exports have been reported by Thailand
Turkey's imports have been reported by Turkey Page : 9Turkey's imports from world Thailand's exports to Turkey Thailand's exports to world
Product Code HS-2
DigitProduct Label Value in 2013, USD
(000)
Annual growth in value 2009-2013, %, p.a.
Share in world imports, %
Value in 2013, USD (000)
Ranking in Volume
Annual growth in value 2009-
2013, %, p.a.
Share in Thailand's exports, %
Equivalent ad valorem tariff
applied by Turkey to Thailand
Value in 2013, USD (000)
Annual growth in value between 2009-2013, %,
p.a.
Share in world exports, %
TOTAL All products 251,650,560 15 1.3 1,119,522 11 0.5 228,527,440 10 1.3
'36 Explosives, pyrotechnics, matches, pyrophorics, etc. 55,176 17 1.2 0 91 0 0 10,938 8 0.2
'04 Dairy products, eggs, honey, edible animal product 160,003 5 0.2 0 92 0 125.7 252,279 8 0.3
'01 Live animals 346,448 75 1.6 0 93 0 51.9 115,954 2 0.5'02 Meat and edible meat offal 25,275 58 0 0 94 0 185.5 420,702 67 0.3'18 Cocoa and cocoa preparations 512,092 12 1.2 0 95 0 4 65,054 -2 0.1
'13 Lac, gums, resins, vegetable saps and extracts nes 44,082 12 0.5 0 96 0 3.1 47,912 25 0.5
APPENDIX 2 - Bilateral Trade between Thailand and Turkey in 2013