Embed Size (px)
Citation preview
Presentation to the Portfolio Committee on Trade
and Industry ECIC Annual Report
Export Credit Insurance Corporation of South Africa
SOC Limited (ECIC)
9 October 2013 1

Lesego Mosupye Chief Risk Officer Tel: 012 471 3817 or 082 558 4106 [email protected]
Sedzani Mudau Chief Financial Officer Tel: 012 471 3814 [email protected]
Abel Mawela Non Executive Director (Chairperson of the Audit & Risk Committee) Tel: 083 266 1236 [email protected]
Lindelani Mphaphuli General Counsel Tel: 012 471 3813 [email protected]
2
ECIC REPRESENTATIVES
CONTENTS
• INTRODUCTION
• 2012/13 PERFORMANCE REVIEW
• LATEST PERFORMANCE REVIEW FOR 2013/14 AS AT 30 JUNE 2013
• FORWARD FUNDING REQUIREMENTS FOR 2014/15 MTEF
3
• The official Export Credit Agency for the Republic of South Africa
• Established as a SOE in 2001 in terms of the Export Credit and Foreign Investment Insurance Act (1957), as amended
• Mandated to promote exports of South African goods and services by providing insurance
• We therefore specify and monitor the level of SA content on supported export contracts
• We are subject to the PFMA, Companies Act and the Short Term Insurance Act
4
INTRODUCTION

Office of CEO
CRO
Risk
Internal Audit
IT
COO
Underwriting
Political & Economic Research
Portfolio Management
Business Development & Marketing
CFO
Finance
Procurement & Office
Management
Investment Portfolio
Management
General Counsel
Legal
Corporate Secretariat
Compliance
Actuarial HR
5
INTRODUCTION
Organisational Structure

• 2012/13 was a successful year for ECIC
• We met or exceeded all our targets in the strategic plan
• We grew the insurance portfolio by 58% to R17 billion
• An estimated R2,7 billion of value adding exports were facilitated in 2012/13
• An estimated 15,327 jobs are expected to be created / sustained in 2012/13
• We grew the balance sheet by R1 billion to R5 billion
• We achieved a clean audit
6
INTRODUCTION
2012/13 Performance Review
OBJECTIVE PERFORMANCE/ KEY INDICATOR
MEASURE 2012/13 TARGET 2012/13 RESULT
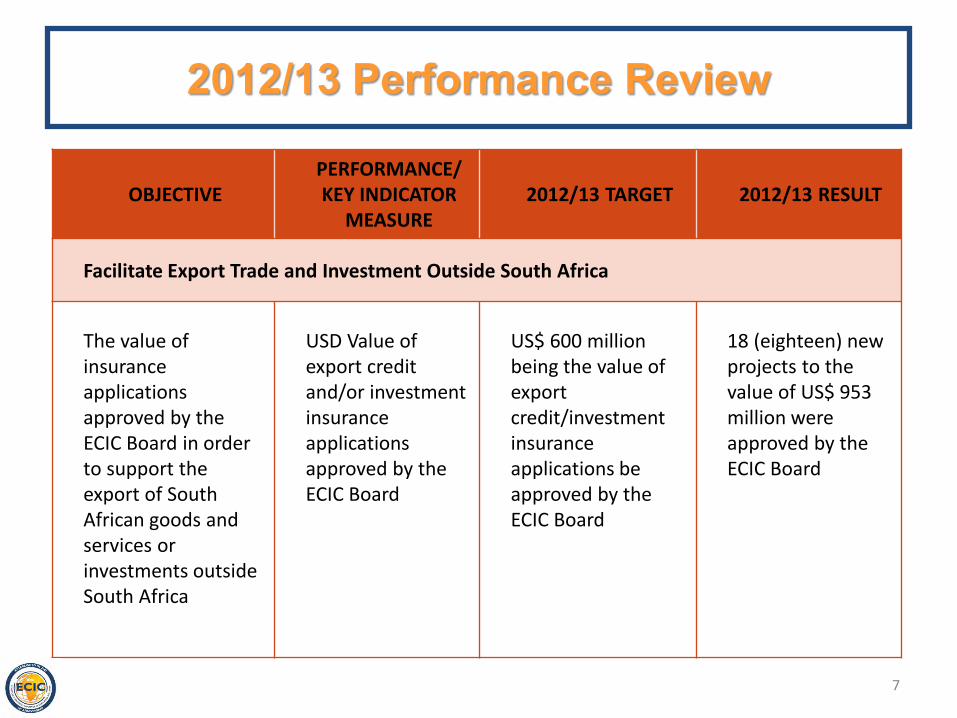
Facilitate Export Trade and Investment Outside South Africa
The value of insurance applications approved by the ECIC Board in order to support the export of South African goods and services or investments outside South Africa
USD Value of export credit and/or investment insurance applications approved by the ECIC Board
US$ 600 million being the value of export credit/investment insurance applications be approved by the ECIC Board
18 (eighteen) new projects to the value of US$ 953 million were approved by the ECIC Board
7
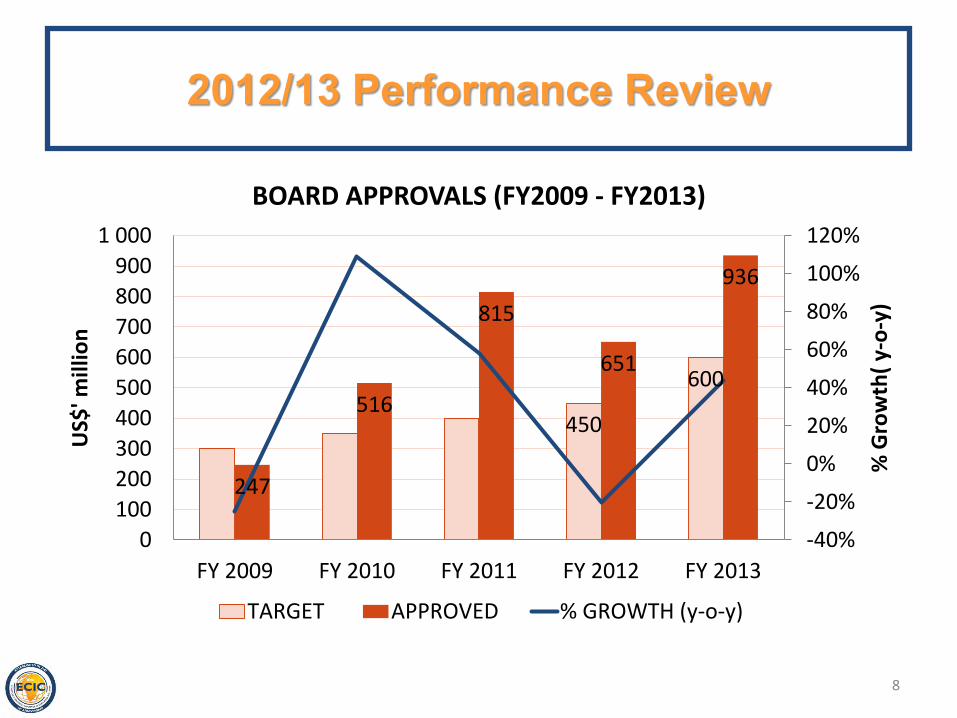
450
600
247
516
815
651
936
-40%
-20%
0%
20%
40%
60%
80%
100%
120%
0
100
200
300
400
500
600
700
800
900
1 000
FY 2009 FY 2010 FY 2011 FY 2012 FY 2013
% G
row
th(
y-o
-y)
US$
' mill
ion
BOARD APPROVALS (FY2009 - FY2013)
TARGET APPROVED % GROWTH (y-o-y)
2012/13 Performance Review
8
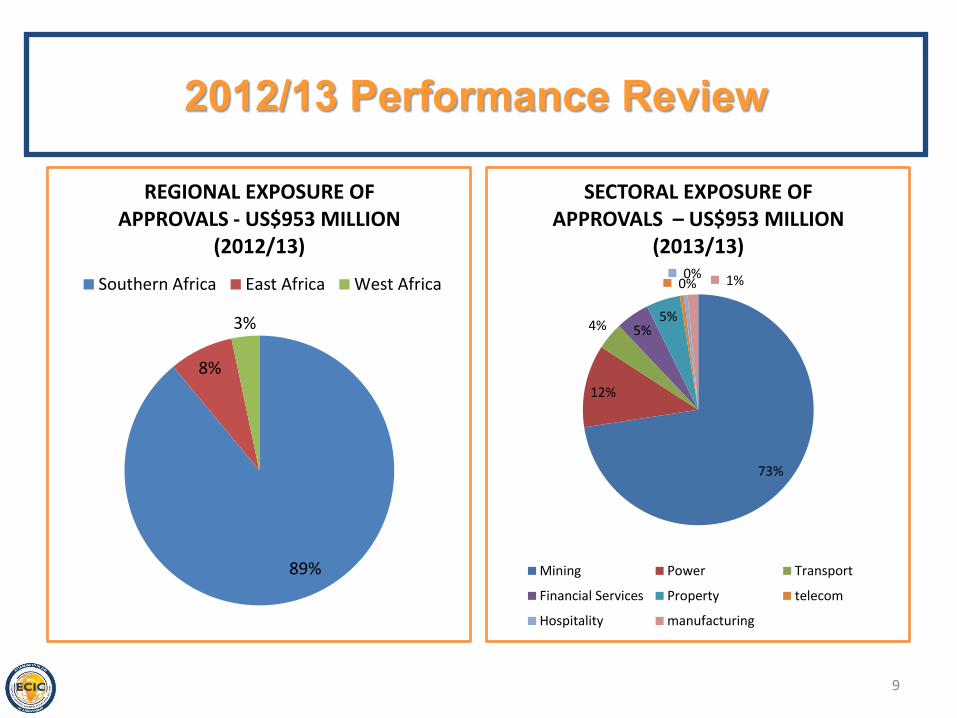
89%
8%
3%
REGIONAL EXPOSURE OF APPROVALS - US$953 MILLION
(2012/13)
Southern Africa East Africa West Africa
2012/13 Performance Review
73%
12%
4% 5% 5%
0% 0% 1%
SECTORAL EXPOSURE OF APPROVALS – US$953 MILLION
(2013/13)
Mining Power Transport
Financial Services Property telecom
Hospitality manufacturing
9

OBJECTIVE PERFORMANCE/ KEY INDICATOR
MEASURE 2012/13 TARGET 2012/13 RESULT
Facilitate Export Trade and Investment Outside South Africa
The value of export credit and/or investment insurance policies signed by ECIC to support the export of South African goods and services or investments outside South Africa
USD Value of export credit and/or investment insurance policies signed by ECIC during the financial year
US$ 200 million being the value of export credit/investment insurance policies to be signed by ECIC in this specific financial year
14 (fourteen) new policies to the value of US$ 769 million were signed
2012/13 Performance Review
10

11
0
2
4
6
8
10
12
14
0
100
200
300
400
500
600
700
800
900
1 2 3 4 5
US$
’ mill
ion
POLICIES SIGNED FY 2009 – FY 2013
Export Credit Policies Investment Guarantee Policies No. of Policies Signed
2012/13 Performance Review

OBJECTIVE PERFORMANCE/ KEY INDICATOR
MEASURE 2012/13 TARGET 2012/13 RESULT
Facilitate Export Trade and Investment Outside South Africa
The value of loans disbursed and/or investment insurance exposures declared under insurance policies signed by ECIC to support the export of South African goods or investments outside South Africa
USD Value of loans disbursed and/or investment insurance exposures declared under insurance policies that are effective under the ECIC insurance/re-insurance portfolio
US$ 180 million being the value of loans disbursed and/or investment insurance exposures declared for the specific financial year under insurance policies that are effective under the ECIC insurance/re-insurance portfolio
US$ 1,240 billion of loans disbursed and investment insurance exposures were declared
2012/13 Performance Review
12

13
2012/13 Performance Review
0
200
400
600
800
1 000
1 200
1 400
FY 2009 FY 2010 FY 2011 FY 2012 FY 2013
US$
’ mill
ion
USD VALUE OF DRAWDOWNS AND DECLARATIONS (FY2009 – FY2013)
Board Approvals Policies Signed Drawdowns and Declarations

14
-
100
200
300
400
500
600
700
800
900
IMU supported Export Credit business Non IMU supported Investment Insurancebusiness
US$
' mill
ion
FY 2013 DRAWDOWNS & DECLARATIONS SPLIT BY BUSINESS LINES AND SECTOR
mining Roads Infrastructure Telecomunications Manufacturing
Transport Power Hospitality Agro Industries
R5 Billion*
R7 Billion*
2012/13 Performance Review
* Year-end exchange rate was R9.2521
15
2012/13 Performance Review
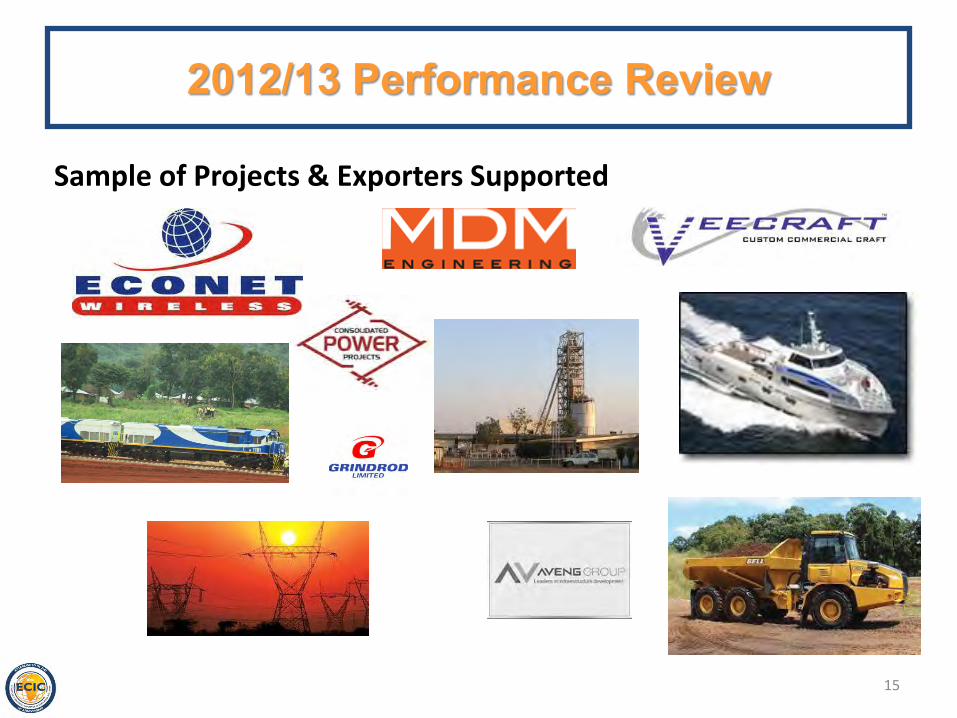
Sample of Projects & Exporters Supported

IMPACT OF ECIC ON THE SOUTH AFRICAN ECONOMY • Over the financial year period 2009/10-2012/13, the ECIC supported projects to
the value of R12.8 billion
16
947 2 660 3 736
5 450 3 607
7 343
12 793
-
2 000
4 000
6 000
8 000
10 000
12 000
14 000
2009/10 2010/11 2011/12 2012/13
R‘ m
illio
n
Value of ECIC Effective Policies*
Loan Values Cumulative
*Amounts exclude approved applications which are not yet policies
2012/13 Performance Review
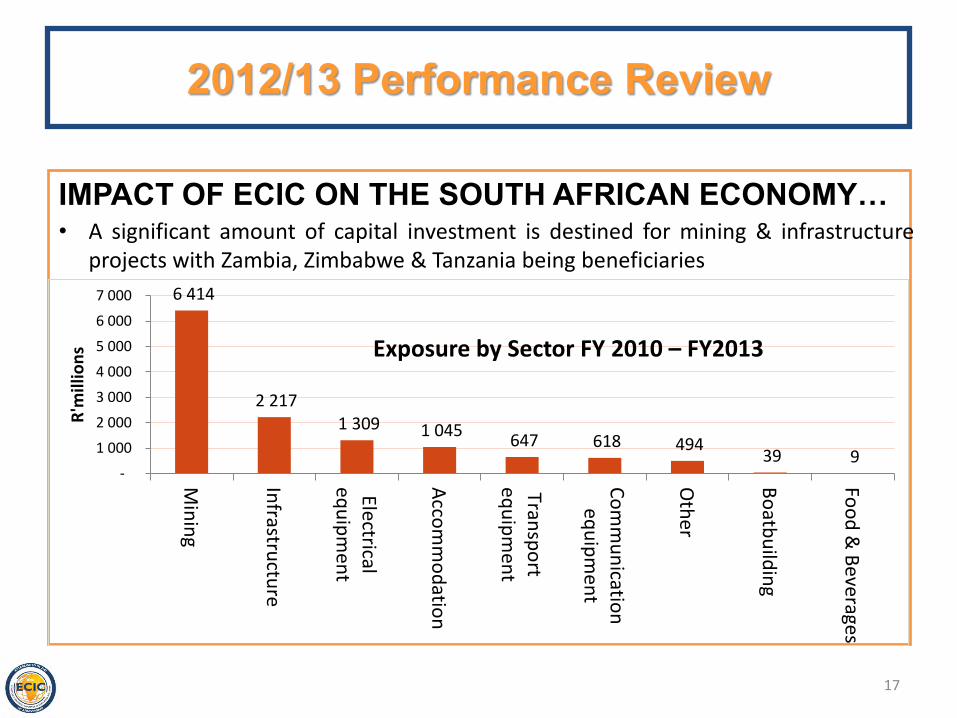
IMPACT OF ECIC ON THE SOUTH AFRICAN ECONOMY…
17
• A significant amount of capital investment is destined for mining & infrastructure projects with Zambia, Zimbabwe & Tanzania being beneficiaries
6 414
2 217 1 309 1 045
647 618 494 39 9
-
1 000
2 000
3 000
4 000
5 000
6 000
7 000
Min
ing
Infrastru
cture
Electricaleq
uip
men
t
Acco
mm
od
ation
Transp
ort
equ
ipm
ent
Co
mm
un
ication
equ
ipm
ent
Oth
er
Bo
atbu
ildin
g
Foo
d &
Beve
rages
R'm
illio
ns Exposure by Sector FY 2010 – FY2013
2012/13 Performance Review

IMPACT OF ECIC ON THE SOUTH AFRICAN ECONOMY…
18
• R13.1 billion has been added to the South African economy
3 941
2 638 2 587
3 969
6 579
9 166
13 135
-
2 000
4 000
6 000
8 000
10 000
12 000
14 000
2009/10 2010/11 2011/12 2012/13
R'm
illio
n
GDP Impact
GDP Cumulative
2012/13 Performance Review

IMPACT OF ECIC ON THE SOUTH AFRICAN ECONOMY…
19
• Approximately 48 000 job opportunities have been created/sustained
8 714 8 831 15 327 15 177
23 891
32 722
48 049
-
10 000
20 000
30 000
40 000
50 000
60 000
2009/10 2010/11 2011/12 2012/13
Nu
mb
er
of
Job
s
Employment Impact
Employment Cumulative
2012/13 Performance Review

IMPACT OF ECIC ON THE SOUTH AFRICAN ECONOMY…
20
• Most job opportunities have been created in the manufacturing sector
12 659
1 881 3 176
12 910
2 517
6 833 5 655
2 417
-
2 000
4 000
6 000
8 000
10 000
12 000
14 000
16 000
18 000
2009/10 2010/11 2011/12 2012/13
Nu
mb
er
of
Job
s
Employment Impact by Sector
Financial &BusinessServices
Manufacturing
*Manufacturing include capital equipment & machinery used in mining, transport and construction industries
2012/13 Performance Review
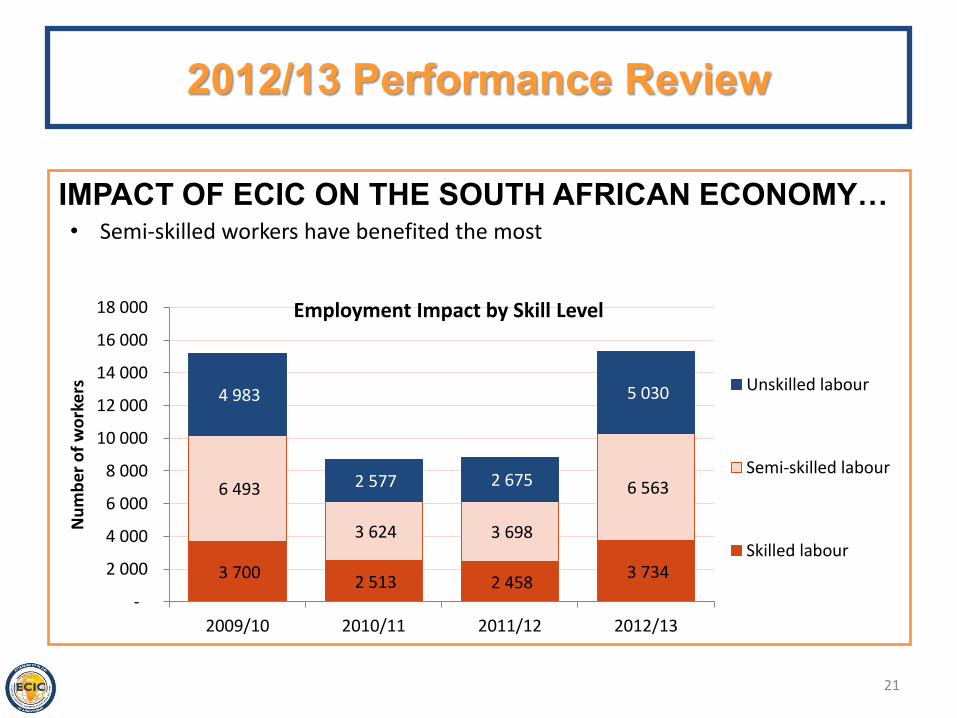
IMPACT OF ECIC ON THE SOUTH AFRICAN ECONOMY…
21
• Semi-skilled workers have benefited the most
3 700 2 513 2 458
3 734
6 493
3 624 3 698
6 563
4 983
2 577 2 675
5 030
-
2 000
4 000
6 000
8 000
10 000
12 000
14 000
16 000
18 000
2009/10 2010/11 2011/12 2012/13
Nu
mb
er
of
wo
rke
rs
Employment Impact by Skill Level
Unskilled labour
Semi-skilled labour
Skilled labour
2012/13 Performance Review
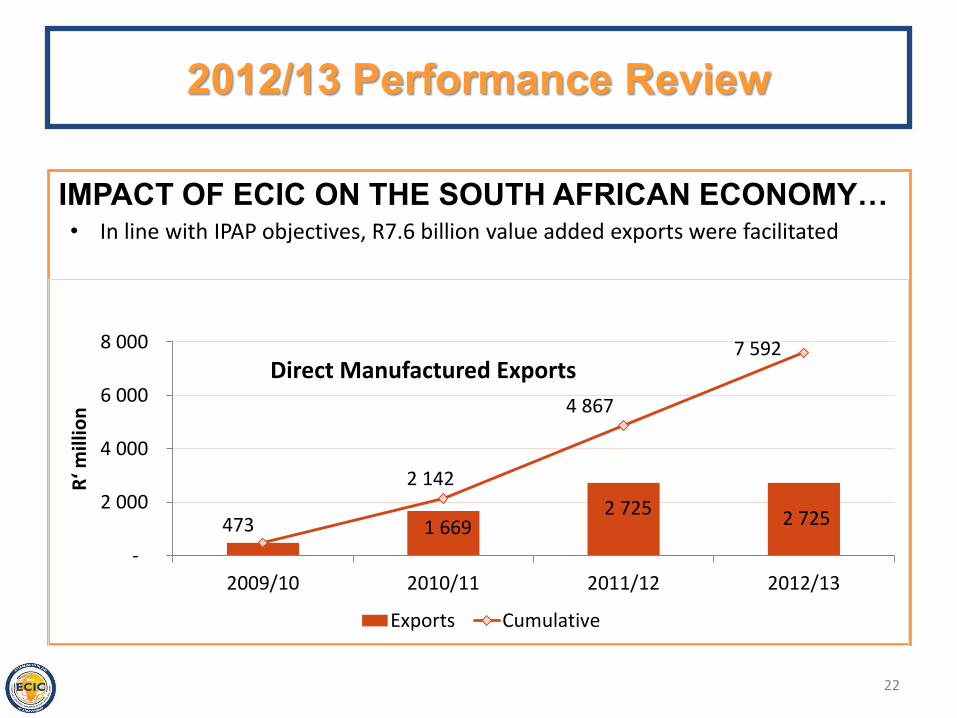
IMPACT OF ECIC ON THE SOUTH AFRICAN ECONOMY…
22
• In line with IPAP objectives, R7.6 billion value added exports were facilitated
473 1 669 2 725 2 725
2 142
4 867
7 592
-
2 000
4 000
6 000
8 000
2009/10 2010/11 2011/12 2012/13
R‘ m
illio
n
Direct Manufactured Exports
Exports Cumulative
2012/13 Performance Review

IMPACT OF ECIC ON THE SOUTH AFRICAN ECONOMY…
23
• Approximately R3.5 billion was added to the national fiscus
1 061
698 677 1 049
1 759
2 436
3 485
-
500
1 000
1 500
2 000
2 500
3 000
3 500
4 000
2009/10 2010/11 2011/12 2012/13
R‘ m
illio
n Fiscal Revenue Impact
Fiscal Revenue Cumulative
2012/13 Performance Review
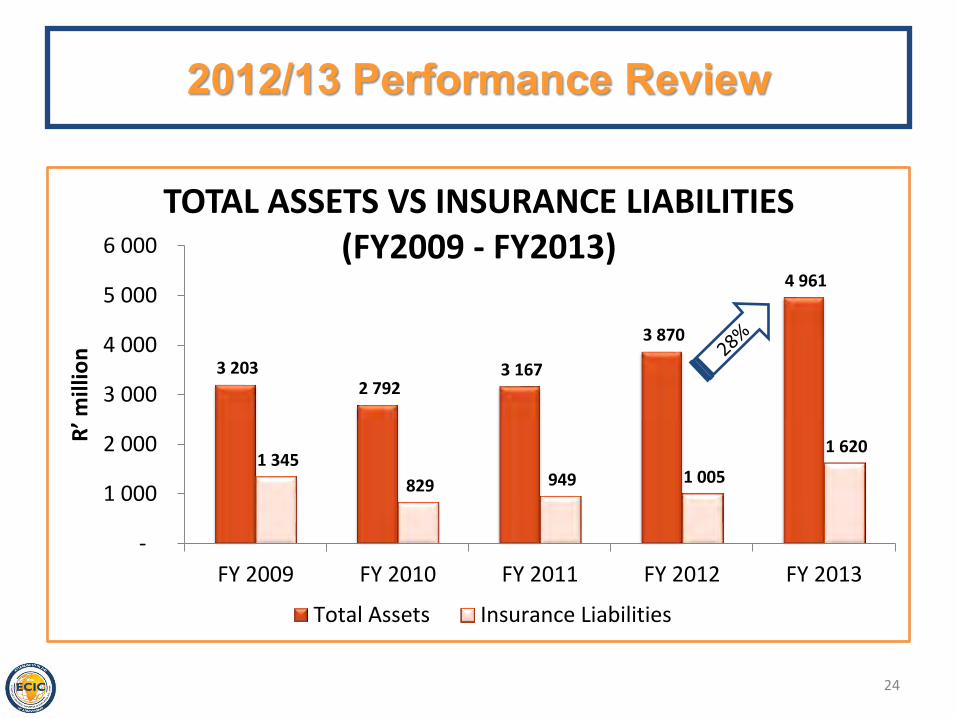
3 203 2 792
3 167
3 870
4 961
1 345
829 949 1 005
1 620
-
1 000
2 000
3 000
4 000
5 000
6 000
FY 2009 FY 2010 FY 2011 FY 2012 FY 2013
R’ m
illio
n
TOTAL ASSETS VS INSURANCE LIABILITIES (FY2009 - FY2013)
Total Assets Insurance Liabilities
2012/13 Performance Review
24
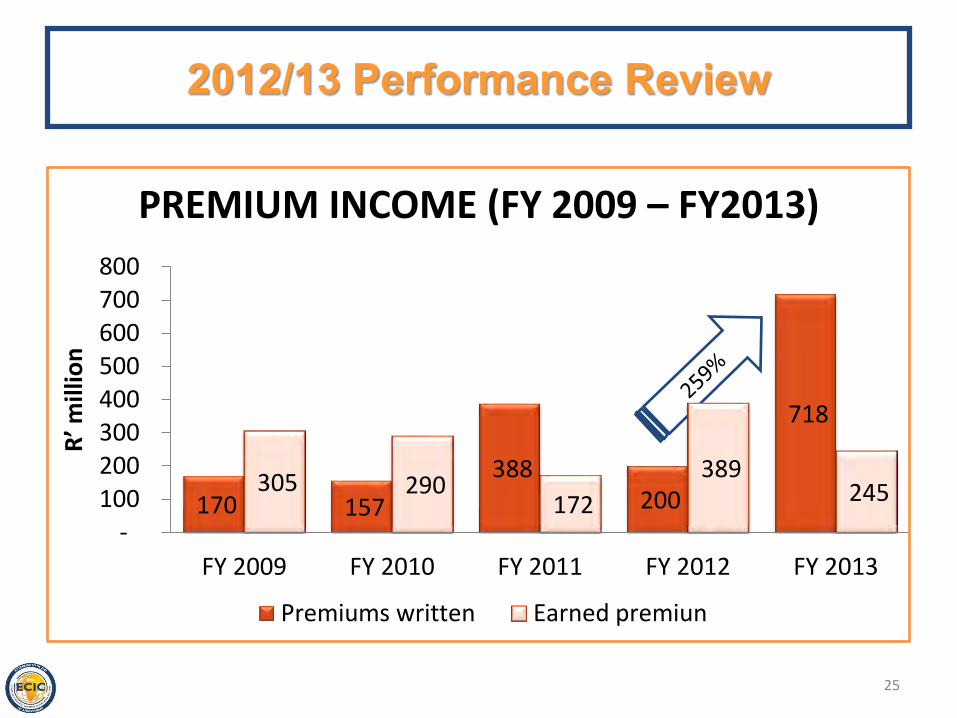
170 157
388 200
718
305 290 172
389 245
- 100 200 300 400 500 600 700 800
FY 2009 FY 2010 FY 2011 FY 2012 FY 2013
R’ m
illio
n
PREMIUM INCOME (FY 2009 – FY2013)
Premiums written Earned premiun
2012/13 Performance Review
25

2012/13 Performance Review
OBJECTIVE
PERFORMANCE/ KEY INDICATOR
MEASURE 2012/13 TARGET 2012/13 RESULT
Strategic Alliances: Build mutually-beneficial local, regional and global relations to advance South Africa’s trade and economic development objectives
Initiate cooperation agreements or arrangements with ECAs or DFIs in Africa, Middle East or other members of BRICS and other developing nations
The number of Co-operation agreements or arrangements initiated with ECAs or DFIs in Africa, Middle East or other members of BRICS and other developing nations
Initiate draft co-operation agreements or arrangements with two of the targeted ECAs or DFIs
Two co-operation agreements were initiated with ATI and EXIAR.
26

• We participate in the Berne Union and Prague Club so as to stay abreast of the latest international developments in our line of business.
• We represent South Africa as observer member on the OECD export credit working committee
• We entered into co-operation agreements with EXIAR, the Russian ECIA as well as ATI, the multi-lateral credit insurance agency based in Nairobi, Kenya. We work with these ECAs to share expertise and know-how.
2012/13 Performance Review
27

OBJECTIVE PERFORMANCE/ KEY INDICATOR
MEASURE 2012/13 TARGET 2012/13 RESULT
Promote a professional, competitive and customer focused workforce that ensures an effective and efficient service to our customers
Raise awareness of ECIC and/or ECIC products by engaging with various export promotion agencies and/or economic development agencies or through conferences in the various provinces in South Africa
The number of ECIC product presentations or awareness sessions held with export promotion agencies and/or with economic development agencies or through conferences in the various provinces in South Africa
12 ECIC product presentations or awareness sessions held with export promotion agencies and/or with economic development agencies or through conferences in the various provinces in South Africa
Twenty nine presentations to conferences and export promotion workshops covering all nine provinces were held
2012/13 Performance Review
28
• We raise awareness of ECIC products by engaging with key structures that can provide us access to our target market and stakeholder who comprise manufacturers and exporters of capital goods and services
• The key structures we use include:
• Export councils and profession associations
• Business chambers
• Government agencies
• Provincial economic development agencies
• For the financial year 2012/13 we met with 29 different organisations across South Africa and their members to share information on ECIC and its products
2012/13 Performance Review
29

We participate in various export or industry related conference as speaker or sponsor Our long running sponsorship is for the Annual Mining Indaba conference which focuses on mining projects on the Africa continent We have found our participation on this conference to be beneficial as it has led to a number of new applications for ECIC products
2012/13 Performance Review
30
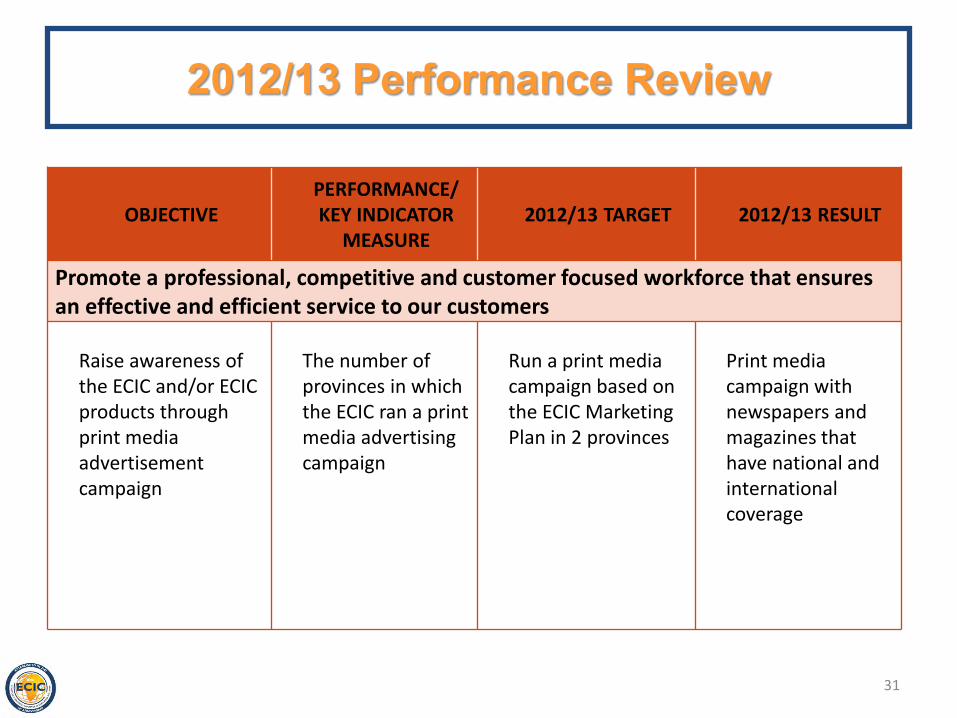
OBJECTIVE PERFORMANCE/ KEY INDICATOR
MEASURE 2012/13 TARGET 2012/13 RESULT
Promote a professional, competitive and customer focused workforce that ensures an effective and efficient service to our customers
Raise awareness of the ECIC and/or ECIC products through print media advertisement campaign
The number of provinces in which the ECIC ran a print media advertising campaign
Run a print media campaign based on the ECIC Marketing Plan in 2 provinces
Print media campaign with newspapers and magazines that have national and international coverage
2012/13 Performance Review
31
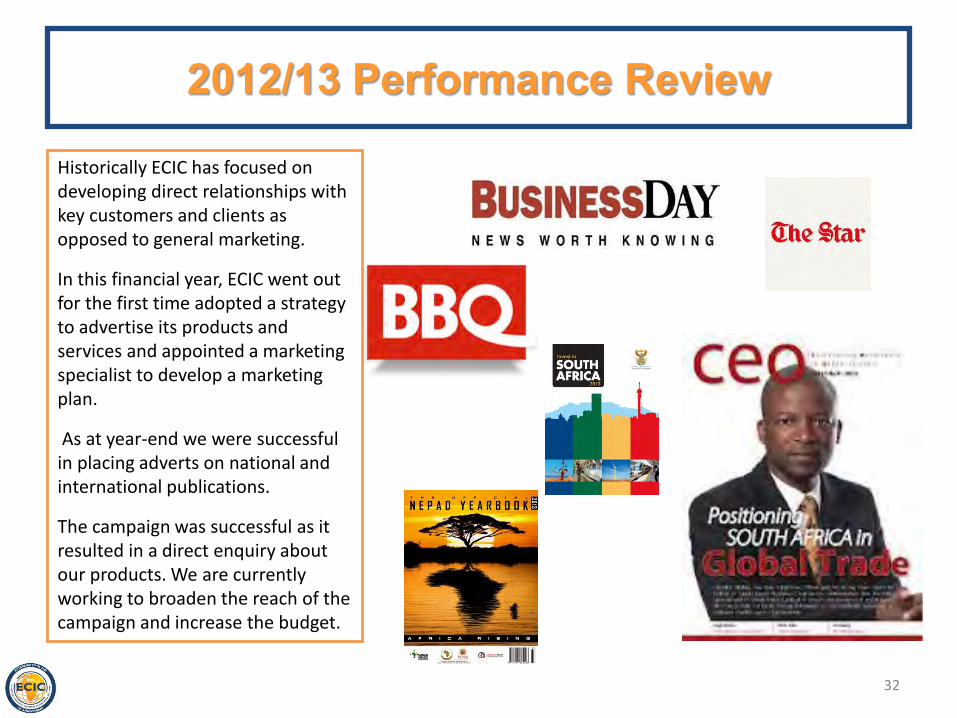
Historically ECIC has focused on developing direct relationships with key customers and clients as opposed to general marketing.
In this financial year, ECIC went out for the first time adopted a strategy to advertise its products and services and appointed a marketing specialist to develop a marketing plan.
As at year-end we were successful in placing adverts on national and international publications.
The campaign was successful as it resulted in a direct enquiry about our products. We are currently working to broaden the reach of the campaign and increase the budget.
2012/13 Performance Review
32
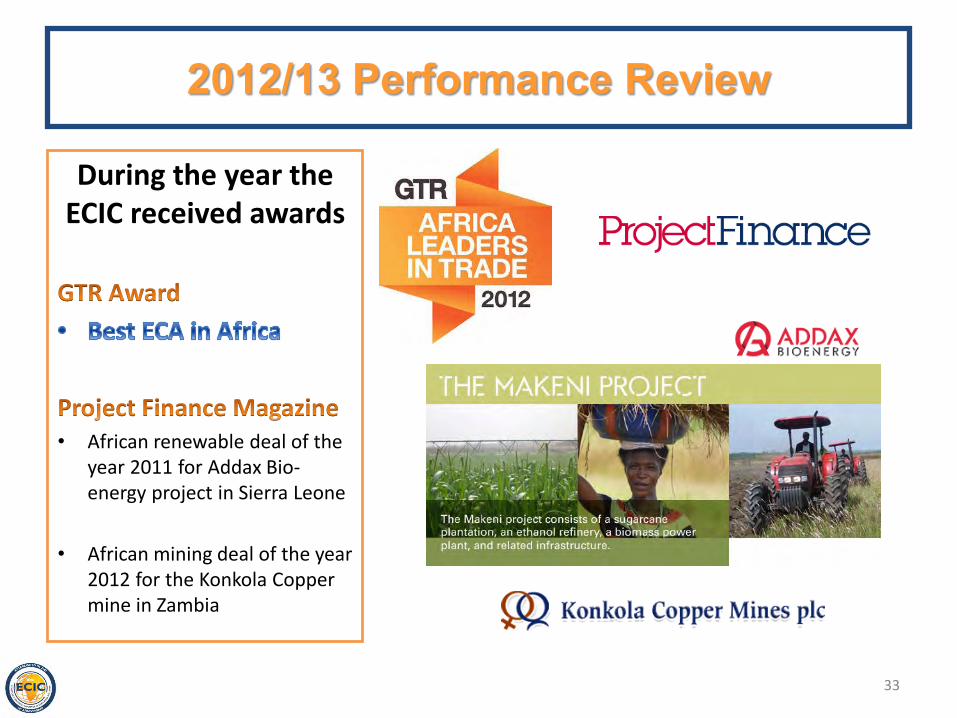
During the year the ECIC received awards
• African renewable deal of the year 2011 for Addax Bio-energy project in Sierra Leone
• African mining deal of the year 2012 for the Konkola Copper mine in Zambia
33
2012/13 Performance Review

34
OBJECTIVE PERFORMANCE/ KEY INDICATOR
MEASURE 2012/13 TARGET 2012/13 RESULT
Fostering risk orientation: Create an enterprise wide risk awareness and effective corporate governance and risk management practices
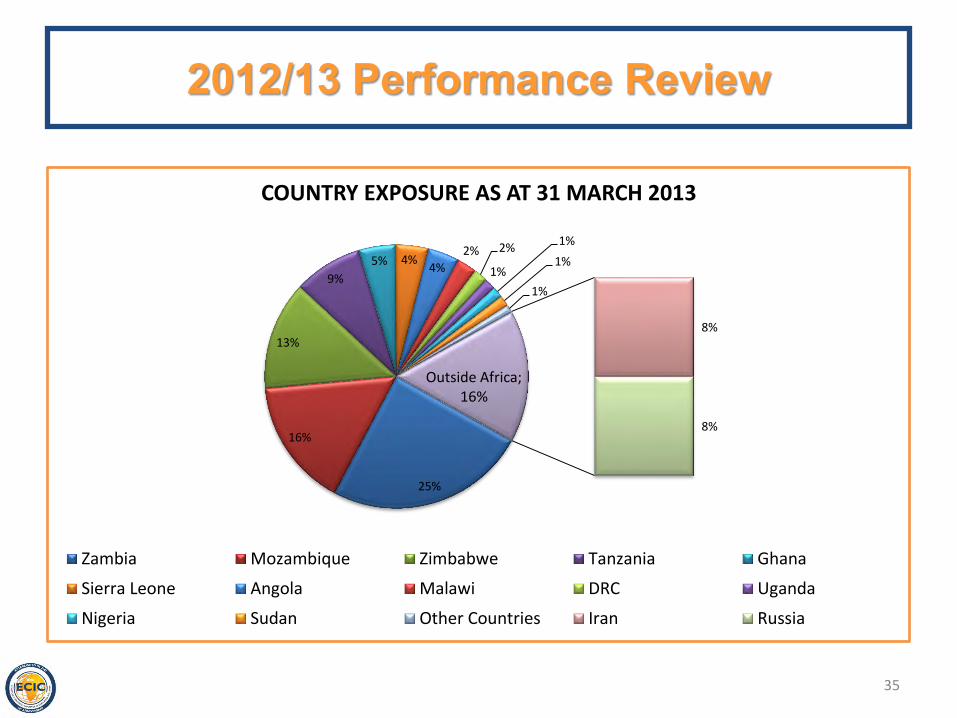
Reduce the concentration of the ECIC insurance and re-insurance portfolio with reference to country exposure
The single largest country exposure as a percentage of the total ECIC insurance portfolio not exceeding the target
The single largest country exposure as a percentage of the total ECIC insurance portfolio not exceeding 34%
The single largest country exposure as at 31 March 2013 is Zambia at 25% of the portfolio which is within the 34% target range
2012/13 Performance Review
35
2012/13 Performance Review
25%
16%
13%
9%
5% 4% 4%
2% 2%
1%
1%
1%
1%
8%
8%
Outside Africa; 16%
COUNTRY EXPOSURE AS AT 31 MARCH 2013
Zambia Mozambique Zimbabwe Tanzania Ghana
Sierra Leone Angola Malawi DRC Uganda
Nigeria Sudan Other Countries Iran Russia
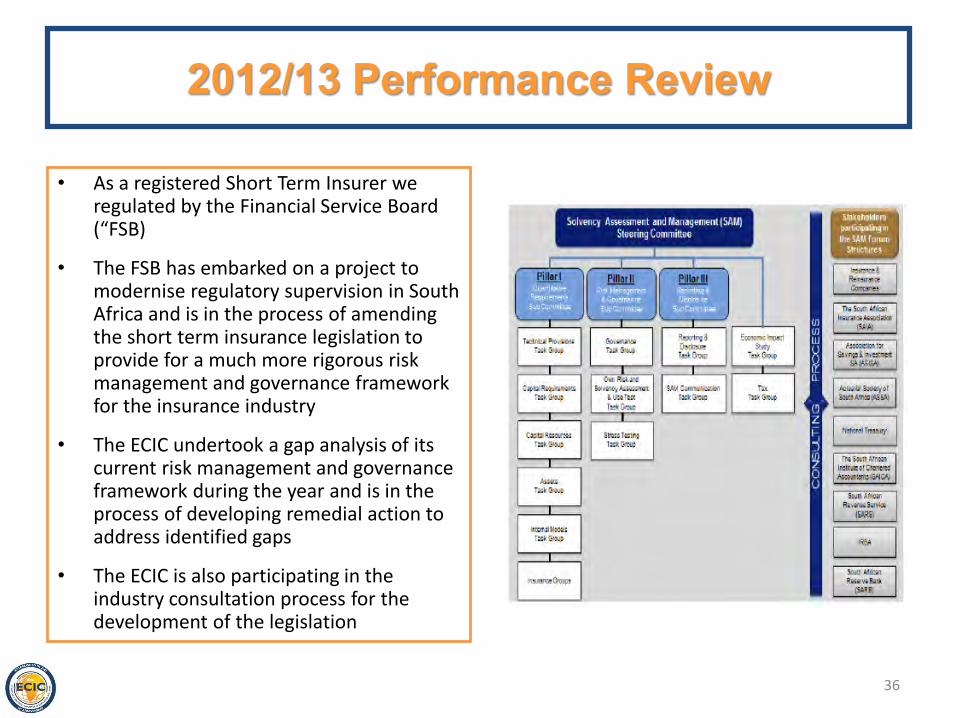
• As a registered Short Term Insurer we regulated by the Financial Service Board (“FSB)
• The FSB has embarked on a project to modernise regulatory supervision in South Africa and is in the process of amending the short term insurance legislation to provide for a much more rigorous risk management and governance framework for the insurance industry
• The ECIC undertook a gap analysis of its current risk management and governance framework during the year and is in the process of developing remedial action to address identified gaps
• The ECIC is also participating in the industry consultation process for the development of the legislation
36
2012/13 Performance Review
37
OBJECTIVE PERFORMANCE/ KEY INDICATOR
MEASURE 2012/13 TARGET 2012/13 RESULT
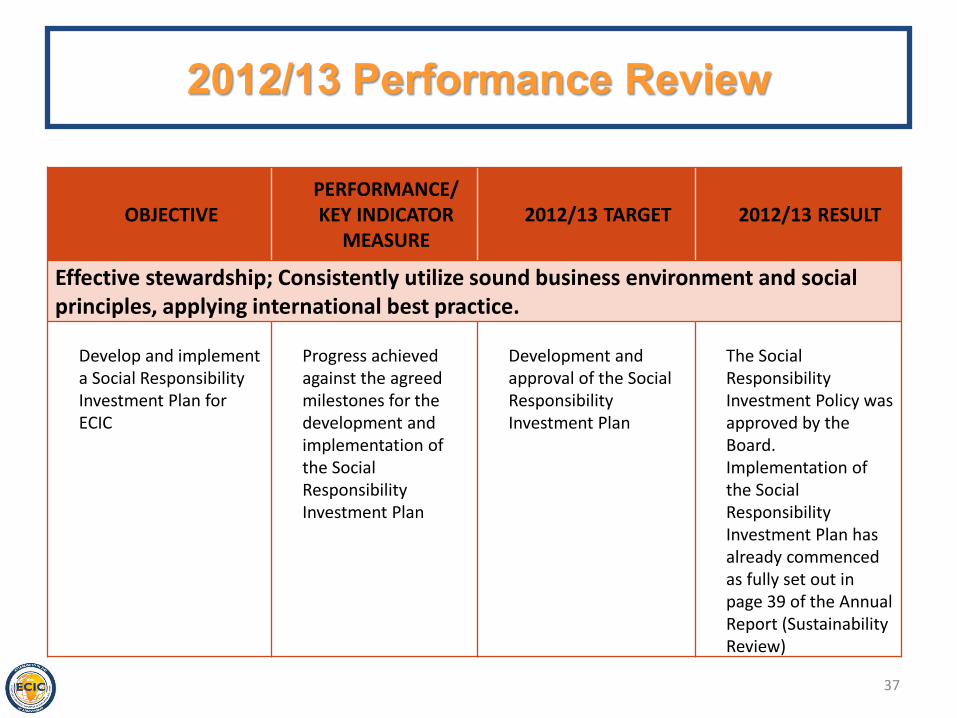
Effective stewardship; Consistently utilize sound business environment and social principles, applying international best practice.
Develop and implement a Social Responsibility Investment Plan for ECIC
Progress achieved against the agreed milestones for the development and implementation of the Social Responsibility Investment Plan
Development and approval of the Social Responsibility Investment Plan
The Social Responsibility Investment Policy was approved by the Board. Implementation of the Social Responsibility Investment Plan has already commenced as fully set out in page 39 of the Annual Report (Sustainability Review)
2012/13 Performance Review
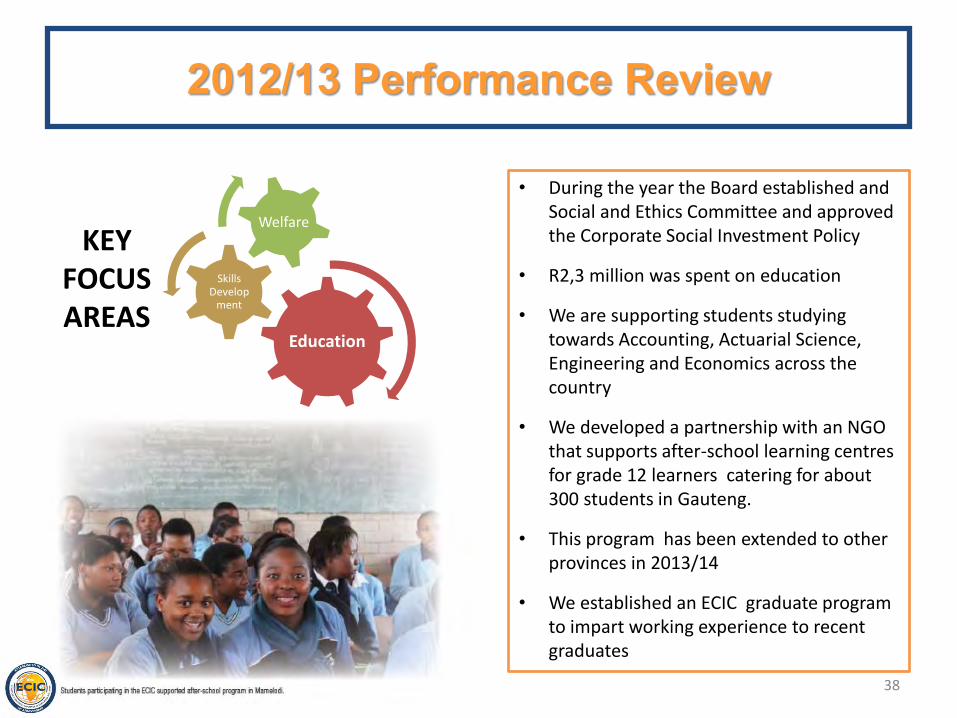
Education
Skills Develop
ment
Welfare
38
2012/13 Performance Review
KEY FOCUS AREAS
• During the year the Board established and Social and Ethics Committee and approved the Corporate Social Investment Policy
• R2,3 million was spent on education
• We are supporting students studying towards Accounting, Actuarial Science, Engineering and Economics across the country
• We developed a partnership with an NGO that supports after-school learning centres for grade 12 learners catering for about 300 students in Gauteng.
• This program has been extended to other provinces in 2013/14
• We established an ECIC graduate program to impart working experience to recent graduates

39
OBJECTIVE PERFORMANCE/ KEY INDICATOR
MEASURE 2012/13 TARGET 2012/13 RESULT
Effective stewardship; Consistently utilize sound business environment and social principles, applying international best practice.
Increase the value of procurement spend from BBBEE certified suppliers or service providers when measured against the total procurement spend of ECIC
The percentage value of procurement spend from BBBEE certified suppliers or service providers when measured against the total procurement spend of ECIC
70% being the target percentage value of the ECIC procurement spend from BBBEE certified suppliers or service providers when measured against the total procurement spend of ECIC in this financial year
The percentage value of BBBEE spend was 93%
2012/13 Performance Review
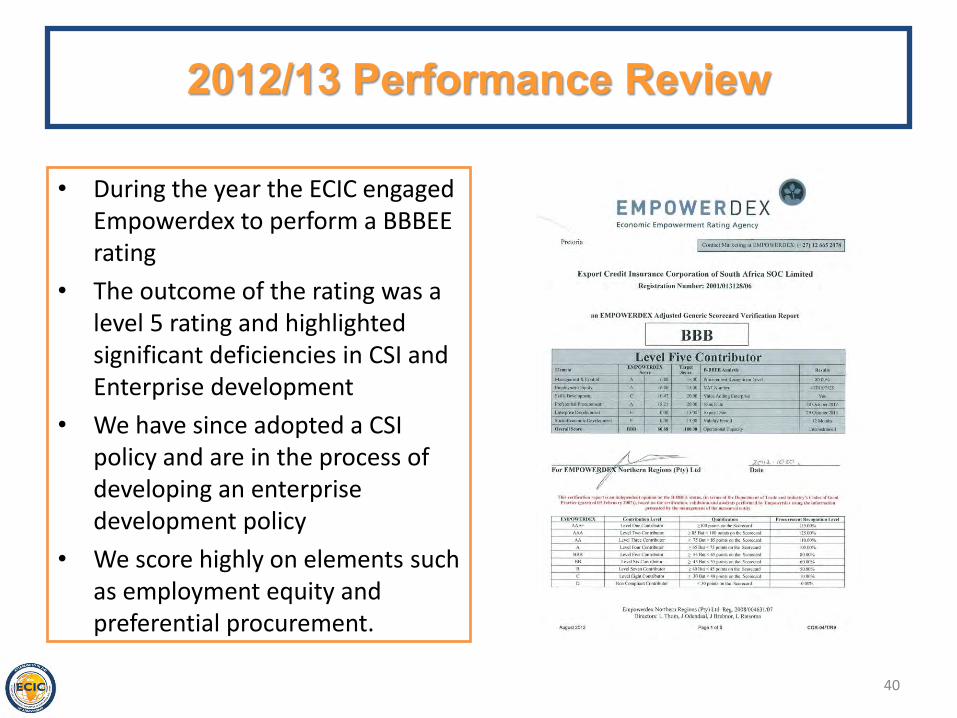
• During the year the ECIC engaged Empowerdex to perform a BBBEE rating
• The outcome of the rating was a level 5 rating and highlighted significant deficiencies in CSI and Enterprise development
• We have since adopted a CSI policy and are in the process of developing an enterprise development policy
• We score highly on elements such as employment equity and preferential procurement.
40
2012/13 Performance Review
41
2012/13 Performance Review
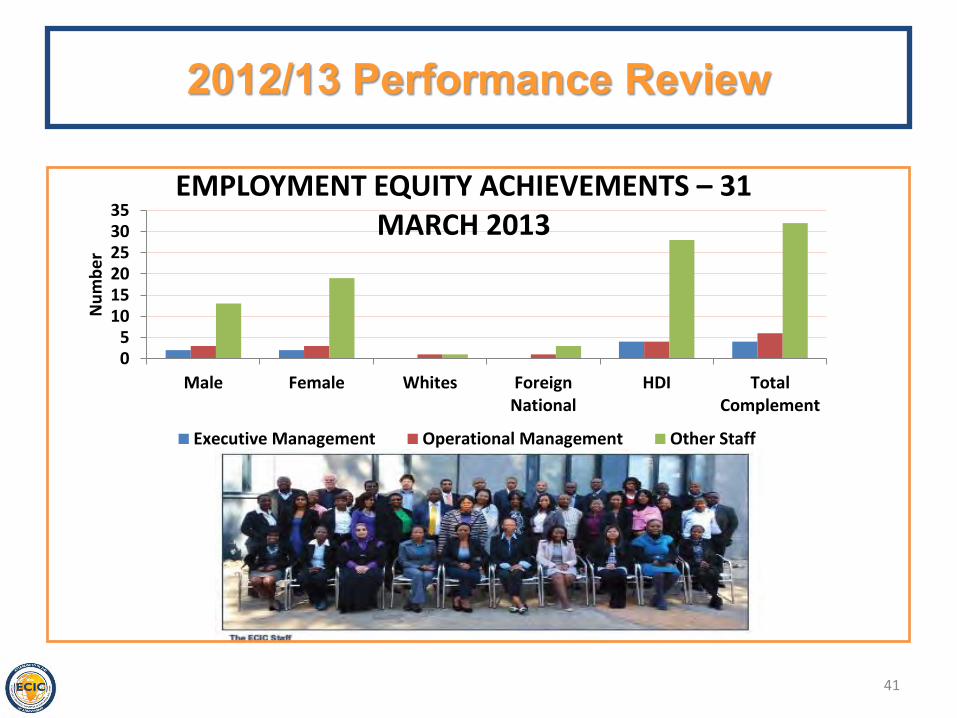
05
101520253035
Male Female Whites ForeignNational
HDI TotalComplement
Nu
mb
er
EMPLOYMENT EQUITY ACHIEVEMENTS – 31 MARCH 2013
Executive Management Operational Management Other Staff

42
OBJECTIVE PERFORMANCE/ KEY INDICATOR
MEASURE 2012/13 TARGET 2012/13 RESULT
Effective stewardship; Consistently utilize sound business environment and social principles, applying international best practice.
Develop and implement an environmental and social policy to regulate ECIC approach to the management of environ-mental and social risks in transactions supported by the ECIC
Progress achieved against agreed milestones for the development and implementation of the environmental and social policy to regulate ECIC approach for the management of environmental and social risks in transactions supported by the ECIC
Development and approval of an ECIC environmental and social policy.
The Environmental and Social Policy was approved by the ECIC Board
2012/13 Performance Review

• As an organisation that operates on an international scale we have a duty to ensure that the projects in various countries that we support uphold social and environmental principles that are enshrined in our constitution.
• It is on this basis that we have developed a comprehensive social and environmental policy for public and private sector projects that we support.
• Our policy for public sector projects is benchmarked against the World Bank Guidelines, whilst the policy for private projects is benchmarked against the International Finance Corporation (“IFC”).
• In developing this policy we also worked in collaboration with the Export Development Canada (“EDC”) the official export credit agency of Canada.
43
2012/13 Performance Review
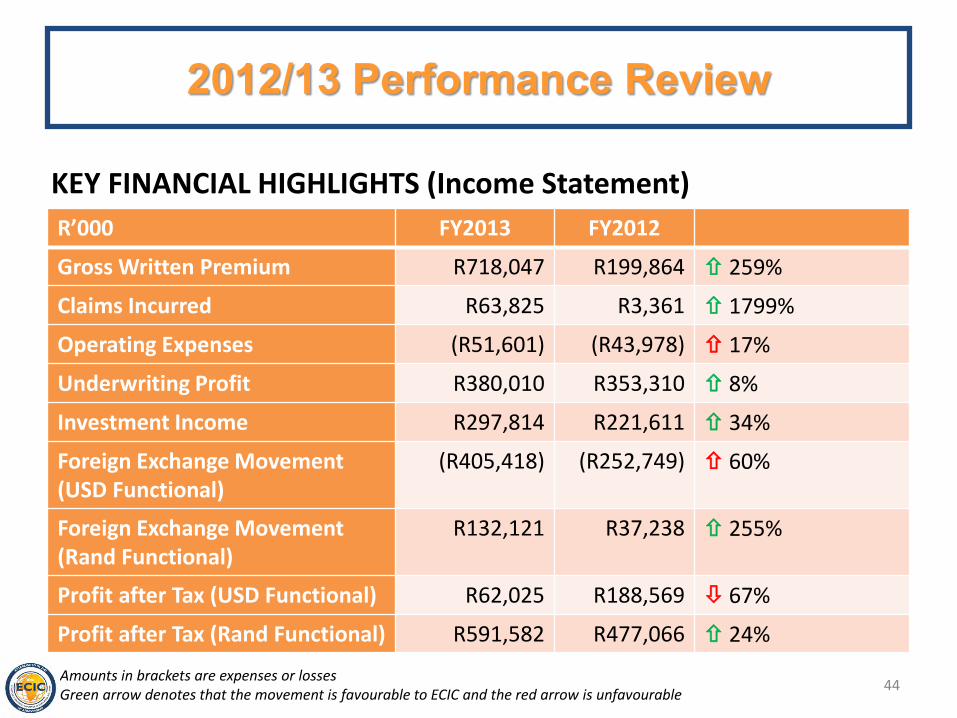
R’000 FY2013 FY2012
Gross Written Premium R718,047 R199,864 259%
Claims Incurred R63,825 R3,361 1799%
Operating Expenses (R51,601) (R43,978) 17%
Underwriting Profit R380,010 R353,310 8%
Investment Income R297,814 R221,611 34%
Foreign Exchange Movement (USD Functional)
(R405,418) (R252,749) 60%
Foreign Exchange Movement (Rand Functional)
R132,121 R37,238 255%
Profit after Tax (USD Functional) R62,025 R188,569 67%
Profit after Tax (Rand Functional) R591,582 R477,066 24%
44
2012/13 Performance Review
KEY FINANCIAL HIGHLIGHTS (Income Statement)
Amounts in brackets are expenses or losses Green arrow denotes that the movement is favourable to ECIC and the red arrow is unfavourable
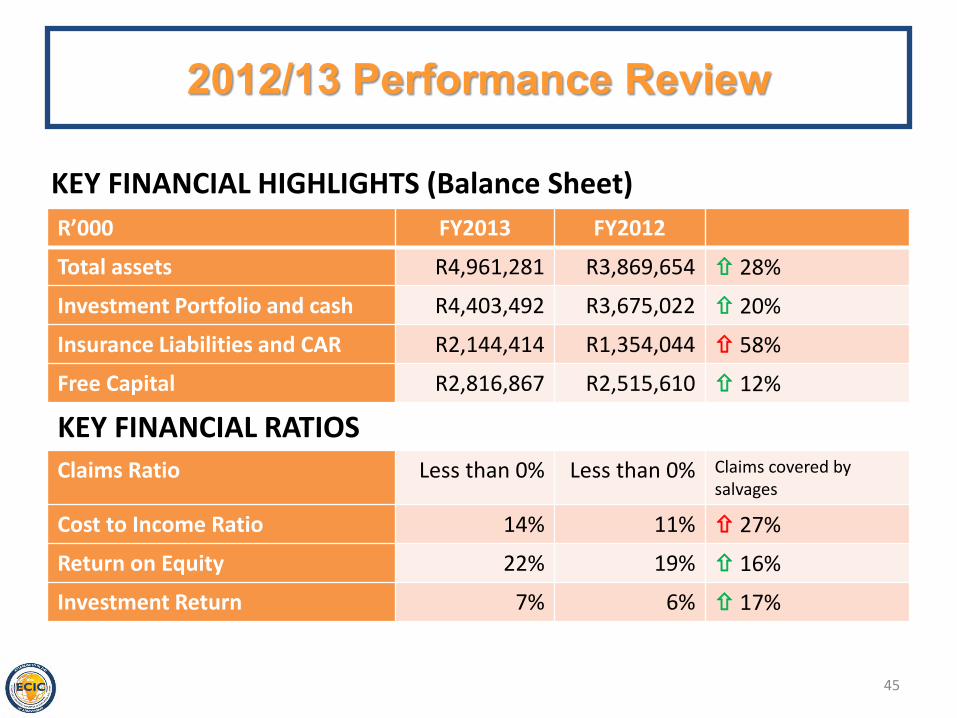
R’000 FY2013 FY2012
Total assets R4,961,281 R3,869,654 28%
Investment Portfolio and cash R4,403,492 R3,675,022 20%
Insurance Liabilities and CAR R2,144,414 R1,354,044 58%
Free Capital R2,816,867 R2,515,610 12%
KEY FINANCIAL RATIOS
Claims Ratio Less than 0% Less than 0% Claims covered by salvages
Cost to Income Ratio 14% 11% 27%
Return on Equity 22% 19% 16%
Investment Return 7% 6% 17%
45
2012/13 Performance Review
KEY FINANCIAL HIGHLIGHTS (Balance Sheet)

Facilitate Export Credit & Investment Outside South Africa
Value of export Credit / Investments insurance approved by the ECIC Board (US$720 million)
Value of export credit / investment insurance policies signed (US$240 million)
Value of loans disbursed / investment insurance declared (US$216 million)
Approvals of US$80 million were achieved against a target of US$180 million for the quarter. We have subsequently approved an amount of US$488 million for various projects
One policy to the value of $7 million was signed during the quarter against a target of $60 million for the quarter.
A total of $121 million was disbursed or declared against a target of US30 million for the quarter.
46
Latest Performance Review for 2013/14 as at 30 June 2013
(The annual target for the performance indicator is indicated in brackets)
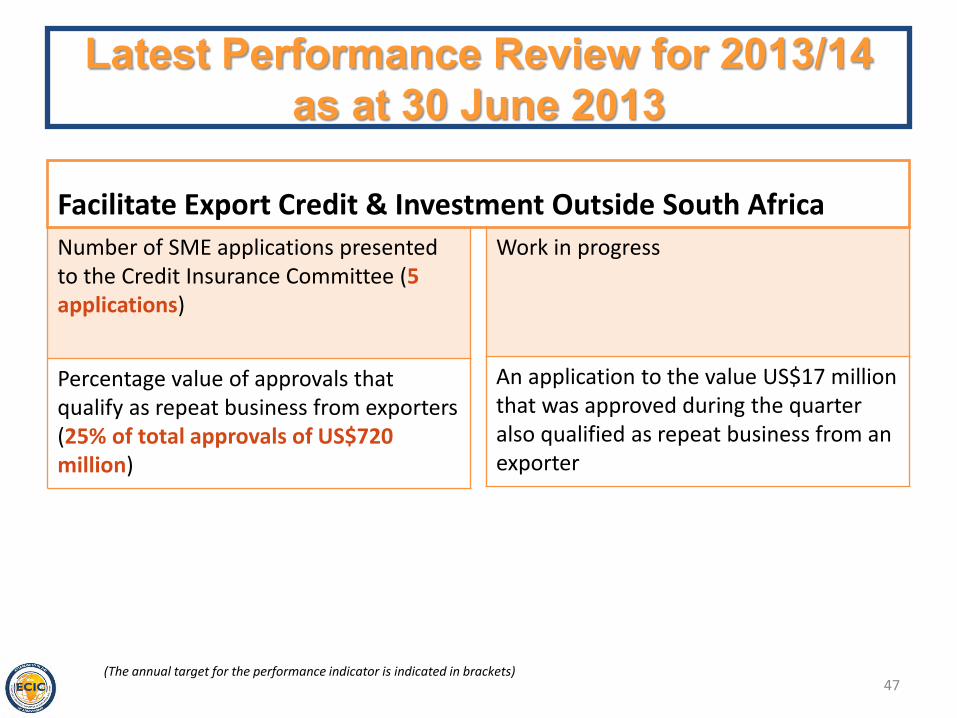
Facilitate Export Credit & Investment Outside South Africa
Number of SME applications presented to the Credit Insurance Committee (5 applications)
Percentage value of approvals that qualify as repeat business from exporters (25% of total approvals of US$720 million)
Work in progress
An application to the value US$17 million that was approved during the quarter also qualified as repeat business from an exporter
47
Latest Performance Review for 2013/14 as at 30 June 2013
(The annual target for the performance indicator is indicated in brackets)
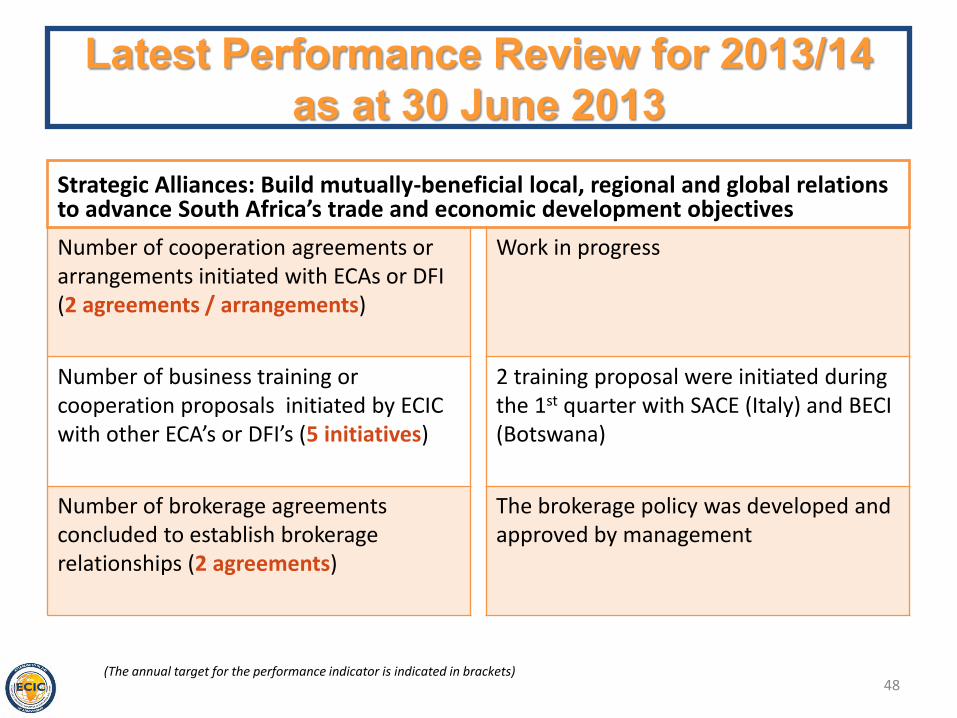
Strategic Alliances: Build mutually-beneficial local, regional and global relations to advance South Africa’s trade and economic development objectives
Number of cooperation agreements or arrangements initiated with ECAs or DFI (2 agreements / arrangements)
Number of business training or cooperation proposals initiated by ECIC with other ECA’s or DFI’s (5 initiatives)
Number of brokerage agreements concluded to establish brokerage relationships (2 agreements)
Work in progress
2 training proposal were initiated during the 1st quarter with SACE (Italy) and BECI (Botswana)
The brokerage policy was developed and approved by management
48
Latest Performance Review for 2013/14 as at 30 June 2013
(The annual target for the performance indicator is indicated in brackets)

Promote a professional, competitive and customer focused workforce that ensures an effective and efficient service to our customers
Number of ECIC product presentations or awareness sessions held with export agencies, provincial economic development agencies etc. (15 presentations)
Number of research reports produced by ECIC (2 research reports)
Number of stakeholder website linked to the ECIC website (10 website links)
18 presentation were held during the quarter which included a conference in Zambia were we held an exhibition
Work in progress
Work in progress
49
Latest Performance Review for 2013/14 as at 30 June 2013
(The annual target for the performance indicator is indicated in brackets)
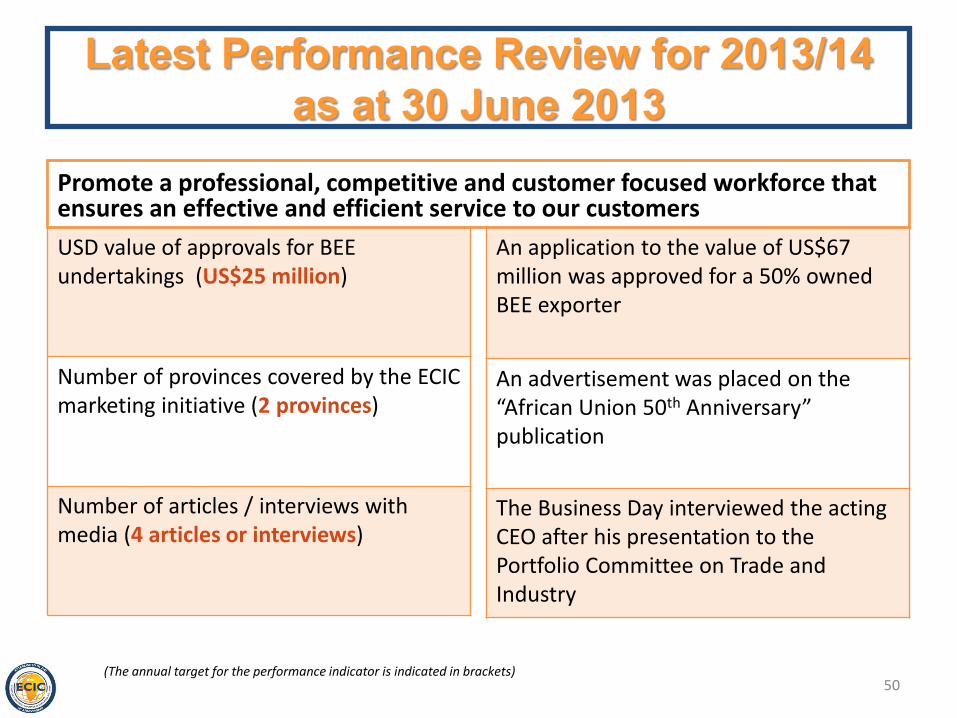
Promote a professional, competitive and customer focused workforce that ensures an effective and efficient service to our customers
USD value of approvals for BEE undertakings (US$25 million)
Number of provinces covered by the ECIC marketing initiative (2 provinces)
Number of articles / interviews with media (4 articles or interviews)
An application to the value of US$67 million was approved for a 50% owned BEE exporter
An advertisement was placed on the “African Union 50th Anniversary” publication
The Business Day interviewed the acting CEO after his presentation to the Portfolio Committee on Trade and Industry
50
Latest Performance Review for 2013/14 as at 30 June 2013
(The annual target for the performance indicator is indicated in brackets)
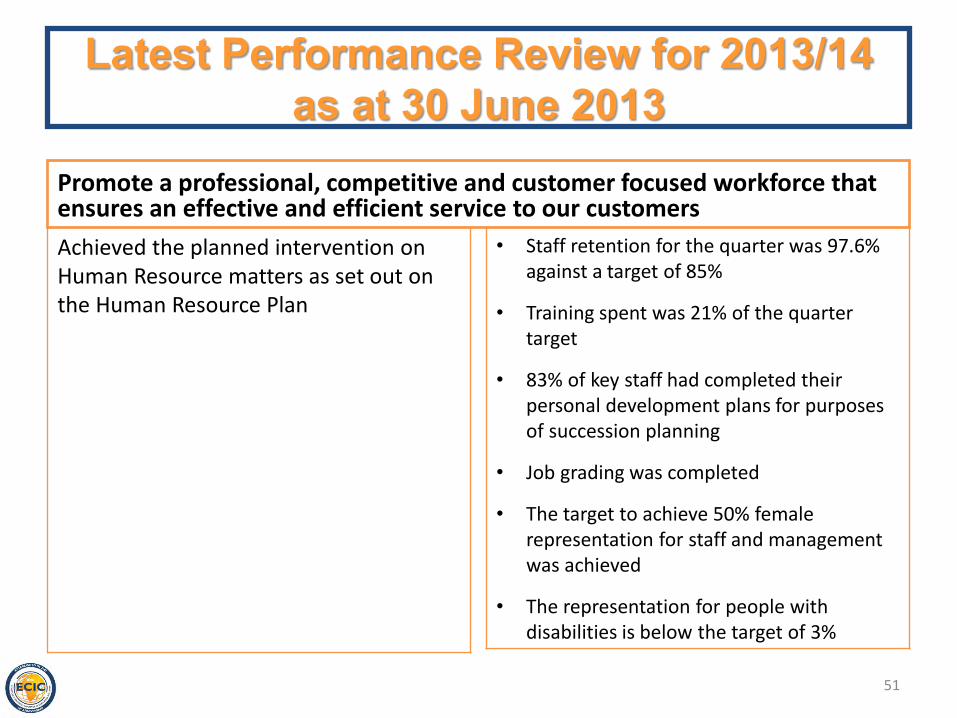
Promote a professional, competitive and customer focused workforce that ensures an effective and efficient service to our customers
Achieved the planned intervention on Human Resource matters as set out on the Human Resource Plan
• Staff retention for the quarter was 97.6% against a target of 85%
• Training spent was 21% of the quarter target
• 83% of key staff had completed their personal development plans for purposes of succession planning
• Job grading was completed
• The target to achieve 50% female representation for staff and management was achieved
• The representation for people with disabilities is below the target of 3%
51
Latest Performance Review for 2013/14 as at 30 June 2013

Fostering risk orientation: Create an enterprise wide risk awareness and effective corporate governance and risk management practices
Single largest country exposure (not to exceed 32% of total portfolio)
Implementation of SAM gap analysis (achieve compliance with SAM)
The single largest country exposure as at 30 June 2013 was Zambia with 24.5% and was within the target.
The Board approved the Remuneration and Outsourcing Policies. The corporation is still in progress with the development of investment and underwriting policies.
52
Latest Performance Review for 2013/14 as at 30 June 2013
(The annual target for the performance indicator is indicate in brackets)

Effective stewardship; Consistently utilize sound business environment and social principles, applying international best practice.
Amount spent on Corporate Social investment (“CSI”) as a percentage of net profit after tax (1% of PAT for FY2012/13)
Number of CSI programs supported under 3 focus areas (3 CSI programs supported)
BBBEE spend as per the dti code (100% BBBEE spend)
As at 30 June 2013 CSI spending was less than 1% of the target spending of R5 million.
As at 30 June 2013, 3 CSI initiatives had been identified but not yet sponsored.
The BBBEE spend for the quarter ending 30 June 2013 was 82%
53
Latest Performance Review for 2013/14 as at 30 June 2013
(The annual target for the performance indicator is indicated in brackets)
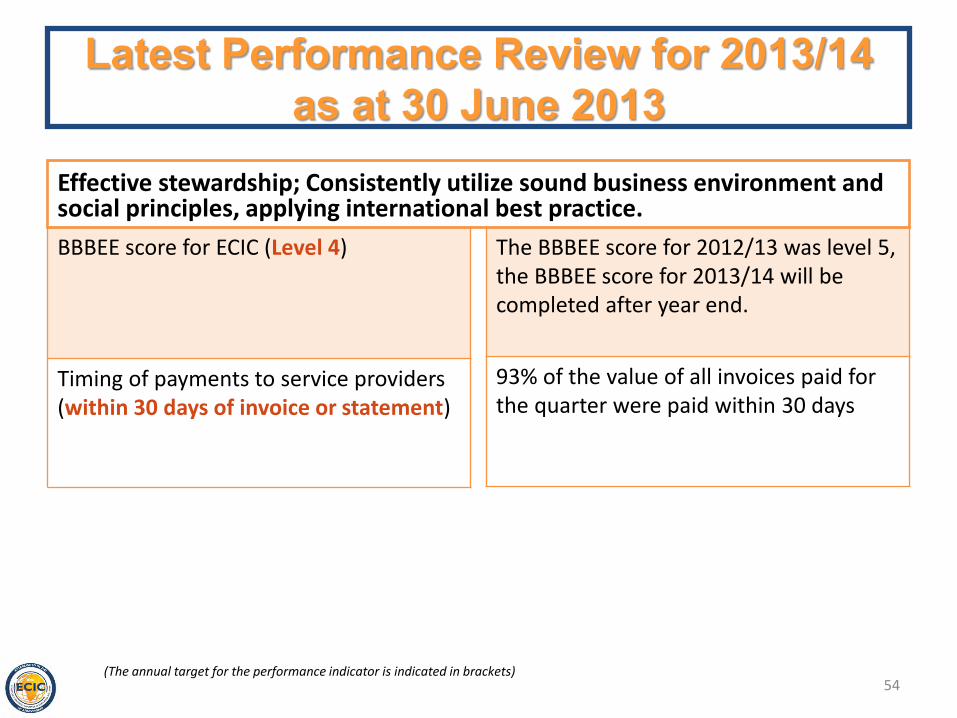
Effective stewardship; Consistently utilize sound business environment and social principles, applying international best practice.
BBBEE score for ECIC (Level 4)
Timing of payments to service providers (within 30 days of invoice or statement)
The BBBEE score for 2012/13 was level 5, the BBBEE score for 2013/14 will be completed after year end.
93% of the value of all invoices paid for the quarter were paid within 30 days
54
Latest Performance Review for 2013/14 as at 30 June 2013
(The annual target for the performance indicator is indicated in brackets)
55
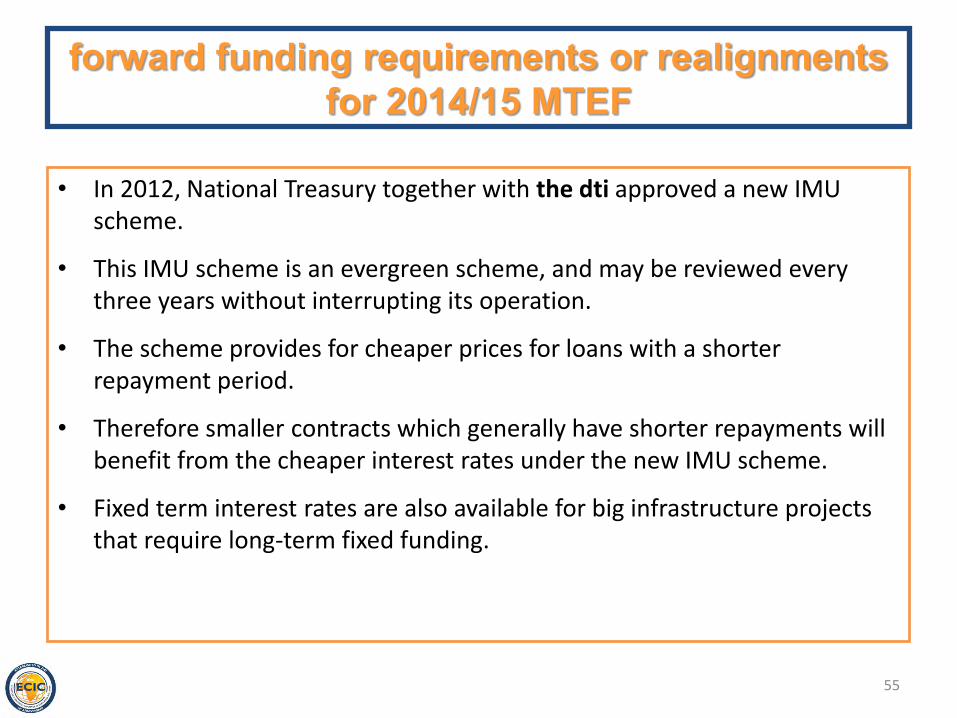
• In 2012, National Treasury together with the dti approved a new IMU scheme.
• This IMU scheme is an evergreen scheme, and may be reviewed every three years without interrupting its operation.
• The scheme provides for cheaper prices for loans with a shorter repayment period.
• Therefore smaller contracts which generally have shorter repayments will benefit from the cheaper interest rates under the new IMU scheme.
• Fixed term interest rates are also available for big infrastructure projects that require long-term fixed funding.
forward funding requirements or realignments for 2014/15 MTEF

• We anticipate that the price competitiveness of the new IMU scheme will lead to increased utilisation.
• The projected increase in the pipeline of projects and new commitments will stretch and exceed the current budget allocations made in the MTEF (Medium Term Expenditure Framework).
• Given the two year lead time before the surplus funds in the IMU bank account run out, there is time and space to revisit the budget assumptions and future budget allocations.
• Our current estimates is that the will be an IMU shortfall of roughly R371 million by FY 2015/16 and a continuing additional budget requirement of at least R300 million for every year thereafter
• We believe the IMU budget from 2015/16 should be increased by at least R300 million
• We had a fruitful meeting with National Treasury who were impressed by the significant impact of IMU on job creation which supports the motivation for increasing the IMU budget
56
forward funding requirements or realignments for 2014/15 MTEF

57
-
50 000
100 000
150 000
200 000
250 000
FY 2009 FY 2010 FY 2011 FY 2012 FY 2013
R'0
00
IMU DISBURSEMENTS (FY2009 – FY2013)
Disbursements to financial institutions (outflow)
2012/13 Performance Review
58
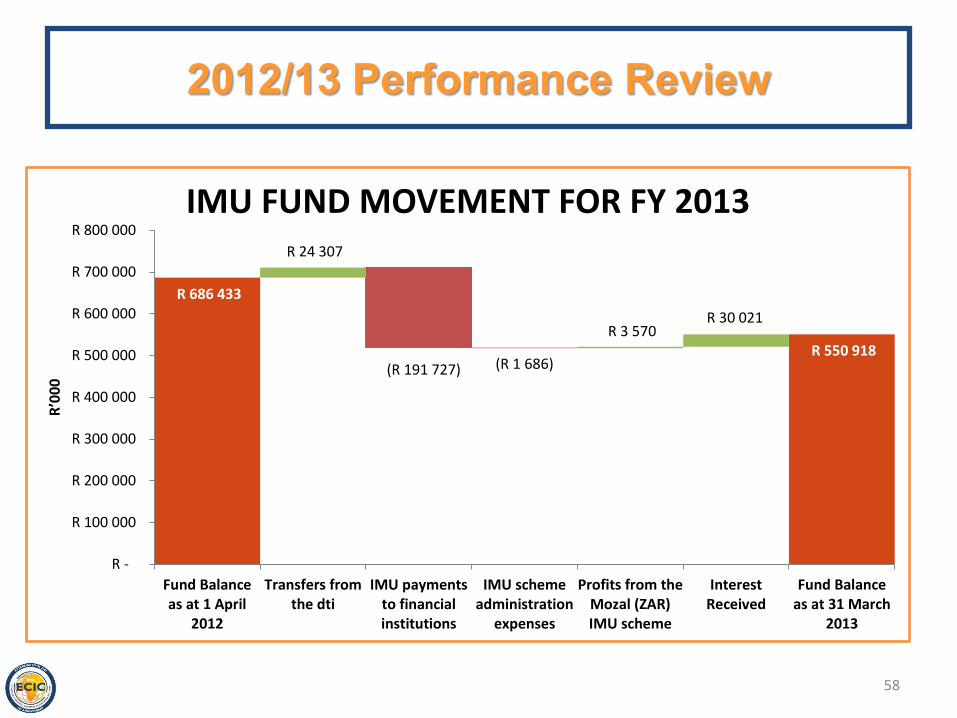
R 686 433
R 550 918
R 24 307
(R 191 727) (R 1 686)
R 3 570 R 30 021
R -
R 100 000
R 200 000
R 300 000
R 400 000
R 500 000
R 600 000
R 700 000
R 800 000
Fund Balanceas at 1 April
2012
Transfers fromthe dti
IMU paymentsto financialinstitutions
IMU schemeadministration
expenses
Profits from theMozal (ZAR)IMU scheme
InterestReceived
Fund Balanceas at 31 March
2013
R’0
00
IMU FUND MOVEMENT FOR FY 2013
2012/13 Performance Review

59
forward funding requirements or realignments for 2014/15 MTEF
24 307 110 293 110 370 115 447
371 249
191 272
323 346
380 110
554 822 550 918
337 865
68 125
-
100 000
200 000
300 000
400 000
500 000
600 000
700 000
-
100 000
200 000
300 000
400 000
500 000
600 000
700 000
Mar-13 Mar-14 Mar-15 Mar-16
R’0
00
R’0
00
Over the next 3 years the IMU fund account is depleted (including new business)
the dti transfers Interest income Top Up Required
actual payments IMU fund account
60
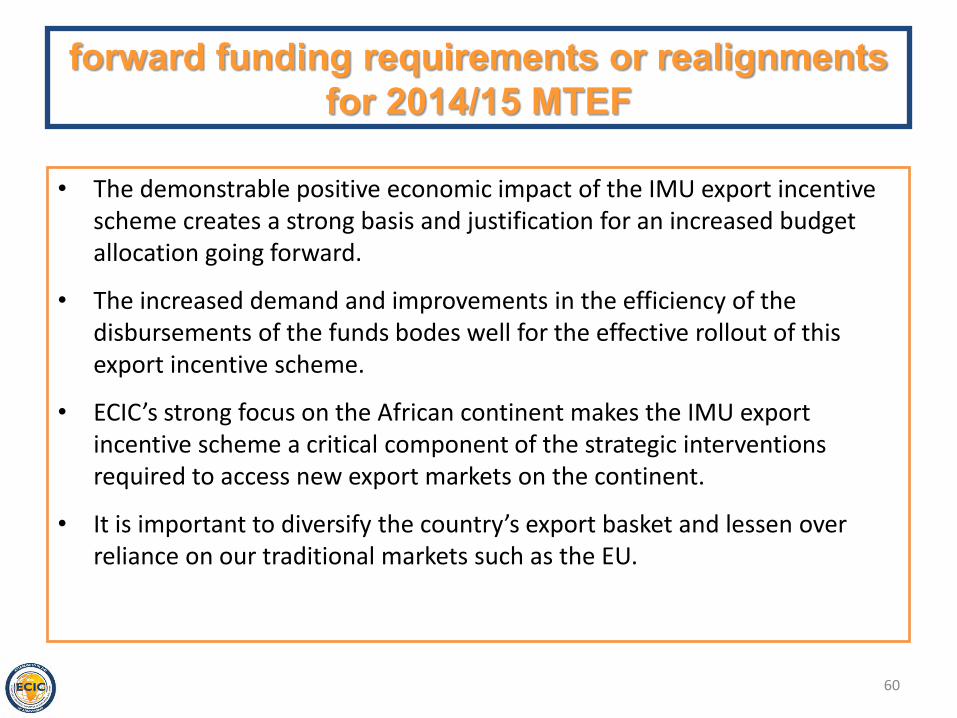
• The demonstrable positive economic impact of the IMU export incentive scheme creates a strong basis and justification for an increased budget allocation going forward.
• The increased demand and improvements in the efficiency of the disbursements of the funds bodes well for the effective rollout of this export incentive scheme.
• ECIC’s strong focus on the African continent makes the IMU export incentive scheme a critical component of the strategic interventions required to access new export markets on the continent.
• It is important to diversify the country’s export basket and lessen over reliance on our traditional markets such as the EU.
forward funding requirements or realignments for 2014/15 MTEF

61
TERM DEFINITION
IMU Interest Make Up. A subsidy scheme provided by the South African Government to support exports of South African goods and services by through a competitive funding package to offshore buyers
DFI Development Financial Institution
ECA Export Credit Agency
BECI Official export Credit Agency of Botswana
SACE Official export Credit Agency of Italy
SAM Solvency Assessment Management project. A project to modernise insurance industry regulation by the FSB
SAM Social Accounting Matrix. A model used by the Political and Economic research unit to calculate and project the economic impact of ECIC activities
GTR Global Trade Review, an international publication for export trade finance
GLOSSARY OF TERMS
62
Export Credit Insurance Corporation of South Africa
SOC Limited (ECIC)