Embed Size (px)
Citation preview
www.statssa.gov.za
T +27 12 310 8911
F +27 12 310 8500
Private Bag X44, Pretoria, 0001, South Africa
ISIbalo House, Koch Street, Salvokop, Pretoria, 0002
STATISTICAL RELEASE P0142.7
Export and Import Value Indices
February 2017
Embargoed until: 26 April 2017
11:30 ENQUIRIES: FORTHCOMING ISSUE: EXPECTED RELEASE DATE Richard Klaas March 2017 25 May 2017 (012) 310 2185
STATISTICS SOUTH AFRICA 2 P0142.7
Export and Import Value Indices - February 2017
CONTENTS
KEY FINDINGS .................................................................................................................................................................. 3
Exports................................................................................................................................................................................ 3
Imports ................................................................................................................................................................................ 3
KEY FIGURES AND ANALYTICAL SERIES ..................................................................................................................... 4
Table A - Key figures .......................................................................................................................................................... 4
Table B - Analytical series .................................................................................................................................................. 4
DETAILED RESULTS ........................................................................................................................................................ 5
Main index numbers and rates of change (%) ................................................................................................................ 5
Table C - Exports ................................................................................................................................................................ 5
Table D - Imports ................................................................................................................................................................ 5
Figure 1 - Export and import unit value indices ................................................................................................................... 5
Figure 2 - Export UVI rates of change (%) .......................................................................................................................... 6
Figure 3 - Import UVI rates of change (%) .......................................................................................................................... 6
Detailed index numbers and rates of change, and contributions ................................................................................ 7
Table 1 - Exports ................................................................................................................................................................ 7
Figure 4.1 - Contributions to the monthly percentage change in exports ............................................................................ 8
Figure 4.2 - Contributions to the annual percentage change in exports .............................................................................. 8
Table 2 - Imports ................................................................................................................................................................. 9
Figure 5.1 - Contributions to the monthly percentage change in imports .......................................................................... 10
Figure 5.2 - Contributions to the annual percentage change in imports ............................................................................ 10
EXPLANATORY NOTES ................................................................................................................................................. 11
GLOSSARY ...................................................................................................................................................................... 11
TECHNICAL ENQUIRIES ................................................................................................................................................ 11
GENERAL INFORMATION .............................................................................................................................................. 12
STATISTICS SOUTH AFRICA 3 P0142.7
Export and Import Value Indices - February 2017
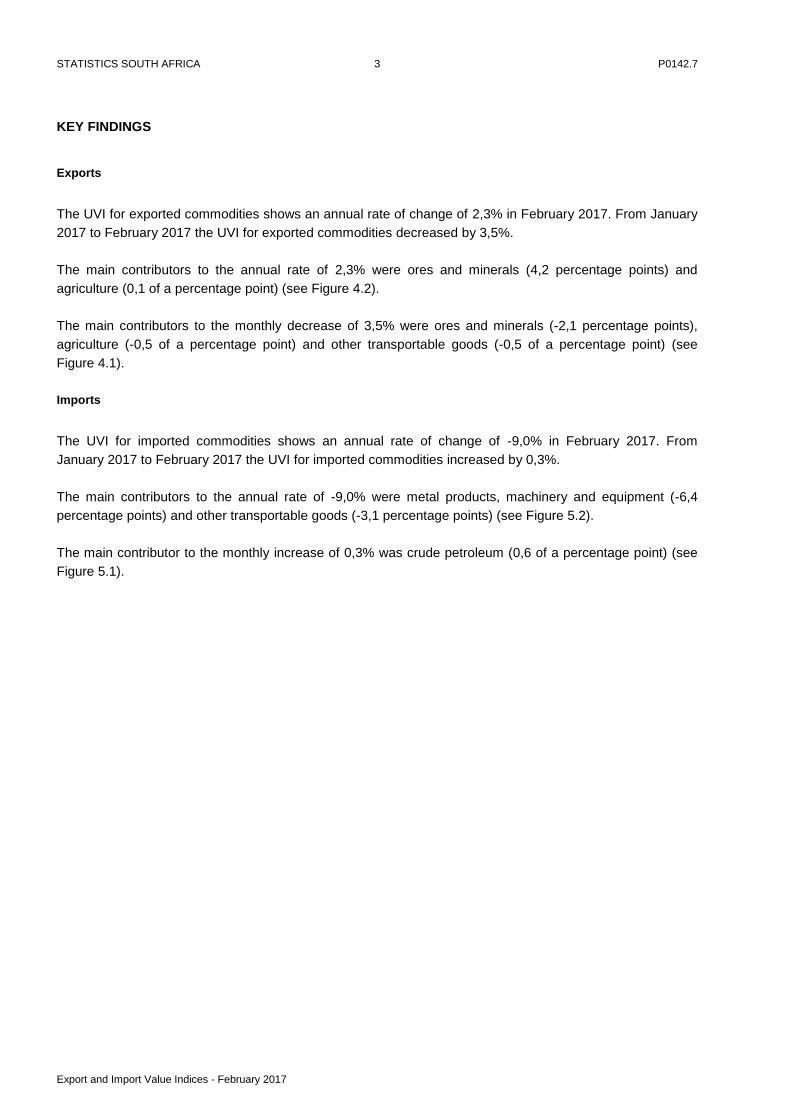
KEY FINDINGS
Exports
The UVI for exported commodities shows an annual rate of change of 2,3% in February 2017. From January
2017 to February 2017 the UVI for exported commodities decreased by 3,5%.
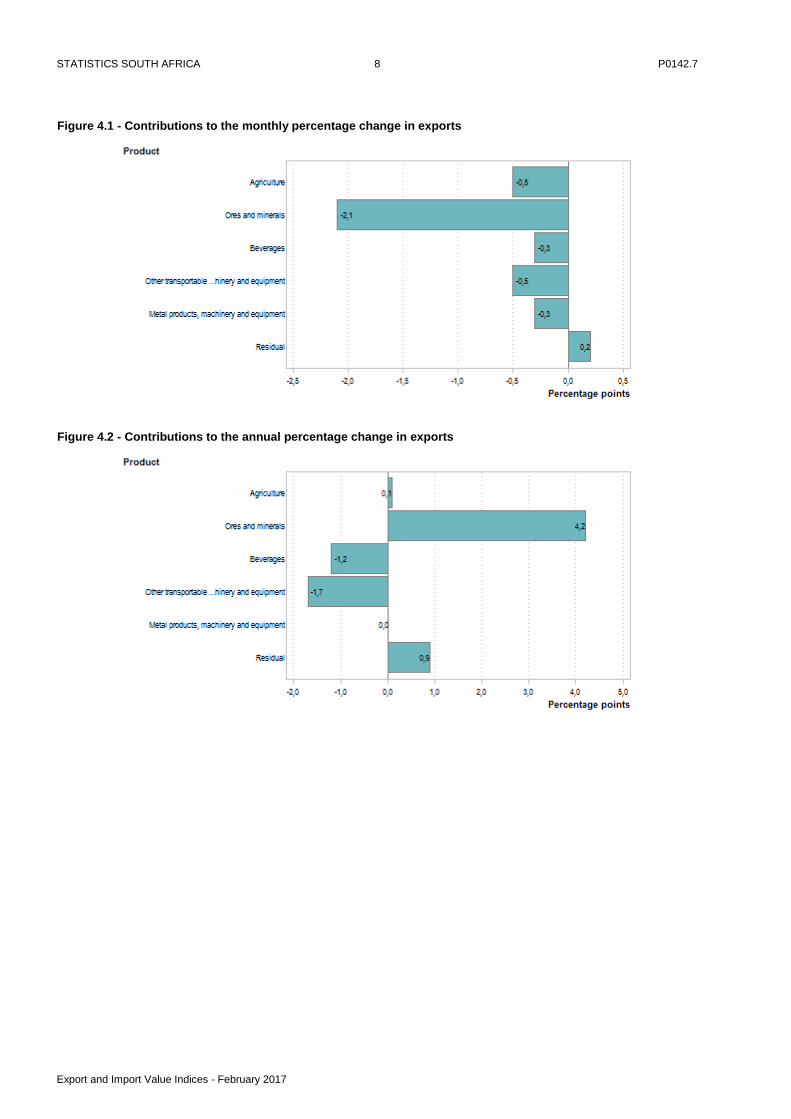
The main contributors to the annual rate of 2,3% were ores and minerals (4,2 percentage points) and
agriculture (0,1 of a percentage point) (see Figure 4.2).
The main contributors to the monthly decrease of 3,5% were ores and minerals (-2,1 percentage points),
agriculture (-0,5 of a percentage point) and other transportable goods (-0,5 of a percentage point) (see
Figure 4.1).
Imports
The UVI for imported commodities shows an annual rate of change of -9,0% in February 2017. From
January 2017 to February 2017 the UVI for imported commodities increased by 0,3%.
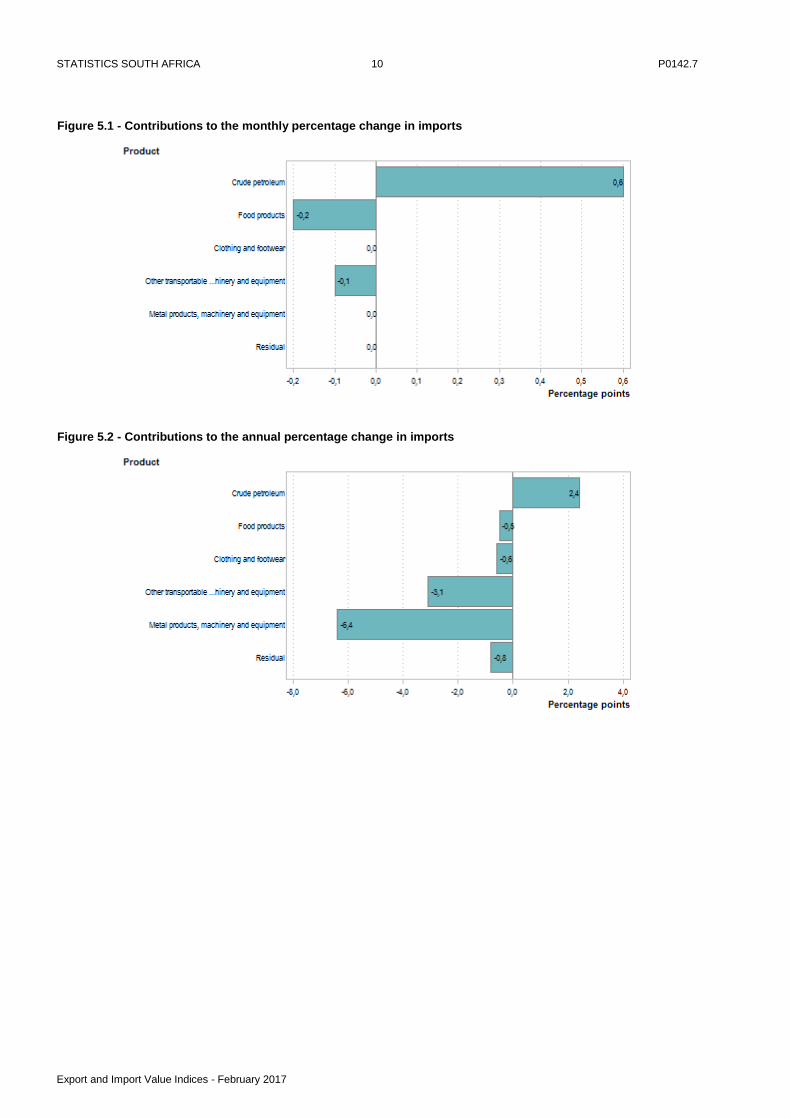
The main contributors to the annual rate of -9,0% were metal products, machinery and equipment (-6,4
percentage points) and other transportable goods (-3,1 percentage points) (see Figure 5.2).
The main contributor to the monthly increase of 0,3% was crude petroleum (0,6 of a percentage point) (see
Figure 5.1).
STATISTICS SOUTH AFRICA 4 P0142.7
Export and Import Value Indices - February 2017
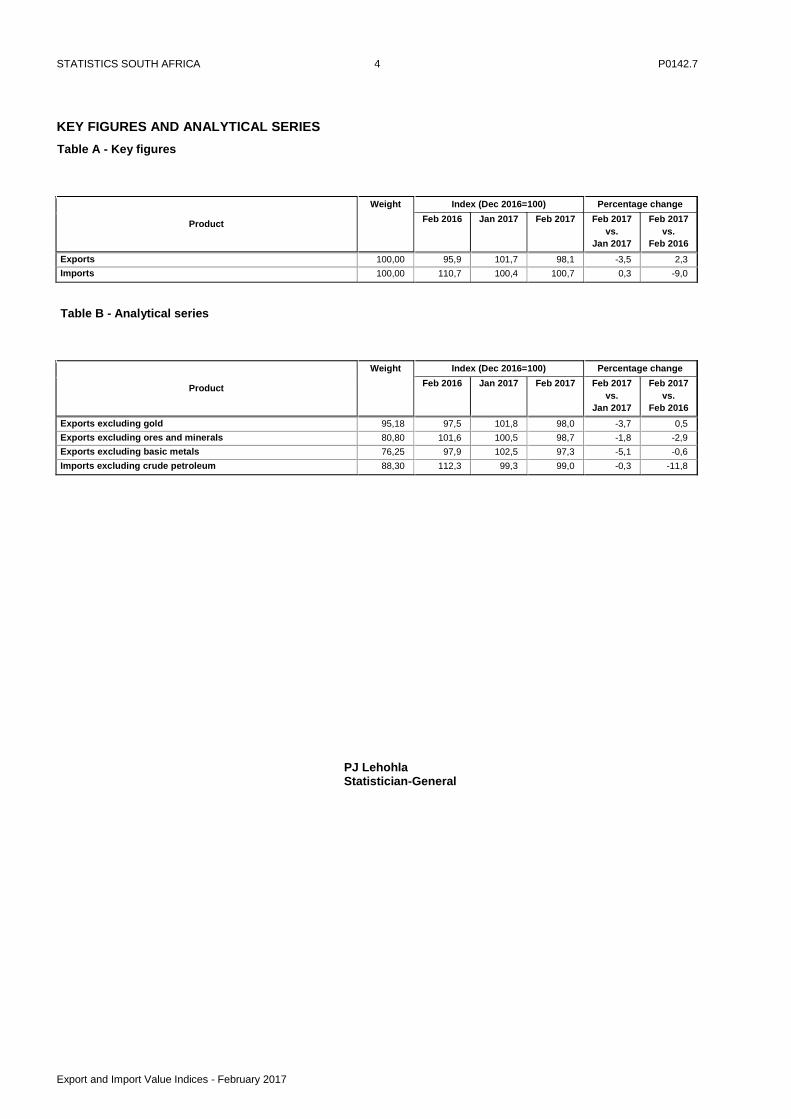
KEY FIGURES AND ANALYTICAL SERIES
Table A - Key figures
Product
Weight Index (Dec 2016=100) Percentage change
Feb 2016 Jan 2017 Feb 2017 Feb 2017
vs.
Jan 2017
Feb 2017
vs.
Feb 2016
Exports 100,00 95,9 101,7 98,1 -3,5 2,3
Imports 100,00 110,7 100,4 100,7 0,3 -9,0
Table B - Analytical series
Product
Weight Index (Dec 2016=100) Percentage change
Feb 2016 Jan 2017 Feb 2017 Feb 2017
vs.
Jan 2017
Feb 2017
vs.
Feb 2016
Exports excluding gold 95,18 97,5 101,8 98,0 -3,7 0,5
Exports excluding ores and minerals 80,80 101,6 100,5 98,7 -1,8 -2,9
Exports excluding basic metals 76,25 97,9 102,5 97,3 -5,1 -0,6
Imports excluding crude petroleum 88,30 112,3 99,3 99,0 -0,3 -11,8
PJ Lehohla Statistician-General
STATISTICS SOUTH AFRICA 5 P0142.7
Export and Import Value Indices - February 2017
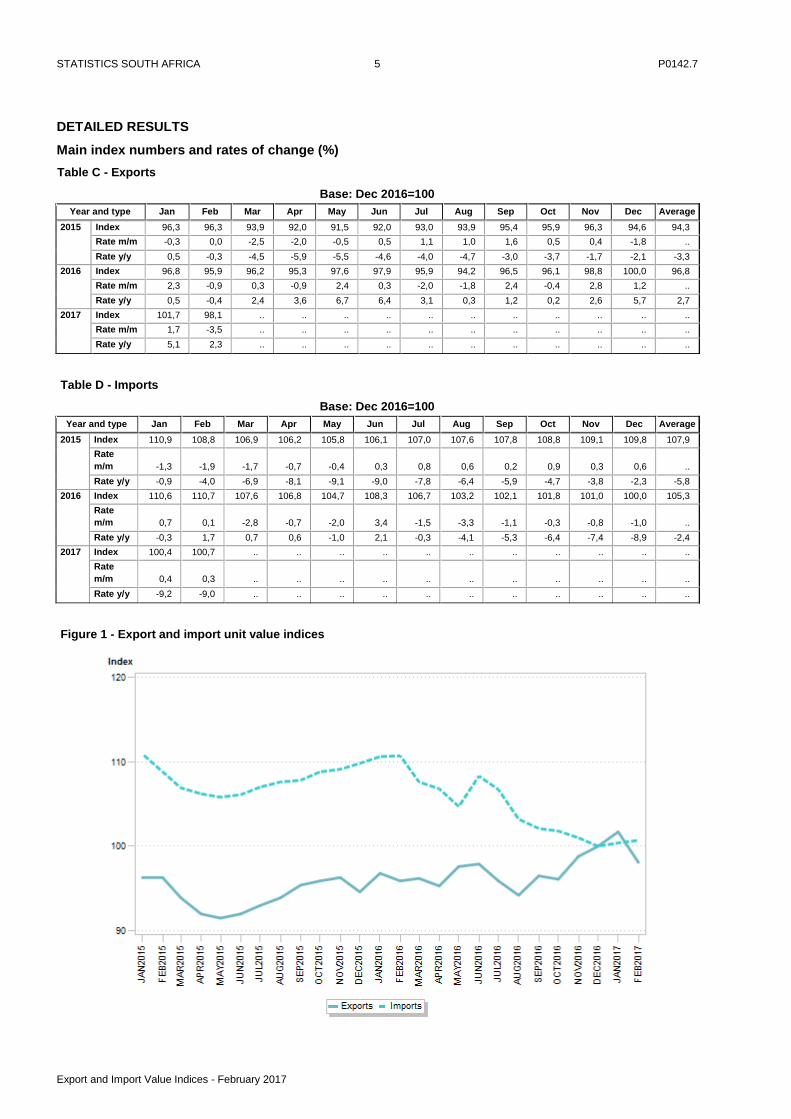
DETAILED RESULTS
Main index numbers and rates of change (%)
Table C - Exports
Base: Dec 2016=100
Year and type Jan Feb Mar Apr May Jun Jul Aug Sep Oct Nov Dec Average
2015 Index 96,3 96,3 93,9 92,0 91,5 92,0 93,0 93,9 95,4 95,9 96,3 94,6 94,3
Rate m/m -0,3 0,0 -2,5 -2,0 -0,5 0,5 1,1 1,0 1,6 0,5 0,4 -1,8 ..
Rate y/y 0,5 -0,3 -4,5 -5,9 -5,5 -4,6 -4,0 -4,7 -3,0 -3,7 -1,7 -2,1 -3,3
2016 Index 96,8 95,9 96,2 95,3 97,6 97,9 95,9 94,2 96,5 96,1 98,8 100,0 96,8
Rate m/m 2,3 -0,9 0,3 -0,9 2,4 0,3 -2,0 -1,8 2,4 -0,4 2,8 1,2 ..
Rate y/y 0,5 -0,4 2,4 3,6 6,7 6,4 3,1 0,3 1,2 0,2 2,6 5,7 2,7
2017 Index 101,7 98,1 .. .. .. .. .. .. .. .. .. .. ..
Rate m/m 1,7 -3,5 .. .. .. .. .. .. .. .. .. .. ..
Rate y/y 5,1 2,3 .. .. .. .. .. .. .. .. .. .. ..
Table D - Imports
Base: Dec 2016=100
Year and type Jan Feb Mar Apr May Jun Jul Aug Sep Oct Nov Dec Average
2015 Index 110,9 108,8 106,9 106,2 105,8 106,1 107,0 107,6 107,8 108,8 109,1 109,8 107,9
Rate
m/m -1,3 -1,9 -1,7 -0,7 -0,4 0,3 0,8 0,6 0,2 0,9 0,3 0,6 ..
Rate y/y -0,9 -4,0 -6,9 -8,1 -9,1 -9,0 -7,8 -6,4 -5,9 -4,7 -3,8 -2,3 -5,8
2016 Index 110,6 110,7 107,6 106,8 104,7 108,3 106,7 103,2 102,1 101,8 101,0 100,0 105,3
Rate
m/m 0,7 0,1 -2,8 -0,7 -2,0 3,4 -1,5 -3,3 -1,1 -0,3 -0,8 -1,0 ..
Rate y/y -0,3 1,7 0,7 0,6 -1,0 2,1 -0,3 -4,1 -5,3 -6,4 -7,4 -8,9 -2,4
2017 Index 100,4 100,7 .. .. .. .. .. .. .. .. .. .. ..
Rate
m/m 0,4 0,3 .. .. .. .. .. .. .. .. .. .. ..
Rate y/y -9,2 -9,0 .. .. .. .. .. .. .. .. .. .. ..
Figure 1 - Export and import unit value indices
STATISTICS SOUTH AFRICA 6 P0142.7
Export and Import Value Indices - February 2017
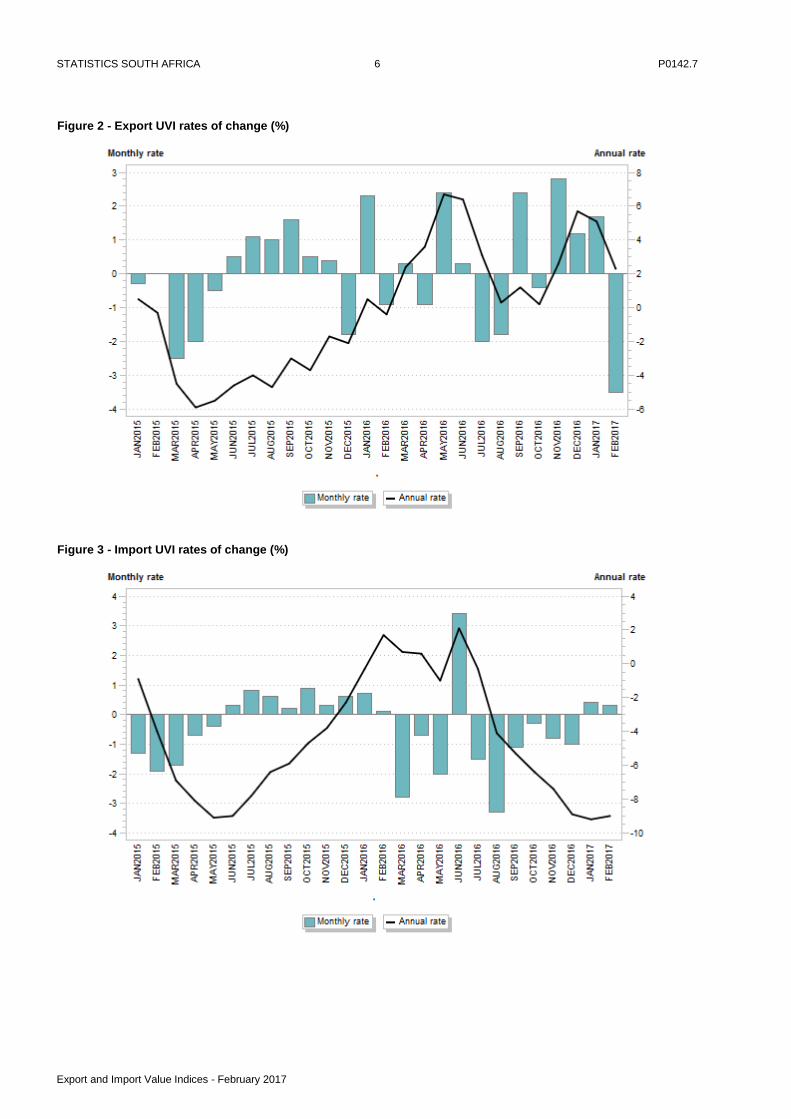
Figure 2 - Export UVI rates of change (%)
Figure 3 - Import UVI rates of change (%)
STATISTICS SOUTH AFRICA 7 P0142.7
Export and Import Value Indices - February 2017
Detailed index numbers and rates of change, and contributions
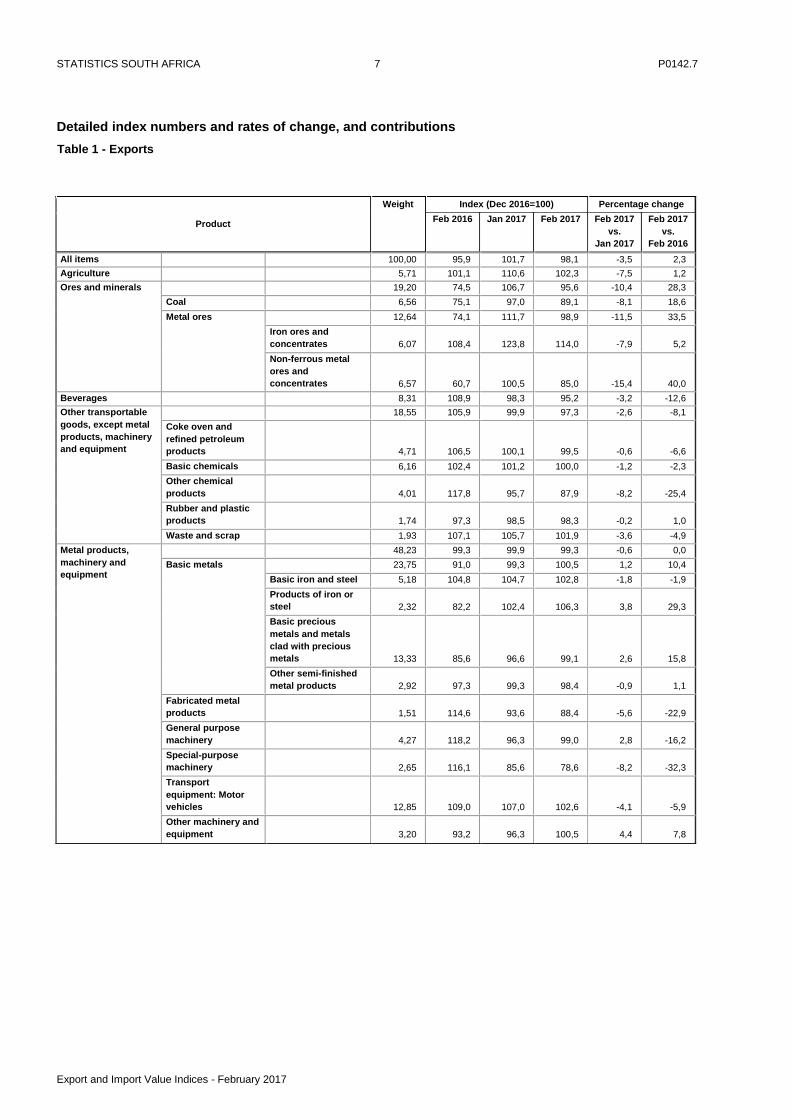
Table 1 - Exports
Product
Weight Index (Dec 2016=100) Percentage change
Feb 2016 Jan 2017 Feb 2017 Feb 2017
vs.
Jan 2017
Feb 2017
vs.
Feb 2016
All items 100,00 95,9 101,7 98,1 -3,5 2,3
Agriculture 5,71 101,1 110,6 102,3 -7,5 1,2
Ores and minerals 19,20 74,5 106,7 95,6 -10,4 28,3
Coal 6,56 75,1 97,0 89,1 -8,1 18,6
Metal ores 12,64 74,1 111,7 98,9 -11,5 33,5
Iron ores and
concentrates 6,07 108,4 123,8 114,0 -7,9 5,2
Non-ferrous metal
ores and
concentrates 6,57 60,7 100,5 85,0 -15,4 40,0
Beverages 8,31 108,9 98,3 95,2 -3,2 -12,6
Other transportable
goods, except metal
products, machinery
and equipment
18,55 105,9 99,9 97,3 -2,6 -8,1
Coke oven and
refined petroleum
products
4,71 106,5 100,1 99,5 -0,6 -6,6
Basic chemicals 6,16 102,4 101,2 100,0 -1,2 -2,3
Other chemical
products
4,01 117,8 95,7 87,9 -8,2 -25,4
Rubber and plastic
products
1,74 97,3 98,5 98,3 -0,2 1,0
Waste and scrap 1,93 107,1 105,7 101,9 -3,6 -4,9
Metal products,
machinery and
equipment
48,23 99,3 99,9 99,3 -0,6 0,0
Basic metals 23,75 91,0 99,3 100,5 1,2 10,4
Basic iron and steel 5,18 104,8 104,7 102,8 -1,8 -1,9
Products of iron or
steel 2,32 82,2 102,4 106,3 3,8 29,3
Basic precious
metals and metals
clad with precious
metals 13,33 85,6 96,6 99,1 2,6 15,8
Other semi-finished
metal products 2,92 97,3 99,3 98,4 -0,9 1,1
Fabricated metal
products
1,51 114,6 93,6 88,4 -5,6 -22,9
General purpose
machinery
4,27 118,2 96,3 99,0 2,8 -16,2
Special-purpose
machinery
2,65 116,1 85,6 78,6 -8,2 -32,3
Transport
equipment: Motor
vehicles
12,85 109,0 107,0 102,6 -4,1 -5,9
Other machinery and
equipment
3,20 93,2 96,3 100,5 4,4 7,8
STATISTICS SOUTH AFRICA 8 P0142.7
Export and Import Value Indices - February 2017
Figure 4.1 - Contributions to the monthly percentage change in exports
Figure 4.2 - Contributions to the annual percentage change in exports
STATISTICS SOUTH AFRICA 9 P0142.7
Export and Import Value Indices - February 2017
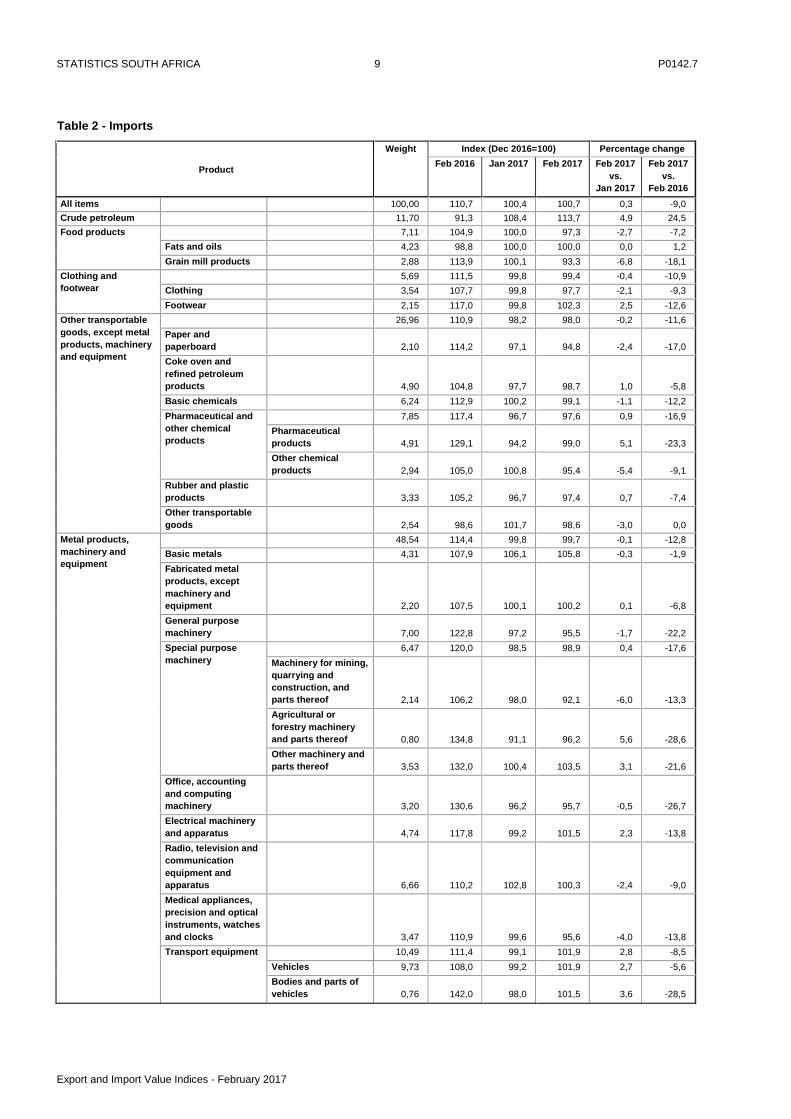
Table 2 - Imports
Product
Weight Index (Dec 2016=100) Percentage change
Feb 2016 Jan 2017 Feb 2017 Feb 2017
vs.
Jan 2017
Feb 2017
vs.
Feb 2016
All items 100,00 110,7 100,4 100,7 0,3 -9,0
Crude petroleum 11,70 91,3 108,4 113,7 4,9 24,5
Food products 7,11 104,9 100,0 97,3 -2,7 -7,2
Fats and oils 4,23 98,8 100,0 100,0 0,0 1,2
Grain mill products 2,88 113,9 100,1 93,3 -6,8 -18,1
Clothing and
footwear
5,69 111,5 99,8 99,4 -0,4 -10,9
Clothing 3,54 107,7 99,8 97,7 -2,1 -9,3
Footwear 2,15 117,0 99,8 102,3 2,5 -12,6
Other transportable
goods, except metal
products, machinery
and equipment
26,96 110,9 98,2 98,0 -0,2 -11,6
Paper and
paperboard
2,10 114,2 97,1 94,8 -2,4 -17,0
Coke oven and
refined petroleum
products
4,90 104,8 97,7 98,7 1,0 -5,8
Basic chemicals 6,24 112,9 100,2 99,1 -1,1 -12,2
Pharmaceutical and
other chemical
products
7,85 117,4 96,7 97,6 0,9 -16,9
Pharmaceutical
products 4,91 129,1 94,2 99,0 5,1 -23,3
Other chemical
products 2,94 105,0 100,8 95,4 -5,4 -9,1
Rubber and plastic
products
3,33 105,2 96,7 97,4 0,7 -7,4
Other transportable
goods
2,54 98,6 101,7 98,6 -3,0 0,0
Metal products,
machinery and
equipment
48,54 114,4 99,8 99,7 -0,1 -12,8
Basic metals 4,31 107,9 106,1 105,8 -0,3 -1,9
Fabricated metal
products, except
machinery and
equipment
2,20 107,5 100,1 100,2 0,1 -6,8
General purpose
machinery
7,00 122,8 97,2 95,5 -1,7 -22,2
Special purpose
machinery
6,47 120,0 98,5 98,9 0,4 -17,6
Machinery for mining,
quarrying and
construction, and
parts thereof 2,14 106,2 98,0 92,1 -6,0 -13,3
Agricultural or
forestry machinery
and parts thereof 0,80 134,8 91,1 96,2 5,6 -28,6
Other machinery and
parts thereof 3,53 132,0 100,4 103,5 3,1 -21,6
Office, accounting
and computing
machinery
3,20 130,6 96,2 95,7 -0,5 -26,7
Electrical machinery
and apparatus
4,74 117,8 99,2 101,5 2,3 -13,8
Radio, television and
communication
equipment and
apparatus
6,66 110,2 102,8 100,3 -2,4 -9,0
Medical appliances,
precision and optical
instruments, watches
and clocks
3,47 110,9 99,6 95,6 -4,0 -13,8
Transport equipment 10,49 111,4 99,1 101,9 2,8 -8,5
Vehicles 9,73 108,0 99,2 101,9 2,7 -5,6
Bodies and parts of
vehicles 0,76 142,0 98,0 101,5 3,6 -28,5
STATISTICS SOUTH AFRICA 10 P0142.7
Export and Import Value Indices - February 2017
Figure 5.1 - Contributions to the monthly percentage change in imports
Figure 5.2 - Contributions to the annual percentage change in imports
STATISTICS SOUTH AFRICA 11 P0142.7
Export and Import Value Indices - February 2017
EXPLANATORY NOTES
Purpose and results
1 The unit value index provides information on the trends in import and export unit values that are weighted with quantities of the current reference period. The calculation of unit value indices of commodities in exports and imports covers transactions reported by the South African Revenue Service. The results are used to compile export and import unit value indices, which are a measure of changes in export prices of locally produced commodities and changes in prices of imported commodities. Further information can be found in the XMUVI sources and methods document which can be accessed on this website: http://www.statssa.gov.za/?page_id=2528.
Source
2 South African Revenue Service (SARS).
Gold
3 The export unit value index for gold is calculated from net gold values and quantities obtained from the South African Reserve Bank (SARB) quarterly. The index changes quarterly and is published in this publication with a one quarter lag (e.g. the September 2013 gold value and quantity will only be included in the December 2013 publication).
GLOSSARY
Chain linking The construction of a continuous price series by multiplying together price indices
that have been using different weights for different periods. The resulting index is
referred to as a chained index (Practical Guide to producing Consumer Price
Indices; 2009). Linking is intended to ensure that the individual indices on all
levels show the correct development through time, but leads to non-additivity
(IMF, 2005).
Contributions The contribution (percentage points) of a sub-index to the percentage change in
the total index for a given period is calculated by multiplying the difference (i.e.
change) in the sub index by its weight and then dividing by the previous period’s
total index. In the case of annual percentage changes, the contributions are
approximations owing to annual changes in weights.
Percentage change The percentage change in an index for any given period is the change between
that period’s index value and the previous period’s index value expressed as a
percentage of the latter.
TECHNICAL ENQUIRIES
Richard Klaas Telephone number: (012) 310 2185
Email: [email protected]
Marietjie Bennett Telephone number: (012) 310 8077
Email: [email protected]
STATISTICS SOUTH AFRICA 12 P0142.7
Export and Import Value Indices - February 2017
GENERAL INFORMATION
Stats SA publishes approximately 300 different statistical releases each year. It is not economically viable to produce
them in more than one of South Africa's eleven official languages. Since the releases are used extensively, not only
locally but also by international economic and social-scientific communities, Stats SA releases are published in English
only.
Stats SA has copyright on this publication. Users may apply the information as they wish, provided that they
acknowledge Stats SA as the source of the basic data wherever they process, apply, utilise, publish or distribute the
data; and also that they specify that the relevant application and analysis (where applicable) result from their own
processing of the data.
Advance release calendar
An advance release calendar is disseminated on www.statssa.gov.za
Forthcoming issues
Issue Expected release date
March 2017 25 May 2017
April 2017 29 June 2017
May 2017 27 July 2017
Stats SA products
A complete set of Stats SA publications is available at the Stats SA Library and the following libraries:
National Library of South Africa, Pretoria Division
National Library of South Africa, Cape Town Division
Natal Society Library, Pietermaritzburg
Library of Parliament, Cape Town
Bloemfontein Public Library
Johannesburg Public Library
Eastern Cape Library Services, King William’s Town
Central Regional Library, Polokwane
Central Reference Library, Nelspruit
Central Reference Collection, Kimberley
Central Reference Library, Mmabatho
Stats SA also provides a subscription service.
Electronic services
A large range of data are available via on-line services, diskette and computer printouts. For more details about our
electronic data services, contact (012) 310 8600.
You can visit us on the internet at: www.statssa.gov.za
Enquiries
User information services Telephone number: (012) 310 8600
Email address: [email protected]
Orders/subscription services Telephone number: (012) 310 8044
Email address: [email protected]
Postal address Private Bag X44, Pretoria, 0001
Produced by Stats SA