Embed Size (px)
Citation preview
International Journal of Economics, Finance and Management Sciences 2018; 6(2): 66-74 http://www.sciencepublishinggroup.com/j/ijefm doi: 10.11648/j.ijefm.20180602.15 ISSN: 2326-9553 (Print); ISSN: 2326-9561 (Online)
Export and Import Demand Functions of Bangladesh: A Disaggregated Approach
Mohammad Monirul Islam Sarker
Centre for Economic Studies and Planning, Jawaharlal Nehru University, New Delhi, India
Email address:
To cite this article: Mohammad Monirul Islam Sarker. Export and Import Demand Functions of Bangladesh: A Disaggregated Approach. International Journal
of Economics, Finance and Management Sciences. Vol. 6, No. 2, 2018, pp. 66-74. doi: 10.11648/j.ijefm.20180602.15
Received: March 22, 2018; Accepted: April 8, 2018; Published: May 18, 2018
Abstract: This study attempts to estimate the export and import demand functions of Bangladesh on a bilateral basis by
using annual data from 1995-2015, Johansen cointegration test approach and vector error correction mechanism. The estimated
results identify income as an influential determinant of both export and import demand of Bangladesh, while the influence of
price is very limited. The price effect appears limited because Bangladesh’s export prices for garments are already absolutely
low, so changes in prices are less significant; while for imports, the impact of trade liberalization has been greater than
changing world prices.
Keywords: Export and Import Demand, Bilateral Model, Cointegration Test, Error Correction Mechanism,
Income and Price Elasticity
1. Introduction
The estimation of export and import demand functions is
generally a useful exercise for a small open economy, such as
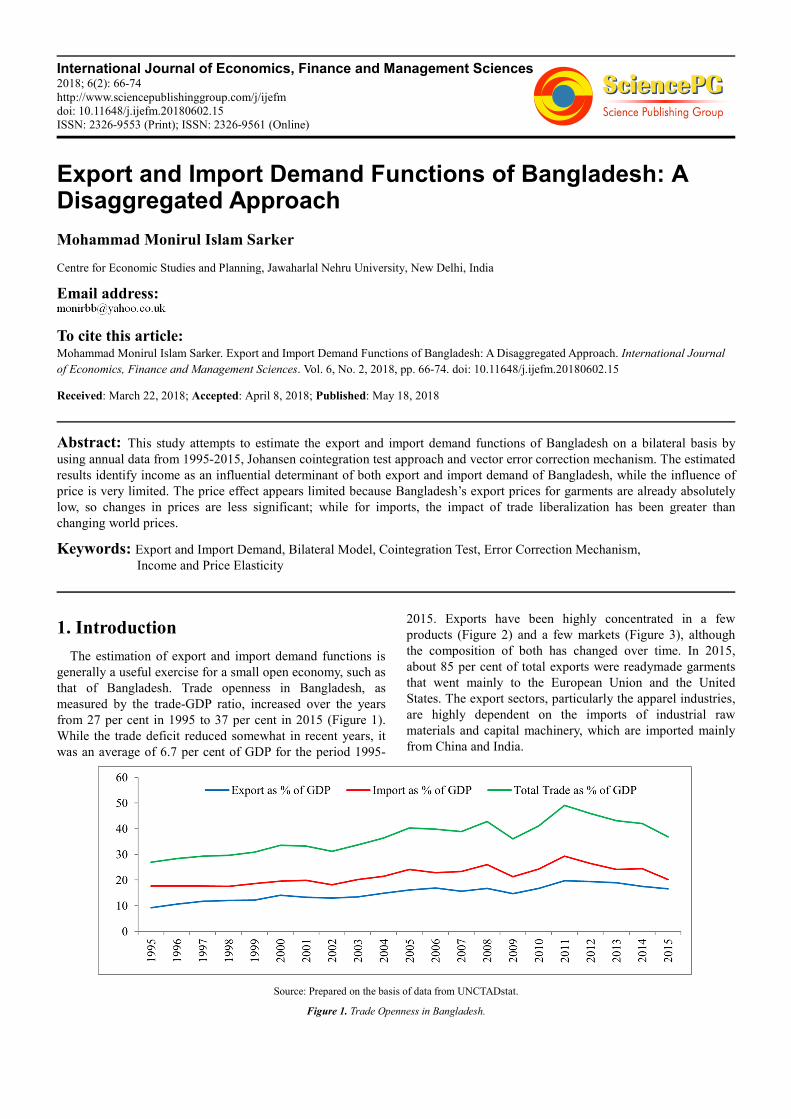
that of Bangladesh. Trade openness in Bangladesh, as
measured by the trade-GDP ratio, increased over the years
from 27 per cent in 1995 to 37 per cent in 2015 (Figure 1).
While the trade deficit reduced somewhat in recent years, it
was an average of 6.7 per cent of GDP for the period 1995-
2015. Exports have been highly concentrated in a few
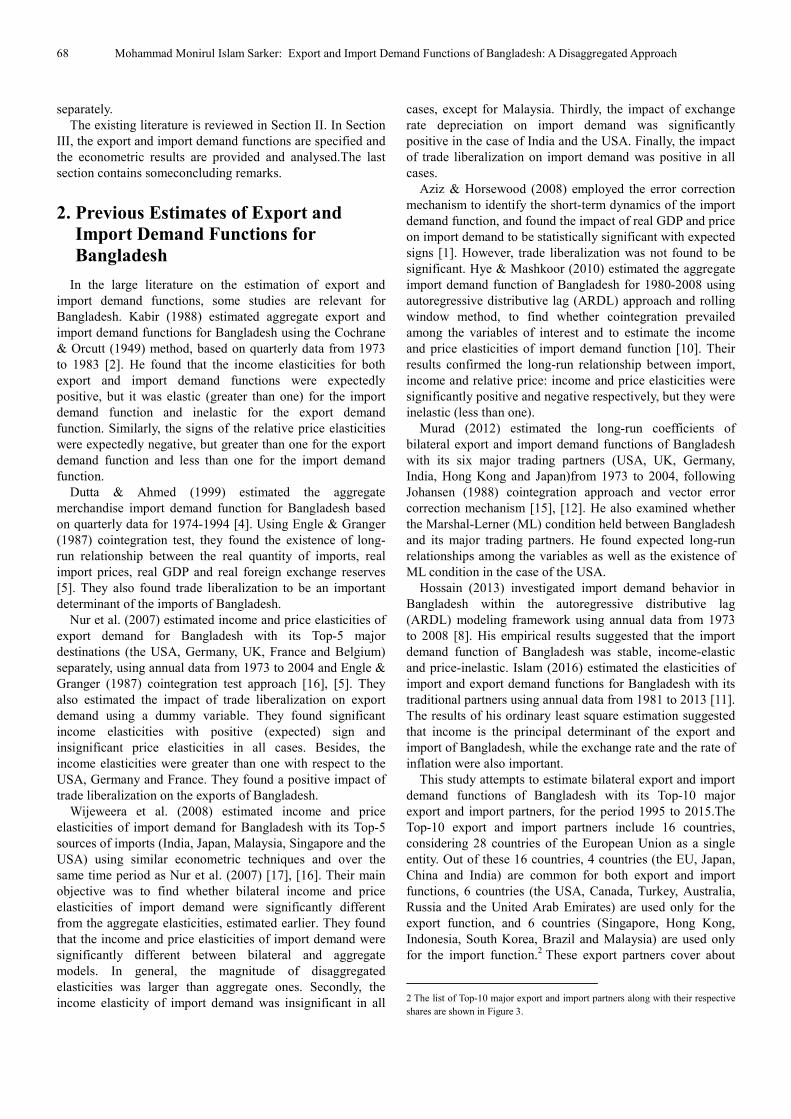
products (Figure 2) and a few markets (Figure 3), although
the composition of both has changed over time. In 2015,
about 85 per cent of total exports were readymade garments
that went mainly to the European Union and the United
States. The export sectors, particularly the apparel industries,
are highly dependent on the imports of industrial raw
materials and capital machinery, which are imported mainly
from China and India.
Source: Prepared on the basis of data from UNCTADstat.
Figure 1. Trade Openness in Bangladesh.
International Journal of Economics, Finance and Management Sciences 2018; 6(2): 66-74 67
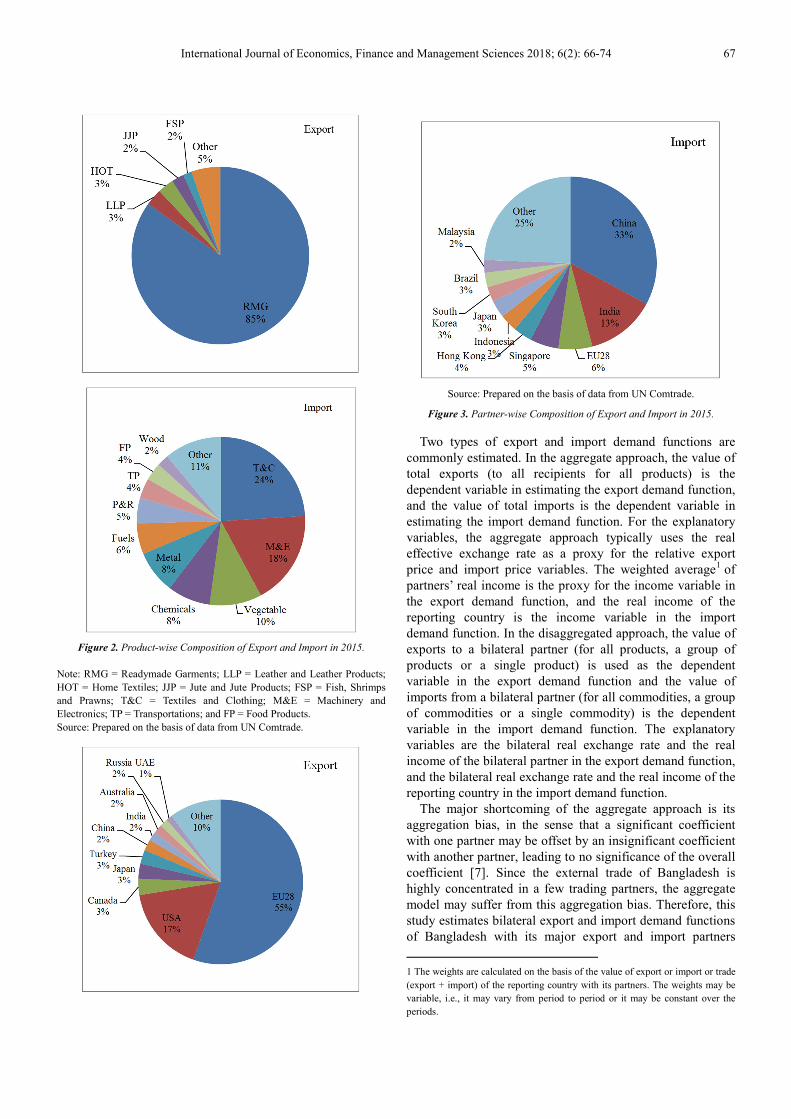
Figure 2. Product-wise Composition of Export and Import in 2015.
Note: RMG = Readymade Garments; LLP = Leather and Leather Products;
HOT = Home Textiles; JJP = Jute and Jute Products; FSP = Fish, Shrimps
and Prawns; T&C = Textiles and Clothing; M&E = Machinery and
Electronics; TP = Transportations; and FP = Food Products.
Source: Prepared on the basis of data from UN Comtrade.
Source: Prepared on the basis of data from UN Comtrade.
Figure 3. Partner-wise Composition of Export and Import in 2015.
Two types of export and import demand functions are
commonly estimated. In the aggregate approach, the value of
total exports (to all recipients for all products) is the
dependent variable in estimating the export demand function,
and the value of total imports is the dependent variable in
estimating the import demand function. For the explanatory
variables, the aggregate approach typically uses the real
effective exchange rate as a proxy for the relative export
price and import price variables. The weighted average1 of
partners’ real income is the proxy for the income variable in
the export demand function, and the real income of the
reporting country is the income variable in the import
demand function. In the disaggregated approach, the value of
exports to a bilateral partner (for all products, a group of
products or a single product) is used as the dependent
variable in the export demand function and the value of
imports from a bilateral partner (for all commodities, a group
of commodities or a single commodity) is the dependent
variable in the import demand function. The explanatory
variables are the bilateral real exchange rate and the real
income of the bilateral partner in the export demand function,
and the bilateral real exchange rate and the real income of the
reporting country in the import demand function.
The major shortcoming of the aggregate approach is its
aggregation bias, in the sense that a significant coefficient
with one partner may be offset by an insignificant coefficient
with another partner, leading to no significance of the overall
coefficient [7]. Since the external trade of Bangladesh is
highly concentrated in a few trading partners, the aggregate
model may suffer from this aggregation bias. Therefore, this
study estimates bilateral export and import demand functions
of Bangladesh with its major export and import partners
1 The weights are calculated on the basis of the value of export or import or trade
(export + import) of the reporting country with its partners. The weights may be
variable, i.e., it may vary from period to period or it may be constant over the
periods.
68 Mohammad Monirul Islam Sarker: Export and Import Demand Functions of Bangladesh: A Disaggregated Approach
separately.
The existing literature is reviewed in Section II. In Section
III, the export and import demand functions are specified and
the econometric results are provided and analysed.The last
section contains someconcluding remarks.
2. Previous Estimates of Export and
Import Demand Functions for
Bangladesh
In the large literature on the estimation of export and
import demand functions, some studies are relevant for
Bangladesh. Kabir (1988) estimated aggregate export and
import demand functions for Bangladesh using the Cochrane
& Orcutt (1949) method, based on quarterly data from 1973
to 1983 [2]. He found that the income elasticities for both
export and import demand functions were expectedly
positive, but it was elastic (greater than one) for the import
demand function and inelastic for the export demand
function. Similarly, the signs of the relative price elasticities
were expectedly negative, but greater than one for the export
demand function and less than one for the import demand
function.
Dutta & Ahmed (1999) estimated the aggregate
merchandise import demand function for Bangladesh based
on quarterly data for 1974-1994 [4]. Using Engle & Granger
(1987) cointegration test, they found the existence of long-
run relationship between the real quantity of imports, real
import prices, real GDP and real foreign exchange reserves
[5]. They also found trade liberalization to be an important
determinant of the imports of Bangladesh.
Nur et al. (2007) estimated income and price elasticities of
export demand for Bangladesh with its Top-5 major
destinations (the USA, Germany, UK, France and Belgium)
separately, using annual data from 1973 to 2004 and Engle &
Granger (1987) cointegration test approach [16], [5]. They
also estimated the impact of trade liberalization on export
demand using a dummy variable. They found significant
income elasticities with positive (expected) sign and
insignificant price elasticities in all cases. Besides, the
income elasticities were greater than one with respect to the
USA, Germany and France. They found a positive impact of
trade liberalization on the exports of Bangladesh.
Wijeweera et al. (2008) estimated income and price
elasticities of import demand for Bangladesh with its Top-5
sources of imports (India, Japan, Malaysia, Singapore and the
USA) using similar econometric techniques and over the
same time period as Nur et al. (2007) [17], [16]. Their main
objective was to find whether bilateral income and price
elasticities of import demand were significantly different
from the aggregate elasticities, estimated earlier. They found
that the income and price elasticities of import demand were
significantly different between bilateral and aggregate
models. In general, the magnitude of disaggregated
elasticities was larger than aggregate ones. Secondly, the
income elasticity of import demand was insignificant in all
cases, except for Malaysia. Thirdly, the impact of exchange
rate depreciation on import demand was significantly
positive in the case of India and the USA. Finally, the impact
of trade liberalization on import demand was positive in all
cases.
Aziz & Horsewood (2008) employed the error correction
mechanism to identify the short-term dynamics of the import
demand function, and found the impact of real GDP and price
on import demand to be statistically significant with expected
signs [1]. However, trade liberalization was not found to be
significant. Hye & Mashkoor (2010) estimated the aggregate
import demand function of Bangladesh for 1980-2008 using
autoregressive distributive lag (ARDL) approach and rolling
window method, to find whether cointegration prevailed
among the variables of interest and to estimate the income
and price elasticities of import demand function [10]. Their
results confirmed the long-run relationship between import,
income and relative price: income and price elasticities were
significantly positive and negative respectively, but they were
inelastic (less than one).
Murad (2012) estimated the long-run coefficients of
bilateral export and import demand functions of Bangladesh
with its six major trading partners (USA, UK, Germany,
India, Hong Kong and Japan)from 1973 to 2004, following
Johansen (1988) cointegration approach and vector error
correction mechanism [15], [12]. He also examined whether
the Marshal-Lerner (ML) condition held between Bangladesh
and its major trading partners. He found expected long-run
relationships among the variables as well as the existence of
ML condition in the case of the USA.
Hossain (2013) investigated import demand behavior in
Bangladesh within the autoregressive distributive lag
(ARDL) modeling framework using annual data from 1973
to 2008 [8]. His empirical results suggested that the import
demand function of Bangladesh was stable, income-elastic
and price-inelastic. Islam (2016) estimated the elasticities of
import and export demand functions for Bangladesh with its
traditional partners using annual data from 1981 to 2013 [11].
The results of his ordinary least square estimation suggested
that income is the principal determinant of the export and
import of Bangladesh, while the exchange rate and the rate of
inflation were also important.
This study attempts to estimate bilateral export and import
demand functions of Bangladesh with its Top-10 major
export and import partners, for the period 1995 to 2015.The
Top-10 export and import partners include 16 countries,
considering 28 countries of the European Union as a single
entity. Out of these 16 countries, 4 countries (the EU, Japan,
China and India) are common for both export and import
functions, 6 countries (the USA, Canada, Turkey, Australia,
Russia and the United Arab Emirates) are used only for the
export function, and 6 countries (Singapore, Hong Kong,
Indonesia, South Korea, Brazil and Malaysia) are used only
for the import function.2 These export partners cover about
2 The list of Top-10 major export and import partners along with their respective
shares are shown in Figure 3.
International Journal of Economics, Finance and Management Sciences 2018; 6(2): 66-74 69
90 per cent of total exports and the import partners cover 75
per cent of total imports of Bangladesh as per data of 2015
(Figure 3). This study adds to the literature because (i) it
covers the latest annual data up to 2015, (ii) it covers a
greater number of major trading partners compared to the
earlier studies, and (iii) it considers the 28 countries of
European Union as a single trading partner for both export
and import demand functions.
3. Estimation Procedure and Results
Income and price are the two principal determinants of
any demand function whether it is Marshallian type at the
micro level or Keynesian type at the macro level [14], [9].
Since the export and import demand functions reflect
macroeconomic phenomena, it is justified to consider
national income as the income variable and the relative
price (domestic price divided by foreign price) as the price
variable in the export and import demand functions.
Usually the real GDP and the real exchange rate are used
as proxies for income and relative price variables in the
export and import demand functions. Theoretically, the
export demand of a country is positively influenced by its
trading partners’ income and negatively influenced by real
exchange rate.3 On the other hand, the import demand of a
country is positively influenced by its own income and
real exchange rate. 4 Therefore, the export and import
demand functions in context of Bangladesh are:
21 )R()Y(X tpttαα= (1)
21 )R()Y(M tbttββ= (2)
where X, M and bY indicate the real exports, real imports
and real GDP of Bangladesh respectively, pY indicates the
real GDP of partner country, R indicates the real exchange rate between Bangladesh’s taka and partner’s currency, t
indicates time period, 1α and 2α indicate income and real
exchange rate elasticities of export demand, and 1β and 2β
indicate income and real exchange rate elasticities of import demand respectively. It is expected that
0 and 0 and , 2211 <α>ββα .
To estimate export and import demand functions
empirically, I convert this multiplicative form into additive
form by taking natural log on both sides and adding constant
and error terms.
tt2pt10t uRlnYlnXln +α+α+α= (3)
3 Assuming the export goods are normal by nature. The impact of real exchange
rate on export demand is negative in the sense that the increase of real exchange
rate appreciates domestic currency and raises the price of export goods in terms of
foreign currency.
4 Assuming the import goods are normal by nature. The impact of real exchange
rate on import demand is positive in the sense that the increase of real exchange
rate appreciates domestic currency and reduces the price of import goods in terms
of local currency.
tt2bt10t vRlnYlnMln +β+β+β= (4)
where 0α and 0β are the constant terms, and tu and tv are
the error terms in the export and import demand functions respectively.
3.1. Data Sources
The deflated value of nominal exports and nominal
imports (by export and import price indices) are used as real
exports and real imports of Bangladesh. Data on nominal
exports and nominal imports are from UNCTADstat,5 and the
export and import price indices are from Bangladesh
Economic Review (BER). 6 The data on real GDP of
Bangladesh and its trading partners are collected from
UNCTADstat. The data on real exchange rate is calculated by
using equation (5) for all partners, other than the EU, for
which equation (6) is used.
tp
b
ttaka
pct
CPI
CPI*
ER
ERR
= (5)
teu
b
ttaka
euct
WACPI
CPI*
ER
WAERR
= (6)
where pctaka ERand ER indicate the exchange rate of US
dollar in terms of Bangladesh taka and partner’s currency
respectively, pb CPI and CPI indicate consumer price index
of Bangladesh and its partners respectively,
eueuc WACPI and WAER indicate the weighted average
exchange rate of US$ in terms of the currencies of EU members and the weighted average consumer price indices of EU members respectively.7 The data on exchange rate and the consumer price index (2005=100) are collected from WDI8 and UNCTADstat respectively. Euro conversion rates9 are used to convert the exchange rate of euro countries from national currency per US$ to euro per US$ for the period when they were not members of the euro area.10
3.2. Stationarity Test
Although time series data are used heavily in econometric
analyses, non-stationarity is a common problem in data. 11
5 World Statistical Database, created by the United Nations Conference on Trade
and Development: https://comtrade.un.org/
6 The export and import price indices, published in BER (http://mof.gov.bd/en/),
are not in the same base for the period of 1995-2015. So, these are converted into
single base: 2005=100 to make similar to other indices like CPI used in this study.
7 The variable export weights are used in case of export demand functions and the
variable import weights are used in case of import demand functions.
8 A publication of the World Bank: http://data.worldbank.org/
9 Collected from the European Central Bank:
http://www.ecb.europa.eu/euro/intro/html/index.en.html
10 The euro area is a monetary union of 19 countries out of 28 members of the
European Union.
11 A time series is said to be stationary if its mean, variance and auto-covariance
(at various lags) remain the same no matter at what point they are measured, i.e.,
they are time invariant; otherwise, it is called non-stationary.

70 Mohammad Monirul Islam Sarker: Export and Import Demand Functions of Bangladesh: A Disaggregated Approach
This study uses the unit root test for stationarity of time
series data, mainly the Dickey-Fuller test and sometimes the
Phillips-Perron method when necessary. This required testing
the stationarity of 30 data series for export demand functions
and 21 data series for import demand functions.12 The results
are presented in Table 1 and Table 2 for the export and import
demand functions respectively, which show that all variables
related to export and import demand functions are non-
stationary at level form and stationary at first difference
form, i.e., they are integrated of order 1, I(1). In other word,
they have unit roots.
Table 1. Results of Unit Root Test for Export Demand Functions.
Variable ADF Test Statistic Order of
Integration
Level 1st Difference
Real Export
InXEU -2.40 -3.32*** I (1)
lnXUSA -2.46 -3.28*** I (1)
lnXCAN 0.87 -3.14*** I (1)
lnXJPN 2.04 -2.04** I (1)
lnXTUR -1.71 -3.35*** I (1)
InXCHN -1.90 -4.54*** I (1)
lnXAUS -0.94 -3.26*** I (1)
ln XIND -2.15 -2.75*** I (1)
lnXRUS -3.16 -2.91* I (1)
lnXUAE -1.21 -4.11*** I (1)
Real Income
InYEU 4.33 -2.11** I (1)
lnYUSA -2.22 -29.96*** I (1)
ln YCAN -1.34 -3.19** I (1)
lnYJPN -2.91 -4.79*** I (1)
ln YTUR -2.65 -2.81*** I (1)
InYCHN -1.70 -2.08* I (1)
lnYAUS -0.81 -3.20*** I (1)
lnYIND -2.87 -3.41** I (1)
lnYRUS -1.45 -2.42** I (1)
lnYUAE -1.39 -2.06** I (1)
Real Exchange Rate
InREU 9.49 -1.28* I (1)
lnRUSA -0.15 -2.78*** I (1)
lnRCAN -3.02 -1.67* I (1)
lnRJPN -1.10 -2.82*** I (1)
ln RTUR 0.49 -3.42*** I (1)
In RCHN -2.22 -3.97*** I (1)
ln RAUS -0.47 -2.23** I (1)
lnRIND -0.11 -3.09*** I (1)
lnRRUS 0.83 -2.33** I (1)
lnRUAE -2.87 -4.45*** I (1)
Note: (i) The variable X, Y and R are in natural logarithmic form and they
are correspondence to concern export partner. Here the partners are reported
by their short name like, EU = European Union. (ii) ***, ** and * denote
significant at 1%, 5%, and 10% level respectively.
12 There are three variables (one dependent variable and two explanatory
variables) in each export and import demand function. Ten data series are needed
for each variable except the case of import demand functions where one data
series on real GDP of Bangladesh is used in all functions.
Table 2. Results of Unit Root Test for Import Demand Functions.
Variable ADF Test Statistic Order of
Integration
Level 1st Difference
Real Import
InMCHN 1.14 -2.83*** I (1)
lnMIND -2.93 -5.57*** I (1)
lnMEU -0.27 -3.85*** I (1)
lnMSGP -2.06 -4.20*** I (1)
lnMJPN -2.27 -5.78*** I (1)
InMIDN -2.03 -2.94*** I (1)
lnMKOR -1.57 -5.17*** I (1)
ln MMYS -2.97 -3.68*** I (1)
lnMBRA -2.84 -5.88*** I (1)
lnMHKG -1.37 -3.40*** I (1)
Real Income
InYBGD@ -1.68 -3.08* I (1)
Real Exchange Rate
InRCHN -2.22 -3.97*** I (1)
lnRIND -0.11 -3.09*** I (1)
lnREU 4.50 -1.46* I (1)
lnRSGP -3.14 -3.27** I (1)
lnRJPN -1.10 -2.82*** I (1)
InRIDN -2.46 -5.02*** I (1)
lnRKOR -2.84 -3.01*** I (1)
lnRMYS -1.56 -2.84*** I (1)
lnRBRA -1.11 -2.88*** I (1)
lnRHKG 2.18 -3.58*** I (1)
Note: (i) The variable M and R are in natural logarithmic form and they are
correspondence to concern import partner. Here the partners are reported by
their short name, like CHN = China. The variable YBGD (real income of
Bangladesh) is also in logarithmic form. (ii)***, **and * denote significant
at 1%, 5% and 10% level respectively. @ using Phillips-Perron method.
3.3. Cointegration Test
Since the variables are non-stationary at level form, they will
produce spurious regression if the ordinary least squares method
is applied to estimate export and import demand functions [18].
Since the sample size considered in this study is not so small (21
observations for the period of 1995-2015)13 and the variables
intended to use are integrated in the same order, i.e., I(1), the
Johansen method (a multivariate generalization of the
augmented Dickey-Fuller test which starts from the Vector
Autoregression or VAR) was applied to test whether the
variables in export and import demand functions are
cointegrated or not. This was applied on 20 functions separately.
The results of cointegration test along with the optimal number
of lags are shown in Table 3. It is observed that there is long-run
relationship among the variables used in the export and import
demand functions of Bangladesh. Specifically, the real export of
Bangladesh, real income of the partner country and the real
exchange rate of Bangladesh taka against partner currency have
long-run association among themselves and they influence one
another in the long-run. The same characteristics prevailed for
real imports of Bangladesh, real income of Bangladesh and the
real exchange rate of Bangladesh taka against the partner
currency.
13 The data on export and import of Bangladesh are very different in different
sources. Among them, the data of UNCTADstat that covers all merchandise
products looks very reliable. Therefore, this study collects both export and import
data from UNCTADstat which have started from 1995.
International Journal of Economics, Finance and Management Sciences 2018; 6(2): 66-74 71
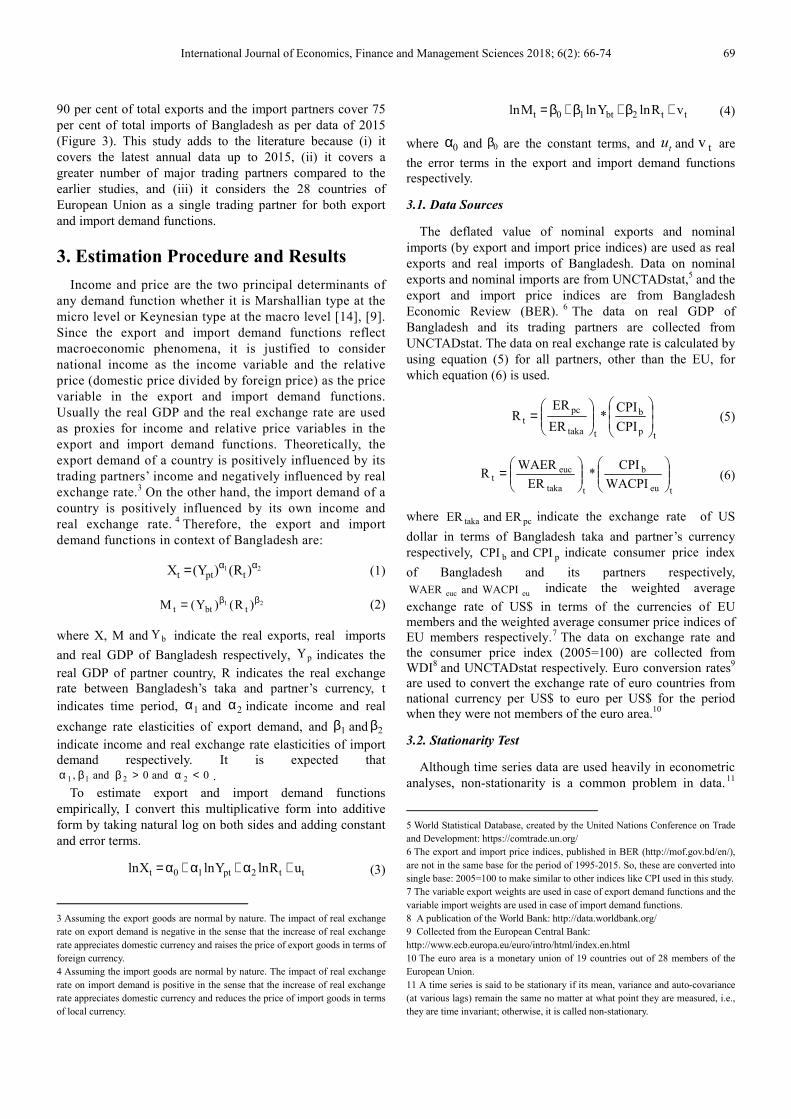
Table 3. Results of Johansen’s Test of Cointegration.
Partner No. of Cointegrating Equation(s)
Decision Trace Test Max-Eigenvalue Test
Export Demand Function
European Union (1) 1 1 Cointegrated
United States (2) 1 1 Cointegrated
Canada (1) 1 1 Cointegrated
Japan (1) 1 1 Cointegrated
Turkey (1) 1 1 Cointegrated
China (1) 1 1 Cointegrated
Australia (1) 1 1 Cointegrated
India (1) 1 1 Cointegrated
Russia (2) 1 1 Cointegrated
United Arab Emirates (2) 1 1 Cointegrated
Import Demand Function
Cointegrated
China (1) 1 1 Cointegrated
India (2) 1 1 Cointegrated
European Union (1) 1 1 Cointegrated
Singapore (2) 1 1 Cointegrated
Japan (1) 1 1 Cointegrated
Indonesia (1) 1 1 Cointegrated
South Korea 1 1 Cointegrated
Malaysia (1) 1 1 Cointegrated
Brazil (2) 1 1 Cointegrated
Hong Kong (1) 1 1 Cointegrated
Note: Figures in the parentheses indicate optimal number of lag(s).
3.4. Vector Error Correction Model
It is important to test the impact of short-run disturbances
on the long-run relationship (i.e., the test of the stability of
long-run relationship) as well as to know the direction and
magnitude of the long-run relationship among the variables,
in other words, to know the long-run coefficients of the
cointegrating equations. Therefore, the vector error
correction model14 was estimated for the export and import
demand functions of Bangladesh. The results are depicted in
Table 4.
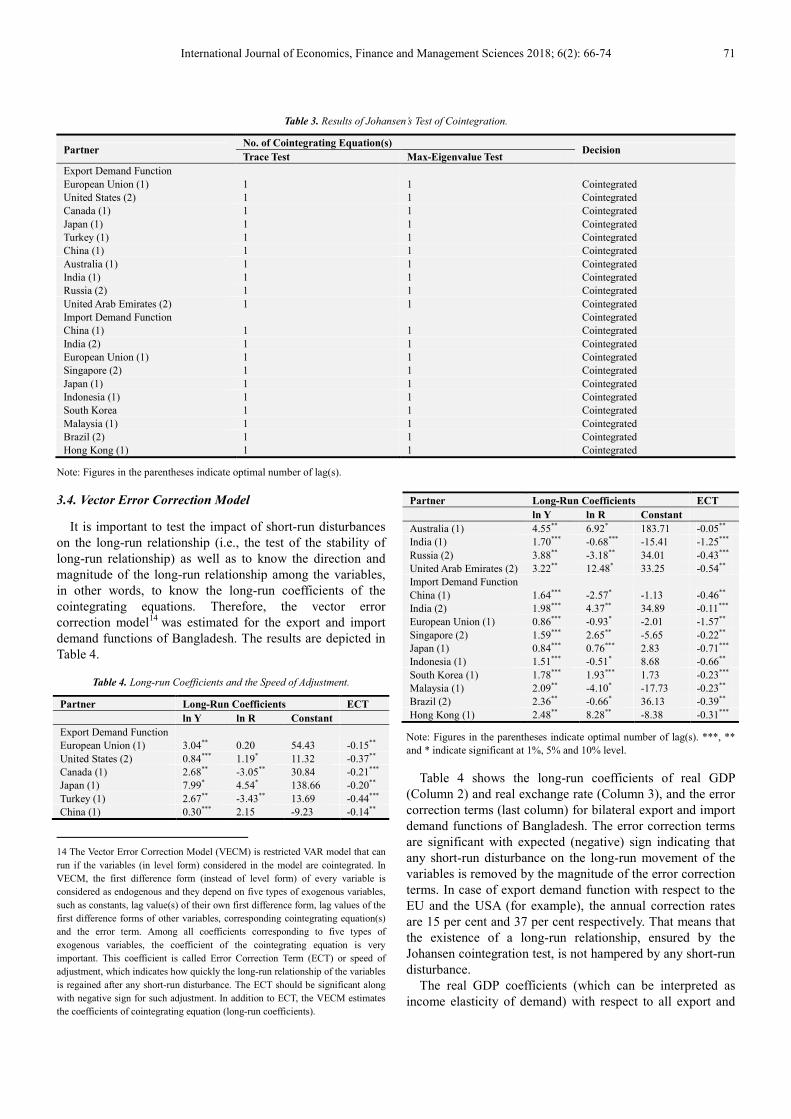
Table 4. Long-run Coefficients and the Speed of Adjustment.
Partner Long-Run Coefficients ECT
ln Y ln R Constant
Export Demand Function
European Union (1) 3.04** 0.20 54.43 -0.15**
United States (2) 0.84*** 1.19* 11.32 -0.37**
Canada (1) 2.68** -3.05** 30.84 -0.21***
Japan (1) 7.99* 4.54* 138.66 -0.20**
Turkey (1) 2.67** -3.43** 13.69 -0.44***
China (1) 0.30*** 2.15 -9.23 -0.14**
14 The Vector Error Correction Model (VECM) is restricted VAR model that can
run if the variables (in level form) considered in the model are cointegrated. In
VECM, the first difference form (instead of level form) of every variable is
considered as endogenous and they depend on five types of exogenous variables,
such as constants, lag value(s) of their own first difference form, lag values of the
first difference forms of other variables, corresponding cointegrating equation(s)
and the error term. Among all coefficients corresponding to five types of
exogenous variables, the coefficient of the cointegrating equation is very
important. This coefficient is called Error Correction Term (ECT) or speed of
adjustment, which indicates how quickly the long-run relationship of the variables
is regained after any short-run disturbance. The ECT should be significant along
with negative sign for such adjustment. In addition to ECT, the VECM estimates
the coefficients of cointegrating equation (long-run coefficients).
Partner Long-Run Coefficients ECT
ln Y ln R Constant
Australia (1) 4.55** 6.92* 183.71 -0.05**
India (1) 1.70*** -0.68*** -15.41 -1.25***
Russia (2) 3.88** -3.18** 34.01 -0.43***
United Arab Emirates (2) 3.22** 12.48* 33.25 -0.54**
Import Demand Function
China (1) 1.64*** -2.57* -1.13 -0.46**
India (2) 1.98*** 4.37** 34.89 -0.11***
European Union (1) 0.86*** -0.93* -2.01 -1.57**
Singapore (2) 1.59*** 2.65** -5.65 -0.22**
Japan (1) 0.84*** 0.76*** 2.83 -0.71***
Indonesia (1) 1.51*** -0.51* 8.68 -0.66**
South Korea (1) 1.78*** 1.93*** 1.73 -0.23***
Malaysia (1) 2.09** -4.10* -17.73 -0.23**
Brazil (2) 2.36** -0.66* 36.13 -0.39**
Hong Kong (1) 2.48** 8.28** -8.38 -0.31***
Note: Figures in the parentheses indicate optimal number of lag(s). ***, **
and * indicate significant at 1%, 5% and 10% level.
Table 4 shows the long-run coefficients of real GDP
(Column 2) and real exchange rate (Column 3), and the error
correction terms (last column) for bilateral export and import
demand functions of Bangladesh. The error correction terms
are significant with expected (negative) sign indicating that
any short-run disturbance on the long-run movement of the
variables is removed by the magnitude of the error correction
terms. In case of export demand function with respect to the
EU and the USA (for example), the annual correction rates
are 15 per cent and 37 per cent respectively. That means that
the existence of a long-run relationship, ensured by the
Johansen cointegration test, is not hampered by any short-run
disturbance.
The real GDP coefficients (which can be interpreted as
income elasticity of demand) with respect to all export and
72 Mohammad Monirul Islam Sarker: Export and Import Demand Functions of Bangladesh: A Disaggregated Approach
import demand functions are significant with expected
(positive) sign, but the real exchange rate coefficients (used
as proxy for price elasticity) are not. The real GDP
coefficients are not only significant with positive sign but
also elastic (greater than 1) in most of the cases. Out of 10
export demand functions, the real GDP coefficients are
elastic in 8 cases, except for the United States and China.
This result indicates that the export demand for Bangladeshi
products is highly influenced by economic growth in partner
countries. So the business cycles of those countries affect
export demand of Bangladesh. This result validates much of
the existing literature [16], [11] and is as expected given the
nature of Bangladeshi export products, since the main export
item—readymade garments—is likely to be income elastic in
demand. But in case of China, the income elasticity for
Bangladesh’s exports is very low (0.30), probably because
China is not a major RMG importer; rather she is the largest
RMG exporter internationally.
Like the export demand function, the real GDP coefficients
of the import demand functions are elastic in most of the
cases (8 out of 10) except the European Union and Japan,
which are near unity. This is similar to the existing literature
[1], [10]. Therefore, domestic economic growth is an
important factor for import demand in Bangladesh. But this
may not be because of final consumption, as the nature of
import goods indicates. As Figure 2 shows, textile and
clothing (mostly raw materials for apparel industries) is the
largest import item of Bangladesh (24 per cent of total
imports) followed by machinery and electronics (18 per cent
of total imports). The demand for Bangladesh’s imports
mostly depend on activity in the export-oriented
manufacturing sector, which obviously then contributes to
aggregate output.
Among the real exchange rate coefficients, some are
significant with expected sign, some are significant with
unexpected (opposite) sign and some are insignificant with
unexpected sign. In case of the export demand function, 4
coefficients are significant with expected (negative) sign
against Canada, Turkey, India and Russia; 4 coefficients are
significant with unexpected (positive) sign against the United
States, Japan, Australia and the United Arab Emirates; and 2
coefficients against the European Union and China are
neither significant nor negative. The real exchange rate
coefficients that are significant with expected sign cover only
10 per cent of total exports of Bangladesh (Figure 3). These
results suggest that the real exchange rate is not an important
determinant of export demand for Bangladesh. Although this
estimated result is supported by some existing literature [16],
it is unexpected and obviously of great interest to policy
makers.
Several factors may be at work in this regard. First, it
should be noted that the consumer price indices used in the
construction of the bilateral real exchange rates incorporate
the prices of both tradable and non-tradable goods. Among
the tradable goods, some goods are exportable and some
goods are imported. Ideally, there should be further
disaggregation, for example, it would appropriate to use the
export price index of Bangladesh and the consumer price
index of the partner country that are constructed considering
the commodities exports from Bangladesh to that particular
trading partner to estimate the bilateral real exchange rate for
exports. But such data are not available in the existing
sources.
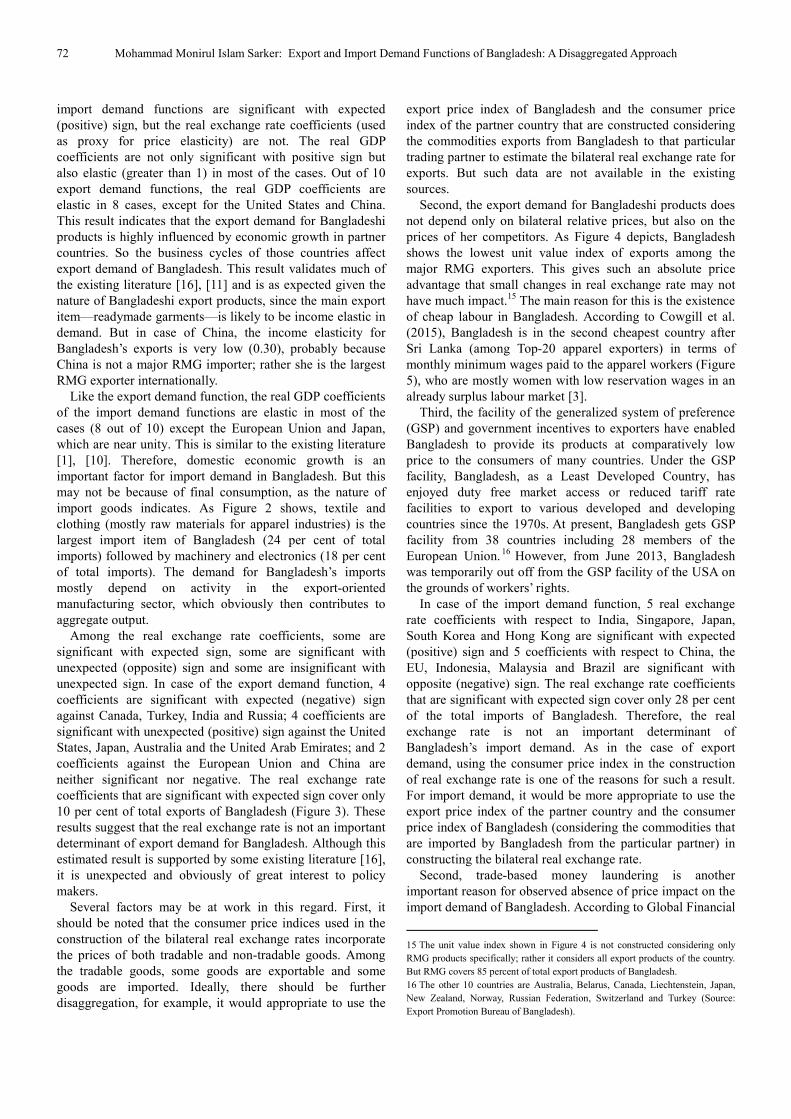
Second, the export demand for Bangladeshi products does
not depend only on bilateral relative prices, but also on the
prices of her competitors. As Figure 4 depicts, Bangladesh
shows the lowest unit value index of exports among the
major RMG exporters. This gives such an absolute price
advantage that small changes in real exchange rate may not
have much impact.15 The main reason for this is the existence
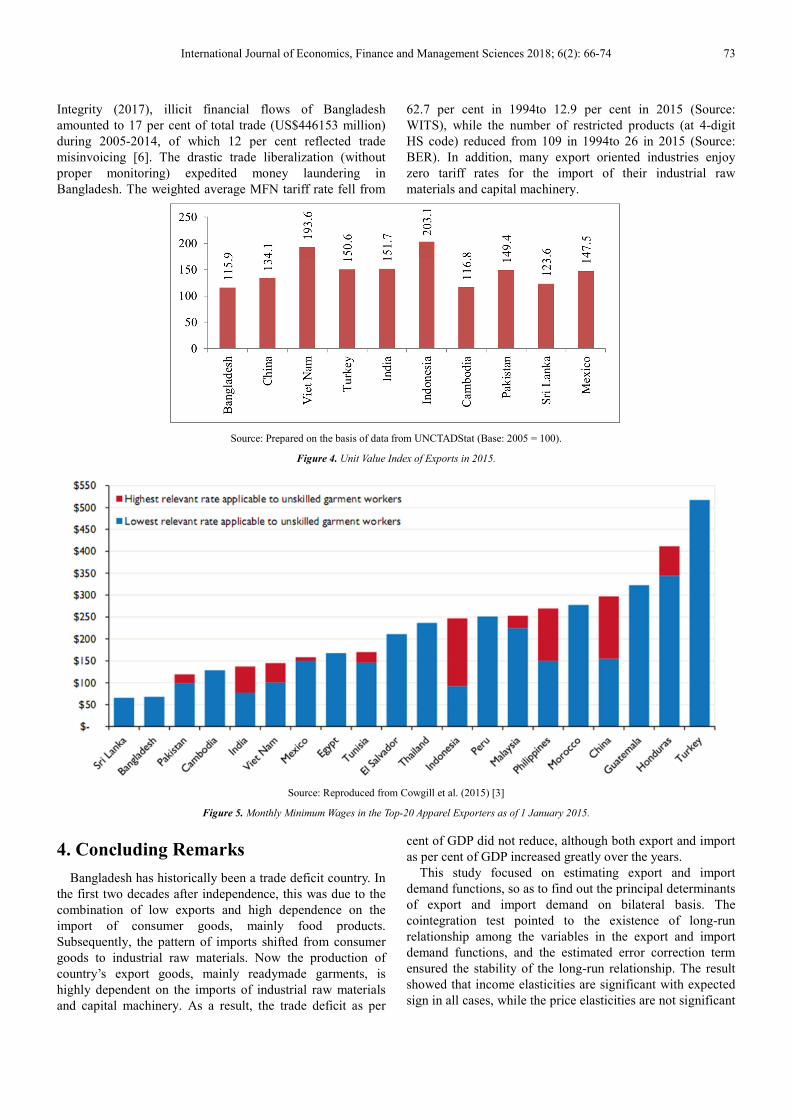
of cheap labour in Bangladesh. According to Cowgill et al.
(2015), Bangladesh is in the second cheapest country after
Sri Lanka (among Top-20 apparel exporters) in terms of
monthly minimum wages paid to the apparel workers (Figure
5), who are mostly women with low reservation wages in an
already surplus labour market [3].
Third, the facility of the generalized system of preference
(GSP) and government incentives to exporters have enabled
Bangladesh to provide its products at comparatively low
price to the consumers of many countries. Under the GSP
facility, Bangladesh, as a Least Developed Country, has
enjoyed duty free market access or reduced tariff rate
facilities to export to various developed and developing
countries since the 1970s. At present, Bangladesh gets GSP
facility from 38 countries including 28 members of the
European Union. 16 However, from June 2013, Bangladesh
was temporarily out off from the GSP facility of the USA on
the grounds of workers’ rights.
In case of the import demand function, 5 real exchange
rate coefficients with respect to India, Singapore, Japan,
South Korea and Hong Kong are significant with expected
(positive) sign and 5 coefficients with respect to China, the
EU, Indonesia, Malaysia and Brazil are significant with
opposite (negative) sign. The real exchange rate coefficients
that are significant with expected sign cover only 28 per cent
of the total imports of Bangladesh. Therefore, the real
exchange rate is not an important determinant of
Bangladesh’s import demand. As in the case of export
demand, using the consumer price index in the construction
of real exchange rate is one of the reasons for such a result.
For import demand, it would be more appropriate to use the
export price index of the partner country and the consumer
price index of Bangladesh (considering the commodities that
are imported by Bangladesh from the particular partner) in
constructing the bilateral real exchange rate.
Second, trade-based money laundering is another
important reason for observed absence of price impact on the
import demand of Bangladesh. According to Global Financial
15 The unit value index shown in Figure 4 is not constructed considering only
RMG products specifically; rather it considers all export products of the country.
But RMG covers 85 percent of total export products of Bangladesh.
16 The other 10 countries are Australia, Belarus, Canada, Liechtenstein, Japan,
New Zealand, Norway, Russian Federation, Switzerland and Turkey (Source:
Export Promotion Bureau of Bangladesh).
International Journal of Economics, Finance and Management Sciences 2018; 6(2): 66-74 73
Integrity (2017), illicit financial flows of Bangladesh
amounted to 17 per cent of total trade (US$446153 million)
during 2005-2014, of which 12 per cent reflected trade
misinvoicing [6]. The drastic trade liberalization (without
proper monitoring) expedited money laundering in
Bangladesh. The weighted average MFN tariff rate fell from
62.7 per cent in 1994to 12.9 per cent in 2015 (Source:
WITS), while the number of restricted products (at 4-digit
HS code) reduced from 109 in 1994to 26 in 2015 (Source:
BER). In addition, many export oriented industries enjoy
zero tariff rates for the import of their industrial raw
materials and capital machinery.
Source: Prepared on the basis of data from UNCTADStat (Base: 2005 = 100).
Figure 4. Unit Value Index of Exports in 2015.
Source: Reproduced from Cowgill et al. (2015) [3]
Figure 5. Monthly Minimum Wages in the Top-20 Apparel Exporters as of 1 January 2015.
4. Concluding Remarks
Bangladesh has historically been a trade deficit country. In
the first two decades after independence, this was due to the
combination of low exports and high dependence on the
import of consumer goods, mainly food products.
Subsequently, the pattern of imports shifted from consumer
goods to industrial raw materials. Now the production of
country’s export goods, mainly readymade garments, is
highly dependent on the imports of industrial raw materials
and capital machinery. As a result, the trade deficit as per
cent of GDP did not reduce, although both export and import
as per cent of GDP increased greatly over the years.
This study focused on estimating export and import
demand functions, so as to find out the principal determinants
of export and import demand on bilateral basis. The
cointegration test pointed to the existence of long-run
relationship among the variables in the export and import
demand functions, and the estimated error correction term
ensured the stability of the long-run relationship. The result
showed that income elasticities are significant with expected
sign in all cases, while the price elasticities are not significant
74 Mohammad Monirul Islam Sarker: Export and Import Demand Functions of Bangladesh: A Disaggregated Approach
in most of the cases. The real exchange rate (used as proxy of
relative price) coefficients that are significant with expected
sign represent only 10 per cent of total exports and 28 per
cent of total imports of Bangladesh.
Probable reasons for this unexpected price effect include
the level of aggregation in calculating the real exchange rate;
the fact that Bangladesh’s main export (garments) is so low
priced internationally (because of cheap labour) that
exchange rate changes cannot affect exports much; the GSP
facility as well as the government cash incentives that make
Bangladeshi products more competitive in the international
market; and the existence of trade based money laundering,
which has been expedited by trade liberalization.
The results for the export demand functions suggest that
the income effect is one of the main reasons for the
concentration of Bangladesh’s exports to some developed
countries, specifically in Europe and America.
Acknowledgements
This paper is based on Ph.D. research. The author is
indebted to Professor Jayati Ghosh for her valuable guidance
and suggestions. The earlier version of this paper was
presented in the CESP-CAS Young Scholars’ Conference
organized by Centre for Economic Studies and Planning,
Jawaharlal Nehru University from 26-28 March, 2017. The
author also acknowledges the suggestions and feedbacks of
the discussant and the participants of the conference.
References
[1] Aziz, N. & Horsewood, N. J. (2008). Determinants of Aggregate Import Demand of Bangladesh: Cointegration and Error Correction Modelling. In The 18th International Conference (May 21-24). International Trade and Finance Association, Lisbon, Portugal.
[2] Cochrane, D. & Orcutt, G. H. (1949). Application of Least Squares Regression to Relationships Containing Auto-Correlated Error Terms. Journal of the American Statistical Association, 44 (245), 32–61.
[3] Cowgill, M., Luebker, M. & Xia, C. (2015). Minimum Wages in the Global Garment Industry: Update for 2015. International Labour Organization.
[4] Dutta, D. & Ahmed, N. (1999). An aggregate import demand function for Bangladesh: A cointegration approach. Applied Economics, 31(4), 465–472.
[5] Engle, R. F. & Granger, C. W. J. (1987). Co-integration and Error Correction: Representation, Estimation, and Testing. Econometrica, 55(2), 251–276.
[6] Global Financial Integrity. (2017). Illicit Financial Flows to and from Developing Countries: 2005-2014.
[7] Goswami, G. G. & Sarker, M. M. I. (2010). Exchange Rate Sensitivity of Inpayments and Outpayments of Bangladesh: An Aggregate vs. Bilateral Approach. Bank Parikrama, XXXV, 38–59.
[8] Hossain, A. A. (2013). Trade Liberalization and Import-Demand Behavior in Bangladesh, 1974–2008. The Journal of Developing Areas, 47(2), 387–416.
[9] Houthakker, H. S. & Magee, S. P. (1969). Income and Price Elasticities in World Trade. The Review of Economics and Statistics, 51(2), 111–125.
[10] Hye, Q. M. A. & Mashkoor, M. (2010). Import Demand Function for Bangladesh: A Rolling Window Analysis. African Journal of Business Management, 4(10), 2150–2156.
[11] Islam, T. (2016). An Empirical Estimation of Export and Import Demand Functions Using Bilateral Trade Data: The Case of Bangladesh. Journal of Commerce & Management Thought, 7(3), 526–551.
[12] Johansen, S. (1988). Statistical Analysis of Cointegrating Vectors. Journal of Economic Dynamics and Control, 12, 231–254.
[13] Kabir, R. (1988). Estimating Import and Export Demand Function : The Case of Bangladesh. The Bangladesh Development Studies, 16(4), 115–127.
[14] Kreinin, M. E. (1967). Price Elasticities in the International Trade. The Review of Economics and Statistics, 57, 221–224.
[15] Murad, S. M. W. (2012). Bilateral Export and Import Demand Functions of Bangladesh: A Cointegration Approach. The Bangladesh Development Studies, XXXV(1), 43–60.
[16] Nur, M., Wijeweera, A. & Dollery, B. (2007). Estimation of the Export Demand Function using Bilateral Trade Data: The Case of Bangladesh. South Asia Economic Journal, 8(2), 249–264.
[17] Wijeweera, A., Nur, M. & Dollery, B. (2008). Bilateral Import Demand Elasticities the Case of Bangladesh. International Research Journal of Finance & Economics, (19), 114–125.
[18] Yule, G. U. (1926). Why do we Sometimes get Nonsense-Correlations between Time-Series ? --A Study in Sampling and the Nature of Time-Series. Journal of the Royal Statistical Society, 89(1), 1–63.