Embed Size (px)
Citation preview
Export 2030 – delivering fresh food fast The opportunity to double high value food exports from Far North Queensland
Final Report The growth of agricultural exports from FNQ through enhanced supply chains — May 2020
© 2020 KPMG, an Australian partnership and a member firm of the KPMG network of independent member firms affiliated with KPMG International Cooperative (“KPMG International”), a Swiss entity. All rights reserved. Printed in Australia. KPMG and the KPMG logo are registered trademarks of KPMG International. Liability limited by a scheme approved under Professional Standards Legislation.
The authors acknowledge the financial support of the Cooperative Research Centre for Developing Northern Australia and the support of its investment partners: the Western Australian, Northern Territory and Queensland Governments.
We also acknowledge the financial support and in-kind support of the project participants and peer-reviewers.
Principal partners: Advance Cairns, Cooperative Research Centre for Developing Northern Australia (CRCNA), Cairns International Airport Pty Ltd, Far North Queensland Ports Corporation (Ports North), Air Freight Handling Services Pty Ltd, Queensland Department of Agriculture and Fisheries (DAF QLD), James Cook University (JCU) and Far North Queensland Regional Organisation of Councils (FNQROC).
Stakeholder contributors: Department of State Development, Manufacturing, Industry and Planning (DSDMIP), Trade and Investment Queensland (TIQ), Austrade, Kleinhardt Business Consultants, Outsource Management, FNQ Growers and Qantas Freight.
Inherent limitations
This report has been prepared as outlined in the Executive Summary and Scope. The services provided in connection with this engagement comprise an advisory engagement, which is not subject to assurance or other standards issued by the Australian Auditing and Assurance Standards Board and, consequently no opinions or conclusions intended to convey assurance have been expressed.
KPMG does not make any representation or warranty as to the accuracy, completeness, reasonableness, or reliability of the information included (whether directly or by reference) in the report, statements, representations and documentation provided by Advance Cairns management and stakeholders consulted as part of the process, and/or the achievement or reasonableness of any plans, projections, forecasts, management targets, prospects or returns described (whether express or implied) in the report. There will usually be differences between forecast or projected and actual results, because events and circumstances frequently do not occur as expected or predicted, and those differences may be material. Additionally, KPMG does not make any confirmation or assessment of the commercial merits, technical feasibility or compliance with any applicable legislation or regulation of the Far North Queensland Agricultural Supply Chain Study.
KPMG have indicated within this report the sources of the information provided. We have not sought to independently verify those sources unless otherwise noted within the report.
KPMG is under no obligation in any circumstance to update this report, in either oral or written form, for events occurring after the report has been issued in final form.
The findings in this report have been formed on the above basis.
Third party reliance
This report is solely for the purpose set out in the Executive Summary and Scope for Advance Cairns’s information, and is not to be used for any other purpose or distributed to any other party without KPMG’s prior written consent.
This report has been prepared at the request of Advance Cairns in accordance with the terms of KPMG’s contract dated 7 August 2019. Other than our responsibility to Advance Cairns, neither KPMG nor any member or employee of KPMG undertakes responsibility arising in any way from reliance placed by a third party on this report. Any reliance placed is that party’s sole responsibility.
ISBN 978-1-922437-03-7
Far North Queensland Agricultural Supply Chain Study | 1
© 2020 KPMG, an Australian partnership and a member firm of the KPMG network of independent member firms affiliated with KPMG International Cooperative (“KPMG International”), a Swiss entity. All rights reserved. Printed in Australia. KPMG and the KPMG logo are registered trademarks of KPMG International. Liability limited by a scheme approved under Professional Standards Legislation.
Executive Summary
Far North Queensland Agricultural Supply Chain Study | 2
© 2020 KPMG, an Australian partnership and a member firm of the KPMG network of independent member firms affiliated with KPMG International Cooperative (“KPMG International”), a Swiss entity. All rights reserved. Printed in Australia. KPMG and the KPMG logo are registered trademarks of KPMG International. Liability limited by a scheme approved under Professional Standards Legislation.
Far North Queensland Agricultural Supply Chain Study | 3
© 2020 KPMG, an Australian partnership and a member firm of the KPMG network of independent member firms affiliated with KPMG International Cooperative (“KPMG International”), a Swiss entity. All rights reserved. Printed in Australia. KPMG and the KPMG logo are registered trademarks of KPMG International. Liability limited by a scheme approved under Professional Standards Legislation.
Far North Queensland (FNQ) is an abundant producer of high quality produce including a diverse horticultural industry, a world-recognised seafood and aquaculture industry and an array of boutique and niche products such as beef, dairy, coffee, and native foods. As a highly productive growing region, FNQ will only continue to grow its productive output and has the capacity to further unlock export opportunities for high value food exports from the region via Cairns International Airport.
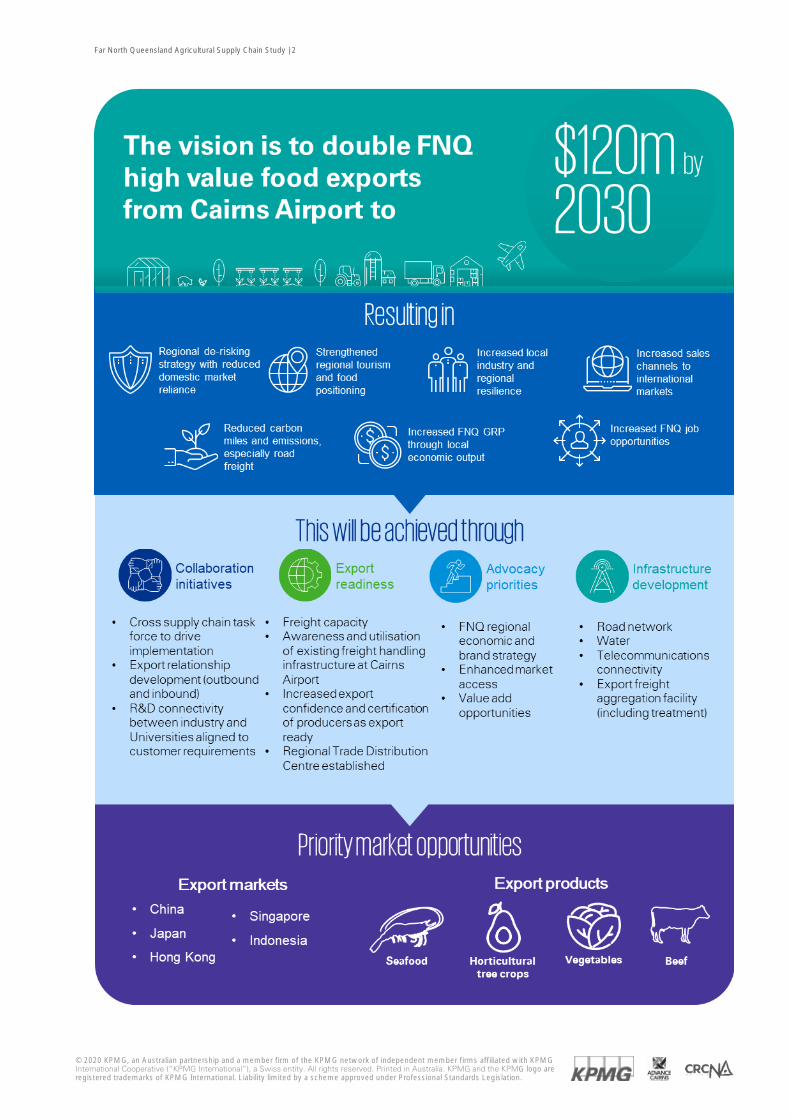
The vision for the region is to double high value food exports from Cairns International Airport by 2030, growing export values to $120 million.
The opportunity for Far North Queensland
The vision to double high value food exports is an ambitious, yet achievable, target for FNQ. The 2030 vision also aligns and contributes to the National Farmers’ Federation’s 2030 Roadmap to grow the value of Australian Agriculture to $100 billion. FNQ has a significant opportunity to achieve increased exports of high value produce to meet the growing demand of rapidly developing markets in Asia, while building the economic resilience of the region and assisting to de-risk the region’s reliance on domestic markets and Southern ports. With the continued growth and affluence of the Asian middle class, FNQ can supply high value food exports that meet the changing consumption preferences of these consumers.
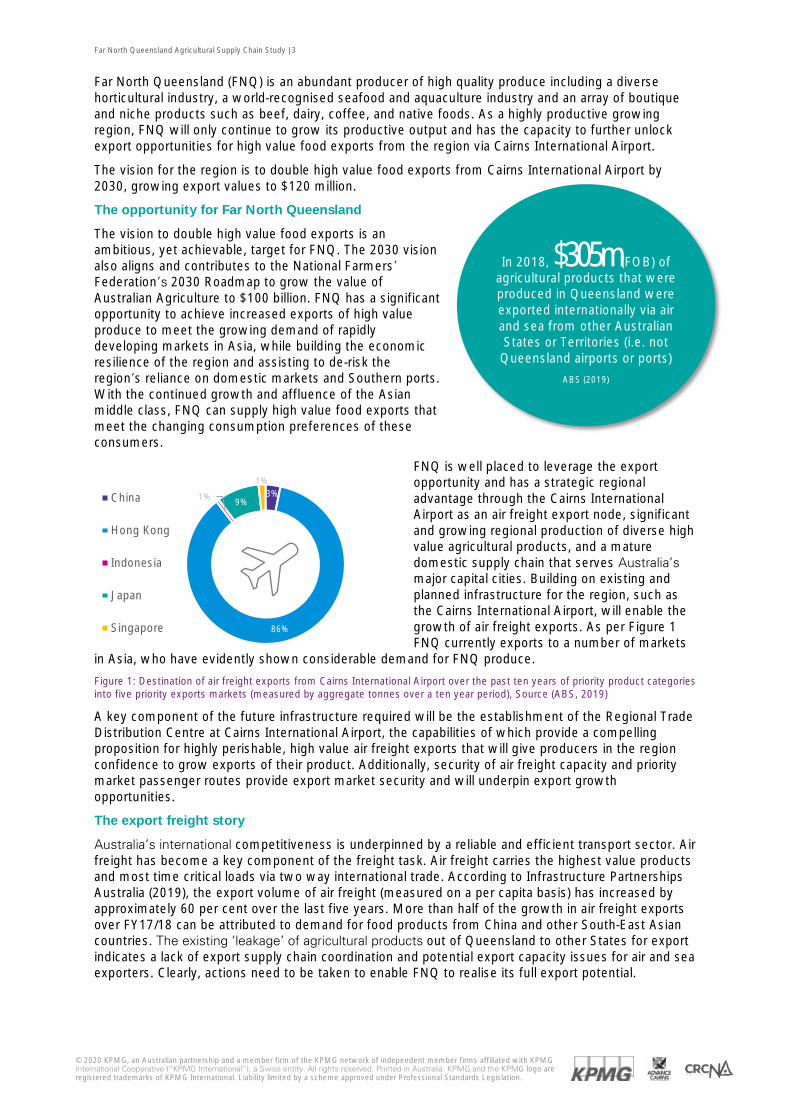
FNQ is well placed to leverage the export opportunity and has a strategic regional advantage through the Cairns International Airport as an air freight export node, significant and growing regional production of diverse high value agricultural products, and a mature domestic supply chain that serves Australia’s major capital cities. Building on existing and planned infrastructure for the region, such as the Cairns International Airport, will enable the growth of air freight exports. As per Figure 1 FNQ currently exports to a number of markets
in Asia, who have evidently shown considerable demand for FNQ produce.
Figure 1: Destination of air freight exports from Cairns International Airport over the past ten years of priority product categories into five priority exports markets (measured by aggregate tonnes over a ten year period), Source (ABS, 2019)
A key component of the future infrastructure required will be the establishment of the Regional Trade Distribution Centre at Cairns International Airport, the capabilities of which provide a compelling proposition for highly perishable, high value air freight exports that will give producers in the region confidence to grow exports of their product. Additionally, security of air freight capacity and priority market passenger routes provide export market security and will underpin export growth opportunities.
The export freight story
Australia’s international competitiveness is underpinned by a reliable and efficient transport sector. Air freight has become a key component of the freight task. Air freight carries the highest value products and most time critical loads via two way international trade. According to Infrastructure Partnerships Australia (2019), the export volume of air freight (measured on a per capita basis) has increased by approximately 60 per cent over the last five years. More than half of the growth in air freight exports over FY17/18 can be attributed to demand for food products from China and other South-East Asian countries. The existing ‘leakage’ of agricultural products out of Queensland to other States for export indicates a lack of export supply chain coordination and potential export capacity issues for air and sea exporters. Clearly, actions need to be taken to enable FNQ to realise its full export potential.
In 2018, $305m (FOB) of agricultural products that were produced in Queensland were exported internationally via air and sea from other Australian States or Territories (i.e. not Queensland airports or ports)
ABS (2019)
3%
86%
1% 9%
1%
China
Hong Kong
Indonesia
Japan
Singapore
Far North Queensland Agricultural Supply Chain Study | 4
© 2020 KPMG, an Australian partnership and a member firm of the KPMG network of independent member firms affiliated with KPMG International Cooperative (“KPMG International”), a Swiss entity. All rights reserved. Printed in Australia. KPMG and the KPMG logo are registered trademarks of KPMG International. Liability limited by a scheme approved under Professional Standards Legislation.
Priority export market opportunities
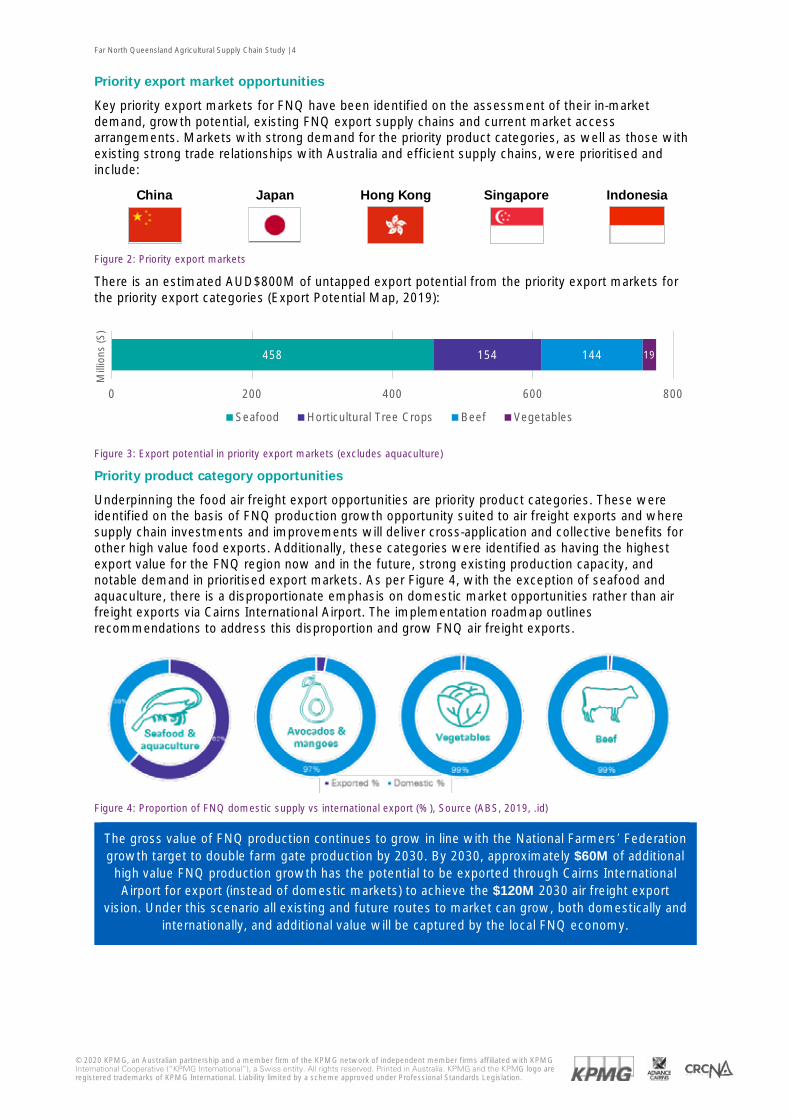
Key priority export markets for FNQ have been identified on the assessment of their in-market demand, growth potential, existing FNQ export supply chains and current market access arrangements. Markets with strong demand for the priority product categories, as well as those with existing strong trade relationships with Australia and efficient supply chains, were prioritised and include:
China Japan Hong Kong Singapore Indonesia
Figure 2: Priority export markets
There is an estimated AUD$800M of untapped export potential from the priority export markets for the priority export categories (Export Potential Map, 2019):
Priority product category opportunities
Underpinning the food air freight export opportunities are priority product categories. These were identified on the basis of FNQ production growth opportunity suited to air freight exports and where supply chain investments and improvements will deliver cross-application and collective benefits for other high value food exports. Additionally, these categories were identified as having the highest export value for the FNQ region now and in the future, strong existing production capacity, and notable demand in prioritised export markets. As per Figure 4, with the exception of seafood and aquaculture, there is a disproportionate emphasis on domestic market opportunities rather than air freight exports via Cairns International Airport. The implementation roadmap outlines recommendations to address this disproportion and grow FNQ air freight exports.
Figure 4: Proportion of FNQ domestic supply vs international export (%), Source (ABS, 2019, .id)
The gross value of FNQ production continues to grow in line with the National Farmers’ Federation growth target to double farm gate production by 2030. By 2030, approximately $60M of additional
high value FNQ production growth has the potential to be exported through Cairns International Airport for export (instead of domestic markets) to achieve the $120M 2030 air freight export
vision. Under this scenario all existing and future routes to market can grow, both domestically and internationally, and additional value will be captured by the local FNQ economy.
458 154 144 19
0 200 400 600 800
Mill
ions
(S)
Seafood Horticultural Tree Crops Beef Vegetables
Figure 3: Export potential in priority export markets (excludes aquaculture)
Far North Queensland Agricultural Supply Chain Study | 5
© 2020 KPMG, an Australian partnership and a member firm of the KPMG network of independent member firms affiliated with KPMG International Cooperative (“KPMG International”), a Swiss entity. All rights reserved. Printed in Australia. KPMG and the KPMG logo are registered trademarks of KPMG International. Liability limited by a scheme approved under Professional Standards Legislation.
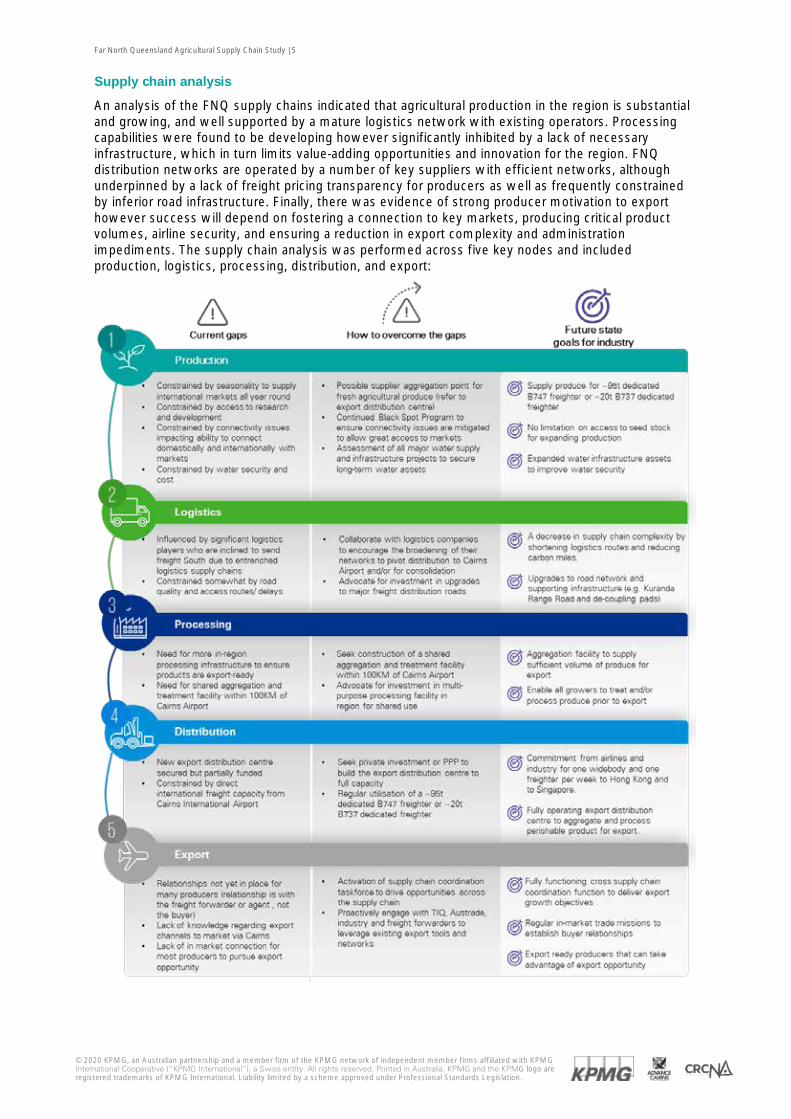
Supply chain analysis
An analysis of the FNQ supply chains indicated that agricultural production in the region is substantial and growing, and well supported by a mature logistics network with existing operators. Processing capabilities were found to be developing however significantly inhibited by a lack of necessary infrastructure, which in turn limits value-adding opportunities and innovation for the region. FNQ distribution networks are operated by a number of key suppliers with efficient networks, although underpinned by a lack of freight pricing transparency for producers as well as frequently constrained by inferior road infrastructure. Finally, there was evidence of strong producer motivation to export however success will depend on fostering a connection to key markets, producing critical product volumes, airline security, and ensuring a reduction in export complexity and administration impediments. The supply chain analysis was performed across five key nodes and included production, logistics, processing, distribution, and export:
Far North Queensland Agricultural Supply Chain Study | 6
© 2020 KPMG, an Australian partnership and a member firm of the KPMG network of independent member firms affiliated with KPMG International Cooperative (“KPMG International”), a Swiss entity. All rights reserved. Printed in Australia. KPMG and the KPMG logo are registered trademarks of KPMG International. Liability limited by a scheme approved under Professional Standards Legislation.
Recommendations
The global COVID-19 pandemic has resulted in significant detrimental economic impacts for the FNQ region with large scale cessation of passenger flights, freight exports and tourism. It remains to be seen the long term impact this may have however all recommendations should be viewed in the context of the 10 year longer term growth objective and the 2030 export target for the region.
Achieving $120M of air freight export value via Cairns International Airport by 2030 requires a committed and prioritised effort across the FNQ region. Core recommendations have been identified to underpin this effort and are supported by a clear implementation roadmap. There are three overarching priority enablers that are the key levers the FNQ region should progress to drive the export opportunity:
1 Secure airline agreements that provide both increased passenger numbers to enhance FNQ freight capacity and tourism out of Cairns International Airport. This should be considered through the options of both wide and narrow body aircraft, noting the continuing trend in aviation towards increased use of narrow body aircraft for long-haul passenger flights, with continued emphasis on the opportunity of a dedicated freighter aircraft.
2 Drive increased utilisation of existing and future Cairns International Airport export facilities infrastructure through enhanced awareness and collaboration.
3 Ensure key enabling infrastructure is secured, with priority given to water and improving connectivity that will underpin increased production potential in the region.
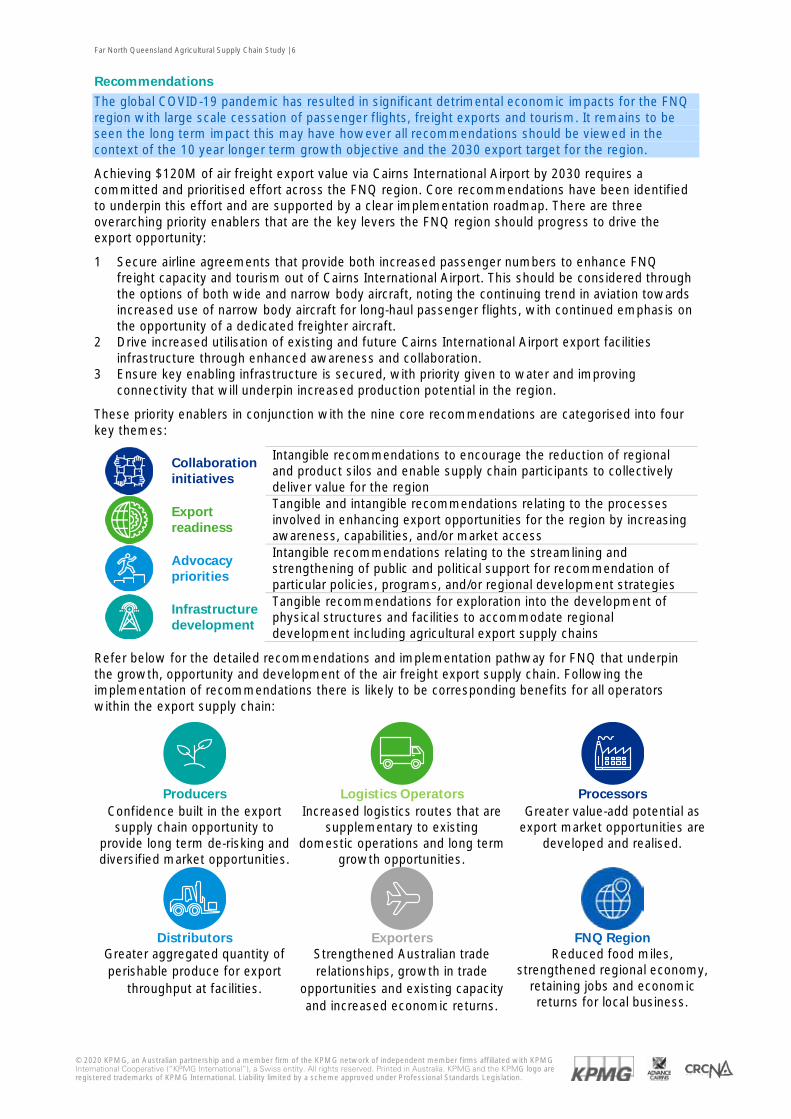
These priority enablers in conjunction with the nine core recommendations are categorised into four key themes:
Collaboration initiatives
Intangible recommendations to encourage the reduction of regional and product silos and enable supply chain participants to collectively deliver value for the region
Export readiness
Tangible and intangible recommendations relating to the processes involved in enhancing export opportunities for the region by increasing awareness, capabilities, and/or market access
Advocacy priorities
Intangible recommendations relating to the streamlining and strengthening of public and political support for recommendation of particular policies, programs, and/or regional development strategies
Infrastructure development
Tangible recommendations for exploration into the development of physical structures and facilities to accommodate regional development including agricultural export supply chains
Refer below for the detailed recommendations and implementation pathway for FNQ that underpin the growth, opportunity and development of the air freight export supply chain. Following the implementation of recommendations there is likely to be corresponding benefits for all operators within the export supply chain:
Producers
Logistics Operators
Processors
Confidence built in the export supply chain opportunity to
provide long term de-risking and diversified market opportunities.
Increased logistics routes that are supplementary to existing
domestic operations and long term growth opportunities.
Greater value-add potential as export market opportunities are
developed and realised.
Distributors
Exporters
FNQ Region
Greater aggregated quantity of perishable produce for export
throughput at facilities.
Strengthened Australian trade relationships, growth in trade
opportunities and existing capacity and increased economic returns.
Reduced food miles, strengthened regional economy,
retaining jobs and economic returns for local business.
Far North Queensland Agricultural Supply Chain Study | 7
© 2020 KPMG, an Australian partnership and a member firm of the KPMG network of independent member firms affiliated with KPMG International Cooperative (“KPMG International”), a Swiss entity. All rights reserved. Printed in Australia. KPMG and the KPMG logo are registered trademarks of KPMG International. Liability limited by a scheme approved under Professional Standards Legislation.
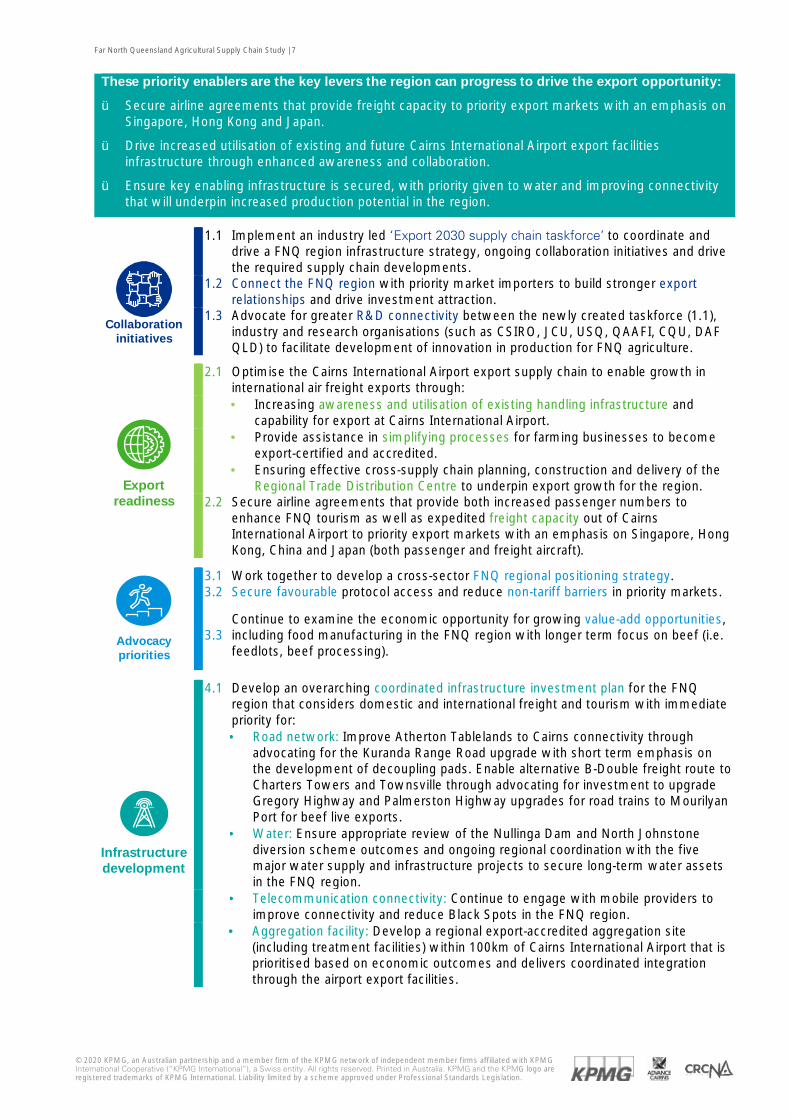
These priority enablers are the key levers the region can progress to drive the export opportunity:
ü Secure airline agreements that provide freight capacity to priority export markets with an emphasis on Singapore, Hong Kong and Japan.
ü Drive increased utilisation of existing and future Cairns International Airport export facilities infrastructure through enhanced awareness and collaboration.
ü Ensure key enabling infrastructure is secured, with priority given to water and improving connectivity that will underpin increased production potential in the region.
Collaboration
initiatives
1.1 Implement an industry led ‘Export 2030 supply chain taskforce’ to coordinate and drive a FNQ region infrastructure strategy, ongoing collaboration initiatives and drive the required supply chain developments.
1.2 Connect the FNQ region with priority market importers to build stronger export relationships and drive investment attraction.
1.3 Advocate for greater R&D connectivity between the newly created taskforce (1.1), industry and research organisations (such as CSIRO, JCU, USQ, QAAFI, CQU, DAF QLD) to facilitate development of innovation in production for FNQ agriculture.
Export readiness
2.1 Optimise the Cairns International Airport export supply chain to enable growth in international air freight exports through:
· Increasing awareness and utilisation of existing handling infrastructure and capability for export at Cairns International Airport.
· Provide assistance in simplifying processes for farming businesses to become export-certified and accredited.
· Ensuring effective cross-supply chain planning, construction and delivery of the Regional Trade Distribution Centre to underpin export growth for the region.
2.2 Secure airline agreements that provide both increased passenger numbers to enhance FNQ tourism as well as expedited freight capacity out of Cairns International Airport to priority export markets with an emphasis on Singapore, Hong Kong, China and Japan (both passenger and freight aircraft).
Advocacy priorities
3.1 Work together to develop a cross-sector FNQ regional positioning strategy. 3.2 Secure favourable protocol access and reduce non-tariff barriers in priority markets.
3.3 Continue to examine the economic opportunity for growing value-add opportunities, including food manufacturing in the FNQ region with longer term focus on beef (i.e. feedlots, beef processing).
Infrastructure development
4.1 Develop an overarching coordinated infrastructure investment plan for the FNQ region that considers domestic and international freight and tourism with immediate priority for:
· Road network: Improve Atherton Tablelands to Cairns connectivity through advocating for the Kuranda Range Road upgrade with short term emphasis on the development of decoupling pads. Enable alternative B-Double freight route to Charters Towers and Townsville through advocating for investment to upgrade Gregory Highway and Palmerston Highway upgrades for road trains to Mourilyan Port for beef live exports.
· Water: Ensure appropriate review of the Nullinga Dam and North Johnstone diversion scheme outcomes and ongoing regional coordination with the five major water supply and infrastructure projects to secure long-term water assets in the FNQ region.
· Telecommunication connectivity: Continue to engage with mobile providers to improve connectivity and reduce Black Spots in the FNQ region.
· Aggregation facility: Develop a regional export-accredited aggregation site (including treatment facilities) within 100km of Cairns International Airport that is prioritised based on economic outcomes and delivers coordinated integration through the airport export facilities.
Far North Queensland Agricultural Supply Chain Study | 8
© 2020 KPMG, an Australian partnership and a member firm of the KPMG network of independent member firms affiliated with KPMG International Cooperative (“KPMG International”), a Swiss entity. All rights reserved. Printed in Australia. KPMG and the KPMG logo are registered trademarks of KPMG International. Liability limited by a scheme approved under Professional Standards Legislation.
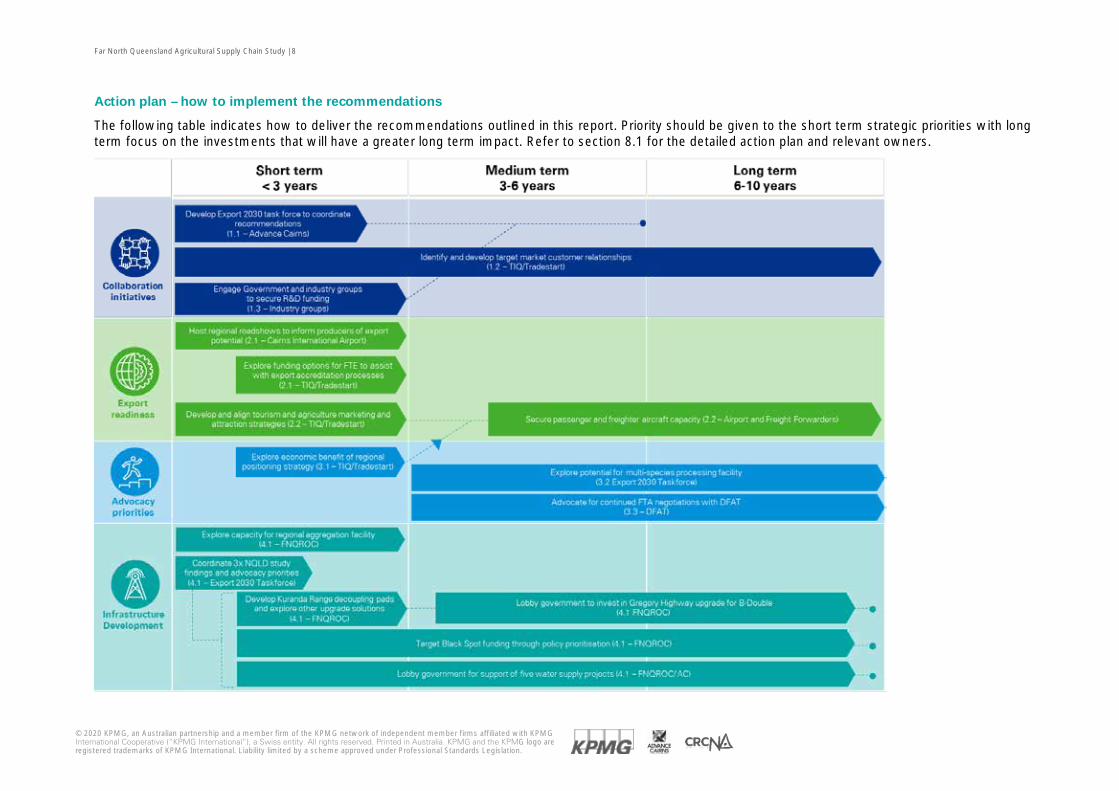
Action plan – how to implement the recommendations
The following table indicates how to deliver the recommendations outlined in this report. Priority should be given to the short term strategic priorities with long term focus on the investments that will have a greater long term impact. Refer to section 8.1 for the detailed action plan and relevant owners.
Far North Queensland Agricultural Supply Chain Study | 9
© 2020 KPMG, an Australian partnership and a member firm of the KPMG network of independent member firms affiliated with KPMG International Cooperative (“KPMG International”), a Swiss entity. All rights reserved. Printed in Australia. KPMG and the KPMG logo are registered trademarks of KPMG International. Liability limited by a scheme approved under Professional Standards Legislation.
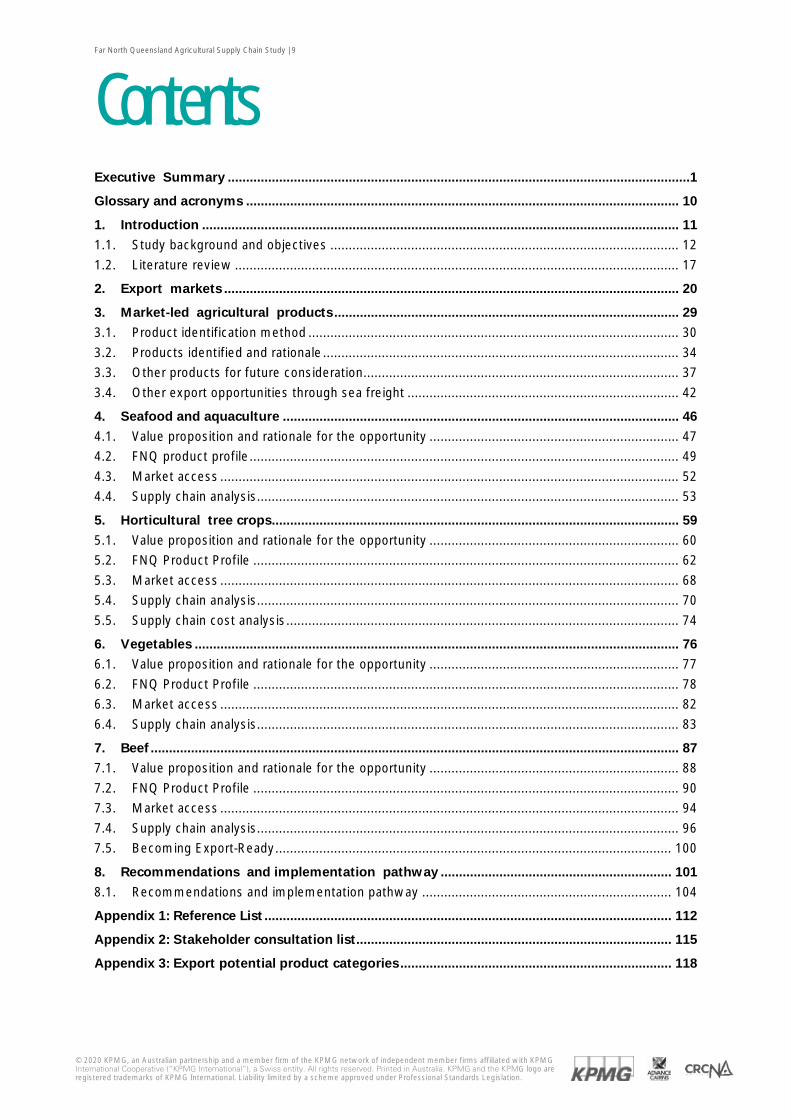
Contents Executive Summary ..............................................................................................................................1
Glossary and acronyms ...................................................................................................................... 10
1. Introduction .................................................................................................................................. 11 1.1. Study background and objectives ............................................................................................... 12 1.2. Literature review ......................................................................................................................... 17
2. Export markets ............................................................................................................................ 20
3. Market-led agricultural products .............................................................................................. 29 3.1. Product identification method ..................................................................................................... 30 3.2. Products identified and rationale ................................................................................................. 34 3.3. Other products for future consideration...................................................................................... 37 3.4. Other export opportunities through sea freight .......................................................................... 42
4. Seafood and aquaculture ............................................................................................................ 46 4.1. Value proposition and rationale for the opportunity .................................................................... 47 4.2. FNQ product profile ..................................................................................................................... 49 4.3. Market access ............................................................................................................................. 52 4.4. Supply chain analysis................................................................................................................... 53
5. Horticultural tree crops ............................................................................................................... 59 5.1. Value proposition and rationale for the opportunity .................................................................... 60 5.2. FNQ Product Profile .................................................................................................................... 62 5.3. Market access ............................................................................................................................. 68 5.4. Supply chain analysis................................................................................................................... 70 5.5. Supply chain cost analysis ........................................................................................................... 74
6. Vegetables .................................................................................................................................... 76 6.1. Value proposition and rationale for the opportunity .................................................................... 77 6.2. FNQ Product Profile .................................................................................................................... 78 6.3. Market access ............................................................................................................................. 82 6.4. Supply chain analysis................................................................................................................... 83
7. Beef ................................................................................................................................................ 87 7.1. Value proposition and rationale for the opportunity .................................................................... 88 7.2. FNQ Product Profile .................................................................................................................... 90 7.3. Market access ............................................................................................................................. 94 7.4. Supply chain analysis................................................................................................................... 96 7.5. Becoming Export-Ready ............................................................................................................ 100
8. Recommendations and implementation pathway ............................................................... 101 8.1. Recommendations and implementation pathway .................................................................... 104
Appendix 1: Reference List ............................................................................................................... 112
Appendix 2: Stakeholder consultation list ...................................................................................... 115
Appendix 3: Export potential product categories .......................................................................... 118
Far North Queensland Agricultural Supply Chain Study | 10
© 2020 KPMG, an Australian partnership and a member firm of the KPMG network of independent member firms affiliated with KPMG International Cooperative (“KPMG International”), a Swiss entity. All rights reserved. Printed in Australia. KPMG and the KPMG logo are registered trademarks of KPMG International. Liability limited by a scheme approved under Professional Standards Legislation.
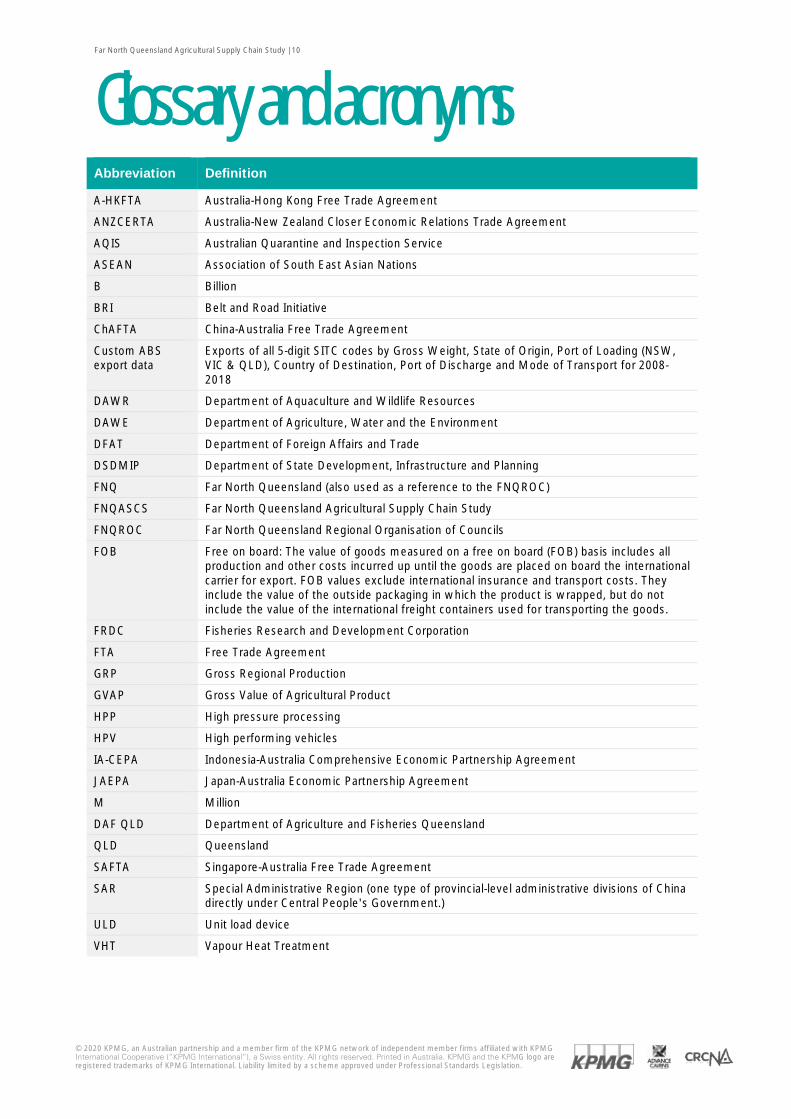
Glossary and acronyms Abbreviation Definition
A-HKFTA Australia-Hong Kong Free Trade Agreement
ANZCERTA Australia-New Zealand Closer Economic Relations Trade Agreement
AQIS Australian Quarantine and Inspection Service
ASEAN Association of South East Asian Nations
B Billion
BRI Belt and Road Initiative
ChAFTA China-Australia Free Trade Agreement
Custom ABS export data
Exports of all 5-digit SITC codes by Gross Weight, State of Origin, Port of Loading (NSW, VIC & QLD), Country of Destination, Port of Discharge and Mode of Transport for 2008-2018
DAWR Department of Aquaculture and Wildlife Resources
DAWE Department of Agriculture, Water and the Environment
DFAT Department of Foreign Affairs and Trade
DSDMIP Department of State Development, Infrastructure and Planning
FNQ Far North Queensland (also used as a reference to the FNQROC)
FNQASCS Far North Queensland Agricultural Supply Chain Study
FNQROC Far North Queensland Regional Organisation of Councils
FOB Free on board: The value of goods measured on a free on board (FOB) basis includes all production and other costs incurred up until the goods are placed on board the international carrier for export. FOB values exclude international insurance and transport costs. They include the value of the outside packaging in which the product is wrapped, but do not include the value of the international freight containers used for transporting the goods.
FRDC Fisheries Research and Development Corporation
FTA Free Trade Agreement
GRP Gross Regional Production
GVAP Gross Value of Agricultural Product
HPP High pressure processing
HPV High performing vehicles
IA-CEPA Indonesia-Australia Comprehensive Economic Partnership Agreement
JAEPA Japan-Australia Economic Partnership Agreement
M Million
DAF QLD Department of Agriculture and Fisheries Queensland
QLD Queensland
SAFTA Singapore-Australia Free Trade Agreement
SAR Special Administrative Region (one type of provincial-level administrative divisions of China directly under Central People's Government.)
ULD Unit load device
VHT Vapour Heat Treatment
Far North Queensland Agricultural Supply Chain Study | 11
© 2020 KPMG, an Australian partnership and a member firm of the KPMG network of independent member firms affiliated with KPMG International Cooperative (“KPMG International”), a Swiss entity. All rights reserved. Printed in Australia. KPMG and the KPMG logo are registered trademarks of KPMG International. Liability limited by a scheme approved under Professional Standards Legislation.
1. Introduction
Far North Queensland Agricultural Supply Chain Study | 12
© 2020 KPMG, an Australian partnership and a member firm of the KPMG network of independent member firms affiliated with KPMG International Cooperative (“KPMG International”), a Swiss entity. All rights reserved. Printed in Australia. KPMG and the KPMG logo are registered trademarks of KPMG International. Liability limited by a scheme approved under Professional Standards Legislation.
1.1. Study background and objectives 1.1.1. The export opportunity
There is a valuable opportunity for the agricultural producing regions of Far North Queensland to supply the growing demand of the rapidly developing priority international markets in Asia. As the trend of the burgeoning growth in the middle class populations (in the priority international markets in Asia) continues to draw the focus of the global economy, greater emphasis will be placed on the ease of access required to engage with this significant market. According to a recent study by Infrastructure Partnerships Australia (2019) the export volume of Australian air freight, measured on a per capita basis, has increased approximately 60 per cent over the last five years and more than half of the growth in air freight exports over FY17/18 can be attributed to demand for food products from China and other South-East Asian countries.
Across the priority international markets in Asian countries and the Middle East, there is a growing wealthy, middle class population that is increasing the consumer market’s demand for food, and in particular proteins, value-added products and fresh produce. Simultaneously these countries lack abundant arable land and inputs, processing capabilities and the ability to produce food at scale and as a result, consistently face an inability to meet food supply needs. Asia and the Middle East instead look to Australia as a source of food, with 63 per cent of the $40B food export value attributed directly to these markets (CSIRO, 2017).
Australia has an established reputation as a supplier of sustainable, clean and high quality produce and value-added products. Australia can deliver improved food security, particularly given that a number of these export countries have free trade agreements with Australia and do not yet have any established internal government policies to increase their own food self-sufficiency. Furthermore, Australia is a proximal market to South East Asia, ensuring that supply chains are shorter for time sensitive products; even more so for FNQ.
A major competitive advantage to be considered in expanding air freight exports out of Cairns is the resulting positive impact on the sustainability of the region. Shifting exports to be sent from Cairns will cause a significant reduction in carbon miles given that less freight will be trucked the approximate 1,700 kilometres south to Brisbane and then flown back over Cairns to international markets. This will substantially assist the preservation of sustainability in FNQ, which is highly critical given the region’s biodiversity and vast natural resources such as rainforests and the Great Barrier Reef.
The global COVID-19 pandemic has resulted in significant detrimental economic impacts for the FNQ region with large scale cessation of passenger flights, freight exports and tourism. It remains to be seen the long term impact this may have however all recommendations should be viewed in the context of the 10 year longer term growth objective and the 2030 export target for the region.
1.1.2. The Far North Queensland region
There will be significant benefits for FNQ producers and exporters to identify the high demand agricultural products from consumers in the priority export markets identified in this study. This will also ensure production and value-added processing are aligned to meet the preferences of this large market and ensure that products can be transported to their final destination in a timely and efficient manner.
In recent years there has been substantial growth and diversification in agricultural production across the FNQ region. The majority of this growth has focused on supplying domestic demand, however various agricultural products have strong export market potential – particularly in relation to air-based exports. The FNQ region has the agricultural capacity to respond to the valuable opportunity presented by the priority international markets in Asia and there is an opportunity for FNQ producers to export product directly to international markets more efficiently through improved supply chains.
In 2018 there was a total of $305M FOB (ABS, 2019) worth of agricultural products that were produced in Queensland and exported internationally via air and sea from other Australian States or Territories (i.e. not Queensland ports). This study seeks to understand why more of this agricultural product is not exported from FNQ (Cairns), analyse the drivers for this trend and provide strategic recommendations to improve the export supply chain from FNQ.
Far North Queensland Agricultural Supply Chain Study | 13
© 2020 KPMG, an Australian partnership and a member firm of the KPMG network of independent member firms affiliated with KPMG International Cooperative (“KPMG International”), a Swiss entity. All rights reserved. Printed in Australia. KPMG and the KPMG logo are registered trademarks of KPMG International. Liability limited by a scheme approved under Professional Standards Legislation.
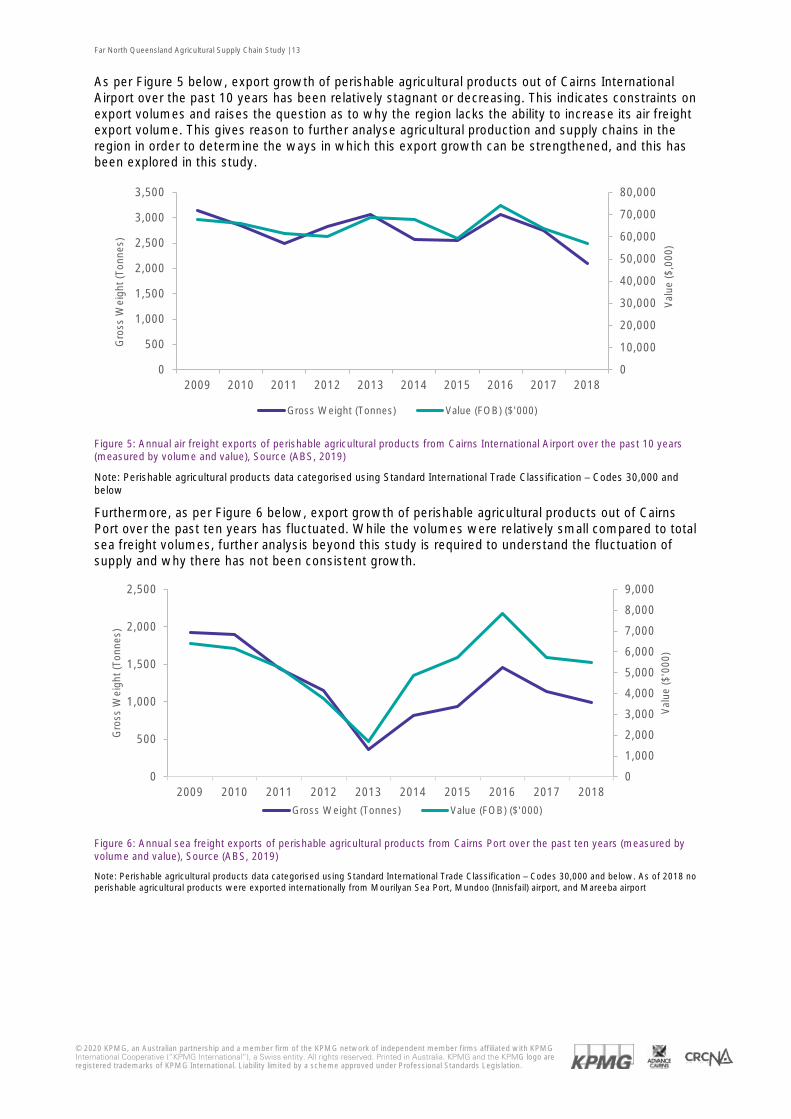
As per Figure 5 below, export growth of perishable agricultural products out of Cairns International Airport over the past 10 years has been relatively stagnant or decreasing. This indicates constraints on export volumes and raises the question as to why the region lacks the ability to increase its air freight export volume. This gives reason to further analyse agricultural production and supply chains in the region in order to determine the ways in which this export growth can be strengthened, and this has been explored in this study.
Figure 5: Annual air freight exports of perishable agricultural products from Cairns International Airport over the past 10 years (measured by volume and value), Source (ABS, 2019)
Note: Perishable agricultural products data categorised using Standard International Trade Classification – Codes 30,000 and below
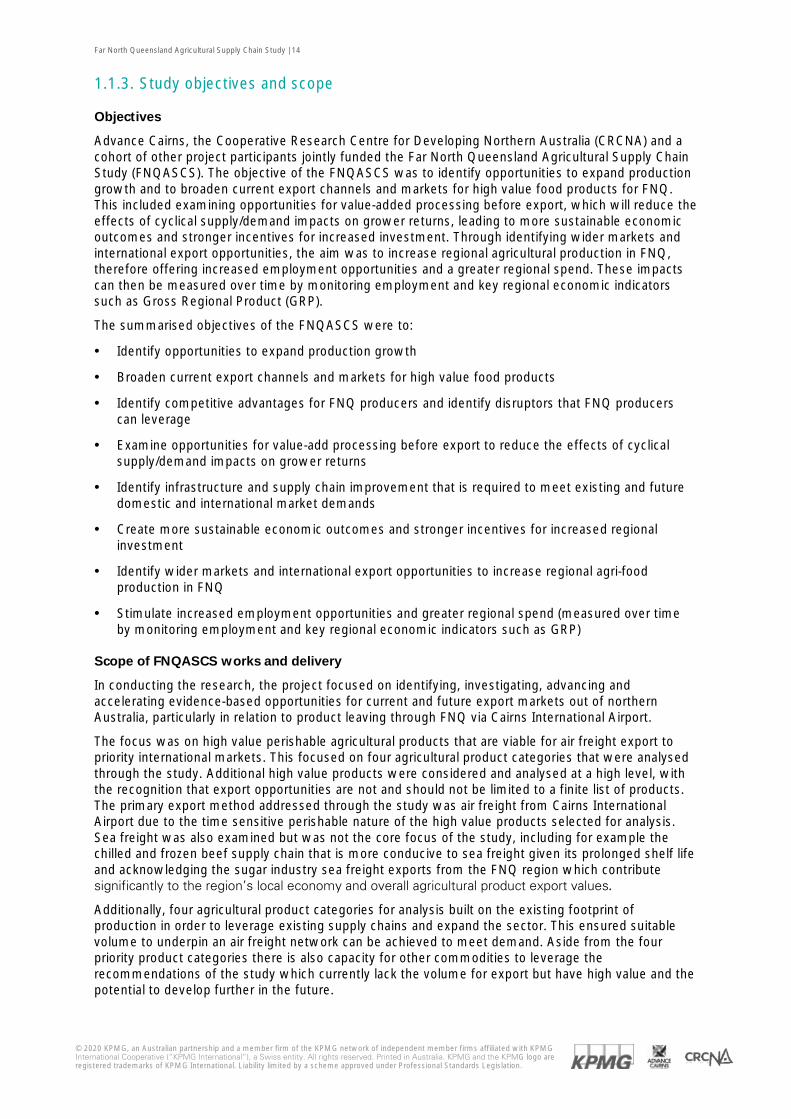
Furthermore, as per Figure 6 below, export growth of perishable agricultural products out of Cairns Port over the past ten years has fluctuated. While the volumes were relatively small compared to total sea freight volumes, further analysis beyond this study is required to understand the fluctuation of supply and why there has not been consistent growth.
Figure 6: Annual sea freight exports of perishable agricultural products from Cairns Port over the past ten years (measured by volume and value), Source (ABS, 2019)
Note: Perishable agricultural products data categorised using Standard International Trade Classification – Codes 30,000 and below. As of 2018 no perishable agricultural products were exported internationally from Mourilyan Sea Port, Mundoo (Innisfail) airport, and Mareeba airport
0
10,000
20,000
30,000
40,000
50,000
60,000
70,000
80,000
0
500
1,000
1,500
2,000
2,500
3,000
3,500
2009 2010 2011 2012 2013 2014 2015 2016 2017 2018
Val
ue ($
,000
)
Gro
ss W
eigh
t (To
nnes
)
Gross Weight (Tonnes) Value (FOB) ($'000)
0
1,000
2,000
3,000
4,000
5,000
6,000
7,000
8,000
9,000
0
500
1,000
1,500
2,000
2,500
2009 2010 2011 2012 2013 2014 2015 2016 2017 2018
Val
ue ($
'000
)
Gro
ss W
eigh
t (To
nnes
)
Gross Weight (Tonnes) Value (FOB) ($'000)
Far North Queensland Agricultural Supply Chain Study | 14
© 2020 KPMG, an Australian partnership and a member firm of the KPMG network of independent member firms affiliated with KPMG International Cooperative (“KPMG International”), a Swiss entity. All rights reserved. Printed in Australia. KPMG and the KPMG logo are registered trademarks of KPMG International. Liability limited by a scheme approved under Professional Standards Legislation.
1.1.3. Study objectives and scope
Objectives
Advance Cairns, the Cooperative Research Centre for Developing Northern Australia (CRCNA) and a cohort of other project participants jointly funded the Far North Queensland Agricultural Supply Chain Study (FNQASCS). The objective of the FNQASCS was to identify opportunities to expand production growth and to broaden current export channels and markets for high value food products for FNQ. This included examining opportunities for value-added processing before export, which will reduce the effects of cyclical supply/demand impacts on grower returns, leading to more sustainable economic outcomes and stronger incentives for increased investment. Through identifying wider markets and international export opportunities, the aim was to increase regional agricultural production in FNQ, therefore offering increased employment opportunities and a greater regional spend. These impacts can then be measured over time by monitoring employment and key regional economic indicators such as Gross Regional Product (GRP).
The summarised objectives of the FNQASCS were to:
· Identify opportunities to expand production growth
· Broaden current export channels and markets for high value food products
· Identify competitive advantages for FNQ producers and identify disruptors that FNQ producers can leverage
· Examine opportunities for value-add processing before export to reduce the effects of cyclical supply/demand impacts on grower returns
· Identify infrastructure and supply chain improvement that is required to meet existing and future domestic and international market demands
· Create more sustainable economic outcomes and stronger incentives for increased regional investment
· Identify wider markets and international export opportunities to increase regional agri-food production in FNQ
· Stimulate increased employment opportunities and greater regional spend (measured over time by monitoring employment and key regional economic indicators such as GRP)
Scope of FNQASCS works and delivery
In conducting the research, the project focused on identifying, investigating, advancing and accelerating evidence-based opportunities for current and future export markets out of northern Australia, particularly in relation to product leaving through FNQ via Cairns International Airport.
The focus was on high value perishable agricultural products that are viable for air freight export to priority international markets. This focused on four agricultural product categories that were analysed through the study. Additional high value products were considered and analysed at a high level, with the recognition that export opportunities are not and should not be limited to a finite list of products. The primary export method addressed through the study was air freight from Cairns International Airport due to the time sensitive perishable nature of the high value products selected for analysis. Sea freight was also examined but was not the core focus of the study, including for example the chilled and frozen beef supply chain that is more conducive to sea freight given its prolonged shelf life and acknowledging the sugar industry sea freight exports from the FNQ region which contribute significantly to the region’s local economy and overall agricultural product export values.
Additionally, four agricultural product categories for analysis built on the existing footprint of production in order to leverage existing supply chains and expand the sector. This ensured suitable volume to underpin an air freight network can be achieved to meet demand. Aside from the four priority product categories there is also capacity for other commodities to leverage the recommendations of the study which currently lack the volume for export but have high value and the potential to develop further in the future.
Far North Queensland Agricultural Supply Chain Study | 15
© 2020 KPMG, an Australian partnership and a member firm of the KPMG network of independent member firms affiliated with KPMG International Cooperative (“KPMG International”), a Swiss entity. All rights reserved. Printed in Australia. KPMG and the KPMG logo are registered trademarks of KPMG International. Liability limited by a scheme approved under Professional Standards Legislation.
The core deliverable of this study will be a roadmap for the region with actionable milestones that prioritise the infrastructure and supply chain improvement opportunities identified. The roadmap will inform the region on how best to meet the existing and future domestic and international market demands uncovered through the study. The findings will also be used for advocacy, both domestically to prioritise funding and investment priorities and internationally to clearly articulate the agricultural export opportunity.
KPMG was pleased to support Advance Cairns, the CRCNA and project participants in delivering this study to enable future growth and development of the region’s export supply chains.
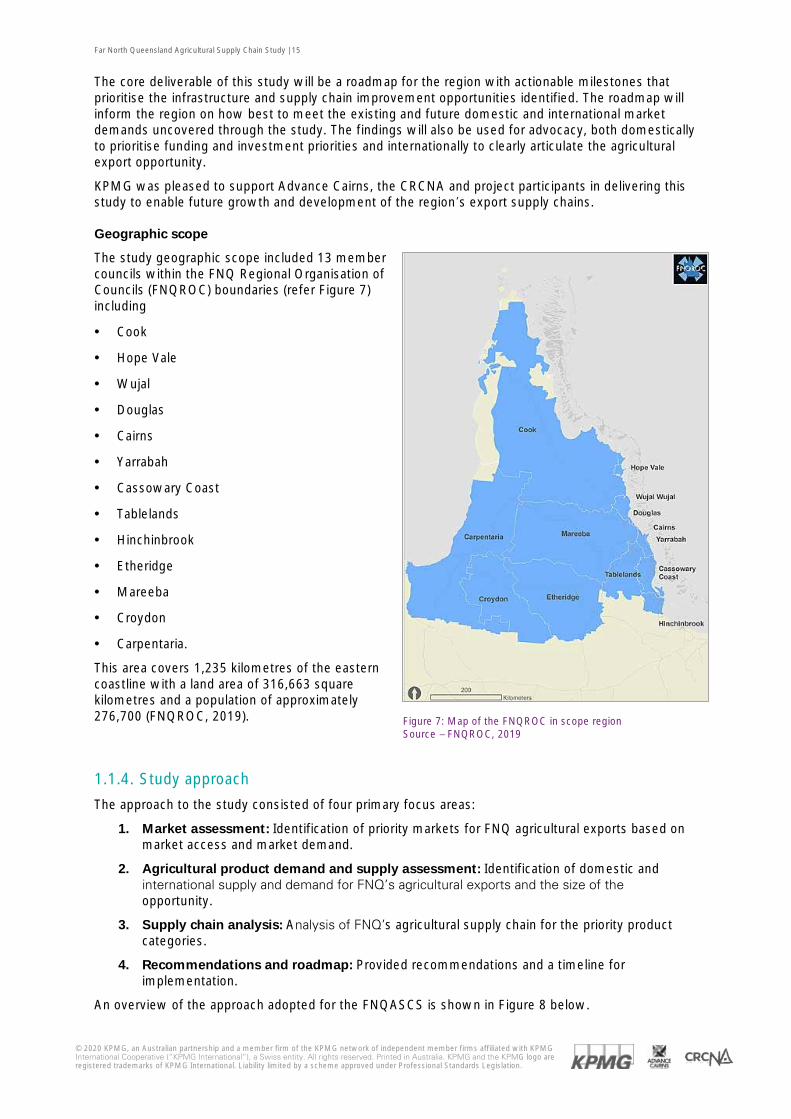
Geographic scope
The study geographic scope included 13 member councils within the FNQ Regional Organisation of Councils (FNQROC) boundaries (refer Figure 7) including
· Cook
· Hope Vale
· Wujal
· Douglas
· Cairns
· Yarrabah
· Cassowary Coast
· Tablelands
· Hinchinbrook
· Etheridge
· Mareeba
· Croydon
· Carpentaria.
This area covers 1,235 kilometres of the eastern coastline with a land area of 316,663 square kilometres and a population of approximately 276,700 (FNQROC, 2019).
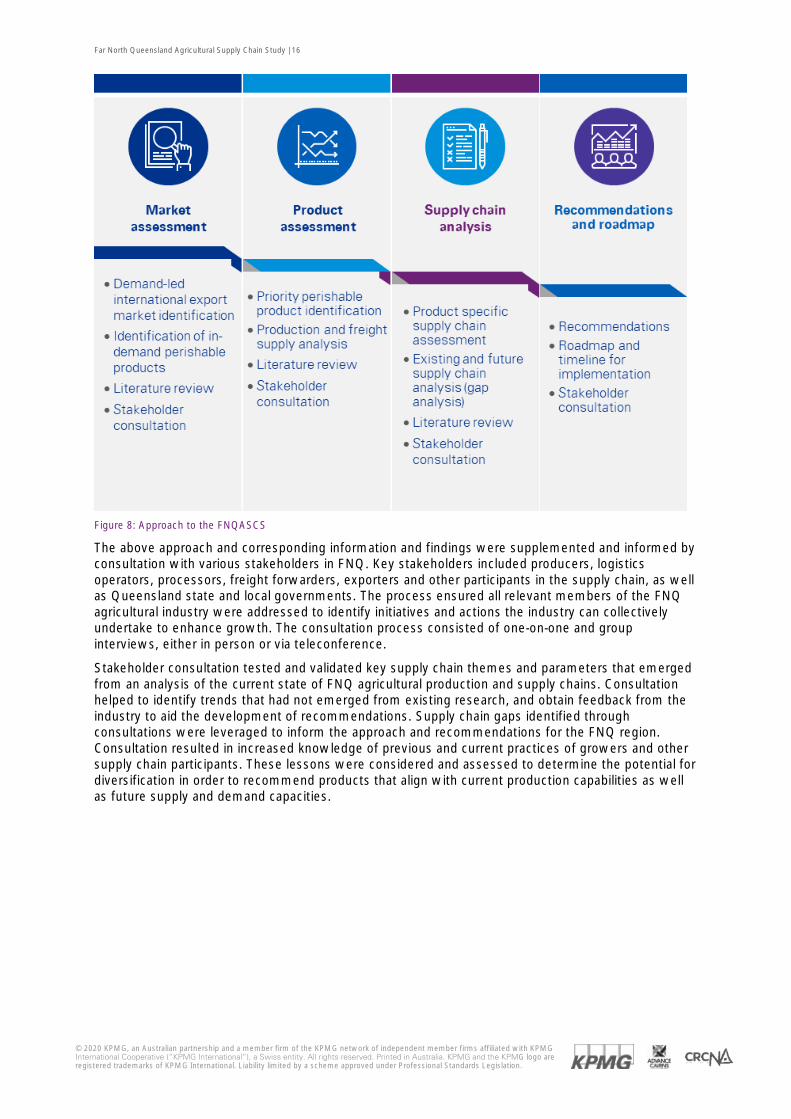
1.1.4. Study approach
The approach to the study consisted of four primary focus areas:
1. Market assessment: Identification of priority markets for FNQ agricultural exports based on market access and market demand.
2. Agricultural product demand and supply assessment: Identification of domestic and international supply and demand for FNQ’s agricultural exports and the size of the opportunity.
3. Supply chain analysis: Analysis of FNQ’s agricultural supply chain for the priority product categories.
4. Recommendations and roadmap: Provided recommendations and a timeline for implementation.
An overview of the approach adopted for the FNQASCS is shown in Figure 8 below.
Figure 7: Map of the FNQROC in scope region Source – FNQROC, 2019
Far North Queensland Agricultural Supply Chain Study | 16
© 2020 KPMG, an Australian partnership and a member firm of the KPMG network of independent member firms affiliated with KPMG International Cooperative (“KPMG International”), a Swiss entity. All rights reserved. Printed in Australia. KPMG and the KPMG logo are registered trademarks of KPMG International. Liability limited by a scheme approved under Professional Standards Legislation.
Figure 8: Approach to the FNQASCS
The above approach and corresponding information and findings were supplemented and informed by consultation with various stakeholders in FNQ. Key stakeholders included producers, logistics operators, processors, freight forwarders, exporters and other participants in the supply chain, as well as Queensland state and local governments. The process ensured all relevant members of the FNQ agricultural industry were addressed to identify initiatives and actions the industry can collectively undertake to enhance growth. The consultation process consisted of one-on-one and group interviews, either in person or via teleconference.
Stakeholder consultation tested and validated key supply chain themes and parameters that emerged from an analysis of the current state of FNQ agricultural production and supply chains. Consultation helped to identify trends that had not emerged from existing research, and obtain feedback from the industry to aid the development of recommendations. Supply chain gaps identified through consultations were leveraged to inform the approach and recommendations for the FNQ region. Consultation resulted in increased knowledge of previous and current practices of growers and other supply chain participants. These lessons were considered and assessed to determine the potential for diversification in order to recommend products that align with current production capabilities as well as future supply and demand capacities.
Far North Queensland Agricultural Supply Chain Study | 17
© 2020 KPMG, an Australian partnership and a member firm of the KPMG network of independent member firms affiliated with KPMG International Cooperative (“KPMG International”), a Swiss entity. All rights reserved. Printed in Australia. KPMG and the KPMG logo are registered trademarks of KPMG International. Liability limited by a scheme approved under Professional Standards Legislation.
1.2. Literature review
Literature review approach
The purpose of the literature review was to examine relevant available literature from the FNQ study region to inform and determine the current supply chain and export related activities in the region, including recent investments. Stakeholders were aware of significant existing baseline work and did not want to duplicate this effort. As such, the review analysed documents prescribed by the Advance Cairns Project Steering Committee as well as additional publicly available documents which served to widen the scope of knowledge retained. Documents reviewed were defined geographically by the FNQ in scope region and its current and past agricultural production, supply chain infrastructure for both air and sea freight, economic and other regional development. The literature review aimed to provide baseline data for:
· Local production of food and fibre and key trends
· The local supply chain, infrastructure and its inter-connectivity with state, national and international networks
· International market demand and its relevance to FNQ production trends based on the selected product categories
· Other relevant studies in the region and innovation in relation to the food supply chain
Documents were broadly analysed against five assessment criteria corresponding to the objectives of the study:
· Current production
· Potential for high value export markets
· Potential for high value and/or value-added agricultural production
· Bottlenecks in the supply chain (tangible and intangible)
· Emerging trends in supply chain logistics (AgTech, boutique etc.)
The result of this literature review informed strategic recommendations for the region regarding knowledge gaps that need to be filled (outlined in below-bottlenecks), and export markets and product opportunities to be pursued. Literature will be referenced throughout the study and used to support recommendations to ensure compatibility with other external concurrent research projects.
Literature review summary of key findings
The literature review confirmed that existing research is informative and aligned to the majority of the criteria assessed. Documents highlighted the significant opportunities for expansion of production into high value fresh products such as horticultural tree crops, the pursuit of growing export markets, and the feasibility of increased air freight for the region pending supply chain and infrastructure developments. The key themes acknowledged across the documents reviewed have been categorised below and were used to inform the approach to the study and recommendations for the region, also taking into account the gaps recognised in existing production and supply chain.
Current production
As per Advance Cairns’s AgTNQ Sector Update 2018, agricultural production in FNQ is strong with detailed analysis of ABS statistics for the 2015-16 season showing the gross value of agriculture in FNQ as $1.69B (Advance Cairns, 2018). Furthermore, the value of agricultural production in the FNQ catchment area in 2018 for freight specifically was cited to be around $3.5B (Air Freight Handling Services, 2019). For context, the most recent FNQROC figures (2018) cited a population of the FNQ region at just over 278,000, a land area of nearly 317,000 square kilometres and a population density of 0.01 persons per hectare (FNQROC, 2018). The Wet Tropics were cited as having the largest production value of irrigated produce at 52 percent of total gross value (of the three NRM regions comprising FNQ), predominantly being fruit and nuts (Advance Cairns, 2018). These types of insights informed the FNQASCS product recommendations, such as horticultural tree crops, by demonstrating
Far North Queensland Agricultural Supply Chain Study | 18
© 2020 KPMG, an Australian partnership and a member firm of the KPMG network of independent member firms affiliated with KPMG International Cooperative (“KPMG International”), a Swiss entity. All rights reserved. Printed in Australia. KPMG and the KPMG logo are registered trademarks of KPMG International. Liability limited by a scheme approved under Professional Standards Legislation.
the production capacity in the region. Sub-regional production growth statistics also argued for investment in the region, with FNQROC’s Regional Roads Investment Strategy noting primary production growth for the Kuranda Range Road region estimated to be 2.6 percent per annum, with 2.7M hectares of active primary production land (FNQROC, 2019). The region’s most high value products currently produced were also reflected, as predominantly fruit (bananas, mangoes, avocados, and melons), nuts (macadamia), dairy, seafood and aquaculture, and beef (Advance Cairns, 2018).
For the FNQASCS these insights are relevant and attributed to the study’s focus on enhancing agricultural production and supply chains for export growth. It was noted that more work is required to understand the risk to production in the context of weather adversities. Overall current production insights highlighted the region’s capacity for growth and enhanced agricultural supply chains, which will be best achieved through value-added exports of products such as horticultural tree crops.
Potential for high value export markets
The literature review validated the initial objective of the FNQASCS to leverage the opportunity potential of increasing levels of demand in the priority international markets in Asia. The North Queensland Agricultural Markets Supply Chain Study (NQAMSCS), for example, discussed the value in exporting to Asian markets given rising income levels and a growing middle class, increasing demand for premium goods, and most importantly the competitive advantage of geographic proximity to Asian markets for time sensitive products (TEL et al., 2019). The value of air freight was commonly discussed given its ability to deliver value-added fresh food exports efficiently. The AgTNQ Sector Update 2018 presented the opportunity in increasing air freight exports to Singapore in particular, given demand for premium products, existing flight routes from Cairns International Airport and Singapore’s capacity as a re-export hub to other markets in the region (Advance Cairns, 2018). This report argued that securing a daily run of international flights to Singapore with tightly packed wide-bodied aircrafts would result in $100M worth of jobs for the local economy. Other value-added fresh food opportunities were also mentioned for instance sending mangoes that had undergone Vapour Heat Treatment (VHT) to Japan (Advance Cairns, 2018). This opportunity indicates that the availability of VHT infrastructure in the FNQ region should be explored.
These findings helped inform FNQASCS recommendations for priority markets, highlighting the attractiveness of exports to the priority international markets in Asia and leveraging existing trade pathways. Insights on individual countries were particularly useful in framing the rationale for each target market considered in the study. There is an apparent margin for further research into the logistics required to reach each market specifically with optimal efficiency, and the supply chain challenges once products arrive in the overseas market.
Potential for high value and/or value-added agricultural production
Opportunities for high value or value-added agricultural production were evident in several reports analysed throughout the literature review. For example the AgTNQ Sector Update 2018 discussed the potential to expand the region’s existing strengths in producing niche, value-adding processors such as coffee, chocolate, wine and spirits, nuts, dried fruits, and banana flour (Advance Cairns, 2018). There were also recommendations identified to diversify the area’s current agricultural production by implementing crop rotation (soybeans) to reduce dependence on sugarcane and other suggested potential products such as macadamia, beef, and avocado (TEL et al., 2019). Overall the literature review reiterated that given agricultural production expansion in the region, there is the need to uplift industry capabilities through greater expansion into value-added production to ensure competitiveness on a global scale and sustained agricultural growth. These insights fuelled the arguments for continuing to diversify agricultural production to meet international market demand and strengthening a number of high-potential industries discussed in the FNQASCS.
Bottlenecks in the supply chain (tangible and intangible)
One supply chain bottleneck identified in the review surrounded the Kuranda Range Road, which was reflected in some literature as an occasional barrier to the movement of goods and people via larger freight vehicles in the region due to frequent closures (FNQROC, 2019). While the road does not prevent the movement of freight from the Tablelands to Cairns, its need for an upgrade is prevalent. Similarly, connectivity in the region was highlighted as a major supply chain constraint, with extensive mobile Black Spots impacting safety, welfare, and transport routes in the region (FNQROC, 2019). Other bottlenecks identified include a lack of critical mass to support the development of new
Far North Queensland Agricultural Supply Chain Study | 19
© 2020 KPMG, an Australian partnership and a member firm of the KPMG network of independent member firms affiliated with KPMG International Cooperative (“KPMG International”), a Swiss entity. All rights reserved. Printed in Australia. KPMG and the KPMG logo are registered trademarks of KPMG International. Liability limited by a scheme approved under Professional Standards Legislation.
agricultural sectors, infrastructure gaps such as storage and processing facilities, and geographically long and dispersed stages of the supply chain that lack scale and aggregation (Advance Cairns, 2018). Intangible potential threats to increased trade identified include open trade arrangements and competition, pests and diseases, and other competitive production areas in Australia and offshore (Advance Cairns, 2018).
Overall insights in this area of analysis provided important considerations to be aware of informing recommendations for target products and markets for the region. The review highlighted the challenges anticipated in strengthening supply chains both domestically and globally. The high priority of considering country-specific market constraints regarding free trade and protocol regulations when looking to expand exports was validated. It was also confirmed from this review that internal improvements to domestic infrastructure (e.g. processing facilities, road upgrades and expanded export terminals) must first be made to facilitate increased air exports from the region, in order to ensure the region has the capacity to regularly handle large volumes of agricultural goods with maximum efficiency. Further research in internal supply chain bottlenecks including production, logistics, processing, distribution and exports would be valuable.
Emerging trends in supply chain logistics (AgTech, boutique etc)
Emerging trends in supply chain logistics identified in the literature review included increasing demand for traceability in food products, with discussion of the implementation of Blockchain and other cargo tracking technologies in supply chains (Advance Cairns, 2018). For example, Queensland AgTrends 2018-19 discussed new requirements for United States of America beef imports to China to have whole-of-life traceability (Queensland Department of Agriculture and Fisheries, 2019).
NQAMSCS cited emerging use of farming system group structures that drive a collaborative effort in farming research and development including on-farm adoption and supply chain design (Townsville Enterprise, 2019). There was an overarching theme discussed regarding the trend in increasing application of technology to supply chains. A best practice future state for air freight logistics aspirations was depicted in “The Cargo Facility Of The Future” White Paper, including robotics and automated systems, use of augmented reality, wearables and IOT, Big Data and sustainable Net Zero Building (StB Cargo, 2017). These insights highlighted the fact that enhanced technology will be pivotal to strengthening supply chains for the FNQ region, especially as the demands of both consumer and regulatory bodies increase. Awareness of these future trends significantly informed the FNQASCS approach, given the long-term timeframe of recommendations.
Literature review key insights
Findings from this literature review informed strategic recommendations for the region regarding knowledge gaps that need to be filled through consultation (outlined in below-bottlenecks), and export markets and product opportunities to be pursued.
· Production: Production costs, water, environmental approvals and effect of weather events were common challenges
· Logistics: Time constraints and connectivity limitations were common challenges
· Processing: Availability of value-added processing, critical mass and location of processing facilities were common challenges
· Distribution: Road networks (e.g. Kuranda Range Road), product damage, transport costs and airline air freight capacity were common challenges
· Export: Protocols, market access and supply fluctuations were common challenges
The challenges identified through the literature review will be explored through analysis and stakeholder consultation.

Far North Queensland Agricultural Supply Chain Study | 20
© 2020 KPMG, an Australian partnership and a member firm of the KPMG network of independent member firms affiliated with KPMG International Cooperative (“KPMG International”), a Swiss entity. All rights reserved. Printed in Australia. KPMG and the KPMG logo are registered trademarks of KPMG International. Liability limited by a scheme approved under Professional Standards Legislation.
2. Export markets
Far North Queensland Agricultural Supply Chain Study | 21
© 2020 KPMG, an Australian partnership and a member firm of the KPMG network of independent member firms affiliated with KPMG International Cooperative (“KPMG International”), a Swiss entity. All rights reserved. Printed in Australia. KPMG and the KPMG logo are registered trademarks of KPMG International. Liability limited by a scheme approved under Professional Standards Legislation.
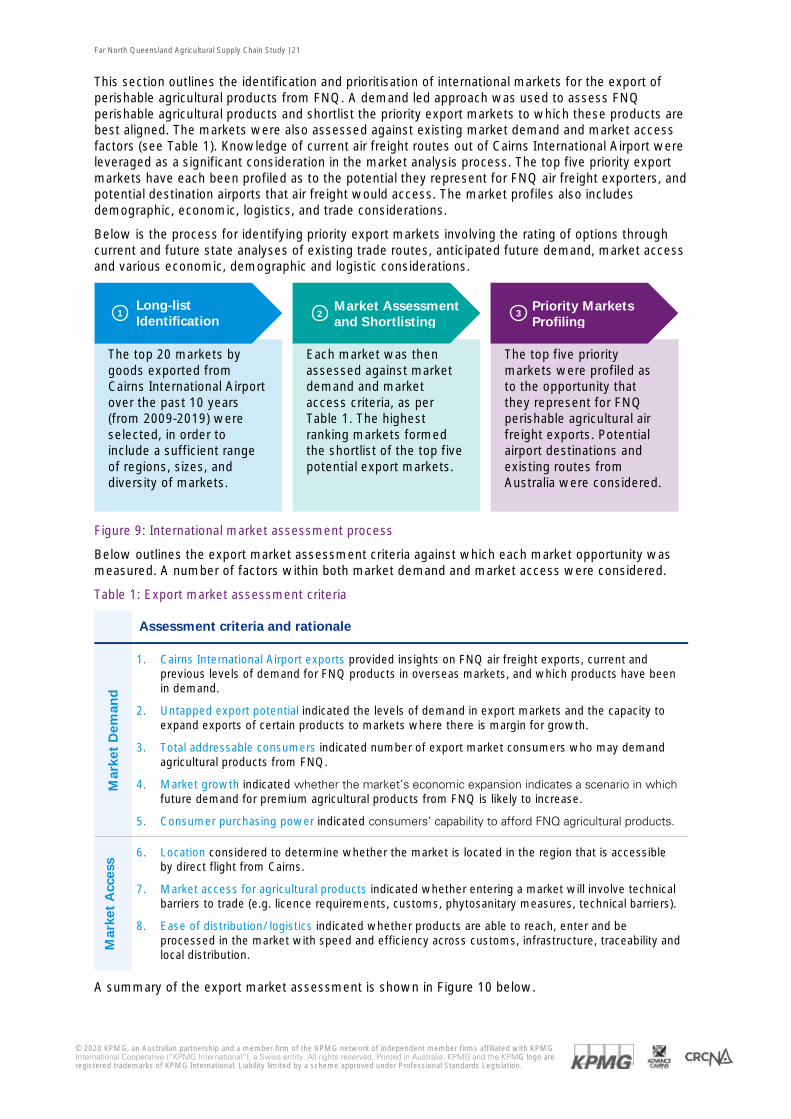
This section outlines the identification and prioritisation of international markets for the export of perishable agricultural products from FNQ. A demand led approach was used to assess FNQ perishable agricultural products and shortlist the priority export markets to which these products are best aligned. The markets were also assessed against existing market demand and market access factors (see Table 1). Knowledge of current air freight routes out of Cairns International Airport were leveraged as a significant consideration in the market analysis process. The top five priority export markets have each been profiled as to the potential they represent for FNQ air freight exporters, and potential destination airports that air freight would access. The market profiles also includes demographic, economic, logistics, and trade considerations.
Below is the process for identifying priority export markets involving the rating of options through current and future state analyses of existing trade routes, anticipated future demand, market access and various economic, demographic and logistic considerations.
Figure 9: International market assessment process
Below outlines the export market assessment criteria against which each market opportunity was measured. A number of factors within both market demand and market access were considered.
Table 1: Export market assessment criteria
Assessment criteria and rationale
Mar
ket
Dem
and
1. Cairns International Airport exports provided insights on FNQ air freight exports, current and previous levels of demand for FNQ products in overseas markets, and which products have been in demand.
2. Untapped export potential indicated the levels of demand in export markets and the capacity to expand exports of certain products to markets where there is margin for growth.
3. Total addressable consumers indicated number of export market consumers who may demand agricultural products from FNQ.
4. Market growth indicated whether the market’s economic expansion indicates a scenario in which future demand for premium agricultural products from FNQ is likely to increase.
5. Consumer purchasing power indicated consumers’ capability to afford FNQ agricultural products.
Mar
ket
Acc
ess
6. Location considered to determine whether the market is located in the region that is accessible by direct flight from Cairns.
7. Market access for agricultural products indicated whether entering a market will involve technical barriers to trade (e.g. licence requirements, customs, phytosanitary measures, technical barriers).
8. Ease of distribution/ logistics indicated whether products are able to reach, enter and be processed in the market with speed and efficiency across customs, infrastructure, traceability and local distribution.
A summary of the export market assessment is shown in Figure 10 below.
Long-list Identification
The top 20 markets by goods exported from Cairns International Airport over the past 10 years (from 2009-2019) were selected, in order to include a sufficient range of regions, sizes, and diversity of markets.
Market Assessment and Shortlisting
Each market was then assessed against market demand and market access criteria, as per Table 1. The highest ranking markets formed the shortlist of the top five potential export markets.
Priority Markets Profiling
The top five priority markets were profiled as to the opportunity that they represent for FNQ perishable agricultural air freight exports. Potential airport destinations and existing routes from Australia were considered.
1
2
3
Far North Queensland Agricultural Supply Chain Study | 22
© 2020 KPMG, an Australian partnership and a member firm of the KPMG network of independent member firms affiliated with KPMG International Cooperative (“KPMG International”), a Swiss entity. All rights reserved. Printed in Australia. KPMG and the KPMG logo are registered trademarks of KPMG International. Liability limited by a scheme approved under Professional Standards Legislation.
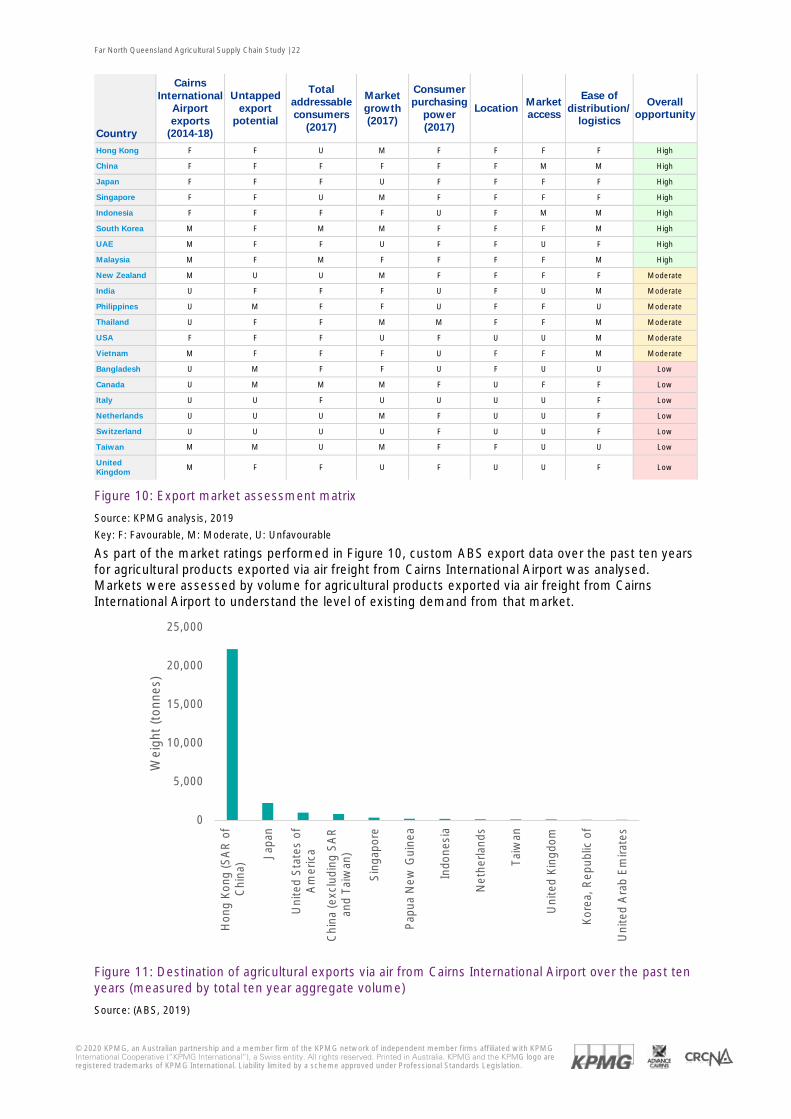
Figure 10: Export market assessment matrix
Source: KPMG analysis, 2019
Key: F: Favourable, M: Moderate, U: Unfavourable
As part of the market ratings performed in Figure 10, custom ABS export data over the past ten years for agricultural products exported via air freight from Cairns International Airport was analysed. Markets were assessed by volume for agricultural products exported via air freight from Cairns International Airport to understand the level of existing demand from that market.
Figure 11: Destination of agricultural exports via air from Cairns International Airport over the past ten years (measured by total ten year aggregate volume)
Source: (ABS, 2019)
0
5,000
10,000
15,000
20,000
25,000
Hon
g K
ong
(SA
R o
fC
hina
) Japa
n
Uni
ted
Sta
tes
ofA
mer
ica
Chi
na (e
xclu
ding
SA
Ran
d Ta
iwan
)
Sin
gapo
re
Pap
ua N
ew G
uine
a
Indo
nesi
a
Net
herla
nds
Taiw
an
Uni
ted
Kin
gdom
Kor
ea, R
epub
lic o
f
Uni
ted
Ara
b E
mira
tes
Wei
ght
(ton
nes)
Country
Cairns International
Airport exports
(2014-18)
Untapped export
potential
Total addressable consumers
(2017)
Market growth (2017)
Consumer purchasing
power (2017)
Location Market access
Ease of distribution/
logistics
Overall opportunity
Hong Kong F F U M F F F F High
China F F F F F F M M High
Japan F F F U F F F F High
Singapore F F U M F F F F High
Indonesia F F F F U F M M High
South Korea M F M M F F F M High
UAE M F F U F F U F High
Malaysia M F M F F F F M High
New Zealand M U U M F F F F Moderate
India U F F F U F U M Moderate
Philippines U M F F U F F U Moderate
Thailand U F F M M F F M Moderate
USA F F F U F U U M Moderate
Vietnam M F F F U F F M Moderate
Bangladesh U M F F U F U U Low
Canada U M M M F U F F Low
Italy U U F U U U U F Low
Netherlands U U U M F U U F Low
Switzerland U U U U F U U F Low
Taiwan M M U M F F U U Low
United Kingdom
M F F U F U U F Low
Far North Queensland Agricultural Supply Chain Study | 23
© 2020 KPMG, an Australian partnership and a member firm of the KPMG network of independent member firms affiliated with KPMG International Cooperative (“KPMG International”), a Swiss entity. All rights reserved. Printed in Australia. KPMG and the KPMG logo are registered trademarks of KPMG International. Liability limited by a scheme approved under Professional Standards Legislation.
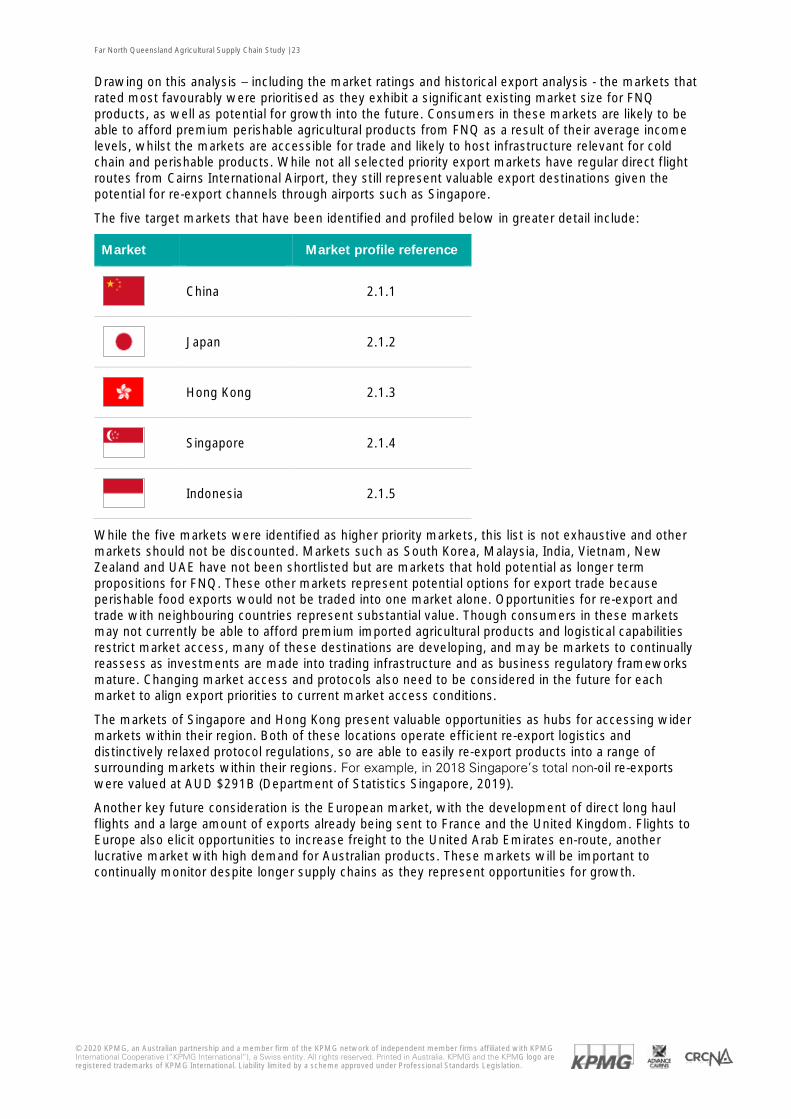
Drawing on this analysis – including the market ratings and historical export analysis - the markets that rated most favourably were prioritised as they exhibit a significant existing market size for FNQ products, as well as potential for growth into the future. Consumers in these markets are likely to be able to afford premium perishable agricultural products from FNQ as a result of their average income levels, whilst the markets are accessible for trade and likely to host infrastructure relevant for cold chain and perishable products. While not all selected priority export markets have regular direct flight routes from Cairns International Airport, they still represent valuable export destinations given the potential for re-export channels through airports such as Singapore.
The five target markets that have been identified and profiled below in greater detail include:
Market Market profile reference
China 2.1.1
Japan 2.1.2
Hong Kong 2.1.3
Singapore 2.1.4
Indonesia 2.1.5
While the five markets were identified as higher priority markets, this list is not exhaustive and other markets should not be discounted. Markets such as South Korea, Malaysia, India, Vietnam, New Zealand and UAE have not been shortlisted but are markets that hold potential as longer term propositions for FNQ. These other markets represent potential options for export trade because perishable food exports would not be traded into one market alone. Opportunities for re-export and trade with neighbouring countries represent substantial value. Though consumers in these markets may not currently be able to afford premium imported agricultural products and logistical capabilities restrict market access, many of these destinations are developing, and may be markets to continually reassess as investments are made into trading infrastructure and as business regulatory frameworks mature. Changing market access and protocols also need to be considered in the future for each market to align export priorities to current market access conditions.
The markets of Singapore and Hong Kong present valuable opportunities as hubs for accessing wider markets within their region. Both of these locations operate efficient re-export logistics and distinctively relaxed protocol regulations, so are able to easily re-export products into a range of surrounding markets within their regions. For example, in 2018 Singapore’s total non-oil re-exports were valued at AUD $291B (Department of Statistics Singapore, 2019).
Another key future consideration is the European market, with the development of direct long haul flights and a large amount of exports already being sent to France and the United Kingdom. Flights to Europe also elicit opportunities to increase freight to the United Arab Emirates en-route, another lucrative market with high demand for Australian products. These markets will be important to continually monitor despite longer supply chains as they represent opportunities for growth.
Far North Queensland Agricultural Supply Chain Study | 24
© 2020 KPMG, an Australian partnership and a member firm of the KPMG network of independent member firms affiliated with KPMG International Cooperative (“KPMG International”), a Swiss entity. All rights reserved. Printed in Australia. KPMG and the KPMG logo are registered trademarks of KPMG International. Liability limited by a scheme approved under Professional Standards Legislation.
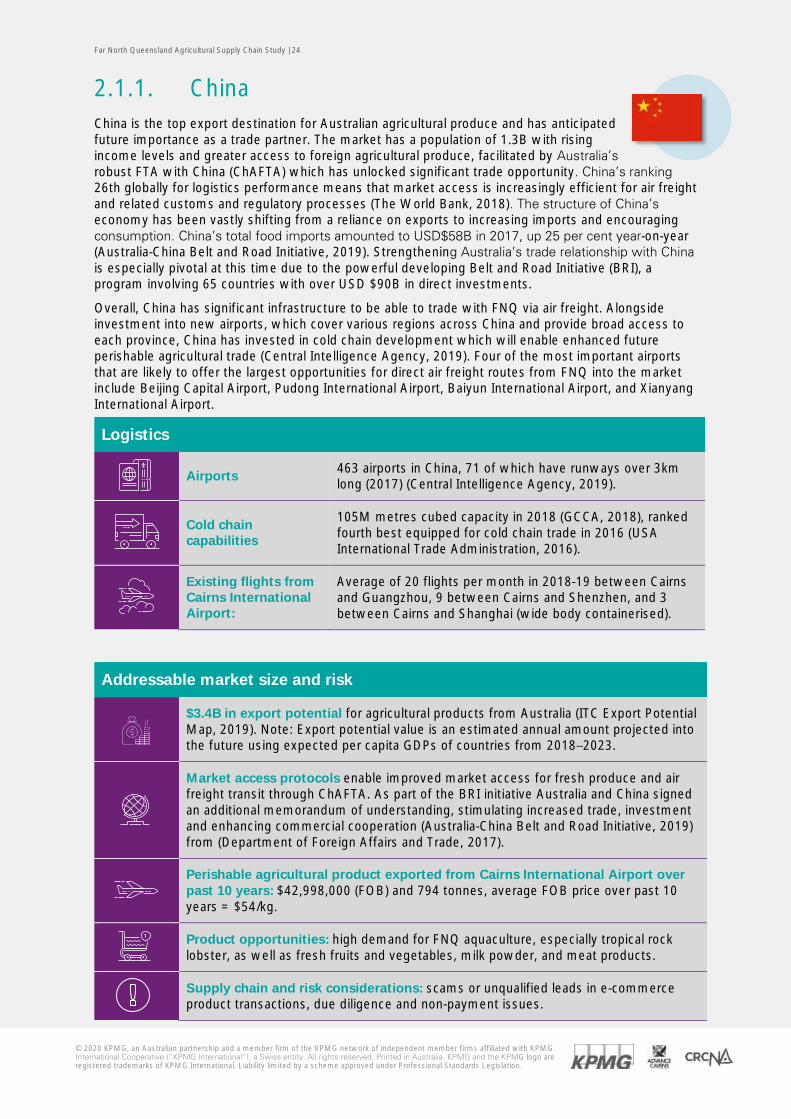
2.1.1. China China is the top export destination for Australian agricultural produce and has anticipated future importance as a trade partner. The market has a population of 1.3B with rising income levels and greater access to foreign agricultural produce, facilitated by Australia’s robust FTA with China (ChAFTA) which has unlocked significant trade opportunity. China’s ranking 26th globally for logistics performance means that market access is increasingly efficient for air freight and related customs and regulatory processes (The World Bank, 2018). The structure of China’s economy has been vastly shifting from a reliance on exports to increasing imports and encouraging consumption. China’s total food imports amounted to USD$58B in 2017, up 25 per cent year-on-year (Australia-China Belt and Road Initiative, 2019). Strengthening Australia’s trade relationship with China is especially pivotal at this time due to the powerful developing Belt and Road Initiative (BRI), a program involving 65 countries with over USD $90B in direct investments.
Overall, China has significant infrastructure to be able to trade with FNQ via air freight. Alongside investment into new airports, which cover various regions across China and provide broad access to each province, China has invested in cold chain development which will enable enhanced future perishable agricultural trade (Central Intelligence Agency, 2019). Four of the most important airports that are likely to offer the largest opportunities for direct air freight routes from FNQ into the market include Beijing Capital Airport, Pudong International Airport, Baiyun International Airport, and Xianyang International Airport.
Logistics
Airports 463 airports in China, 71 of which have runways over 3km long (2017) (Central Intelligence Agency, 2019).
Cold chain capabilities
105M metres cubed capacity in 2018 (GCCA, 2018), ranked fourth best equipped for cold chain trade in 2016 (USA International Trade Administration, 2016).
Existing flights from Cairns International Airport:
Average of 20 flights per month in 2018-19 between Cairns and Guangzhou, 9 between Cairns and Shenzhen, and 3 between Cairns and Shanghai (wide body containerised).
Addressable market size and risk
$3.4B in export potential for agricultural products from Australia (ITC Export Potential Map, 2019). Note: Export potential value is an estimated annual amount projected into the future using expected per capita GDPs of countries from 2018–2023.
Market access protocols enable improved market access for fresh produce and air freight transit through ChAFTA. As part of the BRI initiative Australia and China signed an additional memorandum of understanding, stimulating increased trade, investment and enhancing commercial cooperation (Australia-China Belt and Road Initiative, 2019) from (Department of Foreign Affairs and Trade, 2017).
Perishable agricultural product exported from Cairns International Airport over past 10 years: $42,998,000 (FOB) and 794 tonnes, average FOB price over past 10 years = $54/kg.
Product opportunities: high demand for FNQ aquaculture, especially tropical rock lobster, as well as fresh fruits and vegetables, milk powder, and meat products.
Supply chain and risk considerations: scams or unqualified leads in e-commerce product transactions, due diligence and non-payment issues.
Far North Queensland Agricultural Supply Chain Study | 25
© 2020 KPMG, an Australian partnership and a member firm of the KPMG network of independent member firms affiliated with KPMG International Cooperative (“KPMG International”), a Swiss entity. All rights reserved. Printed in Australia. KPMG and the KPMG logo are registered trademarks of KPMG International. Liability limited by a scheme approved under Professional Standards Legislation.
2.1.2. Japan Japan was selected as a result of its longstanding trading relationship with FNQ, with numerous existing trade routes and goods imported by Japan in recent years. The market’s large population of more than 126M commonly enjoy high average incomes compared to the global average, and are able to afford premium quality fresh produce. Though economic growth indicates a minor slowdown of the economy, the Japan-Australia FTA has created new trading relationships and there is potential for FNQ to further develop its exports to the nation. Japan is rated fifth in the world for international and domestic distribution capabilities, the highest ranking of all Asian countries and of the export markets identified in this report (The World Bank, 2018). This market access ensures smooth trade in goods via air freight, facilitating the maintenance of fresh product quality. Japan’s airports are also of a notably high standard. Alongside the six runways over 3km long, there are 45 that are between 2.4km and 3km in length and 25 registered airlines (as of 2017) (Central Intelligence Agency, 2019). Four airports classified as ‘Class 1’ by the Japanese Ministry of Land, Infrastructure and Transport are considered the main hubs for international air transport and thus represent the greatest opportunity for direct air freight from FNQ. These airports are Narita Capital Airport, Haneda International Airport, Chubu Centrair Airport, and Kansai Airport (includes Osaka).
Logistics
Airports 175 airports in Japan, six of which have runways over 3km long (2017) (Central Intelligence Agency, 2019).
Cold chain capabilities
38M metres cubed capacity in 2018 (GCCA, 2018) ranked eighth best equipped for cold chain trade in 2016 (USA International Trade Administration, 2016).
Existing flights from Cairns International Airport:
Average of 27 flights per month (wide body containerised) between Cairns and Tokyo in 2018-19, and 23 flights between Cairns and Osaka.
Addressable market size and risk
$2B export potential for agricultural products from Australia (ITC Export Potential Map, 2019). Note: Export potential value is an estimated annual amount projected into the future using expected per capita GDPs of countries from 2018–2023.
Market access protocols: Japan represents relatively stringent access regulations, for example implements seasonal tariffs on some fruits and vegetables.
Perishable agricultural product exported from Cairns International Airport over past 10 years: $20,560,000 and 2,224 tonnes, average FOB price over the past 10 years = $54/kg.
Product opportunities: high demand for FNQ fresh produce, especially mangoes, live seafood and aquaculture, as well as pre-prepared vegetables and fruit products (Austrade, 2015).
Supply chain and risk considerations: strong competition from US, strict treatment protocols for fresh produce, high cost of Japanese inspection and other regulations.
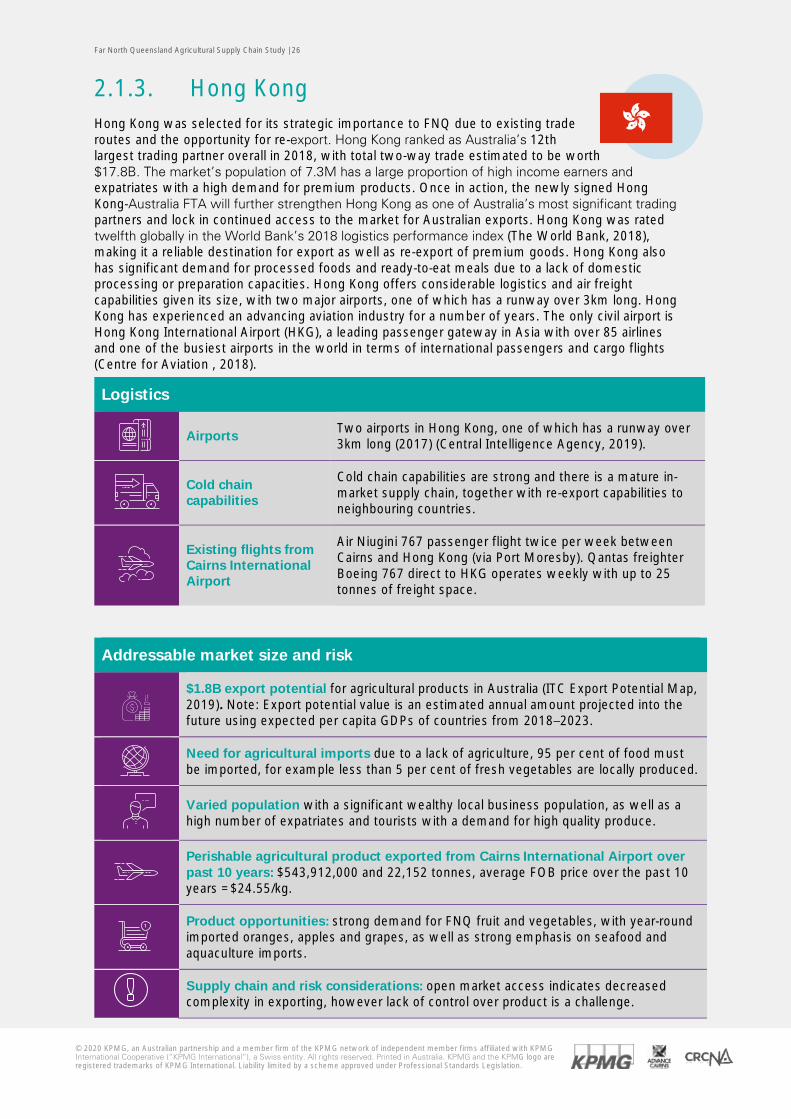
Far North Queensland Agricultural Supply Chain Study | 26
© 2020 KPMG, an Australian partnership and a member firm of the KPMG network of independent member firms affiliated with KPMG International Cooperative (“KPMG International”), a Swiss entity. All rights reserved. Printed in Australia. KPMG and the KPMG logo are registered trademarks of KPMG International. Liability limited by a scheme approved under Professional Standards Legislation.
2.1.3. Hong Kong Hong Kong was selected for its strategic importance to FNQ due to existing trade routes and the opportunity for re-export. Hong Kong ranked as Australia’s 12th largest trading partner overall in 2018, with total two-way trade estimated to be worth $17.8B. The market’s population of 7.3M has a large proportion of high income earners and expatriates with a high demand for premium products. Once in action, the newly signed Hong Kong-Australia FTA will further strengthen Hong Kong as one of Australia’s most significant trading partners and lock in continued access to the market for Australian exports. Hong Kong was rated twelfth globally in the World Bank’s 2018 logistics performance index (The World Bank, 2018), making it a reliable destination for export as well as re-export of premium goods. Hong Kong also has significant demand for processed foods and ready-to-eat meals due to a lack of domestic processing or preparation capacities. Hong Kong offers considerable logistics and air freight capabilities given its size, with two major airports, one of which has a runway over 3km long. Hong Kong has experienced an advancing aviation industry for a number of years. The only civil airport is Hong Kong International Airport (HKG), a leading passenger gateway in Asia with over 85 airlines and one of the busiest airports in the world in terms of international passengers and cargo flights (Centre for Aviation , 2018).
Logistics
Airports Two airports in Hong Kong, one of which has a runway over 3km long (2017) (Central Intelligence Agency, 2019).
Cold chain capabilities
Cold chain capabilities are strong and there is a mature in-market supply chain, together with re-export capabilities to neighbouring countries.
Existing flights from Cairns International Airport
Air Niugini 767 passenger flight twice per week between Cairns and Hong Kong (via Port Moresby). Qantas freighter Boeing 767 direct to HKG operates weekly with up to 25 tonnes of freight space.
Addressable market size and risk
$1.8B export potential for agricultural products in Australia (ITC Export Potential Map, 2019). Note: Export potential value is an estimated annual amount projected into the future using expected per capita GDPs of countries from 2018–2023.
Need for agricultural imports due to a lack of agriculture, 95 per cent of food must be imported, for example less than 5 per cent of fresh vegetables are locally produced.
Varied population with a significant wealthy local business population, as well as a high number of expatriates and tourists with a demand for high quality produce.
Perishable agricultural product exported from Cairns International Airport over past 10 years: $543,912,000 and 22,152 tonnes, average FOB price over the past 10 years =$24.55/kg.
Product opportunities: strong demand for FNQ fruit and vegetables, with year-round imported oranges, apples and grapes, as well as strong emphasis on seafood and aquaculture imports.
Supply chain and risk considerations: open market access indicates decreased complexity in exporting, however lack of control over product is a challenge.
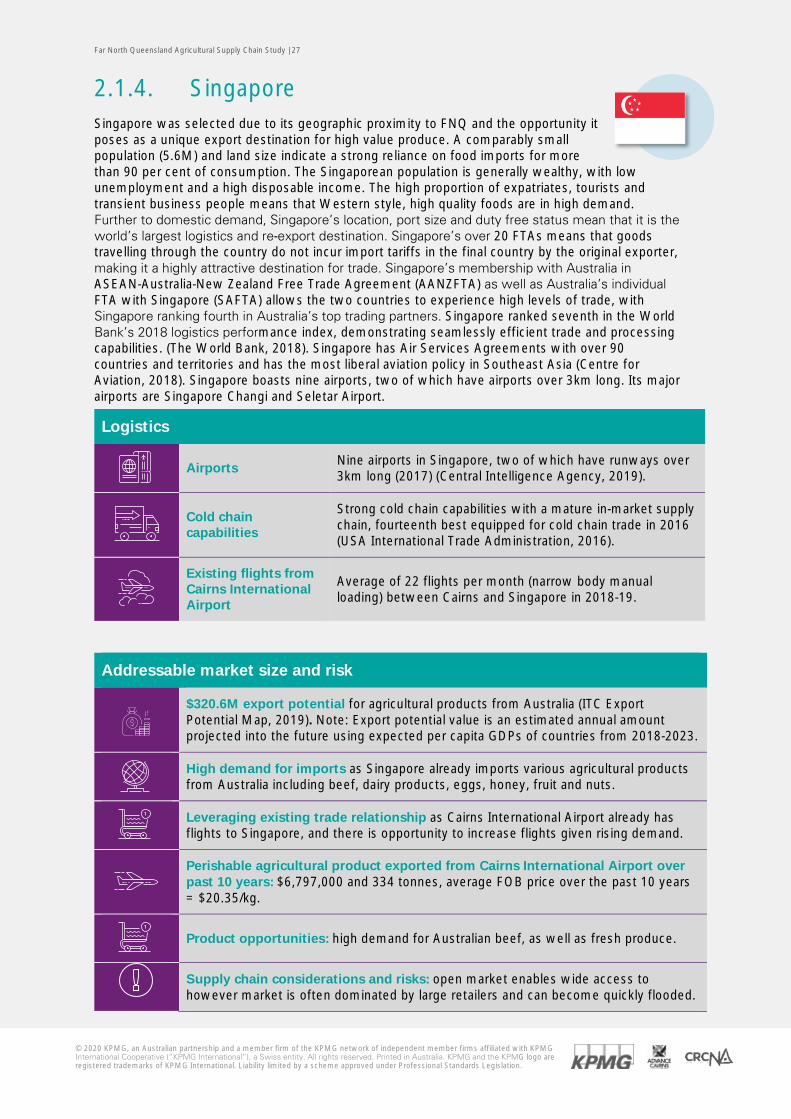
Far North Queensland Agricultural Supply Chain Study | 27
© 2020 KPMG, an Australian partnership and a member firm of the KPMG network of independent member firms affiliated with KPMG International Cooperative (“KPMG International”), a Swiss entity. All rights reserved. Printed in Australia. KPMG and the KPMG logo are registered trademarks of KPMG International. Liability limited by a scheme approved under Professional Standards Legislation.
2.1.4. Singapore Singapore was selected due to its geographic proximity to FNQ and the opportunity it poses as a unique export destination for high value produce. A comparably small population (5.6M) and land size indicate a strong reliance on food imports for more than 90 per cent of consumption. The Singaporean population is generally wealthy, with low unemployment and a high disposable income. The high proportion of expatriates, tourists and transient business people means that Western style, high quality foods are in high demand. Further to domestic demand, Singapore’s location, port size and duty free status mean that it is the world’s largest logistics and re-export destination. Singapore’s over 20 FTAs means that goods travelling through the country do not incur import tariffs in the final country by the original exporter, making it a highly attractive destination for trade. Singapore’s membership with Australia in ASEAN-Australia-New Zealand Free Trade Agreement (AANZFTA) as well as Australia’s individual FTA with Singapore (SAFTA) allows the two countries to experience high levels of trade, with Singapore ranking fourth in Australia’s top trading partners. Singapore ranked seventh in the World Bank’s 2018 logistics performance index, demonstrating seamlessly efficient trade and processing capabilities. (The World Bank, 2018). Singapore has Air Services Agreements with over 90 countries and territories and has the most liberal aviation policy in Southeast Asia (Centre for Aviation, 2018). Singapore boasts nine airports, two of which have airports over 3km long. Its major airports are Singapore Changi and Seletar Airport.
Logistics
Airports Nine airports in Singapore, two of which have runways over 3km long (2017) (Central Intelligence Agency, 2019).
Cold chain capabilities
Strong cold chain capabilities with a mature in-market supply chain, fourteenth best equipped for cold chain trade in 2016 (USA International Trade Administration, 2016).
Existing flights from Cairns International Airport
Average of 22 flights per month (narrow body manual loading) between Cairns and Singapore in 2018-19.
Addressable market size and risk
$320.6M export potential for agricultural products from Australia (ITC Export Potential Map, 2019). Note: Export potential value is an estimated annual amount projected into the future using expected per capita GDPs of countries from 2018-2023.
High demand for imports as Singapore already imports various agricultural products from Australia including beef, dairy products, eggs, honey, fruit and nuts.
Leveraging existing trade relationship as Cairns International Airport already has flights to Singapore, and there is opportunity to increase flights given rising demand.
Perishable agricultural product exported from Cairns International Airport over past 10 years: $6,797,000 and 334 tonnes, average FOB price over the past 10 years = $20.35/kg.
Product opportunities: high demand for Australian beef, as well as fresh produce.
Supply chain considerations and risks: open market enables wide access to however market is often dominated by large retailers and can become quickly flooded.
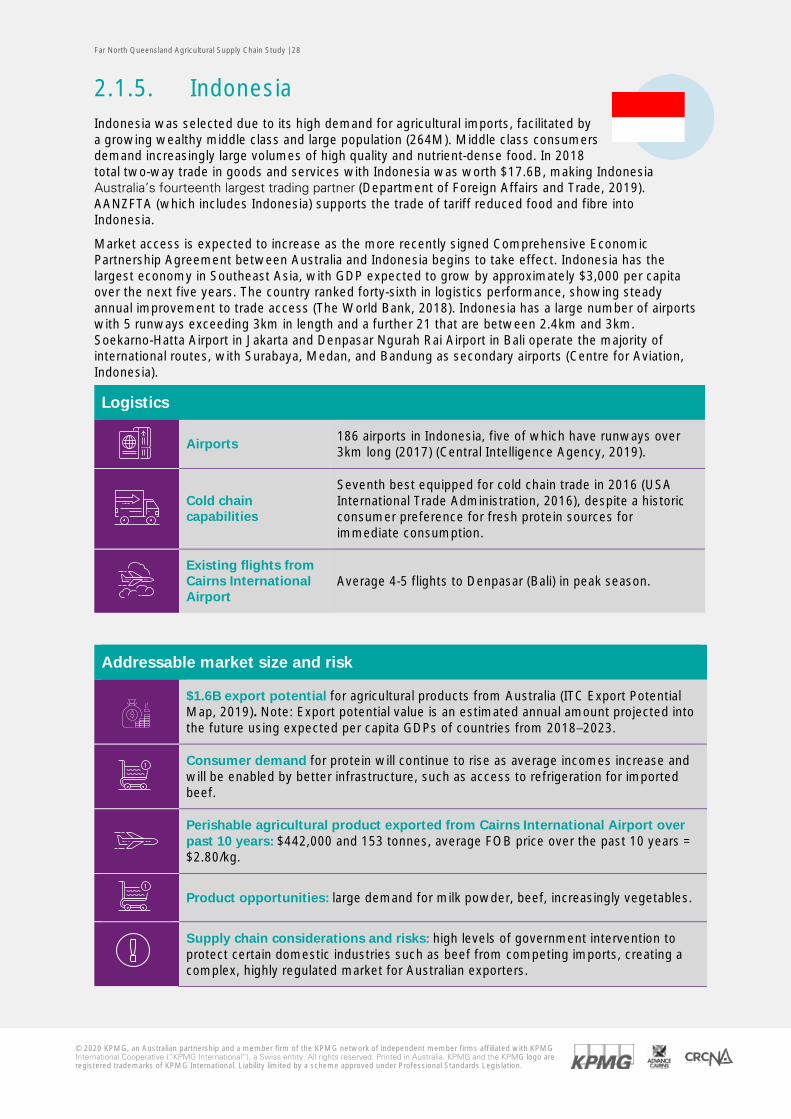
Far North Queensland Agricultural Supply Chain Study | 28
© 2020 KPMG, an Australian partnership and a member firm of the KPMG network of independent member firms affiliated with KPMG International Cooperative (“KPMG International”), a Swiss entity. All rights reserved. Printed in Australia. KPMG and the KPMG logo are registered trademarks of KPMG International. Liability limited by a scheme approved under Professional Standards Legislation.
2.1.5. Indonesia Indonesia was selected due to its high demand for agricultural imports, facilitated by a growing wealthy middle class and large population (264M). Middle class consumers demand increasingly large volumes of high quality and nutrient-dense food. In 2018 total two-way trade in goods and services with Indonesia was worth $17.6B, making Indonesia Australia’s fourteenth largest trading partner (Department of Foreign Affairs and Trade, 2019). AANZFTA (which includes Indonesia) supports the trade of tariff reduced food and fibre into Indonesia.
Market access is expected to increase as the more recently signed Comprehensive Economic Partnership Agreement between Australia and Indonesia begins to take effect. Indonesia has the largest economy in Southeast Asia, with GDP expected to grow by approximately $3,000 per capita over the next five years. The country ranked forty-sixth in logistics performance, showing steady annual improvement to trade access (The World Bank, 2018). Indonesia has a large number of airports with 5 runways exceeding 3km in length and a further 21 that are between 2.4km and 3km. Soekarno-Hatta Airport in Jakarta and Denpasar Ngurah Rai Airport in Bali operate the majority of international routes, with Surabaya, Medan, and Bandung as secondary airports (Centre for Aviation, Indonesia).
Logistics
Airports 186 airports in Indonesia, five of which have runways over 3km long (2017) (Central Intelligence Agency, 2019).
Cold chain capabilities
Seventh best equipped for cold chain trade in 2016 (USA International Trade Administration, 2016), despite a historic consumer preference for fresh protein sources for immediate consumption.
Existing flights from Cairns International Airport
Average 4-5 flights to Denpasar (Bali) in peak season.
Addressable market size and risk
$1.6B export potential for agricultural products from Australia (ITC Export Potential Map, 2019). Note: Export potential value is an estimated annual amount projected into the future using expected per capita GDPs of countries from 2018–2023.
Consumer demand for protein will continue to rise as average incomes increase and will be enabled by better infrastructure, such as access to refrigeration for imported beef.
Perishable agricultural product exported from Cairns International Airport over past 10 years: $442,000 and 153 tonnes, average FOB price over the past 10 years = $2.80/kg.
Product opportunities: large demand for milk powder, beef, increasingly vegetables.
Supply chain considerations and risks: high levels of government intervention to protect certain domestic industries such as beef from competing imports, creating a complex, highly regulated market for Australian exporters.
Far North Queensland Agricultural Supply Chain Study | 29
© 2020 KPMG, an Australian partnership and a member firm of the KPMG network of independent member firms affiliated with KPMG International Cooperative (“KPMG International”), a Swiss entity. All rights reserved. Printed in Australia. KPMG and the KPMG logo are registered trademarks of KPMG International. Liability limited by a scheme approved under Professional Standards Legislation.
3. Market-led agricultural products
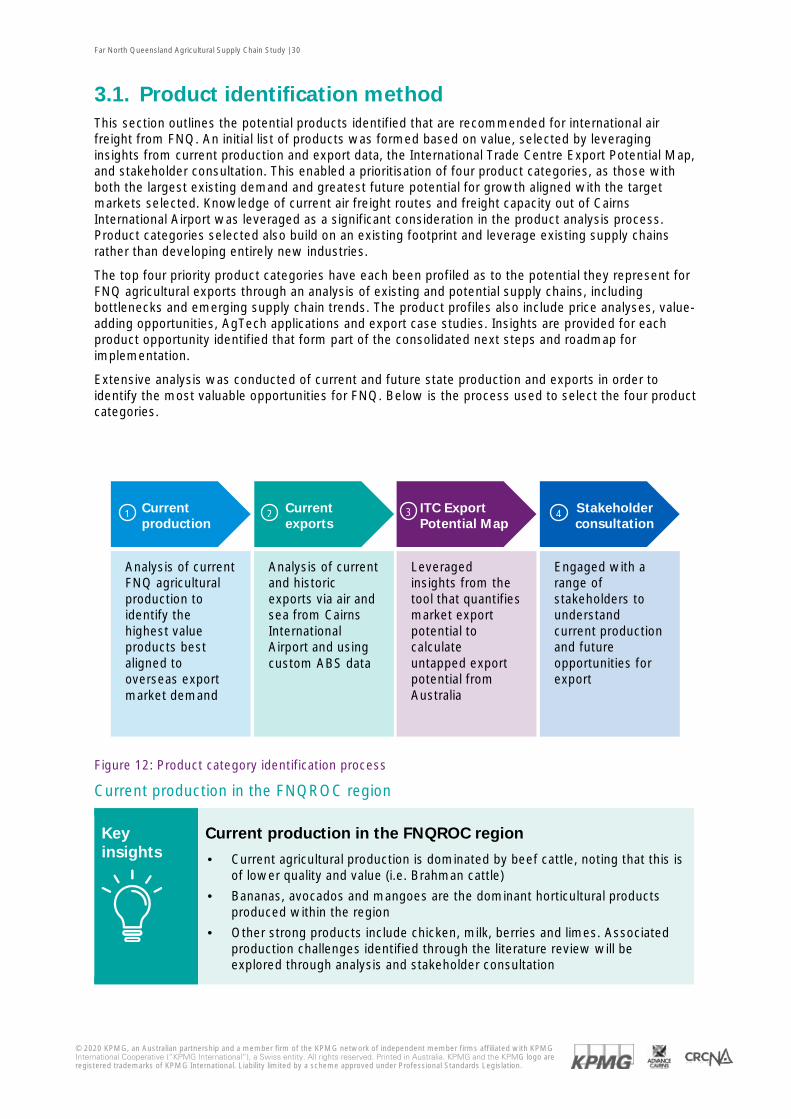
Far North Queensland Agricultural Supply Chain Study | 30
© 2020 KPMG, an Australian partnership and a member firm of the KPMG network of independent member firms affiliated with KPMG International Cooperative (“KPMG International”), a Swiss entity. All rights reserved. Printed in Australia. KPMG and the KPMG logo are registered trademarks of KPMG International. Liability limited by a scheme approved under Professional Standards Legislation.
3.1. Product identification method This section outlines the potential products identified that are recommended for international air freight from FNQ. An initial list of products was formed based on value, selected by leveraging insights from current production and export data, the International Trade Centre Export Potential Map, and stakeholder consultation. This enabled a prioritisation of four product categories, as those with both the largest existing demand and greatest future potential for growth aligned with the target markets selected. Knowledge of current air freight routes and freight capacity out of Cairns International Airport was leveraged as a significant consideration in the product analysis process. Product categories selected also build on an existing footprint and leverage existing supply chains rather than developing entirely new industries.
The top four priority product categories have each been profiled as to the potential they represent for FNQ agricultural exports through an analysis of existing and potential supply chains, including bottlenecks and emerging supply chain trends. The product profiles also include price analyses, value-adding opportunities, AgTech applications and export case studies. Insights are provided for each product opportunity identified that form part of the consolidated next steps and roadmap for implementation.
Extensive analysis was conducted of current and future state production and exports in order to identify the most valuable opportunities for FNQ. Below is the process used to select the four product categories.
Figure 12: Product category identification process
Current production in the FNQROC region
Key insights
Current production in the FNQROC region
· Current agricultural production is dominated by beef cattle, noting that this is of lower quality and value (i.e. Brahman cattle)
· Bananas, avocados and mangoes are the dominant horticultural products produced within the region
· Other strong products include chicken, milk, berries and limes. Associated production challenges identified through the literature review will be explored through analysis and stakeholder consultation
Analysis of current FNQ agricultural production to identify the highest value products best aligned to overseas export market demand
Current exports
Analysis of current and historic exports via air and sea from Cairns International Airport and using custom ABS data
ITC Export Potential Map
Leveraged insights from the tool that quantifies market export potential to calculate untapped export potential from Australia
Stakeholder consultation
Engaged with a range of stakeholders to understand current production and future opportunities for export
Current production
1 2
3
4
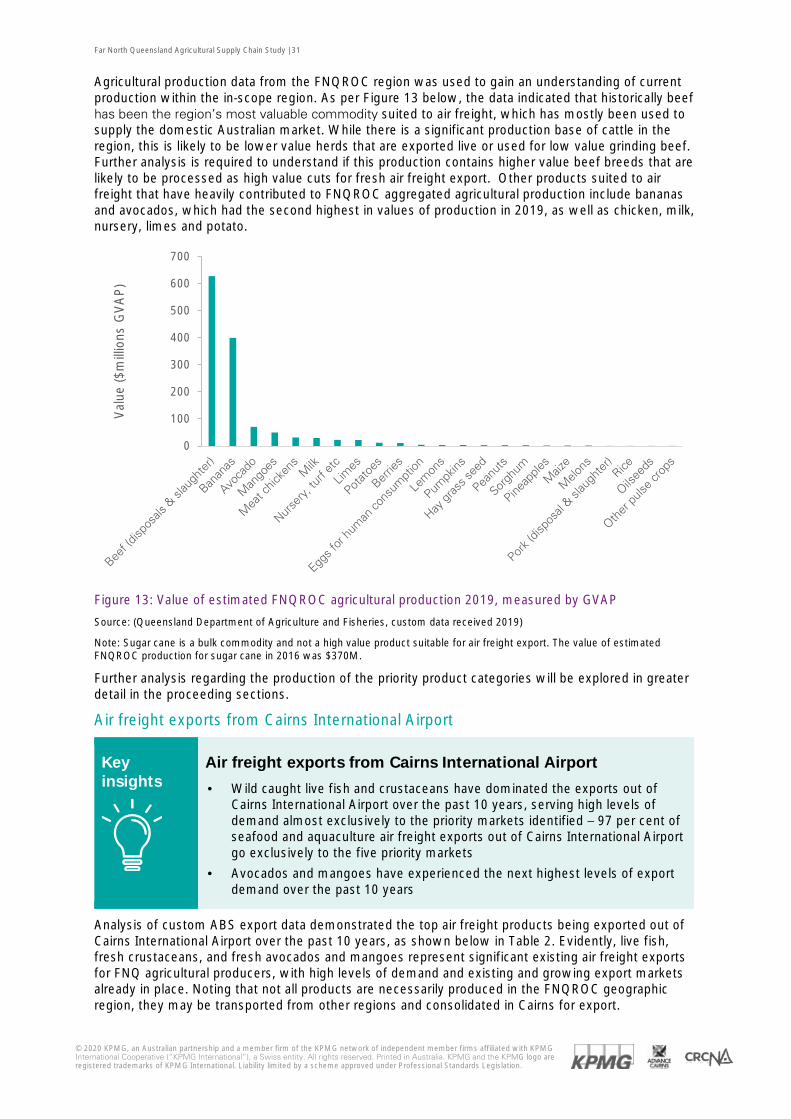
Far North Queensland Agricultural Supply Chain Study | 31
© 2020 KPMG, an Australian partnership and a member firm of the KPMG network of independent member firms affiliated with KPMG International Cooperative (“KPMG International”), a Swiss entity. All rights reserved. Printed in Australia. KPMG and the KPMG logo are registered trademarks of KPMG International. Liability limited by a scheme approved under Professional Standards Legislation.
Agricultural production data from the FNQROC region was used to gain an understanding of current production within the in-scope region. As per Figure 13 below, the data indicated that historically beef has been the region’s most valuable commodity suited to air freight, which has mostly been used to supply the domestic Australian market. While there is a significant production base of cattle in the region, this is likely to be lower value herds that are exported live or used for low value grinding beef. Further analysis is required to understand if this production contains higher value beef breeds that are likely to be processed as high value cuts for fresh air freight export. Other products suited to air freight that have heavily contributed to FNQROC aggregated agricultural production include bananas and avocados, which had the second highest in values of production in 2019, as well as chicken, milk, nursery, limes and potato.
Figure 13: Value of estimated FNQROC agricultural production 2019, measured by GVAP
Source: (Queensland Department of Agriculture and Fisheries, custom data received 2019)
Note: Sugar cane is a bulk commodity and not a high value product suitable for air freight export. The value of estimated FNQROC production for sugar cane in 2016 was $370M.
Further analysis regarding the production of the priority product categories will be explored in greater detail in the proceeding sections.
Air freight exports from Cairns International Airport
Key insights
Air freight exports from Cairns International Airport
· Wild caught live fish and crustaceans have dominated the exports out of Cairns International Airport over the past 10 years, serving high levels of demand almost exclusively to the priority markets identified – 97 per cent of seafood and aquaculture air freight exports out of Cairns International Airport go exclusively to the five priority markets
· Avocados and mangoes have experienced the next highest levels of export demand over the past 10 years
Analysis of custom ABS export data demonstrated the top air freight products being exported out of Cairns International Airport over the past 10 years, as shown below in Table 2. Evidently, live fish, fresh crustaceans, and fresh avocados and mangoes represent significant existing air freight exports for FNQ agricultural producers, with high levels of demand and existing and growing export markets already in place. Noting that not all products are necessarily produced in the FNQROC geographic region, they may be transported from other regions and consolidated in Cairns for export.
0
100
200
300
400
500
600
700
Val
ue ($
mill
ions
GV
AP
)
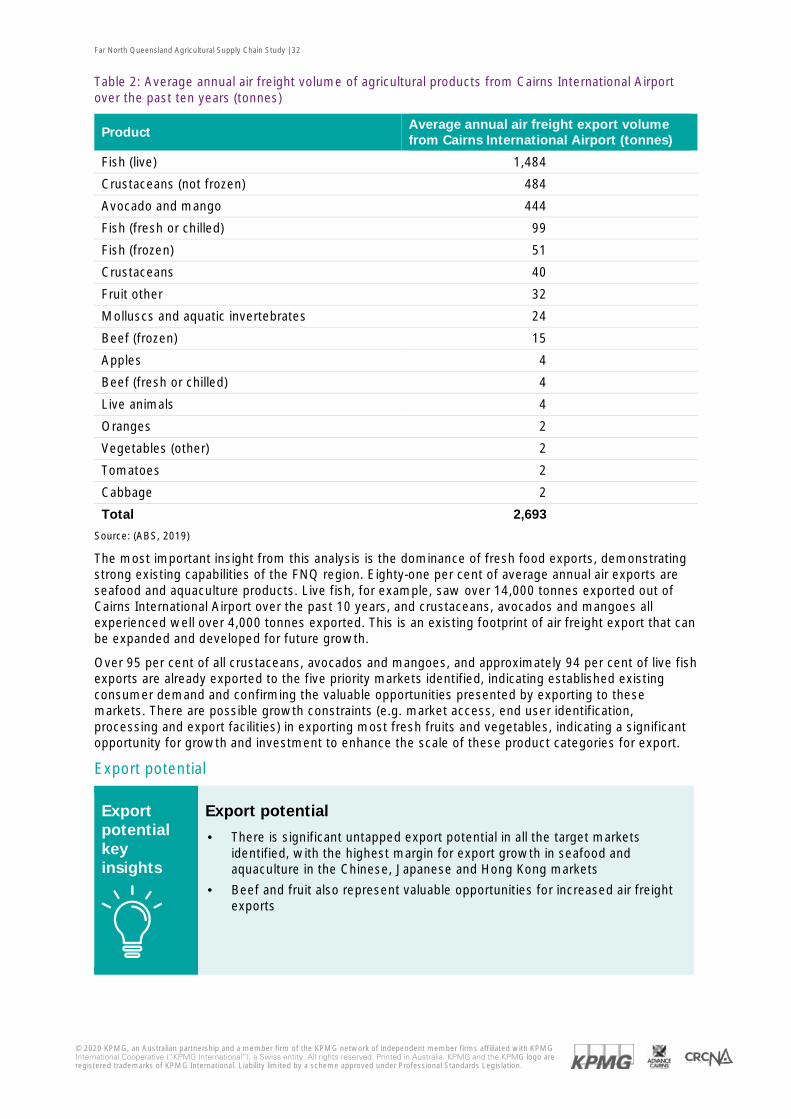
Far North Queensland Agricultural Supply Chain Study | 32
© 2020 KPMG, an Australian partnership and a member firm of the KPMG network of independent member firms affiliated with KPMG International Cooperative (“KPMG International”), a Swiss entity. All rights reserved. Printed in Australia. KPMG and the KPMG logo are registered trademarks of KPMG International. Liability limited by a scheme approved under Professional Standards Legislation.
Table 2: Average annual air freight volume of agricultural products from Cairns International Airport over the past ten years (tonnes)
Product Average annual air freight export volume from Cairns International Airport (tonnes)
Fish (live) 1,484
Crustaceans (not frozen) 484
Avocado and mango 444
Fish (fresh or chilled) 99
Fish (frozen) 51
Crustaceans 40
Fruit other 32
Molluscs and aquatic invertebrates 24
Beef (frozen) 15
Apples 4
Beef (fresh or chilled) 4
Live animals 4
Oranges 2
Vegetables (other) 2
Tomatoes 2
Cabbage 2
Total 2,693
Source: (ABS, 2019)
The most important insight from this analysis is the dominance of fresh food exports, demonstrating strong existing capabilities of the FNQ region. Eighty-one per cent of average annual air exports are seafood and aquaculture products. Live fish, for example, saw over 14,000 tonnes exported out of Cairns International Airport over the past 10 years, and crustaceans, avocados and mangoes all experienced well over 4,000 tonnes exported. This is an existing footprint of air freight export that can be expanded and developed for future growth.
Over 95 per cent of all crustaceans, avocados and mangoes, and approximately 94 per cent of live fish exports are already exported to the five priority markets identified, indicating established existing consumer demand and confirming the valuable opportunities presented by exporting to these markets. There are possible growth constraints (e.g. market access, end user identification, processing and export facilities) in exporting most fresh fruits and vegetables, indicating a significant opportunity for growth and investment to enhance the scale of these product categories for export.
Export potential
Export potential key insights
Export potential
· There is significant untapped export potential in all the target markets identified, with the highest margin for export growth in seafood and aquaculture in the Chinese, Japanese and Hong Kong markets
· Beef and fruit also represent valuable opportunities for increased air freight exports
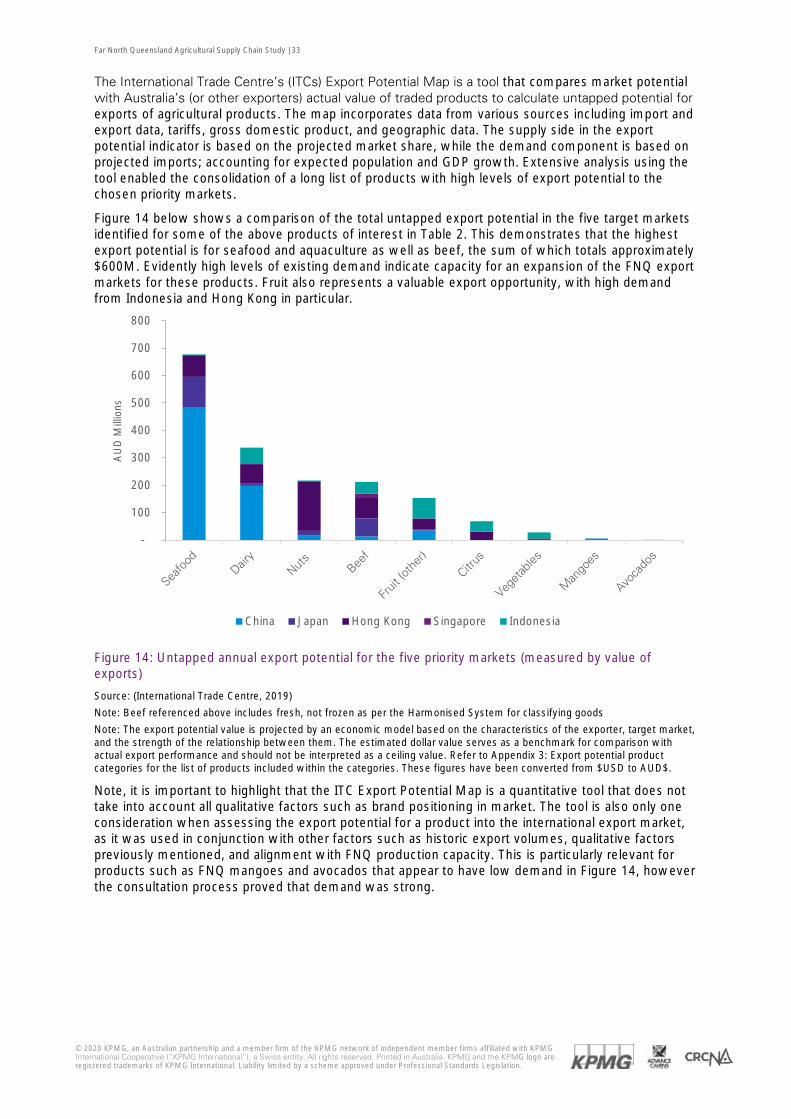
Far North Queensland Agricultural Supply Chain Study | 33
© 2020 KPMG, an Australian partnership and a member firm of the KPMG network of independent member firms affiliated with KPMG International Cooperative (“KPMG International”), a Swiss entity. All rights reserved. Printed in Australia. KPMG and the KPMG logo are registered trademarks of KPMG International. Liability limited by a scheme approved under Professional Standards Legislation.
The International Trade Centre’s (ITCs) Export Potential Map is a tool that compares market potential with Australia’s (or other exporters) actual value of traded products to calculate untapped potential for exports of agricultural products. The map incorporates data from various sources including import and export data, tariffs, gross domestic product, and geographic data. The supply side in the export potential indicator is based on the projected market share, while the demand component is based on projected imports; accounting for expected population and GDP growth. Extensive analysis using the tool enabled the consolidation of a long list of products with high levels of export potential to the chosen priority markets.
Figure 14 below shows a comparison of the total untapped export potential in the five target markets identified for some of the above products of interest in Table 2. This demonstrates that the highest export potential is for seafood and aquaculture as well as beef, the sum of which totals approximately $600M. Evidently high levels of existing demand indicate capacity for an expansion of the FNQ export markets for these products. Fruit also represents a valuable export opportunity, with high demand from Indonesia and Hong Kong in particular.
Figure 14: Untapped annual export potential for the five priority markets (measured by value of exports)
Source: (International Trade Centre, 2019)
Note: Beef referenced above includes fresh, not frozen as per the Harmonised System for classifying goods
Note: The export potential value is projected by an economic model based on the characteristics of the exporter, target market, and the strength of the relationship between them. The estimated dollar value serves as a benchmark for comparison with actual export performance and should not be interpreted as a ceiling value. Refer to Appendix 3: Export potential product categories for the list of products included within the categories. These figures have been converted from $USD to AUD$.
Note, it is important to highlight that the ITC Export Potential Map is a quantitative tool that does not take into account all qualitative factors such as brand positioning in market. The tool is also only one consideration when assessing the export potential for a product into the international export market, as it was used in conjunction with other factors such as historic export volumes, qualitative factors previously mentioned, and alignment with FNQ production capacity. This is particularly relevant for products such as FNQ mangoes and avocados that appear to have low demand in Figure 14, however the consultation process proved that demand was strong.
-
100
200
300
400
500
600
700
800
AU
D M
illio
ns
China Japan Hong Kong Singapore Indonesia
Far North Queensland Agricultural Supply Chain Study | 34
© 2020 KPMG, an Australian partnership and a member firm of the KPMG network of independent member firms affiliated with KPMG International Cooperative (“KPMG International”), a Swiss entity. All rights reserved. Printed in Australia. KPMG and the KPMG logo are registered trademarks of KPMG International. Liability limited by a scheme approved under Professional Standards Legislation.
3.1.1. Stakeholder consultation
Stakeholder consultation key insights
Stakeholder consultation
· There is high demand, lucrative export markets, as well as a possibility of oversupply for horticultural tree crops (mangoes and avocados)
· Numerous opportunities for value-adding production exist around organic, pre-prepared, and other altered products
· There are numerous opportunities for value-adding production in the region such as eco-organic, kids sized products, organic, frozen or dried products
· FNQ has strong existing capabilities for on shore and off-shore aquaculture production and there is insatiable demand for some product categories both domestically and internationally
· In-region infrastructure along several stages in the supply chain (i.e. processing, packing, finishing) are needed for beef, horticultural tree crops and field crops in order to drive critical supplies for commercialisation
A range of stakeholders in the FNQ region were consulted to inform the recommendations of priority products categories for the region. Producers, supply chain operators, industry bodies and government representatives gave insights into current production in the region and potential capacity for expansion or diversification in certain areas. Stakeholder consultations were highly useful in validating and confirming the feasibility of export for certain products and operations. This knowledge was particularly valuable to product prioritisation and leveraged accordingly, enabling recommendations to be supported by current industry factors.
3.2. Products identified and rationale Based on the analysis performed above, four product categories shown below in Table 3 have been identified to focus agricultural production for air freight exports. These categories have been identified as having the highest value for export for the FNQ region both currently and in the future, as well as strong existing production capacity. Products within the same group typically share aligned production, transport, distribution and export requirements, and consequently supply chain considerations can be viewed through an all-encompassing lens for each category. For example, avocados will have similar recommendations as for other products in the horticultural tree crops category suitable to the FNQ region, such as mangoes and citrus.
While there may be differences between products of a given category, the up-scaling of industries for export will require compatible infrastructure developments. The product category approach is valuable as it allows recommendations to be applicable for a larger cross-section of producers, supply chain operators, and other industry participants. Therefore the benefits achieved by expanding exports and resulting economic growth can be more widely leveraged throughout the region.
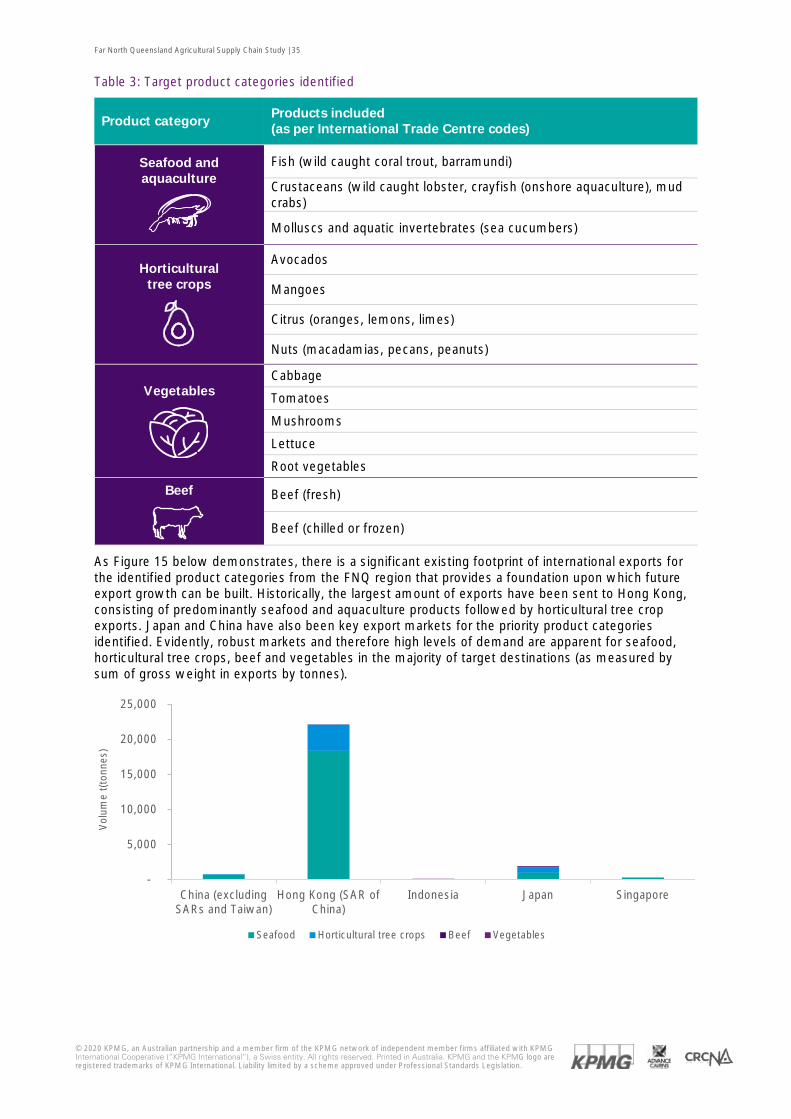
Far North Queensland Agricultural Supply Chain Study | 35
© 2020 KPMG, an Australian partnership and a member firm of the KPMG network of independent member firms affiliated with KPMG International Cooperative (“KPMG International”), a Swiss entity. All rights reserved. Printed in Australia. KPMG and the KPMG logo are registered trademarks of KPMG International. Liability limited by a scheme approved under Professional Standards Legislation.
Table 3: Target product categories identified
Product category Products included (as per International Trade Centre codes)
Seafood and aquaculture
Fish (wild caught coral trout, barramundi)
Crustaceans (wild caught lobster, crayfish (onshore aquaculture), mud crabs)
Molluscs and aquatic invertebrates (sea cucumbers)
Horticultural tree crops
Avocados
Mangoes
Citrus (oranges, lemons, limes)
Nuts (macadamias, pecans, peanuts)
Vegetables
Cabbage
Tomatoes
Mushrooms
Lettuce
Root vegetables
Beef
Beef (fresh)
Beef (chilled or frozen)
As Figure 15 below demonstrates, there is a significant existing footprint of international exports for the identified product categories from the FNQ region that provides a foundation upon which future export growth can be built. Historically, the largest amount of exports have been sent to Hong Kong, consisting of predominantly seafood and aquaculture products followed by horticultural tree crop exports. Japan and China have also been key export markets for the priority product categories identified. Evidently, robust markets and therefore high levels of demand are apparent for seafood, horticultural tree crops, beef and vegetables in the majority of target destinations (as measured by sum of gross weight in exports by tonnes).
-
5,000
10,000
15,000
20,000
25,000
China (excludingSARs and Taiwan)
Hong Kong (SAR ofChina)
Indonesia Japan Singapore
Vol
ume
t(to
nnes
)
Seafood Horticultural tree crops Beef Vegetables
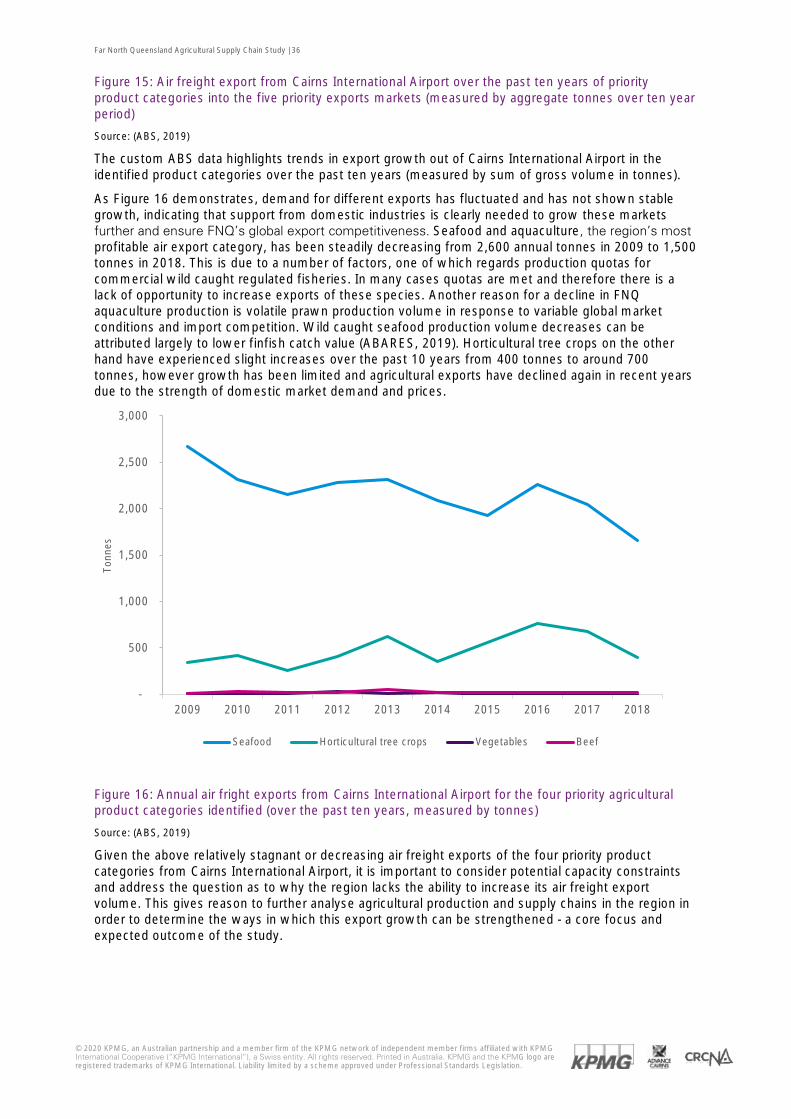
Far North Queensland Agricultural Supply Chain Study | 36
© 2020 KPMG, an Australian partnership and a member firm of the KPMG network of independent member firms affiliated with KPMG International Cooperative (“KPMG International”), a Swiss entity. All rights reserved. Printed in Australia. KPMG and the KPMG logo are registered trademarks of KPMG International. Liability limited by a scheme approved under Professional Standards Legislation.
Figure 15: Air freight export from Cairns International Airport over the past ten years of priority product categories into the five priority exports markets (measured by aggregate tonnes over ten year period)
Source: (ABS, 2019)
The custom ABS data highlights trends in export growth out of Cairns International Airport in the identified product categories over the past ten years (measured by sum of gross volume in tonnes).
As Figure 16 demonstrates, demand for different exports has fluctuated and has not shown stable growth, indicating that support from domestic industries is clearly needed to grow these markets further and ensure FNQ’s global export competitiveness. Seafood and aquaculture, the region’s most profitable air export category, has been steadily decreasing from 2,600 annual tonnes in 2009 to 1,500 tonnes in 2018. This is due to a number of factors, one of which regards production quotas for commercial wild caught regulated fisheries. In many cases quotas are met and therefore there is a lack of opportunity to increase exports of these species. Another reason for a decline in FNQ aquaculture production is volatile prawn production volume in response to variable global market conditions and import competition. Wild caught seafood production volume decreases can be attributed largely to lower finfish catch value (ABARES, 2019). Horticultural tree crops on the other hand have experienced slight increases over the past 10 years from 400 tonnes to around 700 tonnes, however growth has been limited and agricultural exports have declined again in recent years due to the strength of domestic market demand and prices.
Figure 16: Annual air fright exports from Cairns International Airport for the four priority agricultural product categories identified (over the past ten years, measured by tonnes)
Source: (ABS, 2019)
Given the above relatively stagnant or decreasing air freight exports of the four priority product categories from Cairns International Airport, it is important to consider potential capacity constraints and address the question as to why the region lacks the ability to increase its air freight export volume. This gives reason to further analyse agricultural production and supply chains in the region in order to determine the ways in which this export growth can be strengthened - a core focus and expected outcome of the study.
-
500
1,000
1,500
2,000
2,500
3,000
2009 2010 2011 2012 2013 2014 2015 2016 2017 2018
Tonn
es
Seafood Horticultural tree crops Vegetables Beef
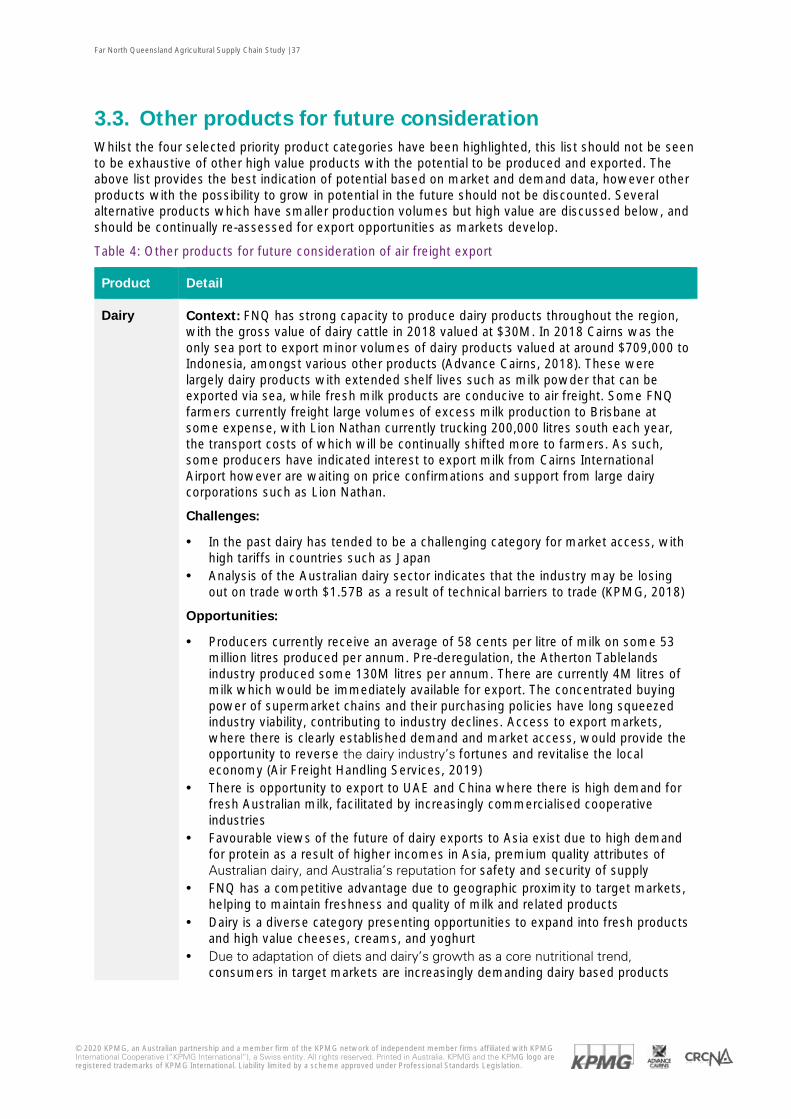
Far North Queensland Agricultural Supply Chain Study | 37
© 2020 KPMG, an Australian partnership and a member firm of the KPMG network of independent member firms affiliated with KPMG International Cooperative (“KPMG International”), a Swiss entity. All rights reserved. Printed in Australia. KPMG and the KPMG logo are registered trademarks of KPMG International. Liability limited by a scheme approved under Professional Standards Legislation.
3.3. Other products for future consideration Whilst the four selected priority product categories have been highlighted, this list should not be seen to be exhaustive of other high value products with the potential to be produced and exported. The above list provides the best indication of potential based on market and demand data, however other products with the possibility to grow in potential in the future should not be discounted. Several alternative products which have smaller production volumes but high value are discussed below, and should be continually re-assessed for export opportunities as markets develop.
Table 4: Other products for future consideration of air freight export
Product Detail
Dairy Context: FNQ has strong capacity to produce dairy products throughout the region, with the gross value of dairy cattle in 2018 valued at $30M. In 2018 Cairns was the only sea port to export minor volumes of dairy products valued at around $709,000 to Indonesia, amongst various other products (Advance Cairns, 2018). These were largely dairy products with extended shelf lives such as milk powder that can be exported via sea, while fresh milk products are conducive to air freight. Some FNQ farmers currently freight large volumes of excess milk production to Brisbane at some expense, with Lion Nathan currently trucking 200,000 litres south each year, the transport costs of which will be continually shifted more to farmers. As such, some producers have indicated interest to export milk from Cairns International Airport however are waiting on price confirmations and support from large dairy corporations such as Lion Nathan.
Challenges:
· In the past dairy has tended to be a challenging category for market access, with high tariffs in countries such as Japan
· Analysis of the Australian dairy sector indicates that the industry may be losing out on trade worth $1.57B as a result of technical barriers to trade (KPMG, 2018)
Opportunities:
· Producers currently receive an average of 58 cents per litre of milk on some 53 million litres produced per annum. Pre-deregulation, the Atherton Tablelands industry produced some 130M litres per annum. There are currently 4M litres of milk which would be immediately available for export. The concentrated buying power of supermarket chains and their purchasing policies have long squeezed industry viability, contributing to industry declines. Access to export markets, where there is clearly established demand and market access, would provide the opportunity to reverse the dairy industry’s fortunes and revitalise the local economy (Air Freight Handling Services, 2019)
· There is opportunity to export to UAE and China where there is high demand for fresh Australian milk, facilitated by increasingly commercialised cooperative industries
· Favourable views of the future of dairy exports to Asia exist due to high demand for protein as a result of higher incomes in Asia, premium quality attributes of Australian dairy, and Australia’s reputation for safety and security of supply
· FNQ has a competitive advantage due to geographic proximity to target markets, helping to maintain freshness and quality of milk and related products
· Dairy is a diverse category presenting opportunities to expand into fresh products and high value cheeses, creams, and yoghurt
· Due to adaptation of diets and dairy’s growth as a core nutritional trend, consumers in target markets are increasingly demanding dairy based products
Far North Queensland Agricultural Supply Chain Study | 38
© 2020 KPMG, an Australian partnership and a member firm of the KPMG network of independent member firms affiliated with KPMG International Cooperative (“KPMG International”), a Swiss entity. All rights reserved. Printed in Australia. KPMG and the KPMG logo are registered trademarks of KPMG International. Liability limited by a scheme approved under Professional Standards Legislation.
Product Detail
· 2011 China melamine contamination of milk powder has led to huge increases in priority of food safety and increased demand for safe Australian dairy exports (KPMG, 2018)
· Greenfield investments in new economic opportunities such as dairy processing plants are anticipated to be attracted to the region in the future (Advance Cairns, 2018). For example, the Malanda factory has recently been acquired by Chinese dairy company Mengniu, which could potentially increase export options over time
Coffee Context: Coffee production in FNQ has been marked as having increasing production value. In FNQ there are about seven growers producing coffee on around 175 hectares (Advance Cairns, 2018). Some producers are exporting the majority of their coffee, with one in particular exporting around 20T per year.
Challenges:
· In FNQ coffee requires 3-7ML/ha/year of water as rainfall and irrigation. Irrigation is pivotal to ensuring good production, especially in areas with sandy soils and sporadic rainfall (AgriFutures, 2017)
Opportunities:
· The tropical areas of Queensland are highly suitable for coffee production due to temperature, water availability, well-draining soils and freedom from frost (AgriFutures, 2017)
· Producers have indicated the advantage of growing coffee given that it can be produced and exported all year round. A mature tree yields 1.5–4.0 kilograms of ripe fruit each year, which processed and dried results in about 250–600 grams of dry green beans (AgriFutures, 2017)
· Coffee is a high value product for which many overseas consumers are willing to pay a significant premium
Cocoa Context: Cocoa production has valuable potential for expansion in FNQ. A new industry is in operation in the region growing plants from hybrid seed imported from Papua New Guinea (AgriFutures, 2017). An eight-year feasibility study Commercialising cocoa growing in North Queensland showed that the best production of cocoa in Australia was at Mossman, 100km north of Cairns (Rural Industries Research and Development Corporation, 2010).
Challenges:
· Growing cocoa as a plantation species is challenging and the industry is addressing fundamental issues of cultivation and processing
· Establishment of seedlings is challenging and the trees are prone to cyclone damage, but research is underway to investigate solutions for these problems
· Optimum economic benefit is dependent on the production of consistent high quality dried beans, meaning a significantly high dependence on the fermentation process (AgriFutures, 2017)
· There are several pests and diseases to which cocoa can be subjected in production, as identified in a recent feasibility study (Rural Industries Research and Development Corporation, 2010)
Opportunities:
· Food preparations containing cocoa air exports from Cairns International Airport achieved an average FOB price point of $22.22 per kilo over the past ten years
· Boutique markets are under development using the concept of high quality ‘origin’ chocolate and there is potential for chocolate-based tourism built around a
Far North Queensland Agricultural Supply Chain Study | 39
© 2020 KPMG, an Australian partnership and a member firm of the KPMG network of independent member firms affiliated with KPMG International Cooperative (“KPMG International”), a Swiss entity. All rights reserved. Printed in Australia. KPMG and the KPMG logo are registered trademarks of KPMG International. Liability limited by a scheme approved under Professional Standards Legislation.
Product Detail
‘bean to bar’ concept. There is substantial capacity to capitalise on both domestic and global trends of organic-eating and sustainable consumer purchasing habits
· The wet tropical coast of Northern Queensland from Cardwell to the Daintree is environmentally suited to production, with the potential to produce high yields of up to 3T/ha of dry beans that meet physical commercial requirements
Vanilla Context: There are several producers in FNQ already succeeding in the production and commercialisation of vanilla as well as other spices. Stakeholders indicated opportunities for vanilla production in the Etheridge Shire specifically.
Challenges:
· Several pests and diseases can be found in vanilla cultivation · Highly specialised farming technique that requires long-term commitment from
farmers. Cultivation involves a significantly long curing process and in many cases every flower has to be hand-pollinated during morning hours
Opportunities:
· Lucrative market with potential to earn significant profit margins, given vanilla is one of the costliest spices in the market after saffron (AgriFarming, 2016). Furthermore, the initial investment for the cultivation of vanilla is little when compared to other spices
· Vanilla air freight exports from Cairns International Airport achieved an average FOB price point of $119.79 per kilo over the past ten years
· Cultivation of vanilla crop is suited to FNQ climate given it requires warm and humid conditions for growth, and is accustomed to regular rainfall
· Highly versatile crop with the capacity to produce range of vanilla-based products, such as vanilla beans, essence, sugars, salt, tea, and paste
Berries Context: There is existing berry production in the region and berry air exports from Cairns International Airports achieved an average FOB price of $18.01 per kilo over the past ten years. Costa Group are the primary producer but predominately supply the domestic market exclusively. There are several blueberry producers already succeeding on the Atherton Tablelands, many of whom plan to diversify into export sales in the future.
Challenges:
· In some respects large corporations like Costa Group monopolise the industry with its vast scale of producers and set contracts with domestic retailers
· Costs of labour are high due to manual picking, as well as manual packing if farms do not yet have advanced technology. Grading machines cost around $1M.
· High capital barriers to entry, stakeholders have indicated that around $250-300,000 is required per hectare to set up blueberry production. Tunnels are the major cost driver of this capital
· Short lead times from picking to shelf, products must be kept in 2 degree temperatures. For every hour blueberries are at room temperature a day of shelf life is lost
· New varieties take over 24 months to develop
Opportunities:
· Berry air freight exports from Cairns International Airport achieved an average FOB price point of $18.01 per kilo over the past ten years
· Costa Group also presents an opportunity for industry development as other growers can use the company’s facilities, as well as leverage its research into
Far North Queensland Agricultural Supply Chain Study | 40
© 2020 KPMG, an Australian partnership and a member firm of the KPMG network of independent member firms affiliated with KPMG International Cooperative (“KPMG International”), a Swiss entity. All rights reserved. Printed in Australia. KPMG and the KPMG logo are registered trademarks of KPMG International. Liability limited by a scheme approved under Professional Standards Legislation.
Product Detail
new variety development and other industry growth strategies. Overall, Costa Group has significantly grown the industry in FNQ and driven higher levels of demand
· Support for genetics research can also be sourced from collaborations with other industry bodies such as Mountain Blue Orchards
· There is large opportunity in new variety development, as the process takes around 24 months which is reasonably quick for field crops
· Existing demand from Asian markets: Hong Kong represented 47 per cent of Australian exported blueberries in 2016-2017, with Indonesia, UAE and Singapore also having imported significant quantities
Native
foods
Context: There is significant availability of native foods like Lemon Myrtle, Davidson Plum (Atherton Tablelands), Lemon Aspen or ‘pigeon berry’ (Atherton Tablelands), in the FNQ region (Rural Industries Research and Development Corporation, 2012).
Challenges:
· Variable yields can make crop unreliable, especially with smaller amounts of agronomy, research and development, communication and cooperation compared to traditional crops
· Less profitable than traditional crops for growers, collectors, and retailers · Challenge in balancing how to maintain profitable Indigenous involvement and
ownership while also supporting substantial growth in supply to take advantage of commercial market opportunities (Rural Industries Research and Development Corporation, 2012)
· Ongoing product and market development needed
Opportunities:
· Development and commercialisation could be potentially facilitated by bodies such as the Advanced Manufacturing Hub or the FNQ Food Incubator in Cairns
· Popularity of native foods increasing due to health benefits and sustainable, ethical nature of products, native foods have been developing a reputation as the ’next superfoods’
· Capacity for export exists, some consumer groups in Asian countries such as Korea have an increasing demand for all natural, Australian products
Hide and skins
Context: In 2018 $5.3M (FOB) of hides and skin products were exported via air freight from Cairns International Airport to France. An additional $0.8M (FOB) was exported to Singapore in 2018. Australia’s crocodile skins are considered to be the best quality in the world and fashion houses have purchased farms in FNQ to secure their supply. Luxury fashion label Hermes owns several farms including the Cairns Crocodile Farm and Louis Vuitton owns a farm in Innisfail.
Challenges:
· Tightly regulated industry by strict Australian laws protecting the import and export of wildlife and wildlife products, the adherence to which can be distinctively costly
· Value-adding opportunities are limited due to regulations and limitations as to chemical use
· High levels of capital investment required due to extensive range of infrastructure necessary for sustainable cultivation of crocodiles. This includes capital such as incubators, hatchling sheds, grower sheds, processing facilities and complexes, grow out ponds and skin rooms (AgriFutures, 2017)
· Return on investment takes many years so producers need to be prepared to take on financial risks
Far North Queensland Agricultural Supply Chain Study | 41
© 2020 KPMG, an Australian partnership and a member firm of the KPMG network of independent member firms affiliated with KPMG International Cooperative (“KPMG International”), a Swiss entity. All rights reserved. Printed in Australia. KPMG and the KPMG logo are registered trademarks of KPMG International. Liability limited by a scheme approved under Professional Standards Legislation.
Product Detail
· Crocodiles’ habitat of humid conditions and high temperatures increases the risk of fungal diseases and as such hygiene is an important issue for the industry, intensive maintenance of pens is pivotal to successful production
Opportunities:
· Hide and skins products attract high profit margins from importers overseas, where they are often used for luxury leather products such as handbags or luggage
· Following France, Singapore and Indonesia have the next highest levels of demand for imports of Australian crocodile skins
· There is capacity for a market for value-added products and tanned skins, some producers sell such products via their own websites or on-site at their farms but the volume of these sales is generally insufficient to support a commercial business (AgriFutures, 2017)
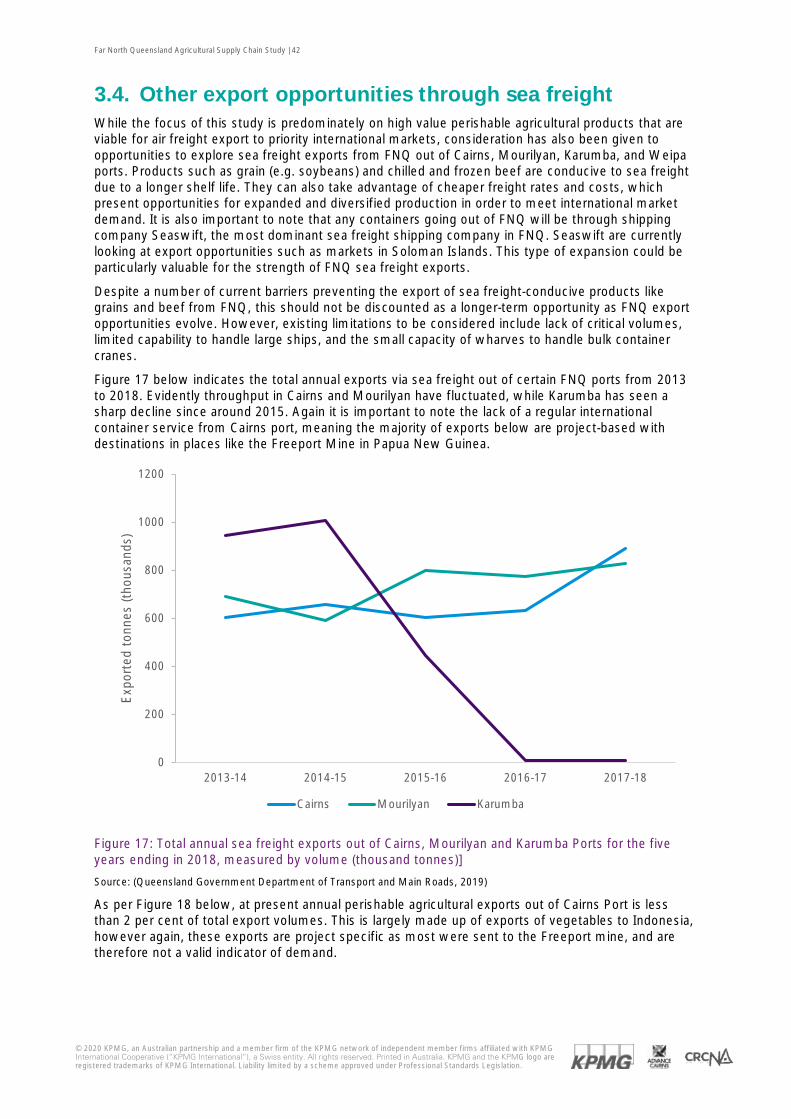
Far North Queensland Agricultural Supply Chain Study | 42
© 2020 KPMG, an Australian partnership and a member firm of the KPMG network of independent member firms affiliated with KPMG International Cooperative (“KPMG International”), a Swiss entity. All rights reserved. Printed in Australia. KPMG and the KPMG logo are registered trademarks of KPMG International. Liability limited by a scheme approved under Professional Standards Legislation.
3.4. Other export opportunities through sea freight While the focus of this study is predominately on high value perishable agricultural products that are viable for air freight export to priority international markets, consideration has also been given to opportunities to explore sea freight exports from FNQ out of Cairns, Mourilyan, Karumba, and Weipa ports. Products such as grain (e.g. soybeans) and chilled and frozen beef are conducive to sea freight due to a longer shelf life. They can also take advantage of cheaper freight rates and costs, which present opportunities for expanded and diversified production in order to meet international market demand. It is also important to note that any containers going out of FNQ will be through shipping company Seaswift, the most dominant sea freight shipping company in FNQ. Seaswift are currently looking at export opportunities such as markets in Soloman Islands. This type of expansion could be particularly valuable for the strength of FNQ sea freight exports.
Despite a number of current barriers preventing the export of sea freight-conducive products like grains and beef from FNQ, this should not be discounted as a longer-term opportunity as FNQ export opportunities evolve. However, existing limitations to be considered include lack of critical volumes, limited capability to handle large ships, and the small capacity of wharves to handle bulk container cranes.
Figure 17 below indicates the total annual exports via sea freight out of certain FNQ ports from 2013 to 2018. Evidently throughput in Cairns and Mourilyan have fluctuated, while Karumba has seen a sharp decline since around 2015. Again it is important to note the lack of a regular international container service from Cairns port, meaning the majority of exports below are project-based with destinations in places like the Freeport Mine in Papua New Guinea.
Figure 17: Total annual sea freight exports out of Cairns, Mourilyan and Karumba Ports for the five years ending in 2018, measured by volume (thousand tonnes)]
Source: (Queensland Government Department of Transport and Main Roads, 2019)
As per Figure 18 below, at present annual perishable agricultural exports out of Cairns Port is less than 2 per cent of total export volumes. This is largely made up of exports of vegetables to Indonesia, however again, these exports are project specific as most were sent to the Freeport mine, and are therefore not a valid indicator of demand.
0
200
400
600
800
1000
1200
2013-14 2014-15 2015-16 2016-17 2017-18
Exp
orte
d to
nnes
(tho
usan
ds)
Cairns Mourilyan Karumba
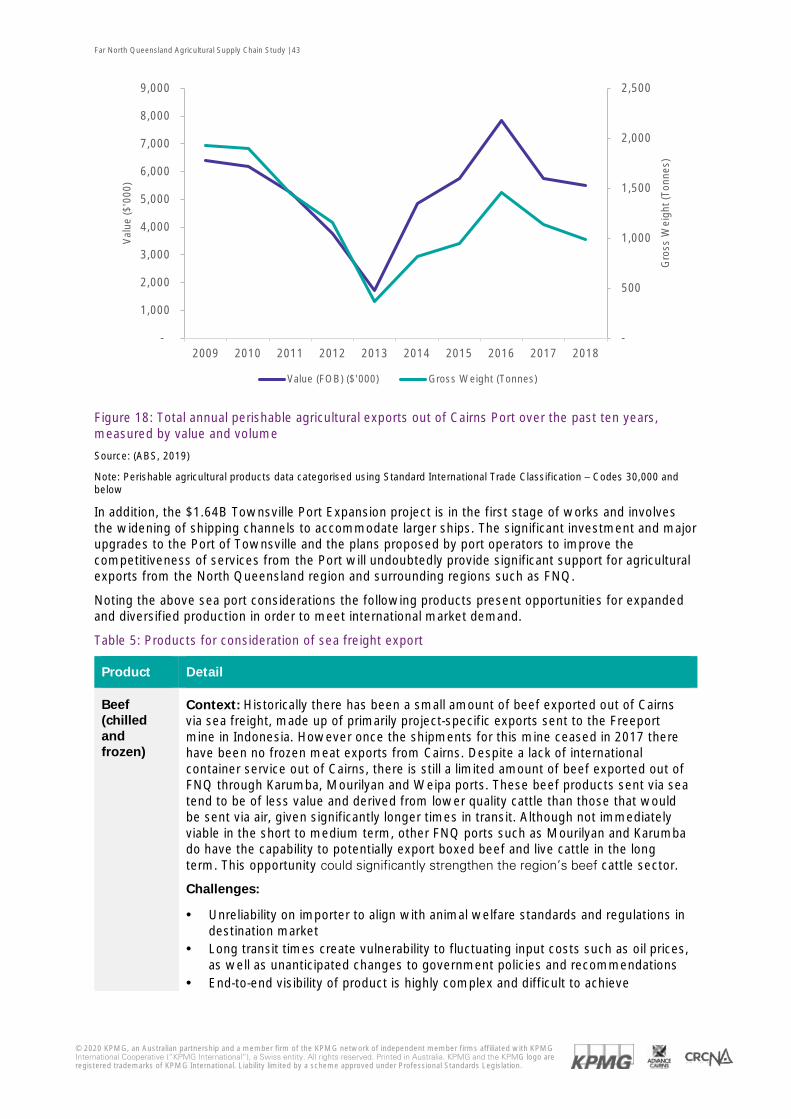
Far North Queensland Agricultural Supply Chain Study | 43
© 2020 KPMG, an Australian partnership and a member firm of the KPMG network of independent member firms affiliated with KPMG International Cooperative (“KPMG International”), a Swiss entity. All rights reserved. Printed in Australia. KPMG and the KPMG logo are registered trademarks of KPMG International. Liability limited by a scheme approved under Professional Standards Legislation.
Figure 18: Total annual perishable agricultural exports out of Cairns Port over the past ten years, measured by value and volume
Source: (ABS, 2019)
Note: Perishable agricultural products data categorised using Standard International Trade Classification – Codes 30,000 and below
In addition, the $1.64B Townsville Port Expansion project is in the first stage of works and involves the widening of shipping channels to accommodate larger ships. The significant investment and major upgrades to the Port of Townsville and the plans proposed by port operators to improve the competitiveness of services from the Port will undoubtedly provide significant support for agricultural exports from the North Queensland region and surrounding regions such as FNQ. Noting the above sea port considerations the following products present opportunities for expanded and diversified production in order to meet international market demand.
Table 5: Products for consideration of sea freight export
Product Detail
Beef (chilled and frozen)
Context: Historically there has been a small amount of beef exported out of Cairns via sea freight, made up of primarily project-specific exports sent to the Freeport mine in Indonesia. However once the shipments for this mine ceased in 2017 there have been no frozen meat exports from Cairns. Despite a lack of international container service out of Cairns, there is still a limited amount of beef exported out of FNQ through Karumba, Mourilyan and Weipa ports. These beef products sent via sea tend to be of less value and derived from lower quality cattle than those that would be sent via air, given significantly longer times in transit. Although not immediately viable in the short to medium term, other FNQ ports such as Mourilyan and Karumba do have the capability to potentially export boxed beef and live cattle in the long term. This opportunity could significantly strengthen the region’s beef cattle sector.
Challenges:
· Unreliability on importer to align with animal welfare standards and regulations in destination market
· Long transit times create vulnerability to fluctuating input costs such as oil prices, as well as unanticipated changes to government policies and recommendations
· End-to-end visibility of product is highly complex and difficult to achieve
-
500
1,000
1,500
2,000
2,500
-
1,000
2,000
3,000
4,000
5,000
6,000
7,000
8,000
9,000
2009 2010 2011 2012 2013 2014 2015 2016 2017 2018
Gro
ss W
eigh
t (To
nnes
)
Val
ue ($
'000
)
Value (FOB) ($'000) Gross Weight (Tonnes)
Far North Queensland Agricultural Supply Chain Study | 44
© 2020 KPMG, an Australian partnership and a member firm of the KPMG network of independent member firms affiliated with KPMG International Cooperative (“KPMG International”), a Swiss entity. All rights reserved. Printed in Australia. KPMG and the KPMG logo are registered trademarks of KPMG International. Liability limited by a scheme approved under Professional Standards Legislation.
Product Detail
· Increased supplies from the USA and Brazil will see competition for frozen beef exports rise (MLA, 2019)
Opportunities:
· High demand for chilled and frozen beef in priority export markets · Approximately $2.9B of untapped export potential in the ASEAN region for
Australian frozen bovine (ITC Export Potential Map, 2019) · There are a number of key port destinations in FNQ that represent potential
opportunities for beef exports in the long term future, the developments of which are overseen by key governing body Ports North
· Port of Karumba has supported livestock exports for the last 20 years and has only ceased recently, indicating strong infrastructure capabilities that could potentially be drawn upon again in the future. In the long term Karumba is a strategic port for FNQ given its location and the lack of similar facilities in Northern Australia, aside from the port of Darwin. Karumba is one of the only ports in Australia with a quarantine holding yard where cattle can walk straight onto a ship. The opportunity for increased agricultural sea freight through Karumba will become increasingly important as pastoralists look to potentially grow more grains such as sorghum and soybeans. The only limitation with Karumba Port to be considered is channel depth, however this barrier can be overcome with time
· Mourilyan Port also poses a potential opportunity to investigate the feasibility for live cattle exports, especially given a relatively strong supply of cattle in the region. Mourilyan Harbour has a loading facility on the wharf, which can unload up to 1500 head of cattle waiting for an export vessel. Mourilyan Harbour is a natural deep water port capable of accommodating the largest Livestock Vessels of up to 2000 head. However, the execution of this opportunity will depend on the upgrading the Palmerston Highway, which can currently only accommodate B-Doubles. The accommodation of B-Triples and other major freight carriers on the Palmerston is undisputedly crucial to the export of cattle out from the Mourilyan Harbour
· Stakeholder consultations indicated there may be opportunity to develop live cattle exports from the Port of Weipa as a means of diversifying current throughput from minerals. However, significant road infrastructure between Mareeba and Weipa would be necessary, including upgrading the Kuranda Range Road.
Soybeans Context: There is strong potential for soybean exported from Australia due to the non-GM status of the Australian crop (AgriFutures, 2017). Soybean production in Australia is relatively small compared to other countries, however key advantages include favourable shipping proximity to priority markets, where the demand for soy products is high. In addition, the fact that soy beans in Australia are harvested in the opposite season to northern hemisphere crops creates a strong demand from importers.
Challenges:
· Strong competition from USA, Argentina and Brazil · Top soybean market China is decreasing demand for soy imports due to an
outbreak of African Swine Fever that enables buyers to be more selective · Fluctuating protein levels in soy crop production depending on yields can have a
large impact on demand
Opportunities:
Far North Queensland Agricultural Supply Chain Study | 45
© 2020 KPMG, an Australian partnership and a member firm of the KPMG network of independent member firms affiliated with KPMG International Cooperative (“KPMG International”), a Swiss entity. All rights reserved. Printed in Australia. KPMG and the KPMG logo are registered trademarks of KPMG International. Liability limited by a scheme approved under Professional Standards Legislation.
Product Detail
· Production of non-GM soybean is viable in the FNQ region and the market demand for non-GMO soybeans is strong. FNQ production systems are well suited to growing in rotation with sugarcane given it is a legume
· There is substantial potential for Australia to capture a niche market by capitalising on the demand driven from Asian markets that traditionally consume high volumes of soy in their diets, particularly China, Japan, Indonesia and India.
· There are numerous value-adding opportunities in the soy product market as soybean can be transformed into tofu, soy meal and noodles

Far North Queensland Agricultural Supply Chain Study | 46
© 2020 KPMG, an Australian partnership and a member firm of the KPMG network of independent member firms affiliated with KPMG International Cooperative (“KPMG International”), a Swiss entity. All rights reserved. Printed in Australia. KPMG and the KPMG logo are registered trademarks of KPMG International. Liability limited by a scheme approved under Professional Standards Legislation.
4. Seafood and aquaculture
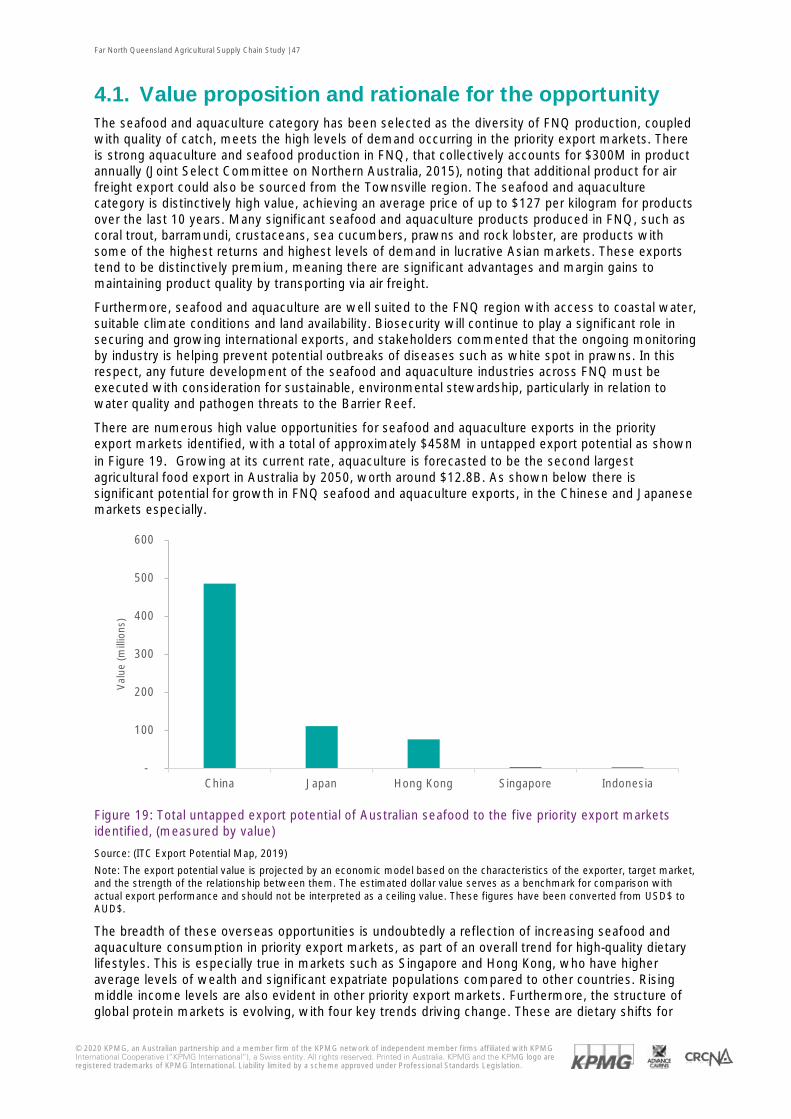
Far North Queensland Agricultural Supply Chain Study | 47
© 2020 KPMG, an Australian partnership and a member firm of the KPMG network of independent member firms affiliated with KPMG International Cooperative (“KPMG International”), a Swiss entity. All rights reserved. Printed in Australia. KPMG and the KPMG logo are registered trademarks of KPMG International. Liability limited by a scheme approved under Professional Standards Legislation.
4.1. Value proposition and rationale for the opportunity The seafood and aquaculture category has been selected as the diversity of FNQ production, coupled with quality of catch, meets the high levels of demand occurring in the priority export markets. There is strong aquaculture and seafood production in FNQ, that collectively accounts for $300M in product annually (Joint Select Committee on Northern Australia, 2015), noting that additional product for air freight export could also be sourced from the Townsville region. The seafood and aquaculture category is distinctively high value, achieving an average price of up to $127 per kilogram for products over the last 10 years. Many significant seafood and aquaculture products produced in FNQ, such as coral trout, barramundi, crustaceans, sea cucumbers, prawns and rock lobster, are products with some of the highest returns and highest levels of demand in lucrative Asian markets. These exports tend to be distinctively premium, meaning there are significant advantages and margin gains to maintaining product quality by transporting via air freight.
Furthermore, seafood and aquaculture are well suited to the FNQ region with access to coastal water, suitable climate conditions and land availability. Biosecurity will continue to play a significant role in securing and growing international exports, and stakeholders commented that the ongoing monitoring by industry is helping prevent potential outbreaks of diseases such as white spot in prawns. In this respect, any future development of the seafood and aquaculture industries across FNQ must be executed with consideration for sustainable, environmental stewardship, particularly in relation to water quality and pathogen threats to the Barrier Reef.
There are numerous high value opportunities for seafood and aquaculture exports in the priority export markets identified, with a total of approximately $458M in untapped export potential as shown in Figure 19. Growing at its current rate, aquaculture is forecasted to be the second largest agricultural food export in Australia by 2050, worth around $12.8B. As shown below there is significant potential for growth in FNQ seafood and aquaculture exports, in the Chinese and Japanese markets especially.
Figure 19: Total untapped export potential of Australian seafood to the five priority export markets identified, (measured by value)
Source: (ITC Export Potential Map, 2019)
Note: The export potential value is projected by an economic model based on the characteristics of the exporter, target market, and the strength of the relationship between them. The estimated dollar value serves as a benchmark for comparison with actual export performance and should not be interpreted as a ceiling value. These figures have been converted from USD$ to AUD$.
The breadth of these overseas opportunities is undoubtedly a reflection of increasing seafood and aquaculture consumption in priority export markets, as part of an overall trend for high-quality dietary lifestyles. This is especially true in markets such as Singapore and Hong Kong, who have higher average levels of wealth and significant expatriate populations compared to other countries. Rising middle income levels are also evident in other priority export markets. Furthermore, the structure of global protein markets is evolving, with four key trends driving change. These are dietary shifts for
-
100
200
300
400
500
600
China Japan Hong Kong Singapore Indonesia
Val
ue (m
illio
ns)
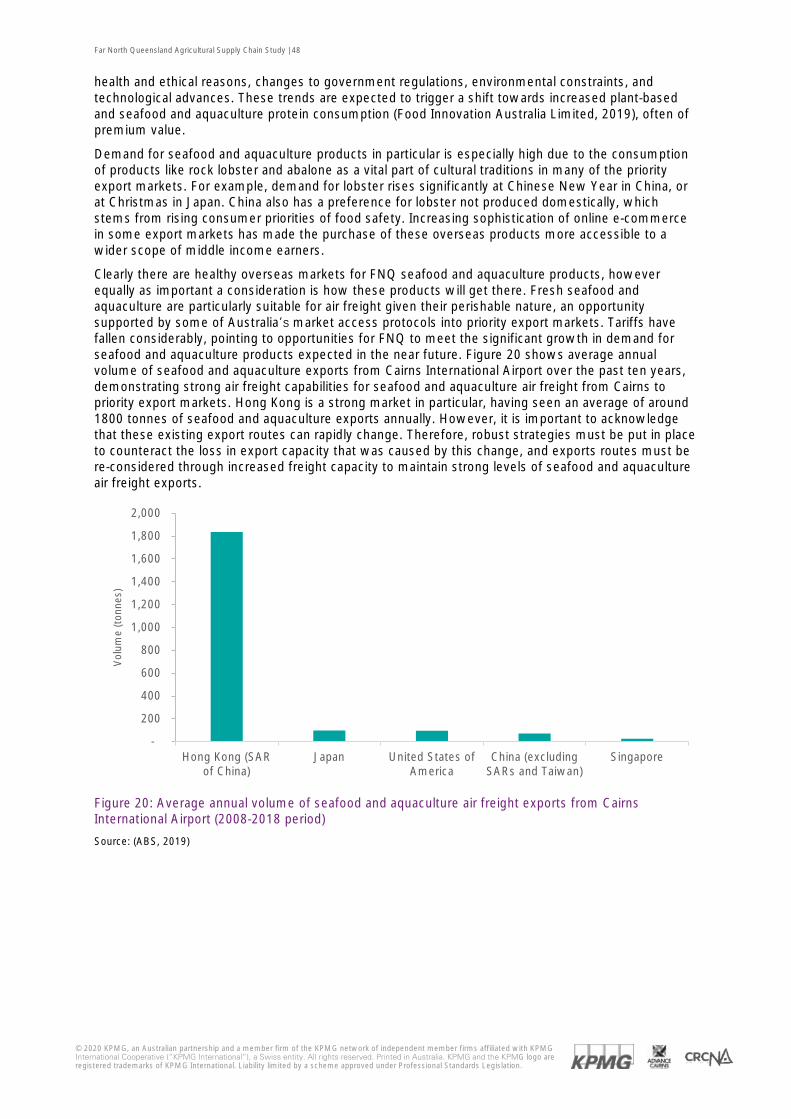
Far North Queensland Agricultural Supply Chain Study | 48
© 2020 KPMG, an Australian partnership and a member firm of the KPMG network of independent member firms affiliated with KPMG International Cooperative (“KPMG International”), a Swiss entity. All rights reserved. Printed in Australia. KPMG and the KPMG logo are registered trademarks of KPMG International. Liability limited by a scheme approved under Professional Standards Legislation.
health and ethical reasons, changes to government regulations, environmental constraints, and technological advances. These trends are expected to trigger a shift towards increased plant-based and seafood and aquaculture protein consumption (Food Innovation Australia Limited, 2019), often of premium value.
Demand for seafood and aquaculture products in particular is especially high due to the consumption of products like rock lobster and abalone as a vital part of cultural traditions in many of the priority export markets. For example, demand for lobster rises significantly at Chinese New Year in China, or at Christmas in Japan. China also has a preference for lobster not produced domestically, which stems from rising consumer priorities of food safety. Increasing sophistication of online e-commerce in some export markets has made the purchase of these overseas products more accessible to a wider scope of middle income earners.
Clearly there are healthy overseas markets for FNQ seafood and aquaculture products, however equally as important a consideration is how these products will get there. Fresh seafood and aquaculture are particularly suitable for air freight given their perishable nature, an opportunity supported by some of Australia’s market access protocols into priority export markets. Tariffs have fallen considerably, pointing to opportunities for FNQ to meet the significant growth in demand for seafood and aquaculture products expected in the near future. Figure 20 shows average annual volume of seafood and aquaculture exports from Cairns International Airport over the past ten years, demonstrating strong air freight capabilities for seafood and aquaculture air freight from Cairns to priority export markets. Hong Kong is a strong market in particular, having seen an average of around 1800 tonnes of seafood and aquaculture exports annually. However, it is important to acknowledge that these existing export routes can rapidly change. Therefore, robust strategies must be put in place to counteract the loss in export capacity that was caused by this change, and exports routes must be re-considered through increased freight capacity to maintain strong levels of seafood and aquaculture air freight exports.
Figure 20: Average annual volume of seafood and aquaculture air freight exports from Cairns International Airport (2008-2018 period)
Source: (ABS, 2019)
-
200
400
600
800
1,000
1,200
1,400
1,600
1,800
2,000
Hong Kong (SARof China)
Japan United States ofAmerica
China (excludingSARs and Taiwan)
Singapore
Vol
ume
(ton
nes)
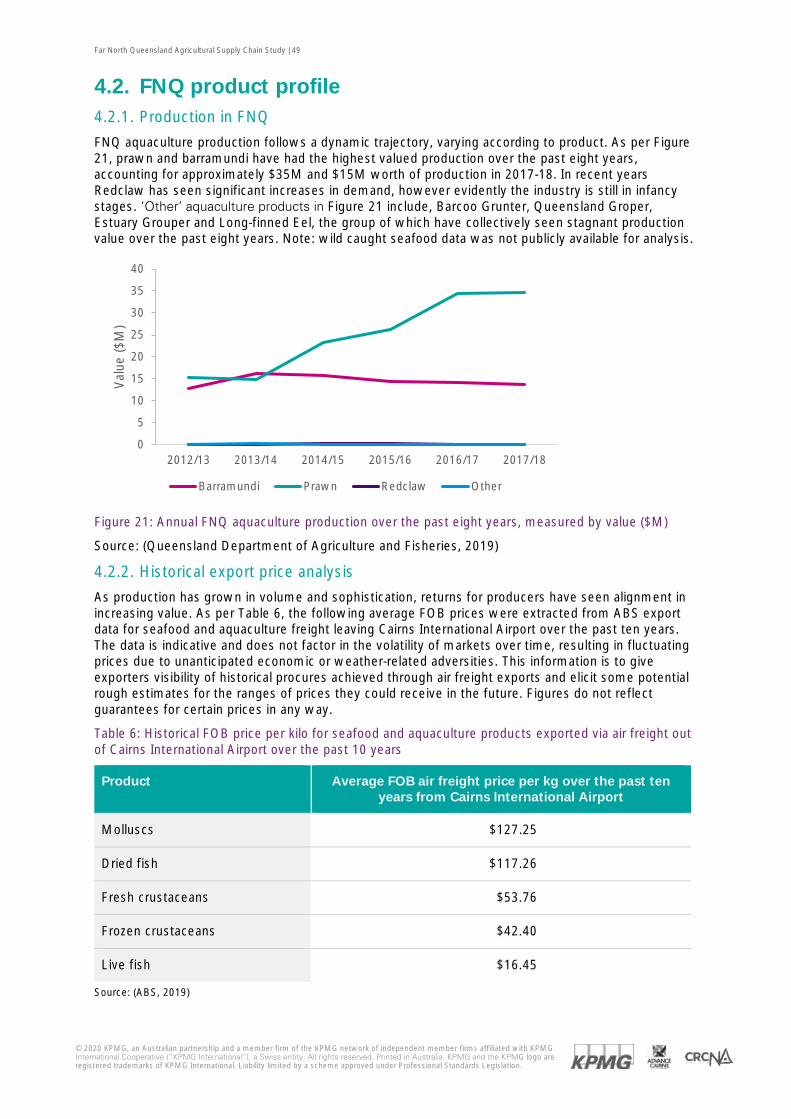
Far North Queensland Agricultural Supply Chain Study | 49
© 2020 KPMG, an Australian partnership and a member firm of the KPMG network of independent member firms affiliated with KPMG International Cooperative (“KPMG International”), a Swiss entity. All rights reserved. Printed in Australia. KPMG and the KPMG logo are registered trademarks of KPMG International. Liability limited by a scheme approved under Professional Standards Legislation.
4.2. FNQ product profile 4.2.1. Production in FNQ
FNQ aquaculture production follows a dynamic trajectory, varying according to product. As per Figure 21, prawn and barramundi have had the highest valued production over the past eight years, accounting for approximately $35M and $15M worth of production in 2017-18. In recent years Redclaw has seen significant increases in demand, however evidently the industry is still in infancy stages. ‘Other’ aquaculture products in Figure 21 include, Barcoo Grunter, Queensland Groper, Estuary Grouper and Long-finned Eel, the group of which have collectively seen stagnant production value over the past eight years. Note: wild caught seafood data was not publicly available for analysis.
Figure 21: Annual FNQ aquaculture production over the past eight years, measured by value ($M)
Source: (Queensland Department of Agriculture and Fisheries, 2019)
4.2.2. Historical export price analysis
As production has grown in volume and sophistication, returns for producers have seen alignment in increasing value. As per Table 6, the following average FOB prices were extracted from ABS export data for seafood and aquaculture freight leaving Cairns International Airport over the past ten years. The data is indicative and does not factor in the volatility of markets over time, resulting in fluctuating prices due to unanticipated economic or weather-related adversities. This information is to give exporters visibility of historical procures achieved through air freight exports and elicit some potential rough estimates for the ranges of prices they could receive in the future. Figures do not reflect guarantees for certain prices in any way.
Table 6: Historical FOB price per kilo for seafood and aquaculture products exported via air freight out of Cairns International Airport over the past 10 years
Product Average FOB air freight price per kg over the past ten years from Cairns International Airport
Molluscs $127.25
Dried fish $117.26
Fresh crustaceans $53.76
Frozen crustaceans $42.40
Live fish $16.45
Source: (ABS, 2019)
0
5
10
15
20
25
30
35
40
2012/13 2013/14 2014/15 2015/16 2016/17 2017/18
Val
ue ($
M)
Barramundi Prawn Redclaw Other
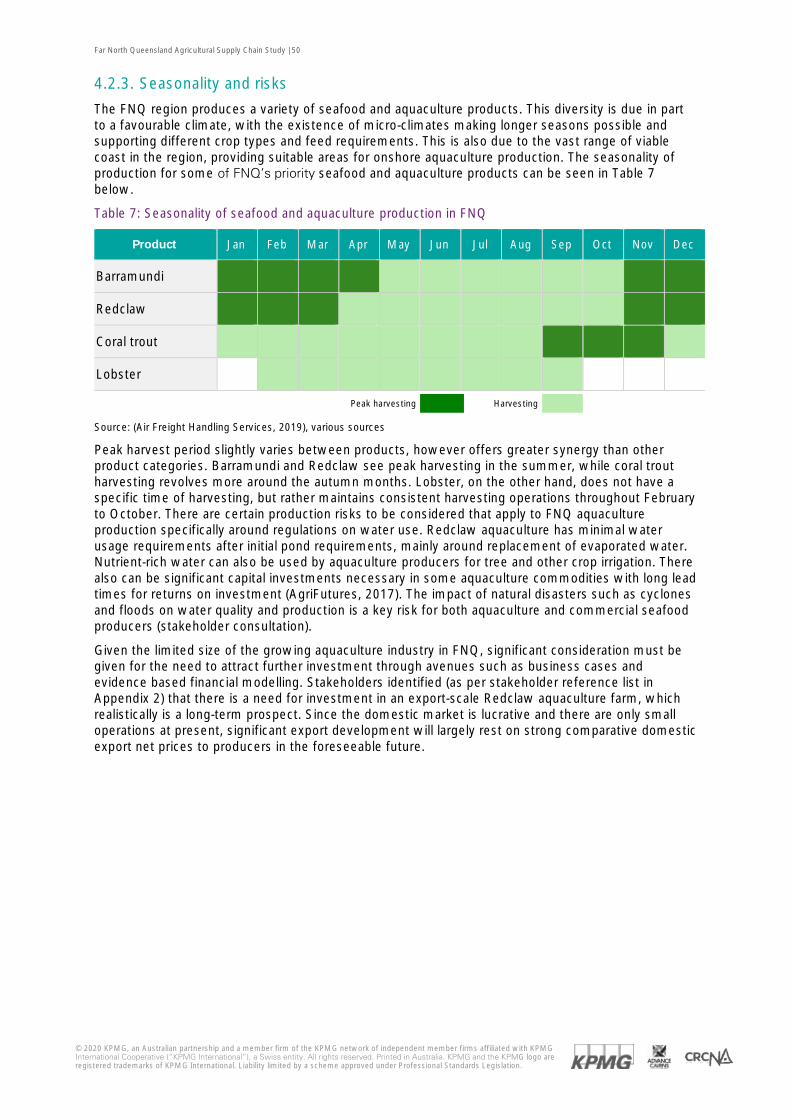
Far North Queensland Agricultural Supply Chain Study | 50
© 2020 KPMG, an Australian partnership and a member firm of the KPMG network of independent member firms affiliated with KPMG International Cooperative (“KPMG International”), a Swiss entity. All rights reserved. Printed in Australia. KPMG and the KPMG logo are registered trademarks of KPMG International. Liability limited by a scheme approved under Professional Standards Legislation.
4.2.3. Seasonality and risks
The FNQ region produces a variety of seafood and aquaculture products. This diversity is due in part to a favourable climate, with the existence of micro-climates making longer seasons possible and supporting different crop types and feed requirements. This is also due to the vast range of viable coast in the region, providing suitable areas for onshore aquaculture production. The seasonality of production for some of FNQ’s priority seafood and aquaculture products can be seen in Table 7 below.
Table 7: Seasonality of seafood and aquaculture production in FNQ
Product Jan Feb Mar Apr May Jun Jul Aug Sep Oct Nov Dec
Barramundi
Redclaw
Coral trout
Lobster
Peak harvesting Harvesting
Source: (Air Freight Handling Services, 2019), various sources
Peak harvest period slightly varies between products, however offers greater synergy than other product categories. Barramundi and Redclaw see peak harvesting in the summer, while coral trout harvesting revolves more around the autumn months. Lobster, on the other hand, does not have a specific time of harvesting, but rather maintains consistent harvesting operations throughout February to October. There are certain production risks to be considered that apply to FNQ aquaculture production specifically around regulations on water use. Redclaw aquaculture has minimal water usage requirements after initial pond requirements, mainly around replacement of evaporated water. Nutrient-rich water can also be used by aquaculture producers for tree and other crop irrigation. There also can be significant capital investments necessary in some aquaculture commodities with long lead times for returns on investment (AgriFutures, 2017). The impact of natural disasters such as cyclones and floods on water quality and production is a key risk for both aquaculture and commercial seafood producers (stakeholder consultation).
Given the limited size of the growing aquaculture industry in FNQ, significant consideration must be given for the need to attract further investment through avenues such as business cases and evidence based financial modelling. Stakeholders identified (as per stakeholder reference list in Appendix 2) that there is a need for investment in an export-scale Redclaw aquaculture farm, which realistically is a long-term prospect. Since the domestic market is lucrative and there are only small operations at present, significant export development will largely rest on strong comparative domestic export net prices to producers in the foreseeable future.
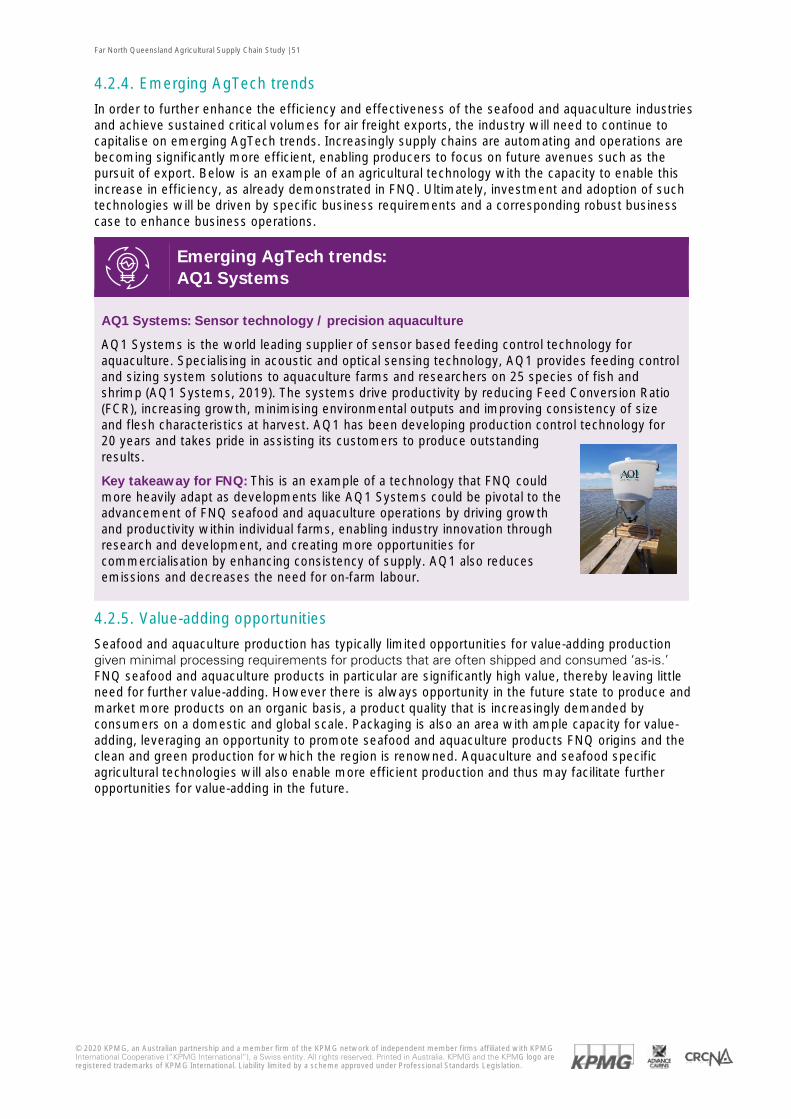
Far North Queensland Agricultural Supply Chain Study | 51
© 2020 KPMG, an Australian partnership and a member firm of the KPMG network of independent member firms affiliated with KPMG International Cooperative (“KPMG International”), a Swiss entity. All rights reserved. Printed in Australia. KPMG and the KPMG logo are registered trademarks of KPMG International. Liability limited by a scheme approved under Professional Standards Legislation.
4.2.4. Emerging AgTech trends
In order to further enhance the efficiency and effectiveness of the seafood and aquaculture industries and achieve sustained critical volumes for air freight exports, the industry will need to continue to capitalise on emerging AgTech trends. Increasingly supply chains are automating and operations are becoming significantly more efficient, enabling producers to focus on future avenues such as the pursuit of export. Below is an example of an agricultural technology with the capacity to enable this increase in efficiency, as already demonstrated in FNQ. Ultimately, investment and adoption of such technologies will be driven by specific business requirements and a corresponding robust business case to enhance business operations.
Emerging AgTech trends: AQ1 Systems
AQ1 Systems: Sensor technology / precision aquaculture
AQ1 Systems is the world leading supplier of sensor based feeding control technology for aquaculture. Specialising in acoustic and optical sensing technology, AQ1 provides feeding control and sizing system solutions to aquaculture farms and researchers on 25 species of fish and shrimp (AQ1 Systems, 2019). The systems drive productivity by reducing Feed Conversion Ratio (FCR), increasing growth, minimising environmental outputs and improving consistency of size and flesh characteristics at harvest. AQ1 has been developing production control technology for 20 years and takes pride in assisting its customers to produce outstanding results.
Key takeaway for FNQ: This is an example of a technology that FNQ could more heavily adapt as developments like AQ1 Systems could be pivotal to the advancement of FNQ seafood and aquaculture operations by driving growth and productivity within individual farms, enabling industry innovation through research and development, and creating more opportunities for commercialisation by enhancing consistency of supply. AQ1 also reduces emissions and decreases the need for on-farm labour.
4.2.5. Value-adding opportunities
Seafood and aquaculture production has typically limited opportunities for value-adding production given minimal processing requirements for products that are often shipped and consumed ‘as-is.’ FNQ seafood and aquaculture products in particular are significantly high value, thereby leaving little need for further value-adding. However there is always opportunity in the future state to produce and market more products on an organic basis, a product quality that is increasingly demanded by consumers on a domestic and global scale. Packaging is also an area with ample capacity for value-adding, leveraging an opportunity to promote seafood and aquaculture products FNQ origins and the clean and green production for which the region is renowned. Aquaculture and seafood specific agricultural technologies will also enable more efficient production and thus may facilitate further opportunities for value-adding in the future.
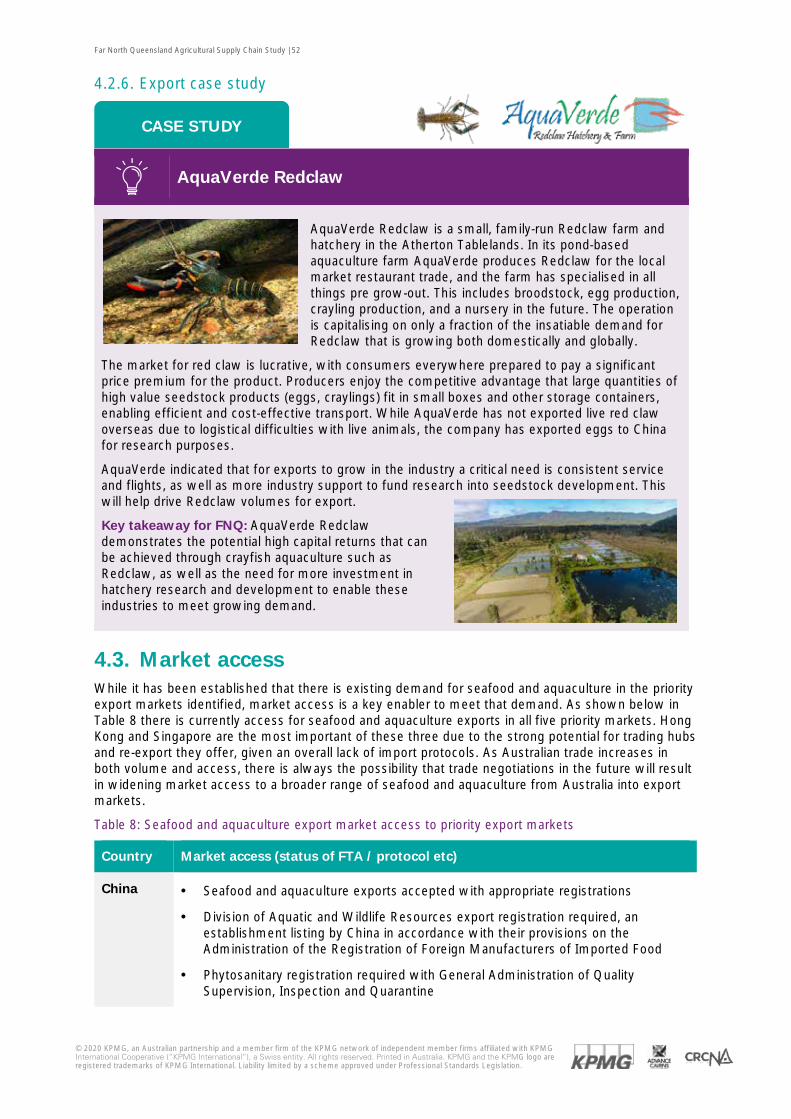
Far North Queensland Agricultural Supply Chain Study | 52
© 2020 KPMG, an Australian partnership and a member firm of the KPMG network of independent member firms affiliated with KPMG International Cooperative (“KPMG International”), a Swiss entity. All rights reserved. Printed in Australia. KPMG and the KPMG logo are registered trademarks of KPMG International. Liability limited by a scheme approved under Professional Standards Legislation.
4.2.6. Export case study
AquaVerde Redclaw
AquaVerde Redclaw is a small, family-run Redclaw farm and hatchery in the Atherton Tablelands. In its pond-based aquaculture farm AquaVerde produces Redclaw for the local market restaurant trade, and the farm has specialised in all things pre grow-out. This includes broodstock, egg production, crayling production, and a nursery in the future. The operation is capitalising on only a fraction of the insatiable demand for Redclaw that is growing both domestically and globally.
The market for red claw is lucrative, with consumers everywhere prepared to pay a significant price premium for the product. Producers enjoy the competitive advantage that large quantities of high value seedstock products (eggs, craylings) fit in small boxes and other storage containers, enabling efficient and cost-effective transport. While AquaVerde has not exported live red claw overseas due to logistical difficulties with live animals, the company has exported eggs to China for research purposes.
AquaVerde indicated that for exports to grow in the industry a critical need is consistent service and flights, as well as more industry support to fund research into seedstock development. This will help drive Redclaw volumes for export.
Key takeaway for FNQ: AquaVerde Redclaw demonstrates the potential high capital returns that can be achieved through crayfish aquaculture such as Redclaw, as well as the need for more investment in hatchery research and development to enable these industries to meet growing demand.
4.3. Market access While it has been established that there is existing demand for seafood and aquaculture in the priority export markets identified, market access is a key enabler to meet that demand. As shown below in Table 8 there is currently access for seafood and aquaculture exports in all five priority markets. Hong Kong and Singapore are the most important of these three due to the strong potential for trading hubs and re-export they offer, given an overall lack of import protocols. As Australian trade increases in both volume and access, there is always the possibility that trade negotiations in the future will result in widening market access to a broader range of seafood and aquaculture from Australia into export markets.
Table 8: Seafood and aquaculture export market access to priority export markets
Country Market access (status of FTA / protocol etc)
China · Seafood and aquaculture exports accepted with appropriate registrations
· Division of Aquatic and Wildlife Resources export registration required, an establishment listing by China in accordance with their provisions on the Administration of the Registration of Foreign Manufacturers of Imported Food
· Phytosanitary registration required with General Administration of Quality Supervision, Inspection and Quarantine
CASE STUDY
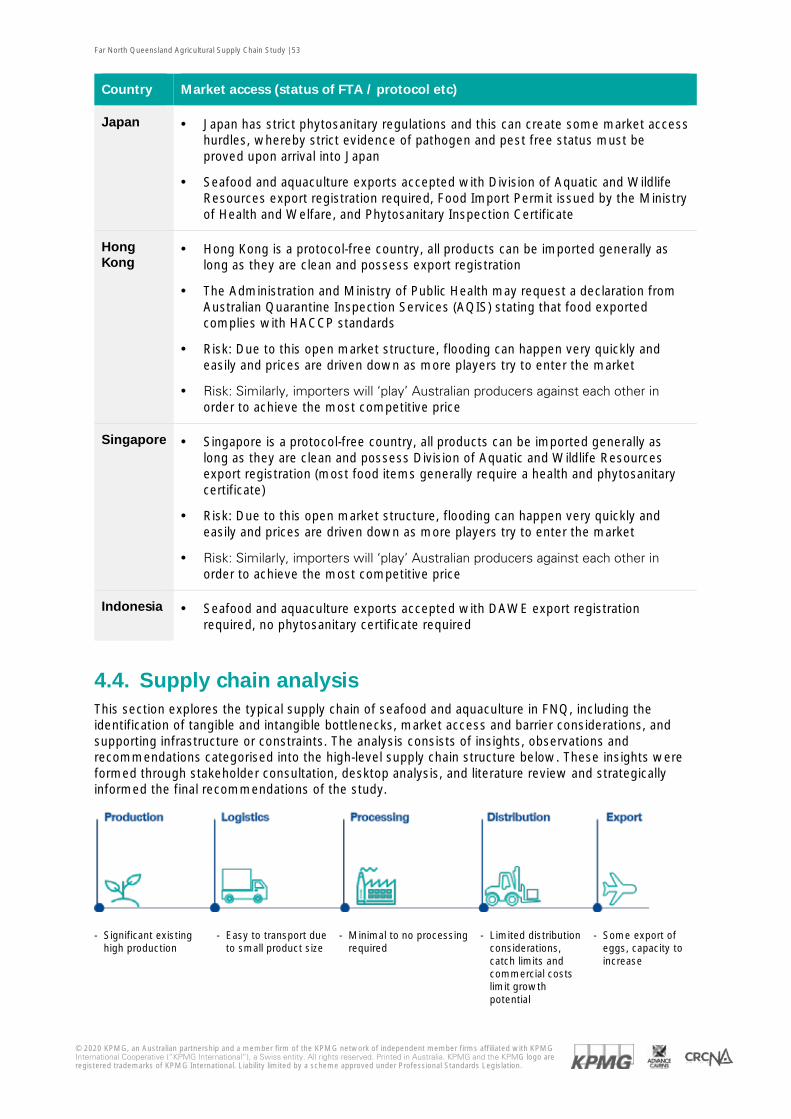
Far North Queensland Agricultural Supply Chain Study | 53
© 2020 KPMG, an Australian partnership and a member firm of the KPMG network of independent member firms affiliated with KPMG International Cooperative (“KPMG International”), a Swiss entity. All rights reserved. Printed in Australia. KPMG and the KPMG logo are registered trademarks of KPMG International. Liability limited by a scheme approved under Professional Standards Legislation.
Country Market access (status of FTA / protocol etc)
Japan · Japan has strict phytosanitary regulations and this can create some market access hurdles, whereby strict evidence of pathogen and pest free status must be proved upon arrival into Japan
· Seafood and aquaculture exports accepted with Division of Aquatic and Wildlife Resources export registration required, Food Import Permit issued by the Ministry of Health and Welfare, and Phytosanitary Inspection Certificate
Hong Kong
· Hong Kong is a protocol-free country, all products can be imported generally as long as they are clean and possess export registration
· The Administration and Ministry of Public Health may request a declaration from Australian Quarantine Inspection Services (AQIS) stating that food exported complies with HACCP standards
· Risk: Due to this open market structure, flooding can happen very quickly and easily and prices are driven down as more players try to enter the market
· Risk: Similarly, importers will ‘play’ Australian producers against each other in order to achieve the most competitive price
Singapore · Singapore is a protocol-free country, all products can be imported generally as long as they are clean and possess Division of Aquatic and Wildlife Resources export registration (most food items generally require a health and phytosanitary certificate)
· Risk: Due to this open market structure, flooding can happen very quickly and easily and prices are driven down as more players try to enter the market
· Risk: Similarly, importers will ‘play’ Australian producers against each other in order to achieve the most competitive price
Indonesia · Seafood and aquaculture exports accepted with DAWE export registration required, no phytosanitary certificate required
4.4. Supply chain analysis This section explores the typical supply chain of seafood and aquaculture in FNQ, including the identification of tangible and intangible bottlenecks, market access and barrier considerations, and supporting infrastructure or constraints. The analysis consists of insights, observations and recommendations categorised into the high-level supply chain structure below. These insights were formed through stakeholder consultation, desktop analysis, and literature review and strategically informed the final recommendations of the study.
- Significant existing high production
- Easy to transport due to small product size
- Minimal to no processing required
- Limited distribution considerations, catch limits and commercial costs limit growth potential
- Some export of eggs, capacity to increase
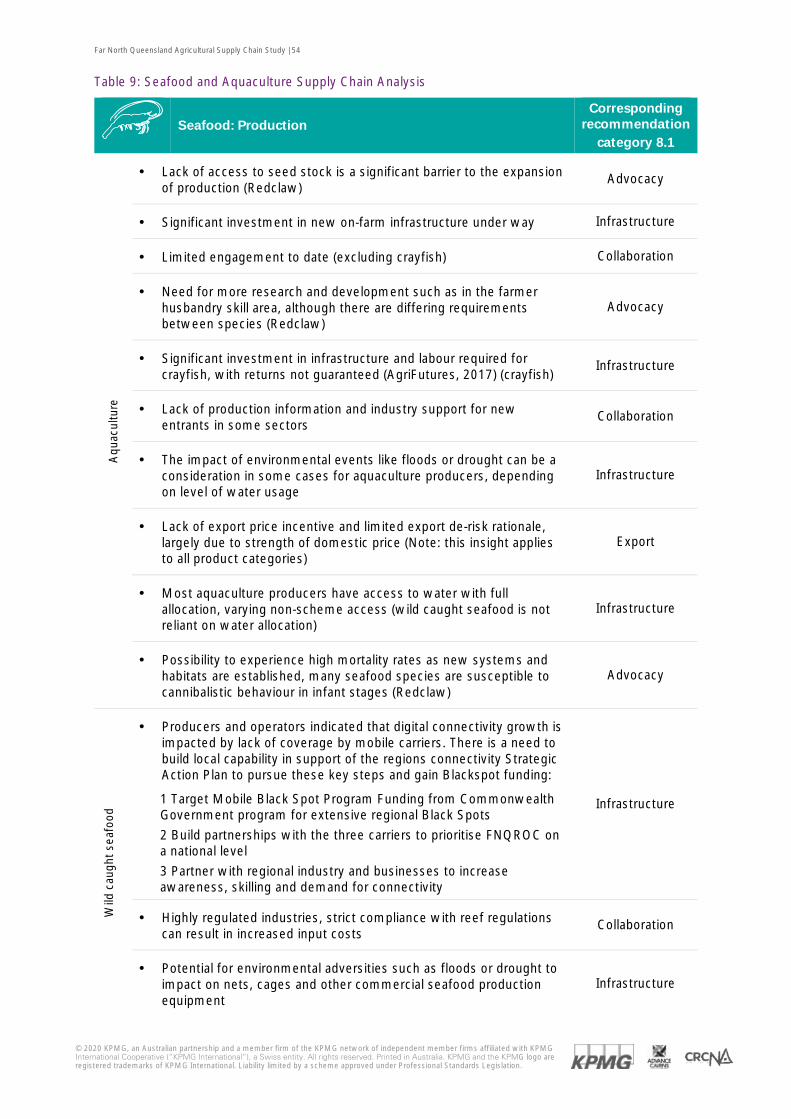
Far North Queensland Agricultural Supply Chain Study | 54
© 2020 KPMG, an Australian partnership and a member firm of the KPMG network of independent member firms affiliated with KPMG International Cooperative (“KPMG International”), a Swiss entity. All rights reserved. Printed in Australia. KPMG and the KPMG logo are registered trademarks of KPMG International. Liability limited by a scheme approved under Professional Standards Legislation.
Table 9: Seafood and Aquaculture Supply Chain Analysis
Seafood: Production
Corresponding recommendation
category 8.1
Aqu
acul
ture
· Lack of access to seed stock is a significant barrier to the expansion of production (Redclaw)
Advocacy
· Significant investment in new on-farm infrastructure under way Infrastructure
· Limited engagement to date (excluding crayfish) Collaboration
· Need for more research and development such as in the farmer husbandry skill area, although there are differing requirements between species (Redclaw)
Advocacy
· Significant investment in infrastructure and labour required for crayfish, with returns not guaranteed (AgriFutures, 2017) (crayfish)
Infrastructure
· Lack of production information and industry support for new entrants in some sectors
Collaboration
· The impact of environmental events like floods or drought can be a consideration in some cases for aquaculture producers, depending on level of water usage
Infrastructure
· Lack of export price incentive and limited export de-risk rationale, largely due to strength of domestic price (Note: this insight applies to all product categories)
Export
· Most aquaculture producers have access to water with full allocation, varying non-scheme access (wild caught seafood is not reliant on water allocation)
Infrastructure
· Possibility to experience high mortality rates as new systems and habitats are established, many seafood species are susceptible to cannibalistic behaviour in infant stages (Redclaw)
Advocacy
Wild
cau
ght s
eafo
od
· Producers and operators indicated that digital connectivity growth is impacted by lack of coverage by mobile carriers. There is a need to build local capability in support of the regions connectivity Strategic Action Plan to pursue these key steps and gain Blackspot funding:
1 Target Mobile Black Spot Program Funding from Commonwealth Government program for extensive regional Black Spots
2 Build partnerships with the three carriers to prioritise FNQROC on a national level
3 Partner with regional industry and businesses to increase awareness, skilling and demand for connectivity
Infrastructure
· Highly regulated industries, strict compliance with reef regulations can result in increased input costs
Collaboration
· Potential for environmental adversities such as floods or drought to impact on nets, cages and other commercial seafood production equipment
Infrastructure
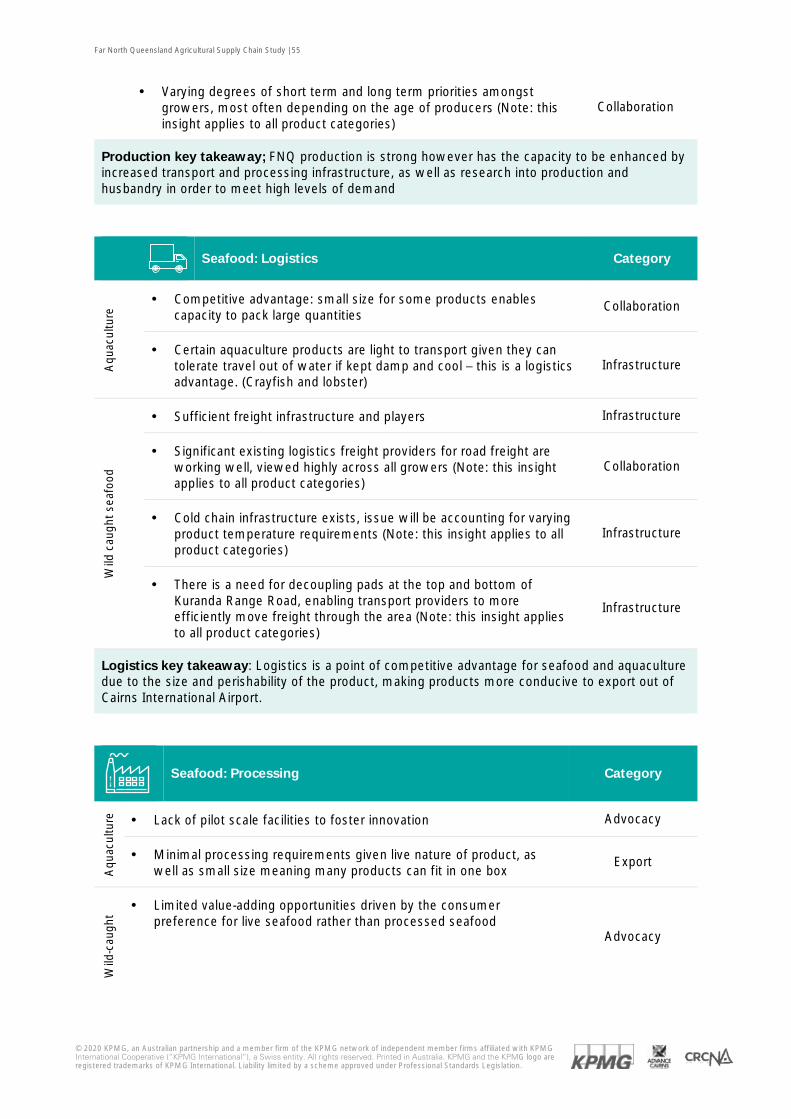
Far North Queensland Agricultural Supply Chain Study | 55
© 2020 KPMG, an Australian partnership and a member firm of the KPMG network of independent member firms affiliated with KPMG International Cooperative (“KPMG International”), a Swiss entity. All rights reserved. Printed in Australia. KPMG and the KPMG logo are registered trademarks of KPMG International. Liability limited by a scheme approved under Professional Standards Legislation.
· Varying degrees of short term and long term priorities amongst growers, most often depending on the age of producers (Note: this insight applies to all product categories)
Collaboration
Production key takeaway; FNQ production is strong however has the capacity to be enhanced by increased transport and processing infrastructure, as well as research into production and husbandry in order to meet high levels of demand
Seafood: Logistics Category
Aqu
acul
ture
· Competitive advantage: small size for some products enables capacity to pack large quantities
Collaboration
· Certain aquaculture products are light to transport given they can tolerate travel out of water if kept damp and cool – this is a logistics advantage. (Crayfish and lobster)
Infrastructure
Wild
cau
ght s
eafo
od
· Sufficient freight infrastructure and players Infrastructure
· Significant existing logistics freight providers for road freight are working well, viewed highly across all growers (Note: this insight applies to all product categories)
Collaboration
· Cold chain infrastructure exists, issue will be accounting for varying product temperature requirements (Note: this insight applies to all product categories)
Infrastructure
· There is a need for decoupling pads at the top and bottom of Kuranda Range Road, enabling transport providers to more efficiently move freight through the area (Note: this insight applies to all product categories)
Infrastructure
Logistics key takeaway: Logistics is a point of competitive advantage for seafood and aquaculture due to the size and perishability of the product, making products more conducive to export out of Cairns International Airport.
Seafood: Processing Category
Aqu
acul
ture
· Lack of pilot scale facilities to foster innovation Advocacy
· Minimal processing requirements given live nature of product, as well as small size meaning many products can fit in one box
Export
Wild
-cau
ght
· Limited value-adding opportunities driven by the consumer preference for live seafood rather than processed seafood
Advocacy
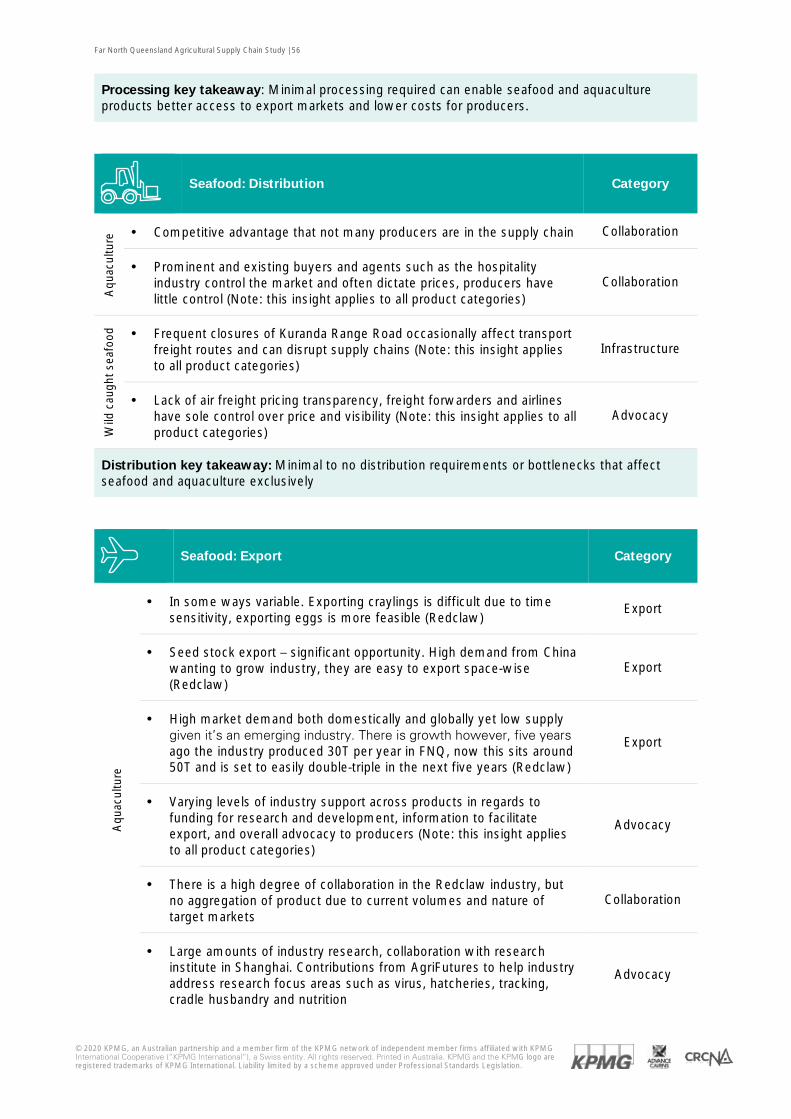
Far North Queensland Agricultural Supply Chain Study | 56
© 2020 KPMG, an Australian partnership and a member firm of the KPMG network of independent member firms affiliated with KPMG International Cooperative (“KPMG International”), a Swiss entity. All rights reserved. Printed in Australia. KPMG and the KPMG logo are registered trademarks of KPMG International. Liability limited by a scheme approved under Professional Standards Legislation.
Processing key takeaway: Minimal processing required can enable seafood and aquaculture products better access to export markets and lower costs for producers.
Seafood: Distribution Category
Aqu
acul
ture
· Competitive advantage that not many producers are in the supply chain Collaboration
· Prominent and existing buyers and agents such as the hospitality industry control the market and often dictate prices, producers have little control (Note: this insight applies to all product categories)
Collaboration
Wild
cau
ght s
eafo
od
· Frequent closures of Kuranda Range Road occasionally affect transport freight routes and can disrupt supply chains (Note: this insight applies to all product categories)
Infrastructure
· Lack of air freight pricing transparency, freight forwarders and airlines have sole control over price and visibility (Note: this insight applies to all product categories)
Advocacy
Distribution key takeaway: Minimal to no distribution requirements or bottlenecks that affect seafood and aquaculture exclusively
Seafood: Export Category
Aqu
acul
ture
· In some ways variable. Exporting craylings is difficult due to time sensitivity, exporting eggs is more feasible (Redclaw)
Export
· Seed stock export – significant opportunity. High demand from China wanting to grow industry, they are easy to export space-wise (Redclaw)
Export
· High market demand both domestically and globally yet low supply given it’s an emerging industry. There is growth however, five years ago the industry produced 30T per year in FNQ, now this sits around 50T and is set to easily double-triple in the next five years (Redclaw)
Export
· Varying levels of industry support across products in regards to funding for research and development, information to facilitate export, and overall advocacy to producers (Note: this insight applies to all product categories)
Advocacy
· There is a high degree of collaboration in the Redclaw industry, but no aggregation of product due to current volumes and nature of target markets
Collaboration
· Large amounts of industry research, collaboration with research institute in Shanghai. Contributions from AgriFutures to help industry address research focus areas such as virus, hatcheries, tracking, cradle husbandry and nutrition
Advocacy
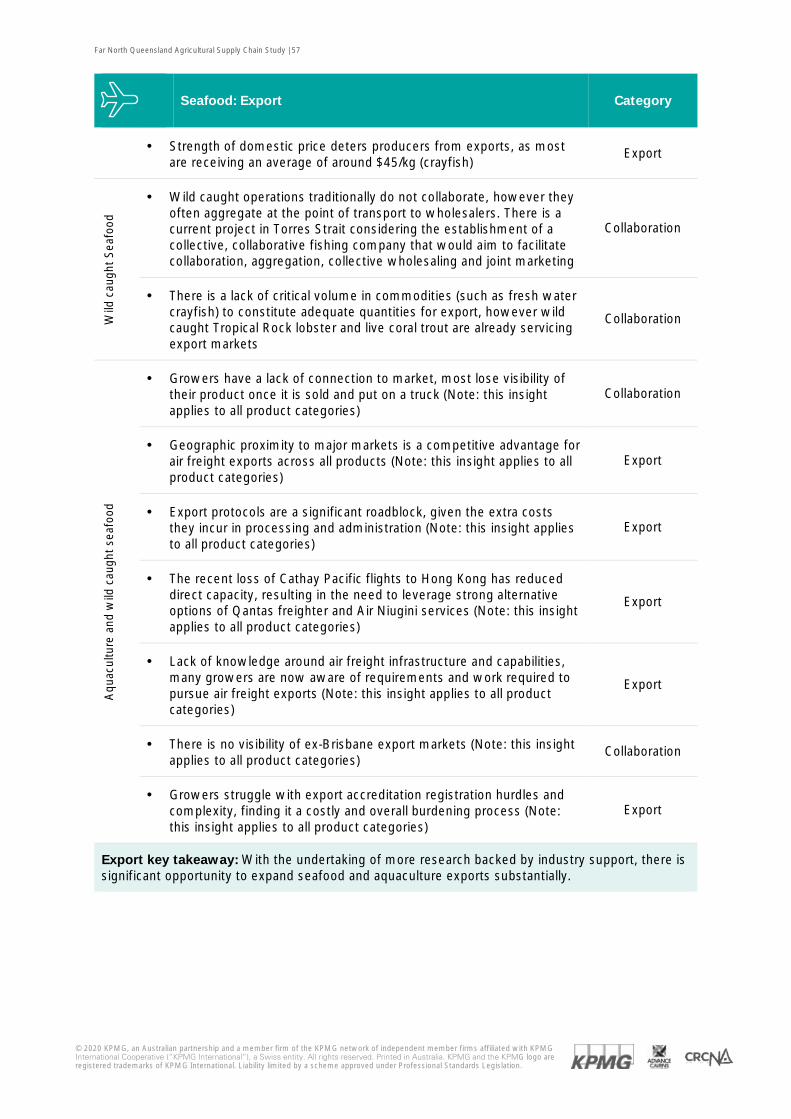
Far North Queensland Agricultural Supply Chain Study | 57
© 2020 KPMG, an Australian partnership and a member firm of the KPMG network of independent member firms affiliated with KPMG International Cooperative (“KPMG International”), a Swiss entity. All rights reserved. Printed in Australia. KPMG and the KPMG logo are registered trademarks of KPMG International. Liability limited by a scheme approved under Professional Standards Legislation.
Seafood: Export Category
· Strength of domestic price deters producers from exports, as most are receiving an average of around $45/kg (crayfish)
Export
Wild
cau
ght
Seaf
ood
· Wild caught operations traditionally do not collaborate, however they often aggregate at the point of transport to wholesalers. There is a current project in Torres Strait considering the establishment of a collective, collaborative fishing company that would aim to facilitate collaboration, aggregation, collective wholesaling and joint marketing
Collaboration
· There is a lack of critical volume in commodities (such as fresh water crayfish) to constitute adequate quantities for export, however wild caught Tropical Rock lobster and live coral trout are already servicing export markets
Collaboration
Aqu
acul
ture
and
wild
cau
ght
seaf
ood
· Growers have a lack of connection to market, most lose visibility of their product once it is sold and put on a truck (Note: this insight applies to all product categories)
Collaboration
· Geographic proximity to major markets is a competitive advantage for air freight exports across all products (Note: this insight applies to all product categories)
Export
· Export protocols are a significant roadblock, given the extra costs they incur in processing and administration (Note: this insight applies to all product categories)
Export
· The recent loss of Cathay Pacific flights to Hong Kong has reduced direct capacity, resulting in the need to leverage strong alternative options of Qantas freighter and Air Niugini services (Note: this insight applies to all product categories)
Export
· Lack of knowledge around air freight infrastructure and capabilities, many growers are now aware of requirements and work required to pursue air freight exports (Note: this insight applies to all product categories)
Export
· There is no visibility of ex-Brisbane export markets (Note: this insight applies to all product categories)
Collaboration
· Growers struggle with export accreditation registration hurdles and complexity, finding it a costly and overall burdening process (Note: this insight applies to all product categories)
Export
Export key takeaway: With the undertaking of more research backed by industry support, there is significant opportunity to expand seafood and aquaculture exports substantially.
Far North Queensland Agricultural Supply Chain Study | 58
© 2020 KPMG, an Australian partnership and a member firm of the KPMG network of independent member firms affiliated with KPMG International Cooperative (“KPMG International”), a Swiss entity. All rights reserved. Printed in Australia. KPMG and the KPMG logo are registered trademarks of KPMG International. Liability limited by a scheme approved under Professional Standards Legislation.
Seafood and aquaculture supply chain
key considerations and outcomes
· FNQ production is strong however has the capacity to be enhanced by increased infrastructure and research in order to meet high levels of demand
· Logistics is a point of competitive advantage for seafood and aquaculture due to the size and perishability of the product, making products more conducive to export out of Cairns International Airport
· Minimal processing required can enable seafood and aquaculture products better access to export markets and lower costs for producers
· Limited distribution considerations, catch limits and commercial costs limit growth potential
· With the undertaking of more research backed by industry support into areas such as breeding development or transport, there is significant opportunity to expand seafood and aquaculture exports substantially
· In summary, the supply chain for seafood and aquaculture is relatively streamlined and efficient but there is significant margin for improvement in regards to increasing supplies and driving exports
In-depth identification of current and future production of FNQ seafood and aquaculture, export and demand opportunities, value-adding production and supply chain analysis has informed several key strategic recommendations for the region. These are designed to enhance the industry and facilitate future diversification into high value production and export for a wider scope of producers and other supply chain participants. These recommendations can be found in section 8.

Far North Queensland Agricultural Supply Chain Study | 59
© 2020 KPMG, an Australian partnership and a member firm of the KPMG network of independent member firms affiliated with KPMG International Cooperative (“KPMG International”), a Swiss entity. All rights reserved. Printed in Australia. KPMG and the KPMG logo are registered trademarks of KPMG International. Liability limited by a scheme approved under Professional Standards Legislation.
5. Horticultural tree crops
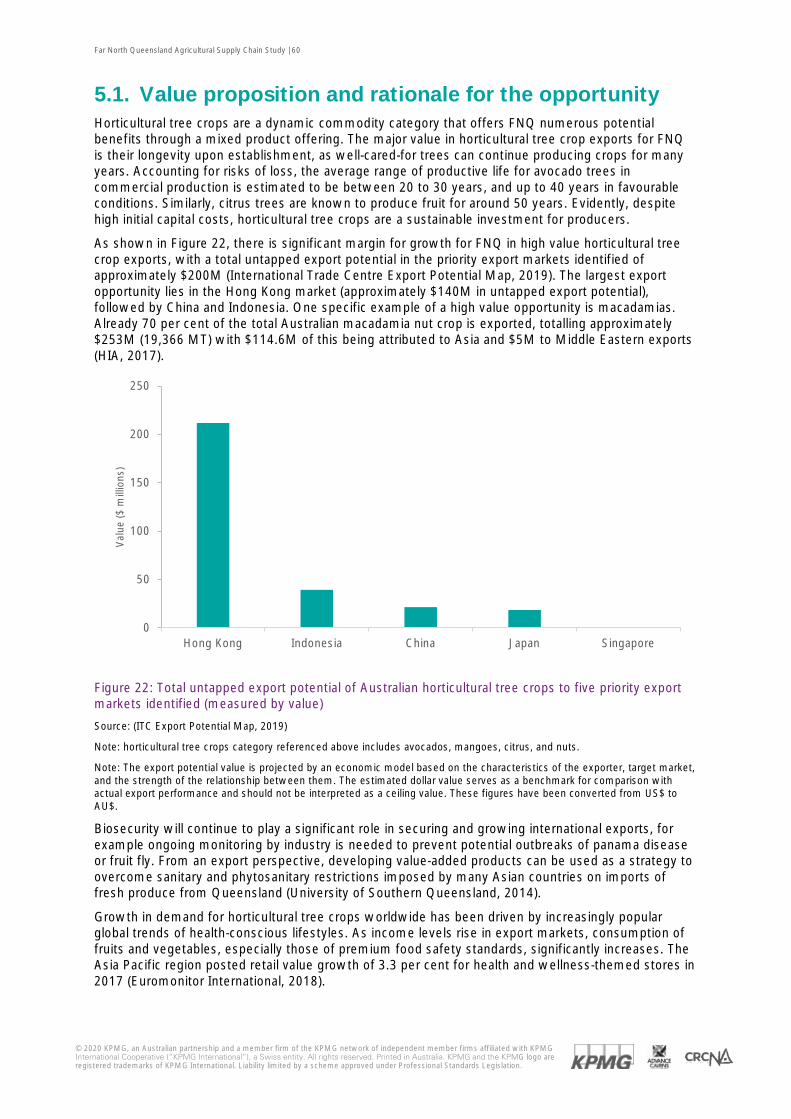
Far North Queensland Agricultural Supply Chain Study | 60
© 2020 KPMG, an Australian partnership and a member firm of the KPMG network of independent member firms affiliated with KPMG International Cooperative (“KPMG International”), a Swiss entity. All rights reserved. Printed in Australia. KPMG and the KPMG logo are registered trademarks of KPMG International. Liability limited by a scheme approved under Professional Standards Legislation.
5.1. Value proposition and rationale for the opportunity Horticultural tree crops are a dynamic commodity category that offers FNQ numerous potential benefits through a mixed product offering. The major value in horticultural tree crop exports for FNQ is their longevity upon establishment, as well-cared-for trees can continue producing crops for many years. Accounting for risks of loss, the average range of productive life for avocado trees in commercial production is estimated to be between 20 to 30 years, and up to 40 years in favourable conditions. Similarly, citrus trees are known to produce fruit for around 50 years. Evidently, despite high initial capital costs, horticultural tree crops are a sustainable investment for producers.
As shown in Figure 22, there is significant margin for growth for FNQ in high value horticultural tree crop exports, with a total untapped export potential in the priority export markets identified of approximately $200M (International Trade Centre Export Potential Map, 2019). The largest export opportunity lies in the Hong Kong market (approximately $140M in untapped export potential), followed by China and Indonesia. One specific example of a high value opportunity is macadamias. Already 70 per cent of the total Australian macadamia nut crop is exported, totalling approximately $253M (19,366 MT) with $114.6M of this being attributed to Asia and $5M to Middle Eastern exports (HIA, 2017).
Figure 22: Total untapped export potential of Australian horticultural tree crops to five priority export markets identified (measured by value)
Source: (ITC Export Potential Map, 2019)
Note: horticultural tree crops category referenced above includes avocados, mangoes, citrus, and nuts.
Note: The export potential value is projected by an economic model based on the characteristics of the exporter, target market, and the strength of the relationship between them. The estimated dollar value serves as a benchmark for comparison with actual export performance and should not be interpreted as a ceiling value. These figures have been converted from US$ to AU$.
Biosecurity will continue to play a significant role in securing and growing international exports, for example ongoing monitoring by industry is needed to prevent potential outbreaks of panama disease or fruit fly. From an export perspective, developing value-added products can be used as a strategy to overcome sanitary and phytosanitary restrictions imposed by many Asian countries on imports of fresh produce from Queensland (University of Southern Queensland, 2014).
Growth in demand for horticultural tree crops worldwide has been driven by increasingly popular global trends of health-conscious lifestyles. As income levels rise in export markets, consumption of fruits and vegetables, especially those of premium food safety standards, significantly increases. The Asia Pacific region posted retail value growth of 3.3 per cent for health and wellness-themed stores in 2017 (Euromonitor International, 2018).
0
50
100
150
200
250
Hong Kong Indonesia China Japan Singapore
Val
ue ($
mill
ions
)
Far North Queensland Agricultural Supply Chain Study | 61
© 2020 KPMG, an Australian partnership and a member firm of the KPMG network of independent member firms affiliated with KPMG International Cooperative (“KPMG International”), a Swiss entity. All rights reserved. Printed in Australia. KPMG and the KPMG logo are registered trademarks of KPMG International. Liability limited by a scheme approved under Professional Standards Legislation.
Avocados in particular have seen notable shifts in domestic demand, as by 2021 domestic demand for Australian avocados is forecasted to increase by at least 20 per cent (HIA, 2019). Domestic avocado consumption has been rapidly increasing in recent years, with Australians now eating 3.8kg of avocados per person per year (Avocados Australia, 2019). This surge in domestic demand has stimulated a monumental increase in production in recent years. From a supply perspective, avocado (Shepard and Hass) have been the fastest growing agriculture industry in North Queensland in the last 5 years. At present there is approximately 13,000 tonne per annum of production and the Australian avocado industry production is forecasted to double in the next decade, and as such the industry is now looking to grow export markets. Currently the majority of this production is absorbed into the domestic market but export is set to soon become an important component to the future of the avocado industry (Air Freight Handling Services, 2019). Export routes will give producers a secondary sales pathway to reduce risk from price reductions in the domestic Australian market. While currently 2.3 per cent of Australian-produced avocados are exported (DAWS, 2019), by 2021 over 10 per cent of avocado production will be sent to markets where customers have a willingness and capacity to pay a premium for Australian avocados (Avocados Australia, 2019).
Australian mangoes, which have seen a similarly large rise in production recently, are also in high demand from Asia. Currently around 10 per cent of Australian mangoes are exported (Australian Mangoes, 2019), and in its 2015-16 export plan Mangoes Australia indicated the capacity of the industry to more than double exports in the near future. Overseas consumers have a strong preference for the large, blush-coloured mangoes with a long shelf life that are typical of Australian production. Asian consumption is also rising due to increasing awareness of the fruit’s health benefits, with consumers readily prepared to pay a premium for the distinctive quality and flavour of Australian mangoes. Queensland mango imports have an advantage in overseas markets on a seasonal basis, given that the area has very little harvest overlap with other states. Together with the Northern Territory, Queensland is one of the only exporters able provide quality mangoes to Asian markets from around November to February depending on the variety of mango (Australian Mangoes, 2020). A major barrier toward mango exports is infrastructure, given mangoes often need to undergo VHT to adhere to the export protocols of importing markets. VHT facilities on the FNQ Atherton Tablelands do exist, and the opportunity to aggregate growers and fully leverage the capacity of such a facility should be explored. However, this is a challenge due to the private ownership structure of this infrastructure. Additionally, stakeholder consultation indicated that compliance costs and lack of critical product volumes in the area make it non-viable for private operators to offer fee-for-service usage of the facility.
The weakening of tariffs by priority export markets is also a contributing factor for increased demand for Australian horticultural tree crop exports, for example the Chinese Government has streamlined customs clearance requirements for several products (ABARES, 2019). Mangoes and avocados still have limited access to mainland China however this market should not be discounted as an opportunity for these exports in the medium to long term. Direct imports of Australian mangoes into China have been increasing in recent years, however grey trade via Hong Kong remains the dominant channel with an estimated 90% of Australian mangoes sold through this channel (CRCNA, 2019). Market access of avocados in particular is a point of competitive advantage in Indonesia, as Australia is one of few countries allowed to export avocado to major parts of the country and demand has been rising due to a growing middle class and western influence. Increasing market access and demand for premium products has also resulted in the rising of prices for horticultural tree crop exports, which have received prices up to $16.40 per kilo in some cases for products such as preserved fruit or $14.09 for fresh nuts (ABS, 2019).
As shown in Figure 23, there are existing markets for FNQ horticultural tree crop exports in the identified priority export markets. The most profitable of these have been Hong Kong and Japan, which have both received average annual imports of over 375 and 75 tonnes respectively over the last ten years. However it is important to note that exports to Hong Kong are distinctively high due to the fact that, as mentioned above, the majority of imports from Hong Kong traditionally enter China through cross-border trade. Avocado exports in particular have increased by 33 per cent since 2016-17 (TEL et al., 2019).
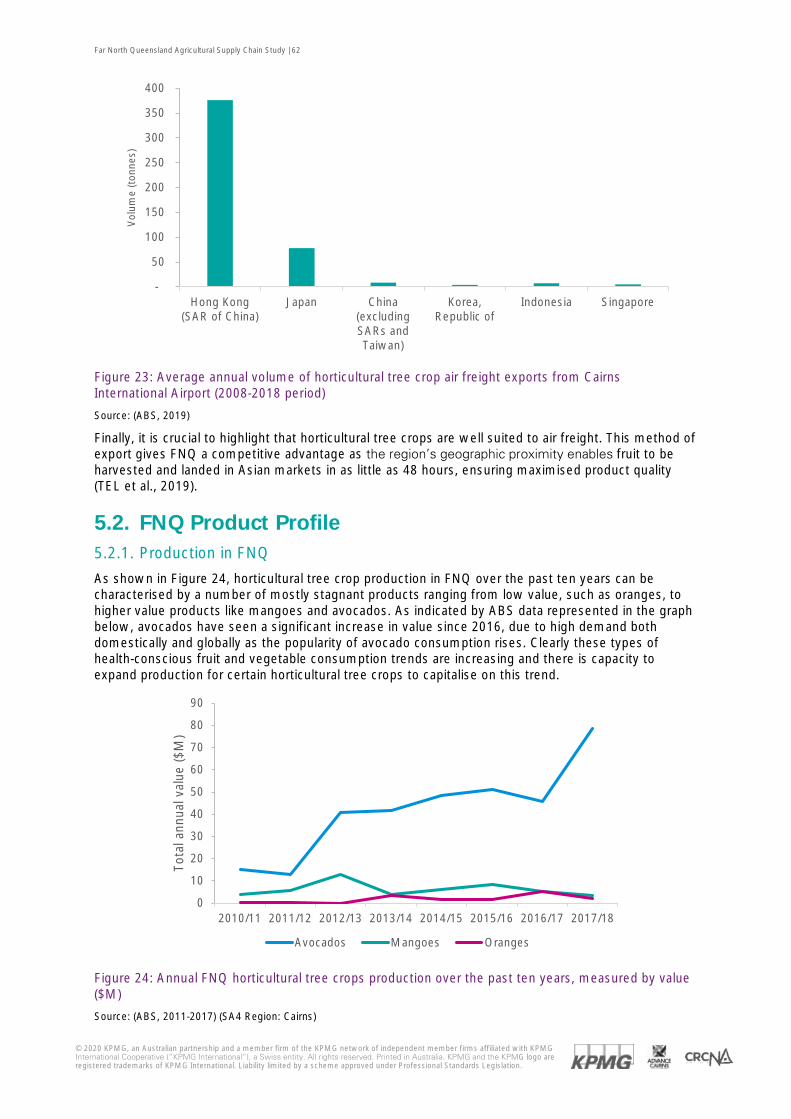
Far North Queensland Agricultural Supply Chain Study | 62
© 2020 KPMG, an Australian partnership and a member firm of the KPMG network of independent member firms affiliated with KPMG International Cooperative (“KPMG International”), a Swiss entity. All rights reserved. Printed in Australia. KPMG and the KPMG logo are registered trademarks of KPMG International. Liability limited by a scheme approved under Professional Standards Legislation.
Figure 23: Average annual volume of horticultural tree crop air freight exports from Cairns International Airport (2008-2018 period)
Source: (ABS, 2019)
Finally, it is crucial to highlight that horticultural tree crops are well suited to air freight. This method of export gives FNQ a competitive advantage as the region’s geographic proximity enables fruit to be harvested and landed in Asian markets in as little as 48 hours, ensuring maximised product quality (TEL et al., 2019).
5.2. FNQ Product Profile 5.2.1. Production in FNQ
As shown in Figure 24, horticultural tree crop production in FNQ over the past ten years can be characterised by a number of mostly stagnant products ranging from low value, such as oranges, to higher value products like mangoes and avocados. As indicated by ABS data represented in the graph below, avocados have seen a significant increase in value since 2016, due to high demand both domestically and globally as the popularity of avocado consumption rises. Clearly these types of health-conscious fruit and vegetable consumption trends are increasing and there is capacity to expand production for certain horticultural tree crops to capitalise on this trend.
Figure 24: Annual FNQ horticultural tree crops production over the past ten years, measured by value ($M)
Source: (ABS, 2011-2017) (SA4 Region: Cairns)
-
50
100
150
200
250
300
350
400
Hong Kong(SAR of China)
Japan China(excludingSARs andTaiwan)
Korea,Republic of
Indonesia Singapore
Vol
ume
(ton
nes)
0
10
20
30
40
50
60
70
80
90
2010/11 2011/12 2012/13 2013/14 2014/15 2015/16 2016/17 2017/18
Tota
l ann
ual v
alue
($M
)
Avocados Mangoes Oranges
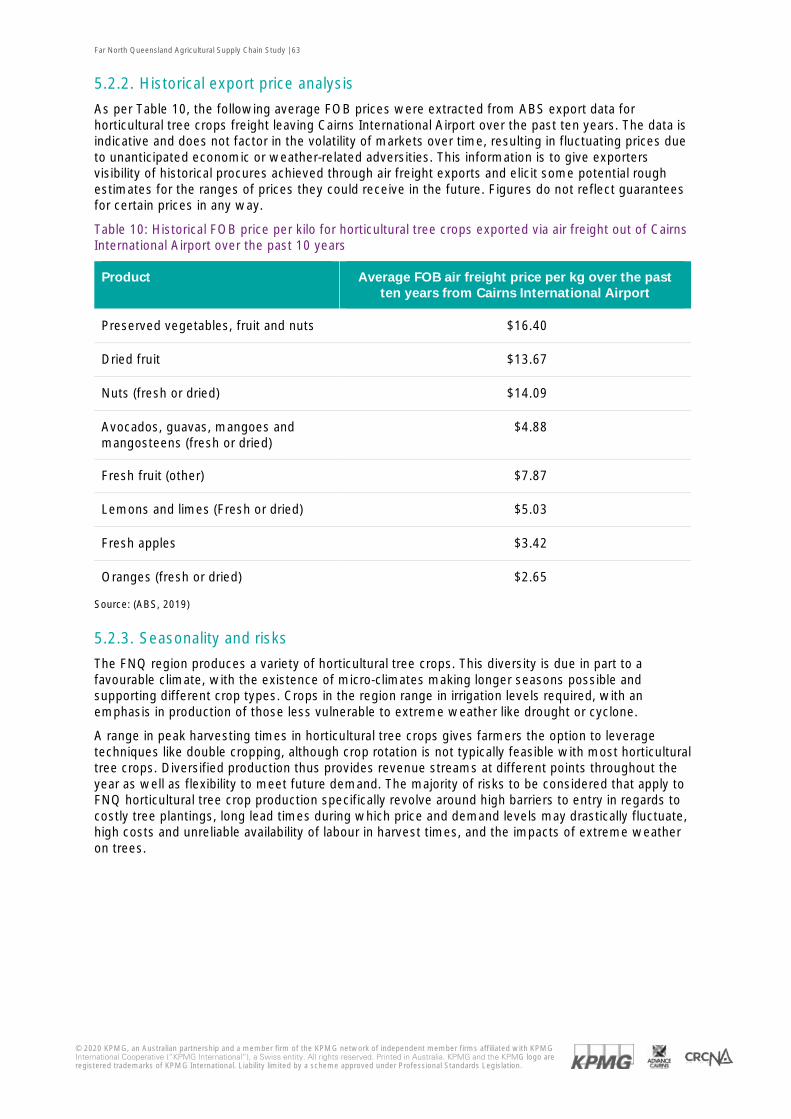
Far North Queensland Agricultural Supply Chain Study | 63
© 2020 KPMG, an Australian partnership and a member firm of the KPMG network of independent member firms affiliated with KPMG International Cooperative (“KPMG International”), a Swiss entity. All rights reserved. Printed in Australia. KPMG and the KPMG logo are registered trademarks of KPMG International. Liability limited by a scheme approved under Professional Standards Legislation.
5.2.2. Historical export price analysis
As per Table 10, the following average FOB prices were extracted from ABS export data for horticultural tree crops freight leaving Cairns International Airport over the past ten years. The data is indicative and does not factor in the volatility of markets over time, resulting in fluctuating prices due to unanticipated economic or weather-related adversities. This information is to give exporters visibility of historical procures achieved through air freight exports and elicit some potential rough estimates for the ranges of prices they could receive in the future. Figures do not reflect guarantees for certain prices in any way.
Table 10: Historical FOB price per kilo for horticultural tree crops exported via air freight out of Cairns International Airport over the past 10 years
Product Average FOB air freight price per kg over the past ten years from Cairns International Airport
Preserved vegetables, fruit and nuts $16.40
Dried fruit $13.67
Nuts (fresh or dried) $14.09
Avocados, guavas, mangoes and mangosteens (fresh or dried)
$4.88
Fresh fruit (other) $7.87
Lemons and limes (Fresh or dried) $5.03
Fresh apples $3.42
Oranges (fresh or dried) $2.65
Source: (ABS, 2019)
5.2.3. Seasonality and risks
The FNQ region produces a variety of horticultural tree crops. This diversity is due in part to a favourable climate, with the existence of micro-climates making longer seasons possible and supporting different crop types. Crops in the region range in irrigation levels required, with an emphasis in production of those less vulnerable to extreme weather like drought or cyclone.
A range in peak harvesting times in horticultural tree crops gives farmers the option to leverage techniques like double cropping, although crop rotation is not typically feasible with most horticultural tree crops. Diversified production thus provides revenue streams at different points throughout the year as well as flexibility to meet future demand. The majority of risks to be considered that apply to FNQ horticultural tree crop production specifically revolve around high barriers to entry in regards to costly tree plantings, long lead times during which price and demand levels may drastically fluctuate, high costs and unreliable availability of labour in harvest times, and the impacts of extreme weather on trees.
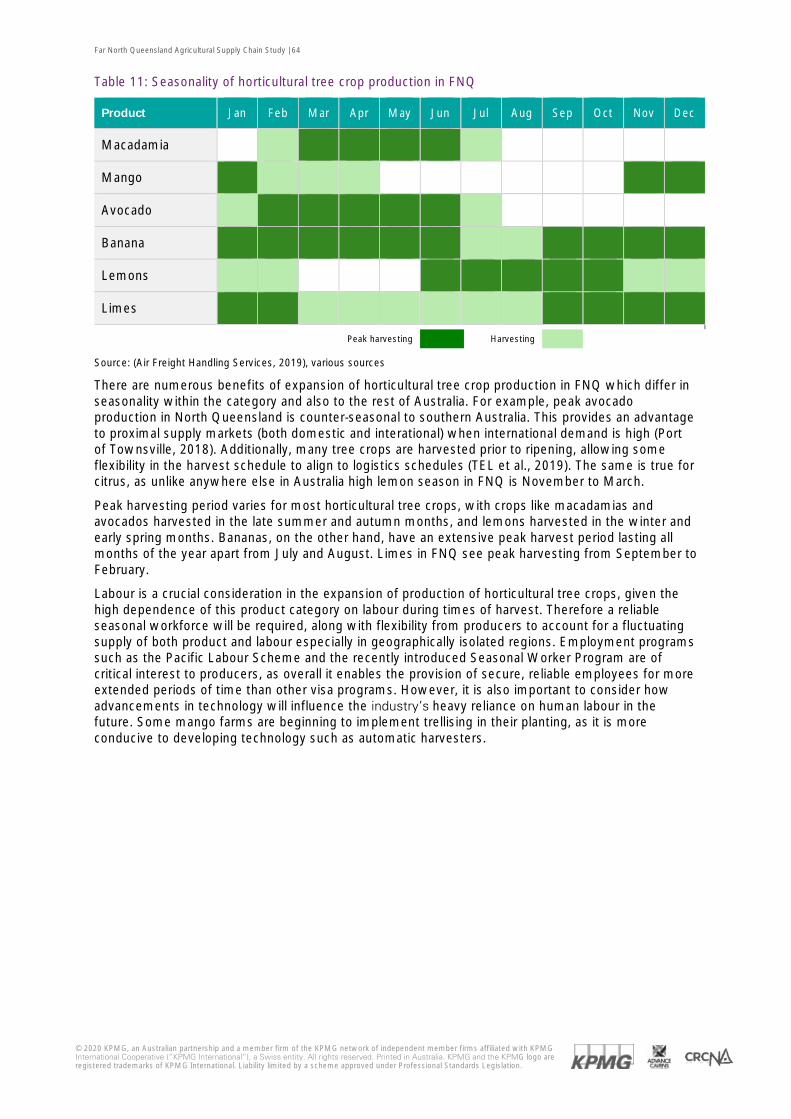
Far North Queensland Agricultural Supply Chain Study | 64
© 2020 KPMG, an Australian partnership and a member firm of the KPMG network of independent member firms affiliated with KPMG International Cooperative (“KPMG International”), a Swiss entity. All rights reserved. Printed in Australia. KPMG and the KPMG logo are registered trademarks of KPMG International. Liability limited by a scheme approved under Professional Standards Legislation.
Table 11: Seasonality of horticultural tree crop production in FNQ
Product Jan Feb Mar Apr May Jun Jul Aug Sep Oct Nov Dec
Macadamia
Mango
Avocado
Banana
Lemons
Limes
Peak harvesting Harvesting
Source: (Air Freight Handling Services, 2019), various sources
There are numerous benefits of expansion of horticultural tree crop production in FNQ which differ in seasonality within the category and also to the rest of Australia. For example, peak avocado production in North Queensland is counter-seasonal to southern Australia. This provides an advantage to proximal supply markets (both domestic and interational) when international demand is high (Port of Townsville, 2018). Additionally, many tree crops are harvested prior to ripening, allowing some flexibility in the harvest schedule to align to logistics schedules (TEL et al., 2019). The same is true for citrus, as unlike anywhere else in Australia high lemon season in FNQ is November to March.
Peak harvesting period varies for most horticultural tree crops, with crops like macadamias and avocados harvested in the late summer and autumn months, and lemons harvested in the winter and early spring months. Bananas, on the other hand, have an extensive peak harvest period lasting all months of the year apart from July and August. Limes in FNQ see peak harvesting from September to February.
Labour is a crucial consideration in the expansion of production of horticultural tree crops, given the high dependence of this product category on labour during times of harvest. Therefore a reliable seasonal workforce will be required, along with flexibility from producers to account for a fluctuating supply of both product and labour especially in geographically isolated regions. Employment programs such as the Pacific Labour Scheme and the recently introduced Seasonal Worker Program are of critical interest to producers, as overall it enables the provision of secure, reliable employees for more extended periods of time than other visa programs. However, it is also important to consider how advancements in technology will influence the industry’s heavy reliance on human labour in the future. Some mango farms are beginning to implement trellising in their planting, as it is more conducive to developing technology such as automatic harvesters.
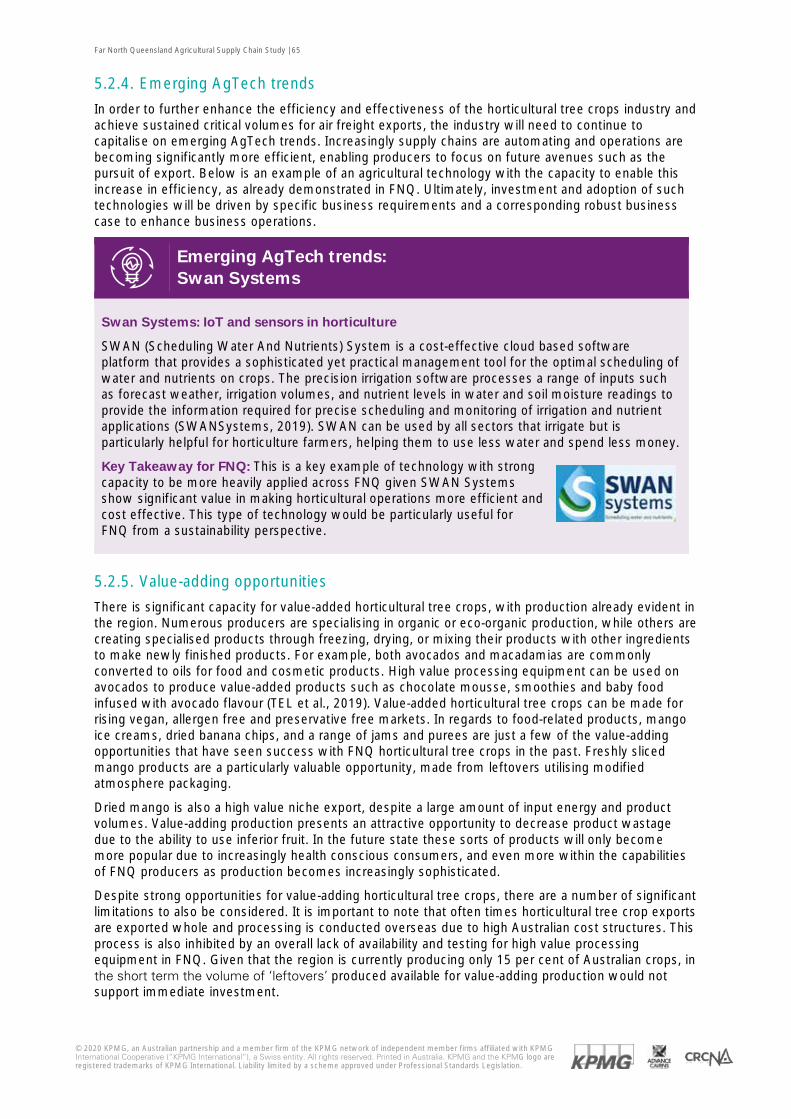
Far North Queensland Agricultural Supply Chain Study | 65
© 2020 KPMG, an Australian partnership and a member firm of the KPMG network of independent member firms affiliated with KPMG International Cooperative (“KPMG International”), a Swiss entity. All rights reserved. Printed in Australia. KPMG and the KPMG logo are registered trademarks of KPMG International. Liability limited by a scheme approved under Professional Standards Legislation.
5.2.4. Emerging AgTech trends
In order to further enhance the efficiency and effectiveness of the horticultural tree crops industry and achieve sustained critical volumes for air freight exports, the industry will need to continue to capitalise on emerging AgTech trends. Increasingly supply chains are automating and operations are becoming significantly more efficient, enabling producers to focus on future avenues such as the pursuit of export. Below is an example of an agricultural technology with the capacity to enable this increase in efficiency, as already demonstrated in FNQ. Ultimately, investment and adoption of such technologies will be driven by specific business requirements and a corresponding robust business case to enhance business operations.
Emerging AgTech trends: Swan Systems
Swan Systems: IoT and sensors in horticulture
SWAN (Scheduling Water And Nutrients) System is a cost-effective cloud based software platform that provides a sophisticated yet practical management tool for the optimal scheduling of water and nutrients on crops. The precision irrigation software processes a range of inputs such as forecast weather, irrigation volumes, and nutrient levels in water and soil moisture readings to provide the information required for precise scheduling and monitoring of irrigation and nutrient applications (SWANSystems, 2019). SWAN can be used by all sectors that irrigate but is particularly helpful for horticulture farmers, helping them to use less water and spend less money.
Key Takeaway for FNQ: This is a key example of technology with strong capacity to be more heavily applied across FNQ given SWAN Systems show significant value in making horticultural operations more efficient and cost effective. This type of technology would be particularly useful for FNQ from a sustainability perspective.
5.2.5. Value-adding opportunities
There is significant capacity for value-added horticultural tree crops, with production already evident in the region. Numerous producers are specialising in organic or eco-organic production, while others are creating specialised products through freezing, drying, or mixing their products with other ingredients to make newly finished products. For example, both avocados and macadamias are commonly converted to oils for food and cosmetic products. High value processing equipment can be used on avocados to produce value-added products such as chocolate mousse, smoothies and baby food infused with avocado flavour (TEL et al., 2019). Value-added horticultural tree crops can be made for rising vegan, allergen free and preservative free markets. In regards to food-related products, mango ice creams, dried banana chips, and a range of jams and purees are just a few of the value-adding opportunities that have seen success with FNQ horticultural tree crops in the past. Freshly sliced mango products are a particularly valuable opportunity, made from leftovers utilising modified atmosphere packaging.
Dried mango is also a high value niche export, despite a large amount of input energy and product volumes. Value-adding production presents an attractive opportunity to decrease product wastage due to the ability to use inferior fruit. In the future state these sorts of products will only become more popular due to increasingly health conscious consumers, and even more within the capabilities of FNQ producers as production becomes increasingly sophisticated.
Despite strong opportunities for value-adding horticultural tree crops, there are a number of significant limitations to also be considered. It is important to note that often times horticultural tree crop exports are exported whole and processing is conducted overseas due to high Australian cost structures. This process is also inhibited by an overall lack of availability and testing for high value processing equipment in FNQ. Given that the region is currently producing only 15 per cent of Australian crops, in the short term the volume of ‘leftovers’ produced available for value-adding production would not support immediate investment.
Far North Queensland Agricultural Supply Chain Study | 66
© 2020 KPMG, an Australian partnership and a member firm of the KPMG network of independent member firms affiliated with KPMG International Cooperative (“KPMG International”), a Swiss entity. All rights reserved. Printed in Australia. KPMG and the KPMG logo are registered trademarks of KPMG International. Liability limited by a scheme approved under Professional Standards Legislation.
Natural Evolution Foods
Cutting-edge health food company Natural Evolution Foods produce Green Banana Flour, the demand for which is increasingly insatiable. The company, which has operations at Walkamin, started as a purpose and use for tonnes of wasted bananas, and has evolved into a new market for all growers. In alignment with a rise in allergen-free dietary habits, demand for this product has been rapidly growing due not only to its gluten-free nature but also because it is one of
the highest starch-resistant food sources in the world. The flour is used used in cosmetics and natural medicines such as Banana Ointment, as well as baking, health supplements, equie and other healing products: all top selling products for Natural Evolution Foods. The operations fo Natural Evolution Foods are benefitting not just Australian and international consumers, but also participants across the entire horticultural tree crops supply chain. Rather than sending to the fresh food market growers have the option to supply Natural Evolution Foods, enabling farms to save on packaging and freight particularly at times of low prices due to oversupply in the fresh fruit market.
Key Takeaway for FNQ:
Natural Evolution Foods provides a valuable example of the opportunity to utilise food waste and create value-added products that align with changing consumer consumption and user habits, a business model with valuable opportunity to be replicated in FNQ.
5.2.6. Export case study
Diamond Star
The Diamond Star Mareeba operation exports top-quality mangoes exclusively to Japan for gift-giving season, strictly distinguished by large size and red-blush colour.
Due to high levels of demand from Japan for Australian product, Diamond Star has been consistently successful in exporting and receive a significant price premium for quality. The process is highly involved, from highly selective hand picking, VHT on-farm, packaging on-site in a purpose-built quarantine facility according to Japanese regulations, trucked to Cairns International Airport and exported by a freight forwarder on daily Jet Star flights to Japan.
Despite this success, Diamond Star’s export operations have been significantly limited by constantly changing export administration and protocols, especially in recent years. Frequently amended packing, paperwork, and inspection requirements have cost the company large amounts of time and capital and in many cases lead to obsolete investments due to the volatile nature of regulations. Increasing quality of price-competitive competing exporters from international markets such as Chile, Peru, and Columbia, is another critical barrier for Diamond Star, as well as all FNQ horticultural tree crop producers.
Key opportunities for other producers looking to export:
CASE STUDY
CASE STUDY
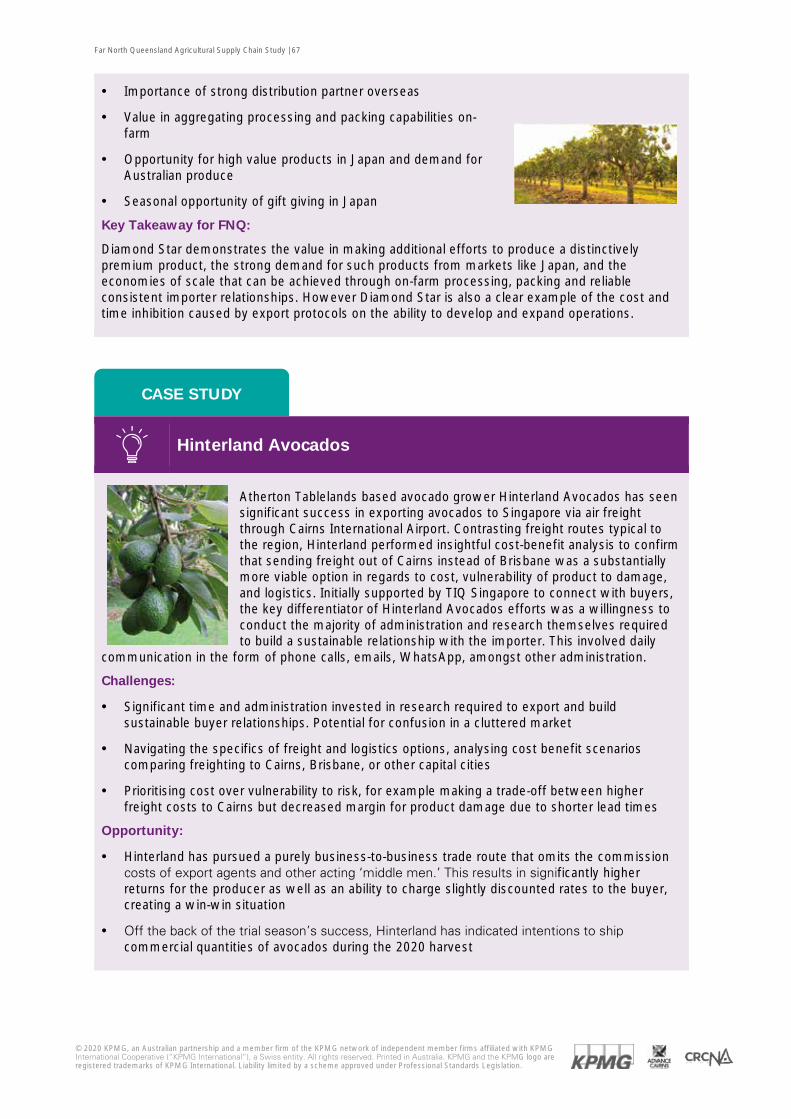
Far North Queensland Agricultural Supply Chain Study | 67
© 2020 KPMG, an Australian partnership and a member firm of the KPMG network of independent member firms affiliated with KPMG International Cooperative (“KPMG International”), a Swiss entity. All rights reserved. Printed in Australia. KPMG and the KPMG logo are registered trademarks of KPMG International. Liability limited by a scheme approved under Professional Standards Legislation.
· Importance of strong distribution partner overseas
· Value in aggregating processing and packing capabilities on-farm
· Opportunity for high value products in Japan and demand for Australian produce
· Seasonal opportunity of gift giving in Japan
Key Takeaway for FNQ:
Diamond Star demonstrates the value in making additional efforts to produce a distinctively premium product, the strong demand for such products from markets like Japan, and the economies of scale that can be achieved through on-farm processing, packing and reliable consistent importer relationships. However Diamond Star is also a clear example of the cost and time inhibition caused by export protocols on the ability to develop and expand operations.
Hinterland Avocados
Atherton Tablelands based avocado grower Hinterland Avocados has seen significant success in exporting avocados to Singapore via air freight through Cairns International Airport. Contrasting freight routes typical to the region, Hinterland performed insightful cost-benefit analysis to confirm that sending freight out of Cairns instead of Brisbane was a substantially more viable option in regards to cost, vulnerability of product to damage, and logistics. Initially supported by TIQ Singapore to connect with buyers, the key differentiator of Hinterland Avocados efforts was a willingness to conduct the majority of administration and research themselves required to build a sustainable relationship with the importer. This involved daily
communication in the form of phone calls, emails, WhatsApp, amongst other administration.
Challenges:
· Significant time and administration invested in research required to export and build sustainable buyer relationships. Potential for confusion in a cluttered market
· Navigating the specifics of freight and logistics options, analysing cost benefit scenarios comparing freighting to Cairns, Brisbane, or other capital cities
· Prioritising cost over vulnerability to risk, for example making a trade-off between higher freight costs to Cairns but decreased margin for product damage due to shorter lead times
Opportunity:
· Hinterland has pursued a purely business-to-business trade route that omits the commission costs of export agents and other acting ‘middle men.’ This results in significantly higher returns for the producer as well as an ability to charge slightly discounted rates to the buyer, creating a win-win situation
· Off the back of the trial season’s success, Hinterland has indicated intentions to ship commercial quantities of avocados during the 2020 harvest
CASE STUDY
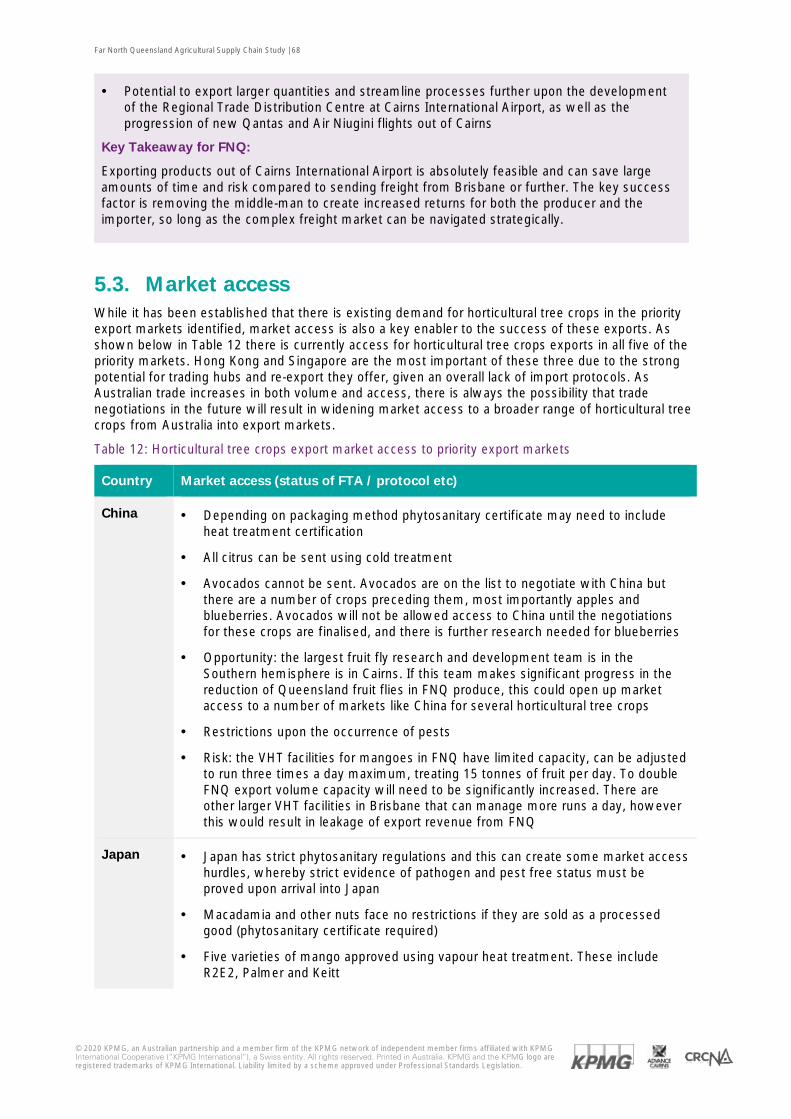
Far North Queensland Agricultural Supply Chain Study | 68
© 2020 KPMG, an Australian partnership and a member firm of the KPMG network of independent member firms affiliated with KPMG International Cooperative (“KPMG International”), a Swiss entity. All rights reserved. Printed in Australia. KPMG and the KPMG logo are registered trademarks of KPMG International. Liability limited by a scheme approved under Professional Standards Legislation.
· Potential to export larger quantities and streamline processes further upon the development of the Regional Trade Distribution Centre at Cairns International Airport, as well as the progression of new Qantas and Air Niugini flights out of Cairns
Key Takeaway for FNQ:
Exporting products out of Cairns International Airport is absolutely feasible and can save large amounts of time and risk compared to sending freight from Brisbane or further. The key success factor is removing the middle-man to create increased returns for both the producer and the importer, so long as the complex freight market can be navigated strategically.
5.3. Market access While it has been established that there is existing demand for horticultural tree crops in the priority export markets identified, market access is also a key enabler to the success of these exports. As shown below in Table 12 there is currently access for horticultural tree crops exports in all five of the priority markets. Hong Kong and Singapore are the most important of these three due to the strong potential for trading hubs and re-export they offer, given an overall lack of import protocols. As Australian trade increases in both volume and access, there is always the possibility that trade negotiations in the future will result in widening market access to a broader range of horticultural tree crops from Australia into export markets.
Table 12: Horticultural tree crops export market access to priority export markets
Country Market access (status of FTA / protocol etc)
China · Depending on packaging method phytosanitary certificate may need to include heat treatment certification
· All citrus can be sent using cold treatment
· Avocados cannot be sent. Avocados are on the list to negotiate with China but there are a number of crops preceding them, most importantly apples and blueberries. Avocados will not be allowed access to China until the negotiations for these crops are finalised, and there is further research needed for blueberries
· Opportunity: the largest fruit fly research and development team is in the Southern hemisphere is in Cairns. If this team makes significant progress in the reduction of Queensland fruit flies in FNQ produce, this could open up market access to a number of markets like China for several horticultural tree crops
· Restrictions upon the occurrence of pests
· Risk: the VHT facilities for mangoes in FNQ have limited capacity, can be adjusted to run three times a day maximum, treating 15 tonnes of fruit per day. To double FNQ export volume capacity will need to be significantly increased. There are other larger VHT facilities in Brisbane that can manage more runs a day, however this would result in leakage of export revenue from FNQ
Japan · Japan has strict phytosanitary regulations and this can create some market access hurdles, whereby strict evidence of pathogen and pest free status must be proved upon arrival into Japan
· Macadamia and other nuts face no restrictions if they are sold as a processed good (phytosanitary certificate required)
· Five varieties of mango approved using vapour heat treatment. These include R2E2, Palmer and Keitt
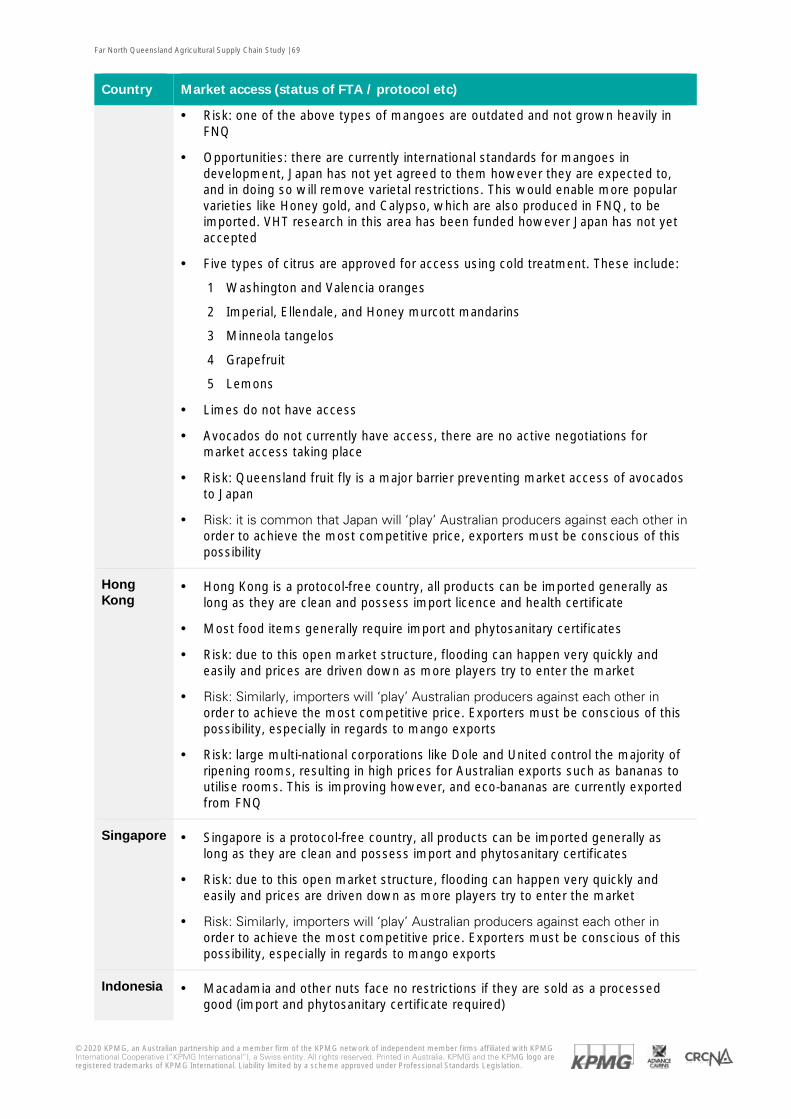
Far North Queensland Agricultural Supply Chain Study | 69
© 2020 KPMG, an Australian partnership and a member firm of the KPMG network of independent member firms affiliated with KPMG International Cooperative (“KPMG International”), a Swiss entity. All rights reserved. Printed in Australia. KPMG and the KPMG logo are registered trademarks of KPMG International. Liability limited by a scheme approved under Professional Standards Legislation.
Country Market access (status of FTA / protocol etc)
· Risk: one of the above types of mangoes are outdated and not grown heavily in FNQ
· Opportunities: there are currently international standards for mangoes in development, Japan has not yet agreed to them however they are expected to, and in doing so will remove varietal restrictions. This would enable more popular varieties like Honey gold, and Calypso, which are also produced in FNQ, to be imported. VHT research in this area has been funded however Japan has not yet accepted
· Five types of citrus are approved for access using cold treatment. These include:
1 Washington and Valencia oranges
2 Imperial, Ellendale, and Honey murcott mandarins
3 Minneola tangelos
4 Grapefruit
5 Lemons
· Limes do not have access
· Avocados do not currently have access, there are no active negotiations for market access taking place
· Risk: Queensland fruit fly is a major barrier preventing market access of avocados to Japan
· Risk: it is common that Japan will ‘play’ Australian producers against each other in order to achieve the most competitive price, exporters must be conscious of this possibility
Hong Kong
· Hong Kong is a protocol-free country, all products can be imported generally as long as they are clean and possess import licence and health certificate
· Most food items generally require import and phytosanitary certificates
· Risk: due to this open market structure, flooding can happen very quickly and easily and prices are driven down as more players try to enter the market
· Risk: Similarly, importers will ‘play’ Australian producers against each other in order to achieve the most competitive price. Exporters must be conscious of this possibility, especially in regards to mango exports
· Risk: large multi-national corporations like Dole and United control the majority of ripening rooms, resulting in high prices for Australian exports such as bananas to utilise rooms. This is improving however, and eco-bananas are currently exported from FNQ
Singapore · Singapore is a protocol-free country, all products can be imported generally as long as they are clean and possess import and phytosanitary certificates
· Risk: due to this open market structure, flooding can happen very quickly and easily and prices are driven down as more players try to enter the market
· Risk: Similarly, importers will ‘play’ Australian producers against each other in order to achieve the most competitive price. Exporters must be conscious of this possibility, especially in regards to mango exports
Indonesia · Macadamia and other nuts face no restrictions if they are sold as a processed good (import and phytosanitary certificate required)
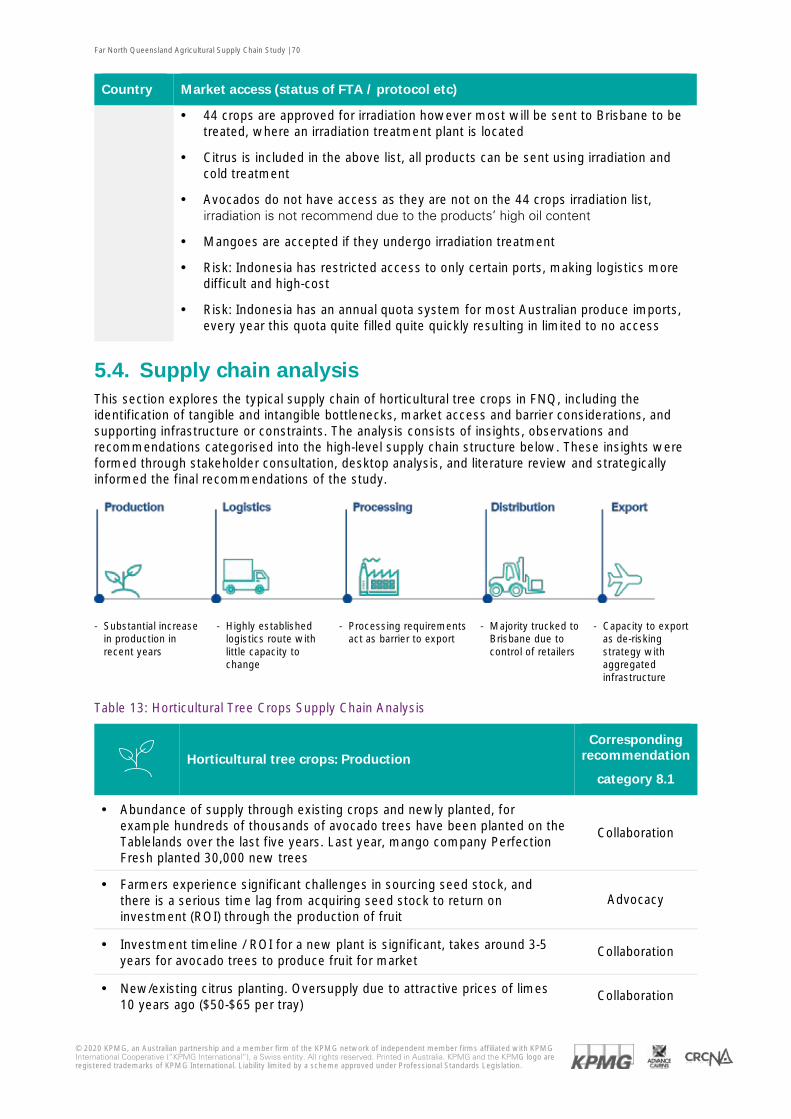
Far North Queensland Agricultural Supply Chain Study | 70
© 2020 KPMG, an Australian partnership and a member firm of the KPMG network of independent member firms affiliated with KPMG International Cooperative (“KPMG International”), a Swiss entity. All rights reserved. Printed in Australia. KPMG and the KPMG logo are registered trademarks of KPMG International. Liability limited by a scheme approved under Professional Standards Legislation.
Country Market access (status of FTA / protocol etc)
· 44 crops are approved for irradiation however most will be sent to Brisbane to be treated, where an irradiation treatment plant is located
· Citrus is included in the above list, all products can be sent using irradiation and cold treatment
· Avocados do not have access as they are not on the 44 crops irradiation list, irradiation is not recommend due to the products’ high oil content
· Mangoes are accepted if they undergo irradiation treatment
· Risk: Indonesia has restricted access to only certain ports, making logistics more difficult and high-cost
· Risk: Indonesia has an annual quota system for most Australian produce imports, every year this quota quite filled quite quickly resulting in limited to no access
5.4. Supply chain analysis This section explores the typical supply chain of horticultural tree crops in FNQ, including the identification of tangible and intangible bottlenecks, market access and barrier considerations, and supporting infrastructure or constraints. The analysis consists of insights, observations and recommendations categorised into the high-level supply chain structure below. These insights were formed through stakeholder consultation, desktop analysis, and literature review and strategically informed the final recommendations of the study.
- Substantial increase in production in recent years
- Highly established logistics route with little capacity to change
- Processing requirements act as barrier to export
- Majority trucked to Brisbane due to control of retailers
- Capacity to export as de-risking strategy with aggregated infrastructure
Table 13: Horticultural Tree Crops Supply Chain Analysis
Horticultural tree crops: Production
Corresponding recommendation
category 8.1
· Abundance of supply through existing crops and newly planted, for example hundreds of thousands of avocado trees have been planted on the Tablelands over the last five years. Last year, mango company Perfection Fresh planted 30,000 new trees
Collaboration
· Farmers experience significant challenges in sourcing seed stock, and there is a serious time lag from acquiring seed stock to return on investment (ROI) through the production of fruit
Advocacy
· Investment timeline / ROI for a new plant is significant, takes around 3-5 years for avocado trees to produce fruit for market
Collaboration
· New/existing citrus planting. Oversupply due to attractive prices of limes 10 years ago ($50-$65 per tray)
Collaboration
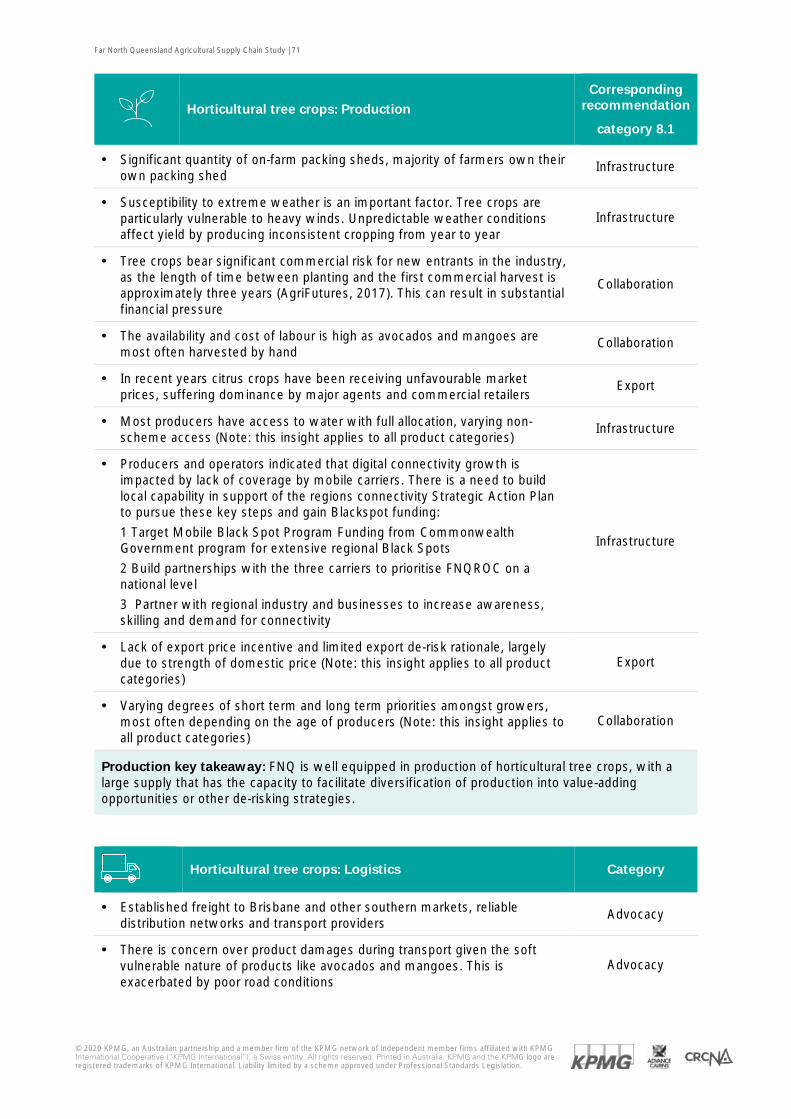
Far North Queensland Agricultural Supply Chain Study | 71
© 2020 KPMG, an Australian partnership and a member firm of the KPMG network of independent member firms affiliated with KPMG International Cooperative (“KPMG International”), a Swiss entity. All rights reserved. Printed in Australia. KPMG and the KPMG logo are registered trademarks of KPMG International. Liability limited by a scheme approved under Professional Standards Legislation.
Horticultural tree crops: Production
Corresponding recommendation
category 8.1
· Significant quantity of on-farm packing sheds, majority of farmers own their own packing shed
Infrastructure
· Susceptibility to extreme weather is an important factor. Tree crops are particularly vulnerable to heavy winds. Unpredictable weather conditions affect yield by producing inconsistent cropping from year to year
Infrastructure
· Tree crops bear significant commercial risk for new entrants in the industry, as the length of time between planting and the first commercial harvest is approximately three years (AgriFutures, 2017). This can result in substantial financial pressure
Collaboration
· The availability and cost of labour is high as avocados and mangoes are most often harvested by hand
Collaboration
· In recent years citrus crops have been receiving unfavourable market prices, suffering dominance by major agents and commercial retailers
Export
· Most producers have access to water with full allocation, varying non-scheme access (Note: this insight applies to all product categories)
Infrastructure
· Producers and operators indicated that digital connectivity growth is impacted by lack of coverage by mobile carriers. There is a need to build local capability in support of the regions connectivity Strategic Action Plan to pursue these key steps and gain Blackspot funding:
1 Target Mobile Black Spot Program Funding from Commonwealth Government program for extensive regional Black Spots
2 Build partnerships with the three carriers to prioritise FNQROC on a national level
3 Partner with regional industry and businesses to increase awareness, skilling and demand for connectivity
Infrastructure
· Lack of export price incentive and limited export de-risk rationale, largely due to strength of domestic price (Note: this insight applies to all product categories)
Export
· Varying degrees of short term and long term priorities amongst growers, most often depending on the age of producers (Note: this insight applies to all product categories)
Collaboration
Production key takeaway: FNQ is well equipped in production of horticultural tree crops, with a large supply that has the capacity to facilitate diversification of production into value-adding opportunities or other de-risking strategies.
Horticultural tree crops: Logistics Category
· Established freight to Brisbane and other southern markets, reliable distribution networks and transport providers
Advocacy
· There is concern over product damages during transport given the soft vulnerable nature of products like avocados and mangoes. This is exacerbated by poor road conditions
Advocacy
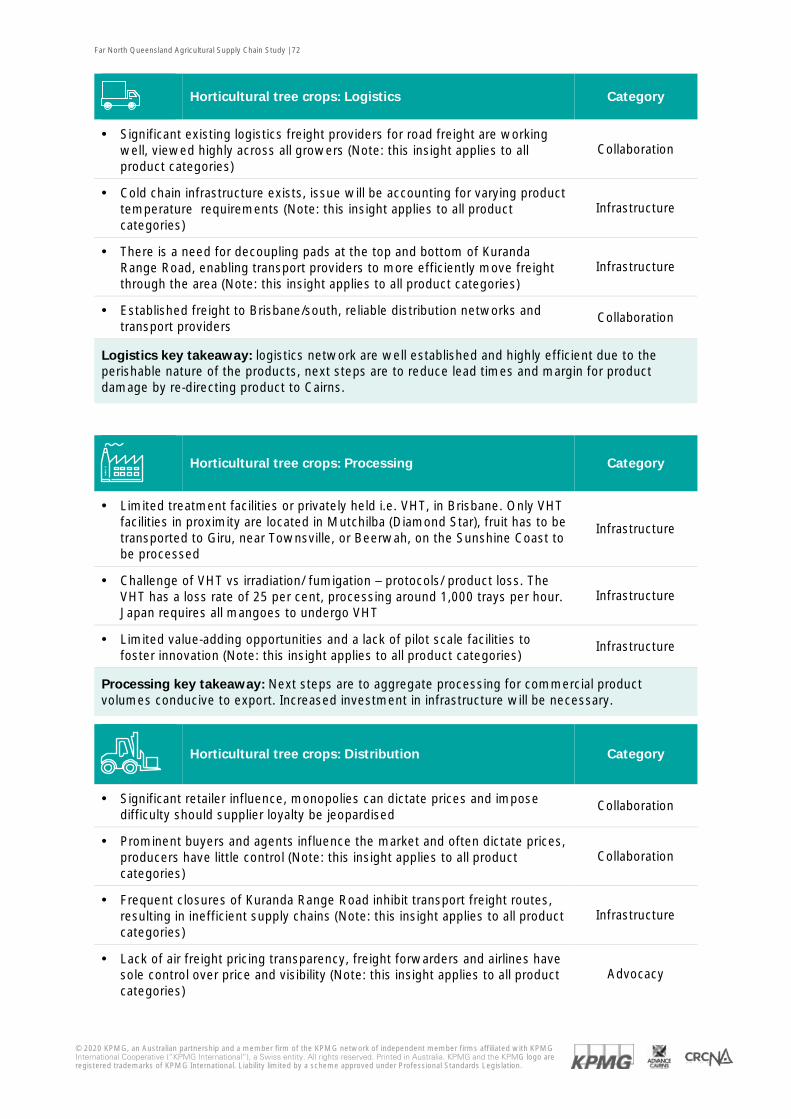
Far North Queensland Agricultural Supply Chain Study | 72
© 2020 KPMG, an Australian partnership and a member firm of the KPMG network of independent member firms affiliated with KPMG International Cooperative (“KPMG International”), a Swiss entity. All rights reserved. Printed in Australia. KPMG and the KPMG logo are registered trademarks of KPMG International. Liability limited by a scheme approved under Professional Standards Legislation.
Horticultural tree crops: Logistics Category
· Significant existing logistics freight providers for road freight are working well, viewed highly across all growers (Note: this insight applies to all product categories)
Collaboration
· Cold chain infrastructure exists, issue will be accounting for varying product temperature requirements (Note: this insight applies to all product categories)
Infrastructure
· There is a need for decoupling pads at the top and bottom of Kuranda Range Road, enabling transport providers to more efficiently move freight through the area (Note: this insight applies to all product categories)
Infrastructure
· Established freight to Brisbane/south, reliable distribution networks and transport providers
Collaboration
Logistics key takeaway: logistics network are well established and highly efficient due to the perishable nature of the products, next steps are to reduce lead times and margin for product damage by re-directing product to Cairns.
Horticultural tree crops: Processing Category
· Limited treatment facilities or privately held i.e. VHT, in Brisbane. Only VHT facilities in proximity are located in Mutchilba (Diamond Star), fruit has to be transported to Giru, near Townsville, or Beerwah, on the Sunshine Coast to be processed
Infrastructure
· Challenge of VHT vs irradiation/ fumigation – protocols/ product loss. The VHT has a loss rate of 25 per cent, processing around 1,000 trays per hour. Japan requires all mangoes to undergo VHT
Infrastructure
· Limited value-adding opportunities and a lack of pilot scale facilities to foster innovation (Note: this insight applies to all product categories)
Infrastructure
Processing key takeaway: Next steps are to aggregate processing for commercial product volumes conducive to export. Increased investment in infrastructure will be necessary.
Horticultural tree crops: Distribution Category
· Significant retailer influence, monopolies can dictate prices and impose difficulty should supplier loyalty be jeopardised
Collaboration
· Prominent buyers and agents influence the market and often dictate prices, producers have little control (Note: this insight applies to all product categories)
Collaboration
· Frequent closures of Kuranda Range Road inhibit transport freight routes, resulting in inefficient supply chains (Note: this insight applies to all product categories)
Infrastructure
· Lack of air freight pricing transparency, freight forwarders and airlines have sole control over price and visibility (Note: this insight applies to all product categories)
Advocacy
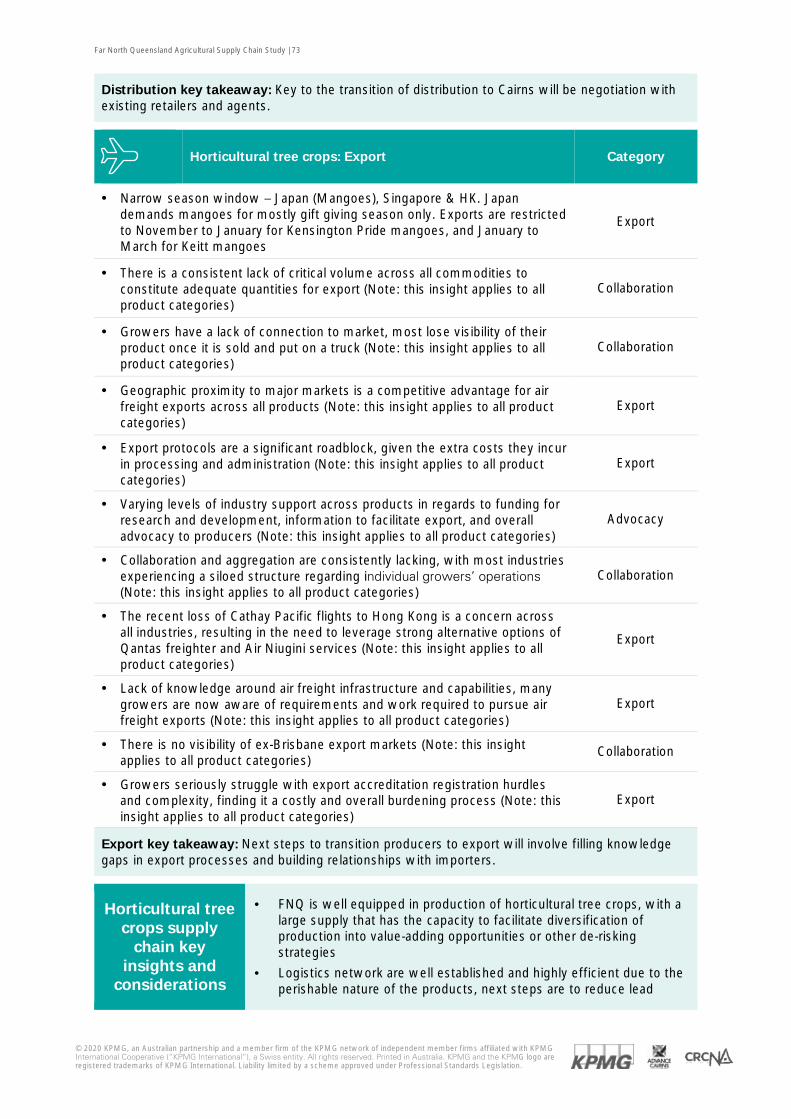
Far North Queensland Agricultural Supply Chain Study | 73
© 2020 KPMG, an Australian partnership and a member firm of the KPMG network of independent member firms affiliated with KPMG International Cooperative (“KPMG International”), a Swiss entity. All rights reserved. Printed in Australia. KPMG and the KPMG logo are registered trademarks of KPMG International. Liability limited by a scheme approved under Professional Standards Legislation.
Distribution key takeaway: Key to the transition of distribution to Cairns will be negotiation with existing retailers and agents.
Horticultural tree crops: Export Category
· Narrow season window – Japan (Mangoes), Singapore & HK. Japan demands mangoes for mostly gift giving season only. Exports are restricted to November to January for Kensington Pride mangoes, and January to March for Keitt mangoes
Export
· There is a consistent lack of critical volume across all commodities to constitute adequate quantities for export (Note: this insight applies to all product categories)
Collaboration
· Growers have a lack of connection to market, most lose visibility of their product once it is sold and put on a truck (Note: this insight applies to all product categories)
Collaboration
· Geographic proximity to major markets is a competitive advantage for air freight exports across all products (Note: this insight applies to all product categories)
Export
· Export protocols are a significant roadblock, given the extra costs they incur in processing and administration (Note: this insight applies to all product categories)
Export
· Varying levels of industry support across products in regards to funding for research and development, information to facilitate export, and overall advocacy to producers (Note: this insight applies to all product categories)
Advocacy
· Collaboration and aggregation are consistently lacking, with most industries experiencing a siloed structure regarding individual growers’ operations (Note: this insight applies to all product categories)
Collaboration
· The recent loss of Cathay Pacific flights to Hong Kong is a concern across all industries, resulting in the need to leverage strong alternative options of Qantas freighter and Air Niugini services (Note: this insight applies to all product categories)
Export
· Lack of knowledge around air freight infrastructure and capabilities, many growers are now aware of requirements and work required to pursue air freight exports (Note: this insight applies to all product categories)
Export
· There is no visibility of ex-Brisbane export markets (Note: this insight applies to all product categories)
Collaboration
· Growers seriously struggle with export accreditation registration hurdles and complexity, finding it a costly and overall burdening process (Note: this insight applies to all product categories)
Export
Export key takeaway: Next steps to transition producers to export will involve filling knowledge gaps in export processes and building relationships with importers.
Horticultural tree crops supply
chain key insights and
considerations
· FNQ is well equipped in production of horticultural tree crops, with a large supply that has the capacity to facilitate diversification of production into value-adding opportunities or other de-risking strategies
· Logistics network are well established and highly efficient due to the perishable nature of the products, next steps are to reduce lead
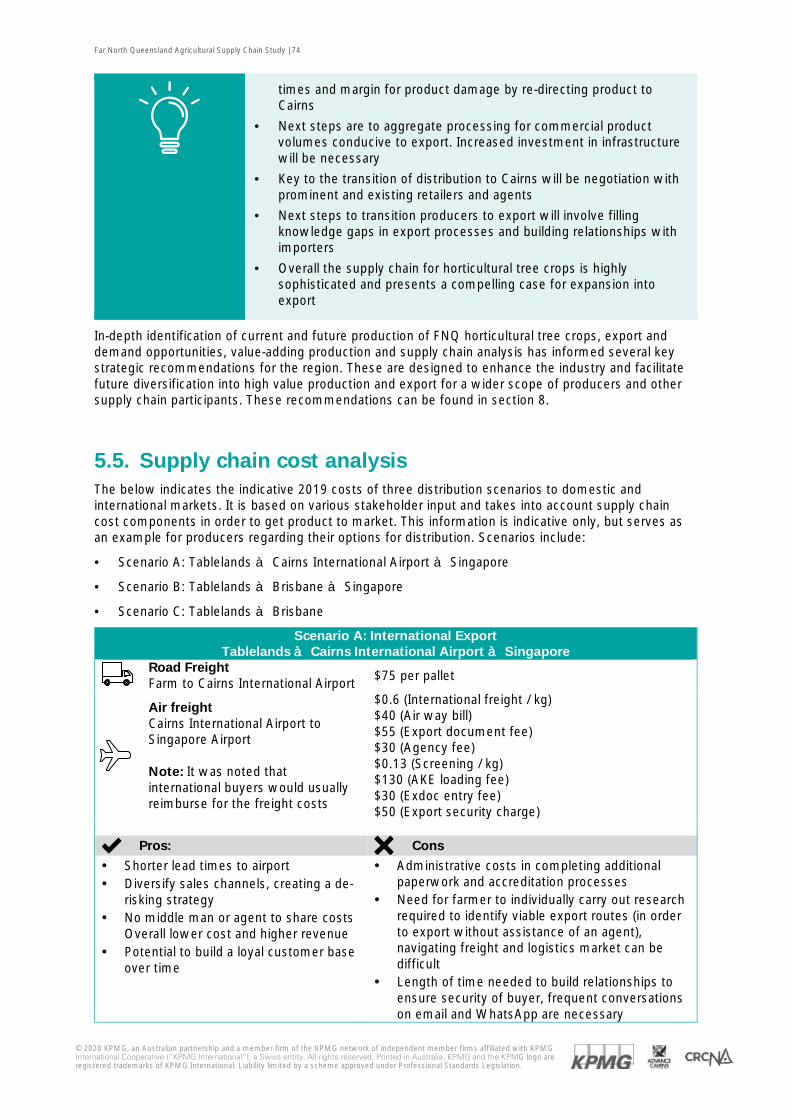
Far North Queensland Agricultural Supply Chain Study | 74
© 2020 KPMG, an Australian partnership and a member firm of the KPMG network of independent member firms affiliated with KPMG International Cooperative (“KPMG International”), a Swiss entity. All rights reserved. Printed in Australia. KPMG and the KPMG logo are registered trademarks of KPMG International. Liability limited by a scheme approved under Professional Standards Legislation.
times and margin for product damage by re-directing product to Cairns
· Next steps are to aggregate processing for commercial product volumes conducive to export. Increased investment in infrastructure will be necessary
· Key to the transition of distribution to Cairns will be negotiation with prominent and existing retailers and agents
· Next steps to transition producers to export will involve filling knowledge gaps in export processes and building relationships with importers
· Overall the supply chain for horticultural tree crops is highly sophisticated and presents a compelling case for expansion into export
In-depth identification of current and future production of FNQ horticultural tree crops, export and demand opportunities, value-adding production and supply chain analysis has informed several key strategic recommendations for the region. These are designed to enhance the industry and facilitate future diversification into high value production and export for a wider scope of producers and other supply chain participants. These recommendations can be found in section 8.
5.5. Supply chain cost analysis The below indicates the indicative 2019 costs of three distribution scenarios to domestic and international markets. It is based on various stakeholder input and takes into account supply chain cost components in order to get product to market. This information is indicative only, but serves as an example for producers regarding their options for distribution. Scenarios include:
· Scenario A: Tablelands à Cairns International Airport à Singapore
· Scenario B: Tablelands à Brisbane à Singapore
· Scenario C: Tablelands à Brisbane
Scenario A: International Export Tablelands à Cairns International Airport à Singapore
Road Freight Farm to Cairns International Airport $75 per pallet
Air freight Cairns International Airport to Singapore Airport Note: It was noted that international buyers would usually reimburse for the freight costs
$0.6 (International freight / kg) $40 (Air way bill) $55 (Export document fee) $30 (Agency fee) $0.13 (Screening / kg) $130 (AKE loading fee) $30 (Exdoc entry fee) $50 (Export security charge)
Pros: Cons
· Shorter lead times to airport · Diversify sales channels, creating a de-
risking strategy · No middle man or agent to share costs
Overall lower cost and higher revenue · Potential to build a loyal customer base
over time
· Administrative costs in completing additional paperwork and accreditation processes
· Need for farmer to individually carry out research required to identify viable export routes (in order to export without assistance of an agent), navigating freight and logistics market can be difficult
· Length of time needed to build relationships to ensure security of buyer, frequent conversations on email and WhatsApp are necessary
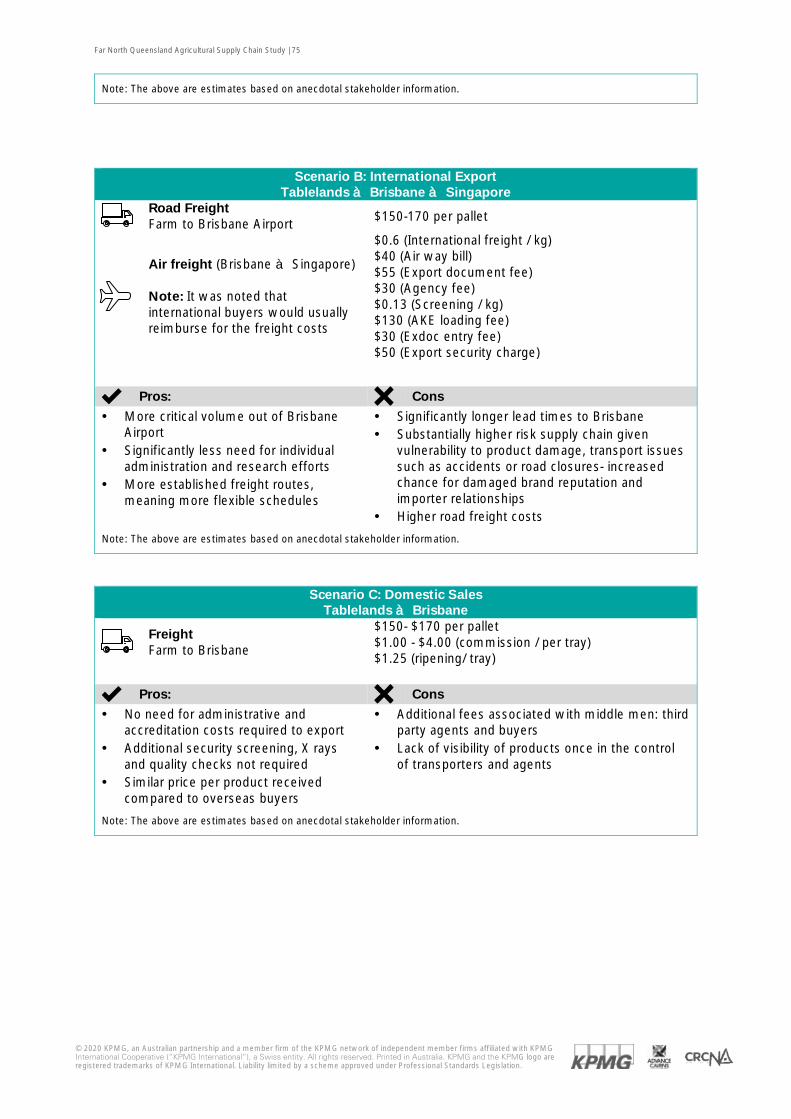
Far North Queensland Agricultural Supply Chain Study | 75
© 2020 KPMG, an Australian partnership and a member firm of the KPMG network of independent member firms affiliated with KPMG International Cooperative (“KPMG International”), a Swiss entity. All rights reserved. Printed in Australia. KPMG and the KPMG logo are registered trademarks of KPMG International. Liability limited by a scheme approved under Professional Standards Legislation.
Note: The above are estimates based on anecdotal stakeholder information.
Scenario B: International Export Tablelands à Brisbane à Singapore
Road Freight Farm to Brisbane Airport $150-170 per pallet
Air freight (Brisbane à Singapore) Note: It was noted that international buyers would usually reimburse for the freight costs
$0.6 (International freight / kg) $40 (Air way bill) $55 (Export document fee) $30 (Agency fee) $0.13 (Screening / kg) $130 (AKE loading fee) $30 (Exdoc entry fee) $50 (Export security charge)
Pros: Cons
· More critical volume out of Brisbane Airport
· Significantly less need for individual administration and research efforts
· More established freight routes, meaning more flexible schedules
· Significantly longer lead times to Brisbane · Substantially higher risk supply chain given
vulnerability to product damage, transport issues such as accidents or road closures- increased chance for damaged brand reputation and importer relationships
· Higher road freight costs Note: The above are estimates based on anecdotal stakeholder information.
Scenario C: Domestic Sales Tablelands à Brisbane
Freight Farm to Brisbane
$150- $170 per pallet $1.00 - $4.00 (commission / per tray) $1.25 (ripening/ tray)
Pros: Cons
· No need for administrative and accreditation costs required to export
· Additional security screening, X rays and quality checks not required
· Similar price per product received compared to overseas buyers
· Additional fees associated with middle men: third party agents and buyers
· Lack of visibility of products once in the control of transporters and agents
Note: The above are estimates based on anecdotal stakeholder information.

Far North Queensland Agricultural Supply Chain Study | 76
© 2020 KPMG, an Australian partnership and a member firm of the KPMG network of independent member firms affiliated with KPMG International Cooperative (“KPMG International”), a Swiss entity. All rights reserved. Printed in Australia. KPMG and the KPMG logo are registered trademarks of KPMG International. Liability limited by a scheme approved under Professional Standards Legislation.
6. Vegetables

Far North Queensland Agricultural Supply Chain Study | 77
© 2020 KPMG, an Australian partnership and a member firm of the KPMG network of independent member firms affiliated with KPMG International Cooperative (“KPMG International”), a Swiss entity. All rights reserved. Printed in Australia. KPMG and the KPMG logo are registered trademarks of KPMG International. Liability limited by a scheme approved under Professional Standards Legislation.
6.1. Value proposition and rationale for the opportunity Similar to horticultural tree crops, vegetables present a valuable product category for export. This is due first and foremost to growth in vegetable consumption resulting from increasingly popular worldwide trends of nutrition-focused diets. International demand for Australian vegetables is rising, with exports increasing by over 15 per cent at $281M in 2018 (AusVeg, 2018). Overseas consumers in Hong Kong, China, Japan, and Indonesia are said to have been some of the highest paying for Australian vegetable exports in recent years. Australian vegetables that are typically highly sought after are carrots, potatoes, broccoli, and cauliflower and onion. Clearly there is significant margin for an expansion of vegetable exports to meet this demand. As shown in Figure 25, there is a total of approximately $20M in untapped export potential for vegetables in the five priority export markets identified. The majority of demand comes from Indonesia, followed by Japan and Hong Kong.
Figure 25: Total untapped export potential of Australian vegetables to the five priority export markets identified (measured by value)
Source: (ITC Export Potential Map, 2019)
Note: The export potential value is projected by an economic model based on the characteristics of the exporter, target market, and the strength of the relationship between them. The estimated dollar value serves as a benchmark for comparison with actual export performance and should not be interpreted as a ceiling value. These figures have been converted from $USD to AUD$.
In contrast to horticultural tree crops, vegetables offer a wide scope of products to grow at significantly less binding permanency, thus facilitating flexibility for crop rotation and diversification. This fulfils an opportunity for producers and other supply chain participants to have the flexibility to adjust production according to potentially fluctuating demand. Biosecurity will continue to play a significant role in securing and growing international exports, for example ongoing monitoring by industry is helping to prevent potential outbreaks of grubs and insect invasions in vegetable crops.
Vegetables present a high value opportunity for export as they form a staple part of most Asian diets, with increasing consumption particularly in the priority export markets identified. In the Asia Pacific Region average consumption of fruits and vegetables is estimated to be around 560g per capita per day, resulting in 75 per cent of global vegetables and 66 per cent of global fruits (University of Southern Queensland, 2014). Asian diets typically contain a rich variety of fresh vegetables, pickled vegetables, as well as vegetable oils, which are increasingly preferred to be premium or organic. Australian vegetable exports maintain a premium quality and food safety reputation overseas, and this brand must be preserved to support export growth. Rising income levels in export markets have enabled increasing demand for this premium brand and driven consumer freedom to follow global demographic trends of prioritised healthy lifestyles and increased vegetable consumption.
Vegetable exports are particularly valuable as products have been experiencing consistent value increases. Queensland is one of the largest producers of vegetables in Australia, with a primary crop portfolio consisting of tomatoes, capsicums, beans, mushrooms, potatoes, broccoli, carrots, onions
-
5
10
15
20
25
Indonesia Japan Hong Kong China Singapore
Val
ue (m
iillio
ns)
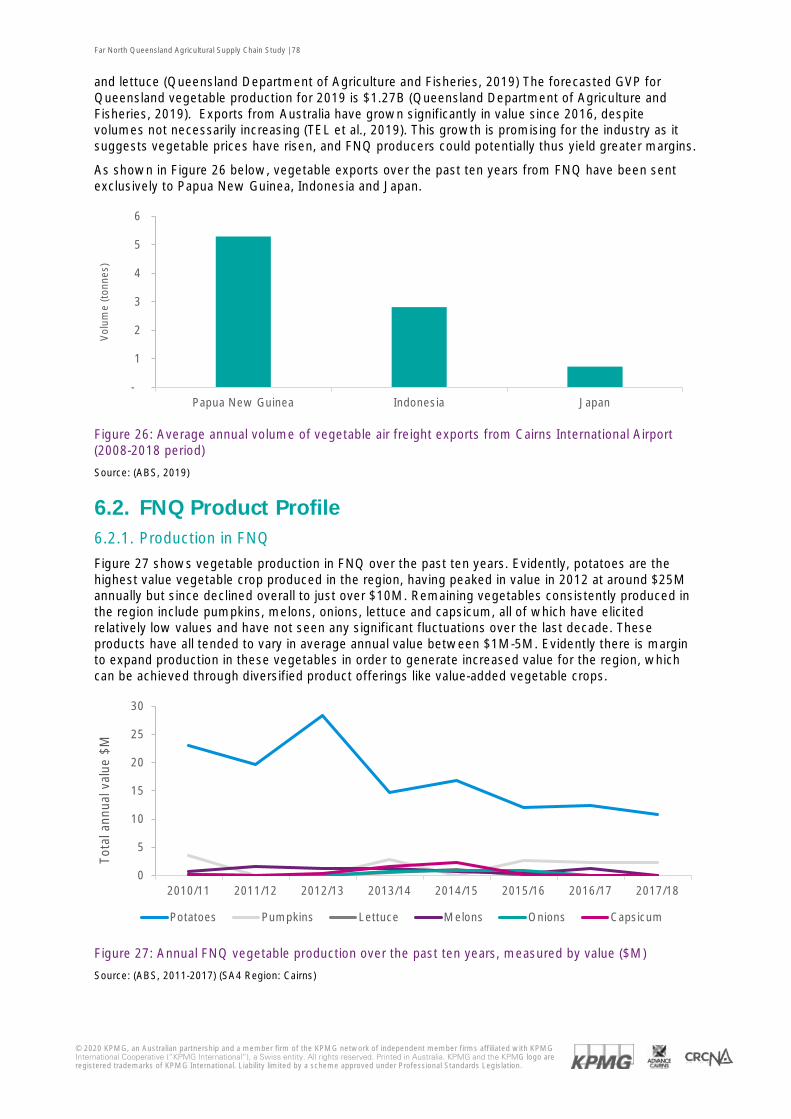
Far North Queensland Agricultural Supply Chain Study | 78
© 2020 KPMG, an Australian partnership and a member firm of the KPMG network of independent member firms affiliated with KPMG International Cooperative (“KPMG International”), a Swiss entity. All rights reserved. Printed in Australia. KPMG and the KPMG logo are registered trademarks of KPMG International. Liability limited by a scheme approved under Professional Standards Legislation.
and lettuce (Queensland Department of Agriculture and Fisheries, 2019) The forecasted GVP for Queensland vegetable production for 2019 is $1.27B (Queensland Department of Agriculture and Fisheries, 2019). Exports from Australia have grown significantly in value since 2016, despite volumes not necessarily increasing (TEL et al., 2019). This growth is promising for the industry as it suggests vegetable prices have risen, and FNQ producers could potentially thus yield greater margins.
As shown in Figure 26 below, vegetable exports over the past ten years from FNQ have been sent exclusively to Papua New Guinea, Indonesia and Japan.
Figure 26: Average annual volume of vegetable air freight exports from Cairns International Airport (2008-2018 period)
Source: (ABS, 2019)
6.2. FNQ Product Profile 6.2.1. Production in FNQ
Figure 27 shows vegetable production in FNQ over the past ten years. Evidently, potatoes are the highest value vegetable crop produced in the region, having peaked in value in 2012 at around $25M annually but since declined overall to just over $10M. Remaining vegetables consistently produced in the region include pumpkins, melons, onions, lettuce and capsicum, all of which have elicited relatively low values and have not seen any significant fluctuations over the last decade. These products have all tended to vary in average annual value between $1M-5M. Evidently there is margin to expand production in these vegetables in order to generate increased value for the region, which can be achieved through diversified product offerings like value-added vegetable crops.
Figure 27: Annual FNQ vegetable production over the past ten years, measured by value ($M)
Source: (ABS, 2011-2017) (SA4 Region: Cairns)
-
1
2
3
4
5
6
Papua New Guinea Indonesia Japan
Vol
ume
(ton
nes)
0
5
10
15
20
25
30
2010/11 2011/12 2012/13 2013/14 2014/15 2015/16 2016/17 2017/18
Tota
l ann
ual v
alue
$M
Potatoes Pumpkins Lettuce Melons Onions Capsicum
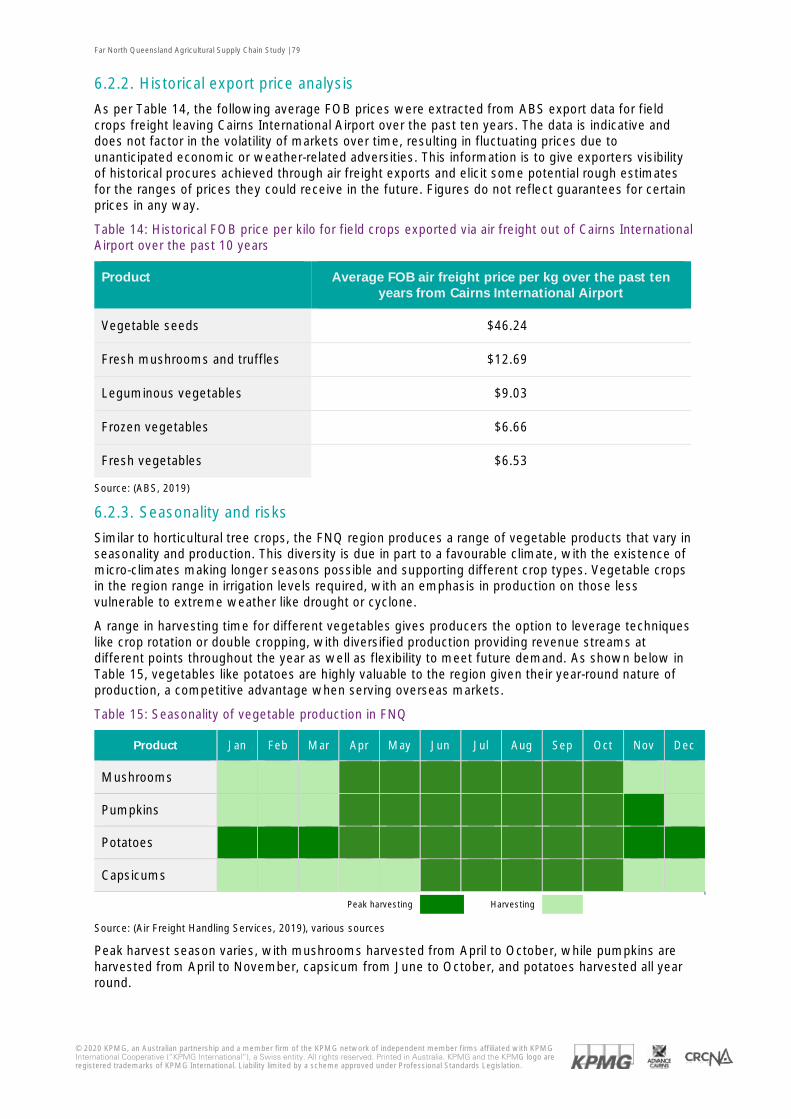
Far North Queensland Agricultural Supply Chain Study | 79
© 2020 KPMG, an Australian partnership and a member firm of the KPMG network of independent member firms affiliated with KPMG International Cooperative (“KPMG International”), a Swiss entity. All rights reserved. Printed in Australia. KPMG and the KPMG logo are registered trademarks of KPMG International. Liability limited by a scheme approved under Professional Standards Legislation.
6.2.2. Historical export price analysis
As per Table 14, the following average FOB prices were extracted from ABS export data for field crops freight leaving Cairns International Airport over the past ten years. The data is indicative and does not factor in the volatility of markets over time, resulting in fluctuating prices due to unanticipated economic or weather-related adversities. This information is to give exporters visibility of historical procures achieved through air freight exports and elicit some potential rough estimates for the ranges of prices they could receive in the future. Figures do not reflect guarantees for certain prices in any way.
Table 14: Historical FOB price per kilo for field crops exported via air freight out of Cairns International Airport over the past 10 years
Product Average FOB air freight price per kg over the past ten years from Cairns International Airport
Vegetable seeds $46.24
Fresh mushrooms and truffles $12.69
Leguminous vegetables $9.03
Frozen vegetables $6.66
Fresh vegetables $6.53
Source: (ABS, 2019)
6.2.3. Seasonality and risks
Similar to horticultural tree crops, the FNQ region produces a range of vegetable products that vary in seasonality and production. This diversity is due in part to a favourable climate, with the existence of micro-climates making longer seasons possible and supporting different crop types. Vegetable crops in the region range in irrigation levels required, with an emphasis in production on those less vulnerable to extreme weather like drought or cyclone.
A range in harvesting time for different vegetables gives producers the option to leverage techniques like crop rotation or double cropping, with diversified production providing revenue streams at different points throughout the year as well as flexibility to meet future demand. As shown below in Table 15, vegetables like potatoes are highly valuable to the region given their year-round nature of production, a competitive advantage when serving overseas markets.
Table 15: Seasonality of vegetable production in FNQ
Product Jan Feb Mar Apr May Jun Jul Aug Sep Oct Nov Dec
Mushrooms
Pumpkins
Potatoes
Capsicums
Peak harvesting Harvesting
Source: (Air Freight Handling Services, 2019), various sources
Peak harvest season varies, with mushrooms harvested from April to October, while pumpkins are harvested from April to November, capsicum from June to October, and potatoes harvested all year round.
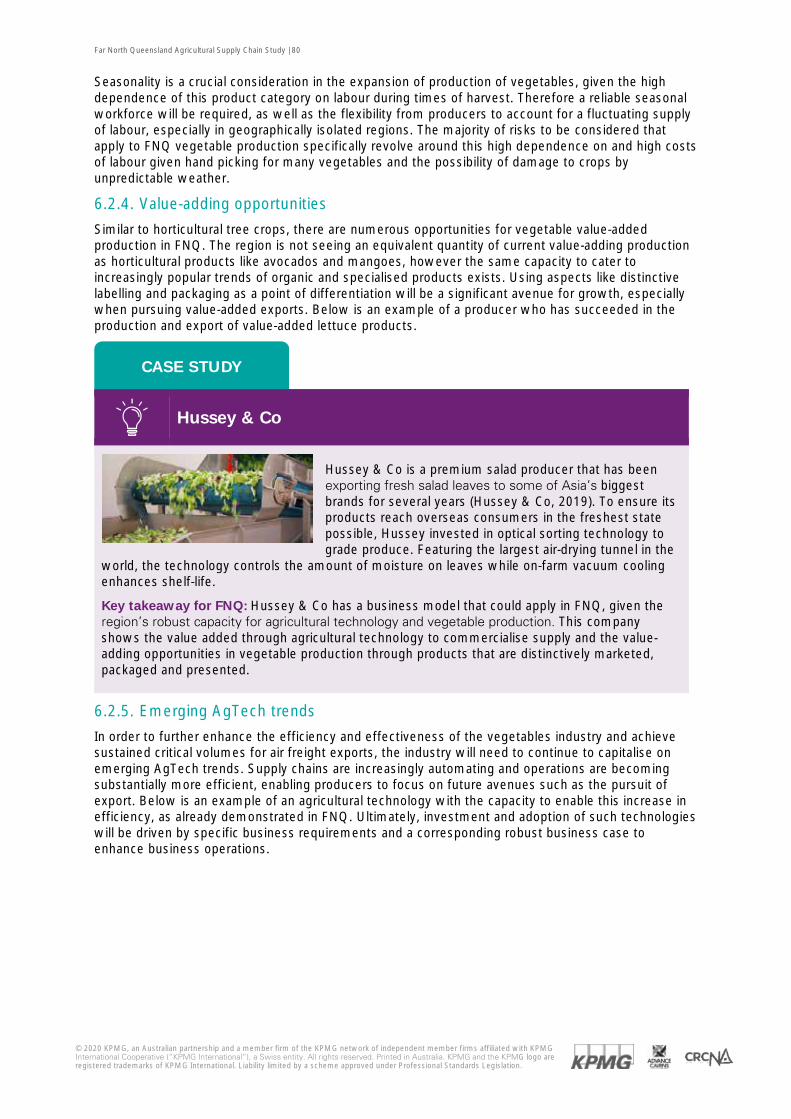
Far North Queensland Agricultural Supply Chain Study | 80
© 2020 KPMG, an Australian partnership and a member firm of the KPMG network of independent member firms affiliated with KPMG International Cooperative (“KPMG International”), a Swiss entity. All rights reserved. Printed in Australia. KPMG and the KPMG logo are registered trademarks of KPMG International. Liability limited by a scheme approved under Professional Standards Legislation.
Seasonality is a crucial consideration in the expansion of production of vegetables, given the high dependence of this product category on labour during times of harvest. Therefore a reliable seasonal workforce will be required, as well as the flexibility from producers to account for a fluctuating supply of labour, especially in geographically isolated regions. The majority of risks to be considered that apply to FNQ vegetable production specifically revolve around this high dependence on and high costs of labour given hand picking for many vegetables and the possibility of damage to crops by unpredictable weather.
6.2.4. Value-adding opportunities
Similar to horticultural tree crops, there are numerous opportunities for vegetable value-added production in FNQ. The region is not seeing an equivalent quantity of current value-adding production as horticultural products like avocados and mangoes, however the same capacity to cater to increasingly popular trends of organic and specialised products exists. Using aspects like distinctive labelling and packaging as a point of differentiation will be a significant avenue for growth, especially when pursuing value-added exports. Below is an example of a producer who has succeeded in the production and export of value-added lettuce products.
Hussey & Co
Hussey & Co is a premium salad producer that has been exporting fresh salad leaves to some of Asia’s biggest brands for several years (Hussey & Co, 2019). To ensure its products reach overseas consumers in the freshest state possible, Hussey invested in optical sorting technology to grade produce. Featuring the largest air-drying tunnel in the
world, the technology controls the amount of moisture on leaves while on-farm vacuum cooling enhances shelf-life.
Key takeaway for FNQ: Hussey & Co has a business model that could apply in FNQ, given the region’s robust capacity for agricultural technology and vegetable production. This company shows the value added through agricultural technology to commercialise supply and the value-adding opportunities in vegetable production through products that are distinctively marketed, packaged and presented.
6.2.5. Emerging AgTech trends
In order to further enhance the efficiency and effectiveness of the vegetables industry and achieve sustained critical volumes for air freight exports, the industry will need to continue to capitalise on emerging AgTech trends. Supply chains are increasingly automating and operations are becoming substantially more efficient, enabling producers to focus on future avenues such as the pursuit of export. Below is an example of an agricultural technology with the capacity to enable this increase in efficiency, as already demonstrated in FNQ. Ultimately, investment and adoption of such technologies will be driven by specific business requirements and a corresponding robust business case to enhance business operations.
CASE STUDY
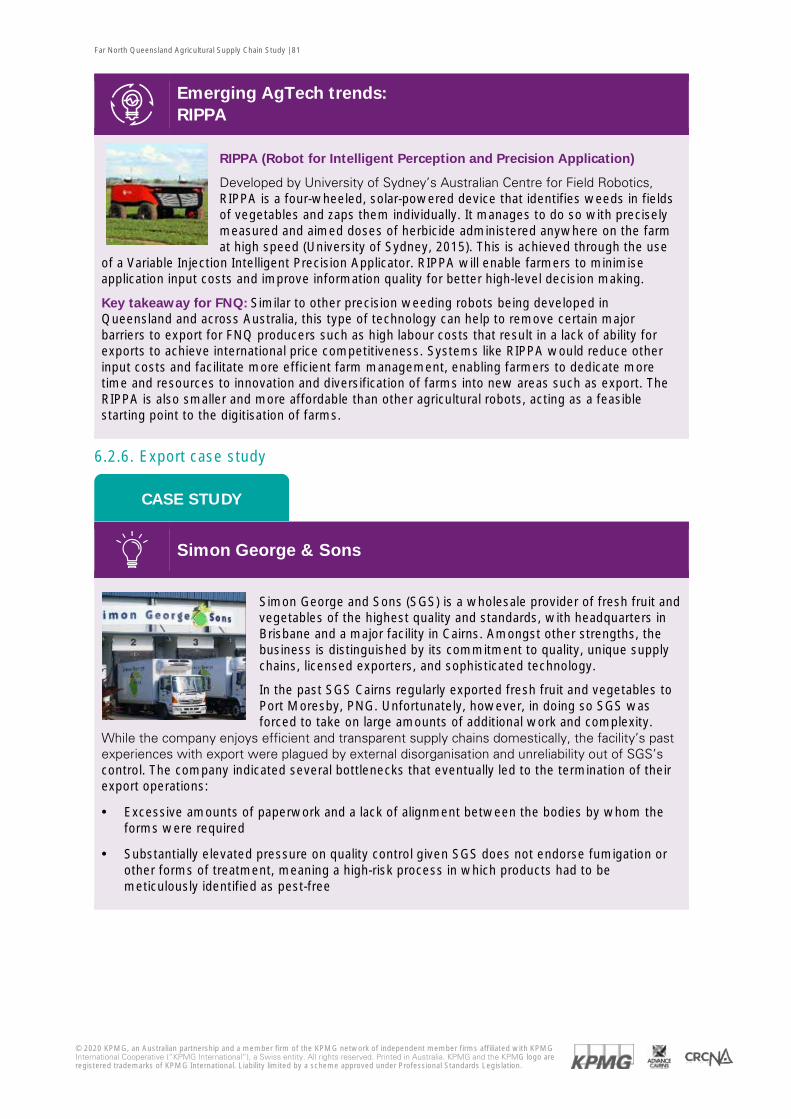
Far North Queensland Agricultural Supply Chain Study | 81
© 2020 KPMG, an Australian partnership and a member firm of the KPMG network of independent member firms affiliated with KPMG International Cooperative (“KPMG International”), a Swiss entity. All rights reserved. Printed in Australia. KPMG and the KPMG logo are registered trademarks of KPMG International. Liability limited by a scheme approved under Professional Standards Legislation.
Emerging AgTech trends: RIPPA
RIPPA (Robot for Intelligent Perception and Precision Application)
Developed by University of Sydney’s Australian Centre for Field Robotics, RIPPA is a four-wheeled, solar-powered device that identifies weeds in fields of vegetables and zaps them individually. It manages to do so with precisely measured and aimed doses of herbicide administered anywhere on the farm at high speed (University of Sydney, 2015). This is achieved through the use
of a Variable Injection Intelligent Precision Applicator. RIPPA will enable farmers to minimise application input costs and improve information quality for better high-level decision making.
Key takeaway for FNQ: Similar to other precision weeding robots being developed in Queensland and across Australia, this type of technology can help to remove certain major barriers to export for FNQ producers such as high labour costs that result in a lack of ability for exports to achieve international price competitiveness. Systems like RIPPA would reduce other input costs and facilitate more efficient farm management, enabling farmers to dedicate more time and resources to innovation and diversification of farms into new areas such as export. The RIPPA is also smaller and more affordable than other agricultural robots, acting as a feasible starting point to the digitisation of farms.
6.2.6. Export case study
Simon George & Sons
Simon George and Sons (SGS) is a wholesale provider of fresh fruit and vegetables of the highest quality and standards, with headquarters in Brisbane and a major facility in Cairns. Amongst other strengths, the business is distinguished by its commitment to quality, unique supply chains, licensed exporters, and sophisticated technology.
In the past SGS Cairns regularly exported fresh fruit and vegetables to Port Moresby, PNG. Unfortunately, however, in doing so SGS was forced to take on large amounts of additional work and complexity.
While the company enjoys efficient and transparent supply chains domestically, the facility’s past experiences with export were plagued by external disorganisation and unreliability out of SGS’s control. The company indicated several bottlenecks that eventually led to the termination of their export operations:
· Excessive amounts of paperwork and a lack of alignment between the bodies by whom the forms were required
· Substantially elevated pressure on quality control given SGS does not endorse fumigation or other forms of treatment, meaning a high-risk process in which products had to be meticulously identified as pest-free
CASE STUDY
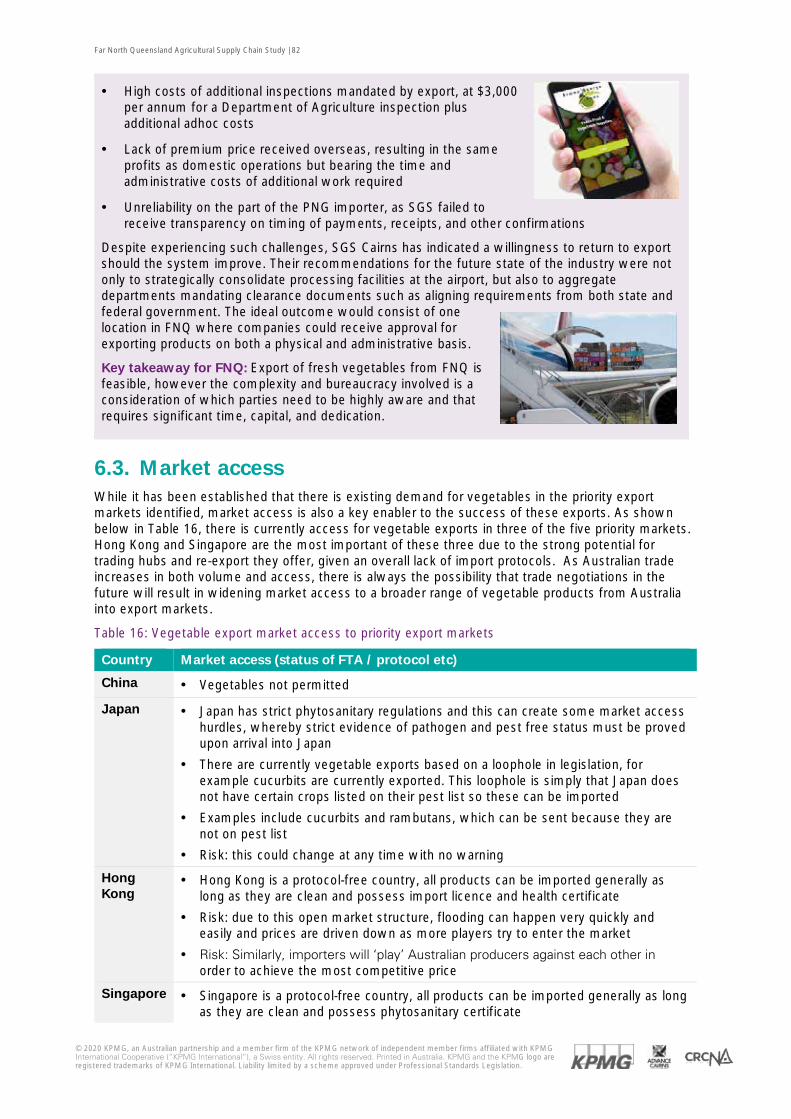
Far North Queensland Agricultural Supply Chain Study | 82
© 2020 KPMG, an Australian partnership and a member firm of the KPMG network of independent member firms affiliated with KPMG International Cooperative (“KPMG International”), a Swiss entity. All rights reserved. Printed in Australia. KPMG and the KPMG logo are registered trademarks of KPMG International. Liability limited by a scheme approved under Professional Standards Legislation.
· High costs of additional inspections mandated by export, at $3,000 per annum for a Department of Agriculture inspection plus additional adhoc costs
· Lack of premium price received overseas, resulting in the same profits as domestic operations but bearing the time and administrative costs of additional work required
· Unreliability on the part of the PNG importer, as SGS failed to receive transparency on timing of payments, receipts, and other confirmations
Despite experiencing such challenges, SGS Cairns has indicated a willingness to return to export should the system improve. Their recommendations for the future state of the industry were not only to strategically consolidate processing facilities at the airport, but also to aggregate departments mandating clearance documents such as aligning requirements from both state and federal government. The ideal outcome would consist of one location in FNQ where companies could receive approval for exporting products on both a physical and administrative basis.
Key takeaway for FNQ: Export of fresh vegetables from FNQ is feasible, however the complexity and bureaucracy involved is a consideration of which parties need to be highly aware and that requires significant time, capital, and dedication.
6.3. Market access While it has been established that there is existing demand for vegetables in the priority export markets identified, market access is also a key enabler to the success of these exports. As shown below in Table 16, there is currently access for vegetable exports in three of the five priority markets. Hong Kong and Singapore are the most important of these three due to the strong potential for trading hubs and re-export they offer, given an overall lack of import protocols. As Australian trade increases in both volume and access, there is always the possibility that trade negotiations in the future will result in widening market access to a broader range of vegetable products from Australia into export markets.
Table 16: Vegetable export market access to priority export markets
Country Market access (status of FTA / protocol etc)
China · Vegetables not permitted
Japan · Japan has strict phytosanitary regulations and this can create some market access hurdles, whereby strict evidence of pathogen and pest free status must be proved upon arrival into Japan
· There are currently vegetable exports based on a loophole in legislation, for example cucurbits are currently exported. This loophole is simply that Japan does not have certain crops listed on their pest list so these can be imported
· Examples include cucurbits and rambutans, which can be sent because they are not on pest list
· Risk: this could change at any time with no warning
Hong Kong
· Hong Kong is a protocol-free country, all products can be imported generally as long as they are clean and possess import licence and health certificate
· Risk: due to this open market structure, flooding can happen very quickly and easily and prices are driven down as more players try to enter the market
· Risk: Similarly, importers will ‘play’ Australian producers against each other in order to achieve the most competitive price
Singapore · Singapore is a protocol-free country, all products can be imported generally as long as they are clean and possess phytosanitary certificate
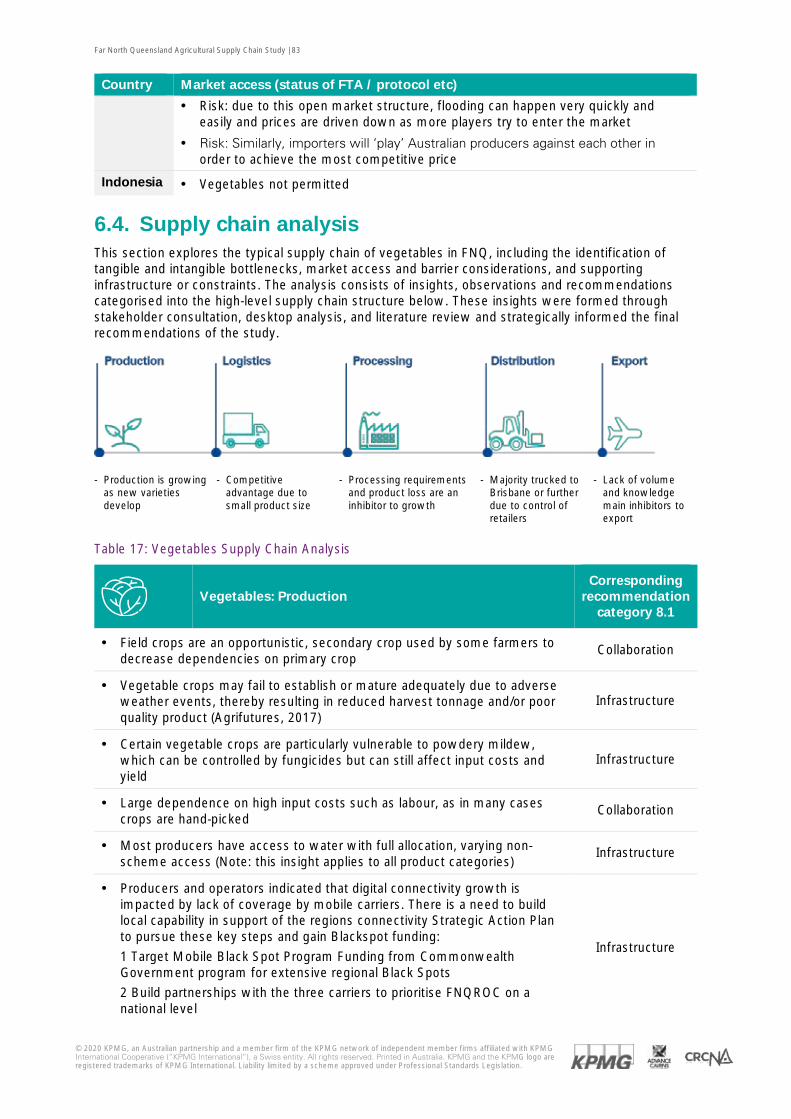
Far North Queensland Agricultural Supply Chain Study | 83
© 2020 KPMG, an Australian partnership and a member firm of the KPMG network of independent member firms affiliated with KPMG International Cooperative (“KPMG International”), a Swiss entity. All rights reserved. Printed in Australia. KPMG and the KPMG logo are registered trademarks of KPMG International. Liability limited by a scheme approved under Professional Standards Legislation.
Country Market access (status of FTA / protocol etc)
· Risk: due to this open market structure, flooding can happen very quickly and easily and prices are driven down as more players try to enter the market
· Risk: Similarly, importers will ‘play’ Australian producers against each other in order to achieve the most competitive price
Indonesia · Vegetables not permitted
6.4. Supply chain analysis This section explores the typical supply chain of vegetables in FNQ, including the identification of tangible and intangible bottlenecks, market access and barrier considerations, and supporting infrastructure or constraints. The analysis consists of insights, observations and recommendations categorised into the high-level supply chain structure below. These insights were formed through stakeholder consultation, desktop analysis, and literature review and strategically informed the final recommendations of the study.
- Production is growing as new varieties develop
- Competitive advantage due to small product size
- Processing requirements and product loss are an inhibitor to growth
- Majority trucked to Brisbane or further due to control of retailers
- Lack of volume and knowledge main inhibitors to export
Table 17: Vegetables Supply Chain Analysis
Vegetables: Production
Corresponding recommendation
category 8.1
· Field crops are an opportunistic, secondary crop used by some farmers to decrease dependencies on primary crop
Collaboration
· Vegetable crops may fail to establish or mature adequately due to adverse weather events, thereby resulting in reduced harvest tonnage and/or poor quality product (Agrifutures, 2017)
Infrastructure
· Certain vegetable crops are particularly vulnerable to powdery mildew, which can be controlled by fungicides but can still affect input costs and yield
Infrastructure
· Large dependence on high input costs such as labour, as in many cases crops are hand-picked
Collaboration
· Most producers have access to water with full allocation, varying non-scheme access (Note: this insight applies to all product categories)
Infrastructure
· Producers and operators indicated that digital connectivity growth is impacted by lack of coverage by mobile carriers. There is a need to build local capability in support of the regions connectivity Strategic Action Plan to pursue these key steps and gain Blackspot funding: 1 Target Mobile Black Spot Program Funding from Commonwealth Government program for extensive regional Black Spots 2 Build partnerships with the three carriers to prioritise FNQROC on a national level
Infrastructure
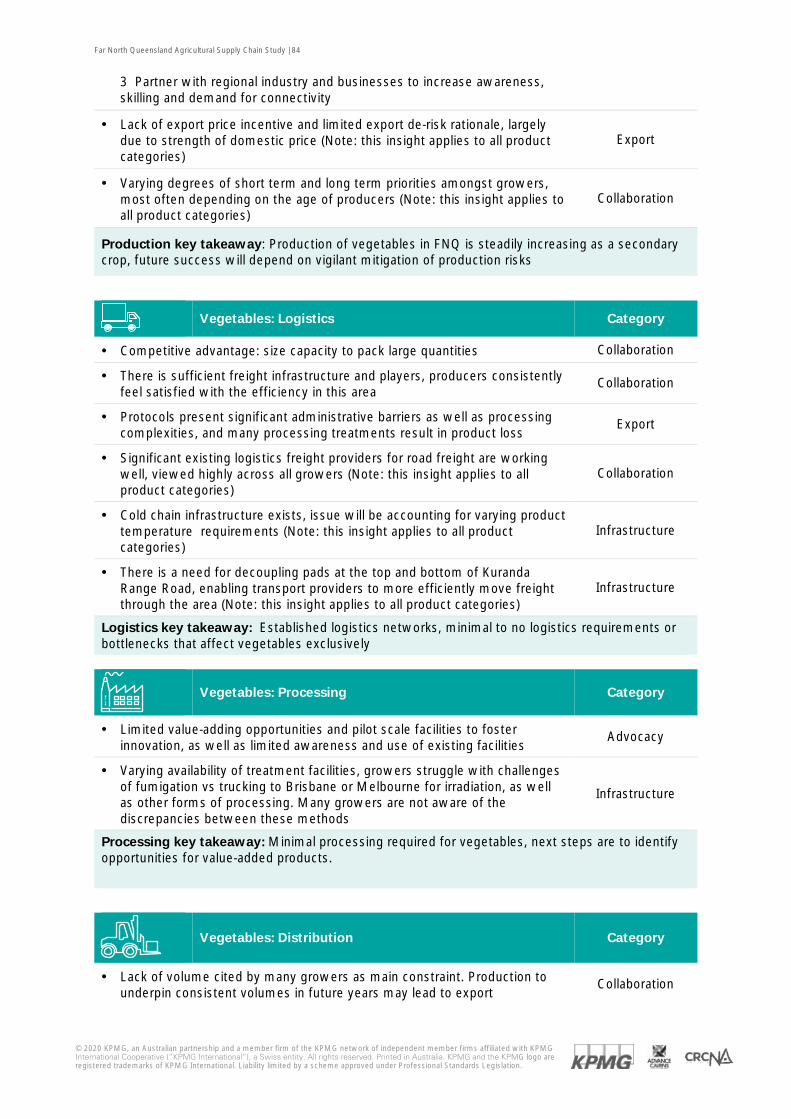
Far North Queensland Agricultural Supply Chain Study | 84
© 2020 KPMG, an Australian partnership and a member firm of the KPMG network of independent member firms affiliated with KPMG International Cooperative (“KPMG International”), a Swiss entity. All rights reserved. Printed in Australia. KPMG and the KPMG logo are registered trademarks of KPMG International. Liability limited by a scheme approved under Professional Standards Legislation.
3 Partner with regional industry and businesses to increase awareness, skilling and demand for connectivity
· Lack of export price incentive and limited export de-risk rationale, largely due to strength of domestic price (Note: this insight applies to all product categories)
Export
· Varying degrees of short term and long term priorities amongst growers, most often depending on the age of producers (Note: this insight applies to all product categories)
Collaboration
Production key takeaway: Production of vegetables in FNQ is steadily increasing as a secondary crop, future success will depend on vigilant mitigation of production risks
Vegetables: Logistics Category
· Competitive advantage: size capacity to pack large quantities Collaboration
· There is sufficient freight infrastructure and players, producers consistently feel satisfied with the efficiency in this area
Collaboration
· Protocols present significant administrative barriers as well as processing complexities, and many processing treatments result in product loss
Export
· Significant existing logistics freight providers for road freight are working well, viewed highly across all growers (Note: this insight applies to all product categories)
Collaboration
· Cold chain infrastructure exists, issue will be accounting for varying product temperature requirements (Note: this insight applies to all product categories)
Infrastructure
· There is a need for decoupling pads at the top and bottom of Kuranda Range Road, enabling transport providers to more efficiently move freight through the area (Note: this insight applies to all product categories)
Infrastructure
Logistics key takeaway: Established logistics networks, minimal to no logistics requirements or bottlenecks that affect vegetables exclusively
Vegetables: Processing Category
· Limited value-adding opportunities and pilot scale facilities to foster innovation, as well as limited awareness and use of existing facilities
Advocacy
· Varying availability of treatment facilities, growers struggle with challenges of fumigation vs trucking to Brisbane or Melbourne for irradiation, as well as other forms of processing. Many growers are not aware of the discrepancies between these methods
Infrastructure
Processing key takeaway: Minimal processing required for vegetables, next steps are to identify opportunities for value-added products.
Vegetables: Distribution Category
· Lack of volume cited by many growers as main constraint. Production to underpin consistent volumes in future years may lead to export
Collaboration
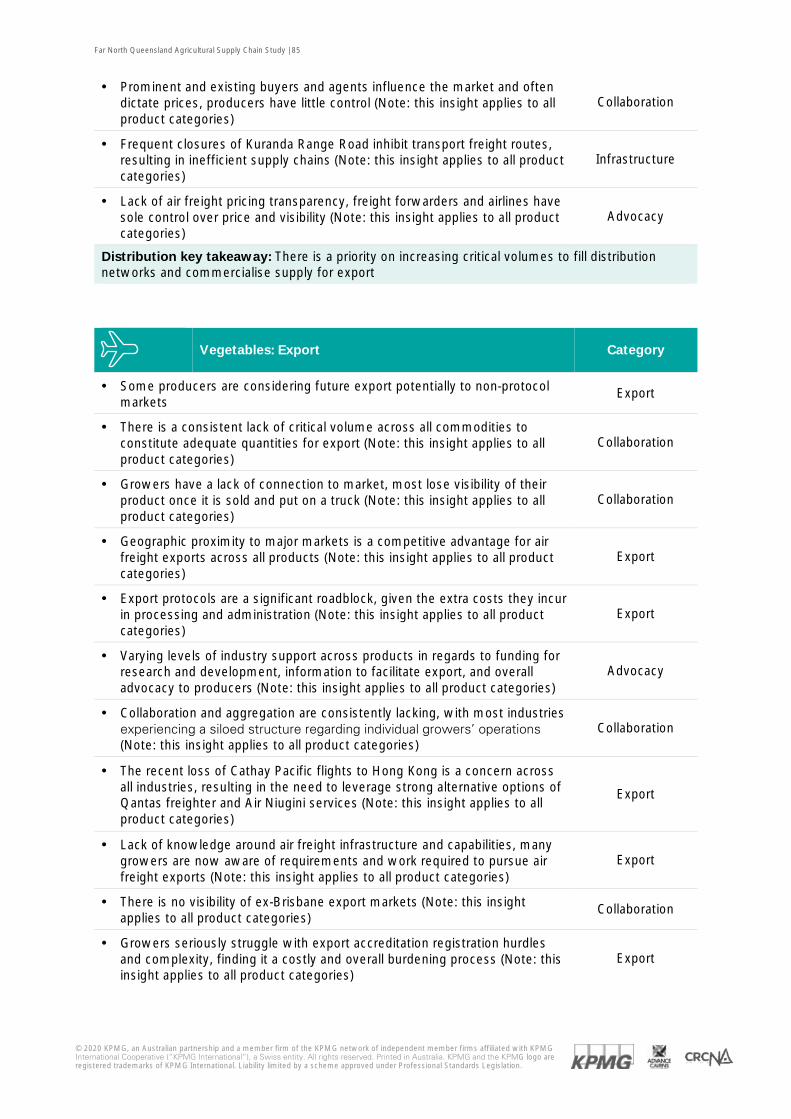
Far North Queensland Agricultural Supply Chain Study | 85
© 2020 KPMG, an Australian partnership and a member firm of the KPMG network of independent member firms affiliated with KPMG International Cooperative (“KPMG International”), a Swiss entity. All rights reserved. Printed in Australia. KPMG and the KPMG logo are registered trademarks of KPMG International. Liability limited by a scheme approved under Professional Standards Legislation.
· Prominent and existing buyers and agents influence the market and often dictate prices, producers have little control (Note: this insight applies to all product categories)
Collaboration
· Frequent closures of Kuranda Range Road inhibit transport freight routes, resulting in inefficient supply chains (Note: this insight applies to all product categories)
Infrastructure
· Lack of air freight pricing transparency, freight forwarders and airlines have sole control over price and visibility (Note: this insight applies to all product categories)
Advocacy
Distribution key takeaway: There is a priority on increasing critical volumes to fill distribution networks and commercialise supply for export
Vegetables: Export Category
· Some producers are considering future export potentially to non-protocol markets
Export
· There is a consistent lack of critical volume across all commodities to constitute adequate quantities for export (Note: this insight applies to all product categories)
Collaboration
· Growers have a lack of connection to market, most lose visibility of their product once it is sold and put on a truck (Note: this insight applies to all product categories)
Collaboration
· Geographic proximity to major markets is a competitive advantage for air freight exports across all products (Note: this insight applies to all product categories)
Export
· Export protocols are a significant roadblock, given the extra costs they incur in processing and administration (Note: this insight applies to all product categories)
Export
· Varying levels of industry support across products in regards to funding for research and development, information to facilitate export, and overall advocacy to producers (Note: this insight applies to all product categories)
Advocacy
· Collaboration and aggregation are consistently lacking, with most industries experiencing a siloed structure regarding individual growers’ operations (Note: this insight applies to all product categories)
Collaboration
· The recent loss of Cathay Pacific flights to Hong Kong is a concern across all industries, resulting in the need to leverage strong alternative options of Qantas freighter and Air Niugini services (Note: this insight applies to all product categories)
Export
· Lack of knowledge around air freight infrastructure and capabilities, many growers are now aware of requirements and work required to pursue air freight exports (Note: this insight applies to all product categories)
Export
· There is no visibility of ex-Brisbane export markets (Note: this insight applies to all product categories)
Collaboration
· Growers seriously struggle with export accreditation registration hurdles and complexity, finding it a costly and overall burdening process (Note: this insight applies to all product categories)
Export
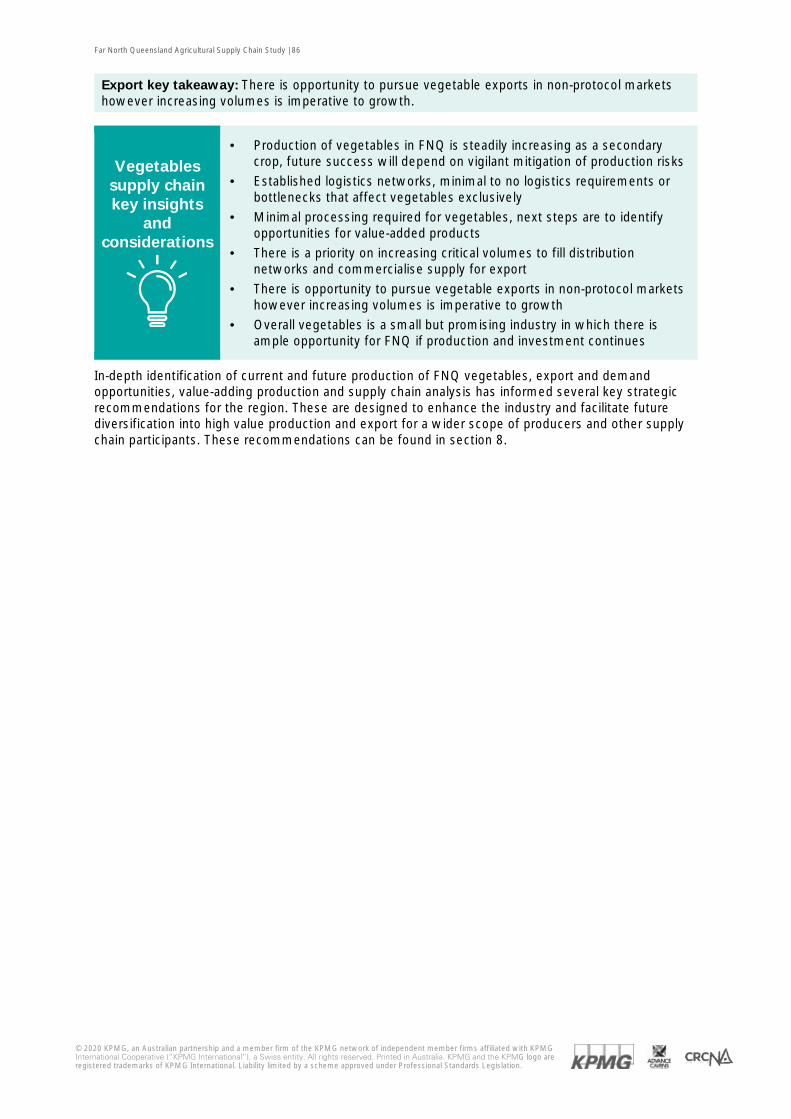
Far North Queensland Agricultural Supply Chain Study | 86
© 2020 KPMG, an Australian partnership and a member firm of the KPMG network of independent member firms affiliated with KPMG International Cooperative (“KPMG International”), a Swiss entity. All rights reserved. Printed in Australia. KPMG and the KPMG logo are registered trademarks of KPMG International. Liability limited by a scheme approved under Professional Standards Legislation.
In-depth identification of current and future production of FNQ vegetables, export and demand opportunities, value-adding production and supply chain analysis has informed several key strategic recommendations for the region. These are designed to enhance the industry and facilitate future diversification into high value production and export for a wider scope of producers and other supply chain participants. These recommendations can be found in section 8.
Export key takeaway: There is opportunity to pursue vegetable exports in non-protocol markets however increasing volumes is imperative to growth.
Vegetables supply chain key insights
and considerations
· Production of vegetables in FNQ is steadily increasing as a secondary crop, future success will depend on vigilant mitigation of production risks
· Established logistics networks, minimal to no logistics requirements or bottlenecks that affect vegetables exclusively
· Minimal processing required for vegetables, next steps are to identify opportunities for value-added products
· There is a priority on increasing critical volumes to fill distribution networks and commercialise supply for export
· There is opportunity to pursue vegetable exports in non-protocol markets however increasing volumes is imperative to growth
· Overall vegetables is a small but promising industry in which there is ample opportunity for FNQ if production and investment continues
Far North Queensland Agricultural Supply Chain Study | 87
© 2020 KPMG, an Australian partnership and a member firm of the KPMG network of independent member firms affiliated with KPMG International Cooperative (“KPMG International”), a Swiss entity. All rights reserved. Printed in Australia. KPMG and the KPMG logo are registered trademarks of KPMG International. Liability limited by a scheme approved under Professional Standards Legislation.
7. Beef
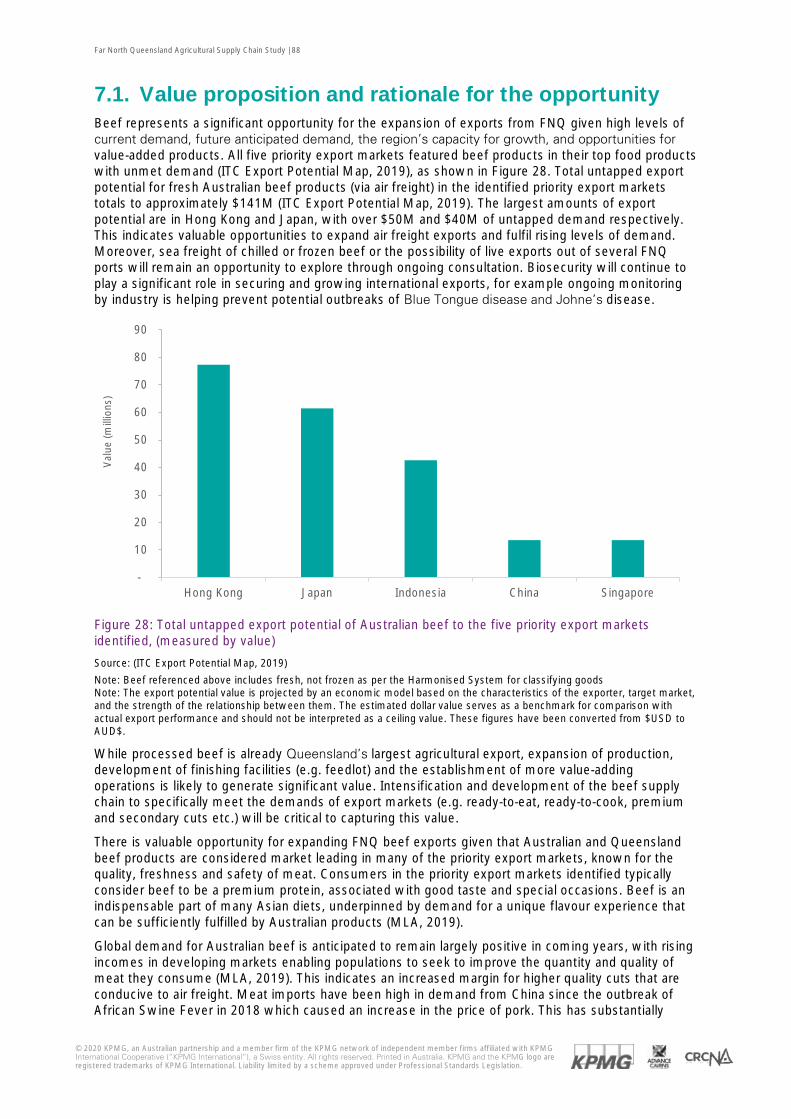
Far North Queensland Agricultural Supply Chain Study | 88
© 2020 KPMG, an Australian partnership and a member firm of the KPMG network of independent member firms affiliated with KPMG International Cooperative (“KPMG International”), a Swiss entity. All rights reserved. Printed in Australia. KPMG and the KPMG logo are registered trademarks of KPMG International. Liability limited by a scheme approved under Professional Standards Legislation.
7.1. Value proposition and rationale for the opportunity Beef represents a significant opportunity for the expansion of exports from FNQ given high levels of current demand, future anticipated demand, the region’s capacity for growth, and opportunities for value-added products. All five priority export markets featured beef products in their top food products with unmet demand (ITC Export Potential Map, 2019), as shown in Figure 28. Total untapped export potential for fresh Australian beef products (via air freight) in the identified priority export markets totals to approximately $141M (ITC Export Potential Map, 2019). The largest amounts of export potential are in Hong Kong and Japan, with over $50M and $40M of untapped demand respectively. This indicates valuable opportunities to expand air freight exports and fulfil rising levels of demand. Moreover, sea freight of chilled or frozen beef or the possibility of live exports out of several FNQ ports will remain an opportunity to explore through ongoing consultation. Biosecurity will continue to play a significant role in securing and growing international exports, for example ongoing monitoring by industry is helping prevent potential outbreaks of Blue Tongue disease and Johne’s disease.
Figure 28: Total untapped export potential of Australian beef to the five priority export markets identified, (measured by value)
Source: (ITC Export Potential Map, 2019)
Note: Beef referenced above includes fresh, not frozen as per the Harmonised System for classifying goods Note: The export potential value is projected by an economic model based on the characteristics of the exporter, target market, and the strength of the relationship between them. The estimated dollar value serves as a benchmark for comparison with actual export performance and should not be interpreted as a ceiling value. These figures have been converted from $USD to AUD$.
While processed beef is already Queensland’s largest agricultural export, expansion of production, development of finishing facilities (e.g. feedlot) and the establishment of more value-adding operations is likely to generate significant value. Intensification and development of the beef supply chain to specifically meet the demands of export markets (e.g. ready-to-eat, ready-to-cook, premium and secondary cuts etc.) will be critical to capturing this value.
There is valuable opportunity for expanding FNQ beef exports given that Australian and Queensland beef products are considered market leading in many of the priority export markets, known for the quality, freshness and safety of meat. Consumers in the priority export markets identified typically consider beef to be a premium protein, associated with good taste and special occasions. Beef is an indispensable part of many Asian diets, underpinned by demand for a unique flavour experience that can be sufficiently fulfilled by Australian products (MLA, 2019).
Global demand for Australian beef is anticipated to remain largely positive in coming years, with rising incomes in developing markets enabling populations to seek to improve the quantity and quality of meat they consume (MLA, 2019). This indicates an increased margin for higher quality cuts that are conducive to air freight. Meat imports have been high in demand from China since the outbreak of African Swine Fever in 2018 which caused an increase in the price of pork. This has substantially
-
10
20
30
40
50
60
70
80
90
Hong Kong Japan Indonesia China Singapore
Val
ue (m
illio
ns)
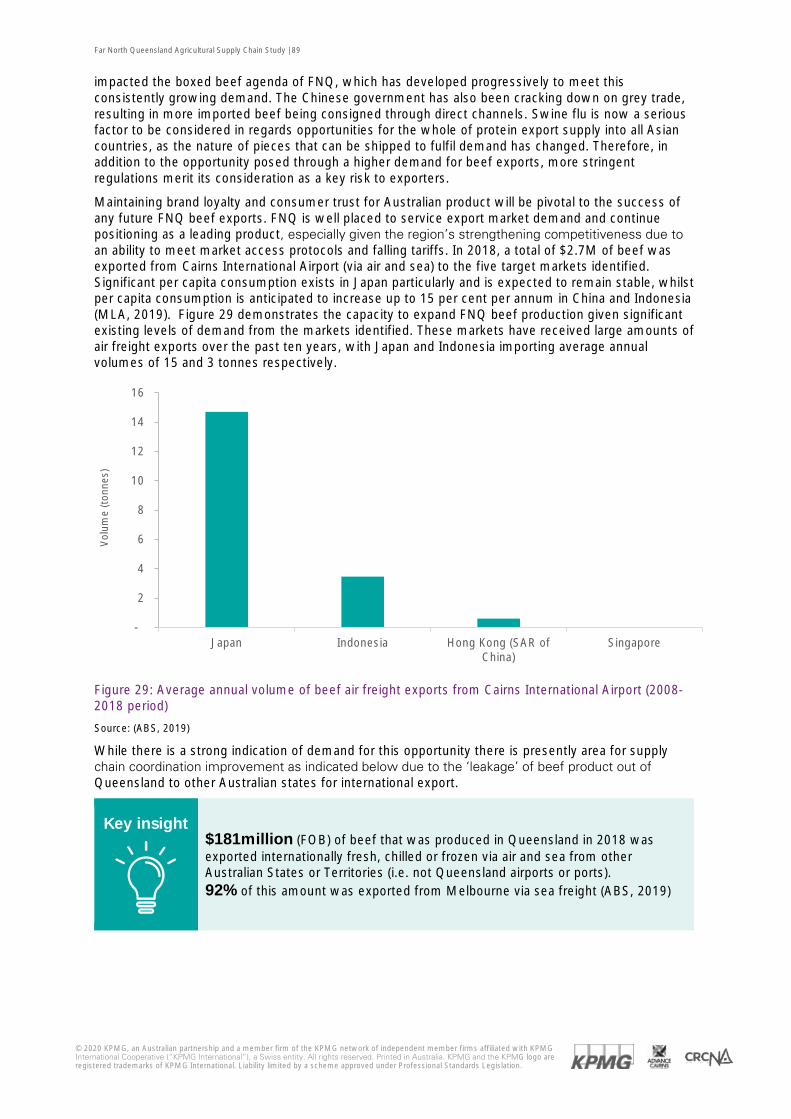
Far North Queensland Agricultural Supply Chain Study | 89
© 2020 KPMG, an Australian partnership and a member firm of the KPMG network of independent member firms affiliated with KPMG International Cooperative (“KPMG International”), a Swiss entity. All rights reserved. Printed in Australia. KPMG and the KPMG logo are registered trademarks of KPMG International. Liability limited by a scheme approved under Professional Standards Legislation.
impacted the boxed beef agenda of FNQ, which has developed progressively to meet this consistently growing demand. The Chinese government has also been cracking down on grey trade, resulting in more imported beef being consigned through direct channels. Swine flu is now a serious factor to be considered in regards opportunities for the whole of protein export supply into all Asian countries, as the nature of pieces that can be shipped to fulfil demand has changed. Therefore, in addition to the opportunity posed through a higher demand for beef exports, more stringent regulations merit its consideration as a key risk to exporters.
Maintaining brand loyalty and consumer trust for Australian product will be pivotal to the success of any future FNQ beef exports. FNQ is well placed to service export market demand and continue positioning as a leading product, especially given the region’s strengthening competitiveness due to an ability to meet market access protocols and falling tariffs. In 2018, a total of $2.7M of beef was exported from Cairns International Airport (via air and sea) to the five target markets identified. Significant per capita consumption exists in Japan particularly and is expected to remain stable, whilst per capita consumption is anticipated to increase up to 15 per cent per annum in China and Indonesia (MLA, 2019). Figure 29 demonstrates the capacity to expand FNQ beef production given significant existing levels of demand from the markets identified. These markets have received large amounts of air freight exports over the past ten years, with Japan and Indonesia importing average annual volumes of 15 and 3 tonnes respectively.
Figure 29: Average annual volume of beef air freight exports from Cairns International Airport (2008-2018 period)
Source: (ABS, 2019)
While there is a strong indication of demand for this opportunity there is presently area for supply chain coordination improvement as indicated below due to the ‘leakage’ of beef product out of Queensland to other Australian states for international export.
Key insight
$181million (FOB) of beef that was produced in Queensland in 2018 was exported internationally fresh, chilled or frozen via air and sea from other Australian States or Territories (i.e. not Queensland airports or ports). 92% of this amount was exported from Melbourne via sea freight (ABS, 2019)
-
2
4
6
8
10
12
14
16
Japan Indonesia Hong Kong (SAR ofChina)
Singapore
Vol
ume
(ton
nes)
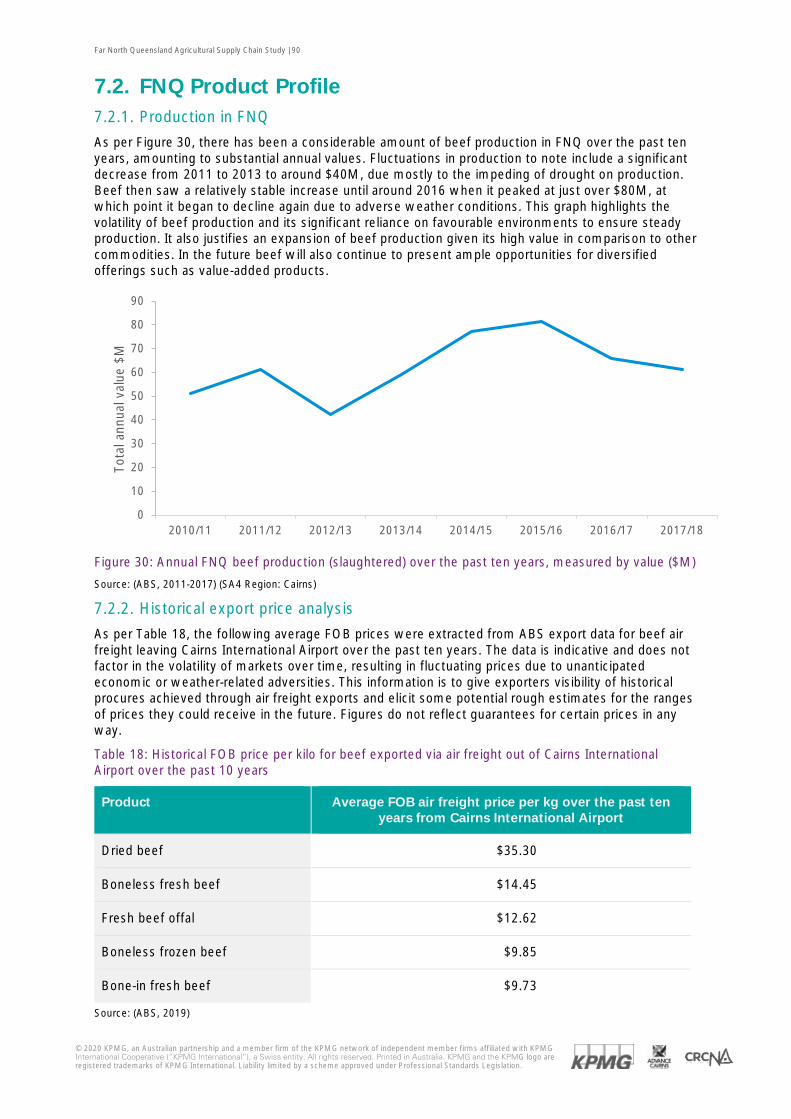
Far North Queensland Agricultural Supply Chain Study | 90
© 2020 KPMG, an Australian partnership and a member firm of the KPMG network of independent member firms affiliated with KPMG International Cooperative (“KPMG International”), a Swiss entity. All rights reserved. Printed in Australia. KPMG and the KPMG logo are registered trademarks of KPMG International. Liability limited by a scheme approved under Professional Standards Legislation.
7.2. FNQ Product Profile 7.2.1. Production in FNQ
As per Figure 30, there has been a considerable amount of beef production in FNQ over the past ten years, amounting to substantial annual values. Fluctuations in production to note include a significant decrease from 2011 to 2013 to around $40M, due mostly to the impeding of drought on production. Beef then saw a relatively stable increase until around 2016 when it peaked at just over $80M, at which point it began to decline again due to adverse weather conditions. This graph highlights the volatility of beef production and its significant reliance on favourable environments to ensure steady production. It also justifies an expansion of beef production given its high value in comparison to other commodities. In the future beef will also continue to present ample opportunities for diversified offerings such as value-added products.
Figure 30: Annual FNQ beef production (slaughtered) over the past ten years, measured by value ($M)
Source: (ABS, 2011-2017) (SA4 Region: Cairns)
7.2.2. Historical export price analysis
As per Table 18, the following average FOB prices were extracted from ABS export data for beef air freight leaving Cairns International Airport over the past ten years. The data is indicative and does not factor in the volatility of markets over time, resulting in fluctuating prices due to unanticipated economic or weather-related adversities. This information is to give exporters visibility of historical procures achieved through air freight exports and elicit some potential rough estimates for the ranges of prices they could receive in the future. Figures do not reflect guarantees for certain prices in any way.
Table 18: Historical FOB price per kilo for beef exported via air freight out of Cairns International Airport over the past 10 years
Product Average FOB air freight price per kg over the past ten years from Cairns International Airport
Dried beef $35.30
Boneless fresh beef $14.45
Fresh beef offal $12.62
Boneless frozen beef $9.85
Bone-in fresh beef $9.73
Source: (ABS, 2019)
0
10
20
30
40
50
60
70
80
90
2010/11 2011/12 2012/13 2013/14 2014/15 2015/16 2016/17 2017/18
Tota
l ann
ual v
alue
$M
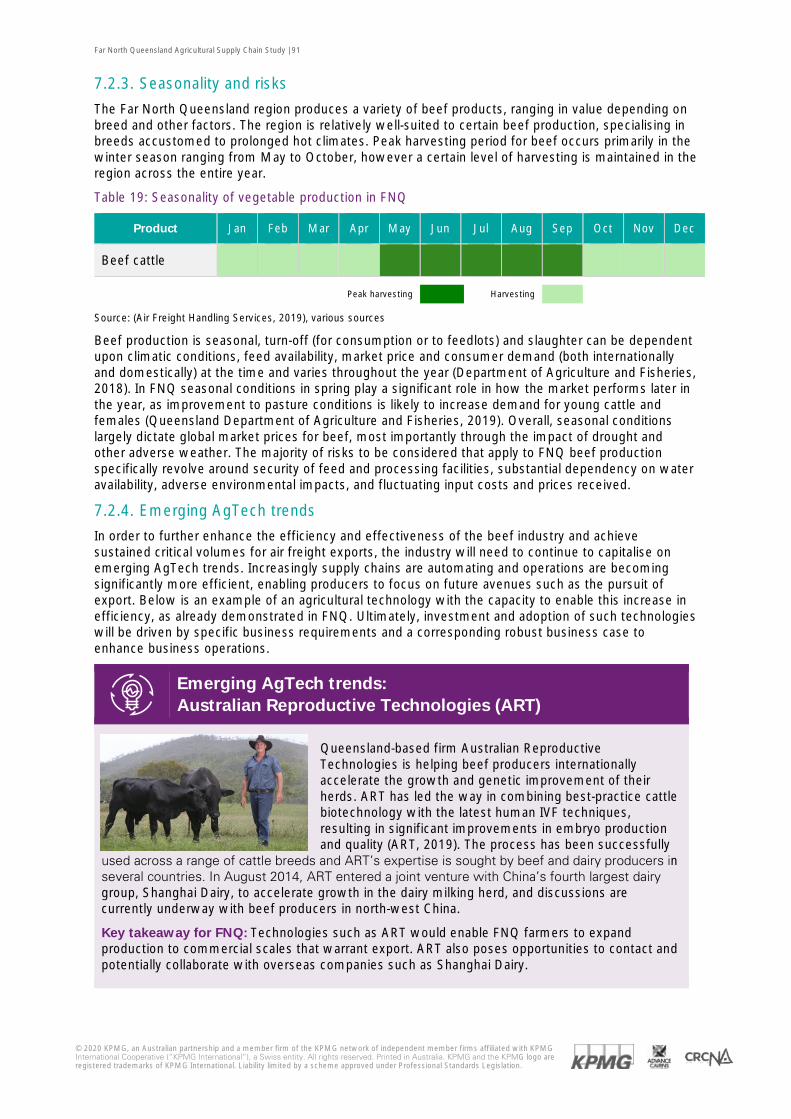
Far North Queensland Agricultural Supply Chain Study | 91
© 2020 KPMG, an Australian partnership and a member firm of the KPMG network of independent member firms affiliated with KPMG International Cooperative (“KPMG International”), a Swiss entity. All rights reserved. Printed in Australia. KPMG and the KPMG logo are registered trademarks of KPMG International. Liability limited by a scheme approved under Professional Standards Legislation.
7.2.3. Seasonality and risks
The Far North Queensland region produces a variety of beef products, ranging in value depending on breed and other factors. The region is relatively well-suited to certain beef production, specialising in breeds accustomed to prolonged hot climates. Peak harvesting period for beef occurs primarily in the winter season ranging from May to October, however a certain level of harvesting is maintained in the region across the entire year.
Table 19: Seasonality of vegetable production in FNQ
Product Jan Feb Mar Apr May Jun Jul Aug Sep Oct Nov Dec
Beef cattle
Peak harvesting Harvesting
Source: (Air Freight Handling Services, 2019), various sources
Beef production is seasonal, turn-off (for consumption or to feedlots) and slaughter can be dependent upon climatic conditions, feed availability, market price and consumer demand (both internationally and domestically) at the time and varies throughout the year (Department of Agriculture and Fisheries, 2018). In FNQ seasonal conditions in spring play a significant role in how the market performs later in the year, as improvement to pasture conditions is likely to increase demand for young cattle and females (Queensland Department of Agriculture and Fisheries, 2019). Overall, seasonal conditions largely dictate global market prices for beef, most importantly through the impact of drought and other adverse weather. The majority of risks to be considered that apply to FNQ beef production specifically revolve around security of feed and processing facilities, substantial dependency on water availability, adverse environmental impacts, and fluctuating input costs and prices received.
7.2.4. Emerging AgTech trends
In order to further enhance the efficiency and effectiveness of the beef industry and achieve sustained critical volumes for air freight exports, the industry will need to continue to capitalise on emerging AgTech trends. Increasingly supply chains are automating and operations are becoming significantly more efficient, enabling producers to focus on future avenues such as the pursuit of export. Below is an example of an agricultural technology with the capacity to enable this increase in efficiency, as already demonstrated in FNQ. Ultimately, investment and adoption of such technologies will be driven by specific business requirements and a corresponding robust business case to enhance business operations.
Emerging AgTech trends: Australian Reproductive Technologies (ART)
Queensland-based firm Australian Reproductive Technologies is helping beef producers internationally accelerate the growth and genetic improvement of their herds. ART has led the way in combining best-practice cattle biotechnology with the latest human IVF techniques, resulting in significant improvements in embryo production and quality (ART, 2019). The process has been successfully
used across a range of cattle breeds and ART’s expertise is sought by beef and dairy producers in several countries. In August 2014, ART entered a joint venture with China’s fourth largest dairy group, Shanghai Dairy, to accelerate growth in the dairy milking herd, and discussions are currently underway with beef producers in north-west China.
Key takeaway for FNQ: Technologies such as ART would enable FNQ farmers to expand production to commercial scales that warrant export. ART also poses opportunities to contact and potentially collaborate with overseas companies such as Shanghai Dairy.
Far North Queensland Agricultural Supply Chain Study | 92
© 2020 KPMG, an Australian partnership and a member firm of the KPMG network of independent member firms affiliated with KPMG International Cooperative (“KPMG International”), a Swiss entity. All rights reserved. Printed in Australia. KPMG and the KPMG logo are registered trademarks of KPMG International. Liability limited by a scheme approved under Professional Standards Legislation.
7.2.5. Value-adding opportunities
Beef is a sector with numerous opportunities for value-added products, given production that has the capacity for alignment with organic or premium cut operations. There are a few organic beef producers in Queensland, as well as several who are already exporting premium cuts to Asia. Dried beef, pre-prepared speciality beef products, and gift meats are other common value-adding areas in beef production. The Atherton Tablelands have particularly strong capacity for value-adding production as a micro-market opportunity for material change given favourable climate and feed conditions, resulting in highly fertile soils conducive to quality beef production. This enables the region to meet emerging markets for high quality, specialised, pre-prepared beef products.
With the intensification of the industry and increased support for development of new breeds in the future state, there is potential to sufficiently expand on lucrative value-added beef markets. See below an example of a producer that has been successful in this area.
Jervoise Station
Located five hours west of Cairns, Jervoise station is the only certified organic cattle station within the scope area of this study. The station has mainly Brahman cattle, with an interest in producing higher quality beef in the future to attract higher prices. Their organic production is the primary source of profits for their business, as it is highly popular in the domestic market.
From an air freight perspective, the value-adding points of differentiation of Jervoise Station’s products position the company favourably for export. They face similar challenges relating to the complexity of export protocols, red tape, and federal export accreditation. Other deterrents include securing supply contracts with international buyers and finding a market for non-prime cuts. Jervoise is also inhibited by a lack of feedlots and other processing facilities, given the closure of certain facilities in the area in recent years. The ideal future state for exporting Jervoise Station’s value-added beef products would involve a multi-species processing facility on-farm, thereby furthering the extent of their ‘locally-grown’ brand. Given progress to the alleviation of some of these export challenges in the future, there is substantial potential to leverage the high value, organic competitive advantage of the Jervoise beef brand overseas.
Key takeaway for FNQ:
Jervoise sets a prime example of the ambition in FNQ to pursue high value beef exports, as well as the barrier that is created by extensive complexity. If more beef producers were to align with the goals of companies like Jervoise, there may be potential for the critical mass of beef production necessary for export in FNQ.
CASE STUDY
Far North Queensland Agricultural Supply Chain Study | 93
© 2020 KPMG, an Australian partnership and a member firm of the KPMG network of independent member firms affiliated with KPMG International Cooperative (“KPMG International”), a Swiss entity. All rights reserved. Printed in Australia. KPMG and the KPMG logo are registered trademarks of KPMG International. Liability limited by a scheme approved under Professional Standards Legislation.
7.2.6. Export case study
Angus Pastoral Company (APC)
Beef producers Blair and Josie Angus of Angus Pastoral Company based in Clermont, Central Queensland, are heads of what is now Australia’s fourth largest beef exporter into the EU grain fed quota. The company sends around 80 tonnes per month of 15 primal cuts. APC exports a number of different brands that cater to the demands of a total of 18 overseas countries. The APC brand
consists predominantly of Angus Belmont Red cattle and is promoted and sold in 14 European countries, the original brand Kimberley Red focuses on domestic, Chinese and UK markets, the Sondella brand is sold to Japan, and the Great Barrier Beef brand is packed exclusively for a Dutch importer. APC also reflects the importance of adaptability to changes in market dynamics. When the US was granted a new quota for beef the company shifted production systems to adhere to US specifications, enabling rapid response upon the announcement of Australia’s inclusion in the deal. Despite challenges such as volatile currencies, the Angus’s insist that the export market offers the most stable, long term prices and producers can achieve a significant premium (Signature Beef, 2011).
Key takeaway for FNQ: Although Angus Pastoral Company is outside of the study scope, this story acts as a prime example of what could be possible for FNQ beef producers given progress in infrastructure development and more importantly, research and development into higher value cattle breeds that are conducive to the FNQ region and to export. APC demonstrates the feasibility in exporting Australian beef worldwide and the potential value in fostering strong relationships with importers to build an overseas distribution network. Overall APC indicates a potential for promising growth of the FNQ beef industry in the future.
CASE STUDY
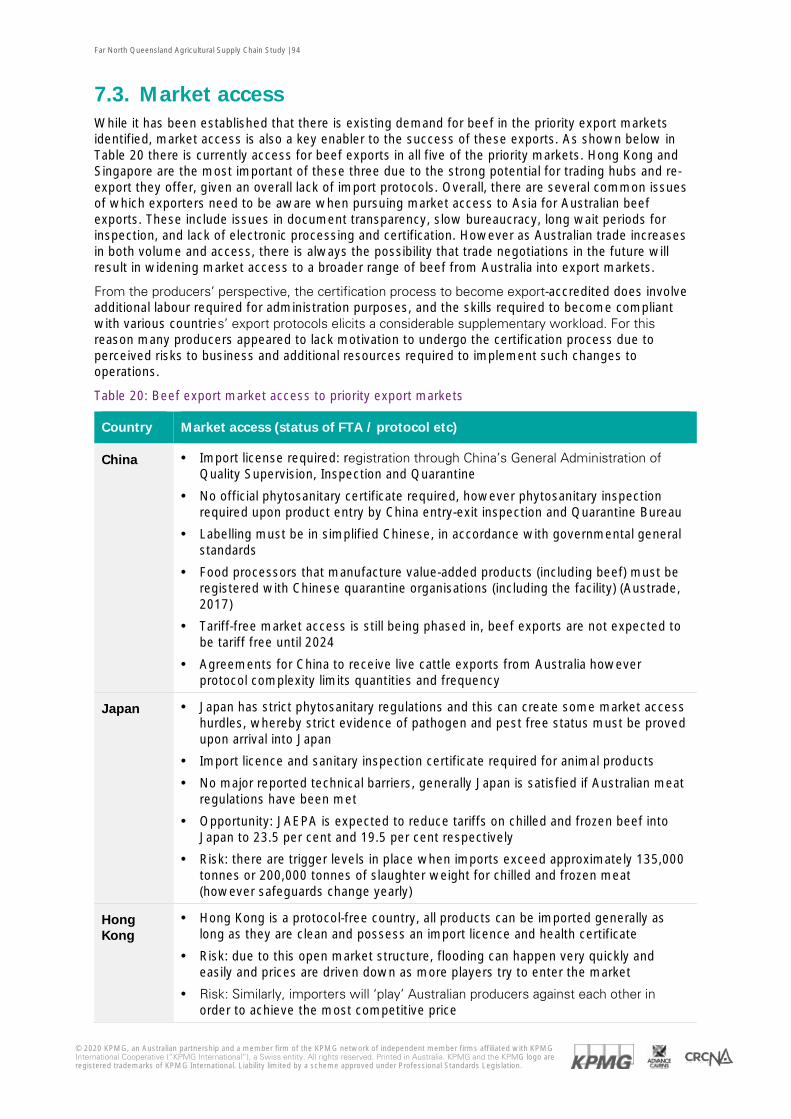
Far North Queensland Agricultural Supply Chain Study | 94
© 2020 KPMG, an Australian partnership and a member firm of the KPMG network of independent member firms affiliated with KPMG International Cooperative (“KPMG International”), a Swiss entity. All rights reserved. Printed in Australia. KPMG and the KPMG logo are registered trademarks of KPMG International. Liability limited by a scheme approved under Professional Standards Legislation.
7.3. Market access While it has been established that there is existing demand for beef in the priority export markets identified, market access is also a key enabler to the success of these exports. As shown below in Table 20 there is currently access for beef exports in all five of the priority markets. Hong Kong and Singapore are the most important of these three due to the strong potential for trading hubs and re-export they offer, given an overall lack of import protocols. Overall, there are several common issues of which exporters need to be aware when pursuing market access to Asia for Australian beef exports. These include issues in document transparency, slow bureaucracy, long wait periods for inspection, and lack of electronic processing and certification. However as Australian trade increases in both volume and access, there is always the possibility that trade negotiations in the future will result in widening market access to a broader range of beef from Australia into export markets.
From the producers’ perspective, the certification process to become export-accredited does involve additional labour required for administration purposes, and the skills required to become compliant with various countries’ export protocols elicits a considerable supplementary workload. For this reason many producers appeared to lack motivation to undergo the certification process due to perceived risks to business and additional resources required to implement such changes to operations.
Table 20: Beef export market access to priority export markets
Country Market access (status of FTA / protocol etc)
China · Import license required: registration through China’s General Administration of Quality Supervision, Inspection and Quarantine
· No official phytosanitary certificate required, however phytosanitary inspection required upon product entry by China entry-exit inspection and Quarantine Bureau
· Labelling must be in simplified Chinese, in accordance with governmental general standards
· Food processors that manufacture value-added products (including beef) must be registered with Chinese quarantine organisations (including the facility) (Austrade, 2017)
· Tariff-free market access is still being phased in, beef exports are not expected to be tariff free until 2024
· Agreements for China to receive live cattle exports from Australia however protocol complexity limits quantities and frequency
Japan · Japan has strict phytosanitary regulations and this can create some market access hurdles, whereby strict evidence of pathogen and pest free status must be proved upon arrival into Japan
· Import licence and sanitary inspection certificate required for animal products
· No major reported technical barriers, generally Japan is satisfied if Australian meat regulations have been met
· Opportunity: JAEPA is expected to reduce tariffs on chilled and frozen beef into Japan to 23.5 per cent and 19.5 per cent respectively
· Risk: there are trigger levels in place when imports exceed approximately 135,000 tonnes or 200,000 tonnes of slaughter weight for chilled and frozen meat (however safeguards change yearly)
Hong Kong
· Hong Kong is a protocol-free country, all products can be imported generally as long as they are clean and possess an import licence and health certificate
· Risk: due to this open market structure, flooding can happen very quickly and easily and prices are driven down as more players try to enter the market
· Risk: Similarly, importers will ‘play’ Australian producers against each other in order to achieve the most competitive price
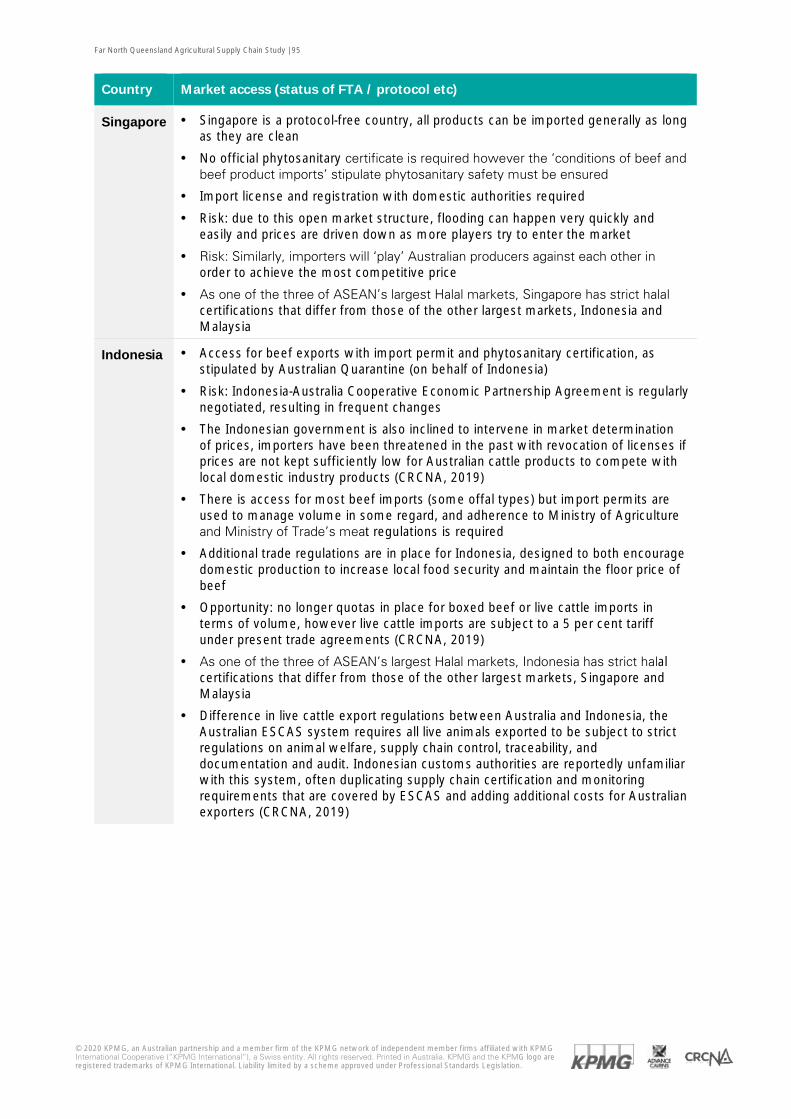
Far North Queensland Agricultural Supply Chain Study | 95
© 2020 KPMG, an Australian partnership and a member firm of the KPMG network of independent member firms affiliated with KPMG International Cooperative (“KPMG International”), a Swiss entity. All rights reserved. Printed in Australia. KPMG and the KPMG logo are registered trademarks of KPMG International. Liability limited by a scheme approved under Professional Standards Legislation.
Country Market access (status of FTA / protocol etc)
Singapore · Singapore is a protocol-free country, all products can be imported generally as long as they are clean
· No official phytosanitary certificate is required however the ‘conditions of beef and beef product imports’ stipulate phytosanitary safety must be ensured
· Import license and registration with domestic authorities required
· Risk: due to this open market structure, flooding can happen very quickly and easily and prices are driven down as more players try to enter the market
· Risk: Similarly, importers will ‘play’ Australian producers against each other in order to achieve the most competitive price
· As one of the three of ASEAN’s largest Halal markets, Singapore has strict halal certifications that differ from those of the other largest markets, Indonesia and Malaysia
Indonesia · Access for beef exports with import permit and phytosanitary certification, as stipulated by Australian Quarantine (on behalf of Indonesia)
· Risk: Indonesia-Australia Cooperative Economic Partnership Agreement is regularly negotiated, resulting in frequent changes
· The Indonesian government is also inclined to intervene in market determination of prices, importers have been threatened in the past with revocation of licenses if prices are not kept sufficiently low for Australian cattle products to compete with local domestic industry products (CRCNA, 2019)
· There is access for most beef imports (some offal types) but import permits are used to manage volume in some regard, and adherence to Ministry of Agriculture and Ministry of Trade’s meat regulations is required
· Additional trade regulations are in place for Indonesia, designed to both encourage domestic production to increase local food security and maintain the floor price of beef
· Opportunity: no longer quotas in place for boxed beef or live cattle imports in terms of volume, however live cattle imports are subject to a 5 per cent tariff under present trade agreements (CRCNA, 2019)
· As one of the three of ASEAN’s largest Halal markets, Indonesia has strict halal certifications that differ from those of the other largest markets, Singapore and Malaysia
· Difference in live cattle export regulations between Australia and Indonesia, the Australian ESCAS system requires all live animals exported to be subject to strict regulations on animal welfare, supply chain control, traceability, and documentation and audit. Indonesian customs authorities are reportedly unfamiliar with this system, often duplicating supply chain certification and monitoring requirements that are covered by ESCAS and adding additional costs for Australian exporters (CRCNA, 2019)
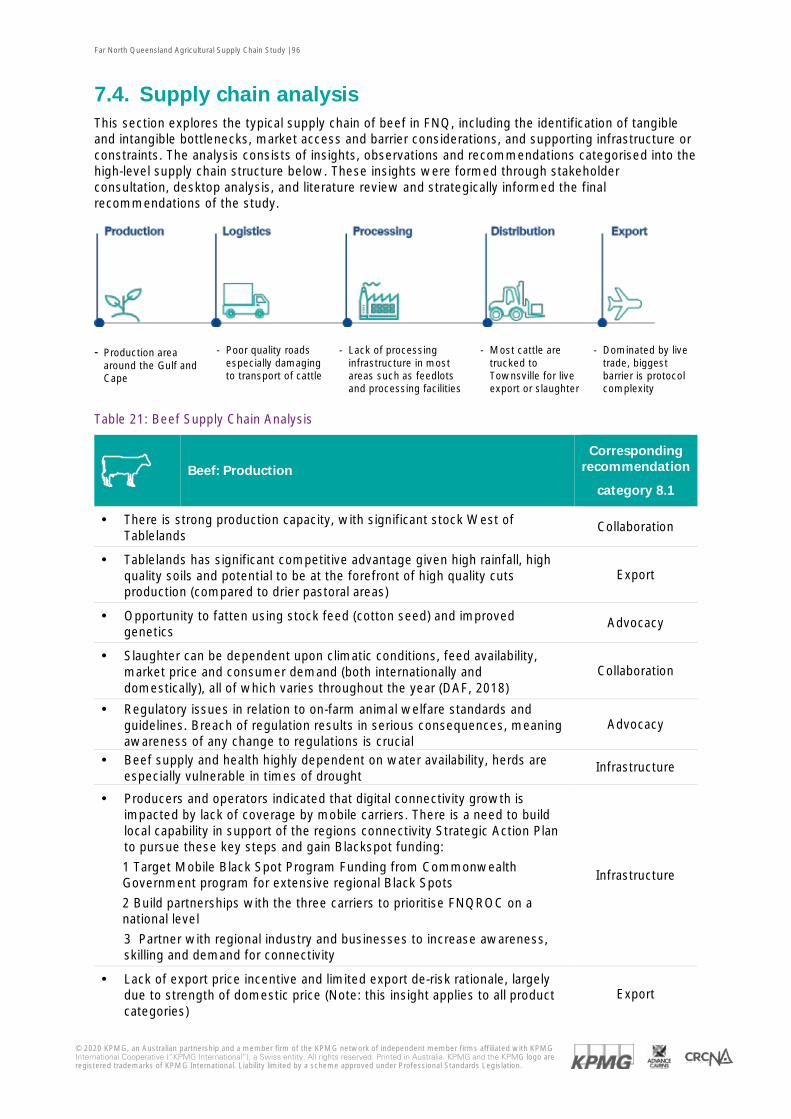
Far North Queensland Agricultural Supply Chain Study | 96
© 2020 KPMG, an Australian partnership and a member firm of the KPMG network of independent member firms affiliated with KPMG International Cooperative (“KPMG International”), a Swiss entity. All rights reserved. Printed in Australia. KPMG and the KPMG logo are registered trademarks of KPMG International. Liability limited by a scheme approved under Professional Standards Legislation.
7.4. Supply chain analysis This section explores the typical supply chain of beef in FNQ, including the identification of tangible and intangible bottlenecks, market access and barrier considerations, and supporting infrastructure or constraints. The analysis consists of insights, observations and recommendations categorised into the high-level supply chain structure below. These insights were formed through stakeholder consultation, desktop analysis, and literature review and strategically informed the final recommendations of the study.
- Production area around the Gulf and Cape
- Poor quality roads especially damaging to transport of cattle
- Lack of processing infrastructure in most areas such as feedlots and processing facilities
- Most cattle are trucked to Townsville for live export or slaughter
- Dominated by live trade, biggest barrier is protocol complexity
Table 21: Beef Supply Chain Analysis
Beef: Production
Corresponding recommendation
category 8.1
· There is strong production capacity, with significant stock West of Tablelands
Collaboration
· Tablelands has significant competitive advantage given high rainfall, high quality soils and potential to be at the forefront of high quality cuts production (compared to drier pastoral areas)
Export
· Opportunity to fatten using stock feed (cotton seed) and improved genetics
Advocacy
· Slaughter can be dependent upon climatic conditions, feed availability, market price and consumer demand (both internationally and domestically), all of which varies throughout the year (DAF, 2018)
Collaboration
· Regulatory issues in relation to on-farm animal welfare standards and guidelines. Breach of regulation results in serious consequences, meaning awareness of any change to regulations is crucial
Advocacy
· Beef supply and health highly dependent on water availability, herds are especially vulnerable in times of drought
Infrastructure
· Producers and operators indicated that digital connectivity growth is impacted by lack of coverage by mobile carriers. There is a need to build local capability in support of the regions connectivity Strategic Action Plan to pursue these key steps and gain Blackspot funding:
1 Target Mobile Black Spot Program Funding from Commonwealth Government program for extensive regional Black Spots
2 Build partnerships with the three carriers to prioritise FNQROC on a national level
3 Partner with regional industry and businesses to increase awareness, skilling and demand for connectivity
Infrastructure
· Lack of export price incentive and limited export de-risk rationale, largely due to strength of domestic price (Note: this insight applies to all product categories)
Export
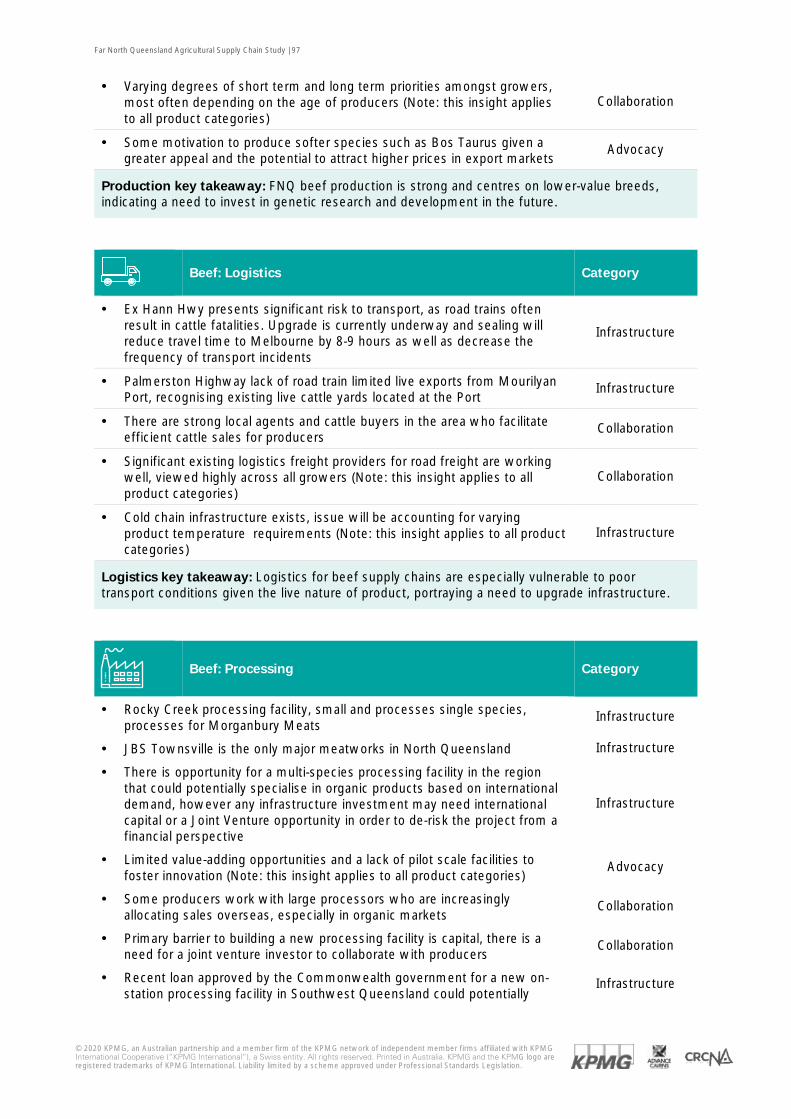
Far North Queensland Agricultural Supply Chain Study | 97
© 2020 KPMG, an Australian partnership and a member firm of the KPMG network of independent member firms affiliated with KPMG International Cooperative (“KPMG International”), a Swiss entity. All rights reserved. Printed in Australia. KPMG and the KPMG logo are registered trademarks of KPMG International. Liability limited by a scheme approved under Professional Standards Legislation.
· Varying degrees of short term and long term priorities amongst growers, most often depending on the age of producers (Note: this insight applies to all product categories)
Collaboration
· Some motivation to produce softer species such as Bos Taurus given a greater appeal and the potential to attract higher prices in export markets
Advocacy
Production key takeaway: FNQ beef production is strong and centres on lower-value breeds, indicating a need to invest in genetic research and development in the future.
Beef: Logistics Category
· Ex Hann Hwy presents significant risk to transport, as road trains often result in cattle fatalities. Upgrade is currently underway and sealing will reduce travel time to Melbourne by 8-9 hours as well as decrease the frequency of transport incidents
Infrastructure
· Palmerston Highway lack of road train limited live exports from Mourilyan Port, recognising existing live cattle yards located at the Port
Infrastructure
· There are strong local agents and cattle buyers in the area who facilitate efficient cattle sales for producers
Collaboration
· Significant existing logistics freight providers for road freight are working well, viewed highly across all growers (Note: this insight applies to all product categories)
Collaboration
· Cold chain infrastructure exists, issue will be accounting for varying product temperature requirements (Note: this insight applies to all product categories)
Infrastructure
Logistics key takeaway: Logistics for beef supply chains are especially vulnerable to poor transport conditions given the live nature of product, portraying a need to upgrade infrastructure.
Beef: Processing Category
· Rocky Creek processing facility, small and processes single species, processes for Morganbury Meats
Infrastructure
· JBS Townsville is the only major meatworks in North Queensland Infrastructure
· There is opportunity for a multi-species processing facility in the region that could potentially specialise in organic products based on international demand, however any infrastructure investment may need international capital or a Joint Venture opportunity in order to de-risk the project from a financial perspective
Infrastructure
· Limited value-adding opportunities and a lack of pilot scale facilities to foster innovation (Note: this insight applies to all product categories)
Advocacy
· Some producers work with large processors who are increasingly allocating sales overseas, especially in organic markets
Collaboration
· Primary barrier to building a new processing facility is capital, there is a need for a joint venture investor to collaborate with producers
Collaboration
· Recent loan approved by the Commonwealth government for a new on-station processing facility in Southwest Queensland could potentially
Infrastructure
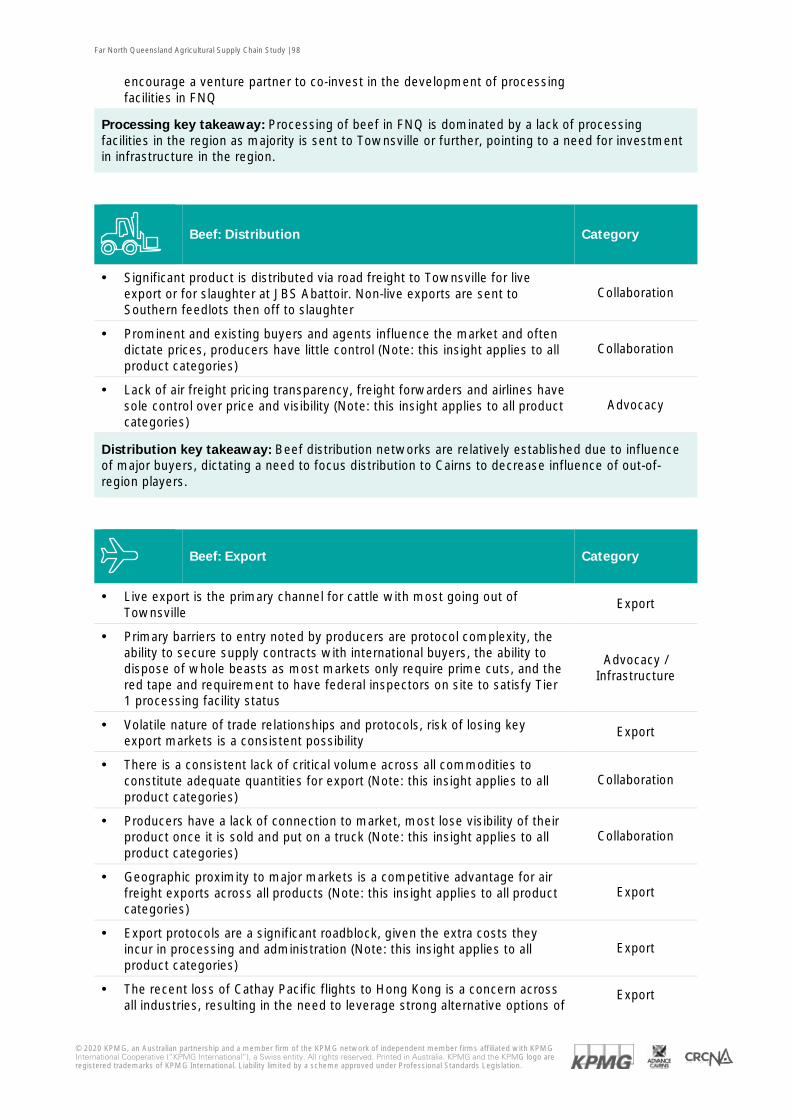
Far North Queensland Agricultural Supply Chain Study | 98
© 2020 KPMG, an Australian partnership and a member firm of the KPMG network of independent member firms affiliated with KPMG International Cooperative (“KPMG International”), a Swiss entity. All rights reserved. Printed in Australia. KPMG and the KPMG logo are registered trademarks of KPMG International. Liability limited by a scheme approved under Professional Standards Legislation.
encourage a venture partner to co-invest in the development of processing facilities in FNQ
Processing key takeaway: Processing of beef in FNQ is dominated by a lack of processing facilities in the region as majority is sent to Townsville or further, pointing to a need for investment in infrastructure in the region.
Beef: Distribution Category
· Significant product is distributed via road freight to Townsville for live export or for slaughter at JBS Abattoir. Non-live exports are sent to Southern feedlots then off to slaughter
Collaboration
· Prominent and existing buyers and agents influence the market and often dictate prices, producers have little control (Note: this insight applies to all product categories)
Collaboration
· Lack of air freight pricing transparency, freight forwarders and airlines have sole control over price and visibility (Note: this insight applies to all product categories)
Advocacy
Distribution key takeaway: Beef distribution networks are relatively established due to influence of major buyers, dictating a need to focus distribution to Cairns to decrease influence of out-of-region players.
Beef: Export Category
· Live export is the primary channel for cattle with most going out of Townsville
Export
· Primary barriers to entry noted by producers are protocol complexity, the ability to secure supply contracts with international buyers, the ability to dispose of whole beasts as most markets only require prime cuts, and the red tape and requirement to have federal inspectors on site to satisfy Tier 1 processing facility status
Advocacy / Infrastructure
· Volatile nature of trade relationships and protocols, risk of losing key export markets is a consistent possibility
Export
· There is a consistent lack of critical volume across all commodities to constitute adequate quantities for export (Note: this insight applies to all product categories)
Collaboration
· Producers have a lack of connection to market, most lose visibility of their product once it is sold and put on a truck (Note: this insight applies to all product categories)
Collaboration
· Geographic proximity to major markets is a competitive advantage for air freight exports across all products (Note: this insight applies to all product categories)
Export
· Export protocols are a significant roadblock, given the extra costs they incur in processing and administration (Note: this insight applies to all product categories)
Export
· The recent loss of Cathay Pacific flights to Hong Kong is a concern across all industries, resulting in the need to leverage strong alternative options of
Export
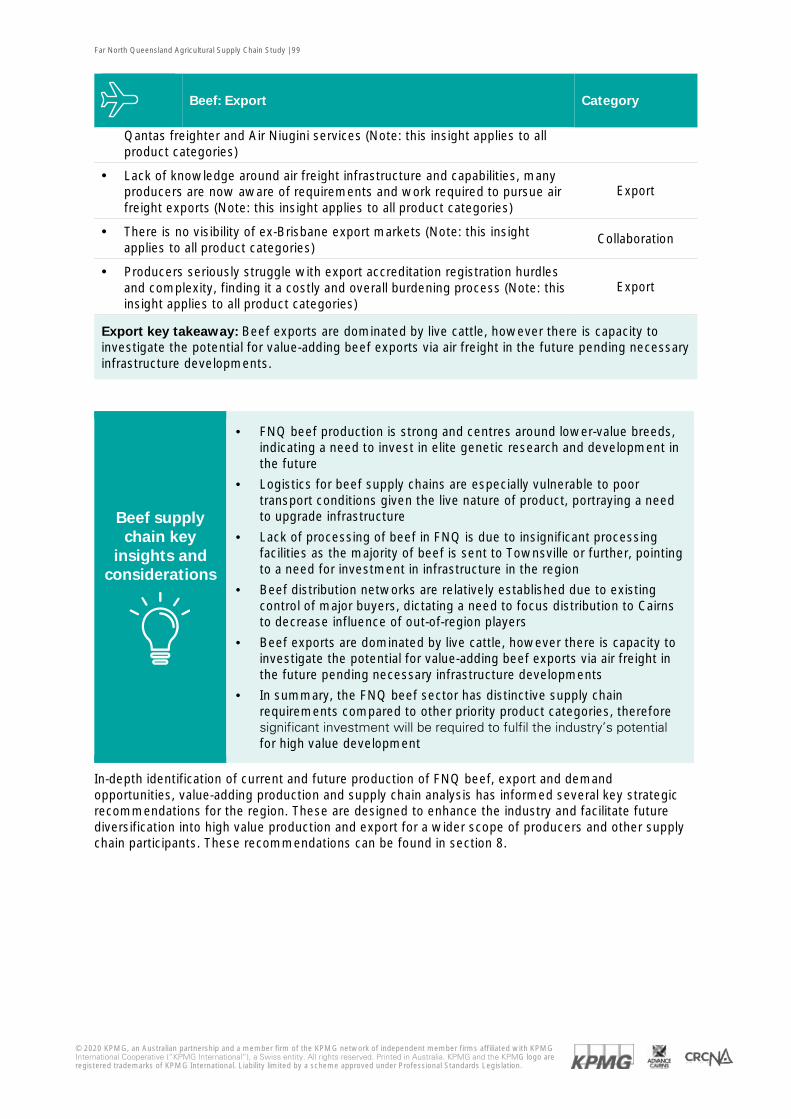
Far North Queensland Agricultural Supply Chain Study | 99
© 2020 KPMG, an Australian partnership and a member firm of the KPMG network of independent member firms affiliated with KPMG International Cooperative (“KPMG International”), a Swiss entity. All rights reserved. Printed in Australia. KPMG and the KPMG logo are registered trademarks of KPMG International. Liability limited by a scheme approved under Professional Standards Legislation.
Beef: Export Category
Qantas freighter and Air Niugini services (Note: this insight applies to all product categories)
· Lack of knowledge around air freight infrastructure and capabilities, many producers are now aware of requirements and work required to pursue air freight exports (Note: this insight applies to all product categories)
Export
· There is no visibility of ex-Brisbane export markets (Note: this insight applies to all product categories)
Collaboration
· Producers seriously struggle with export accreditation registration hurdles and complexity, finding it a costly and overall burdening process (Note: this insight applies to all product categories)
Export
Export key takeaway: Beef exports are dominated by live cattle, however there is capacity to investigate the potential for value-adding beef exports via air freight in the future pending necessary infrastructure developments.
Beef supply chain key
insights and considerations
· FNQ beef production is strong and centres around lower-value breeds, indicating a need to invest in elite genetic research and development in the future
· Logistics for beef supply chains are especially vulnerable to poor transport conditions given the live nature of product, portraying a need to upgrade infrastructure
· Lack of processing of beef in FNQ is due to insignificant processing facilities as the majority of beef is sent to Townsville or further, pointing to a need for investment in infrastructure in the region
· Beef distribution networks are relatively established due to existing control of major buyers, dictating a need to focus distribution to Cairns to decrease influence of out-of-region players
· Beef exports are dominated by live cattle, however there is capacity to investigate the potential for value-adding beef exports via air freight in the future pending necessary infrastructure developments
· In summary, the FNQ beef sector has distinctive supply chain requirements compared to other priority product categories, therefore significant investment will be required to fulfil the industry’s potential for high value development
In-depth identification of current and future production of FNQ beef, export and demand opportunities, value-adding production and supply chain analysis has informed several key strategic recommendations for the region. These are designed to enhance the industry and facilitate future diversification into high value production and export for a wider scope of producers and other supply chain participants. These recommendations can be found in section 8.
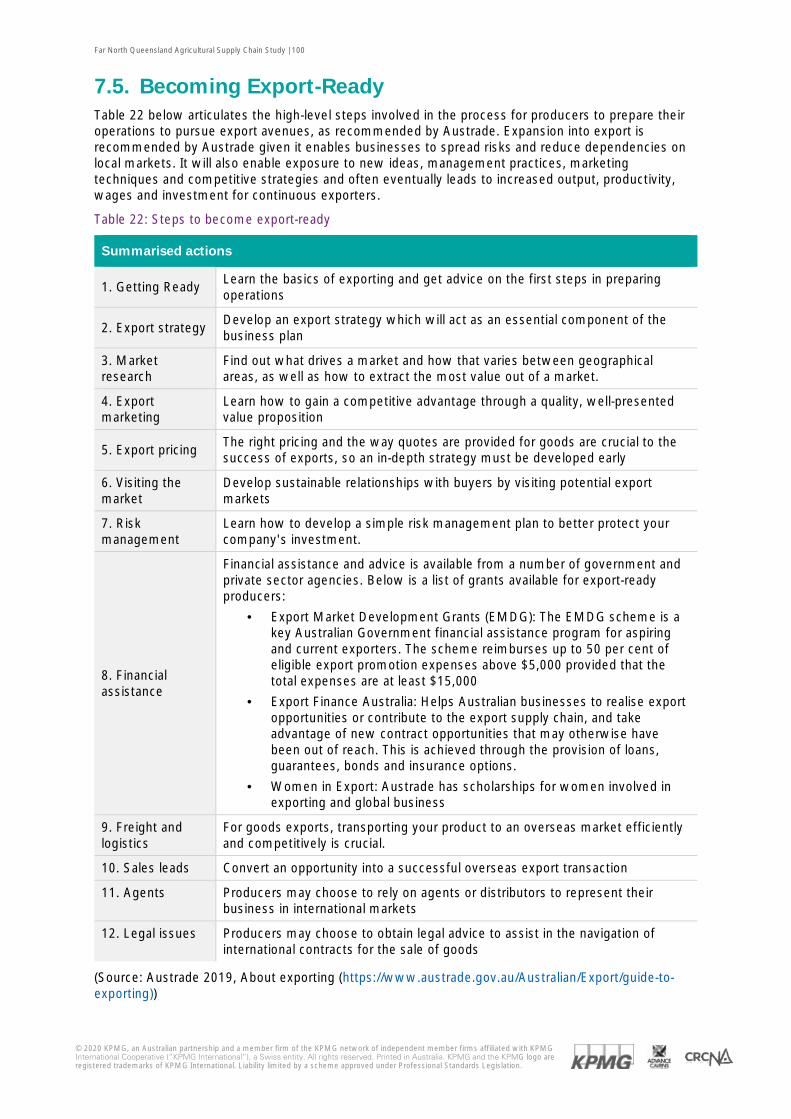
Far North Queensland Agricultural Supply Chain Study | 100
© 2020 KPMG, an Australian partnership and a member firm of the KPMG network of independent member firms affiliated with KPMG International Cooperative (“KPMG International”), a Swiss entity. All rights reserved. Printed in Australia. KPMG and the KPMG logo are registered trademarks of KPMG International. Liability limited by a scheme approved under Professional Standards Legislation.
7.5. Becoming Export-Ready Table 22 below articulates the high-level steps involved in the process for producers to prepare their operations to pursue export avenues, as recommended by Austrade. Expansion into export is recommended by Austrade given it enables businesses to spread risks and reduce dependencies on local markets. It will also enable exposure to new ideas, management practices, marketing techniques and competitive strategies and often eventually leads to increased output, productivity, wages and investment for continuous exporters.
Table 22: Steps to become export-ready
Summarised actions
1. Getting Ready Learn the basics of exporting and get advice on the first steps in preparing operations
2. Export strategy Develop an export strategy which will act as an essential component of the business plan
3. Market research
Find out what drives a market and how that varies between geographical areas, as well as how to extract the most value out of a market.
4. Export marketing
Learn how to gain a competitive advantage through a quality, well-presented value proposition
5. Export pricing The right pricing and the way quotes are provided for goods are crucial to the success of exports, so an in-depth strategy must be developed early
6. Visiting the market
Develop sustainable relationships with buyers by visiting potential export markets
7. Risk management
Learn how to develop a simple risk management plan to better protect your company's investment.
8. Financial assistance
Financial assistance and advice is available from a number of government and private sector agencies. Below is a list of grants available for export-ready producers:
· Export Market Development Grants (EMDG): The EMDG scheme is a key Australian Government financial assistance program for aspiring and current exporters. The scheme reimburses up to 50 per cent of eligible export promotion expenses above $5,000 provided that the total expenses are at least $15,000
· Export Finance Australia: Helps Australian businesses to realise export opportunities or contribute to the export supply chain, and take advantage of new contract opportunities that may otherwise have been out of reach. This is achieved through the provision of loans, guarantees, bonds and insurance options.
· Women in Export: Austrade has scholarships for women involved in exporting and global business
9. Freight and logistics
For goods exports, transporting your product to an overseas market efficiently and competitively is crucial.
10. Sales leads Convert an opportunity into a successful overseas export transaction
11. Agents Producers may choose to rely on agents or distributors to represent their business in international markets
12. Legal issues Producers may choose to obtain legal advice to assist in the navigation of international contracts for the sale of goods
(Source: Austrade 2019, About exporting (https://www.austrade.gov.au/Australian/Export/guide-to-exporting))
Far North Queensland Agricultural Supply Chain Study | 101
© 2020 KPMG, an Australian partnership and a member firm of the KPMG network of independent member firms affiliated with KPMG International Cooperative (“KPMG International”), a Swiss entity. All rights reserved. Printed in Australia. KPMG and the KPMG logo are registered trademarks of KPMG International. Liability limited by a scheme approved under Professional Standards Legislation.
8. Recommendations and implementation pathway
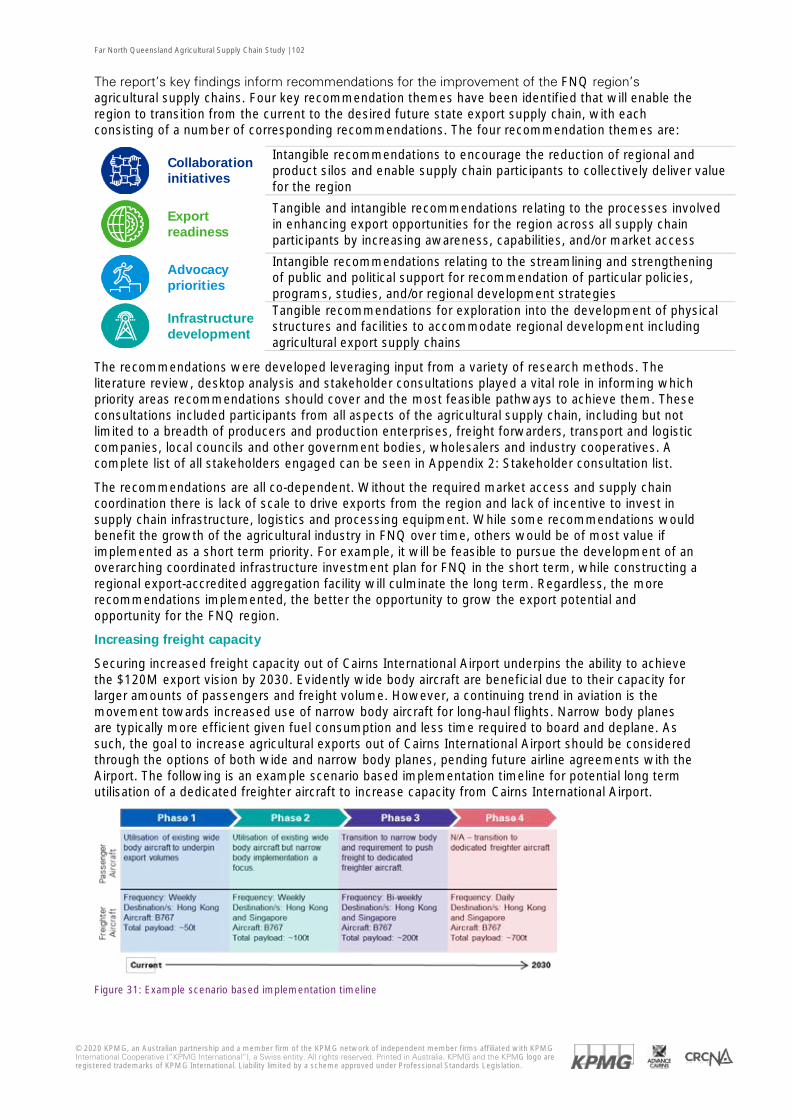
Far North Queensland Agricultural Supply Chain Study | 102
© 2020 KPMG, an Australian partnership and a member firm of the KPMG network of independent member firms affiliated with KPMG International Cooperative (“KPMG International”), a Swiss entity. All rights reserved. Printed in Australia. KPMG and the KPMG logo are registered trademarks of KPMG International. Liability limited by a scheme approved under Professional Standards Legislation.
The report’s key findings inform recommendations for the improvement of the FNQ region’s agricultural supply chains. Four key recommendation themes have been identified that will enable the region to transition from the current to the desired future state export supply chain, with each consisting of a number of corresponding recommendations. The four recommendation themes are:
Collaboration initiatives
Intangible recommendations to encourage the reduction of regional and product silos and enable supply chain participants to collectively deliver value for the region
Export readiness
Tangible and intangible recommendations relating to the processes involved in enhancing export opportunities for the region across all supply chain participants by increasing awareness, capabilities, and/or market access
Advocacy priorities
Intangible recommendations relating to the streamlining and strengthening of public and political support for recommendation of particular policies, programs, studies, and/or regional development strategies
Infrastructure development
Tangible recommendations for exploration into the development of physical structures and facilities to accommodate regional development including agricultural export supply chains
The recommendations were developed leveraging input from a variety of research methods. The literature review, desktop analysis and stakeholder consultations played a vital role in informing which priority areas recommendations should cover and the most feasible pathways to achieve them. These consultations included participants from all aspects of the agricultural supply chain, including but not limited to a breadth of producers and production enterprises, freight forwarders, transport and logistic companies, local councils and other government bodies, wholesalers and industry cooperatives. A complete list of all stakeholders engaged can be seen in Appendix 2: Stakeholder consultation list.
The recommendations are all co-dependent. Without the required market access and supply chain coordination there is lack of scale to drive exports from the region and lack of incentive to invest in supply chain infrastructure, logistics and processing equipment. While some recommendations would benefit the growth of the agricultural industry in FNQ over time, others would be of most value if implemented as a short term priority. For example, it will be feasible to pursue the development of an overarching coordinated infrastructure investment plan for FNQ in the short term, while constructing a regional export-accredited aggregation facility will culminate the long term. Regardless, the more recommendations implemented, the better the opportunity to grow the export potential and opportunity for the FNQ region.
Increasing freight capacity
Securing increased freight capacity out of Cairns International Airport underpins the ability to achieve the $120M export vision by 2030. Evidently wide body aircraft are beneficial due to their capacity for larger amounts of passengers and freight volume. However, a continuing trend in aviation is the movement towards increased use of narrow body aircraft for long-haul flights. Narrow body planes are typically more efficient given fuel consumption and less time required to board and deplane. As such, the goal to increase agricultural exports out of Cairns International Airport should be considered through the options of both wide and narrow body planes, pending future airline agreements with the Airport. The following is an example scenario based implementation timeline for potential long term utilisation of a dedicated freighter aircraft to increase capacity from Cairns International Airport.
Figure 31: Example scenario based implementation timeline
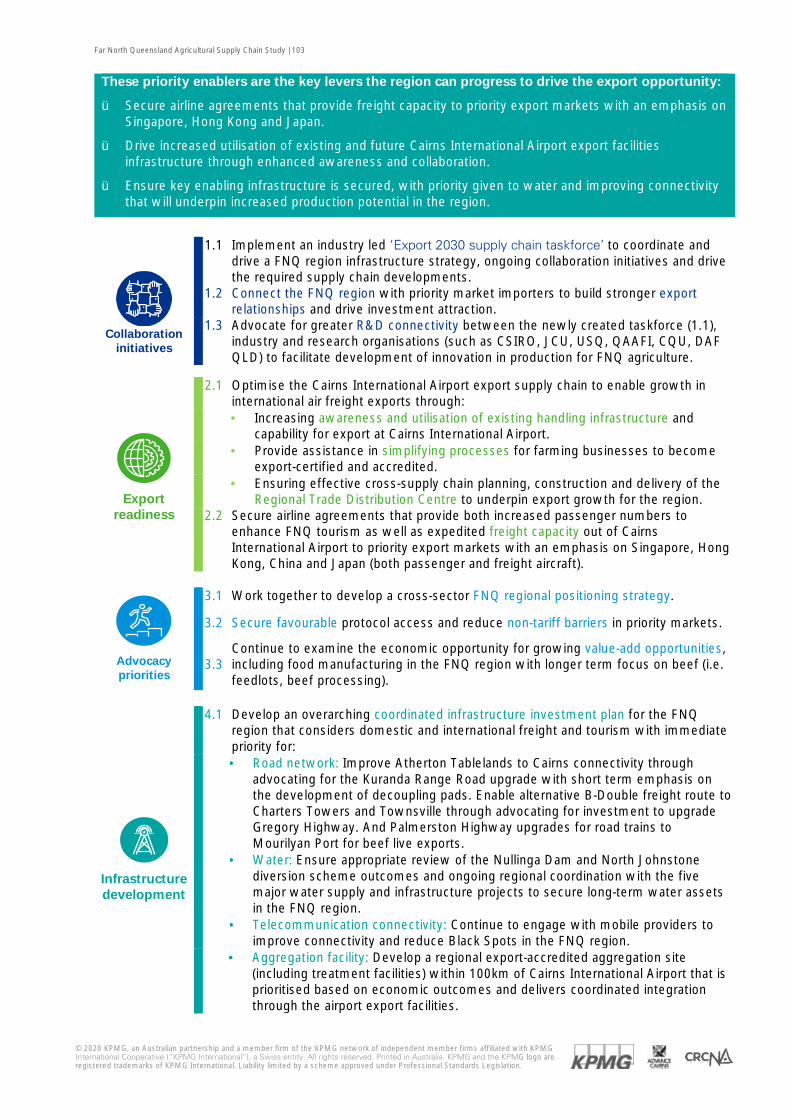
Far North Queensland Agricultural Supply Chain Study | 103
© 2020 KPMG, an Australian partnership and a member firm of the KPMG network of independent member firms affiliated with KPMG International Cooperative (“KPMG International”), a Swiss entity. All rights reserved. Printed in Australia. KPMG and the KPMG logo are registered trademarks of KPMG International. Liability limited by a scheme approved under Professional Standards Legislation.
These priority enablers are the key levers the region can progress to drive the export opportunity:
ü Secure airline agreements that provide freight capacity to priority export markets with an emphasis on Singapore, Hong Kong and Japan.
ü Drive increased utilisation of existing and future Cairns International Airport export facilities infrastructure through enhanced awareness and collaboration.
ü Ensure key enabling infrastructure is secured, with priority given to water and improving connectivity that will underpin increased production potential in the region.
Collaboration
initiatives
1.1 Implement an industry led ‘Export 2030 supply chain taskforce’ to coordinate and drive a FNQ region infrastructure strategy, ongoing collaboration initiatives and drive the required supply chain developments.
1.2 Connect the FNQ region with priority market importers to build stronger export relationships and drive investment attraction.
1.3 Advocate for greater R&D connectivity between the newly created taskforce (1.1), industry and research organisations (such as CSIRO, JCU, USQ, QAAFI, CQU, DAF QLD) to facilitate development of innovation in production for FNQ agriculture.
Export readiness
2.1 Optimise the Cairns International Airport export supply chain to enable growth in international air freight exports through:
· Increasing awareness and utilisation of existing handling infrastructure and capability for export at Cairns International Airport.
· Provide assistance in simplifying processes for farming businesses to become export-certified and accredited.
· Ensuring effective cross-supply chain planning, construction and delivery of the Regional Trade Distribution Centre to underpin export growth for the region.
2.2 Secure airline agreements that provide both increased passenger numbers to enhance FNQ tourism as well as expedited freight capacity out of Cairns International Airport to priority export markets with an emphasis on Singapore, Hong Kong, China and Japan (both passenger and freight aircraft).
Advocacy priorities
3.1 Work together to develop a cross-sector FNQ regional positioning strategy.
3.2 Secure favourable protocol access and reduce non-tariff barriers in priority markets.
3.3 Continue to examine the economic opportunity for growing value-add opportunities, including food manufacturing in the FNQ region with longer term focus on beef (i.e. feedlots, beef processing).
Infrastructure development
4.1 Develop an overarching coordinated infrastructure investment plan for the FNQ region that considers domestic and international freight and tourism with immediate priority for:
· Road network: Improve Atherton Tablelands to Cairns connectivity through advocating for the Kuranda Range Road upgrade with short term emphasis on the development of decoupling pads. Enable alternative B-Double freight route to Charters Towers and Townsville through advocating for investment to upgrade Gregory Highway. And Palmerston Highway upgrades for road trains to Mourilyan Port for beef live exports.
· Water: Ensure appropriate review of the Nullinga Dam and North Johnstone diversion scheme outcomes and ongoing regional coordination with the five major water supply and infrastructure projects to secure long-term water assets in the FNQ region.
· Telecommunication connectivity: Continue to engage with mobile providers to improve connectivity and reduce Black Spots in the FNQ region.
· Aggregation facility: Develop a regional export-accredited aggregation site (including treatment facilities) within 100km of Cairns International Airport that is prioritised based on economic outcomes and delivers coordinated integration through the airport export facilities.
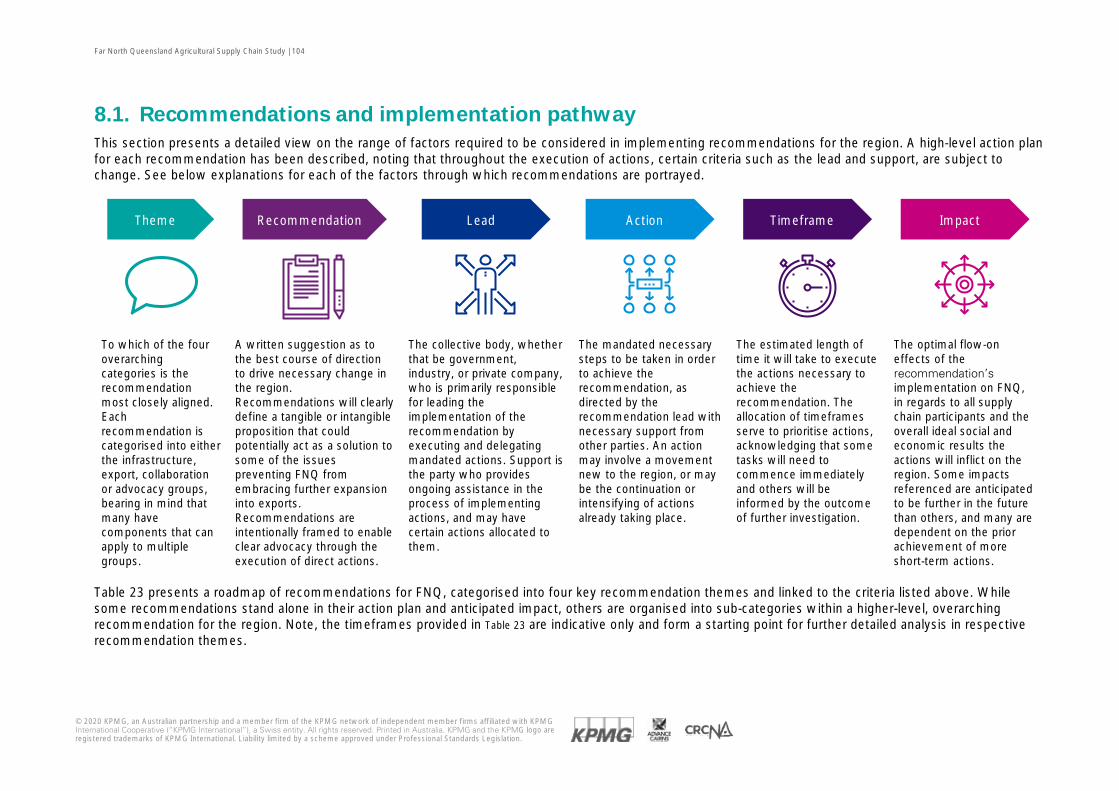
Far North Queensland Agricultural Supply Chain Study | 104
© 2020 KPMG, an Australian partnership and a member firm of the KPMG network of independent member firms affiliated with KPMG International Cooperative (“KPMG International”), a Swiss entity. All rights reserved. Printed in Australia. KPMG and the KPMG logo are registered trademarks of KPMG International. Liability limited by a scheme approved under Professional Standards Legislation.
8.1. Recommendations and implementation pathway This section presents a detailed view on the range of factors required to be considered in implementing recommendations for the region. A high-level action plan for each recommendation has been described, noting that throughout the execution of actions, certain criteria such as the lead and support, are subject to change. See below explanations for each of the factors through which recommendations are portrayed.
To which of the four overarching categories is the recommendation most closely aligned. Each recommendation is categorised into either the infrastructure, export, collaboration or advocacy groups, bearing in mind that many have components that can apply to multiple groups.
A written suggestion as to the best course of direction to drive necessary change in the region. Recommendations will clearly define a tangible or intangible proposition that could potentially act as a solution to some of the issues preventing FNQ from embracing further expansion into exports. Recommendations are intentionally framed to enable clear advocacy through the execution of direct actions.
The collective body, whether that be government, industry, or private company, who is primarily responsible for leading the implementation of the recommendation by executing and delegating mandated actions. Support is the party who provides ongoing assistance in the process of implementing actions, and may have certain actions allocated to them.
The mandated necessary steps to be taken in order to achieve the recommendation, as directed by the recommendation lead with necessary support from other parties. An action may involve a movement new to the region, or may be the continuation or intensifying of actions already taking place.
The estimated length of time it will take to execute the actions necessary to achieve the recommendation. The allocation of timeframes serve to prioritise actions, acknowledging that some tasks will need to commence immediately and others will be informed by the outcome of further investigation.
The optimal flow-on effects of the recommendation’s implementation on FNQ, in regards to all supply chain participants and the overall ideal social and economic results the actions will inflict on the region. Some impacts referenced are anticipated to be further in the future than others, and many are dependent on the prior achievement of more short-term actions.
Table 23 presents a roadmap of recommendations for FNQ, categorised into four key recommendation themes and linked to the criteria listed above. While some recommendations stand alone in their action plan and anticipated impact, others are organised into sub-categories within a higher-level, overarching recommendation for the region. Note, the timeframes provided in Table 23 are indicative only and form a starting point for further detailed analysis in respective recommendation themes.
Theme Recommendation Lead Action Timeframe Impact
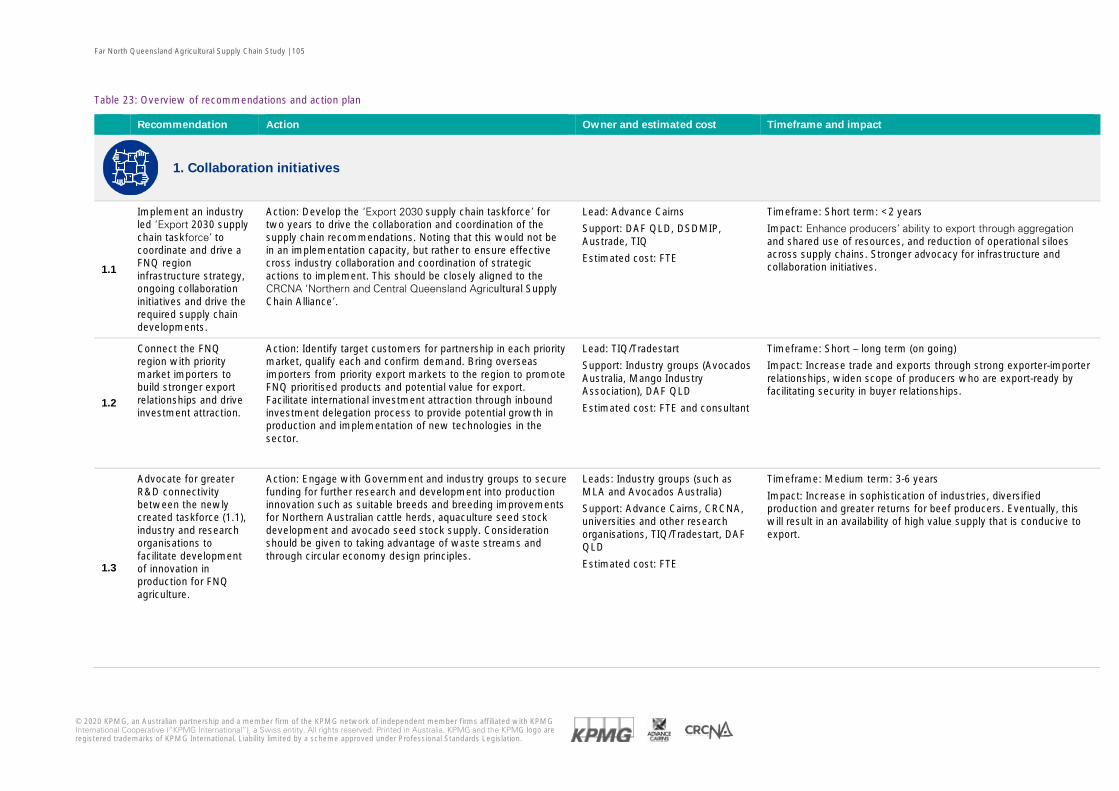
Far North Queensland Agricultural Supply Chain Study | 105
© 2020 KPMG, an Australian partnership and a member firm of the KPMG network of independent member firms affiliated with KPMG International Cooperative (“KPMG International”), a Swiss entity. All rights reserved. Printed in Australia. KPMG and the KPMG logo are registered trademarks of KPMG International. Liability limited by a scheme approved under Professional Standards Legislation.
Table 23: Overview of recommendations and action plan
Recommendation Action Owner and estimated cost Timeframe and impact
1. Collaboration initiatives
1.1
Implement an industry led ‘Export 2030 supply chain taskforce’ to coordinate and drive a FNQ region infrastructure strategy, ongoing collaboration initiatives and drive the required supply chain developments.
Action: Develop the ‘Export 2030 supply chain taskforce’ for two years to drive the collaboration and coordination of the supply chain recommendations. Noting that this would not be in an implementation capacity, but rather to ensure effective cross industry collaboration and coordination of strategic actions to implement. This should be closely aligned to the CRCNA ‘Northern and Central Queensland Agricultural Supply Chain Alliance’.
Lead: Advance Cairns
Support: DAF QLD, DSDMIP, Austrade, TIQ
Estimated cost: FTE
Timeframe: Short term: <2 years
Impact: Enhance producers’ ability to export through aggregation and shared use of resources, and reduction of operational siloes across supply chains. Stronger advocacy for infrastructure and collaboration initiatives.
1.2
Connect the FNQ region with priority market importers to build stronger export relationships and drive investment attraction.
Action: Identify target customers for partnership in each priority market, qualify each and confirm demand. Bring overseas importers from priority export markets to the region to promote FNQ prioritised products and potential value for export. Facilitate international investment attraction through inbound investment delegation process to provide potential growth in production and implementation of new technologies in the sector.
Lead: TIQ/Tradestart
Support: Industry groups (Avocados Australia, Mango Industry Association), DAF QLD
Estimated cost: FTE and consultant
Timeframe: Short – long term (on going)
Impact: Increase trade and exports through strong exporter-importer relationships, widen scope of producers who are export-ready by facilitating security in buyer relationships.
1.3
Advocate for greater R&D connectivity between the newly created taskforce (1.1), industry and research organisations to facilitate development of innovation in production for FNQ agriculture.
Action: Engage with Government and industry groups to secure funding for further research and development into production innovation such as suitable breeds and breeding improvements for Northern Australian cattle herds, aquaculture seed stock development and avocado seed stock supply. Consideration should be given to taking advantage of waste streams and through circular economy design principles.
Leads: Industry groups (such as MLA and Avocados Australia)
Support: Advance Cairns, CRCNA, universities and other research organisations, TIQ/Tradestart, DAF QLD
Estimated cost: FTE
Timeframe: Medium term: 3-6 years
Impact: Increase in sophistication of industries, diversified production and greater returns for beef producers. Eventually, this will result in an availability of high value supply that is conducive to export.
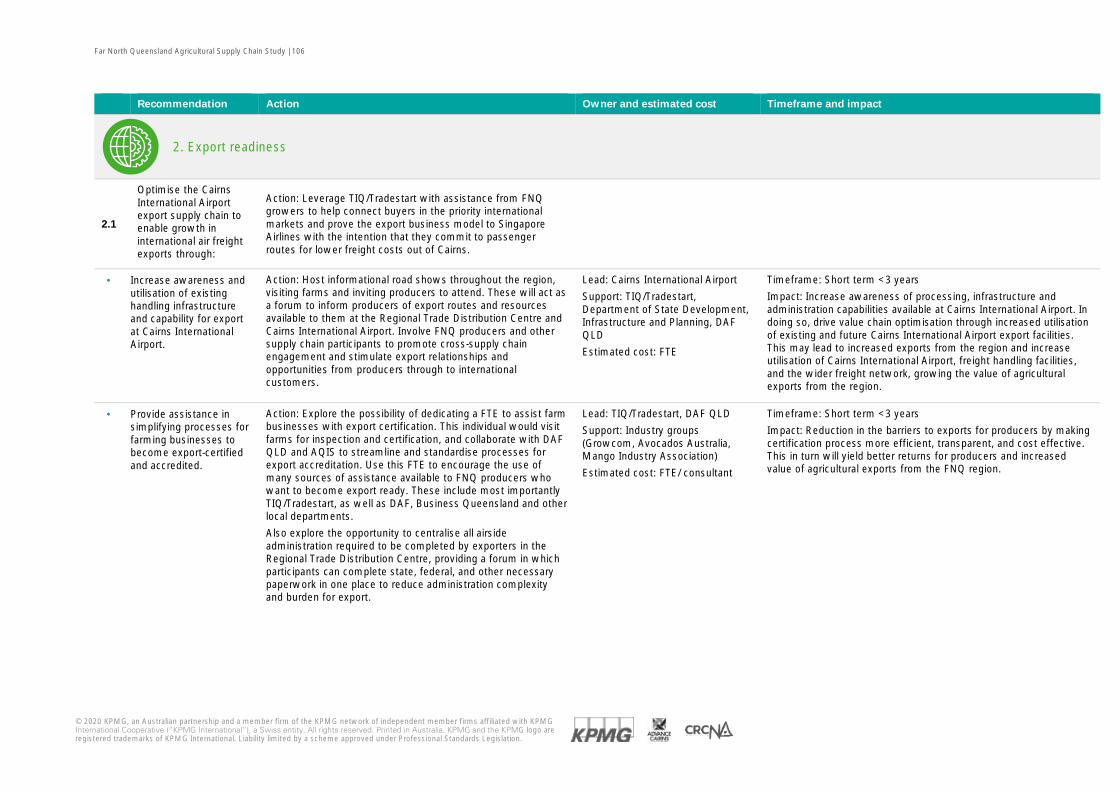
Far North Queensland Agricultural Supply Chain Study | 106
© 2020 KPMG, an Australian partnership and a member firm of the KPMG network of independent member firms affiliated with KPMG International Cooperative (“KPMG International”), a Swiss entity. All rights reserved. Printed in Australia. KPMG and the KPMG logo are registered trademarks of KPMG International. Liability limited by a scheme approved under Professional Standards Legislation.
Recommendation Action Owner and estimated cost Timeframe and impact
2. Export readiness
2.1
Optimise the Cairns International Airport export supply chain to enable growth in international air freight exports through:
Action: Leverage TIQ/Tradestart with assistance from FNQ growers to help connect buyers in the priority international markets and prove the export business model to Singapore Airlines with the intention that they commit to passenger routes for lower freight costs out of Cairns.
· Increase awareness and utilisation of existing handling infrastructure and capability for export at Cairns International Airport.
Action: Host informational road shows throughout the region, visiting farms and inviting producers to attend. These will act as a forum to inform producers of export routes and resources available to them at the Regional Trade Distribution Centre and Cairns International Airport. Involve FNQ producers and other supply chain participants to promote cross-supply chain engagement and stimulate export relationships and opportunities from producers through to international customers.
Lead: Cairns International Airport
Support: TIQ/Tradestart, Department of State Development, Infrastructure and Planning, DAF QLD
Estimated cost: FTE
Timeframe: Short term <3 years
Impact: Increase awareness of processing, infrastructure and administration capabilities available at Cairns International Airport. In doing so, drive value chain optimisation through increased utilisation of existing and future Cairns International Airport export facilities. This may lead to increased exports from the region and increase utilisation of Cairns International Airport, freight handling facilities, and the wider freight network, growing the value of agricultural exports from the region.
· Provide assistance in simplifying processes for farming businesses to become export-certified and accredited.
Action: Explore the possibility of dedicating a FTE to assist farm businesses with export certification. This individual would visit farms for inspection and certification, and collaborate with DAF QLD and AQIS to streamline and standardise processes for export accreditation. Use this FTE to encourage the use of many sources of assistance available to FNQ producers who want to become export ready. These include most importantly TIQ/Tradestart, as well as DAF, Business Queensland and other local departments.
Also explore the opportunity to centralise all airside administration required to be completed by exporters in the Regional Trade Distribution Centre, providing a forum in which participants can complete state, federal, and other necessary paperwork in one place to reduce administration complexity and burden for export.
Lead: TIQ/Tradestart, DAF QLD
Support: Industry groups (Growcom, Avocados Australia, Mango Industry Association)
Estimated cost: FTE/ consultant
Timeframe: Short term <3 years
Impact: Reduction in the barriers to exports for producers by making certification process more efficient, transparent, and cost effective. This in turn will yield better returns for producers and increased value of agricultural exports from the FNQ region.
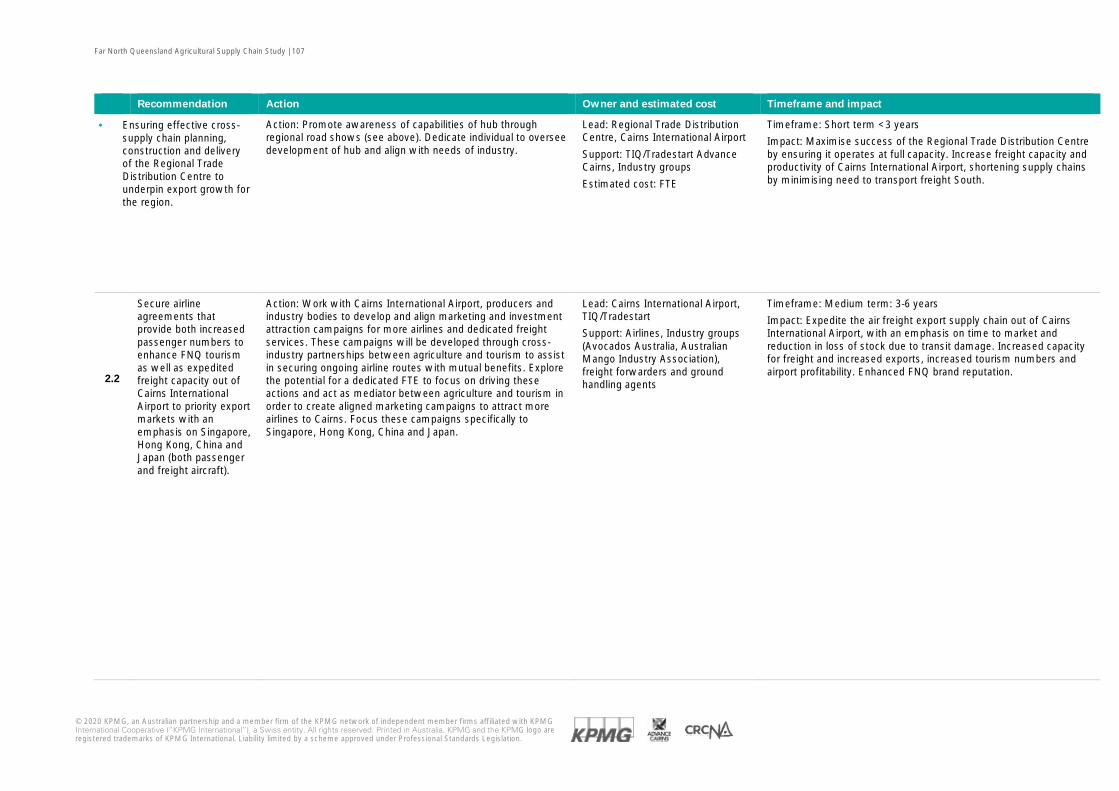
Far North Queensland Agricultural Supply Chain Study | 107
© 2020 KPMG, an Australian partnership and a member firm of the KPMG network of independent member firms affiliated with KPMG International Cooperative (“KPMG International”), a Swiss entity. All rights reserved. Printed in Australia. KPMG and the KPMG logo are registered trademarks of KPMG International. Liability limited by a scheme approved under Professional Standards Legislation.
Recommendation Action Owner and estimated cost Timeframe and impact
· Ensuring effective cross-supply chain planning, construction and delivery of the Regional Trade Distribution Centre to underpin export growth for the region.
Action: Promote awareness of capabilities of hub through regional road shows (see above). Dedicate individual to oversee development of hub and align with needs of industry.
Lead: Regional Trade Distribution Centre, Cairns International Airport
Support: TIQ/Tradestart Advance Cairns, Industry groups
Estimated cost: FTE
Timeframe: Short term <3 years
Impact: Maximise success of the Regional Trade Distribution Centre by ensuring it operates at full capacity. Increase freight capacity and productivity of Cairns International Airport, shortening supply chains by minimising need to transport freight South.
2.2
Secure airline agreements that provide both increased passenger numbers to enhance FNQ tourism as well as expedited freight capacity out of Cairns International Airport to priority export markets with an emphasis on Singapore, Hong Kong, China and Japan (both passenger and freight aircraft).
Action: Work with Cairns International Airport, producers and industry bodies to develop and align marketing and investment attraction campaigns for more airlines and dedicated freight services. These campaigns will be developed through cross-industry partnerships between agriculture and tourism to assist in securing ongoing airline routes with mutual benefits. Explore the potential for a dedicated FTE to focus on driving these actions and act as mediator between agriculture and tourism in order to create aligned marketing campaigns to attract more airlines to Cairns. Focus these campaigns specifically to Singapore, Hong Kong, China and Japan.
Lead: Cairns International Airport, TIQ/Tradestart
Support: Airlines, Industry groups (Avocados Australia, Australian Mango Industry Association), freight forwarders and ground handling agents
Timeframe: Medium term: 3-6 years
Impact: Expedite the air freight export supply chain out of Cairns International Airport, with an emphasis on time to market and reduction in loss of stock due to transit damage. Increased capacity for freight and increased exports, increased tourism numbers and airport profitability. Enhanced FNQ brand reputation.
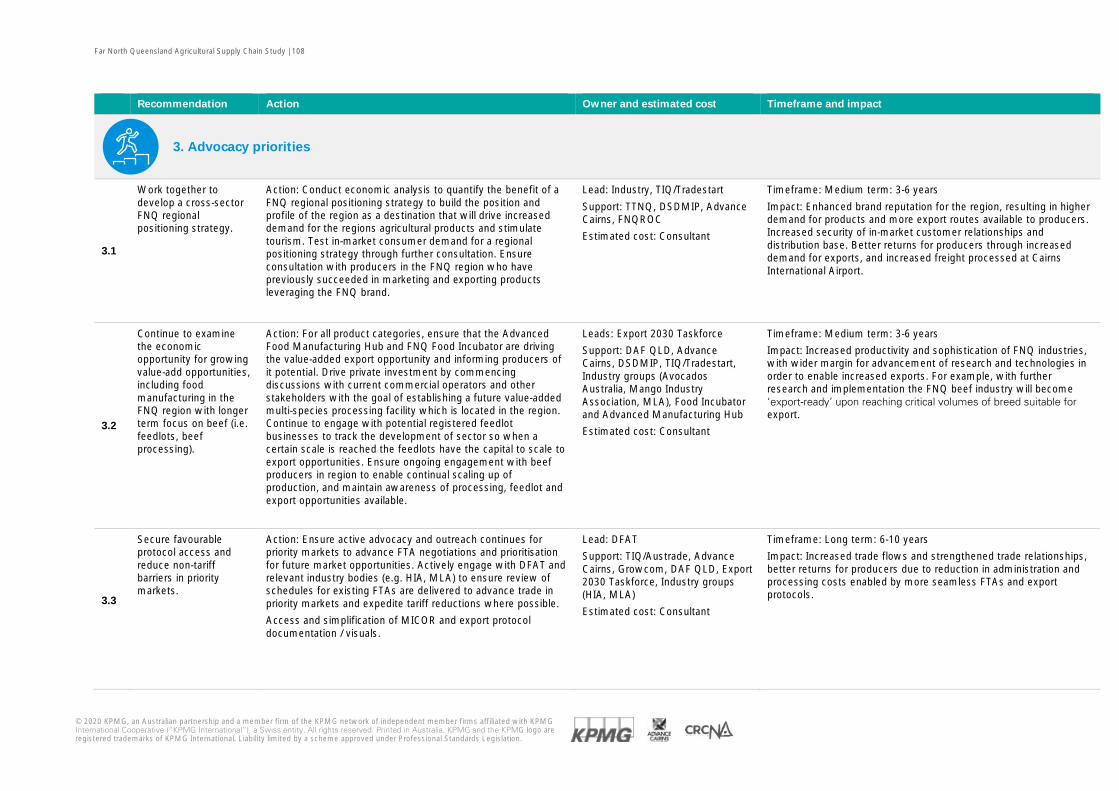
Far North Queensland Agricultural Supply Chain Study | 108
© 2020 KPMG, an Australian partnership and a member firm of the KPMG network of independent member firms affiliated with KPMG International Cooperative (“KPMG International”), a Swiss entity. All rights reserved. Printed in Australia. KPMG and the KPMG logo are registered trademarks of KPMG International. Liability limited by a scheme approved under Professional Standards Legislation.
Recommendation Action Owner and estimated cost Timeframe and impact
3. Advocacy priorities
3.1
Work together to develop a cross-sector FNQ regional positioning strategy.
Action: Conduct economic analysis to quantify the benefit of a FNQ regional positioning strategy to build the position and profile of the region as a destination that will drive increased demand for the regions agricultural products and stimulate tourism. Test in-market consumer demand for a regional positioning strategy through further consultation. Ensure consultation with producers in the FNQ region who have previously succeeded in marketing and exporting products leveraging the FNQ brand.
Lead: Industry, TIQ/Tradestart
Support: TTNQ, DSDMIP, Advance Cairns, FNQROC
Estimated cost: Consultant
Timeframe: Medium term: 3-6 years
Impact: Enhanced brand reputation for the region, resulting in higher demand for products and more export routes available to producers. Increased security of in-market customer relationships and distribution base. Better returns for producers through increased demand for exports, and increased freight processed at Cairns International Airport.
3.2
Continue to examine the economic opportunity for growing value-add opportunities, including food manufacturing in the FNQ region with longer term focus on beef (i.e. feedlots, beef processing).
Action: For all product categories, ensure that the Advanced Food Manufacturing Hub and FNQ Food Incubator are driving the value-added export opportunity and informing producers of it potential. Drive private investment by commencing discussions with current commercial operators and other stakeholders with the goal of establishing a future value-added multi-species processing facility which is located in the region. Continue to engage with potential registered feedlot businesses to track the development of sector so when a certain scale is reached the feedlots have the capital to scale to export opportunities. Ensure ongoing engagement with beef producers in region to enable continual scaling up of production, and maintain awareness of processing, feedlot and export opportunities available.
Leads: Export 2030 Taskforce
Support: DAF QLD, Advance Cairns, DSDMIP, TIQ/Tradestart, Industry groups (Avocados Australia, Mango Industry Association, MLA), Food Incubator and Advanced Manufacturing Hub
Estimated cost: Consultant
Timeframe: Medium term: 3-6 years
Impact: Increased productivity and sophistication of FNQ industries, with wider margin for advancement of research and technologies in order to enable increased exports. For example, with further research and implementation the FNQ beef industry will become ‘export-ready’ upon reaching critical volumes of breed suitable for export.
3.3
Secure favourable protocol access and reduce non-tariff barriers in priority markets.
Action: Ensure active advocacy and outreach continues for priority markets to advance FTA negotiations and prioritisation for future market opportunities. Actively engage with DFAT and relevant industry bodies (e.g. HIA, MLA) to ensure review of schedules for existing FTAs are delivered to advance trade in priority markets and expedite tariff reductions where possible.
Access and simplification of MICOR and export protocol documentation / visuals.
Lead: DFAT
Support: TIQ/Austrade, Advance Cairns, Growcom, DAF QLD, Export 2030 Taskforce, Industry groups (HIA, MLA)
Estimated cost: Consultant
Timeframe: Long term: 6-10 years
Impact: Increased trade flows and strengthened trade relationships, better returns for producers due to reduction in administration and processing costs enabled by more seamless FTAs and export protocols.
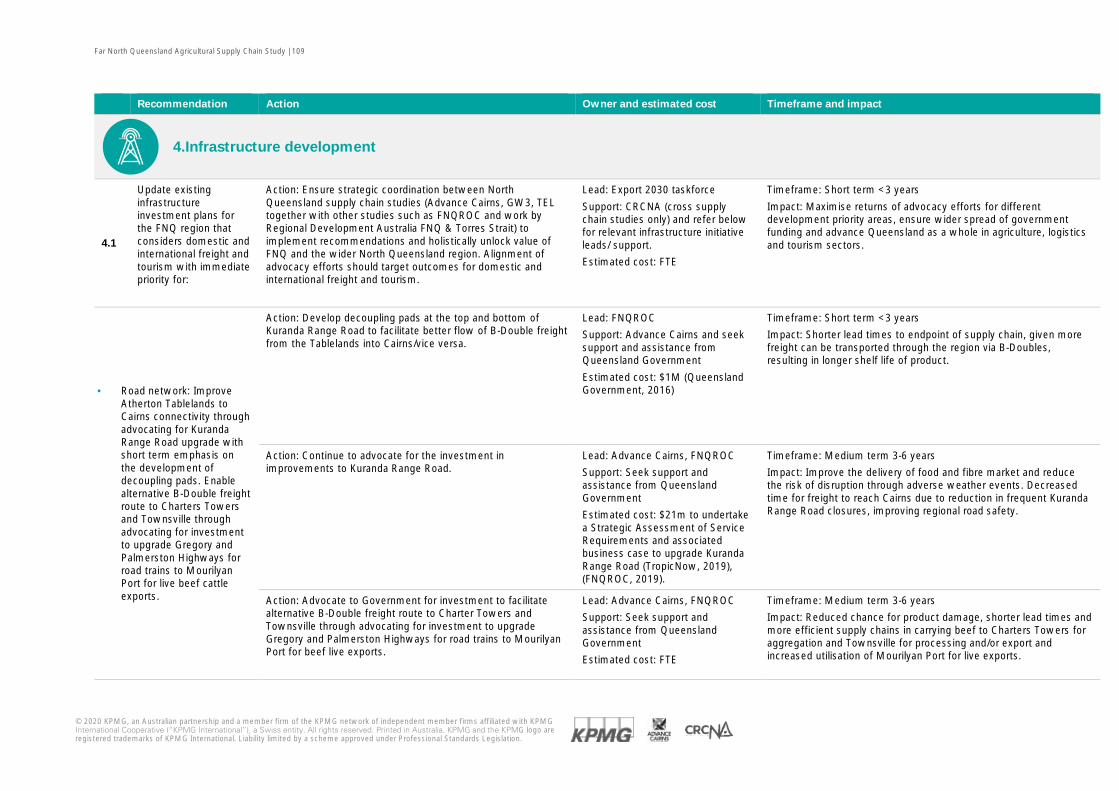
Far North Queensland Agricultural Supply Chain Study | 109
© 2020 KPMG, an Australian partnership and a member firm of the KPMG network of independent member firms affiliated with KPMG International Cooperative (“KPMG International”), a Swiss entity. All rights reserved. Printed in Australia. KPMG and the KPMG logo are registered trademarks of KPMG International. Liability limited by a scheme approved under Professional Standards Legislation.
Recommendation Action Owner and estimated cost Timeframe and impact
4.Infrastructure development
4.1
Update existing infrastructure investment plans for the FNQ region that considers domestic and international freight and tourism with immediate priority for:
Action: Ensure strategic coordination between North Queensland supply chain studies (Advance Cairns, GW3, TEL together with other studies such as FNQROC and work by Regional Development Australia FNQ & Torres Strait) to implement recommendations and holistically unlock value of FNQ and the wider North Queensland region. Alignment of advocacy efforts should target outcomes for domestic and international freight and tourism.
Lead: Export 2030 taskforce
Support: CRCNA (cross supply chain studies only) and refer below for relevant infrastructure initiative leads/ support.
Estimated cost: FTE
Timeframe: Short term <3 years
Impact: Maximise returns of advocacy efforts for different development priority areas, ensure wider spread of government funding and advance Queensland as a whole in agriculture, logistics and tourism sectors.
· Road network: Improve Atherton Tablelands to Cairns connectivity through advocating for Kuranda Range Road upgrade with short term emphasis on the development of decoupling pads. Enable alternative B-Double freight route to Charters Towers and Townsville through advocating for investment to upgrade Gregory and Palmerston Highways for road trains to Mourilyan Port for live beef cattle exports.
Action: Develop decoupling pads at the top and bottom of Kuranda Range Road to facilitate better flow of B-Double freight from the Tablelands into Cairns/vice versa.
Lead: FNQROC
Support: Advance Cairns and seek support and assistance from Queensland Government
Estimated cost: $1M (Queensland Government, 2016)
Timeframe: Short term <3 years
Impact: Shorter lead times to endpoint of supply chain, given more freight can be transported through the region via B-Doubles, resulting in longer shelf life of product.
Action: Continue to advocate for the investment in improvements to Kuranda Range Road.
Lead: Advance Cairns, FNQROC
Support: Seek support and assistance from Queensland Government
Estimated cost: $21m to undertake a Strategic Assessment of Service Requirements and associated business case to upgrade Kuranda Range Road (TropicNow, 2019), (FNQROC, 2019).
Timeframe: Medium term 3-6 years
Impact: Improve the delivery of food and fibre market and reduce the risk of disruption through adverse weather events. Decreased time for freight to reach Cairns due to reduction in frequent Kuranda Range Road closures, improving regional road safety.
Action: Advocate to Government for investment to facilitate alternative B-Double freight route to Charter Towers and Townsville through advocating for investment to upgrade Gregory and Palmerston Highways for road trains to Mourilyan Port for beef live exports.
Lead: Advance Cairns, FNQROC
Support: Seek support and assistance from Queensland Government
Estimated cost: FTE
Timeframe: Medium term 3-6 years
Impact: Reduced chance for product damage, shorter lead times and more efficient supply chains in carrying beef to Charters Towers for aggregation and Townsville for processing and/or export and increased utilisation of Mourilyan Port for live exports.
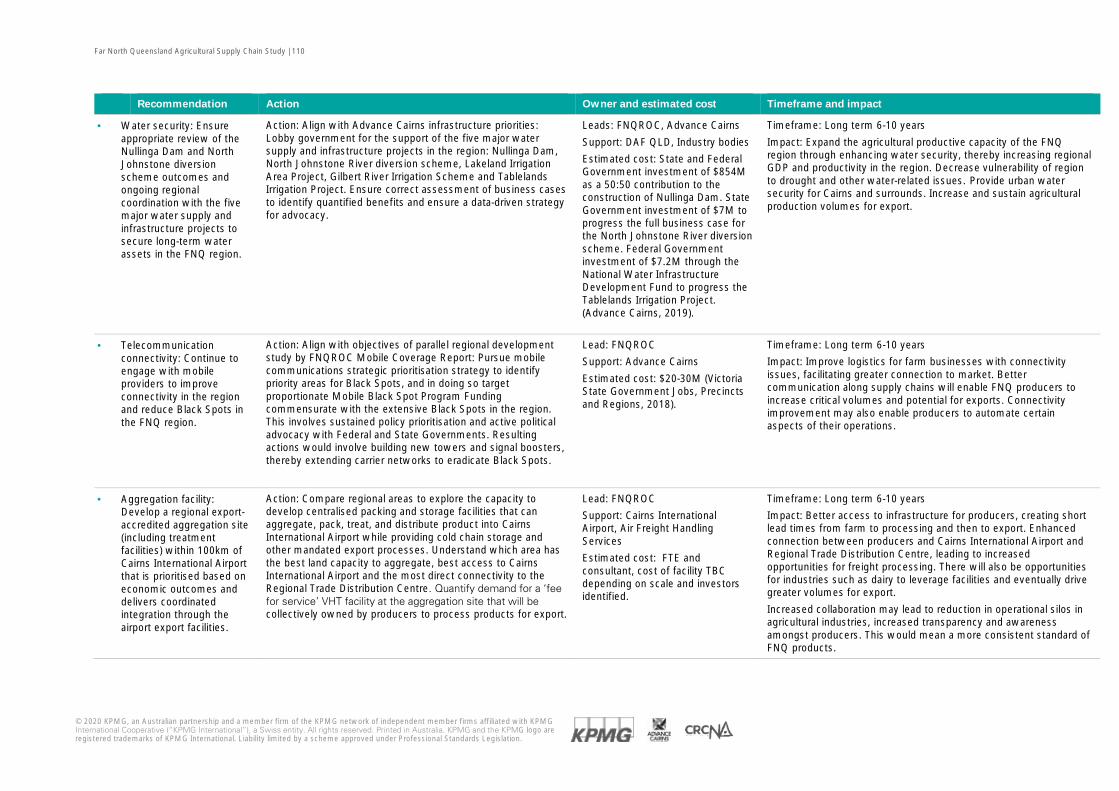
Far North Queensland Agricultural Supply Chain Study | 110
© 2020 KPMG, an Australian partnership and a member firm of the KPMG network of independent member firms affiliated with KPMG International Cooperative (“KPMG International”), a Swiss entity. All rights reserved. Printed in Australia. KPMG and the KPMG logo are registered trademarks of KPMG International. Liability limited by a scheme approved under Professional Standards Legislation.
Recommendation Action Owner and estimated cost Timeframe and impact
· Water security: Ensure appropriate review of the Nullinga Dam and North Johnstone diversion scheme outcomes and ongoing regional coordination with the five major water supply and infrastructure projects to secure long-term water assets in the FNQ region.
Action: Align with Advance Cairns infrastructure priorities: Lobby government for the support of the five major water supply and infrastructure projects in the region: Nullinga Dam, North Johnstone River diversion scheme, Lakeland Irrigation Area Project, Gilbert River Irrigation Scheme and Tablelands Irrigation Project. Ensure correct assessment of business cases to identify quantified benefits and ensure a data-driven strategy for advocacy.
Leads: FNQROC, Advance Cairns
Support: DAF QLD, Industry bodies
Estimated cost: State and Federal Government investment of $854M as a 50:50 contribution to the construction of Nullinga Dam. State Government investment of $7M to progress the full business case for the North Johnstone River diversion scheme. Federal Government investment of $7.2M through the National Water Infrastructure Development Fund to progress the Tablelands Irrigation Project. (Advance Cairns, 2019).
Timeframe: Long term 6-10 years
Impact: Expand the agricultural productive capacity of the FNQ region through enhancing water security, thereby increasing regional GDP and productivity in the region. Decrease vulnerability of region to drought and other water-related issues. Provide urban water security for Cairns and surrounds. Increase and sustain agricultural production volumes for export.
· Telecommunication connectivity: Continue to engage with mobile providers to improve connectivity in the region and reduce Black Spots in the FNQ region.
Action: Align with objectives of parallel regional development study by FNQROC Mobile Coverage Report: Pursue mobile communications strategic prioritisation strategy to identify priority areas for Black Spots, and in doing so target proportionate Mobile Black Spot Program Funding commensurate with the extensive Black Spots in the region. This involves sustained policy prioritisation and active political advocacy with Federal and State Governments. Resulting actions would involve building new towers and signal boosters, thereby extending carrier networks to eradicate Black Spots.
Lead: FNQROC
Support: Advance Cairns
Estimated cost: $20-30M (Victoria State Government Jobs, Precincts and Regions, 2018).
Timeframe: Long term 6-10 years
Impact: Improve logistics for farm businesses with connectivity issues, facilitating greater connection to market. Better communication along supply chains will enable FNQ producers to increase critical volumes and potential for exports. Connectivity improvement may also enable producers to automate certain aspects of their operations.
· Aggregation facility: Develop a regional export-accredited aggregation site (including treatment facilities) within 100km of Cairns International Airport that is prioritised based on economic outcomes and delivers coordinated integration through the airport export facilities.
Action: Compare regional areas to explore the capacity to develop centralised packing and storage facilities that can aggregate, pack, treat, and distribute product into Cairns International Airport while providing cold chain storage and other mandated export processes. Understand which area has the best land capacity to aggregate, best access to Cairns International Airport and the most direct connectivity to the Regional Trade Distribution Centre. Quantify demand for a ‘fee for service’ VHT facility at the aggregation site that will be collectively owned by producers to process products for export.
Lead: FNQROC
Support: Cairns International Airport, Air Freight Handling Services
Estimated cost: FTE and consultant, cost of facility TBC depending on scale and investors identified.
Timeframe: Long term 6-10 years
Impact: Better access to infrastructure for producers, creating short lead times from farm to processing and then to export. Enhanced connection between producers and Cairns International Airport and Regional Trade Distribution Centre, leading to increased opportunities for freight processing. There will also be opportunities for industries such as dairy to leverage facilities and eventually drive greater volumes for export.
Increased collaboration may lead to reduction in operational silos in agricultural industries, increased transparency and awareness amongst producers. This would mean a more consistent standard of FNQ products.
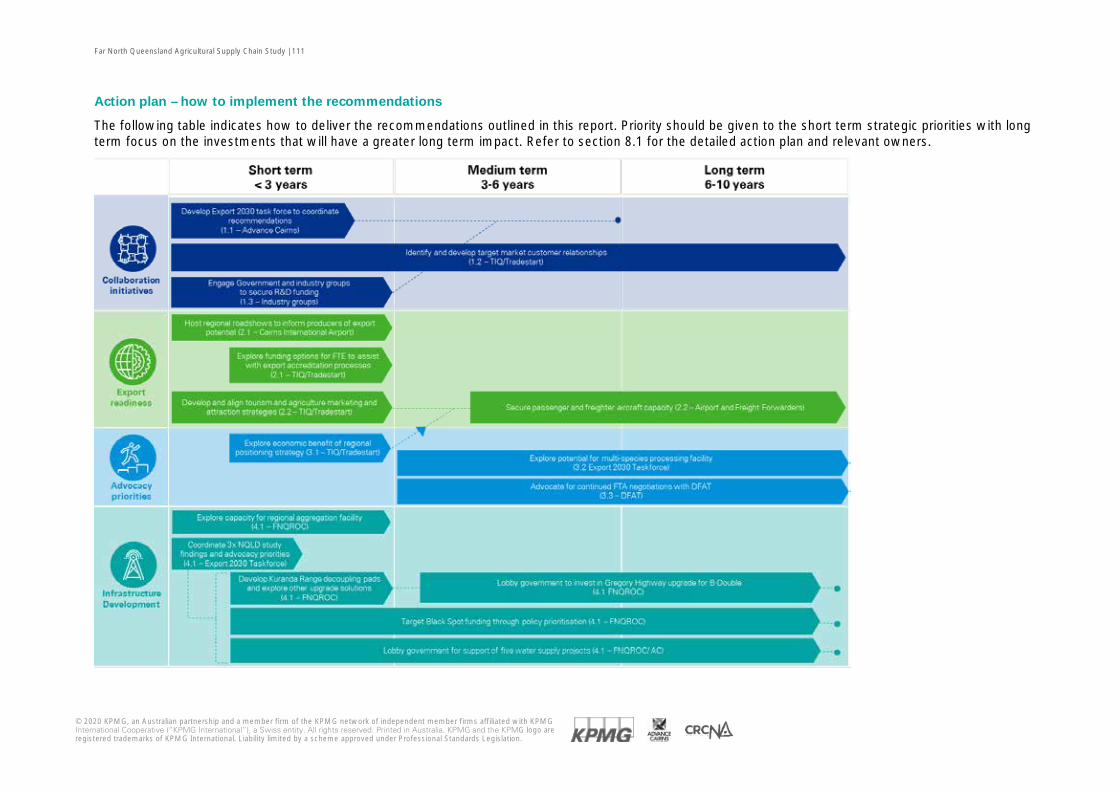
Far North Queensland Agricultural Supply Chain Study | 111
© 2020 KPMG, an Australian partnership and a member firm of the KPMG network of independent member firms affiliated with KPMG International Cooperative (“KPMG International”), a Swiss entity. All rights reserved. Printed in Australia. KPMG and the KPMG logo are registered trademarks of KPMG International. Liability limited by a scheme approved under Professional Standards Legislation.
Action plan – how to implement the recommendations
The following table indicates how to deliver the recommendations outlined in this report. Priority should be given to the short term strategic priorities with long term focus on the investments that will have a greater long term impact. Refer to section 8.1 for the detailed action plan and relevant owners.
Far North Queensland Agricultural Supply Chain Study | 112
© 2020 KPMG, an Australian partnership and a member firm of the KPMG network of independent member firms affiliated with KPMG International Cooperative (“KPMG International”), a Swiss entity. All rights reserved. Printed in Australia. KPMG and the KPMG logo are registered trademarks of KPMG International. Liability limited by a scheme approved under Professional Standards Legislation.
Appendix 1: Reference List ABARES. (2018). About my region - Cairns Queensland.
ABARES. (2019). Horticulture .
ABS. (2011-2017). Agricultural Commodities Australia .
ABS. (2019). International Merchandise Trade: Customised Reoprt (exports of all 5 digit SITC codes) .
Advance Cairns. (2018). AgTNQ Sector Update 2018.
Advance Cairns. (2019). Dams and Water Security.
AgriFarming. (2016). Vanilla Cultivation Information Guide.
AgriFutures . (2017). Prawns (aquaculture).
AgriFutures. (2017). Avocado.
AgriFutures. (2017). Beef Cattle.
AgriFutures. (2017). Cocoa.
AgriFutures. (2017). Coffee.
AgriFutures. (2017). Crocodiles.
AgriFutures. (2017). Freshwater crayfish (Redclaw).
Agrifutures. (2017). Pumpkins.
Air Freight Handling Services. (2019). EOI Response Cairns Regional Export Distribution Centre.
Air Freight Handling Services. (2019). Regional Export Distribution centre pilot detailed business case.
AQ1 Systems. (2019). Driving Aquaculture Productivity .
ART. (2019). About Us.
AusTrade. (2017). Mayura Station: Supplying luxury Australian beef across Asia.
Austrade. (2018). Free Trade Agreements: Aussie oranges squeeze into China's citrus market.
AusTrade. (2019). Australian macadamias crack China's market.
Austrade. (2019). Hussey & Co finds fresh markets in Asia.
Australia, J. S. (n.d.). Inquiry into Opportunities for Expanding Aquaculture in Northern Australia (hearing).
Australia-China Belt and Road Initiative. (2019). Belt and Road Initiative: Commercial Relevance to the Australian Agriculture Sector .
Australian Mangoes. (2019). Where do my mangoes come from?
AusVeg. (2018). Vegetable Industry Export Snapshot.
Avocados Australia. (2019). 2019 Tristate Regional Forum.
Avocados Australia. (2019). Statistics.
Cairns Marine. (2019). Supply Chains Matter .
Central Intelligence Agency. (2019). The World Factbook, China.
Central Intelligence Agency. (2019). The World Factbook, Hong Kong.
Central Intelligence Agency. (2019). The World Factbook, Japan.
Central Intelligence Agency. (2019). The World Factbook, Singapore.
Centre for Aviation . (2018). Hong Kong: International Aviation.
Far North Queensland Agricultural Supply Chain Study | 113
© 2020 KPMG, an Australian partnership and a member firm of the KPMG network of independent member firms affiliated with KPMG International Cooperative (“KPMG International”), a Swiss entity. All rights reserved. Printed in Australia. KPMG and the KPMG logo are registered trademarks of KPMG International. Liability limited by a scheme approved under Professional Standards Legislation.
Centre for Aviation. (2018). Singapore: International Aviation.
Centre for Aviation, Indonesia. (n.d.). Indonesia: International Aviation.
CRCNA / AustCham ASEAN. (2019). Capturing the ASEAN Agricultural Opportunity for Northern Australia.
CRCNA / University of Queensland / QAAFI. (2019). Evaluation of the potential to expand horticultural industries in Northern Australia: CRCNA Project International Field Study Report – China.
CRCNA / Greater Whitsunday Alliance . (2019). Mackay-Isaac Whitsunday Agribusiness Export Supply Chain Mapping Study.
CRCNA / Townsville Enterprise. (2019). North Queensland Agricultural Supply Chain Study.
CSIRO. (2017). A roadmap for unlocking value-adding growth opportunities for Australia .
CSIRO. (2019). Horticulture Airfreight Project.
Department of Agriculture and Fisheries . (2018). Ag Trends - Queensland Agriculture Snapshot.
Department of Foreign Affairs and Trade . (2017).
Department of Foreign Affairs and Trade . (2019). Australia-Hong Kong Free Trade Agreement.
Department of Foreign Affairs and Trade. (2019). Indonesia-Australia Comprehensive Economic Partnership Agreement.
Department of Infrastructure, Regional Development and Cities. (2018). Inquiry into National Freight and Supply Chain Priorities.
Euromonitor International. (2018). New health and wellness data looks into latest trends .
FNQROC. (2018). Welcome to the FNQROC Community Profile.
FNQROC. (2019). Mobile black spot study of tourist and heavy vehicle routes.
FNQROC. (2019). Mobile Coverage Report.
FNQROC. (2019). Regional Roads Investment Strategy.
Food Innovation Australia Limited. (2019). Protein market: size of the prize analysis for Australia.
FRDC. (2018). Rock Lobster Exports .
GCCA. (2018). 2018 GCCA Global Cold Storage Capacity Report.
HIA . (Investment Analysis: See how Avocado Fund investments are tracking against the industry's Strategic Investment Plan ). 2019.
HIA. (2017). Australian Horticulture Statistics Handbook - Nuts 2015/2016, 2017.
HIA. (2019). Investment Analysis: See how Avocado Fund investments are tracking against the industry's Strategic Investment Plan .
Hussey & Co. (2019). Company.
Infrastructure Australia. (2019). The Australian Infrastructure Audit 2019 - An Assessment of Australia's Future Infrastructure Needs .
ITC Export Potential Map. (2019), retrieved from https://exportpotential.intracen.org/#/home
Joint Select Committee on Northern Australia. (2015). Inquiry into Opportunities for Expanding Aquaculture in Northern Australia (hearing).
KPMG. (2018). Talking 2030: Growing agriculture into a $100 billion industry.
Martono, G. a. (2016). Current Indonesian Air Transportation. Journal of Applied Chemistry .
MLA . (2019). Market snapshot beef and sheepmeat.
MLA. (2019). Industry Projections 2019: Australian Cattle.
MLA. (2019). Market data and insights.
Far North Queensland Agricultural Supply Chain Study | 114
© 2020 KPMG, an Australian partnership and a member firm of the KPMG network of independent member firms affiliated with KPMG International Cooperative (“KPMG International”), a Swiss entity. All rights reserved. Printed in Australia. KPMG and the KPMG logo are registered trademarks of KPMG International. Liability limited by a scheme approved under Professional Standards Legislation.
Port of Townsville. (2018). About Townsville Port - Trade Statistics .
Queensland Department of Agriculture and Fisheries. (2019). Queensland AgTrends 2018-19.
Queensland Fresh Exports . (2019). Company Overview.
Queensland Government. (2016). Media statements: New road train decoupling facility opens in Townsville.
Queensland Government. (2019). Queensland Beef Processing Strategy 2019-2022.
Rural Industries Research and Development Corporation. (2010). Producing Cocoa in Northern Austraila.
Rural Industries Research and Development Corporation. (2012). Australian Native Food Industry Stocktake.
Signature Beef. (2011). Packing the EU Market.
StB Cargo. (2017). The cargo facility of the future.
SWANSystems. (2019). About.
TEL et al. (2019). North Queensland Markets & Agricultural Supply Chain Study.
The State Council. (2019). Demand for imported food growing steadily as living standards improve.
The World Bank. (2018). International Logistics Performance Index.
The World Bank. (2019). Statistics, Air transport, Freight, .
Townsville Enterprise. (2019). North Queensland Agricultural Supply Chain Study.
TropicNow. (2019). Lobbying begins for Pacific hub in Cairns.
University of Southern Queensland. (2014). Opportunities and challenges relating to the export of fruit and vegetable products from Queensland to Asian Countries.
University of Sydney. (2015). Rippa robot takes farms forward to the future.
USA International Trade Administration. (2016). Cold Chain Systems Country Rankings.
Victoria State Government Jobs, Precints and Regions . (2018). Connecting Victoria: Digital connectivity in regional Victoria .
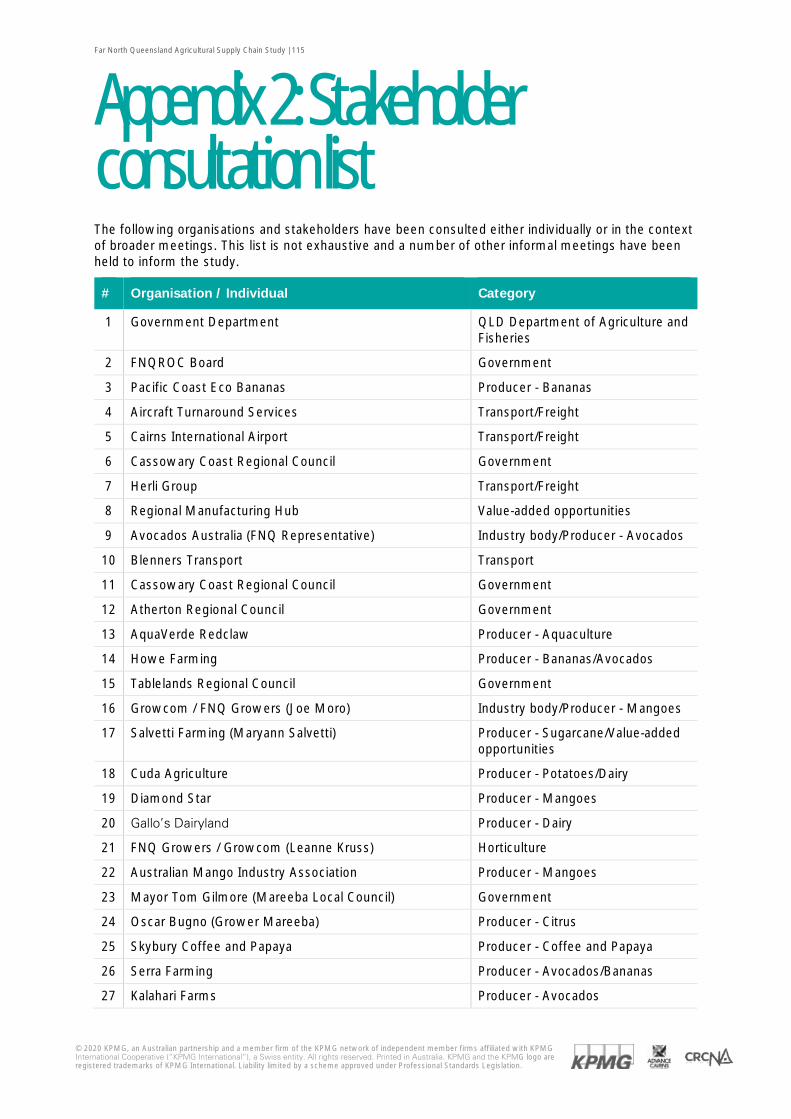
Far North Queensland Agricultural Supply Chain Study | 115
© 2020 KPMG, an Australian partnership and a member firm of the KPMG network of independent member firms affiliated with KPMG International Cooperative (“KPMG International”), a Swiss entity. All rights reserved. Printed in Australia. KPMG and the KPMG logo are registered trademarks of KPMG International. Liability limited by a scheme approved under Professional Standards Legislation.
Appendix 2: Stakeholder consultation list The following organisations and stakeholders have been consulted either individually or in the context of broader meetings. This list is not exhaustive and a number of other informal meetings have been held to inform the study.
# Organisation / Individual Category
1 Government Department QLD Department of Agriculture and Fisheries
2 FNQROC Board Government
3 Pacific Coast Eco Bananas Producer - Bananas
4 Aircraft Turnaround Services Transport/Freight
5 Cairns International Airport Transport/Freight
6 Cassowary Coast Regional Council Government
7 Herli Group Transport/Freight
8 Regional Manufacturing Hub Value-added opportunities
9 Avocados Australia (FNQ Representative) Industry body/Producer - Avocados
10 Blenners Transport Transport
11 Cassowary Coast Regional Council Government
12 Atherton Regional Council Government
13 AquaVerde Redclaw Producer - Aquaculture
14 Howe Farming Producer - Bananas/Avocados
15 Tablelands Regional Council Government
16 Growcom / FNQ Growers (Joe Moro) Industry body/Producer - Mangoes
17 Salvetti Farming (Maryann Salvetti) Producer - Sugarcane/Value-added opportunities
18 Cuda Agriculture Producer - Potatoes/Dairy
19 Diamond Star Producer - Mangoes
20 Gallo’s Dairyland Producer - Dairy
21 FNQ Growers / Growcom (Leanne Kruss) Horticulture
22 Australian Mango Industry Association Producer - Mangoes
23 Mayor Tom Gilmore (Mareeba Local Council) Government
24 Oscar Bugno (Grower Mareeba) Producer - Citrus
25 Skybury Coffee and Papaya Producer - Coffee and Papaya
26 Serra Farming Producer - Avocados/Bananas
27 Kalahari Farms Producer - Avocados
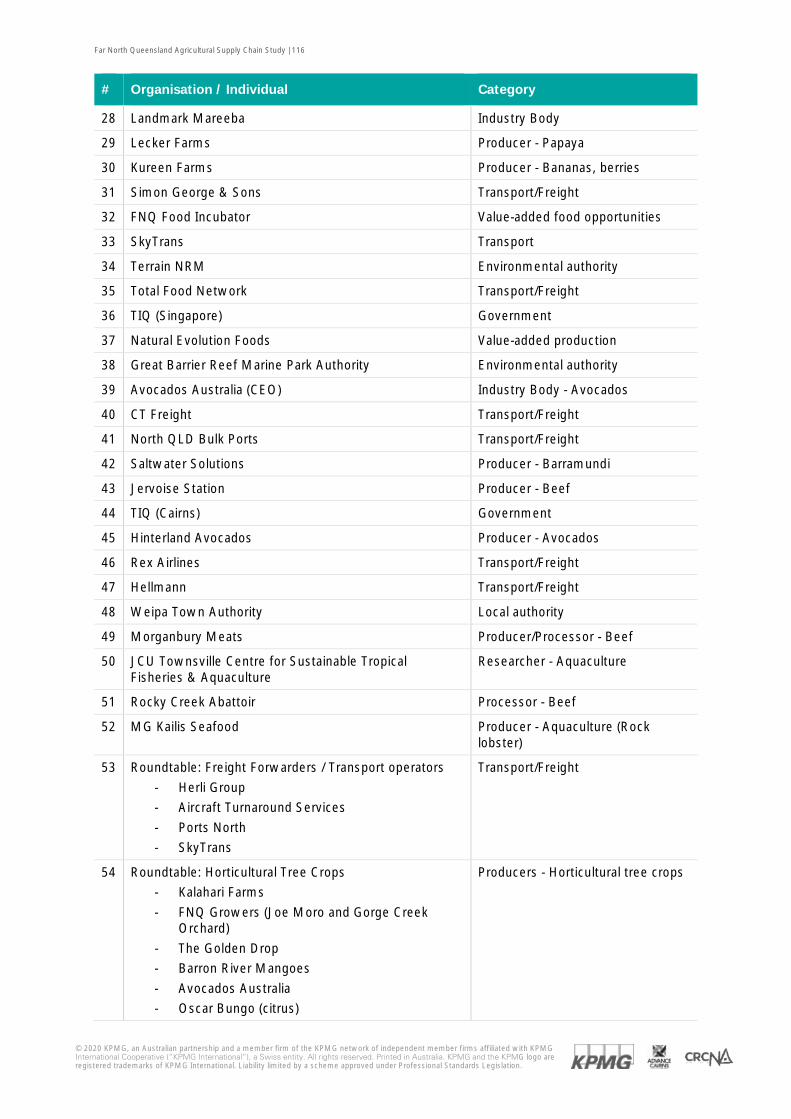
Far North Queensland Agricultural Supply Chain Study | 116
© 2020 KPMG, an Australian partnership and a member firm of the KPMG network of independent member firms affiliated with KPMG International Cooperative (“KPMG International”), a Swiss entity. All rights reserved. Printed in Australia. KPMG and the KPMG logo are registered trademarks of KPMG International. Liability limited by a scheme approved under Professional Standards Legislation.
# Organisation / Individual Category
28 Landmark Mareeba Industry Body
29 Lecker Farms Producer - Papaya
30 Kureen Farms Producer - Bananas, berries
31 Simon George & Sons Transport/Freight
32 FNQ Food Incubator Value-added food opportunities
33 SkyTrans Transport
34 Terrain NRM Environmental authority
35 Total Food Network Transport/Freight
36 TIQ (Singapore) Government
37 Natural Evolution Foods Value-added production
38 Great Barrier Reef Marine Park Authority Environmental authority
39 Avocados Australia (CEO) Industry Body - Avocados
40 CT Freight Transport/Freight
41 North QLD Bulk Ports Transport/Freight
42 Saltwater Solutions Producer - Barramundi
43 Jervoise Station Producer - Beef
44 TIQ (Cairns) Government
45 Hinterland Avocados Producer - Avocados
46 Rex Airlines Transport/Freight
47 Hellmann Transport/Freight
48 Weipa Town Authority Local authority
49 Morganbury Meats Producer/Processor - Beef
50 JCU Townsville Centre for Sustainable Tropical Fisheries & Aquaculture
Researcher - Aquaculture
51 Rocky Creek Abattoir Processor - Beef
52 MG Kailis Seafood Producer - Aquaculture (Rock lobster)
53 Roundtable: Freight Forwarders / Transport operators
- Herli Group - Aircraft Turnaround Services
- Ports North - SkyTrans
Transport/Freight
54 Roundtable: Horticultural Tree Crops - Kalahari Farms
- FNQ Growers (Joe Moro and Gorge Creek Orchard)
- The Golden Drop - Barron River Mangoes
- Avocados Australia - Oscar Bungo (citrus)
Producers - Horticultural tree crops
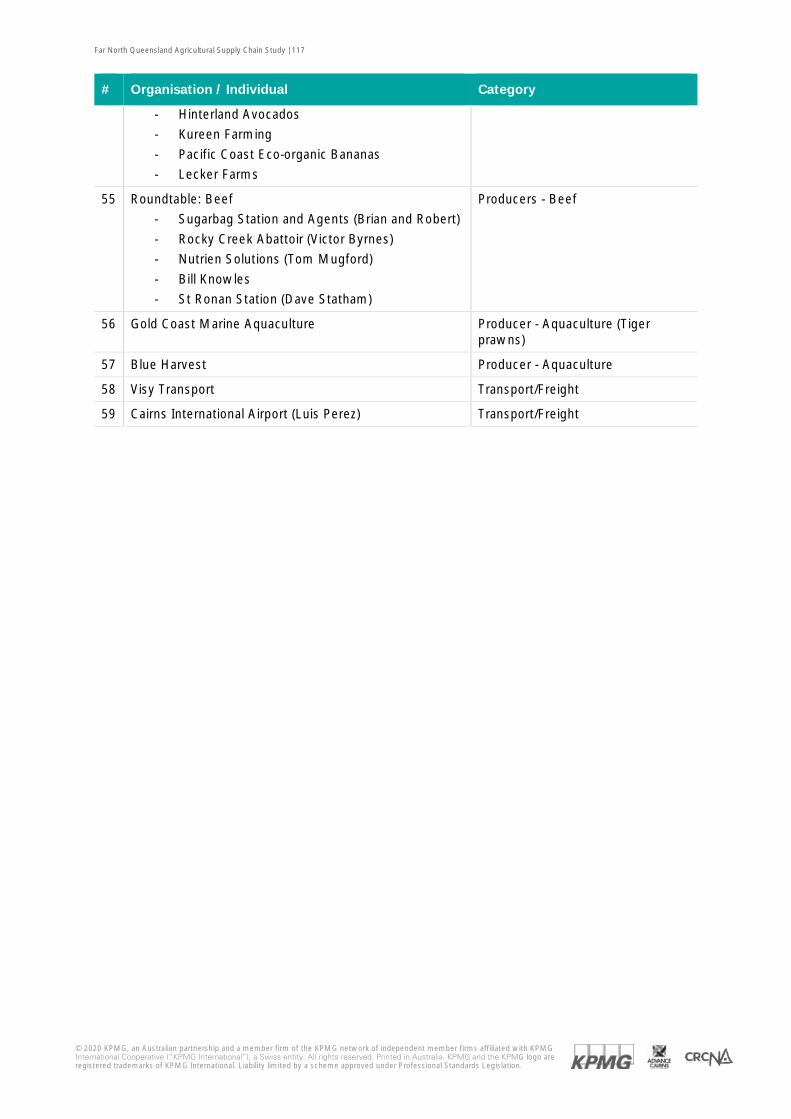
Far North Queensland Agricultural Supply Chain Study | 117
© 2020 KPMG, an Australian partnership and a member firm of the KPMG network of independent member firms affiliated with KPMG International Cooperative (“KPMG International”), a Swiss entity. All rights reserved. Printed in Australia. KPMG and the KPMG logo are registered trademarks of KPMG International. Liability limited by a scheme approved under Professional Standards Legislation.
# Organisation / Individual Category
- Hinterland Avocados - Kureen Farming
- Pacific Coast Eco-organic Bananas - Lecker Farms
55 Roundtable: Beef - Sugarbag Station and Agents (Brian and Robert)
- Rocky Creek Abattoir (Victor Byrnes) - Nutrien Solutions (Tom Mugford)
- Bill Knowles - St Ronan Station (Dave Statham)
Producers - Beef
56 Gold Coast Marine Aquaculture Producer - Aquaculture (Tiger prawns)
57 Blue Harvest Producer - Aquaculture
58 Visy Transport Transport/Freight
59 Cairns International Airport (Luis Perez) Transport/Freight
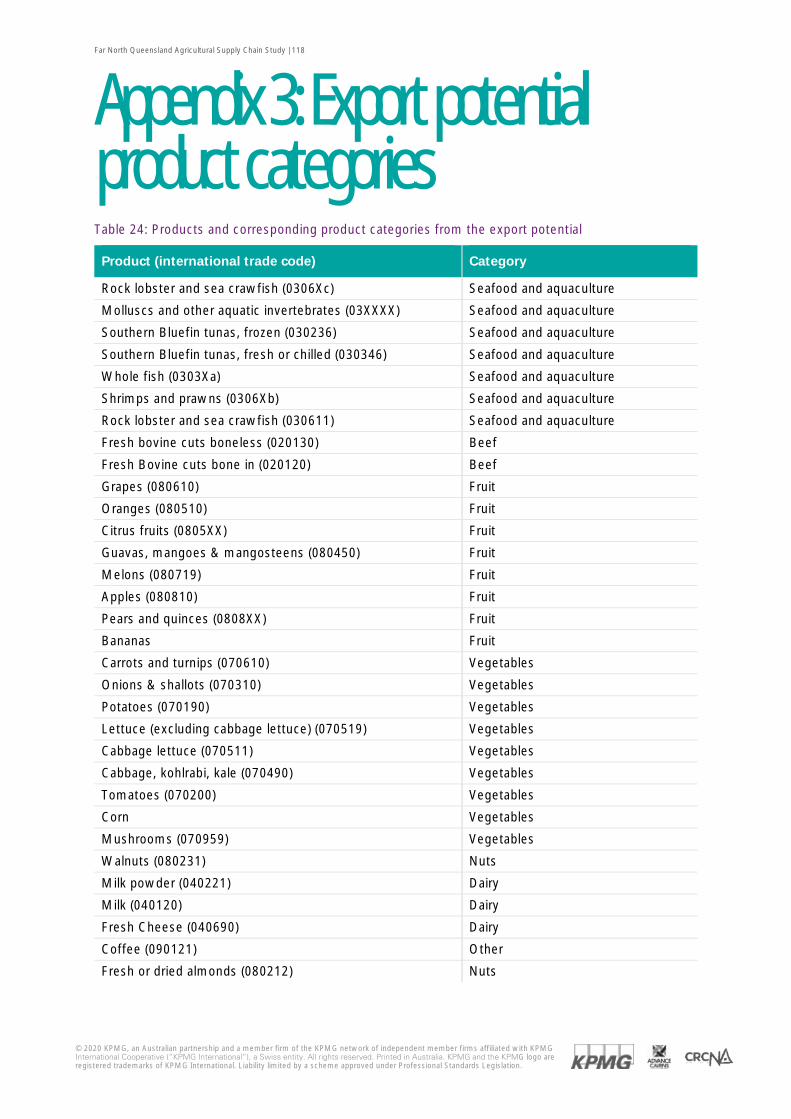
Far North Queensland Agricultural Supply Chain Study | 118
© 2020 KPMG, an Australian partnership and a member firm of the KPMG network of independent member firms affiliated with KPMG International Cooperative (“KPMG International”), a Swiss entity. All rights reserved. Printed in Australia. KPMG and the KPMG logo are registered trademarks of KPMG International. Liability limited by a scheme approved under Professional Standards Legislation.
Appendix 3: Export potential product categories Table 24: Products and corresponding product categories from the export potential
Product (international trade code) Category
Rock lobster and sea crawfish (0306Xc) Seafood and aquaculture
Molluscs and other aquatic invertebrates (03XXXX) Seafood and aquaculture
Southern Bluefin tunas, frozen (030236) Seafood and aquaculture
Southern Bluefin tunas, fresh or chilled (030346) Seafood and aquaculture
Whole fish (0303Xa) Seafood and aquaculture
Shrimps and prawns (0306Xb) Seafood and aquaculture
Rock lobster and sea crawfish (030611) Seafood and aquaculture
Fresh bovine cuts boneless (020130) Beef
Fresh Bovine cuts bone in (020120) Beef
Grapes (080610) Fruit
Oranges (080510) Fruit
Citrus fruits (0805XX) Fruit
Guavas, mangoes & mangosteens (080450) Fruit
Melons (080719) Fruit
Apples (080810) Fruit
Pears and quinces (0808XX) Fruit
Bananas Fruit
Carrots and turnips (070610) Vegetables
Onions & shallots (070310) Vegetables
Potatoes (070190) Vegetables
Lettuce (excluding cabbage lettuce) (070519) Vegetables
Cabbage lettuce (070511) Vegetables
Cabbage, kohlrabi, kale (070490) Vegetables
Tomatoes (070200) Vegetables
Corn Vegetables
Mushrooms (070959) Vegetables
Walnuts (080231) Nuts
Milk powder (040221) Dairy
Milk (040120) Dairy
Fresh Cheese (040690) Dairy
Coffee (090121) Other
Fresh or dried almonds (080212) Nuts

Far North Queensland Agricultural Supply Chain Study | 119
© 2020 KPMG, an Australian partnership and a member firm of the KPMG network of independent member firms affiliated with KPMG International Cooperative (“KPMG International”), a Swiss entity. All rights reserved. Printed in Australia. KPMG and the KPMG logo are registered trademarks of KPMG International. Liability limited by a scheme approved under Professional Standards Legislation.
Far North Queensland Agricultural Supply Chain Study | 120
© 2020 KPMG, an Australian partnership and a member firm of the KPMG network of independent member firms affiliated with KPMG International Cooperative (“KPMG International”), a Swiss entity. All rights reserved. Printed in Australia. KPMG and the KPMG logo are registered trademarks of KPMG International. Liability limited by a scheme approved under Professional Standards Legislation.
Contact us
KPMG Robert Poole KPMG Partner, National Food and Agribusiness Lead [email protected] Georgie Aley KPMG Director, Food and Agribusiness [email protected] Andrew Kulic KPMG Manager, Food and Agribusiness [email protected] Hilary Shannon KPMG Consultant, Food and Agribusiness [email protected] Advance Cairns Advance Cairns 4/16 Minnie Street Cairns, QLD 4870 07 4080 2900 [email protected] CRCNA CRCNA Head Office 2/214 Charters Towers Road Townsville, QLD 4810 07 4401 5035 [email protected]
![Barnet Growth Strategy 2019 - 2030 · Councillor Daniel Thomas Leader of the Council [Delivering for Barnet – section referencing / title graphics and page # in the background]](https://img.pdfslide.us/doc/110x75/5f40b5c1f577c316ec3e3f2e/barnet-growth-strategy-2019-2030-councillor-daniel-thomas-leader-of-the-council.jpg)