Embed Size (px)
Citation preview
Exploring Welfare-to-Exploring Welfare-to-Work Challenges in Five Metropolitan Regions
By: Margery Austin TurnerMark RubinMichelle DelairNovember 1999
National Neighborhood Indicators Partnership
THE URBAN INSTITUTE

The nonpartisan Urban Institute publishes studies, reports, and books on timely topics worthy ofpublic consideration. The views expressed are those of the authors and should not be attributedto the Urban Institute, its trustees, or its funders.

ACKNOWLEDGMENTS
The research presented in this report was conducted as part of the NationalNeighborhood Indicators Partnership (NNIP), an ongoing collaborative project of the UrbanInstitute with seven local institutions, committed to assembling and analyzing data in support ofcommunity building and neighborhood change efforts. Multi-year support for NNIP is provided bythe Rockefeller Foundation and the Annie E. Casey Foundation.
This report would not have been possible without the contributions of our NNIP partners.In particular, David Sawicki of the Atlanta Project, Neil Bania of the Center for Urban Poverty andSocial Change, Terry Bailey of the Piton Foundation, Cheryl Taylor of the Urban StrategiesCouncil, and Jim Vandermillen of the Providence Plan all participated in the design of the cross-site analysis, provided essential data, and reviewed earlier drafts of this report. In addition, TomKingsley, director of NNIP, offered critical guidance and support throughout the project. Both heand Pamela Loprest of the Urban Institute’s Human Resources Policy Center provided helpfulcomments on an earlier draft of this report. Any errors or omissions are, of course, our own.

TABLE OF CONTENTS
1. Background and Purpose . . . . . . . . . . . . . . . . . . . . . . . . . . . . . . . . . . . . . . . . 1The National Neighborhood Indicators Partnership . . . . . . . . . . . . . . . . . . . . . . 1Cross-Site Analysis of Welfare-to-Work Challenges . . . . . . . . . . . . . . . . . . . . . 2Five Study Sites . . . . . . . . . . . . . . . . . . . . . . . . . . . . . . . . . . . . . . . . . . . . . . . . . 3Data Sources and Comparability . . . . . . . . . . . . . . . . . . . . . . . . . . . . . . . . . . . . 5Summary of Findings . . . . . . . . . . . . . . . . . . . . . . . . . . . . . . . . . . . . . . . . . . . . . 7
2. Central City Welfare Recipients . . . . . . . . . . . . . . . . . . . . . . . . . . . . . . . . . . 14Minorities and Children Dominate the Central City Welfare Populations . . . . 14Geographic Clustering Among Recipients Varies Substantially Across Cities 17
3. Regional Employment Opportunities . . . . . . . . . . . . . . . . . . . . . . . . . . . . . . 22The Five Study Sites Reflect the Diversity of Metropolitan Economies Nationwide . . . . . . . . . . . . . . . . . . . . . . . . . . . . . . . . . . . . . . . . . . . . . . . . . . . . 22Entry-Level Jobs Represent a Small Share of All Employment Opportunities . 24Most Jobs Are Located Outside the Central City . . . . . . . . . . . . . . . . . . . . . . . 26
4. Linking Central City Welfare Recipients to Entry-Level Job Openings . . 30Services and Trade Are the Primary Sources of Entry-Level Job Growth . . . . 30Most Entry-Level Openings Are Far from Central City Welfare Recipients . . . 33
References . . . . . . . . . . . . . . . . . . . . . . . . . . . . . . . . . . . . . . . . . . . . . . . . . . . . . . . . 35

Exploring Welfare-to-Work Challenges in Five Metropolitan Regions 1
Atlanta, Georgia — The Atlanta Project
Boston, Massachusetts — The BostonFoundation’s Persistent Poverty Project
Cleveland, Ohio — The Center for UrbanPoverty and Social Change at Case WesternReserve University
Denver, Colorado — The Piton Foundation
Oakland, California — The Urban StrategiesCouncil
Providence, Rhode Island — The ProvidencePlan
Washington, D.C. — DC Agenda
LOCAL NNIP PARTNERS
1. BACKGROUND AND PURPOSE
As states and local governments implement the eligibility restrictions, work requirementsand time limits mandated by the Personal Responsibility and Work Opportunity Reconciliation Act(PRWORA), decisionmakers (both public and private) need reliable information at a local scale— to understand what it takes to link welfare recipients with suitable employment opportunities,to forge links between employment training, child care, transportation, and other assistanceproviders, and to anticipate how emerging policy decisions are likely to affect vulnerable peopleand neighborhoods. More specifically, community-based organizations need detailed informationabout opportunities available to poor residents as they attempt to find jobs and achieve economicindependence. Area employers need information about the characteristics and trainingrequirements of welfare recipients to determine whether and how they can become credible jobcandidates. City and county agencies responsible for implementing welfare reform need to knowmore about where welfare recipients live and their access to the training, support services, andemployment opportunities they need. And federal policymakers need concrete information aboutthe specific challenges and barriers involved in helping city welfare recipients make the transitionto work and self-sufficiency.
The National Neighborhood Indicators Partnership
The National NeighborhoodIndicators Partnership (NNIP) is anongoing collaborative project of theUrban Institute with seven localinstitutions to collect and analyzecurrent and reliable information abouturban neighborhoods. All seven of thelocal partners have built advancedinformation systems with integrated andrecurrently updated information onneighborhood conditions in their cities. And all seven are committed to the goalof democratizing information, facilitatingthe practical use of data by city andcommunity leaders, and building thecapacity of institutions and residents indistressed urban communities toanalyze and address neighborhoodconditions and trends.

Exploring Welfare-to-Work Challenges in Five Metropolitan Regions 2
For more information about NNIP, see its newly established web site at http://www.urban.org/nnip1
or send an email to [email protected]. Interested organizations and individuals are also invited to jointhe NNIP listserv. For enrollment information, send an email to [email protected].
The NNIP partner in Boston chose not to participate in this cross-site project because of other2
competing priorities. In addition, data for Cleveland are not reported here because they have beenextensively reported elsewhere. See, for example, Coulton, Leete, and Bania 1999, which provided themodel for work reported here.
The initial planning phase for NNIP was launched in 1995. Findings and conclusions from theplanning phase are documented in Kingsley (1996). Ongoing activities include the developmentof capacity-building tools and guidebooks, assistance to neighborhood indicators groups in othercities, and a cross-site analysis effort focusing on challenges involved in linking welfare recipientsto work.1
Cross-Site Analysis of Welfare-to-Work Challenges
This report presents findings from the NNIP’s cross-site analysis project, which isdesigned both to build data and analytic capacity at the local level, and to provide newinformation and insights about the challenges and impacts of welfare reform in urbanneighborhoods and regions. In each of five metropolitan areas (Atlanta, Denver, Oakland,Providence, and Washington, D.C.), local research teams are assembling data and conducting2
analysis to address two broad sets of questions about the local challenges of welfare reform:
1) Where do the people live who are at greatest risk under welfare reform? What aretheir family characteristics and service needs? Is the assistance they need — such aschild care or job training — accessible from the neighborhoods in which they live? Whatassets and supports do their communities offer?
2) Where are the job openings that welfare recipients are potentially qualified to fill? What are the skill requirements and wage rates of these jobs? What actions are neededto link welfare recipients to jobs that they could win? What jobs are potentially availableclose to the neighborhoods in which recipients live?
Answers to these questions will provide a baseline for longer-term, dynamic monitoring of theimplementation and impacts of welfare reform from the community perspective in eachmetropolitan area. In the future, NNIP partners expect to build upon their baseline analyses toexplore how welfare reform affects both people and neighborhoods over time.
Exploring Welfare-to-Work Challenges in Five Metropolitan Regions 3
The primary goal of this research is to inform decisionmaking and action at thecommunity, city, and metropolitan level. Each of NNIP’s local partners is an active participant incommunity building and policymaking in their metropolitan regions and is committed to makingreliable information available and accessible locally. At the same time, this project providesfederal policymakers with new insights from a local perspective on the challenges of welfarereform in five very different metropolitan regions.
The findings reported here show that welfare reform presents particularly dauntingchallenges for central city welfare recipients, many of whom are clustered in high-poverty,predominantly minority neighborhoods. Many of these challenges appear to be the same acrosscities, and reinforce the need for welfare-to-work strategies that explicitly address the geographicrealities of poverty concentration and suburbanizing employment. However, our findings alsoreflect major differences between cities — particularly with respect to employment opportunities— that highlight the importance of tailoring welfare-to-work strategies to local needs andconditions. In order to craft these strategies, local decisionmakers clearly need reliableinformation about geographic patterns and trends for their own cities and regions.
Five Study Sites
NNIP offers a unique platform for investigating welfare-to-work challenges in five verydifferent metropolitan regions across the country. Although there is a tremendous amount to belearned from state and national analysis, the challenges of welfare reform vary dramaticallyacross metropolitan regions and across neighborhoods within those regions. The extent to whichwelfare-dependent families are concentrated in distressed inner-city neighborhoods, theavailability and skill requirements of entry-level jobs in the regional economy, the accessibility ofemployment to poor neighborhoods, and the capacity of local child care and employment trainingsystems will all play a role in determining how welfare reform plays out across the country andhow poor families and poor neighborhoods are affected. This project — which focuses not onlyon individual metropolitan regions but on differences among neighborhoods within those regions— helps call attention to key implementation issues and solutions that might otherwise beoverlooked.

Exploring Welfare-to-Work Challenges in Five Metropolitan Regions 4
Although the NNIP partner cities do not constitute a formal sample of U.S. metropolitanregions, they do reflect considerable diversity of demographic and socio-economic conditions, asillustrated in Exhibit 1. The study sites range in size from Providence — a city of only 160,000 ina metro area of 1.1 million — to the District of Columbia — a city of about 600,000 in a metroarea of almost 4 million. Minorities consistently represent a disproportionate share of central citypopulations, but the racial and ethnic composition of our study sites varies quite dramatically.Specifically, Washington and Atlanta both have large black populations, which account for thevast majority of their central city residents, and relatively few Hispanics. Denver, Providence,and Oakland, on the other hand, all have much larger Hispanic populations, although blacks arealso well represented in the city of Oakland. Moreover, in both Oakland and Providence, one ofevery five central city residents is foreign born.
Exhibit 1: Selected 1990 Characteristics of Study Sites
Atlanta Denver Oakland Providence Washington Mean for100 Lgst
MSAs
MSA CC MSA CC MSA CC MSA CC MSA CC MSA CC
Population (000) 2834 394 1623 468 2083 372 1142 161 3924 607 1429 500
% Black 26 67 6 13 15 44 3 15 27 66 13 27
% Hispanic 2 2 13 23 13 13 4 15 6 5 9 12
% Foreign Born 4 3 5 7 16 20 10 20 12 10 8 10
Poverty Rate 10 27 10 17 9 19 10 23 6 17 12 19
Unemployment 5 9 5 7 6 9 7 9 4 7 6 8
% Hhs on Public 5 14 5 8 9 18 8 16 4 9 7 11Assistance
% Males not in 26 40 26 32 30 41 31 40 24 38 31 36Labor Force
% Female- 24 56 22 32 24 42 22 40 23 54 23 36HeadedFamilies
% 16-19 HS 12 13 11 16 9 15 12 14 9 14 11 14Dropouts
Source: Urban Institute tabulations of 1990 Census data

Exploring Welfare-to-Work Challenges in Five Metropolitan Regions 5
The Atlanta Project and the Piton Foundation both assembled data on welfare caseloads for their3
larger metropolitan areas, as well as for the central cities of Atlanta and Denver. These enhanceddatabases support analysis of larger spatial patterns in the residential location of welfare recipients,discussed briefly in section 2.
Not surprisingly, poverty rates are consistently higher in the central cities of our studysites than in the surrounding suburbs. But again, the differences between cities are quitesignificant. Poverty rates (as of 1990) range from a low of 17 percent in Denver andWashington, D.C., to a high of 27 percent in Atlanta. Other indicators of social and economicdistress also vary across cities. For example, Atlanta and D.C. have particularly high shares offemale-headed families; Denver and D.C. have relatively low shares of households on publicassistance.
Data Sources and Comparability
As a starting point for understanding welfare-to-work challenges at the neighborhoodscale, the NNIP partners in Atlanta, Denver, Oakland, Providence, and Washington, D.C.,assembled reasonably comparable data sets on welfare caseloads in their respective centralcities and on job opportunities in their respective metropolitan area labor markets. Because of3
differences across cities in data availability, these data sets do not all have exactly the samedata items or variable definitions. Instead, we have built a cross-site database from data setsthat our local partners had in hand or were able to obtain. Exhibit 2 summarizes these datasources and the availability of key data items across the five study sites.
All five sites obtained data on the demographic characteristics and addresses of citywelfare recipients at a recent point in time from city or county administrative data systems. Theoldest of these files is Oakland’s (December 1997) and the most current is Denver’s (October1998). Each local partner aggregated these data to produce summary files containing thenumber and characteristics of welfare recipients at the census tract level. This intermediateanalysis step is essential to protecting data confidentiality, since the local partners are prohibitedfrom releasing or sharing information that could be used to identify individual welfare recipients. The welfare data are not completely consistent across the study sites. As Exhibit 2 indicates,local administrative systems could not all provide data for the same basic recipientcharacteristics. Nevertheless, the cross-site database contains a core of reasonably comparableinformation about the characteristics and residential locations of welfare recipients in five centralcity jurisdictions.

Exploring Welfare-to-Work Challenges in Five Metropolitan Regions 6
For more information on the strengths and limitations of ES-202 data, see Kingsley (1999).4
Data on jobs in each of the five metropolitan regions were obtained either from stateunemployment compensation files (generally known as ES-202 data) or from the Dun &Bradstreet MarketPlace data system. The NNIP partners in Atlanta and Denver have been ableto negotiate access to their states’ ES-202 files, which are widely believed to provide the mostcomplete and accurate information on employment by location and industry. 4
Exhibit 2: Data Sources and Comparability Across Metro Areas
Atlanta Denver Oakland Providence Washington
Welfare recipients
source administrative records from city and county human services departments
area 9-county 4-county city of city of District ofmetro area metro area Oakland Providence Columbia
date 2/98 10/98 12/97 1/98 1/98
race/ethnicity yes yes yes no yes
age yes yes yes yes yes
age of children no yes yes yes yes
education yes no no yes no
language no no yes yes yes
Employment opportunities
source ES-202 ES-202 D&B D&B D&B
area 9-county 7-county 2-county 7-county 25-countymetro area metro area metro area metro area metro area
date 2 quarter 1996 4/98 4/98 4/98nd
of 1997
industry yes yes yes yes yes

Exploring Welfare-to-Work Challenges in Five Metropolitan Regions 7
Our Providence partner is in the process of negotiating access to these data, while Oakland andWashington do not expect to be able to gain access to ES-202 files in the foreseeable future. Both ES-202 data and the Dunn & Bradstreet data have been scaled to yield comparableestimates of the total number of jobs in the metropolitan region, using control totals from theBureau of Labor Statistics’ Current Employment Survey for AprilSJune 1998. It is important tonote that our data may underestimate regional employment opportunities for cities such asOakland and Providence, where residents may work in other major cities (San Francisco andBoston) that are nearby.
Summary of Findings
The data and analysis presented here confirm that welfare reform presents significantchallenges for central city welfare recipients and for the communities in which they live. Many ofthese challenges appear to be the same across cities. For example,
< city welfare populations are dominated by racial and ethnic minorities, and most welfarehouseholds include preschool children;
< city welfare recipients tend to be quite highly clustered, with a large proportionconcentrated in minority neighborhoods with moderate to high poverty rates;
< fewer than one in five jobs in the regional economy match the entry-level qualifications ofmost welfare recipients;
< even where employment growth is robust, the number of central city welfare recipientsentering the labor market is likely to absorb at least half of new entry-level jobs createdregionwide; and
< the majority of these jobs are located in areas distant from central city welfarepopulations.
These common findings highlight the need for local welfare-to-work strategies that explicitlyaddress locational realities. For example, cities should consider targeting work readiness andskills training programs to neighborhoods where welfare recipients are clustered, possibly takingadvantage of community-based organizations to reach out to residents and support them as theymake the transition from welfare to work. Most recipients will need reliable and affordable childcare, which may not be available in the neighborhoods where they live. And many low-skilledworkers in central city neighborhoods are likely to need special help finding out about suburban job opportunities, applying for these jobs, and commuting to them over the long term.
Exploring Welfare-to-Work Challenges in Five Metropolitan Regions 8
However, our findings also show major differences between cities that highlight theimportance of assembling reliable information on geographic patterns and tailoring welfare-to-work strategies to local needs and conditions. To illustrate:
< Although the Atlanta region has enjoyed considerable economic growth over the last tenyears, the central city’s poverty rate remains high. The vast majority of city welfarerecipients are black, and these families are highly concentrated in predominantly black,high-poverty neighborhoods. Job growth on the other hand is far more decentralized,with most entry-level job creation occurring more than 10 miles from the primaryneighborhoods where welfare recipients are clustered. These findings have helped focuslocal attention on the need for welfare-to-work transportation services. The Atlanta regionrecently won a $2 million grant to develop specialized bus routes that will transport centralcity welfare leavers to job-rich areas of the suburbs.
< Denver’s welfare caseload amounts to only a tiny fraction of the city’s total populationand consequently the density of welfare recipients in any given neighborhood is relativelylow. A substantial share of entry-level job opportunities are located within the city, andannual growth in the number of entry-level jobs regionwide far exceeds the number of cityrecipients likely to join the labor market each year. These conditions have enabled manyDenver residents to leave welfare for work, dramatically increasing the need foraffordable child care. Local estimates indicate that the capacity of licensed child careproviders in Denver falls far short of need, especially for infants and toddlers.
< The welfare population in Oakland is ethnically diverse, including whites, blacks,Hispanics, and Asians. One of the most striking aspects of Oakland’s welfare populationis the unusually large number of children — more than three children for every adultwelfare recipient. In addition, more than half of welfare households include preschoolchildren. Thus, the availability of child care in neighborhoods where recipients areconcentrated represents a particularly important challenge. In addition, the diversity ofOakland’s welfare population — and the substantial share for whom English is a secondlanguage — exacerbates the challenges involved in designing effective job training andplacement services.

Exploring Welfare-to-Work Challenges in Five Metropolitan Regions 9
< Welfare recipients account for 16 percent of all Providence residents and 42 percent ofall children. Although manufacturing industries represent the largest source of jobs inthe Providence region, the number of entry-level manufacturing jobs is expected todecline over the next decade. Consequently, the number of welfare recipients in the cityof Providence who can be expected to enter the labor market annually as a result ofwelfare reform substantially exceeds the number of new entry-level jobs being createdeach year in the region as a whole. This has encouraged policymakers and communityleaders in Providence to focus on economic development as a component of their welfarereform strategy, in order to expand the number of employment opportunities in the cityand the surrounding region.
< In Washington, D.C. — like Atlanta — the welfare population is predominantly black andis highly concentrated in poor black neighborhoods. However, because it is the nation’scapital, Washington continues to offer significant numbers of jobs relatively close to itswelfare population. Although the city’s share of regional jobs has declined substantiallyover the last decade, central city job clusters offer a large number of entry-level positionsthat could potentially be performed by city welfare recipients. However, many entry-leveljobs located inside the city limits appear to be held by suburban residents, raising seriousconcerns about the District of Columbia’s workforce development system, including itspublic school system.
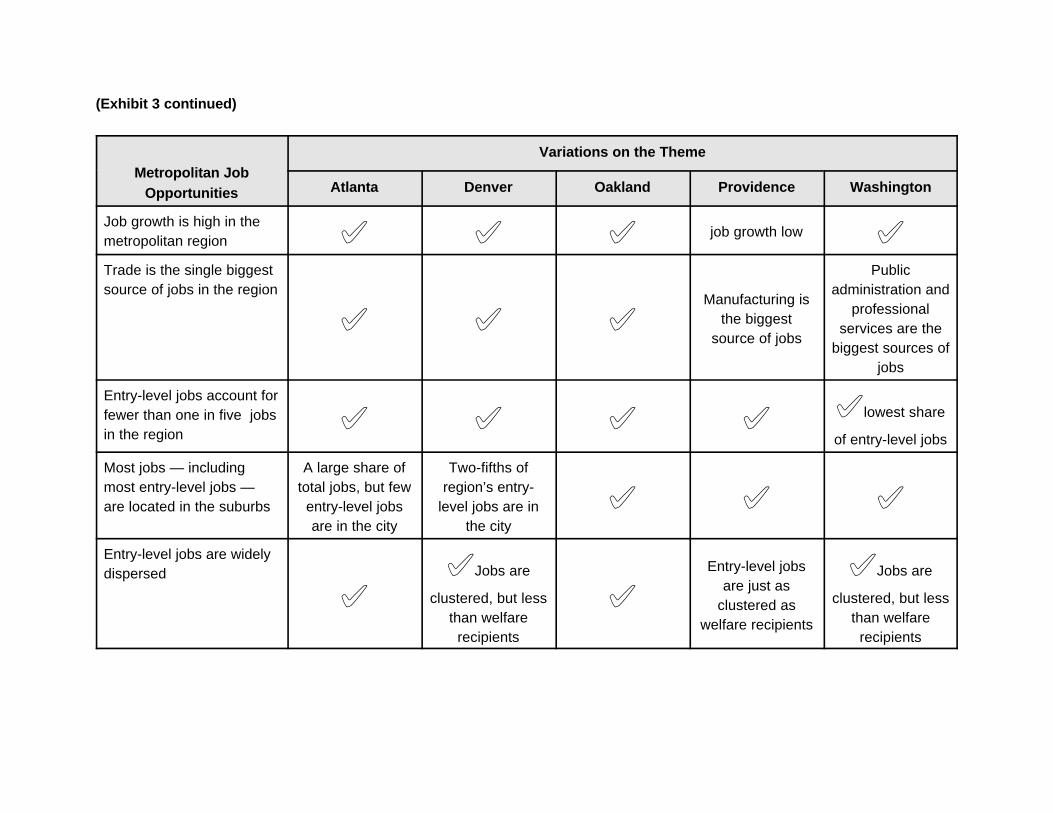
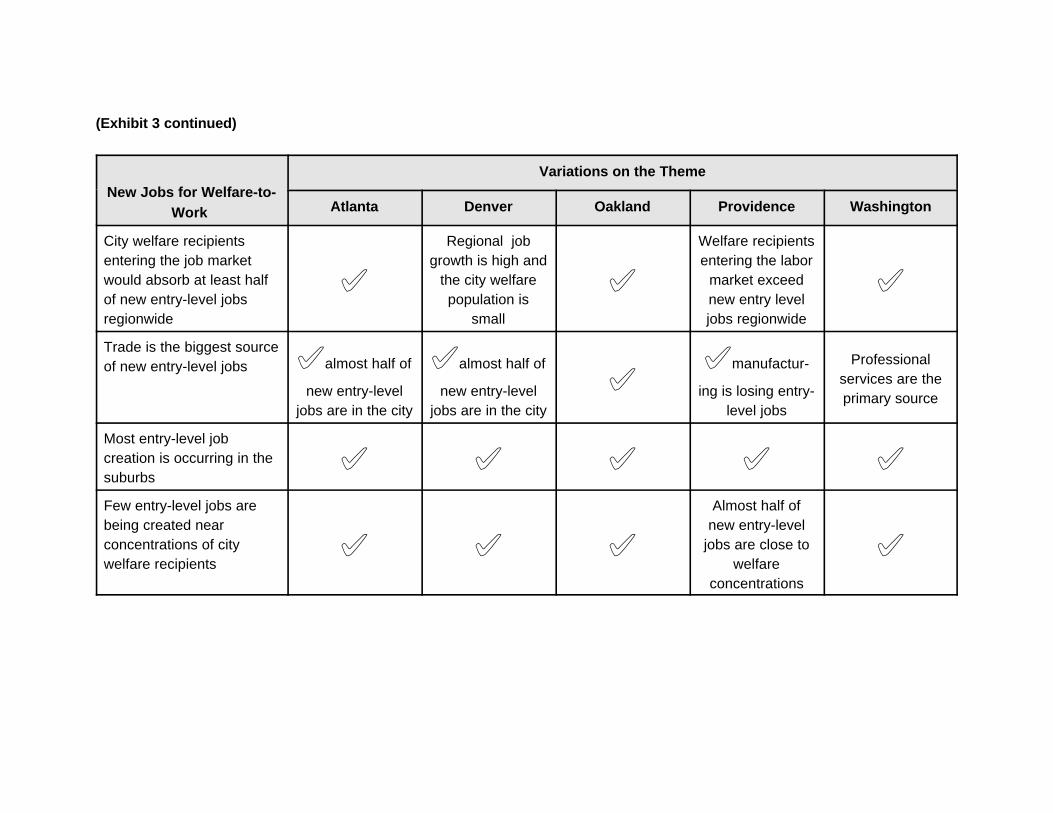
The differences between these five study sites illustrate why local welfare-to-work strategiesmust be “customized” to reach out to welfare recipients in the neighborhoods where they live,prepare recipients for work in the region’s most promising industries and occupations, andstrengthen both information and transportation linkages between areas of entry-level employmentgrowth and the neighborhoods where welfare recipients are located. Exhibit 3 summarizes themajor cross-cutting findings that emerge from this analysis, as well as the important differencesbetween sites that are revealed.
The remainder of this report consists of three sections. Section 2 describes thecharacteristics of the central city welfare populations in the five study sites and explores theirresidential location patterns. Section 3 summarizes key characteristics of the regional labormarkets, including the industrial and occupational mix, sources of entry- .level jobs, and thegeographic dispersal of employment opportunities. Finally, section 4 highlights key challengesconfronting welfare-to-work strategies, presenting forecasts for entry-level job growth andcomparing the location of these new job opportunities to concentrations of central city welfarefamilies.

Exhibit 3: Summary of Findings
Central City WelfarePopulations
Variations on the Theme
Atlanta Denver Oakland Providence Washington
At least one in ten city less than 4% ofresidents are welfare residents receiverecipients welfare
° ° ° °Almost all city welfarerecipients are minorities
° mostly black ° mostly black° mostly
Hispanic
° black,
Hispanic, andAsian
NA
Most adult welfarerecipients are under 40 ° ° ° °° largest share
of adults over 40
Children outnumber adultsin the welfare caseload ° lowest ratio of
children to adults° ° °
° highest ratio
of children toadults
Most welfare householdsinclude preschool children NA NA ° °° three-quarters
include an infant

(Exhibit 3 continued)
Residential LocationPatterns
Variations on the Theme
Atlanta Denver Oakland Providence Washington
Welfare recipients aregeographically clusteredand live at high densities
° highest ° highest
clustering clustering
low density butstill quiteclustered
° °Most recipients live inmoderate- to high-povertyneighborhoods
° highest share
in high-pov neighbs
° ° ° °
Most recipients live inneighborhoods that aremajority black or Hispanic
° black ° Hispanic ° Hispanic ° black° black and
Hispanic
Minority recipients aremore geographicallyclustered than whites
° Blacks are ° Hispanics are
most clustered most clustered° °NA
Black recipients are themost likely to live in high-poverty neighborhoods ° °
° Both blacks
and Hispanics livein high poverty
Asian recipientsare the most likely
to live in highpoverty
NA
(Exhibit 3 continued)
Metropolitan JobOpportunities
Variations on the Theme
Atlanta Denver Oakland Providence Washington
Job growth is high in themetropolitan region ° ° ° °job growth low
Trade is the single biggest Publicsource of jobs in the region administration and
° ° °Manufacturing is
the biggestsource of jobs
professionalservices are the
biggest sources ofjobs
Entry-level jobs account forfewer than one in five jobsin the region
° ° ° ° ° lowest share
of entry-level jobs
Most jobs — including A large share of Two-fifths ofmost entry-level jobs — total jobs, but few region’s entry-are located in the suburbs entry-level jobs level jobs are in
are in the city the city
° ° °
Entry-level jobs are widelydispersed
° °° Jobs are ° Jobs are
clustered, but less clustered, but lessthan welfare than welfare
recipients recipients
Entry-level jobsare just as
clustered aswelfare recipients
(Exhibit 3 continued)
New Jobs for Welfare-to-Work
Variations on the Theme
Atlanta Denver Oakland Providence Washington
City welfare recipients Regional job Welfare recipientsentering the job market growth is high and entering the laborwould absorb at least half the city welfare market exceedof new entry-level jobs population is new entry levelregionwide small jobs regionwide
° ° °
Trade is the biggest sourceof new entry-level jobs ° almost half of ° almost half of ° manufactur-
new entry-level new entry-level ing is losing entry-jobs are in the city jobs are in the city level jobs
°Professional
services are theprimary source
Most entry-level jobcreation is occurring in thesuburbs
° ° ° ° °Few entry-level jobs are Almost half ofbeing created near new entry-levelconcentrations of city jobs are close towelfare recipients welfare
° ° ° °concentrations

Exploring Welfare-to-Work Challenges in Five Metropolitan Regions 14
In Oakland, a significant share of welfare cases are “child only.” Adults in these households are5
not eligible to receive welfare benefits but children in the household are. Possible examples could includefamilies in which parents are not citizens and families in which grandparents or other relatives are caring forchildren.
2. CENTRAL CITY WELFARE RECIPIENTS
Although the welfare caseloads in our five study sites are similar in many importantrespects, they also differ significantly. These differences have important implications for thedesign of welfare-to-work strategies. In particular, patterns of geographic concentration amongwelfare recipients and the characteristics of neighborhoods in which they live highlight theimportance of locally designed strategies.
Minorities and Children Dominate the Central City Welfare Populations
In comparing the central city welfare populations of the five study sites, two importantpatterns emerge: children significantly outnumber adults and minorities dominate the central citycaseloads. However, there are also significant differences among the five study sites. Inparticular, these cities vary with respect to the relative size of the welfare caseload, the racial andethnic diversity of recipients, and the prevalence of very young children among welfare families.
Exhibit 4: Central City Welfare Caseloads
Atlanta Denver Oakland Providence Washington
Total adults 20,743 5,405 13,731 7,789 18,573
Total children 38,787 15,815 44,321 16,026 41,857
Chldrn per adult 1.9 2.9 3.2 2.1 2.3
% of city pop 14.8% 3.6% 12.5% 15.6% 10.0%
% of city chldrn 40.9% 12.3% 34.6% 41.7% 30.7%
% of state welf 16.9% 18.0% 1.7% 41.1% NA
Source: NNIP Cross-Site Caseload Database
Although welfare caseloads range in size from only about 21,000 recipients in Denver to60,000 in D.C., children consistently outnumber adults in the welfare population. Atlanta has thelowest ratio of children to adults in the welfare caseload, at 1.9, while in Oakland, there are morethan 3 children for every adult in the welfare population. Moreover, children are far more likely5

Other
Asian
Hispanic
Black
White
AtlantaDenver
OaklandProvidence
Washington
0.0%
20.0%
40.0%
60.0%
80.0%
100.0%
Exploring Welfare-to-Work Challenges in Five Metropolitan Regions 15
Exhibit 5: Racial and Ethnic Composition ofCentral City Welfare Caseloads
than adults to be welfare recipients in all five study sites. For example, more than 40 percent ofall children living in the cities of Providence and Atlanta receive welfare, compared to only about15 percent of the population as a whole.
The size of the central city welfare caseload varies significantly across the five sitesstudied here, both in relation to the total city population and in relation to the total welfarecaseload of the state. In Denver, for example, the welfare caseload is very small, accounting forless than 4 percent of the city’s population, compared to a high of almost 16 percent inProvidence. Moreover, the welfare caseload in Providence accounts for a large share (41.7percent) of the state’s total caseload. In contrast, Oakland’s welfare population represents lessthan 2 percent of all recipients in California.
Four of the study sites were able to obtaindata on the racial/ethnic characteristics of welfarerecipients. Although the composition of thecaseload differs significantly across these cities,minorities dominate the central city welfare casesin all of them. In Atlanta and the District ofColumbia, the vast majority of recipients (over 90percent) are African American. Denver andOakland’s welfare populations are far morediverse; in Oakland African Americans accountfor about 60 percent of household heads, Asiansaccount for over one-quarter, and Hispanicsaccount for about 8 percent. Denver has thelargest share of white recipients (17 percent); inthe other cities, whites account for less than fivepercent of the welfare population.

55+
40-54
25-39
18-24
AtlantaDenver
OaklandProvidence
Washington
0.0%
20.0%
40.0%
60.0%
80.0%
100.0%
13 - 176 - 12
4 - 52 - 3<=1
AtlantaDenver
OaklandProvidence
Washington
0.0%
20.0%
40.0%
60.0%
80.0%
100.0%
Exploring Welfare-to-Work Challenges in Five Metropolitan Regions 16
Exhibit 6: Age Distribution of Central City WelfareCaseloads
Exhibit 7: Age of Youngest Child for Central CityWelfare Caseloads
It is important to note that the racial and ethnic composition of central city welfarepopulations is not reflective of the composition of total welfare caseloads. Two of our study sites— Atlanta and Denver — were able to obtain detailed caseload data for the metropolitan regionas a whole. These data illustrate that minorities — and particularly African Americans — tend tobe over-represented in central city caseloads. Specifically, 91 percent of welfare recipients in thecity of Atlanta are African American and only 4 percent are white, while in the Atlanta region as awhole, 70 percent of recipients are African Americans and 19 percent are white. Similarly, incentral city Denver, only 17 percent of welfarerecipients are white, 24 percent are black, and 48percent are Hispanic, while in the four-countymetropolitan area, 51 percent are white, only 13percent are black, and 25 percent are Hispanic.
All of the study sites were able to obtaindata on the age of household heads for welfarecases. And in all of these cities, half of the adultrecipients are between the ages of 25 and 39. Younger adults (18 to 24) account for asomewhat larger share in Atlanta, Denver, andWashington than in Oakland and Providence. But the share of young adults does not exceed 35percent in any of these cities. In Oakland, asubstantial share of adult recipients (about one infour) are older, between the ages of 40 and 54. But very few welfare recipients in any of thesecities are 55 or over.
Data are available from three study siteson the ages of children in welfare households. Inall three of these sites, the majority of welfarecases include preschool children. This fact couldhave important implications regarding theavailability and accessibility of affordable childcare. In Oakland, 55 percent of cases include achild under 6, and in the District of Columbia, 60percent of cases include a preschool child.Providence is unusual in that almost three-quarters of the welfare cases include an infant(less than one year) and a total of 88 percent ofcases include a child under 6.

300 +
200 - 300
100 - 200
< 100
AtlantaDenver
OaklandProvidence
Washington
0.0%
20.0%
40.0%
60.0%
80.0%
100.0%
Exploring Welfare-to-Work Challenges in Five Metropolitan Regions 17
See Ellen and Turner (1998) for a review of the empirical literature on how neighborhood6
environment affects outcomes for individual families and children.
See Massey and Denton (1993) and Jargowsky (1996).7
Exhibit 8: Recipients per Square Mile in CentralCity Welfare Caseloads
Geographic Clustering Among Welfare Recipients Varies Substantially Across Cities
Welfare recipients in D.C., Providence, and Oakland are highly concentrated,geographically, while recipients in Denver are far more dispersed and Atlanta represents anintermediate picture. In all five study sites, however, the majority of welfare recipients live inneighborhoods with poverty rates over 20 percent and unemployment rates over 10 percent. Other research suggests that living in these types of distressed neighborhoods may make itharder for families to advance economically. The racial and ethnic composition of the6
neighborhoods in which recipients live varies significantly, depending upon the composition of thewelfare population. In cities where the welfare population is predominantly black, recipients arehighly concentrated in predominantly black neighborhoods, where cities with more diversewelfare populations have more recipients living in ethnically diverse neighborhoods. Thesepatterns reflect the persistence of racial segregation in urban housing and the spatial isolation ofmany poor African Americans.7
Welfare recipients in D.C., Providence,and Oakland are the most densely concentratedof the five study sites. The vast majority ofrecipients in these three cities live in censustracts where the total number of recipientsexceeds 300 per square mile. In D.C., whererecipients are the most densely concentrated,almost 90 percent of recipients live in tracts withmore than 300 recipients per square mile. Incontrast, only 7 percent of Denver recipients livein such high concentrations, and 41 percent livein tracts where the total number of recipients isbelow 100 per square mile. Welfare recipients inAtlanta are moderately concentrated, with 51percent in high-density census tracts and 11percent living in low- density tracts.
Welfare recipients are also highly clustered in Washington, D.C., and Atlanta, but less soin the other study cities. Geographic clustering reflects the extent to which tracts with largenumbers of welfare recipients are located close together or scattered across the city. Exhibit 8reports a standardized index of spatial clustering; this index (Moran’s I) ranges from zero to one,

30% +
20 - 30%
10 - 20%
< 10%
AtlantaDenver
OaklandProvidence
Washington
0.0%
20.0%
40.0%
60.0%
80.0%
100.0%
Exploring Welfare-to-Work Challenges in Five Metropolitan Regions 18
For more information on the calculation and interpretation of Moran’s I, see Anselin (1992).8
Exhibit 10: Central City Welfare Recipients byTract Poverty Rates
where values close to one mean that tracts with large numbers of welfare recipients arecontiguous to one another, and low values mean that tracts with large numbers of recipients aremore widely scattered across the city as a whole. In Washington and Atlanta, index values8
exceed 0.3, while in Providence, the value is less than 0.2. Map 1 further illustrates the extent ofgeographic clustering among welfare recipients in the five study sites.
Exhibit 9: Index of Clustering for Central City Welfare Caseloads
Atlanta Denver Oakland Providence Washington
Clustering Index 0.305 0.275 0.237 0.188 0.328
Probability 0.000 0.000 0.000 0.000 0.017
Source: NNIP Cross-Site Caseload Database
The majority of welfare recipients in allfive sites live in neighborhoods with poverty ratesover 20 percent. Few central city welfarerecipients live in low-poverty neighborhoods(census tracts that are less than 10 percentpoor). Recipients in Atlanta are the most likely tolive in tracts with high poverty rates. Specifically,84 percent of Atlanta recipients live inneighborhoods with poverty rates over 20percent, and 54 percent live in neighborhoodswith poverty rates above 30 percent. The sharewho are concentrated in very high povertyneighborhoods (more than 30 percent poor)varies considerably across study sites. InAtlanta, approximately half of all recipients live invery high poverty neighborhoods. In Providence,Washington, and Denver, about four in ten recipients are concentrated in very high poverty areasof the city. In Oakland, on the other hand, the share of recipients living in very high povertyneighborhoods is substantially lower — only about two in ten.

90% +
50 - 90%
10 - 50%
< 10%
AtlantaDenver
OaklandProvidence
Washington
0.0%
20.0%
40.0%
60.0%
80.0%
100.0%
90% +
50 - 90%
10 - 50%
< 10%
AtlantaDenver
OaklandProvidence
Washington
0.0%
20.0%
40.0%
60.0%
80.0%
100.0%
Exploring Welfare-to-Work Challenges in Five Metropolitan Regions 19
Exhibit 11: Central City Welfare Recipients byTract Percent Black
Exhibit 12: Central City Welfare Recipients byTract Percent Hispanic
Because the five study sites differ significantly in terms of racial and ethnic composition, there is also substantial variation in the race/ethnicity of neighborhoods in whichwelfare recipients live. In general, neighborhood racial and ethnic characteristics correspond tothe racial and ethnic make-up of the welfare population, suggesting that welfare recipients (likemost other Americans) tend to live in neighborhoods where their own racial or ethnic grouppredominates. Thus, in Atlanta and D.C., the majority of recipients live in predominantly blackneighborhoods. In fact, fewer than 10 percent of recipients in Atlanta and fewer than 5 percent ofthose in D.C. live in neighborhoods that are less than half black. In contrast, most Denverrecipients live in tracts that are majority Hispanic, and in Providence, the bulk of recipients live inneighborhoods where Hispanics account for 10 to 50 percent of the population. Oakland exhibitsthe greatest diversity in neighborhood racial and ethnic composition, with about half of recipientsliving in neighborhoods that are majority black and about half living in neighborhoods that are 10to 50 percent Hispanic.

WhiteBlackHispanic
Asian
AtlantaDenver
OaklandProvidence
Washington
0.0%
10.0%
20.0%
30.0%
40.0%
50.0%
60.0%
Exploring Welfare-to-Work Challenges in Five Metropolitan Regions 20
Exhibit 13: Share of Central City WelfareRecipients in High-Poverty Tracts
The extent to which central city welfarerecipients live in high-poverty neighborhoodsappears to vary significantly with their race orethnicity. In Atlanta and Washington, D.C.,where the welfare caseloads are overwhelminglyAfrican American, African American recipientsare the most likely to live in high-povertyneighborhoods, and Hispanics are the leastlikely. In Atlanta, 58 percent of black recipientslive in high-poverty neighbor-hoods, compared toonly 27 percent of Hispanics. And inWashington, 42 percent of black recipients butonly 14 percent of Hispanic recipients live inhigh-poverty neighborhoods.
The picture appears to be very differentin Oakland, however, where the welfare population is considerably more diverse. AlthoughAfrican Americans account for the largest share of welfare recipients in Oakland, the share ofAsians and Hispanics is far greater than in either Atlanta or Washington. In fact, over one-quarter of recipients are Asians, and they are the most likely to be concentrated in high-povertyneighborhoods. Specifically, 38 percent of Asian recipients live in high-poverty tracts, comparedto only 17 percent of whites, and 25 and 23 percent of blacks and Hispanics, respectively. InDenver, where roughly half of all welfare recipients are Hispanic, Hispanics are slightly morelikely than blacks to live in high-poverty neighborhoods.
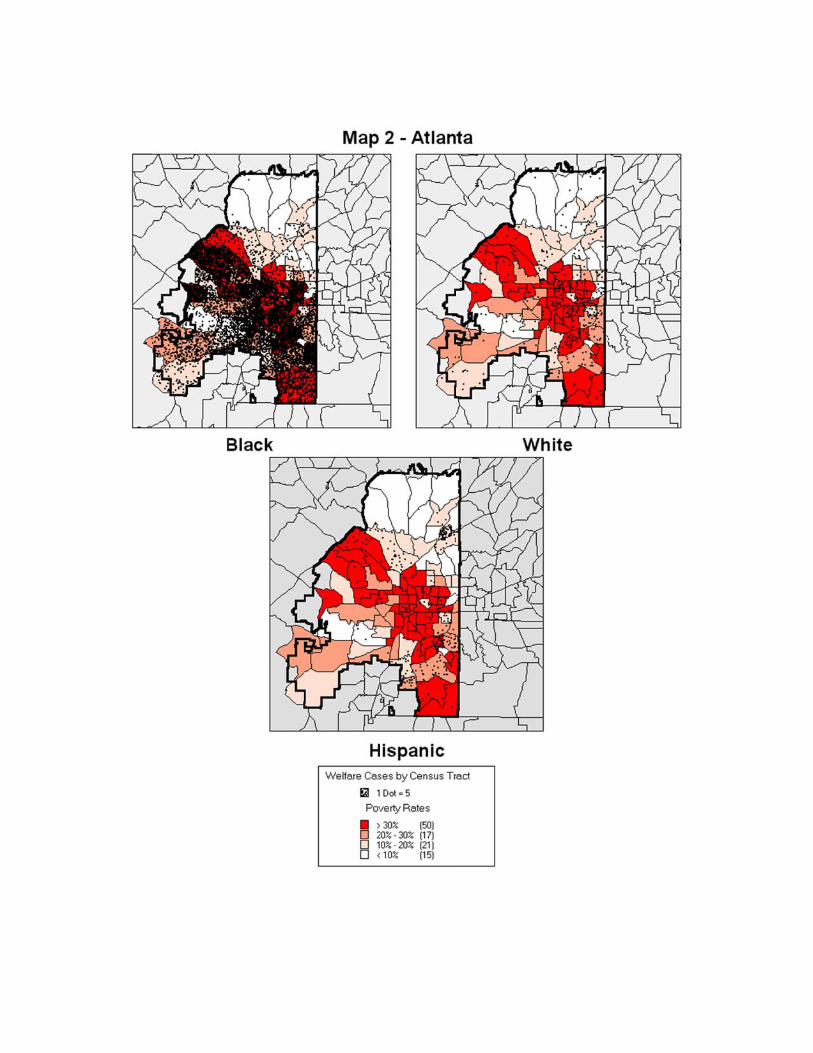
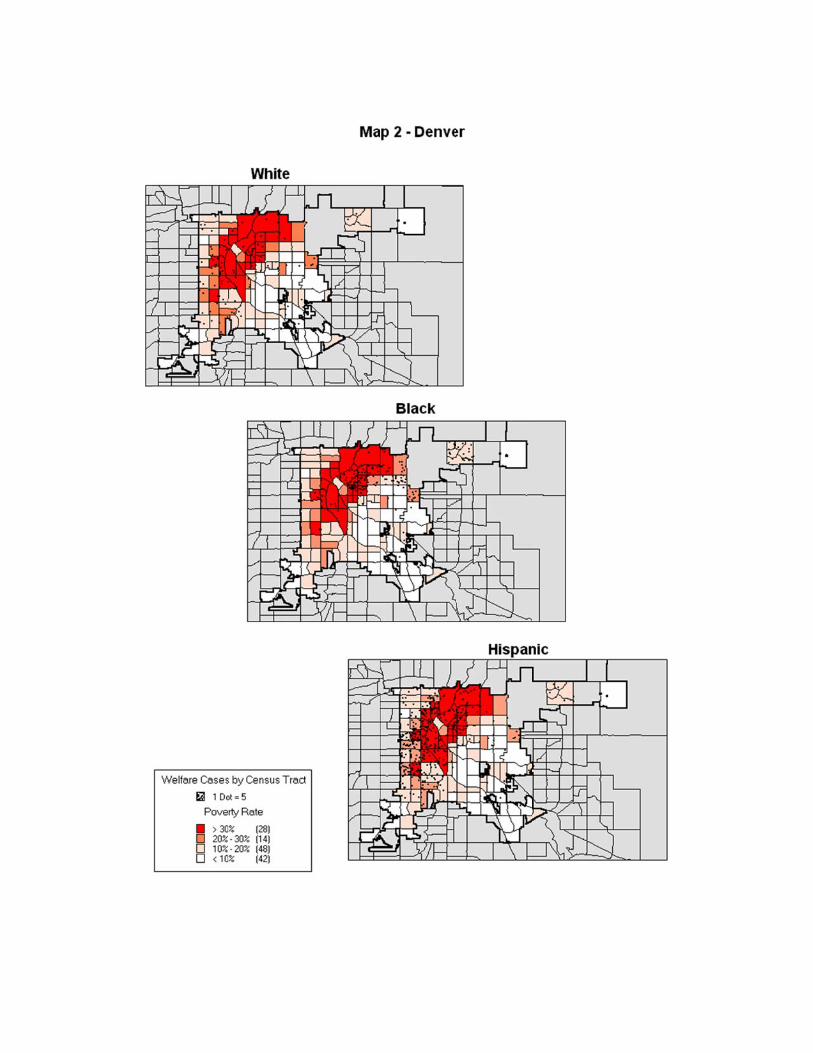
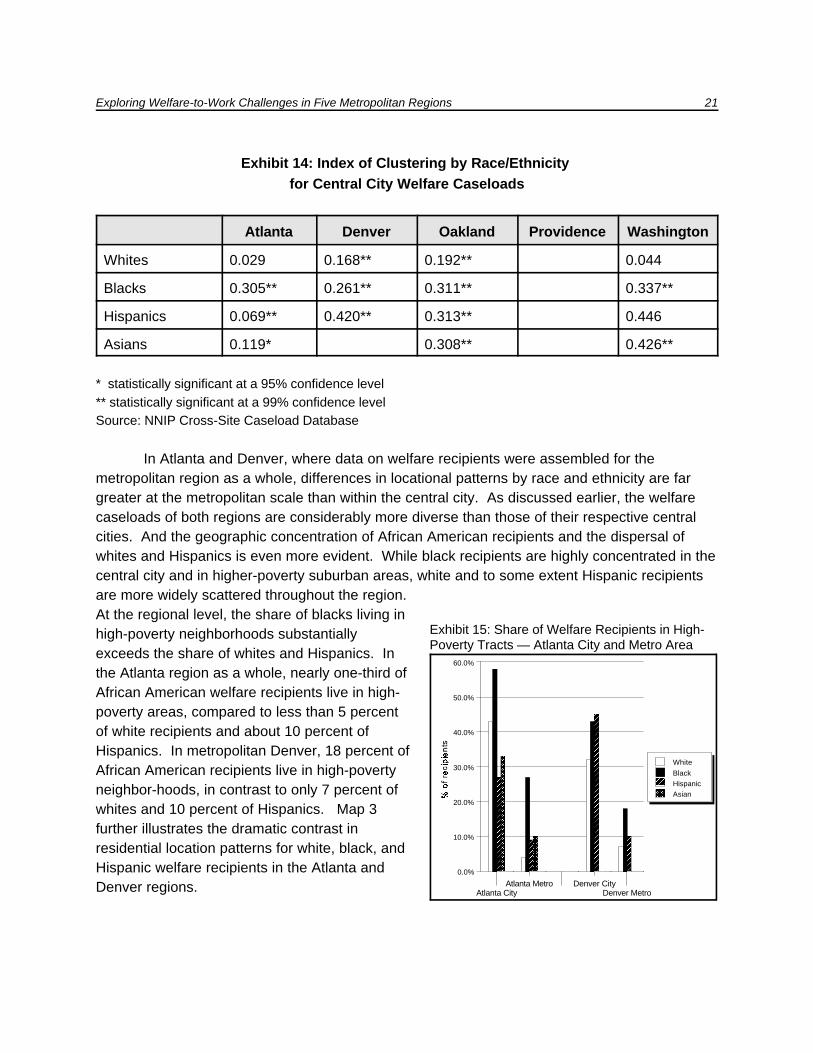
Map 2 and Exhibit 14 further illustrate the critical role of race and ethnicity in shapinglocational patterns among welfare recipients. In both Atlanta and the District of Columbia, wherethe welfare caseloads are overwhelmingly black, African American recipients are highly clusteredand tend to live in predominantly high-poverty neighbor-hoods. Although Hispanic welfarerecipients in both of these cities are less likely to live in areas of high poverty, they neverthelessappear to quite tightly clustered in Washington, D.C. In Oakland, African Americans, Hispanics,and Asians are all highly clustered (in different areas of the city), while Asians are most likely tolive in areas of high poverty. In Denver, Hispanics and blacks are both highly clustered (indistinct areas), with very high clustering among Hispanics. In all four sites, white recipients are the least clustered, geographically.
White
BlackHispanicAsian
Atlanta CityAtlanta Metro Denver City
Denver Metro
0.0%
10.0%
20.0%
30.0%
40.0%
50.0%
60.0%
Exploring Welfare-to-Work Challenges in Five Metropolitan Regions 21
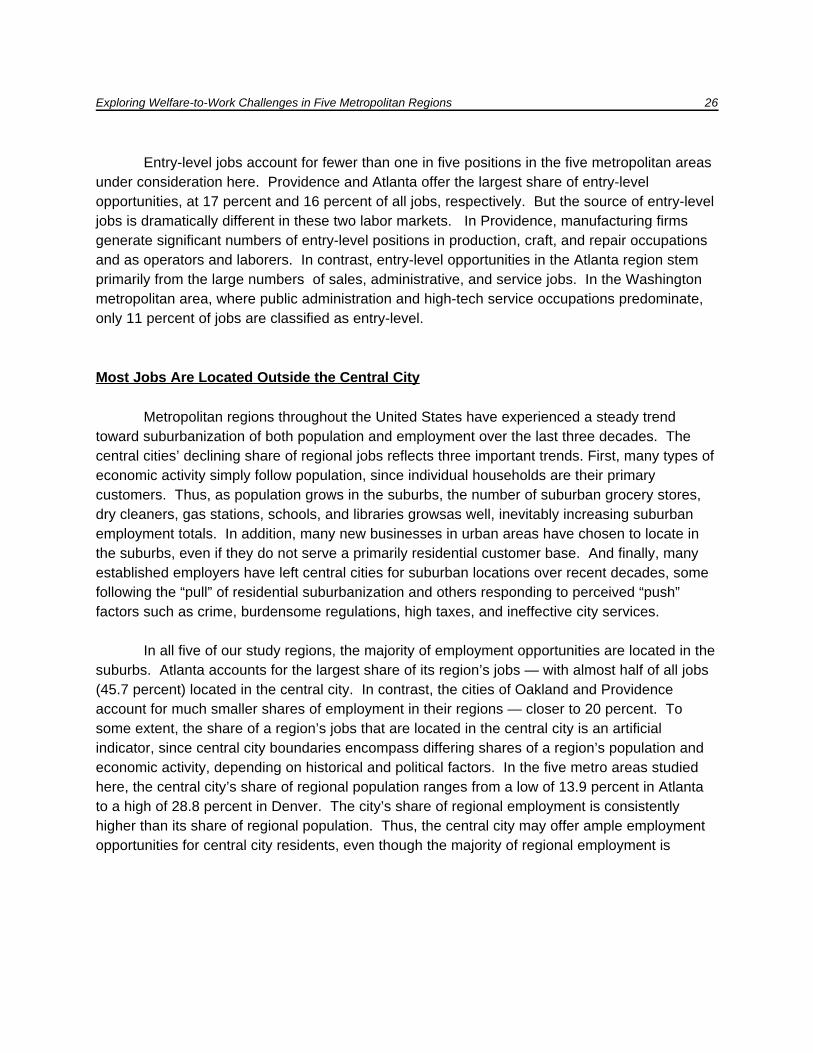
Exhibit 15: Share of Welfare Recipients in High-Poverty Tracts — Atlanta City and Metro Area
Exhibit 14: Index of Clustering by Race/Ethnicity for Central City Welfare Caseloads
Atlanta Denver Oakland Providence Washington
Whites 0.029 0.168** 0.192** 0.044
Blacks 0.305** 0.261** 0.311** 0.337**
Hispanics 0.069** 0.420** 0.313** 0.446
Asians 0.119* 0.308** 0.426**
* statistically significant at a 95% confidence level** statistically significant at a 99% confidence levelSource: NNIP Cross-Site Caseload Database
In Atlanta and Denver, where data on welfare recipients were assembled for themetropolitan region as a whole, differences in locational patterns by race and ethnicity are fargreater at the metropolitan scale than within the central city. As discussed earlier, the welfarecaseloads of both regions are considerably more diverse than those of their respective centralcities. And the geographic concentration of African American recipients and the dispersal ofwhites and Hispanics is even more evident. While black recipients are highly concentrated in thecentral city and in higher-poverty suburban areas, white and to some extent Hispanic recipientsare more widely scattered throughout the region. At the regional level, the share of blacks living inhigh-poverty neighborhoods substantiallyexceeds the share of whites and Hispanics. Inthe Atlanta region as a whole, nearly one-third ofAfrican American welfare recipients live in high-poverty areas, compared to less than 5 percentof white recipients and about 10 percent ofHispanics. In metropolitan Denver, 18 percent ofAfrican American recipients live in high-povertyneighbor-hoods, in contrast to only 7 percent ofwhites and 10 percent of Hispanics. Map 3further illustrates the dramatic contrast inresidential location patterns for white, black, andHispanic welfare recipients in the Atlanta andDenver regions.

Exploring Welfare-to-Work Challenges in Five Metropolitan Regions 22
It is important to note that the labor market data presented here do not include in San Francisco or9
Boston, cities which provide significant employment opportunities for residents in Oakland and Providence,respectively.
3. REGIONAL EMPLOYMENT OPPORTUNITIES
Successful welfare-to-work strategies need to respond not only to the character-istics andneeds of the recipient population, but also to the opportunities offered by the metropolitaneconomy. In all five of the metro areas considered here, the vast majority of jobs are nowlocated outside the central city, posing obvious challenges for central city welfare recipients. Moreover, the industrial and occupational mix varies substan-tially across these five regions, withsignificant implications for the availability and location of entry-level or low-skilled jobopportunities.
The Five Study Sites Reflect the Diversity of Metropolitan Economies Nationwide
The labor markets of the five metropolitan areas studied here vary greatly in size andemployment growth. The total size of the regional labor market ranges from 516,000 jobs in theProvidence area to 2.5 million in metropolitan Washington, D.C. Moreover, Providence hasexperienced very little growth during the 1990s, while Atlanta and Denver have growndramatically. Oakland and Washington have experienced more moderate growth rates during thisdecade. Despite these differences, however, unemployment rates are very low in all five metroareas — 4 percent or lower.9
Exhibit 16: Metropolitan Labor Markets
Atlanta Denver Oakland Providence Washington
Total jobs (000) 2,036 1,099 976 516 2,550
% growth (90S98) 33.2% 30.2% 11.0% 3.2% 8.7%
% unemployment 3.6% 3.2% 4.0% 4.0% 3.4%
Source: 1998 Current Employment Survey
The major differences among these five metropolitan areas reflect the impressiveemployment gains enjoyed in the South and Mountain regions of the United States over the last20 years and the relative stagnation of the Northeast. Cities in the South and West have eitherhad fewer job losses or have added jobs — including jobs in industries with lower educationalrequirements (Wilson 1987). Many businesses have moved to regions where overall labor costs

Exploring Welfare-to-Work Challenges in Five Metropolitan Regions 23
are lower and local regulations are less burdensome. Atlanta and Denver have also benefittedfrom their increased importance as airline hubs, which strongly correlate to positive metropolitanemployment growth.
Exhibit 17: Distribution of Metropolitan Jobs by Industry
Atlanta Denver Oakland Providence Washington
Agric & Mining 0.96% 1.9% 1.3% 0.8% 0.9%
Construction 5.3% 5.3% 4.6% 4.0% 4.9%
Manufacturing 12.4% 11.5% 13.0% 23.4% 4.9%
Transp & Communic 9.1% 7.8% 6.3% 3.6% 5.9%
Trade 24.6% 21.1% 24.1% 21.4% 16.2%
FIRE* 7.3% 8.5% 7.3% 5.3% 7.0%
Personal Srvcs 1.7% 1.4% 1.7% 0.2% 1.3%
Business Srvcs 8.4% 8.8% 7.9% 4.3% 9.1%
Health Srvcs 6.2% 7.1% 7.5% 11.5% 6.2%
Educ Srvcs 5.0% 4.6% 6.6% 6.9% 4.9%
Social Srvcs 1.5% 1.8% 2.1% 2.5% 2.0%
Other Srvcs 13.1% 14.5% 14.4% 9.5% 20.1%
Public Admn 4.4% 5.8% 3.3% 5.3% 16.6%
*FIRE is an abbrevation for Finance, Insurance, and Real Estate.Source: NNIP Cross-Site Employment Database
The regional economies of our five study sites also differ with respect to their industrialcomposition, and reflect national — and global — economic trends. The importance ofwholesale/retail trade and the service industries in all five regional labor markets reflects thenationwide shift away from goods-producing industries to service-producing activities. Providence — which had little employment growth over the last eight years — has the largestmanufacturing base, at almost 25 percent of overall employment. In contrast, fewer than 5percent of Washington-area jobs are in manufacturing. Wholesale and retail trade representimportant sources of employment in all five metro areas, amounting to almost one-quarter of thejobs in Atlanta and Oakland. Trade is the largest employment sector in Denver and is the second

Exploring Welfare-to-Work Challenges in Five Metropolitan Regions 24
highest sector in Providence. Washington, as the national capital, reflects a unique sectoralpattern. Public administration accounts for almost 17 percent of all employment, and otherservices — which include hotels, recreation activities, legal services, and management-relatedservices — account for one in five jobs in the region.
Entry-Level Jobs Represent a Small Share of All Employment Opportunities
Because of the differences between metro areas in industry composition, theoccupational mix varies as well. Data on the distribution of jobs by industrial sector were used toestimate the distribution of jobs by occupational category, using a three- step process. First, weconverted four-digit SIC Industry categories into three-digit Census Industrial Classification (CIC)codes using a concordance file that matches each SIC code to the corresponding CIC code. Then we constructed an industry-occupation matrix for each region, using 1990 Census PublicUse Microdata files (PUMS). For each industry category, this matrix reports the percentage ofemployees in each occupational category. Finally, this industry-occupation matrix was applied tothe most current available data on employment by industry category to yield estimated counts ofemployment by occupational category.
The most numerous occupations in all five metropolitan areas are executive andmanagerial positions, professional specialty occupations, and administrative support positions. In the Washington metropolitan area, almost one in four jobs are executive or managerial,consistent with the important role of public administration in the regional economy. Providenceenjoys a much larger share of precision production jobs and operator or laborer jobs, largelybecause manufacturing still plays a larger role in its economy than in other metropolitan regions.As American cities have transformed themselves from industrial centers into knowledge centers,the need for highly educated workers has increased. Thus, the occupational categories with thehighest percentage of jobs tend to be professions requiring higher-level degrees. Evenadministrative support positions require at least a high school diploma and some level of training,especially in computers.

AtlantaDenver
OaklandProvidence
Washington
0.0%
5.0%
10.0%
15.0%
20.0%
Exploring Welfare-to-Work Challenges in Five Metropolitan Regions 25
Exhibit 19: Entry-Level Jobs as a Share ofRegional Employment
Exhibit 18: Distribution of Jobs by Occupation
Atlanta Denver Oakland Providence Washington
Exec & Admn 16.4% 16.9% 18.1% 12.3% 22.3%
Prof Specialty 13.8% 18.2% 17.4% 15.1% 20.5%
Technicians 4.4% 4.9% 0.5% 3.5% 5.4%
Sales 14.7% 12.2% 13.7% 11.6% 9.8%
Admn Supp, Clerical 18.2% 18.2% 16.7% 12.9% 17.9%
Service 10.3% 11.7% 10.2% 13.0% 10.5%
Agricultural 0.9% 0.5% 0.1% 0.8% 0.6%
Prod, Craft & Repair 9.0% 7.7% 9.0% 14.4% 7.0%
Operators, Laborers 12.4% 9.7% 9.6% 13.6% 6.0%
Source: NNIP Cross-Site Employment Database
Building upon our estimates of jobs byoccupational category, we calculated the numberand share of “entry-level” jobs in eachmetropolitan region. These represent jobs forwhich significant numbers of welfare recipientsare most likely to be qualified. The methodologyfor estimating entry-level jobs was developed byLaura Leete and Neil Bania at Case WesternReserve University (Leete and Bania 1999). Theyconstructed a job content index based oneducation, training, and experience requirements,ranked occupations according to this index, andestablished a set of four basic skill categories.Entry-level jobs constitute the lowest category inthis ranking scheme, and include jobs that requireless than a high school diploma, little or noexperience, limited reading and math proficiency, and less than six months of specializedtraining.
Exploring Welfare-to-Work Challenges in Five Metropolitan Regions 26
Entry-level jobs account for fewer than one in five positions in the five metropolitan areasunder consideration here. Providence and Atlanta offer the largest share of entry-levelopportunities, at 17 percent and 16 percent of all jobs, respectively. But the source of entry-leveljobs is dramatically different in these two labor markets. In Providence, manufacturing firmsgenerate significant numbers of entry-level positions in production, craft, and repair occupationsand as operators and laborers. In contrast, entry-level opportunities in the Atlanta region stemprimarily from the large numbers of sales, administrative, and service jobs. In the Washingtonmetropolitan area, where public administration and high-tech service occupations predominate,only 11 percent of jobs are classified as entry-level.
Most Jobs Are Located Outside the Central City
Metropolitan regions throughout the United States have experienced a steady trendtoward suburbanization of both population and employment over the last three decades. Thecentral cities’ declining share of regional jobs reflects three important trends. First, many types ofeconomic activity simply follow population, since individual households are their primarycustomers. Thus, as population grows in the suburbs, the number of suburban grocery stores,dry cleaners, gas stations, schools, and libraries growsas well, inevitably increasing suburbanemployment totals. In addition, many new businesses in urban areas have chosen to locate inthe suburbs, even if they do not serve a primarily residential customer base. And finally, manyestablished employers have left central cities for suburban locations over recent decades, somefollowing the “pull” of residential suburbanization and others responding to perceived “push”factors such as crime, burdensome regulations, high taxes, and ineffective city services.
In all five of our study regions, the majority of employment opportunities are located in thesuburbs. Atlanta accounts for the largest share of its region’s jobs — with almost half of all jobs(45.7 percent) located in the central city. In contrast, the cities of Oakland and Providenceaccount for much smaller shares of employment in their regions — closer to 20 percent. Tosome extent, the share of a region’s jobs that are located in the central city is an artificialindicator, since central city boundaries encompass differing shares of a region’s population andeconomic activity, depending on historical and political factors. In the five metro areas studiedhere, the central city’s share of regional population ranges from a low of 13.9 percent in Atlantato a high of 28.8 percent in Denver. The city’s share of regional employment is consistentlyhigher than its share of regional population. Thus, the central city may offer ample employmentopportunities for central city residents, even though the majority of regional employment is

Total JobsEntry-Level
AtlantaDenver
OaklandProvidence
Washington
0.0%
10.0%
20.0%
30.0%
40.0%
50.0%
Exploring Welfare-to-Work Challenges in Five Metropolitan Regions 27
Analysis for the Washington region indicates that the number of low-skilled jobs located within the10
District of Columbia exceeds the number of low-skilled residents (employed or not) who are living there(Rubin and Turner 1998).
We estimated the location of entry-level jobs based on the location of jobs in the occupational11
categories designated as entry-level. More specifically, data for each region provided counts of jobs byindustry category in each zip code. We then applied the distribution of occupations by industry to thesecounts, yielding estimates of jobs by occupational category in each zip code. Finally, jobs in occupationsdesignated as entry-level were tallied by zip code to yield estimates of entry-level opportunities by zip code.
Exhibit 20: Central City Jobs as a Share ofRegional Employment
located in suburban areas. The ratio between10
central city jobs and population is highest inAtlanta (where the central city counts for anunusually large share of jobs and a small share ofpopulation) and lowest in Denver (where the cityaccounts for a relatively large share of both jobsand population).
The distribution of entry-level jobsbetween central city and suburbs also variesdramatically across metropolitan areas. 11
Although the city of Atlanta accounts for almosthalf of its region’s total jobs, it claims only 15.8percent of entry-level jobs. In contrast, the city ofDenver claims an even larger share of entry-leveljobs (42.8 percent) than total jobs (36.9 percent). In Oakland, Providence, and Washington, the central city’s share of entry-level jobs falls justslightly below its share of all jobs. Of the five sites studied here, the city of Oakland accounts forthe smallest share of its region’s entry-level jobs — only 16.8 percent.
Although the majority of entry-level jobs in all five metro areas are located in the suburbs,the extent of deconcentration varies. For example, half of all entry-level jobs in Atlanta arelocated in tracts with less than 100 entry-level jobs per square mile. This pattern poses majorlogistical challenges for programs designed to link city welfare recipients to suburban jobs. Incontrast, the Washington region has several significant concentrations of employment, bothinside and outside the central city. As a result, almost one in ten of the region’s entry-level jobsare located in tracts with very high concentrations of entry-level opportunities (more than 2,500per square mile), suggesting greater potential to connect central city welfare recipients to these

2,500 +
250 - 2,500
100 - 250
< 100
AtlantaDenver
OaklandProvidence
Washington
0.0%
20.0%
40.0%
60.0%
80.0%
100.0%
Exploring Welfare-to-Work Challenges in Five Metropolitan Regions 28
For more information on the calculation and interpretation of Moran’s I, see Anselin (1992).12
Exhibit 21: Entry-Level Jobs Per Square Milesuburban employment clusters. Entry-levelemployment is also quite highly concentrated in theProvidence region, where three-fifths of all thesejobs are located in tracts with at least 250 jobs persquare mile.
Measures of geographic clustering confirmthat entry-level opportunities are significantly morelikely to be clustered in the Providence,Washington, and Denver regions than in Atlantaor Oakland. As discussed earlier, geographicclustering reflects the extent to which tracts withlarge numbers of entry-level jobs are located closetogether or scattered across the region. Theclustering index reported in Exhibit 22 ranges fromzero to one, where values close to one mean that areas with large numbers of entry- level jobsare contiguous to one another, and low values mean that these areas are more widely scatteredacross the metropolitan area as a whole. Providence exhibits the highest level of entry-level job12
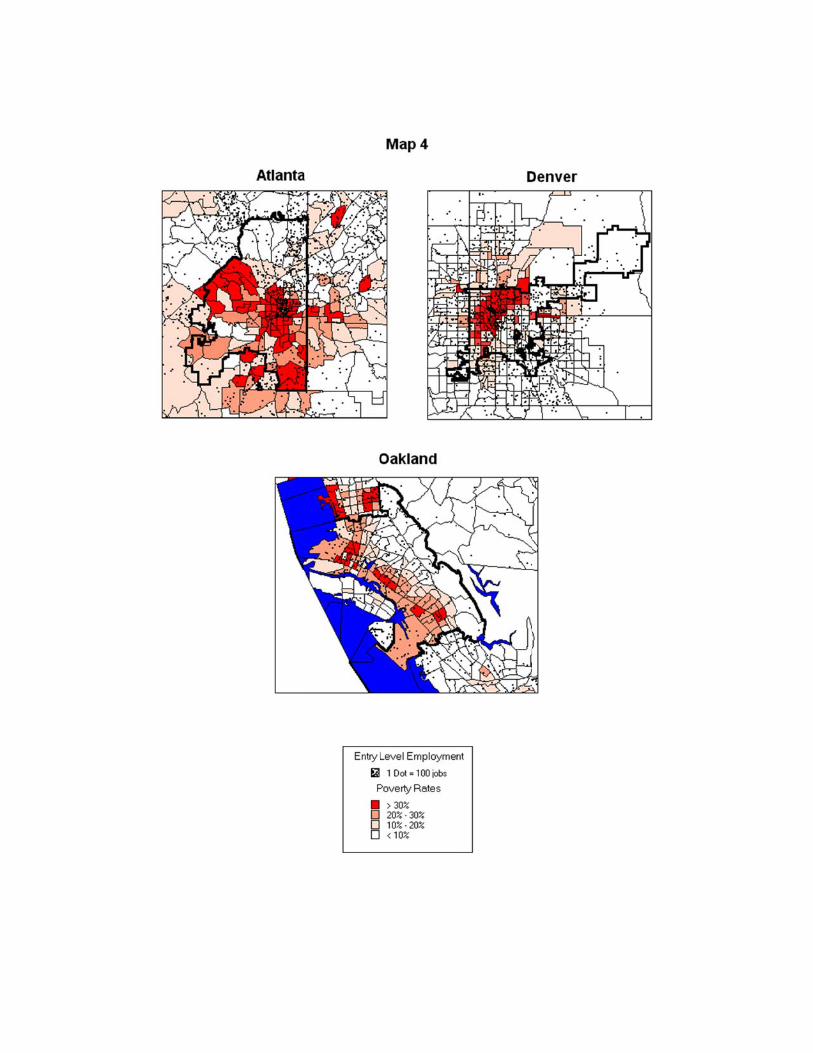
clustering; in fact, entry-level jobs in the Providence region are just as tightly clustered (Moran’s I= 0.210) as are central city welfare recipients (Moran’s I = 0.188). In Washington and Denver,entry-level jobs are substantially less clustered than central city welfare recipients, but severalareas (both within in the central city and in the surrounding suburbs) appear to offer significantconcentrations of employment opportunities. In Atlanta and Oakland, however, there is nostatistically significant clustering of entry-level employment opportunities, despite high levels ofclustering among central city welfare recipients. In these two regions, job opportunities arewidely dispersed across the suburban landscape, creating significant challenges for central cityjobseekers and complicating the design of transportation strategies linking central cityneighborhoods to suburban work sites. Map 4 further illustrates variations across sites in thegeographic dispersal of entry-level employment.
Exhibit 22: Index of Clustering for Entry-Level Employment Opportunities
Atlanta Denver Oakland Providence Washington
Clustering Index 0.029 0.129 0.004 0.210 0.120
Probability 0.220 0.001 0.361 0.001 0.000
Source: NNIP Cross-Site Employment Database

Exploring Welfare-to-Work Challenges in Five Metropolitan Regions 29
4. LINKING CENTRAL CITY WELFARE RECIPIENTS TO ENTRY-LEVEL JOB
OPENINGS
Today, welfare recipients throughout the United States face increasing pressure to findand keep jobs, as the work requirements, time limits, and other sanctions of welfare reform gointo effect. Despite booming economic growth in most parts of the country, the demands ofwelfare reform pose real challenges for many welfare families, who may have limited education,job skills, or work experience. In the early years of welfare reform, central city caseloads havebeen declining less rapidly than suburban and rural caseloads, suggesting that central citywelfare recipients face particularly daunting barriers to getting and keeping jobs (Katz andCarnevale 1998). The suburbanization of entry-level employment opportunities in mostmetropolitan areas certainly contributes to these barriers, although discrimination, poor educationand training, lack of affordable child care, criminal records, drug abuse, and lack of fluency inEnglish are all important factors as well. Thus, initiatives that improve informational andtransportation linkages between central city welfare recipients and entry-level employmentopportunities in the suburbs have an important role to play in regional welfare-to-work strategies. But they should not be viewed as the whole solution to the challenge of helping large numbers ofcentral city families make the transition from welfare to work.
Services and Trade Are the Primary Sources of Entry-Level Job Growth
Over the next decade, significant numbers of new entry-level jobs are expected to becreated in four of the five metropolitan areas studied here — ranging from about 2,800 newpositions annually in the Oakland region to almost 6,000 in the Atlanta region. Providence is theexception, with less than 1 percent annual growth in entry- level jobs (or about 815 new entry-level jobs per year). We estimated the number of new entry-level job openings based on regionalindustry growth estimates from the Commerce Department’s Bureau of Economic Analysis(1995). Each state’s expected growth rate was applied to industry job totals to estimate newopenings by industry. We then used our estimates of skill levels by industry category (discussedin section 3) to forecast the number of new entry-level jobs created annually in each metropolitanregion. It is important to note that these forecasts do not include estimates of expected turnoverin the existing pool of jobs, which represents an important source of job openings. Thus, theseestimates do not reflect the total number of entry-level jobs likely to open up annually. But theydo reflect the net growth in entry-level employment expected for each region.

Exploring Welfare-to-Work Challenges in Five Metropolitan Regions 30
See Lerman, Loprest, and Ratcliffe (1999), who estimate the number of welfare “leavers” for13
selected metro areas under varying assumptions. They find substantial variations in the share of recipientsrequired to leave welfare, due to differences in state welfare reform policies. In some metro areas, theestimated number of recipients required to seek jobs annually is substantially lower than the 15 percentestimate used here, primarily because of caseload declines that have already occurred.
Exhibit 23: Estimated Annual Growth in Entry-Level Employment
Atlanta Denver Oakland Providence Washington
New entry-level jobs 4,107created (metro-wide)
5,964 3,587 2,776 815
Annual % increase inentry-level jobs
1.9 2.2 2.1 0.9 1.5
Central city adultwelfare recipients
20,743 4,174 13,731 7,789 18,573
Est flow of recipientsto job market (15%)
3,111 626 2,060 1,168 2,786
Ratio new cc workersto new metro jobs
0.52 0.17 0.74 1.43 0.68
Source: NNIP Cross-Site Employment Database
The pace of new entry-level job creation varies significantly across sites, relative to thesize of the central city welfare caseload. In the Denver region, the number of new entry-leveljobs created annually is almost as large as the total central city welfare caseload (adults only). Incontrast, Providence’s central city caseload is almost ten times as large as the number of newentry-level jobs expected to be created annually for the region as a whole. If we assume thatapproximately 15 percent of adult recipients enter the labor market annually, then the number of13
new entry-level jobs regionwide exceeds the number of city welfare recipients joining theworkforce everywhere except Providence, where the estimated number of city recipients joiningthe workforce substantially exceeds the number of new entry-level jobs forecast for the region asa whole. Of course, central city welfare recipients are not the only candidates for new jobopenings in a metropolitan labor market. So these ratios should not be interpreted to reflect theshare of welfare recipients who can be absorbed annually. Instead, they represent moreapproximate indicators of the adequacy of entry-level job creation relative to the size of thecentral city welfare population.

Exploring Welfare-to-Work Challenges in Five Metropolitan Regions 31
In the five metropolitan areas studied here, the trade and service sectors constitute themajor sources of new entry-level jobs. As shown in Exhibit 24, manufacturing industries aregenerally not experiencing significant growth and should not be seen as the source of largenumbers of new entry-level employment opportunities. In particular, Providence — which has thelargest existing manufacturing base — is forecast to lose entry-level manufacturing jobs duringthe 1990s. The emergence of flexible manufacturing systems has created a demand fortechnicians, engineers, and programmers who are familiar with the latest computer technology. It has also spawned an increase in temporary help supply services, as firms seek to increasetheir hiring flexibility (OhUallachain 1988).
Exhibit 24: Distribution of New Entry-Level Openings by Industry
Atlanta Denver Oakland Providence Washington
Agric & Mining 4.4% 3.8% 4.4% 3.4% 2.8%
Construction 2.7% 2.3% 5.6% 4.3% 3.8%
Manufacturing 1.9% 4.6% 6.8% -28.4% -1.1%
Transp & Communic 14.8% 10.6% 11.1% 4.3% 5.4%
Trade 34.4% 34.1% 38.8% 53.3% 22.2%
FIRE* 1.4% 2.1% 1.9% 3.4% 2.2%
Personal Srvcs 2.2% 1.6% 2.1% 3.2% 1.8%
Business Srvcs 17.2% 16.5% 9.9% 15.4% 23.6%
Health Srvcs 3.8% 3.4% 2.9% 15.9% 4.6%
Educ Srvcs 3.0% 2.3% 3.1% 6.4% 4.0%
Social Srvcs 0.7% 1.4% 2.0% 1.9% 1.1%
Other Srvcs 13.0% 16.5% 10.8% 19.5% 28.3%
Public Admn 0.5% 0.9% 0.5% 0.7% 1.3%
*FIRE is an abbrevation for Finance, Insurance, and Real Estate.Source: NNIP Cross-Site Employment Database

Existing Jobs
New Jobs
AtlantaDenver
OaklandProvidence
Washington
0.0%
10.0%
20.0%
30.0%
40.0%
50.0%
Exploring Welfare-to-Work Challenges in Five Metropolitan Regions 32
Exhibit 25: Share of New and Existing Entry-LevelJobs Located in the Central City
In contrast to the manufacturing sector, wholesale and retail trade consistently accountsfor a substantial proportion of new entry-level jobs, ranging from 22.2 percent in the Washingtonregion to 38.8 percent in the Oakland area. Business services and other services (which includelegal, entertainment, and repair firms) are also expected to generate significant shares of newentry-level jobs, especially in the Washington metropolitan area, where over half of all new entry-level jobs are forecast for these two sectors. Although firms in these sectors are typically seenas employing highly skilled workers, they also generate jobs for many low-skilled employees. Forexample, medical centers and universities employ physical plant workers, security guards, food-service workers, and cleaning workers. Downtown office complexes employ janitors and repairworkers as well as transportation workers (truck drivers, cab drivers, messengers). Nonprofitand for-profit service enterprises also stimulate other businesses, such as hotels and restaurantsthat employ large numbers of food-service and cleaning service workers (Cohn and Fosset,1996).
The transportation and communication sector constitutes a significant source of entry-level job creation, especially in Atlanta, where it accounts for almost 15 percent of new entry-level positions forecast. This likely reflects Atlanta’s position as an airline hub. Hubsconcentrate airline activities to reduce overall labor costs, thereby increasing the number oflocally based jobs in that industry. And in Providence, which is losing manufacturingemployment, health services emerges as an important source of entry-level job openings,accounting for about 16 percent of expected new positions.
Most Entry-Level Openings Are Far from Central City Welfare Recipients
If the location of new entry-level jobscorresponds to current geographic patterns, mostof the new entry-level jobs being created in thefive metro areas studied here are likely to belocated in the suburbs, not the central city. However, in Atlanta and Oakland, new entry-leveljobs are actually more likely to be located in thecentral city than are existing entry-level jobs. Specifically, 45.0 percent of Atlanta’s new entry-level positions are expected to be located withinthe central city, compared to less than 20 percentof existing entry-level employment. And 22.2percent of new entry-level jobs in the Oaklandmetropolitan area are forecast for the city ofOakland, compared to only about 15 percent of

10 miles +
5 - 10 miles
1 - 5 miles
< 1 mile
AtlantaDenver
OaklandProvidence
Washington
0.0%
20.0%
40.0%
60.0%
80.0%
100.0%
Exploring Welfare-to-Work Challenges in Five Metropolitan Regions 33
We estimated the number of new jobs by zip code by applying rates of job growth by industry to14
current counts of jobs by industry by zip code.
The mean center represents the average x,y coordinates of a welfare recipient in the city.15
We estimated the number of new jobs by zip code by applying rates of job growth by industry to16
current counts of jobs by industry by zip code.
Exhibit 26: Share of New Entry-Level Jobs byDistance from Welfare Recipients
existing positions. This reflects the fact that industry sectors expected to generate significant14
numbers of entry-level positions still have a significant presence in the central city of these metroareas, and reinforces earlier findings that even when the suburbs account for the majority of aregion’s jobs, the central city may represent a substantial (and growing) source for employmentopportunities.
Nevertheless, few new entry-level jobsare being created in close proximity toconcentrations of central city welfare recipients. In fact, with the exception of Providence, mostentry-level job creation is located more than 10miles away from the geographic center of centralcity welfare recipients’ residential locations. Foreach of the metro areas studied here, wedetermined the “mean center” of locations wherecentral city welfare recipients live, and thenestimated the number of new entry-level jobslocated within one mile, five miles, and ten milesof this location. In Atlanta, three-quarters of15
new entry-level jobs are more than 10 miles awayfrom the mean center for city welfare recipients,and in Oakland the share of new entry-level jobsat this distance exceeds 70 percent. Only in Providence, where entry-level job creation isparticularly low, are new entry-level jobs located close to central city welfare populations.
Map 5 further illustrates the locational distribution of entry-level job growth relative to thecentral city welfare population. In all five metropolitan areas, efforts to link central city welfarerecipients to work clearly need to include strategies that help them find out about and commuteto suburban jobs that may be quite far away (as in Oakland) and widely scattered (as in Atlanta). However, these strategies should not overlook potential clusters of entry-level employmentgrowth occurring inside central cities (such as Atlanta and Denver), and they should attempt to16
capitalize on any suburban employment clusters that may exist in the region (as in theWashington suburbs).

Exploring Welfare-to-Work Challenges in Five Metropolitan Regions 34
REFERENCES
Anselin, Luc. SpaceStat Tutorial: A Workbook for Using SpaceStat in the Analysis of SpatialData. National Center for Geographic Information and Analysis, University of California atSanta Barbara. 1992.
Bania, Neil, and Laura Leete. “Geographic Distribution of Job Openings within the Cleveland-Akron, Columbus, and Toledo Metropolitan Areas: Data Sources and Methodology.” InWelfare Reform Impacts on the Public Housing Program: A Preliminary Forecast. U.S.Department of Housing and Urban Development: Washington, D.C. 1998.
Cohn, Samuel, and Mark Fosset. “What Spatial Mismatch? The Proximity of Blacks toEmployment in Boston and Houston,” Social Forces, December 1996, 75(2): 564.
Coulton, Claudia, Nandita Verma, and Shenyang Guo. Time-Limited Welfare and theEmployment Prospects of AFDC Recipients in Cuyahoga County: A Baseline TechnicalReport. Center on Urban Poverty and Social Change, Mandel School of Applied SocialScience, Case Western Reserve University. Cleveland, 1996.
Coulton, Claudia, Laura Leete, and Neil Bania. “Housing, Transportation, and Access toSurburban Jobs by Welfare Recipients in the Cleveland Area.” In Sandra J. Newman(ed.), The Implications of Welfare Reform for Housing, The Urban Institute Press: Washington, D.C. 1999.
Ellen, Ingrid Gould, and Margery Austin Turner. “Does Neighborhood Matter? Assessing RecentEvidence.” Housing Policy Debate. 1997. 8(4):833-866.
Jargowsky, Paul A. Poverty and Place: Ghettos, Barrios, and the American City. New York:Russell Sage Foundation. 1996.
Katz, Bruce, and Kate Carnevale. The State of Welfare Caseloads in America’s Cities. Brookings Institution Center on Urban and Metropolitan Policy: Washington, D.C. 1998.
Kingsley, G. Thomas. Building and Operating Neighborhood Indicator Systems: A Guidebook. The Urban Institute: Washington, D.C. 1999.
Leete, Laura, and Neil Bania. “The Impact of Welfare Reform on Local Labor Markets.” TheJournal of Policy Analysis and Management. 18(1). 1999.
Exploring Welfare-to-Work Challenges in Five Metropolitan Regions 35
Leete, Laura, Neil Bania, and Claudia Coulton. “Welfare Reform: Using Local Labor Market Datafor Policy Analysis and Program Planning.” Workforce Investment Quarterly 5(1). 1998.
Lerman, Robert I., Pamela Loprest, and Caroline Ratcliffe, “How Well Can Urban Labor MarketsAbsorb Welfare Recipients?” in New Federalism: Issues and Options for States, No. A-33, Washington, D.C.: The Urban Institute, June 1999.
Massey, Douglas S., and Nancy A. Denton. American Apartheid: Segregation and the Making ofthe Underclass. Cambridge, MA: Harvard University Press. 1993.
OhUallachain, Brendon. Sectoral Growth Patterns at the Metropolitan Level: An Evaluation ofEconomic Development Incentives, NCI Research, Jan. 1988, 9–10.
Rubin, Mark, and Margery Austin Turner. The Geography of Low-Skilled Work and Workers inthe Washington Metropolitan Region. Washington, D.C.: The Urban Institute. 1998.
Wilson, William Julius. The Truly Disadvantaged: The Inner City, The Underclass, and PublicPolicy, The University of Chicago Press (Chicago), 1987.
U.S. Department of Commerce, Bureau of Economic Analysis. Regional Accounts Data: StateProjections, Projections of Employment, Income, and Gross State Product, 1969–2045.Washington, D.C., July 1995.