Embed Size (px)
Citation preview
sustainability
Article
Exploring Walking Behavior in the Streets of NewYork City Using Hourly Pedestrian Count Data
Jae Min Lee
School of Architecture, University of Ulsan, Ulsan 44610, Korea; [email protected]
Received: 16 July 2020; Accepted: 19 September 2020; Published: 23 September 2020�����������������
Abstract: This paper explores hourly automated pedestrian count data of seven locations in New YorkCity to understand pedestrian walking patterns in cities. Due to practical limitations, such patternshave been studied conceptually; few researchers have explored walking as a continuous, long-termactivity. Adopting an automated pedestrian counting method, we documented and observed peoplewalking on city streets and found that unique pedestrian traffic patterns reflect land use, developmentintensity, and neighborhood characteristics. We observed a threshold of thermal comfort in outdooractivities. People tend to seek shade and avoid solar radiation stronger than 1248 Wh/m2 at an averageair temperature of 25 ◦C. Automated collection of detailed pedestrian count data provides a newopportunity for urban designers and transportation planners to understand how people walk and toimprove our cities to be less dependent on the automobile.
Keywords: walking; automated pedestrian counting; urban design; thermal comfort
1. Introduction
Walking is receiving belated attention across the urban planning disciplines such as in public health,transportation, real estate, and urban design. Researchers have found that promoting walking andbuilding walkable communities have significant effects on healthy living, energy savings, and enjoyingthe urban lifestyle [1–5]. Based on these studies, walking seems to be an essential element in creatinga sustainable society.
There are many aspects related to walking. In transportation terms, walking is a trip from pointA to B, as well as a choice of one transport mode among many alternatives. Walking can be classifiedas either essential trips for commuting or optional trips for recreational activities. The purpose andintensity of walking are heavily influenced by weather, microclimate, sense of safety, and physicalenvironment. Thus, in urban design, walking is concerned with favorable environments, either shadedor sunlit, consisting of clean, pleasant, safe, and human-scaled pathways and sidewalks.
Many studies have dealt with walking in terms of volume of traffic [6,7], rational choice [8–10],irrational random behavior [11,12], reaction to visual cues [13], and as one of many social activities.These studies explored walking by conducting computer simulations [14,15], predicting behavior frommathematical regression [16,17], and observing and counting activities in a limited and controlledenvironment and timeframe [18–20]. However, few have explored walking as an omnipresent activity.
Adopting an automated pedestrian counting algorithm provided by Placemeter, we documentedand observed pedestrian patterns on city streets. We recorded hourly pedestrian traffic at sevenlocations in New York City over six months to explore the collective walking patterns and reactionsto change in the physical environment. This information will provide insights on walking for urbandesigners and transportation planners to improve predominantly automobile-dependent cities andlifestyles. This is an exploratory research to investigate pedestrian behavior in streets with therelationship to the thermal environment using automated pedestrian count.
Sustainability 2020, 12, 7863; doi:10.3390/su12197863 www.mdpi.com/journal/sustainability
Sustainability 2020, 12, 7863 2 of 16
2. Literature Review
At the junction of public health, transportation planning, urban design, and urban planning,walking has been studied extensively to elucidate the behavior of pedestrian-related trips and indifferent physical environments. Transportation scholars regard walking as one of many modes of travel;thus, their mathematical estimations stem from land use and development density. Others emphasizethe importance of the walking environment itself. Providing a decent walking environment andproximity to everyday destinations can attract more people to walk. Since walking is a form of physicalactivity, public health scholars have argued that providing a walkable environment leads to a healthiersociety overall. Environmental scientists and urban designers have paid attention to the physicalconditions of the street, the weather and thermal comfort, and the setting of street features. In thissection, we will survey previous studies on walking and explore the research gaps in the literature.
2.1. Land Use and Transportation
In the transportation planning literature, walking is highly associated with land use and density.Each type of land use (residential, office, retail) has a unique travel demand. Development density istranslated into number of occupants and intensity of travel. Thus, combining land use and density,planners can predict the frequency of walking, similar to the choice of motorized travel [21]. Cerveroand Kockelmann [22] added diversity of land use and design to density (the so-called 3Ds). Diversityrefers to mixed use in a given block or district; also, the level of land use mix at the neighborhood leveland the configuration of the street are closely related to pedestrian walking patterns. The distancebetween two destinations helps determine the mode of travel. A trip to a convenience store inone’s neighborhood is usually made by walking or biking, while an out-of-neighborhood trip istraveled by vehicle [23,24]. Although design often refers to the quality of a space, including aestheticcharacteristics, Cervero and Kockelmann referred to design as the configuration and connectivity ofstreets. The intensity of street crossings and intersections, sidewalk widths and relative proportions,and street fixtures such as lighting and plantings are related to intensity of walking. The larger andwell-managed parks attract more people and invite people to walk further [25].
Lee and Moudon [26] refined the model by identifying specific parameters for public policies andprogram implementation. They argued that the distance measurements to routine daily destinations,or the 3D + R, are effective alternatives to Cervero and Kockelmann’s 3Ds. Lee and Moudon foundthat Seattle’s King County residents tend to walk more if their neighborhoods include everyday retaildestinations such as groceries, markets, banks, eating/drinking establishments, and schools (firstD = Destinations). The proximity from homes to neighborhood destinations is positively associatedwith walking (second D = Distance), and higher residential density (third D = Density) is stronglyassociated with increased walking.
Ewing and Cervero [27] and Ewing et al. [28] developed the D variables further, as density, diversity,design, destination accessibility, distance to transit, and demographics. Demand management ofparking space through control of supply and cost also influences the intensity of walking. The highprice and/or lack of parking space in the central business district (CBD) deters people from drivinginto the city center, leading them to use alternative modes of transport: the transit system, walking,or biking.
Walk Scores, a recently developed internet-based platform that rates walkability, is an exampleof evaluating the potential use of walking based on the distance to nearby neighborhood amenities.The rating system has a scale system of 0 to 100 based on the distance to nearby neighborhoodamenities such grocery stores, cafés, eating/drinking establishments, theaters, schools, and retail shops.Researchers have validated the reliability of the Walk Score [29]. In Providence, Rhode Island, and fourother US metropolitan areas, these researchers concluded that the Walk Score is a valid and reliablemeasure of access to walkable amenities.
Sustainability 2020, 12, 7863 3 of 16
2.2. Urban Design and Microclimate
Precipitation, sunlight, and air temperature have the largest effect on walking. As the airtemperature increases, more pedestrian activities are observed, and it has a direct impact on walkingtempo [30]. Li [31] observed that casual activities declined when the air temperature fell to 4 ◦C,the threshold of pedestrian activity. Researchers have found that thermal comfort in streets and plazasaffected how people use these public open spaces—walking, sitting, and shade-seeking. At 4 ◦C to 20 ◦C,people prefer to be in the sun; only at around 20 ◦C is there an equal distribution of individuals sitting inthe shade and in the sun, implying people find them equally comfortable [32]. Behaviors within publicspaces that can be related to perceived temperature—standing, sitting, and shade-seeking—followedthe same patterns in both New York City and San Francisco, with a threshold temperature of 23 ◦C forshade-seeking [33].
Montigny and Zacharias [4] found that a 5 ◦C increase in temperature was associated with a 14%increase in pedestrians. A shift from snow to dry conditions was associated with a pedestrian increaseof 23%, and a 5% increase in sunlit area was associated with a 2% increase. Using an automated hourlypedestrian counting device suggested that season and weather have an effect on pedestrian volume indowntown Montpelier, Vermont. Precipitation reduces the average hourly volume by approximately13%, and the winter weather reduces it by 16%. At best, a combination of weather variables accountsfor 30% of the variance in hourly volumes [34].
Microclimate also has been identified as an important element in public spaces [5,35–39].Microclimates in the urban environment play a critical role in maintaining urban vitality andencouraging the frequent use of outdoor public spaces for desired outdoor activities by extendingthe days of comfortable temperatures. Understanding the dynamics between built form and thermalcomfort, or the human reaction to the thermal environment, is important for urban designers.Microclimate factors, including sunlight, shade, air temperature, wind speed, humidity, and skycondition, can contribute to the use of outdoor space [25,30,40–43].
The public is always interested in the thermal comfort of public spaces, and appropriate urbandesign can actually improve microclimates and encourage more walking in streets, plazas, and parks.In Norway, for example, designs for favorable microclimate conditions were implemented, i.e.,protection from cold wind, solar exposure, and avoiding overshadowing, which resulted in extendingthe outdoor season for up to six weeks into the spring and fall [44]. The residents of San Franciscoare also eager to maintain microclimatic quality in open spaces, wanting protection from the windsor overshadowing caused by nearby new developments [45]. As a result, in 1985, the city of SanFrancisco established a set of design requirements to control the effects of all new buildings on thelocal microclimates of public spaces [46]. In a more recent example, in 2014, residents of New YorkCity began campaigning for a moratorium on new buildings immediately to the south of CentralPark. The Nordstrom Tower, 225 West 57th Street, a condo tower that rises to a height of 1770 feet,was casting a shadow over the playground and ball field [47]. However, in that instance, residentsfailed to retain their right to be sunlit in the park [48].
For microclimates in urban public spaces, design can improve existing conditions either at theearliest stage or later by design interventions. When the urban texture is extant, alterations to improvethe microclimate are possible at the scale of the urban block, provided it is acknowledged that the publicdomain is not to be ignored. Vegetation used for shading and windbreaks, movable canvas awnings,and canopies made of various materials such as reeds, bamboo, or vines can provide effective shadingwhile preserving the main architectural features of the street. Furthermore, proprietors of commercialactivities are normally the first to realize the potential of such cool oases in a hot environment [44].
2.3. Need for Research
Studies have identified several factors affecting the volume of pedestrian traffic. Walking is onechoice among many transport modes; land use and density are the major contributors to the totalpedestrian volume. We can categorize walking into two types based on purpose: essential trips for
Sustainability 2020, 12, 7863 4 of 16
work commuting and optional trips for recreational activities. Unlike the essential trips, the optionalor recreational trips are more affected by the physical environment, including weather, microclimate,sense of safety, and configuration of streets and features.
Although walking is a conjunction of complicated dynamics, most studies have explored walkingas isolated events related to a specific subject. Many studies have dealt with walking in terms ofvolume of traffic, rational choice, irrational random behavior, reaction to a visual cue, and one of manysocial activities. These studies explored walking by conducting computer simulations, predictingbehavior from mathematical regression, and observing and counting activities in a limited andcontrolled environment and timeframe. However, walking as an activity in the real world is not clearlyreproducible in a lab environment or in a computer simulation. The raw walking dataset containsmuch noise, and it is difficult to understand pedestrian behavior at a micro-level. Few researchers haveexplored walking as a whole or as an omnipresent activity taking place. Too much conceptualizationcan make it difficult to identify the complex mechanisms of walking. In this study, we use an automatedpedestrian counting algorithm to explore pedestrian patterns on city streets.
3. Materials and Methods
3.1. Data
The primary data sources for this study were pedestrian count and relative speed data capturedby Placemeter [49], weather data from Central Park weather station (KNYC) and other private weatherstations in New York City [50], and sunlight and wind simulation results from massing models of thecorresponding locations.
Placemeter is a New York City-based information technology consulting company that harvestspedestrian count data using computer vision technology. Placemeter produces video feeds fromstreets and creates automated reports tracking the number of pedestrians. Aside from the 0.1 percentof its videos that are saved for quality assurance, the company says the videos are discarded afterbeing processed and converted into reports for customers [34]. For privacy concerns, Placemeter usescomputer vision algorithms to analyze video for volume, speed, and trajectories of pedestrian andvehicular traffic in cities, rather than identifying specific individuals [49].
The hourly pedestrian count data provided by Placemeter were used to measure walking patternsin detail. The data were collected from seven locations on New York City sidewalks. Three of themwere located within one block of one another and represented locations on both sides of the street, i.e.,the west and east sidewalks. The “matched sidewalk” is pertinent to test the effect of the microclimatebecause opposite sides of buildings create distinctly different hourly microclimate conditions. Mostbuilt environments are very controlled except for sidewalk characteristics, e.g., number of entrances,transparency in retail frontage, and sidewalk width.
Weather conditions, precipitation, and air temperature are known to have effects on walking [29,34].Here, the weather information was collected from Weather Underground, a private, web-based weatherstation interface that compiles weather data from automated personal weather stations (PWSs).These PWSs provide hourly and sub-hourly reports, including air temperature, dew point, relativehumidity, wind speed, gust speed, wind direction, air pressure, and solar radiation energy [49].
3.2. Climate Classification of New York City
New York City is a humid subtropical climate under Köppen climate classification. The daytimeaverage high is 28.1 ◦C in August whereas the average low is −2.5 ◦C in January [49,51]. Winters arechilly and damp due to sea breezes from the Atlantic Ocean. The city is also the quintessential exampleof an urban heat island effect. Summer night temperatures are higher than the surrounding region dueto the densely built urban area.
Sustainability 2020, 12, 7863 5 of 16
3.3. Monitored Streets
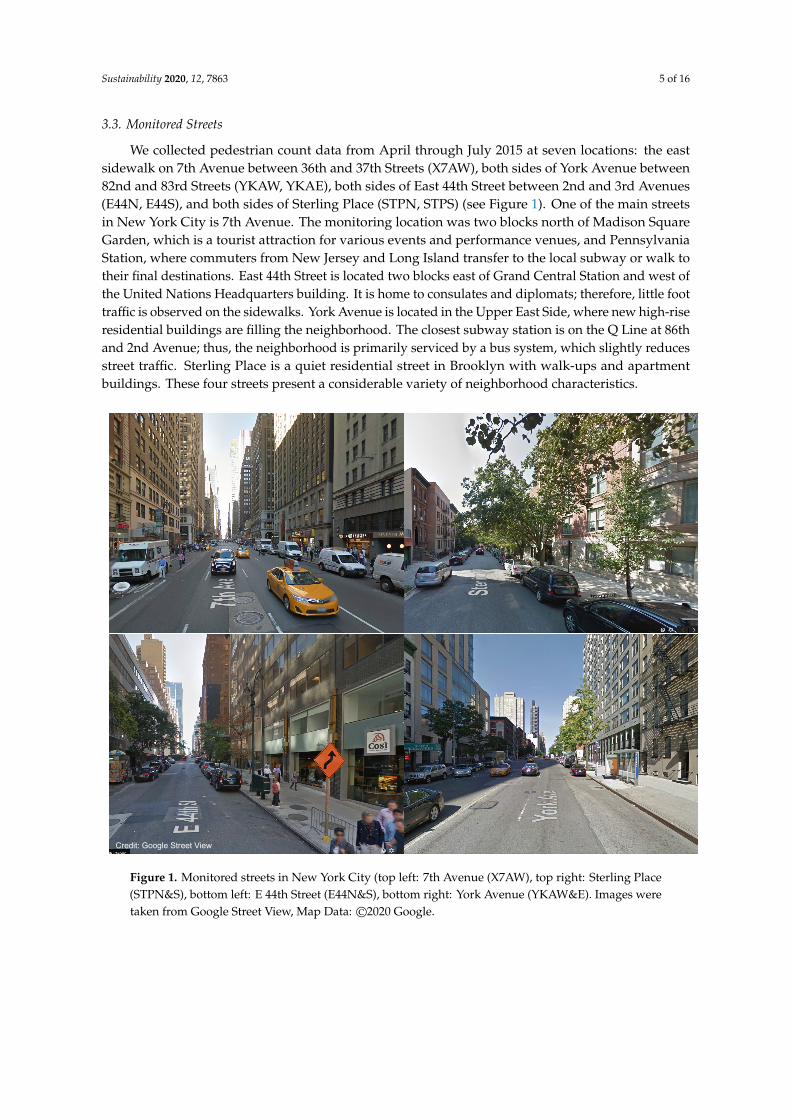
We collected pedestrian count data from April through July 2015 at seven locations: the eastsidewalk on 7th Avenue between 36th and 37th Streets (X7AW), both sides of York Avenue between82nd and 83rd Streets (YKAW, YKAE), both sides of East 44th Street between 2nd and 3rd Avenues(E44N, E44S), and both sides of Sterling Place (STPN, STPS) (see Figure 1). One of the main streetsin New York City is 7th Avenue. The monitoring location was two blocks north of Madison SquareGarden, which is a tourist attraction for various events and performance venues, and PennsylvaniaStation, where commuters from New Jersey and Long Island transfer to the local subway or walk totheir final destinations. East 44th Street is located two blocks east of Grand Central Station and west ofthe United Nations Headquarters building. It is home to consulates and diplomats; therefore, little foottraffic is observed on the sidewalks. York Avenue is located in the Upper East Side, where new high-riseresidential buildings are filling the neighborhood. The closest subway station is on the Q Line at 86thand 2nd Avenue; thus, the neighborhood is primarily serviced by a bus system, which slightly reducesstreet traffic. Sterling Place is a quiet residential street in Brooklyn with walk-ups and apartmentbuildings. These four streets present a considerable variety of neighborhood characteristics.
Sustainability 2020, 12, x FOR PEER REVIEW 5 of 16
82nd and 83rd Streets (YKAW, YKAE), both sides of East 44th Street between 2nd and 3rd Avenues (E44N, E44S), and both sides of Sterling Place (STPN, STPS) (see Figure 1). One of the main streets in New York City is 7th Avenue. The monitoring location was two blocks north of Madison Square Garden, which is a tourist attraction for various events and performance venues, and Pennsylvania Station, where commuters from New Jersey and Long Island transfer to the local subway or walk to their final destinations. East 44th Street is located two blocks east of Grand Central Station and west of the United Nations Headquarters building. It is home to consulates and diplomats; therefore, little foot traffic is observed on the sidewalks. York Avenue is located in the Upper East Side, where new high-rise residential buildings are filling the neighborhood. The closest subway station is on the Q Line at 86th and 2nd Avenue; thus, the neighborhood is primarily serviced by a bus system, which slightly reduces street traffic. Sterling Place is a quiet residential street in Brooklyn with walk-ups and apartment buildings. These four streets present a considerable variety of neighborhood characteristics.
Figure 1. Monitored streets in New York City (top left: 7th Avenue (X7AW), top right: Sterling Place (STPN&S), bottom left: E 44th Street (E44N&S), bottom right: York Avenue (YKAW&E). Images were taken from Google Street View, Map Data: ©2020 Google.
4. Results
4.1. Development Intensity, Land Use, and Pedestrian Count
The patterns from automated pedestrian counts reflect the characteristics of the observed street. As seen in Figure 2, the total number of pedestrians passing the seven locations ranged from 20,000 to more than 50,000. Starting in June, the number of people walking on these sidewalks increased, especially at 7th Avenue, whereas the other streets maintained similar traffic. The difference can be explained by the nature of the streets as 7th Avenue is frequently visited by tourists, while the others are residential streets or high-density residential neighborhoods that do not attract tourist traffic. As
Credit: Google Street View
Figure 1. Monitored streets in New York City (top left: 7th Avenue (X7AW), top right: Sterling Place(STPN&S), bottom left: E 44th Street (E44N&S), bottom right: York Avenue (YKAW&E). Images weretaken from Google Street View, Map Data: ©2020 Google.
Sustainability 2020, 12, 7863 6 of 16
4. Results
4.1. Development Intensity, Land Use, and Pedestrian Count
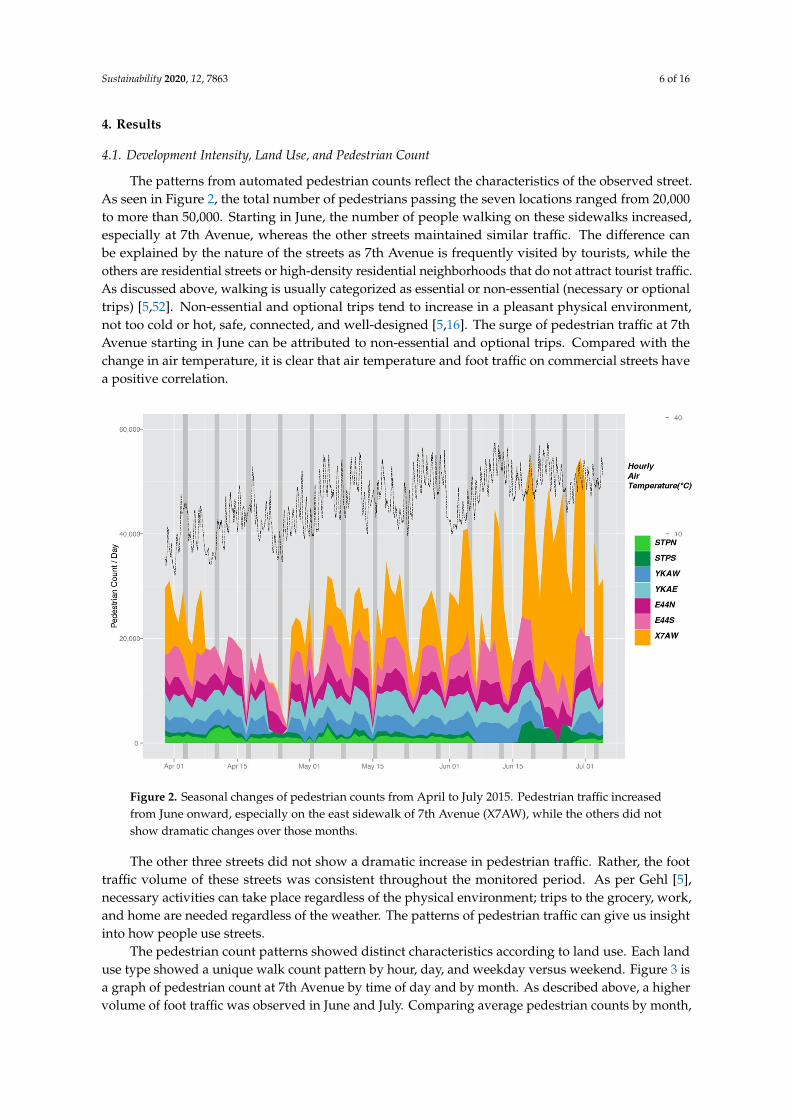
The patterns from automated pedestrian counts reflect the characteristics of the observed street.As seen in Figure 2, the total number of pedestrians passing the seven locations ranged from 20,000to more than 50,000. Starting in June, the number of people walking on these sidewalks increased,especially at 7th Avenue, whereas the other streets maintained similar traffic. The difference canbe explained by the nature of the streets as 7th Avenue is frequently visited by tourists, while theothers are residential streets or high-density residential neighborhoods that do not attract tourist traffic.As discussed above, walking is usually categorized as essential or non-essential (necessary or optionaltrips) [5,52]. Non-essential and optional trips tend to increase in a pleasant physical environment,not too cold or hot, safe, connected, and well-designed [5,16]. The surge of pedestrian traffic at 7thAvenue starting in June can be attributed to non-essential and optional trips. Compared with thechange in air temperature, it is clear that air temperature and foot traffic on commercial streets havea positive correlation.Sustainability 2020, 12, x FOR PEER REVIEW 7 of 16
Figure 2. Seasonal changes of pedestrian counts from April to July 2015. Pedestrian traffic increased from June onward, especially on the east sidewalk of 7th Avenue (X7AW), while the others did not show dramatic changes over those months.
Figure 3. Pedestrian counts by hour at 7th Avenue (Midtown CBD, FAR 12.5, office 69%, retail 11%, residential 5%). A higher volume of traffic was observed in June and July. Comparing the June/July and April/May average lines, the sidewalk was as busy in the evening as at lunch time (single observation and average lines).
Figure 2. Seasonal changes of pedestrian counts from April to July 2015. Pedestrian traffic increasedfrom June onward, especially on the east sidewalk of 7th Avenue (X7AW), while the others did notshow dramatic changes over those months.
The other three streets did not show a dramatic increase in pedestrian traffic. Rather, the foottraffic volume of these streets was consistent throughout the monitored period. As per Gehl [5],necessary activities can take place regardless of the physical environment; trips to the grocery, work,and home are needed regardless of the weather. The patterns of pedestrian traffic can give us insightinto how people use streets.
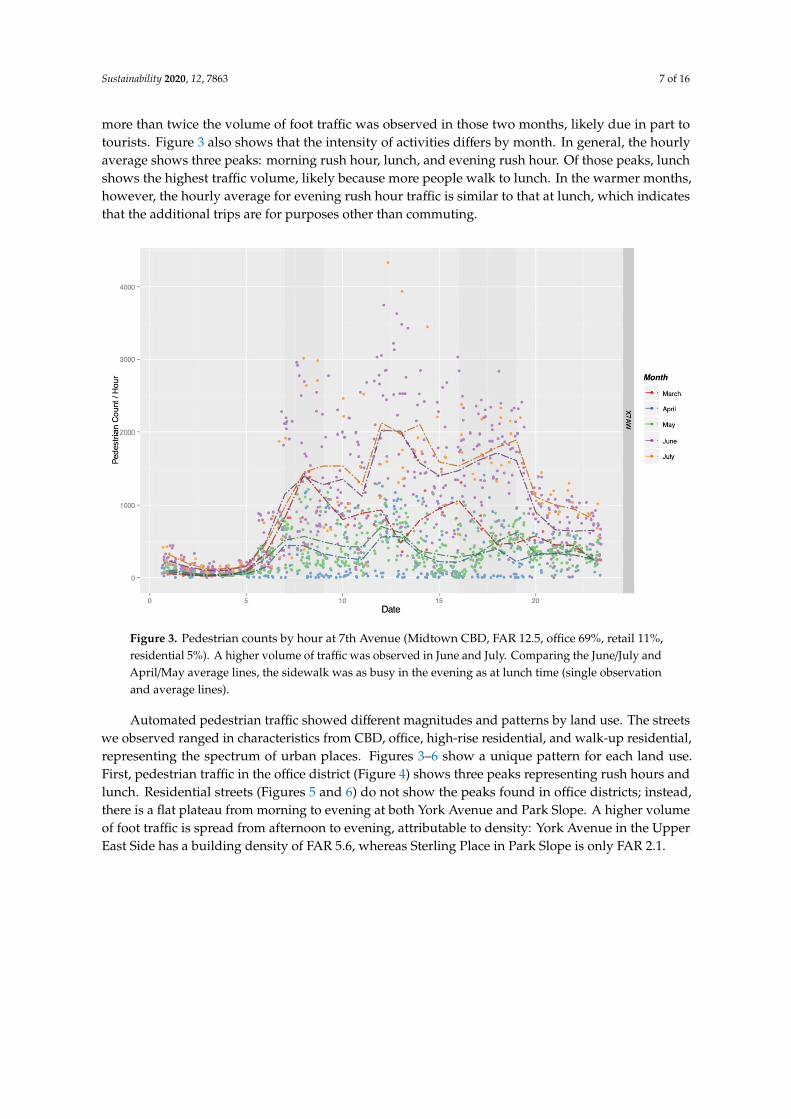
The pedestrian count patterns showed distinct characteristics according to land use. Each landuse type showed a unique walk count pattern by hour, day, and weekday versus weekend. Figure 3 isa graph of pedestrian count at 7th Avenue by time of day and by month. As described above, a highervolume of foot traffic was observed in June and July. Comparing average pedestrian counts by month,
Sustainability 2020, 12, 7863 7 of 16
more than twice the volume of foot traffic was observed in those two months, likely due in part totourists. Figure 3 also shows that the intensity of activities differs by month. In general, the hourlyaverage shows three peaks: morning rush hour, lunch, and evening rush hour. Of those peaks, lunchshows the highest traffic volume, likely because more people walk to lunch. In the warmer months,however, the hourly average for evening rush hour traffic is similar to that at lunch, which indicatesthat the additional trips are for purposes other than commuting.
Sustainability 2020, 12, x FOR PEER REVIEW 7 of 16
Figure 2. Seasonal changes of pedestrian counts from April to July 2015. Pedestrian traffic increased from June onward, especially on the east sidewalk of 7th Avenue (X7AW), while the others did not show dramatic changes over those months.
Figure 3. Pedestrian counts by hour at 7th Avenue (Midtown CBD, FAR 12.5, office 69%, retail 11%, residential 5%). A higher volume of traffic was observed in June and July. Comparing the June/July and April/May average lines, the sidewalk was as busy in the evening as at lunch time (single observation and average lines).
Figure 3. Pedestrian counts by hour at 7th Avenue (Midtown CBD, FAR 12.5, office 69%, retail 11%,residential 5%). A higher volume of traffic was observed in June and July. Comparing the June/July andApril/May average lines, the sidewalk was as busy in the evening as at lunch time (single observationand average lines).
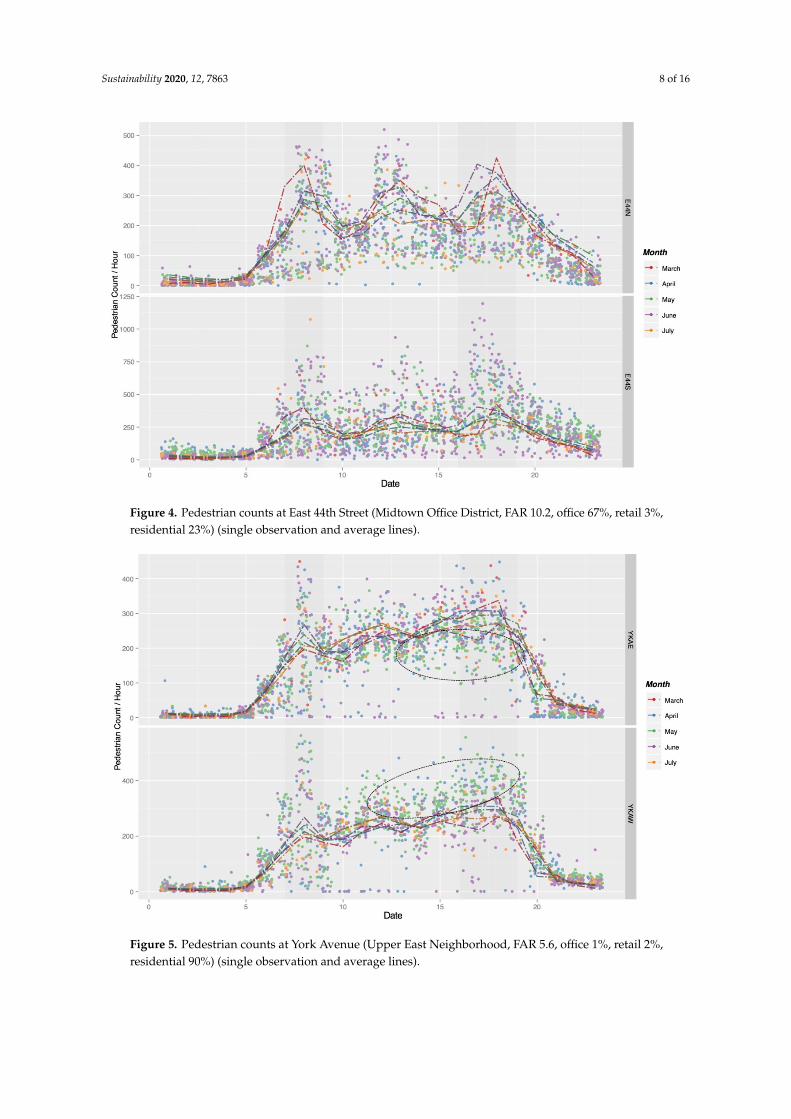
Automated pedestrian traffic showed different magnitudes and patterns by land use. The streetswe observed ranged in characteristics from CBD, office, high-rise residential, and walk-up residential,representing the spectrum of urban places. Figures 3–6 show a unique pattern for each land use.First, pedestrian traffic in the office district (Figure 4) shows three peaks representing rush hours andlunch. Residential streets (Figures 5 and 6) do not show the peaks found in office districts; instead,there is a flat plateau from morning to evening at both York Avenue and Park Slope. A higher volumeof foot traffic is spread from afternoon to evening, attributable to density: York Avenue in the UpperEast Side has a building density of FAR 5.6, whereas Sterling Place in Park Slope is only FAR 2.1.
Sustainability 2020, 12, 7863 8 of 16
Sustainability 2020, 12, x FOR PEER REVIEW 8 of 16
Figure 4. Pedestrian counts at East 44th Street (Midtown Office District, FAR 10.2, office 67%, retail 3%, residential 23%) (single observation and average lines).
Figure 5. Pedestrian counts at York Avenue (Upper East Neighborhood, FAR 5.6, office 1%, retail 2%, residential 90%) (single observation and average lines).
Figure 4. Pedestrian counts at East 44th Street (Midtown Office District, FAR 10.2, office 67%, retail 3%,residential 23%) (single observation and average lines).
Sustainability 2020, 12, x FOR PEER REVIEW 8 of 16
Figure 4. Pedestrian counts at East 44th Street (Midtown Office District, FAR 10.2, office 67%, retail 3%, residential 23%) (single observation and average lines).
Figure 5. Pedestrian counts at York Avenue (Upper East Neighborhood, FAR 5.6, office 1%, retail 2%, residential 90%) (single observation and average lines).
Figure 5. Pedestrian counts at York Avenue (Upper East Neighborhood, FAR 5.6, office 1%, retail 2%,residential 90%) (single observation and average lines).
Sustainability 2020, 12, 7863 9 of 16
Sustainability 2020, 12, x FOR PEER REVIEW 9 of 16
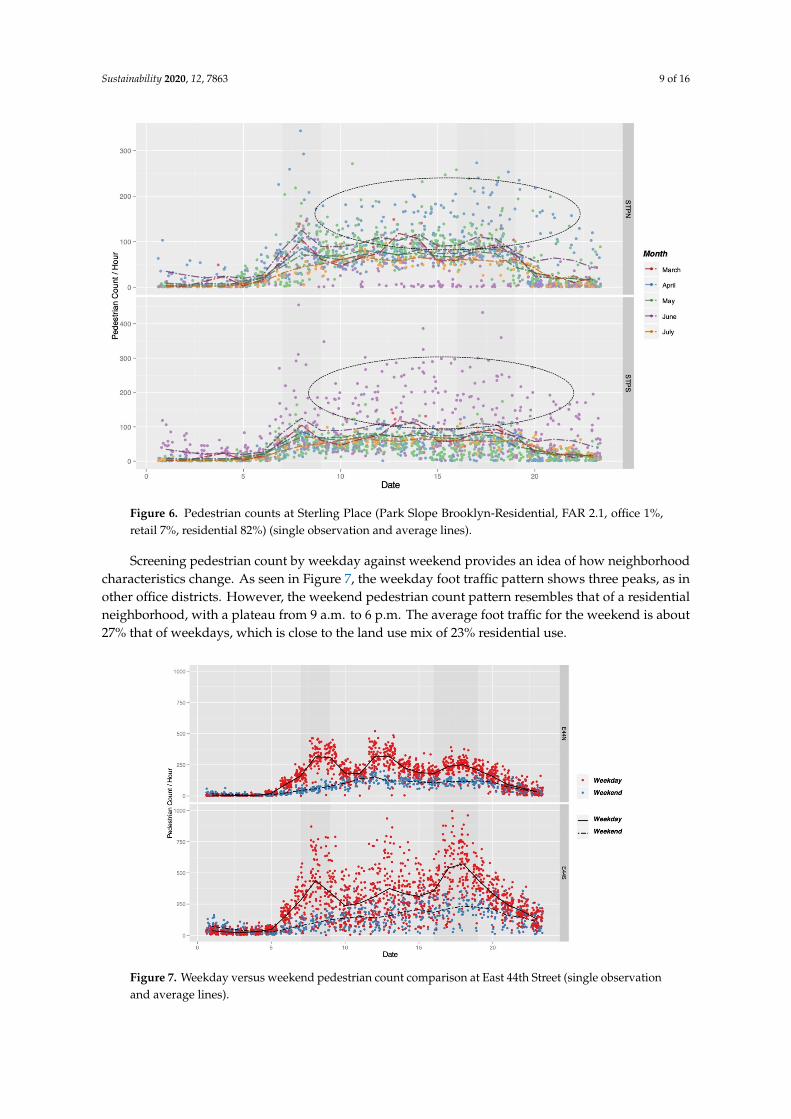
Figure 6. Pedestrian counts at Sterling Place (Park Slope Brooklyn-Residential, FAR 2.1, office 1%, retail 7%, residential 82%) (single observation and average lines).
Figure 7. Weekday versus weekend pedestrian count comparison at East 44th Street (single observation and average lines).
4.2. Outdoor Thermal Comfort and Pedestrian Count
A positive correlation between outdoor thermal comfort and pedestrian traffic has been widely established in urban design [5,16,38,39,53]. More people tend to walk outside for non-essential,
Figure 6. Pedestrian counts at Sterling Place (Park Slope Brooklyn-Residential, FAR 2.1, office 1%,retail 7%, residential 82%) (single observation and average lines).
Screening pedestrian count by weekday against weekend provides an idea of how neighborhoodcharacteristics change. As seen in Figure 7, the weekday foot traffic pattern shows three peaks, as inother office districts. However, the weekend pedestrian count pattern resembles that of a residentialneighborhood, with a plateau from 9 a.m. to 6 p.m. The average foot traffic for the weekend is about27% that of weekdays, which is close to the land use mix of 23% residential use.
Sustainability 2020, 12, x FOR PEER REVIEW 9 of 16
Figure 6. Pedestrian counts at Sterling Place (Park Slope Brooklyn-Residential, FAR 2.1, office 1%, retail 7%, residential 82%) (single observation and average lines).
Figure 7. Weekday versus weekend pedestrian count comparison at East 44th Street (single observation and average lines).
4.2. Outdoor Thermal Comfort and Pedestrian Count
A positive correlation between outdoor thermal comfort and pedestrian traffic has been widely established in urban design [5,16,38,39,53]. More people tend to walk outside for non-essential,
Figure 7. Weekday versus weekend pedestrian count comparison at East 44th Street (single observationand average lines).
Sustainability 2020, 12, 7863 10 of 16
As discussed above, urban planners and designers can study pedestrian patterns on city streets byexamining detailed pedestrian counts. Magnitude of foot traffic volume and distinct patterns of hourlycount data are associated with land use and development density. Exploring the automated pedestriancount can have many benefits, and future research needs to examine the correlation between count dataand land use intensity in a cross-sectional manner to estimate and predict foot traffic in city streets.
4.2. Outdoor Thermal Comfort and Pedestrian Count
A positive correlation between outdoor thermal comfort and pedestrian traffic has been widelyestablished in urban design [5,16,38,39,53]. More people tend to walk outside for non-essential,optional, social, or recreational purposes on warmer days. This is a general pattern that can be observedregardless of location.
Detailed pedestrian counts indicate a threshold that changes people’s walking behavior.As highlighted in the dashed circles in Figures 5 and 6, pedestrians tend to prefer one side ofthe street over the other during certain months. For example, more people walk on the east siderather than the west side of York Avenue in May. Green dots appear below the average of the eastsidewalk, while those of the west sidewalk are above the average. This seasonal difference is clearer atSterling Place. In April and May, more blue and green dots appear above the average on the northsidewalk. On the contrary, purple dots (June) are above the average pedestrian traffic on the southedge of the street.
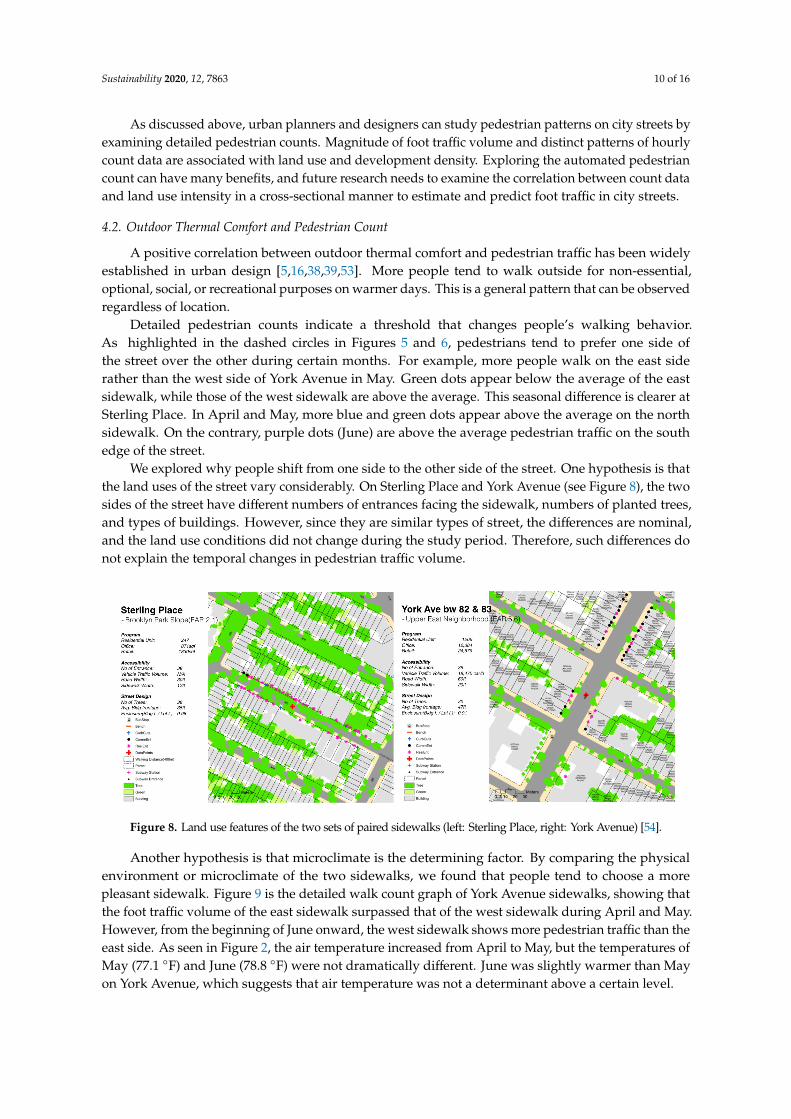
We explored why people shift from one side to the other side of the street. One hypothesis is thatthe land uses of the street vary considerably. On Sterling Place and York Avenue (see Figure 8), the twosides of the street have different numbers of entrances facing the sidewalk, numbers of planted trees,and types of buildings. However, since they are similar types of street, the differences are nominal,and the land use conditions did not change during the study period. Therefore, such differences donot explain the temporal changes in pedestrian traffic volume.
Sustainability 2020, 12, x FOR PEER REVIEW 10 of 16
optional, social, or recreational purposes on warmer days. This is a general pattern that can be observed regardless of location.
Detailed pedestrian counts indicate a threshold that changes people’s walking behavior. As highlighted in the dashed circles in Figures 5 and 6, pedestrians tend to prefer one side of the street over the other during certain months. For example, more people walk on the east side rather than the west side of York Avenue in May. Green dots appear below the average of the east sidewalk, while those of the west sidewalk are above the average. This seasonal difference is clearer at Sterling Place. In April and May, more blue and green dots appear above the average on the north sidewalk. On the contrary, purple dots (June) are above the average pedestrian traffic on the south edge of the street.
We explored why people shift from one side to the other side of the street. One hypothesis is that the land uses of the street vary considerably. On Sterling Place and York Avenue (see Figure 8), the two sides of the street have different numbers of entrances facing the sidewalk, numbers of planted trees, and types of buildings. However, since they are similar types of street, the differences are nominal, and the land use conditions did not change during the study period. Therefore, such differences do not explain the temporal changes in pedestrian traffic volume.
Figure 8. Land use features of the two sets of paired sidewalks (left: Sterling Place, right: York Avenue) [54].
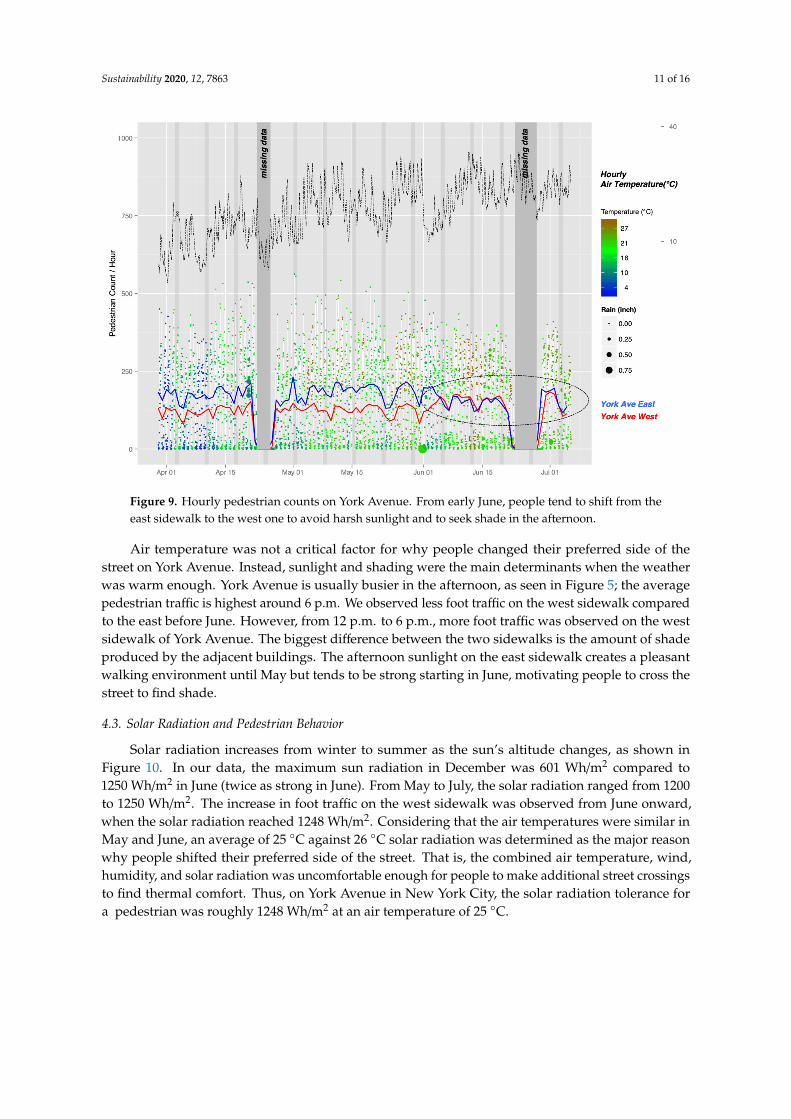
Another hypothesis is that microclimate is the determining factor. By comparing the physical environment or microclimate of the two sidewalks, we found that people tend to choose a more pleasant sidewalk. Figure 9 is the detailed walk count graph of York Avenue sidewalks, showing that the foot traffic volume of the east sidewalk surpassed that of the west sidewalk during April and May. However, from the beginning of June onward, the west sidewalk shows more pedestrian traffic than the east side. As seen in Figure 2, the air temperature increased from April to May, but the temperatures of May (77.1 °F) and June (78.8 °F) were not dramatically different. June was slightly warmer than May on York Avenue, which suggests that air temperature was not a determinant above a certain level.
Air temperature was not a critical factor for why people changed their preferred side of the street on York Avenue. Instead, sunlight and shading were the main determinants when the weather was warm enough. York Avenue is usually busier in the afternoon, as seen in Figure 5; the average pedestrian traffic is highest around 6 p.m. We observed less foot traffic on the west sidewalk compared to the east before June. However, from 12 p.m. to 6 p.m., more foot traffic was observed on the west sidewalk of York Avenue. The biggest difference between the two sidewalks is the amount of shade produced by the adjacent buildings. The afternoon sunlight on the east sidewalk creates a pleasant walking environment until May but tends to be strong starting in June, motivating people to cross the street to find shade.
Figure 8. Land use features of the two sets of paired sidewalks (left: Sterling Place, right: York Avenue) [54].
Another hypothesis is that microclimate is the determining factor. By comparing the physicalenvironment or microclimate of the two sidewalks, we found that people tend to choose a morepleasant sidewalk. Figure 9 is the detailed walk count graph of York Avenue sidewalks, showing thatthe foot traffic volume of the east sidewalk surpassed that of the west sidewalk during April and May.However, from the beginning of June onward, the west sidewalk shows more pedestrian traffic than theeast side. As seen in Figure 2, the air temperature increased from April to May, but the temperatures ofMay (77.1 ◦F) and June (78.8 ◦F) were not dramatically different. June was slightly warmer than Mayon York Avenue, which suggests that air temperature was not a determinant above a certain level.
Sustainability 2020, 12, 7863 11 of 16
Sustainability 2020, 12, x FOR PEER REVIEW 11 of 16
Figure 9. Hourly pedestrian counts on York Avenue. From early June, people tend to shift from the east sidewalk to the west one to avoid harsh sunlight and to seek shade in the afternoon.
4.3. Solar Radiation and Pedestrian Behavior
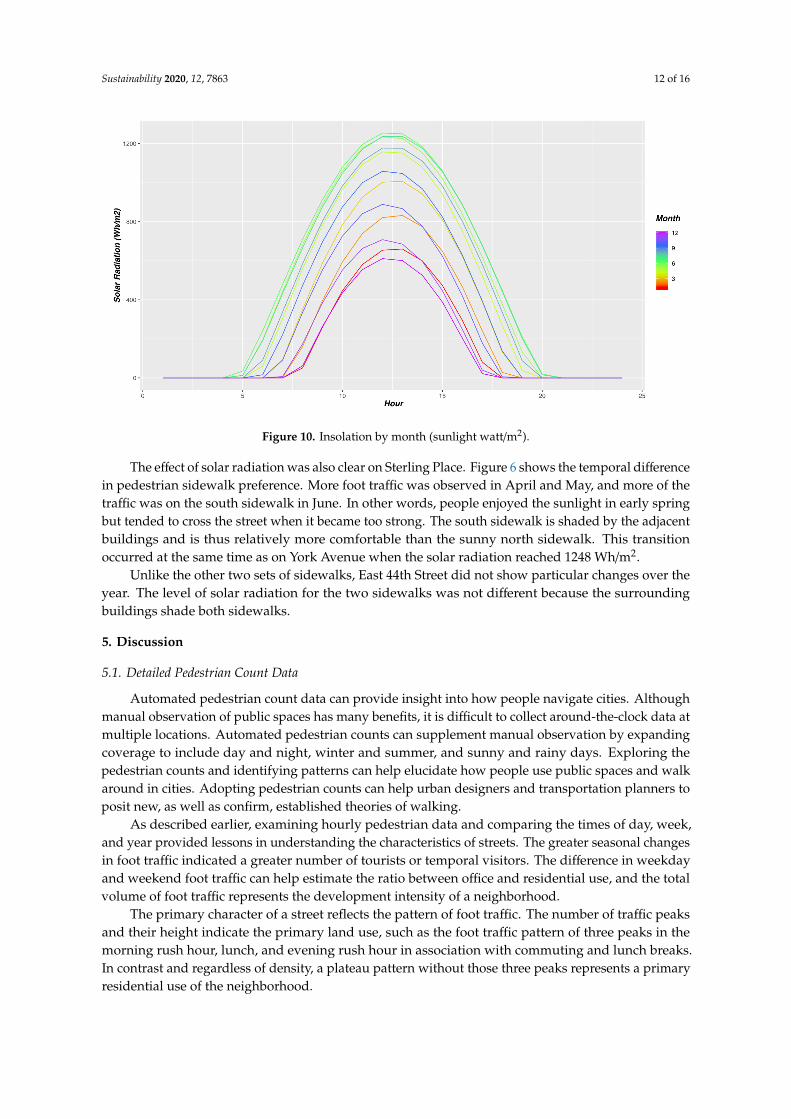
Solar radiation increases from winter to summer as the sun’s altitude changes, as shown in Figure 10. In our data, the maximum sun radiation in December was 601 Wh/m2 compared to 1250 Wh/m2 in June (twice as strong in June). From May to July, the solar radiation ranged from 1200 to 1250 Wh/m2. The increase in foot traffic on the west sidewalk was observed from June onward, when the solar radiation reached 1248 Wh/m2. Considering that the air temperatures were similar in May and June, an average of 25 °C against 26 °C solar radiation was determined as the major reason why people shifted their preferred side of the street. That is, the combined air temperature, wind, humidity, and solar radiation was uncomfortable enough for people to make additional street crossings to find thermal comfort. Thus, on York Avenue in New York City, the solar radiation tolerance for a pedestrian was roughly 1248 Wh/m2 at an air temperature of 25 °C.
The effect of solar radiation was also clear on Sterling Place. Figure 6 shows the temporal difference in pedestrian sidewalk preference. More foot traffic was observed in April and May, and more of the traffic was on the south sidewalk in June. In other words, people enjoyed the sunlight in early spring but tended to cross the street when it became too strong. The south sidewalk is shaded by the adjacent buildings and is thus relatively more comfortable than the sunny north sidewalk. This transition occurred at the same time as on York Avenue when the solar radiation reached 1248 Wh/m2.
Unlike the other two sets of sidewalks, East 44th Street did not show particular changes over the year. The level of solar radiation for the two sidewalks was not different because the surrounding buildings shade both sidewalks.
Figure 9. Hourly pedestrian counts on York Avenue. From early June, people tend to shift from theeast sidewalk to the west one to avoid harsh sunlight and to seek shade in the afternoon.
Air temperature was not a critical factor for why people changed their preferred side of thestreet on York Avenue. Instead, sunlight and shading were the main determinants when the weatherwas warm enough. York Avenue is usually busier in the afternoon, as seen in Figure 5; the averagepedestrian traffic is highest around 6 p.m. We observed less foot traffic on the west sidewalk comparedto the east before June. However, from 12 p.m. to 6 p.m., more foot traffic was observed on the westsidewalk of York Avenue. The biggest difference between the two sidewalks is the amount of shadeproduced by the adjacent buildings. The afternoon sunlight on the east sidewalk creates a pleasantwalking environment until May but tends to be strong starting in June, motivating people to cross thestreet to find shade.
4.3. Solar Radiation and Pedestrian Behavior
Solar radiation increases from winter to summer as the sun’s altitude changes, as shown inFigure 10. In our data, the maximum sun radiation in December was 601 Wh/m2 compared to1250 Wh/m2 in June (twice as strong in June). From May to July, the solar radiation ranged from 1200to 1250 Wh/m2. The increase in foot traffic on the west sidewalk was observed from June onward,when the solar radiation reached 1248 Wh/m2. Considering that the air temperatures were similar inMay and June, an average of 25 ◦C against 26 ◦C solar radiation was determined as the major reasonwhy people shifted their preferred side of the street. That is, the combined air temperature, wind,humidity, and solar radiation was uncomfortable enough for people to make additional street crossingsto find thermal comfort. Thus, on York Avenue in New York City, the solar radiation tolerance fora pedestrian was roughly 1248 Wh/m2 at an air temperature of 25 ◦C.
Sustainability 2020, 12, 7863 12 of 16
Sustainability 2020, 12, x FOR PEER REVIEW 12 of 16
Figure 10. Insolation by month (sunlight watt/m2).
5. Discussion
5.1. Detailed Pedestrian Count Data
Automated pedestrian count data can provide insight into how people navigate cities. Although manual observation of public spaces has many benefits, it is difficult to collect around-the-clock data at multiple locations. Automated pedestrian counts can supplement manual observation by expanding coverage to include day and night, winter and summer, and sunny and rainy days. Exploring the pedestrian counts and identifying patterns can help elucidate how people use public spaces and walk around in cities. Adopting pedestrian counts can help urban designers and transportation planners to posit new, as well as confirm, established theories of walking.
As described earlier, examining hourly pedestrian data and comparing the times of day, week, and year provided lessons in understanding the characteristics of streets. The greater seasonal changes in foot traffic indicated a greater number of tourists or temporal visitors. The difference in weekday and weekend foot traffic can help estimate the ratio between office and residential use, and the total volume of foot traffic represents the development intensity of a neighborhood.
The primary character of a street reflects the pattern of foot traffic. The number of traffic peaks and their height indicate the primary land use, such as the foot traffic pattern of three peaks in the morning rush hour, lunch, and evening rush hour in association with commuting and lunch breaks. In contrast and regardless of density, a plateau pattern without those three peaks represents a primary residential use of the neighborhood.
As summarized below, detailed pedestrian count data can provide a comprehensive pattern of how people walk and use streets in cities. This can be a useful tool for urban designers to explore pedestrian behavior and the surrounding environment in the following aspects:
• Seasonal change in foot traffic—visitors and tourists • Differences between weekday and weekend foot traffic—office and residential uses • Total volume of foot traffic—development intensity of a neighborhood • Three peaks in foot traffic pattern—office as primary land use • Plateau in foot traffic pattern—residential as primary land use.
5.2. Thermal Comfort Threshold
This study confirms previous research and findings which show that thermal comfort has a major effect on walking. In a comfortable environment, people tend to perform more optional and
Figure 10. Insolation by month (sunlight watt/m2).
The effect of solar radiation was also clear on Sterling Place. Figure 6 shows the temporal differencein pedestrian sidewalk preference. More foot traffic was observed in April and May, and more of thetraffic was on the south sidewalk in June. In other words, people enjoyed the sunlight in early springbut tended to cross the street when it became too strong. The south sidewalk is shaded by the adjacentbuildings and is thus relatively more comfortable than the sunny north sidewalk. This transitionoccurred at the same time as on York Avenue when the solar radiation reached 1248 Wh/m2.
Unlike the other two sets of sidewalks, East 44th Street did not show particular changes over theyear. The level of solar radiation for the two sidewalks was not different because the surroundingbuildings shade both sidewalks.
5. Discussion
5.1. Detailed Pedestrian Count Data
Automated pedestrian count data can provide insight into how people navigate cities. Althoughmanual observation of public spaces has many benefits, it is difficult to collect around-the-clock data atmultiple locations. Automated pedestrian counts can supplement manual observation by expandingcoverage to include day and night, winter and summer, and sunny and rainy days. Exploring thepedestrian counts and identifying patterns can help elucidate how people use public spaces and walkaround in cities. Adopting pedestrian counts can help urban designers and transportation planners toposit new, as well as confirm, established theories of walking.
As described earlier, examining hourly pedestrian data and comparing the times of day, week,and year provided lessons in understanding the characteristics of streets. The greater seasonal changesin foot traffic indicated a greater number of tourists or temporal visitors. The difference in weekdayand weekend foot traffic can help estimate the ratio between office and residential use, and the totalvolume of foot traffic represents the development intensity of a neighborhood.
The primary character of a street reflects the pattern of foot traffic. The number of traffic peaksand their height indicate the primary land use, such as the foot traffic pattern of three peaks in themorning rush hour, lunch, and evening rush hour in association with commuting and lunch breaks.In contrast and regardless of density, a plateau pattern without those three peaks represents a primaryresidential use of the neighborhood.
Sustainability 2020, 12, 7863 13 of 16
As summarized below, detailed pedestrian count data can provide a comprehensive pattern ofhow people walk and use streets in cities. This can be a useful tool for urban designers to explorepedestrian behavior and the surrounding environment in the following aspects:
• Seasonal change in foot traffic—visitors and tourists• Differences between weekday and weekend foot traffic—office and residential uses• Total volume of foot traffic—development intensity of a neighborhood• Three peaks in foot traffic pattern—office as primary land use• Plateau in foot traffic pattern—residential as primary land use.
5.2. Thermal Comfort Threshold
This study confirms previous research and findings which show that thermal comfort has a majoreffect on walking. In a comfortable environment, people tend to perform more optional and recreationaltrips, resulting in a higher volume of foot traffic. The effect of thermal comfort is clearly represented inthe paired sidewalks of York Avenue and Sterling Place. For various reasons, people tend to showsimilar walking patterns. They choose one side of the street over the other because of their origin ordestination location, because they prefer certain building façades, or because they feel safer and morecomfortable. On York Avenue and Sterling Place, many pedestrians changed their preferred sidewalkwhen the thermal comfort factors changed. A clear shift took place in April and May on the westsidewalk of York Avenue and the north sidewalk of Sterling Place: both were popular passagewaysuntil people changed their sidewalk preference starting in June.
Paired sidewalk observation provides insights on threshold thermal comfort resulting in behaviorchange. From the York Avenue and Sterling Place cases, the main factor that led people to changetheir sidewalk choice was solar radiation. Since the air temperature in May and June was relativelyconstant, the increased level of solar radiation in June drove pedestrians to seek shade; thus, the shadedsidewalks showed higher volumes of foot traffic. The solar radiation was 1248 Wh/m2 with an airtemperature of 25 ◦C when the shift was observed. This threshold is a new parameter to guide thedesign of streets and buildings to promote walking in cities.
5.3. Street and Public Space Design
There have been many debates on whether or not a built environment affects people’s behavior.Thermal comfort and outdoor activities are closely related to each other. Improved thermal comfortallows more people to stay outdoors for extended periods, thus creating more chances to associatewith other people. In walking, pleasant weather and thermal comfort provide more options for peopleto travel. Thus, to promote walking, street and buildings should be designed to positively contributeto thermal comfort in public spaces.
Based on the findings of this study, streets and plazas in cities would be better utilized when thesolar radiation does not exceed 1248 Wh/m2. There are different ways to achieve this goal, includingbuilding shading, tree planting, and installing shading devices. Public space designers and managersneed to provide enough shaded space in the hotter months.
6. Conclusions
Examining automated hourly pedestrian count data presents new opportunities to understandpedestrian patterns in cities. Unique patterns of foot traffic are associated with land use, developmentintensity, and the characteristics of the neighborhood. The discrepancy in the volume of foot trafficindicates the number of visitors and tourists in summer versus the number of residents in winter.The difference between weekday and weekend foot traffic volume shows the divide between officeand residential uses of the neighborhood. Additionally, the graphical pattern of hourly foot trafficrepresents the predominant land use of the district. Three peaks of foot traffic indicate flooding office
Sustainability 2020, 12, 7863 14 of 16
workers during morning and evening rush hour as well as lunchtime. Whereas, a dull plateau of foottraffic from morning to afternoon is observed in residential neighborhoods.
Pedestrian behavior is highly dependent on thermal comfort. We observed pedestrians’ behaviorfrom paired sidewalks. From May to June, when the average air temperature exceeds 25 ◦C, we observedthat people tend to jump the street to move from one side of the street to the other, seeking shade fromthe scorching sun, at solar radiation greater than 1248 Wh/m2. Data collected from the new automaticmonitoring method of pedestrians can enable urban designers and transportation planners to analyzethe physical setting of the pedestrian thoroughfare and how people react to the setting. That is, the newmonitoring method can help in planning for streets and neighborhoods to promote walking; in turn,we can encourage cities to be less dependent on the automobile and to be more sustainable.
There are limitations on exploring walking behavior using automated pedestrian monitoring,such as the physical characteristics of sidewalks, including microclimate, design, and other factorsthat need to be considered to relate walking behavior to environmental characteristics and to predictpedestrian behavior. As a next step, we will recreate the microclimates of sidewalks using computersimulation to explore the thermal comfort threshold in detail.
Funding: This research was partly funded by University of Ulsan. (grant number: 2020-0641).
Acknowledgments: The authors express gratitude to Martin Lagache and Jon Lee from Placemeter Inc.,for introducing data processing mechanisms and providing data.
Conflicts of Interest: The author declare no conflict of interest.
References
1. Appleyard, D. Livable Streets; University of California Press: Berkeley, CA, USA, 1980.2. Lawrence, F.; Engelke, P. The Built Environment and Human Activity Patterns: Exploring the Impacts of
Urban Form on Public Health. J. Plan. Lit. 2001, 16, 202–218.3. Lee, C.; Moudon, A.V. Physical activity and environment research in the health field: Implications for urban
and transportation planning practice and research. J. Plan. Lit. 2004, 19, 147–181. [CrossRef]4. De Montigny, L.; Ling, R.; Zacharias, J. The Effects of Weather on Walking Rates in Nine Cities. Environ. Behav.
2012, 44, 821–840. [CrossRef]5. Gehl, J. Life Between Buildings; Van Nostrand Reinhold: New York, NY, USA, 1987.6. Hoogendoorn, S.P.; Daamen, W. Pedestrian behavior at bottlenecks. Transp. Sci. 2005, 39, 147–159. [CrossRef]7. Rasouli, A.; Kotseruba, I.; Tsotsos, J.K. Understanding pedestrian behavior in complex traffic scenes.
IEEE Trans. Intell. Veh. 2017, 3, 61–70. [CrossRef]8. Chen, Z.; Ngai, D.C.; Yung, N.H.C. Pedestrian behavior prediction based on motion patterns for
vehicle-to-pedestrian collision avoidance. In Proceedings of the 2008 11th International IEEE Conference onIntelligent Transportation Systems, Beijing, China, 12–15 October 2008; pp. 316–321.
9. Basch, C.H.; Ethan, D.; Zybert, P.; Basch, C.E. Pedestrian behavior at five dangerous and busy Manhattanintersections. J. Community Health 2015, 40, 789–792. [CrossRef] [PubMed]
10. Nikolopoulou, M.; Baker, N.; Steemers, K. Thermal Comfort in Outdoor Urban Spaces: The Human Parameter.Sol. Energy 2001, 70, 227–235. [CrossRef]
11. Hashimoto, Y.; Gu, Y.; Hsu, L.T.; Iryo-Asano, M.; Kamijo, S. A probabilistic model of pedestrian crossingbehavior at signalized intersections for connected vehicles. Transp. Res. Part C Emerg. Technol. 2016, 71,164–181. [CrossRef]
12. Hoogendoorn, S.P.; Bovy, P.H. Pedestrian route-choice and activity scheduling theory and models. Transp. Res.Part B Methodol. 2004, 38, 169–190. [CrossRef]
13. Lin, T.P. Thermal Perception, Adaptation, and Attendance in a Public Square in Hot and Humid Regions.Build. Environ. 2009, 44, 2017–2026. [CrossRef]
14. Zacharias, J. Microclimate and Downtown Open Space Activity. Environ. Behav. 2001, 33, 296–315. [CrossRef]15. Fukuyo, K. Application of computational fluid dynamics and pedestrian-behavior simulations to the design
of task-ambient air-conditioning systems of a subway station. Energy 2006, 31, 706–718. [CrossRef]16. Whyte, W. The Social Life of Small Urban Spaces; Project for Public Spaces: New York, NY, USA, 1980.
Sustainability 2020, 12, 7863 15 of 16
17. Ikeda, T.; Chigodo, Y.; Rea, D.; Zanlungo, F.; Shiomi, M.; Kanda, T. Modeling and prediction of pedestrianbehavior based on the sub-goal concept. Robotics 2013, 10, 137–144.
18. Camillen, F.; Caprì, S.; Garofalo, C.; Ignaccolo, M.; Inturri, G.; Pluchino, A.; Rapisarda, A.; Tudisco, S. Multiagent simulation of pedestrian behavior in closed spatial environments. In Proceedings of the 2009 IEEEToronto International Conference Science and Technology for Humanity (TIC-STH), Toronto, ON, Canada,26–27 September 2009; pp. 375–380.
19. Yi, S.; Li, H.; Wang, X. Pedestrian behavior understanding and prediction with deep neural networks.In European Conference on Computer Vision; Springer: Cham, Switzerland, 2016; pp. 263–279.
20. Chatzidimitriou, A.; Yannas, S. Microclimate development in open urban spaces: The influence of form andmaterials. Energy Build. 2015, 108, 156–174. [CrossRef]
21. Levinson, H.S.; Wynn, F.H. Effects of density on urban transportation requirements. Highw. Res. Rec. 1963, 2,38–64.
22. Cervero, R.; Kockelman, K. Travel demand and the 3Ds: Density, diversity, and design. Transp. Res. Part DTransp. Environ. 1997, 2, 199–219. [CrossRef]
23. Handy, S. Regional Versus Local Accessibility: Implications for Nonwork Travel. Transp. Res. Rec. 1993,1400, 58–66.
24. Cervero, R.; Radisch, C. Travel Choices in Pedestrian Versus Automobile Oriented Neighborhoods; UC Berkeley,University of California Transportation Center: Berkeley, CA, USA, 1995; Available online: https://escholarship.org/uc/item/7cn9m1qz (accessed on 22 September 2020).
25. Rioux, L.; Werner, C.M.; Mokounkolo, R.; Brown, B.B. Walking in two French neighborhoods: A study of howpark numbers and locations relate to everyday walking. J. Environ. Psychol. 2016, 48, 169–184. [CrossRef]
26. Lee, C.; Moudon, A. Correlates of walking for transportation or recreation purposes. J. Phys. Act. Health2006, 3, S77–S98. [CrossRef]
27. Ewing, R.; Cervero, R. Travel and the built environment: A meta-analysis. J. Am. Plan. Assoc. 2010, 76,265–294. [CrossRef]
28. Ewing, R.; Greenwald, M.; Zhang, M.; Walters, J.; Feldman, M.; Cervero, R.; Kassa, S.; Thomas, J. Trafficgenerated by mixed-use developments—six-region study using consistent built environmental measures.J. Urban Plan. Dev. 2011, 137, 248–261. [CrossRef]
29. Robin, T.; Antonini, G.; Bierlaire, M.; Cruz, J. Specification, estimation and validation of a pedestrian walkingbehavior model. Transp. Res. Part B Methodol. 2009, 43, 36–56. [CrossRef]
30. Li, S. User’s Behavior of Small Urban Spaces in Winter and Marginal Seasons. Archit. Behav. 1994, 10, 95–109.31. Wu, H.; Kriksic, F. Designing for pedestrian comfort in response to local climate. J. Wind Eng. Ind. Aerodyn.
2012, 104, 397–407. [CrossRef]32. Zacharias, J.; Bernhardt, T.; De Montigny, L. Computer-simulated pedestrian behavior in shopping
environment. J. Urban Plan. Dev. 2005, 131, 195–200. [CrossRef]33. Dustin, D.; Aldstadt, J.; Whalen, J.; Melly, S.; Gortmaker, S. Validation of Walk Score® for Estimating
Neighborhood Walkability: An Analysis of Four US Metropolitan Areas. Int. J. Respir. Public Health 2011, 8,4160–4179.
34. McFarland, M. Placemeter offers a fast, easy look at pedestrian traffic. The Washington Post. 29 June 2015.Available online: https://www.pressreader.com/usa/the-washington-post/20150629/281831462386141(accessed on 3 August 2015).
35. Aultman-Hall, L.; Lane, D.; Lambert, R. Assessing Impact of Weather and Season on Pedestrian TrafficVolumes. Transp. Res. Rec. 2009, 2140, 35–43. [CrossRef]
36. Culjat, B.; Erskine, R. Climate-Responsive Social Space: A Scandinavian Perspective. In Cities Designed for Winter;Building Book Ltd.: Helsinki, Finland, 1988.
37. Santamouris, M.; Papanikolaou, N.; Livada, I.; Koronakis, I.; Georgakis, C.; Argiriou, A.; Assimakopoulos, D.N.On the Impact of Urban Climate on the Energy Consumption of Buildings. Urban Environ. 2001, 70, 201–216.[CrossRef]
38. Arens, E.; Bosselmann, P. Wind, sun and temperature—Predicting the thermal comfort of people in outdoorspaces. Build. Environ. 1989, 24, 315–320. [CrossRef]
39. Givoni, J.; Noguchi, M.; Saaroni, H.; Pochter, O.; Yaacov, Y.; Feller, N. Outdoor Thermal Comfort ResearchIssues. Energy Build. 2003, 35, 77–86. [CrossRef]
Sustainability 2020, 12, 7863 16 of 16
40. Stathopoulos, T.; Wu, H.; Zacharias, J. Outdoor Human Comfort in an Urban Climate. Build. Environ. 2004,39, 297–305. [CrossRef]
41. Dimoudi, A.; Nikolopoulou, M. Vegetation in the Urban Environment: Microclimatic Analysis and Benefits.Spec. Issue Urban Res. 2003, 35, 69–76. [CrossRef]
42. Newman, P.G.; Kenworthy, J.R. Cities and Automobile Dependence: An International Sourcebook; AveburyTechnical: Brookfield, VT, USA, 1991.
43. Rust, E. Should we be concerned about Placedmeter-an app which monitors street views from apartmentwindow? The Guardian. 2014. Available online: https://www.theguardian.com/cities/2014/oct/27/-sp-placemeter-app-street-view-window-new-york-smartphone (accessed on 22 September 2020).
44. Nikolopoulou, M. Thermal Comfort and Psychological Adaptation as a Guide for Designing Urban Spaces.Energy Build. 2003, 35, 95–101. [CrossRef]
45. Bosselmann, P.; Dake, K.; Kraus, M. Sun, Wind, and Comfort: A Field Study of Thermal Comfort in San Francisco;Work. Paper; Center for Environmental Design Research, University of California, Berkeley: Berkeley, CA,USA, 1988; Volume 627.
46. City and County of San Francisco. Downtown: An Area Plan of the Master Plan of the City and County ofSan Francisco; City of San Francisco: San Francisco, CA, USA, 1985.
47. Adler, M. New Yorkers Protest Long Shadows Cast By New Skyscrapers. NPR Press, 23 April 2014. Availableonline: https://www.npr.org/2014/04/23/305643904/nyc-s-tall-skyscrapers-cast-super-shadows-on-central-park (accessed on 22 September 2020).
48. Bernstein, F.A. Supersizing Manhattan: New Yorkers rage against the dying of the light. The Guardian. 2015.Available online: https://www.theguardian.com/cities/2015/jan/16/supersizing-manhattan-new-yorkers-rage-against-the-dying-of-the-light (accessed on 22 September 2020).
49. Placemeter Website. Available online: https://www.placemeter.com/ (accessed on 30 August 2015).50. Wundermap Website. Available online: http://www.wunderground.com/wundermap/ (accessed on
30 August 2015).51. NOAA. Station Data Inventory, Access & History. Available online: https://www.ncdc.noaa.gov/data-access/
land-based-station-data/station-metadata (accessed on 27 August 2020).52. Handy, S. Methodologies for exploring the link between urban form and travel behavior. Transp. Res. Part D
Transp. Environ. 1996, 1, 151–165. [CrossRef]53. Eliasson, I.; Knez, I.; Westerberg, U.; Thorsson, S.; Lindberg, F. Climate and Behavior in a Nordic City.
Landsc. Urban Plan. 2007, 82, 72–84. [CrossRef]54. New York City, 2015 Street Tree Census. Available online: https://data.cityofnewyork.us/Environment/2015-
Street-Tree-Census-Tree-Data/pi5s-9p35 (accessed on 22 September 2020).
© 2020 by the author. Licensee MDPI, Basel, Switzerland. This article is an open accessarticle distributed under the terms and conditions of the Creative Commons Attribution(CC BY) license (http://creativecommons.org/licenses/by/4.0/).