Embed Size (px)
Citation preview
Exploring the use of entity-relationship diagramming as a
technique to support grounded theory inquiry Paper originally published in
Qualitative Research in Organizations and Management 5(3):224-237
Malcolm Brady and John Loonam
DCU Business School, Dublin City University
© All rights reserved. The authors assert their moral rights to be identified as
Authors of this Article.
Abstract
Purpose
This research compares fundamental concepts from the grounded theory approach to social science research and concepts from entity-relationship diagramming, a technique used to model data from the field of systems analysis, and proposes that entity-relationship diagramming can be a useful tool for grounded theory researchers. The deductive nature of entity-relationship diagramming may be particularly helpful to researchers during the process of ‘constant comparison’ of data.
Design/Methodology/Approach
The paper compares and contrasts concepts from the two different fields and demonstrates the construction of an entity-relationship diagram from data drawn from an existing grounded theory research project and demonstrates the correspondence between the data model constructs and the grounded theory constructs.
Findings
The research finds a correspondence between these two methodologies and suggests that the entity-relationship diagramming technique may be a useful addition to the social scientist's toolkit when carrying out research using the grounded theory approach.
Originality/ Value
The paper bridges two distinct fields - information systems and grounded theory – and proposes a novel way for qualitative researchers to analyse and depict data.
Paper type: technical paper
Keywords: grounded theory, entity-relationship diagram, data model, visual.
1

Introduction
This paper proposes the use of entity-relationship diagramming, a technique from the
field of information systems analysis, in the grounded theory approach to qualitative
research. Use of diagrams as an aid to data analysis and display is not new in
qualitative research; indeed, Strauss & Corbin (1998:217-8) call for the use of
diagrams and memos when carrying out qualitative analysis. Miles and Huberman’s
(1994) seminal work contains many examples of network and matrix based diagrams.
These diagrams centre on a variety of phenomena: events, activities, incidents,
decisions, causal links, timelines, roles or taxonomies. This paper proposes a diagram
that centres on entities - things of interest to the researcher and that become known to
the researcher as nouns - and their relationships to one another. Entity-relationship
diagrams are widely used in the development of databases and information systems.
This paper proposes that such diagrams may be useful to qualitative researchers.
The issue arises as to whether a technique from a positivist background such as entity-
relationship diagramming can fit well with a research methodology from an
interpretivist background such as grounded theory. We argue that it can. Firstly there
is a growing literature pointing out the advantages of research using mixed-
methodologies and even multi-paradigms. Secondly, entity-relationship diagrams are
built using a process of semantic analysis, a process that is interpretivist in nature.
Thirdly, we argue that the essential structural elements of entity-relationship
diagramming have some similar correspondences with the essential structural
elements of grounded theory, and that this close correspondence suggests that the two
approaches could be used synchronously. Finally we argue not for the full-scale
detailed completion of an entity-relationship diagram depicting the total situation
being examined, as would be the case in the development of an information system,
but merely that such a diagram can assist grounded theory researchers in exploring
interpretivist data. We argue that such a partial implementation will support but not
dilute the interpretivist nature of a research project. We now elaborate these points in
turn.
In recent decades carrying out a research project using a mixture of qualitative and
quantitative techniques has become relatively common and has developed to the point
2
that the field now has its own publication: the Journal of Mixed Methods Research.
Teddlie and Tashakkori (2009) point out that mixed methodologies assume that
research is carried out by cycling between inductive and deductive stages and the use
of mixed methods facilitates this. They also point out that the commonly used
research process of triangulation assumes use of mixed methods, and the more distinct
the methods the ‘greater opportunities for accurate inferences’ (Teddlie and
Tashakkori, 2009:75). In the traditionally positivist field of management science, soft
methods - broadly speaking interpretive – are becoming more popular and are
beginning to coexist with hard methods (Rosenhead and Mingers, 2001). Mingers
(2001) advocates the use of multi-methods, and even multi-paradigms, as real world
situations are multi-dimensional and different methods can be used to focus on
different aspects of their reality. Faulkner (1982) suggests using a ‘triad’ approach to
research on the basis that variety in the phenomenon being researched requires a
requisite variety in the methods used to carry out the research. Tashakkori and
Cresswell (2008) similarly view the use of mixed methods as a response to the need to
examine ‘social phenomena in a more eclectic manner, utilizing multiple
perspectives’. Benton and Craib (2001:114) in their study of the philosophy of
science suggest that there are ‘different types and levels of scientific activity…and
that these can coexist with each other’.
Grounded theory is inductive in that it eschews commencing a research project with a
preconceived theory, preferring instead to let the data speak atheoretically. It is
interpretive in that theory is developed during the process of examining the data.
However, through the process of constant comparison of data, grounded theorists are
also engaged in deducing an understanding from the emergent data. Dacin et al
(2010), for example, use a grounded theory approach to determine the theoretical
structure underpinning formal dining at Cambridge colleges. The research team
collected data using interviews and participant-observation; through a formal coding
process they reduced the data into base categories; they then aggregated base
categories into super-categories. While the second step in the coding process is
interpretivist the first coding step is clearly reductionist. This is not surprising given
the eclectic origin of grounded theory: Glazer’s Columbia University positivism and
Strauss’s University of Chicago pragmatism (Charmaz, 2009). It is conceivable
therefore that a technique from a positivist background such as entity-relationship
3
diagramming can find a home in the grounded theory stable. It should be noted
however that recent developments in grounded theory have taken it in a more
interpretivist and constructivist direction (Clarke, 2005; Charmaz, 2009).
Entity-relationship models are often built up by analysts and domain experts working
together using a process of semantic analysis i.e. the analysis is based on determining
the meanings of the constructs being examined and the associations between the
constructs. There are many similarities between this analytical process and a typical
grounded theory research project. Firstly, the project team are immersed in the
situation being examined for long periods of time: weeks or months. Secondly, data
for the model are often collected by interviewing a range of people who are involved
in the situation1. Locke (2001:65-66) describes similar top-down and bottom-up
processes taking place in grounded theory projects. Thirdly, the boundary or scope of
an entity-relationship modeling project is not always clear-cut and may change as the
project evolves. Fourthly, there is often considerable discussion, and even
disagreement, among the project team about the existence of and naming of entities
and about the relationships between entities. Finally, it can be difficult to model
certain aspects of reality, for example joint bank accounts i.e. bank accounts that are
owned by more than one customer. It can be difficult to resolve the many-to-many
relationship between bank accounts and customers: an account may be owned by one
or more customers, and a customer may own one or more bank accounts. However,
in order to progress the project and to deliver an information system, the entity-
relationship modeling team must eventually come down on one particular
interpretation of reality, even if the modeling team accept that a number of alternative
views of that reality may exist. In this sense the entity-relationship diagramming
approach is positivist: the development team must ultimately accept a single view of
reality and propose to its steering committee that the entity-relationship diagram is a
valid model of that reality. However, it is interpretivist in the way that it gets to that
final model: by examining the meaning of the entities involved and if necessary
examining a number of different views of that reality. Also, while the modeling team
propose a final model for some, usually practical, reason - that it is the best fit, the
1 An alternative approach exists: building up the data model from an examination of documents relevant to the situation being examined eg. forms, invoices, reports. The two approaches can also be used in tandem, one being used to confirm the other.
4

most practical, the cheapest to implement or that it provides most flexibility for the
future - the team also accept that there may exist alternative views of that reality or at
least of elements of that reality.
As we demonstrate in the paper there is a correspondence between the main elements
of grounded theory - categories, dimensions and properties - and the entity-
relationship diagramming elements of entities, attributes and values. However, entity-
relationship diagramming also entails a formal mechanism for drawing relationships
between entities. It is this formal diagramming of relationships, including their
bidirectionality, cardinality and optionality, that we suggest could be a useful addition
to the grounded researcher’s toolkit. We are not however suggesting that grounded
theorists should produce a fully-specified entity-relationship or data model. We only
suggest that such a rigorous diagramming technique could aid in developing and
understanding elements of the research situation under investigation. We see the
entity-relationship diagramming technique primarily being used manually – using a
whiteboard or flipchart – and only as a support tool in teasing out categories,
properties and dimensions during a grounded theory research project. While software
tools to support entity-relationship diagramming are widely available, for example
Visio (Microsoft, 2008), we do not see their use as in any way essential2. We suggest
in the paper that entity-relationship diagramming strengthens a grounded theory
research effort in that it combines analysis with representation (Clarke, 2005:8). It
forces analysts to consider the cardinality and optionality of relationships between
categories, and the bi-directionality of these relationships. It can also highlight
elements of the research situation that may not be fully understood or developed such
as one-to-one relationships between categories, many-to-many relationships between
categories, and the existence of isolated categories; once highlighted, these elements
can then be explored more fully.
The paper begins by briefly reviewing the grounded theory approach to qualitative
research. The paper then discusses the entity-relationship diagramming technique as
2 Note that many software packages exist to support qualitative data analysis (Atlas, 2008; MAXqda, 2008; QSR, 2008; Qualrus, 2008) but these do not support formal entity-relationship diagramming. See Miles & Weitzman (1994), Dohan and Sanchez-Jankowski (1998), Bazeley (1999), Bolden & Moscarola, 2000), Bourdon (2002), Richards (2002), Atherton & Elsmore (2007) and Robertson (2008) for a discussion of the use of computer aided qualitative data analysis software (CAQDAS).
5
used in the field of information systems analysis. The paper examines the parallels
between the concepts of grounded theory and the entity-relationship diagramming
technique and demonstrates the correspondence by applying entity-relationship
diagramming to a narrative from an actual grounded theory research project. The
paper then concludes by reflecting on ways in which entity-relationship diagramming
could enhance the grounded theory approach in practice.
Grounded Theory Methodology
Qualitative research makes use of a variety of techniques to analyse and understand a
particular situation in some depth; the techniques used are not usually quantitative or
statistical (Strauss and Corbin, 1990:7). Denzin and Lincoln (1994) suggest the use of
the French word bricolage (using whatever comes to hand to get the job done) as an
analogy for qualitative research. Flick (1998:13) suggests that qualitative research
methods are used to analyse and understand 'concrete cases in their temporal and local
particularity'. Strauss (1987:2) suggests that '[q]ualitative researchers tend to lay
considerable emphasis on situational and often structural contexts, in contrast to
quantitative researchers, whose work is multivariate but often weak on context'.
Qualitative research therefore tends to examine specific, complex, real-world
situations using visual, aural, oral techniques rather than statistical. Flick (1998:13)
summarises these tendencies in qualitative research: examining particular rather than
general problems in local rather than universal situations in a historical, timely,
context and relying greatly on oral material.
Grounded theory emerged during the 1960’s as a specific way of carrying out
qualitative research which sought to inductively generate theory where little is already
known, rather than deductively from a priori assumptions (Glaser and Strauss, 1967;
Glaser, 1978 and 1992; Charmaz, 1983 and 2007; Turner, 1983; Strauss and Corbin,
1990; Locke, 2001; Bryant, 2002; Goulding, 2002; Richardson and Kramer, 2006).
While Glaser and Strauss first developed grounded theory in 1967 the field
subsequently evolved in two directions with Glaser stressing the interpretive,
contextual and emergent nature of theory development whereas Strauss emphasised
complex and systematic coding techniques (Goulding, 2002: 47). The authors suggest
that entity-relationship diagramming may be particularly useful to researchers
adopting the Straussian approach to grounded theory inquiry.
6
Grounded theory methodology places strong emphasis on the systematic collection,
coding and analysis of data. Development of theory from this data – i.e. theory
grounded in data – is a key feature of the method. Grounded theory draws on the
principles of symbolic interactionism, a principle tenet of which is that humans come
to understand social definitions through the socialisation process (Goulding, 2002;
Fendt and Sachs, 2008). Theory evolves during the research process and is a product
of continuous interplay between analysis and data collection: the researcher is
'inductively building theory, through the qualitative analysis of data' (Strauss and
Corbin, 1990:7). Bailey (1987:54) gives an example of dying patients: the variable
social loss, defined as 'the degree of loss the patient's death will represent to his
family and employer', emerged 'from the data during the course of the study' and the
researchers 'probably could not have anticipated it prior to the study'.
Key to the success of a grounded theory research project is the 'theoretical sensitivity'
of the researcher, that is the 'insight, the ability to give meaning to data, the capacity
to understand, and capability to separate the pertinent from that which isn't' (Strauss
and Corbin, 1990:42; Service, 2009). Grounded theory inquiry proceeds by
theoretically sampling emerging data, where future directions and decisions
concerning data collection are based upon prior knowledge and understanding. In this
process of ‘constant comparisons’ data collection and data analysis continue in
parallel. Three formal coding techniques are used to analyse data: open, axial and
selective (Strauss and Corbin, 1990). Open coding involves fracturing the data i.e.
breaking down the data into distinct units of meaning. Such a process allows the
researcher to place specific ‘phenomena’ into groups giving rise to early concept
development for the emerging theory (Loonam & McDonagh, 2008). This
classification of concepts into specific groups is referred to as ‘conceptualising’ the
data (Strauss and Corbin, 1998:103). Axial coding involves moving to a higher level
of abstraction and is achieved by specifying relationships and delineating a core
category or construct around which the other concepts revolve. Higher level concepts,
known as categories, are related to their subcategories to form more precise and
complete understandings of phenomena (Strauss and Corbin, 1998:124; Orlikowski,
1993). Selective coding is to ‘refine and integrate categories’ having reached a point
of theoretical saturation (Strauss and Corbin, 1998:143). Concepts are saturated when
7
new data provokes no revision of those concepts. Broad themes about the
phenomenon being studied are therefore classified into categories; specific
characteristics pertaining to a category are identified and formally termed properties;
dimensions of each property - its location along a continuum - are determined (Strauss
and Corbin, 1990:61-74). These three elements - categories, properties, and
dimensions - form the rudimentary elements of a ‘grounded theory’. Such a rigorous
specification lends itself to the supportive use of formal models (Dohan and Sanchez-
Jankowski, 1998). This paper proposes the supportive use of one such formal model:
entity-relationship diagramming.
Entity-Relationship Diagramming
Entity-relationship diagramming (ERD) is a technique used to model the data
requirements of an organisation, typically by systems analysts in the requirements
analysis phase of a systems development project. While ostensibly a diagramming
technique or visual aid it provides the basis for the design of the relational database
underlying the information system being developed. The entity-relationship diagram
together with supporting detail constitute the data model which in turn is used as a
specification for the database.
The main elements of an entity relationship model are entities, relationships and
attributes (Watson, 2002:155; Lejk and Deeks, 2002:113). Entities are objects of
interest in the area of the organisation being modeled. Taking a university as an
example, lecturer and module would be reasonable candidate entities as shown in the
sample entity-relationship diagram in figure 1. Data models in a complex
organisational situation can become very large: models with over a hundred entity
types are possible.
Entities are usually named as singular nouns and represented as cushioned rectangles
in the entity-relationship diagram. A relationship is an association between two entity
types and is represented as a straight line connecting two entities. The cardinality of
the relationship is represented by a crow’s foot symbol for ‘one or more’ and absence
of a crow’s foot for ‘one’. Optionality is represented as a dashed line; a solid line is
used to depict a mandatory relationship. In the example given below the relationship
reads from left to right as 'a lecturer sometimes delivers one or more modules' where
8

the dashed portion of the line represents ‘sometimes’ and the crows foot symbol
represents ‘one or more’. Note that relationships are bi-directional and the
relationship also acts from right to left as: 'a module is always delivered by one
lecturer' in this case ‘always’ is represented by the solid end of the line and ‘one’ is
represented by the absence of a crow’s foot. These relationship statements represent
the 'rules' of the organisation. According to the rules of the organisation being
modeled in this example lecturers may exist who do not deliver modules; however, a
module, if it exists, must be associated with a lecturer who delivers it.
Figure 1: Entity-relationship diagram
Attributes give further detailed information about an entity type. For example,
specific details required about a lecturer may be: surname, first name, room number,
telephone number, email address, department, employment start date, age, and gender.
Each of these specific items is an attribute of the entity type. Attributes and
relationships represent the structure of an entity type. Attributes in turn have an
internal structure, for example: name, type (numeric, alphabetic, alphanumeric),
maximum length, and permitted values. For example, surname may be defined as
alphabetic of maximum length 30 characters, gender as alphabetic with a maximum
length of six characters and with permitted values 'female' or 'male'.
Several different styles of entity-relationship diagramming exist. In this paper we use
the format suggested by Lejk and Deeks (2002:ch7) which follows on from the
information engineering format (Martin, 1986:ch.2; Finglestein, 1992:ch.2; Bell and
Wood-Harper, 1992:ch.6). This format is relatively easy to understand for readers
new to data modeling as it allows only binary relationships between entity types and
uses a straight line to depict this relationship. Alternative approaches allow n-ary
relationships - a relationship between n different entity types - and use diamond-
shaped boxes to depict relationships (Yourdon, 1989:235; Yourdon, 1993:49-69;
Wieringa, 1996:148).
Lecturer delivers Module
delivered by
9
Correspondence between Grounded theory and ERD concepts
Clear parallels exist between the grounded theory and the entity-relationship
diagramming approaches. Both are essentially a form of semantic analysis: analysis
based on the meaning of the themes being explored. Data is gathered in a similar
fashion under both methods: by observation, interviews with individuals, or by group
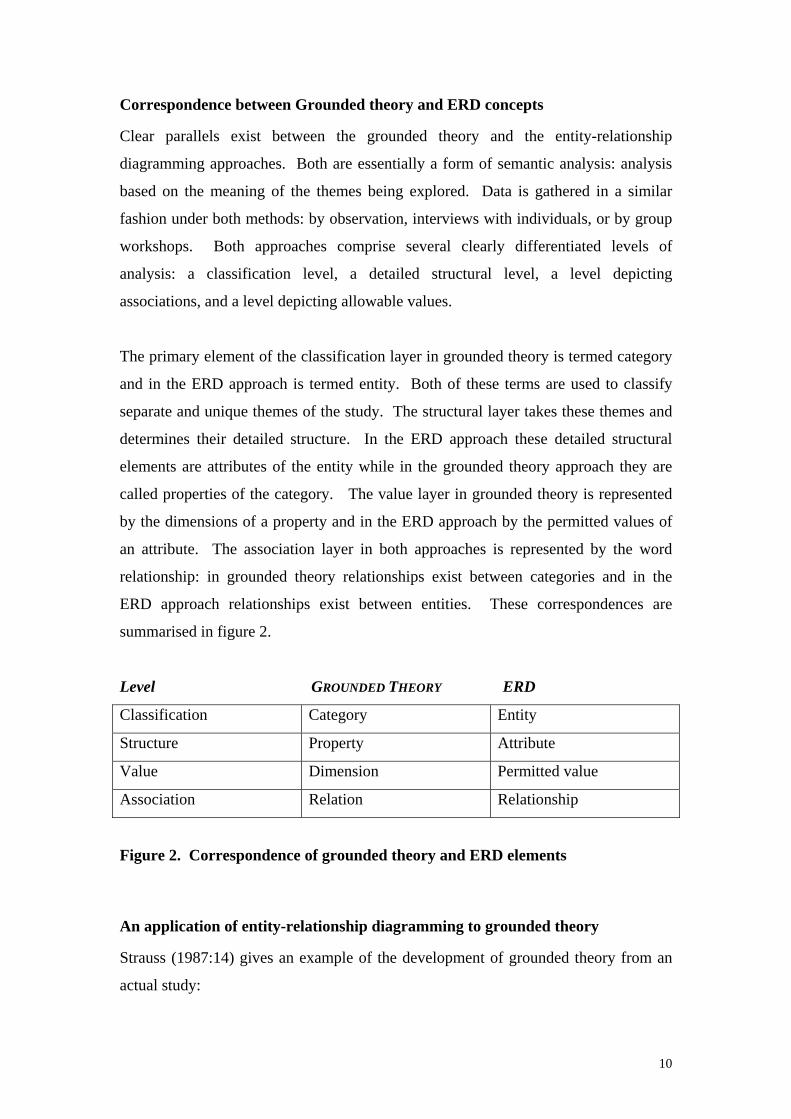
workshops. Both approaches comprise several clearly differentiated levels of
analysis: a classification level, a detailed structural level, a level depicting
associations, and a level depicting allowable values.
The primary element of the classification layer in grounded theory is termed category
and in the ERD approach is termed entity. Both of these terms are used to classify
separate and unique themes of the study. The structural layer takes these themes and
determines their detailed structure. In the ERD approach these detailed structural
elements are attributes of the entity while in the grounded theory approach they are
called properties of the category. The value layer in grounded theory is represented
by the dimensions of a property and in the ERD approach by the permitted values of
an attribute. The association layer in both approaches is represented by the word
relationship: in grounded theory relationships exist between categories and in the
ERD approach relationships exist between entities. These correspondences are
summarised in figure 2.
Level GROUNDED THEORY ERD
Classification Category Entity
Structure Property Attribute
Value Dimension Permitted value
Association Relation Relationship
Figure 2. Correspondence of grounded theory and ERD elements
An application of entity-relationship diagramming to grounded theory
Strauss (1987:14) gives an example of the development of grounded theory from an
actual study:
10

Imagine that in a study of whether and how the use of machines in hospitals affects
the interaction between staff and patients, we observe that many machines are
connected to the sick persons. We can formulate a category - machine-body
connections - to refer to this phenomenon. Our observations also lead us to make a
provisional distinction (which may or may not turn out to be significant after further
research) between those machines where the connection is external to the skin of the
patient, and those where the connection is internal (through various orifices: nose,
mouth, anus, vagina). This distinction involves two dimensions of the machine-body
category: internal and external connections. The basic operation of making those
distinctions is dimensionalising. But since further distinctions can be made - either
by thinking about previous observations or making new ones - the process of
dimensionalising will continue. That is termed subdimensionalizing. Subdimensions
may also be generated analytically by questions that sooner or later will occur to us
about some of those distinctions. Thus, about the internal connections: Don't they -
or at least some of them - hurt? Are they safe? Are they uncomfortable? Are they
frightening? We can think of these subdimensions (hurt, safety, discomfort, fear)
dichotomously - as yes or no - or as continua running from very much to not at all.
Or we can slice up a continuum roughly into "more or less" subcategories, as for
instance, terribly uncomfortable, very uncomfortable, a bit uncomfortable, not at all
uncomfortable. (In quantitative analysis, continua can be given "values", running
from 0 to 100). All of these subdimensions, subcategories, and questions come not
only from inspection of field/interview data but, understandably from our
experiential data (those orifices are sensitive, so that connection probably hurts: or,
that tube looks horrible coming out of his belly, so is it really safe?).
We now produce a data model and entity-relationship diagram based on the
information given in the above narrative. Candidate entities are: staff, patient,
machine, and machine-body connection. Candidate relationships determined from the
above narrative are as shown in figure 3; to keep the diagram simple relationships
have not been named in both directions. No information is given about staff in the
narrative and so no relationships for this entity can be proposed at this time. Further
research would be necessary to determine whether a staff member is assigned to one
or more machines or to one or more patients or to one or more machine-body
connections; all of these relationships are feasible – further research would be
necessary to determine which relationships are valid in the particular context being
examined. It is clear that many machines can be connected to a patient at the one time
i.e. many machine-body connections can exist, either simultaneously or sequentially;
the two crow’s feet in figure 3 indicate the relevant cardinality.
11

connected as
connected to
Machine Machine-body connection
Staff Patient
Figure 3: Entity-relationship diagram for hospital machine example
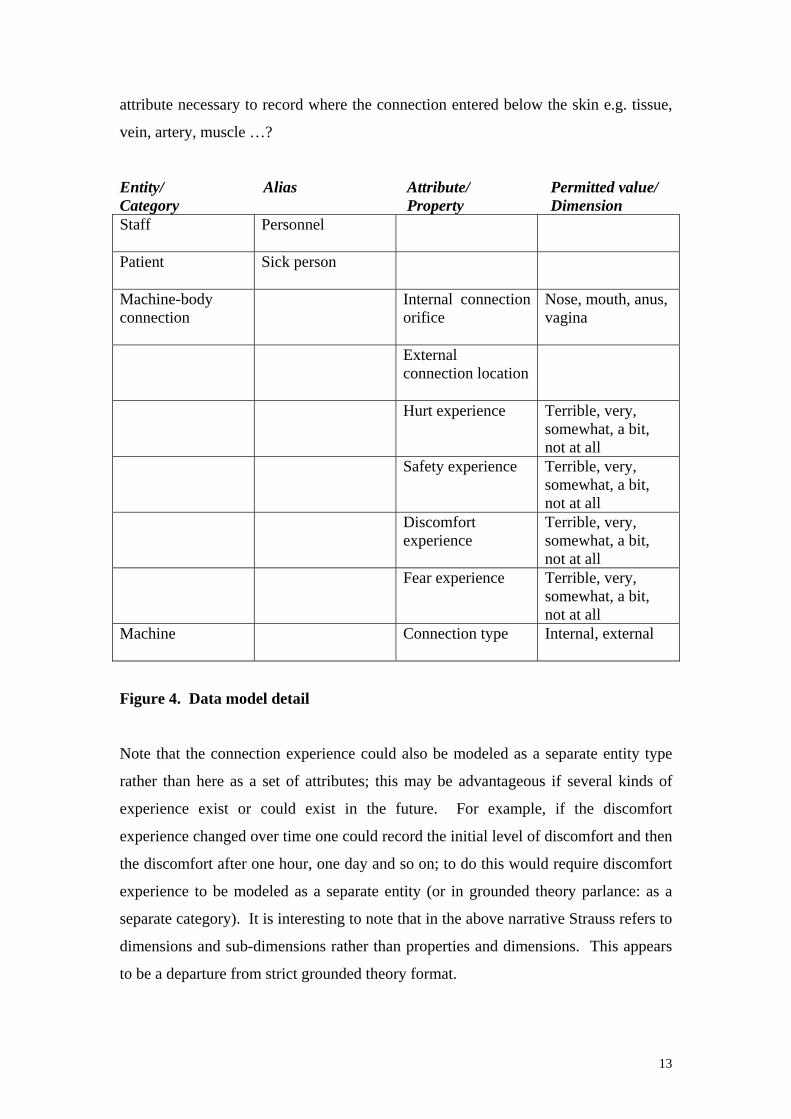
The structure of each entity can now be determined. Several aliases were used in the
grounded theory narrative, for example patient and sick person are assumed to
represent the one entity. No attributes for entities staff or patient were suggested:
more research would be needed to determine these, assuming that they are important
to the study. Several sets of permitted values are evident in the above narrative, e.g.
internal connection can be to several allowable orifices - nose, mouth, anus, vagina.
External connection location is not explicitly suggested as a property in the narrative;
however, the fact that the internal connection orifice is important suggests that the
external connection location may also be important; this suggests that some further
research would be needed here. Details of the data model gleaned from the above
narrative are summarised in figure 4.
The data model (entity-relationship diagram plus descriptive detail) produced so far
poses questions for further research: Is 'connection type' an attribute of machine or an
attribute of machine-body connection? For example, if a machine can be connected
both internally or externally then it is an attribute of machine-body connection as the
value will only be assigned when the circumstances of a particular instance are
known. The data model detailed in figures 3 and 4 assumes that connection type is an
attribute of machine i.e. a machine is capable of being connected internally or
connected externally; machines that are capable of being connected both internally
and externally are assumed not to exist; if this assumption is incorrect further research
would be needed to determine if machines with multi-modal connections exist or are
likely to exist in the future. Is the external connection location significant and if so do
specific values exist e.g. right arm, left arm, right leg, left leg, back …? Is another
12
attribute necessary to record where the connection entered below the skin e.g. tissue,
vein, artery, muscle …?
Entity/ Alias Attribute/ Permitted value/ Category Property Dimension Staff
Personnel
Patient
Sick person
Machine-body connection
Internal connection orifice
Nose, mouth, anus, vagina
External connection location
Hurt experience Terrible, very, somewhat, a bit, not at all
Safety experience Terrible, very, somewhat, a bit, not at all
Discomfort experience
Terrible, very, somewhat, a bit, not at all
Fear experience Terrible, very, somewhat, a bit, not at all
Machine
Connection type Internal, external
Figure 4. Data model detail
Note that the connection experience could also be modeled as a separate entity type
rather than here as a set of attributes; this may be advantageous if several kinds of
experience exist or could exist in the future. For example, if the discomfort
experience changed over time one could record the initial level of discomfort and then
the discomfort after one hour, one day and so on; to do this would require discomfort
experience to be modeled as a separate entity (or in grounded theory parlance: as a
separate category). It is interesting to note that in the above narrative Strauss refers to
dimensions and sub-dimensions rather than properties and dimensions. This appears
to be a departure from strict grounded theory format.
13
Reflections
Jones and Noble (2007) have suggested that grounded theory is in danger of losing its
integrity having ‘become so pliant that management researchers appear to have
accepted it as a situation of “anything goes”’ to the point where it has almost become
a generic term for any qualitative research approach. They emphasise the need to
instill more discipline into the approach by eliminating the ‘laxity and disorder that
currently prevails’. Use of a formal but well-known data modeling technique that
forces a systematic approach to data analysis, such as described in this paper, could
act as one such discipline.
While grounded theorists do use diagrams to visualise data and to aid in the research
process (Strauss and Corbin, 1998:236) these diagrams are not always consistent and
are infrequently used. For example, very few diagrams are contained in the book of
research papers edited by Strauss and Corbin (1997) and several of the papers contain
no diagrams at all. Bowen (2008) refers to a diagram that ‘provided a visual
representation of relationships among concepts’ but does not give an example of its
use. Padilla (1991) gives several examples of models which graphically depict
concepts (which are broadly equivalent to categories or entities) and the relationships
between them but again the diagramming approach is not standardised, even between
the two concept model diagrams given in the paper. Crilly et al (2006) suggest the
use of diagrams as visual elicitation stimuli during the interview stage of data
collection. While many qualitative research software packages support some form of
diagramming of data they use a proprietary diagramming convention and often model
at instance rather than class level thus creating relatively cumbersome diagrams.
However, it should be noted that Miles and Huberman (1994) strongly advocate the
use of diagrammatic techniques as an aid in analysing qualitative data. Clarke’s
(2005) supplement to grounded theory – situational analysis – also recommends use
of a variety of diagramming techniques in support of an interpretivist approach to
research; Clarke emphasises relationality and puts forward a relational diagram
(pp.104-5) not dissimilar to the entity-relationship diagrams suggested in this paper.
Entity-relationship diagramming may also provide a mechanism to bridge between the
artistic and scientific aspects (Strauss and Corbin, 1998:13) of grounded theory
14
research as the model is both rigorous and graphic. Diagramming may also facilitate
the process of conceptualisation of data and the hierarchical placement of concepts,
particularly in moving from ‘fractured data’ to ‘categories’. It can also assist during
the open coding stage when categories (entities) are discovered, and in the axial
coding stage when relationships between categories (entities) are surfaced. During
the process of axial coding entity relationship diagramming could provide researchers
with unique support in identifying causal relationships and building a network
diagram to reveal emerging concepts. The primary concern at this stage is
‘conceptualisation of data’ and it is useful for grounded theorists to have an eclectic
array of tools to draw on for support. Diagrams and memos play a role in assisting
researchers in documenting and visualizing the unfolding story: they “help the analyst
to gain analytical distance from materials. They force the analyst to move from
working with data to conceptualizing” (Strauss & Corbin, 1998: 218). Gasson (2004)
supports the use of different tools in GTM stating that ‘a holistic view of any research
question requires multiple approaches, as the selection of a research strategy entails a
trade-off: the strengths of one approach overcome the weaknesses in another approach
and vice versa. This in itself is a powerful argument for pluralism and for the use of
multiple research approaches during any investigation’ (2004:99). Examples of other
methods of inductive coding include, ‘discourse analysis, soft systems conceptual
models, process modelling, and inductive categorisation’ (Gasson, 2004).
A diagramming technique such as ERD may be useful in several respects: simply
being able to visualise the data in diagram form may aid the researcher - a picture
being worth a thousand words (Bryans and Mavin, 2006); the very act of putting
concepts down in diagram form during the research project may aid the researcher in
thinking through the meaning of their data and the relationships between the data
objects as they go along - the extended example used above demonstrated how
formalising the data as a data model provoked several questions for further research.
A diagram can be easily scanned visually and missing relationships or isolated entities
quickly identified suggesting avenues for further research. Finally, the use of formal
diagrams may also aid in presenting the results of the research to readers. These uses
broadly correspond to Crilly et al’s (2006) suggested use of diagrams for ideation,
elicitation and communication. This approach also supports Bourdon’s (2002) call for
15

the role of tools to shift from ‘handy utensils to fully integrated parts of the very
design of research projects’.
The entity-relationship diagramming technique yields more than diagrams however: it
also yields a robust, precise and detailed model: relationships named in both
directions, with their cardinality and optionality defined in both directions, with
attributes defined for each entity and with permitted values defined for these
attributes. While entities, relationships and attributes have a direct correspondence
with grounded theory elements, optionality and cardinality are new concepts to
grounded theory. This provides further detail on the nature of a relationship, adding
useful additional specific knowledge of the ‘rules’ of the situation being examined.
Interestingly, Richards and Richards (1994) suggest the teaching of 'data modeling on
sociological methods courses - that might help to critique the current often
meaningless use of diagrams in sociological literature'.
This brings us to a possible limitation in the use of entity-relationship diagrams as a
supporting tool in carrying out a grounded theory research project. In information
systems development entity-relationship diagrams are typically used in a positivist
manner in that they specify a single agreed world view of the situation under concern.
This is necessary in order to carry out their purpose in information systems
development: to provide the specification for an organisation’s data base and
information system. Using an ERD in this manner could make it an unsuitable
vehicle for detailing the nuances and multiple meanings inherent in a social science
research project. Certainly this paper does not advocate attempting to build a full-
scale entity-relationship diagram of the entire situation being examined. In any case it
is unlikely that this would be possible or advisable: reducing a social situation to one
single diagrammatic model runs the risk of aggregating away the multiple meanings
that are inherent in a social situation. The paper primarily suggests using entity-
relationship diagrams as a useful way of teasing out the meaning of small portions of
the situation under exploration, and detailing these portions in diagram form such as
shown in figures 3 and 4. This teasing out could lead to the development of several
entity-relationship diagrams of the one situation, each representing the views of
different actors. These different but precise views could then be used to interpret the
underlying different views of reality. The precision of the technique allows these
16

different views to be precisely compared and the exact nature or nuance of the
difference in views identified. Our final words are: use the technique only to the
extent that it is useful, and do not use it where it is not.
Conclusion
This paper is seeking to contribute to the mixed methods debate, by highlighting the
possible role of entity relationship diagramming in assisting grounded theory
explorations. Interpretivist inquiries call upon many tools to assist the investigator
with data collection. An eclectic mix of data collection tools is often heralded as an
imperative for increasing study depth and breath. However, such a vast range of data
can overwhelm prospective investigators, it therefore becomes vital that effective data
analysis techniques are deployed. The grounded theory investigator is furnished with
a clear data analysis coding strategy. To contribute to this strategy, the authors
propose deploying an entity relationship diagramming technique. This technique may
assist investigators in displaying and visualizing emergent data. Such illustrations
could provide a more thorough exploration of prospective concepts and their
relationships to other emergent concepts.
Bibliography
Atherton, A. and P. Elsmore. (2007). ‘Structuring qualitative enquiry in management
and organization research: a dialogue on the merits of using software for qualitative
data analysis’. Qualitative Research in Organizations and Management: An
International Journal 2(1):62-77.
Atlas (2008). Product description of ATLAS.ti, ATLAS.ti website available at
http://www.atlasti.com accessed 24th July 2008.
Bailey, K. (1987). Methods of social research, The Free Press.
Bazeley, P. (1999). ‘The bricoleur with a computer: piecing together qualitative and
quantitative data’, Qualitative Health Research 9(2):279-287.
17

Bell, S. and T. Wood-Harper (1992). Rapid information systems development: a non-
specialist's guide to analysis and design in an imperfect world, McGraw-Hill.
Benton, T. and I. Craib (2001). Philosophy of social science: the philosophical
foundations of social thought, Basingstoke, Hampshire: Palgrave.
Bolden, R. and J. Moscarola (2000). ‘Bridging the quantitative-qualitative divide: the
lexical approach to textual data analysis’. Social Science Computer Review 18(4):450-
460.
Bowen, G. (2008). ‘Naturalistic inquiry and the saturation concept: a research note’,
Qualitative Research 8(1):137-152.
Bryans, P. and S. Mavin (2006). ‘Visual images: a technique to surface conceptions of
research and researchers’, Qualitative Research in Organizations and Management
1(2):113-128.
Bryant, A. (2002). ‘Re-Grounding Grounded Theory’. Journal of Information
Technology Theory and Application 4(1):25-42.
Bourdon, S. (2002). ‘The Integration of Qualitative Data Analysis Software in
Research Strategies: Resistances and Possibilities’. Forum Qualitative
Sozialforschung / Forum: Qualitative Social Research [On-line Journal], 3(2).
Available at: http://www.qualitative-research.net/fqs-texte/2-02/2-02bourdon-e.htm
[Date of Access: July 24th, 2008].
Charmaz, K. (2009). ‘Shifting the grounds: constructivist grounded theory methods’
in Morse J., Stern P.N., Corbin J, Bowers B, Charmaz K and A. Clarke (eds.)
Developing grounded theory: the second generation, Walnut Creek, CA: West Coast
Press.
Charmaz, K (2007). Constructing Grounded Theory: A Practical Guide Through
Qualitative Analysis. Sage Publications, London.
18

Charmaz, K. (1983). ‘The grounded theory method: an explication and interpretation’
in R. Emerson (ed.) Contemporary Field Research: A collection of readings., Boston
MA: Little Brown.
Clarke, A. (2005). Situational analysis: grounded theory after the postmodern turn,
Thousand Oaks: Sage.
Crilly, N., A. Blackwell and P. Clarkson. (2006). ‘Graphic elicitation: using research
diagrams as interview stimuli’. Qualitative Research 6(3):341-366.
Dacin, T.M., K. Munir and Paul Tracey (2010). ‘Formal dining at Cambridge
colleges: linking ritual performance and institutional maintenance’, Academy of
Management Journal (forthcoming).
Denzin, N. and Y. Lincoln (1994). 'Introduction: entering the field of qualitative
research', in N. Denzin and Y. Lincoln (eds.) Handbook of qualitative research, Sage.
Dohan, D. and M. Sanchez-Jankowski (1998). ‘Using computers to analyze
ethnographic field data: theoretical and practical considerations’, Annual Review of
Sociology 24:477-498.
Faulkner, R. (1982). ‘Improvising on a triad’ in John Van Maanen, James Dabbs and
Robert Faulkner (eds.) Varieties of qualitative research, Beverly Hills: Sage.
Fendt, J and W. Sachs (2008). ‘Grounded Theory Method in Management Research’.
Organisational Research Methods, 11(3):430-455.
Finglestein, C (1992). Information engineering: strategic systems development,
Addison-Wesley.
Flick, U. (1998). An introduction to qualitative research, Sage.
19
Gasson, S. (2004). ‘Rigor in Grounded Theory Research: An Interpretive Perspective
on generating theory from qualitative field studies’ in The Handbook of Information
Systems Research eds. M. E. Whitman and A. B. Woszczynski. London, Idea Group
Publishing, pp. 79-102.
Glaser, B and Strauss, R. (1967). The discovery of grounded theory: strategies for
qualitative research, Hawthorne NY: Aldine de Gruyter.
Glaser B. (1978). Theoretical Sensitivity: Advances in the methodology of Grounded
Theory. Sociology Press.
Glaser, B (1992). Basics of Grounded Theory Analysis. Emergence vs Forcing.
Sociology Press.
Goulding, C. (2002). Grounded Theory: A Practical guide for Management, Business,
and Market Researchers, London: Sage Publications.
Jones, R and G. Noble. (2007). ‘Grounded theory and management research: a lack of
integrity?’. Qualitative Research in Organizations and Management: An International
Journal 2(2):84-103.
Lejk, M. and D. Deeks. (2002). An introduction to systems analysis techniques.
Addison-Wesley.
Locke, K. (2001). Grounded theory in management research. Sage:London.
Loonam, J, and J. McDonagh (2008). ‘A Grounded Theory Study of Enterprise
Systems Implementation-Lessons Learned from the Irish Health Services’ in A.
Cater-Steel and L. Al-Hakim (eds.) Information Systems Research: Public and
Private Sector Applications, World Scientific Publication, New York
Martin, J. (1986). Information engineering: volume 1, Savant.
20
MAXqda (2008). MAXqda product information available at http://www.maxqda.com
accessed 24th July 2008.
Microsoft (2008). Visio product information available at:
http://office.microsoft.com/en-gb/visio accessed 25th July 2008.
Miles, Matthew and A. Michael Huberman (1994). Qualitative data analysis – an
expanded sourcebook. Thousand Oaks: Sage.
Miles, Matthew and Eben Weitzman (1994). ‘Choosing computer programs for
qualitative data analysis’ in appendix to M. Miles and A. M. Huberman Qualitative
data analysis – an expanded sourcebook, 1994, Thousand Oaks: Sage.
Mingers, J. (2001). ‘Multimethodology: mixing and matching methods’ in Rosenhead
and Mingers (eds.) Rational analysis for a problematic world revisited: problem
structuring methods for complexity, uncertainty and conflict. Chichester: Wiley, pp.
289-309.
Orlikowski, W. J. (1993). ‘CASE tools as Organisational change: Investigating
incremental and radical changes in systems development’ MIS Quarterly 17(3): 309-
340.
Padilla, R. (1991). ‘Using computers to develop concept models of social situations’.
Qualitative Sociology 14(3):263-274.
QSR (2008). Product description of NVivo, QSR International website, available at:
http://www.qsrinternational.com accessed 24th July 2008.
Qualrus (2008). Product description of Qualrus, The Idea Works website, available at:
http://www.ideaworks.com accessed 24th July 2008.
Richards, T. (2002). ‘An intellectual history of NUD*IST and Nvivo’. International
Journal of Social Research Methodology 5(3):199-214
21

Richards, T. and L. Richards (1994). 'Using computers in qualitative research', in N.
Denzin and Y. Lincoln (eds.) Handbook of qualitative research, Sage.
Robertson, S. (2008). ‘The qualitative research process as a journey: mapping your
course with qualitative research software’. Qualitative Research Journal, 8(2):81-90.
Richardson, R and E. Kramer (2006). “Abduction as the type of inference that
characterizes the development of a grounded theory”. Qualitative Research, 6(4):
497-513.
Rosenhead, J and J. Mingers (2001). Rational analysis for a problematic world
revisited: problem structuring methods for complexity, uncertainty and conflict.
Chichester: Wiley.
Service, R (2009). “Basics of Qualitative Research: Techniques and Procedures for
Developing Grounded Theory (3rd ed.)”. Organisational Research Methods, 12(3).
Strauss, A. (1987). Qualitative analysis for social scientists, Cambridge University
Press.
Strauss, A. and J. Corbin (1990). Basics of qualitative research: Grounded theory
procedures and techniques, Newbury Park, CA: Sage Publications.
Strauss, A. and J. Corbin (eds.) (1997). Grounded theory in practice, Thousand Oaks:
Sage Publications.
Strauss, A. and J. Corbin (1998). Basics of Qualitative Research: techniques and
procedures for developing Grounded Theory, Thousand Oaks: Sage Publications.
Taddlie, C. and A. Tashakkori (2009). Foundations of mixed methods research:
integrating quantitative and qualitative approaches in the social and behavioral
sciences, Thousand Oaks: Sage Publications.
22

Tashakkori, A. and J. Cresswell. (2008). Mixed methodology across disciplines.
Journal of Mixed Methods Research, 2(1):3-6.
Turner, B. (1983). ‘The use of grounded theory for the qualitative analysis of
organisational behaviour’ Journal of Management Studies 20: 333-348.
Watson, R. (2002). Data management: databases and organizations, Wiley.
Wieringa, R.J. (1996). Requirements engineering: frameworks for understanding,
Wiley.
23


![Diagramming Review II - WCUSD15 · about sentence diagramming. classes are excited ... -ed, -d, -t, or ... Diagramming Review II [Compatibility Mode]](https://img.pdfslide.us/doc/110x75/5af7254d7f8b9a9271913b29/diagramming-review-ii-sentence-diagramming-classes-are-excited-ed-d-t.jpg)