Embed Size (px)
Citation preview
Exploring the Tropically Excited Arctic Warming Mechanism with StationData: Links between Tropical Convection and Arctic Downward
Infrared Radiation
MATTHEW D. FLOURNOY AND STEVEN B. FELDSTEIN
Department of Meteorology, The Pennsylvania State University, University Park, Pennsylvania
SUKYOUNG LEE
Department of Meteorology, The Pennsylvania State University, University Park, Pennsylvania,
and School of Earth and Environmental Sciences, Seoul National University,
Seoul, South Korea
EUGENE E. CLOTHIAUX
Department of Meteorology, The Pennsylvania State University, University Park,
Pennsylvania
(Manuscript received 23 September 2014, in final form 19 August 2015)
ABSTRACT
The Tropically ExcitedArcticWarming (TEAM)mechanism ascribes warming of theArctic surface to tropical
convection, which excites poleward-propagating Rossby wave trains that transport water vapor and heat into the
Arctic. A crucial component of the TEAM mechanism is the increase in downward infrared radiation (IR) that
precedes the Arctic warming. Previous studies have examined the downward IR associated with the TEAM
mechanism using reanalysis data. To corroborate previous findings, this study examines the linkage between
tropical convection, Rossby wave trains, and downward IR with Baseline Surface Radiation Network (BSRN)
downward IR station data. The physical processes that drive changes in the downward IR are also investigated by
regressing 300-hPa geopotential height, outgoing longwave radiation, water vapor flux, ERA-Interim downward
IR, and other key variables against the BSRN downward IR at Barrow, Alaska, and Ny-Ålesund, Spitsbergen.
Both the Barrow and the Ny-Ålesund station downward IR anomalies are preceded by anomalous tropical
convection and poleward-propagating Rossby wave trains. The wave train associated with Barrow resembles
the Pacific–North America teleconnection pattern, and that for Ny-Ålesund corresponds to a northwestern
Atlantic wave train. It is found that both wave trains promote warm and moist advection from the mid-
latitudes into the Arctic. The resulting water vapor flux convergence, multiplied by the latent heat of va-
porization, closely resembles the regressed ERA-Interim downward IR. These results suggest that the
combination of warm advection, latent heat release, and increased cloudiness all contribute toward an in-
crease in downward IR.
1. Introduction
According to the Tropically Excited Arctic Warming
(TEAM) mechanism, proposed by Lee et al. (2011) and
Lee (2012), La Niña–like convection over the tropical
Pacific excites poleward-propagating Rossby waves that
warm the Arctic via an intensified poleward eddy heat
flux, eddy-induced adiabatic descent, and an increase in
downward infrared radiation (IR). These wave trains
take about 10 days to propagate from the tropics to
high latitudes (Hoskins and Karoly 1981). Thus, the
TEAM mechanism is fundamentally an intraseasonal-
time-scale process. The TEAM mechanism has been
shown to operate on the intraseasonal time scale in con-
nection with the tropical Madden–Julian oscillation
(MJO) (Yoo et al. 2011, 2012a,b), on the interannual time
scale in association with the El Niño–SouthernOscillation
Corresponding author address: Steven Feldstein, Department of
Meteorology, The Pennsylvania State University, 503 Walker
Building, University Park, PA 16802.
E-mail: [email protected]
MARCH 2016 F LOURNOY ET AL . 1143
DOI: 10.1175/JAS-D-14-0271.1
� 2016 American Meteorological Society
(Lee 2012), and on the interdecadal time scale (Lee et al.
2011), possibly linked to greenhouse gas warming.
In previous studies, the downward IR associated with
the TEAM mechanism was examined with ERA-40 and
ERA-Interim data. As the reanalysis IR data are model
generated, to corroborate the key role played by down-
ward IR for the TEAMmechanism, we examine whether
tropical convection and poleward-propagating Rossby
wave trains are associated with changes in downward IR
at various surface stations in the Arctic. For this purpose,
we use daily downward IR data from the following two
World Radiation Monitoring Center–Baseline Surface
Radiation Network (BSRN) stations: Barrow, Alaska
(718N, 1568W), and Ny-Ålesund, Spitsbergen (788N,
118E) (Dutton et al. 2014; Maturilli et al. 2014).
In the recentmodeling study ofYoo et al. (2012a), it was
found that the tropically excited wave train transports a
passive tracer poleward, alluding to the possibility that
increases in downward IR associated with the TEAM
mechanism arise from poleward water vapor transport
and an attendant increase in downward IR. Motivated by
that result, we also examine the relationship between
poleward water vapor transport and changes in liquid
water and ice content associated with changes in down-
ward IR at the above Arctic stations. As we will see, a
strengthened poleward water vapor transport occurs in
conjunction with increased water vapor flux convergence,
condensation, latent heat release, increased cloudiness,
warm advection, and a greater downward IR. Because of
the close relationship between reanalysis and station
downward IR, these findings suggest that a similar process
may drive an increase in downward IR and surface
warming over much of the Arctic.
In section 2, the data and methods are presented,
followed by the results in section 3 and the summary and
conclusions in section 4.
2. Data and methods
As discussed in the introduction, the downward IR
data used in this study consist of time series from two
BSRN stations. The downward IR measurements were
taken by a pyrgeometer at each location and then accu-
mulated forward in time from 0000 UTC to the end of a
model time step. For this study, we used the accumulated
downward IR data at 0300 UTC, and converted these
data to watts per square meter by dividing each value by
the 3-h time step. Our analysis uses the daily BSRN
downward IR data for the December–February (DJF)
winter period spanning 17 winter seasons (1534 days) for
both sites. Downward IR data at Alert and Eureka,
Canada, and Tiksi, Russia, the remaining BSRN sites in
theArctic, are also available for seven, four, and twoDJF
seasons, respectively, but their time series are too short to
extract conclusions relevant to the focus of this paper.
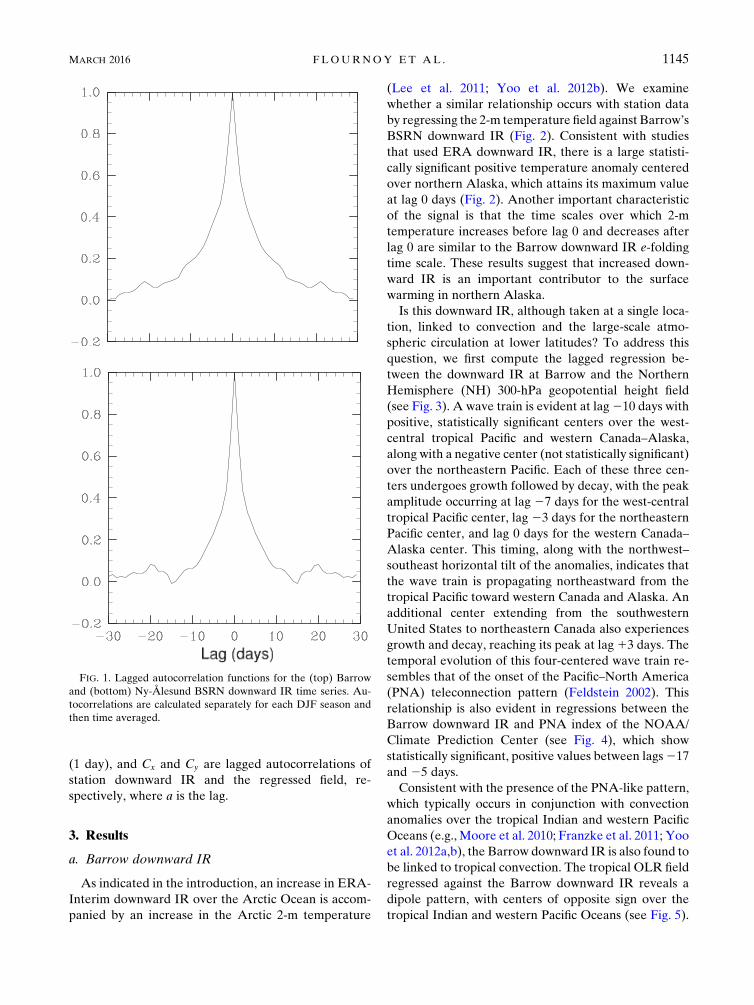
Our motivation for using daily downward IR data is
based on the value of the e-folding time scale of the
downward IR time series. Figure 1 shows the lagged au-
tocorrelations of the BSRN downward IR at Barrow and
Ny-Ålesund. These autocorrelations are calculated sep-
arately for each DJF season and then time averaged. As
can be seen, for Barrow and Ny-Ålesund, the downward
IR time series have e-folding time scales of 5 and 3 days,
respectively. Since our focus is to investigate the processes
that drive anomalies in Arctic downward IR, we use daily
downward IR data for this study, rather than data that
have been averaged over a much longer time period.
In this study, we perform lagged regressions of the
following variables against the daily downward IR time
series at the above stations: 300-hPa geopotential height,
2-m temperature, 400-hPa temperature, vertically in-
tegrated water vapor flux and its convergence, cloud
liquid and frozen water, cloud fraction, and outgoing
longwave radiation (OLR). Each regression spans the
same time period as the BSRN downward IR time series
(i.e., 1993–2010 for Barrow andNy-Ålesund). For each of
these calculations, except those with OLR data, we use
European Centre for Medium-RangeWeather Forecasts
(ECMWF) ERA-Interim data (Dee and Uppala 2009;
Dee et al. 2011); several recent studies showed that the
ERA-Interim dataset is the most reliable one in repre-
senting Arctic climate. The OLR data are obtained from
the National Oceanic and Atmospheric Administration
(NOAA) and are used as a proxy for deep convection in
the tropics. We also regress the daily, multivariate MJO
index of Wheeler and Hendon (2004) against the down-
ward IR time series. The MJO index is defined as the
principal component time series of the two leading
combined EOFs of the 200- and 850-hPa zonal wind and
the OLR, latitudinally averaged from 158S to 158N.With
the exception of theMJO index, all fields are represented
on a global 2.58 latitude by 2.58 longitude grid.
For the lagged regressions, we specify a one-standard-
deviation anomaly for the downward IR time series. Sta-
tistical significance is determined from the Pearson
correlation r,with thenumberofdegreesof freedom(NDOF)
estimated using the procedure of Davis (1976): that is,
NDOF5Ndt/t (1)
and
t5 �a
Cx(a)C
y(a) dt , (2)
whereN is the number of days for a specific, lagged time
series, dt is the time interval between adjacent values
1144 JOURNAL OF THE ATMOSPHER IC SC IENCES VOLUME 73
(1 day), and Cx and Cy are lagged autocorrelations of
station downward IR and the regressed field, re-
spectively, where a is the lag.
3. Results
a. Barrow downward IR
As indicated in the introduction, an increase in ERA-
Interim downward IR over the Arctic Ocean is accom-
panied by an increase in the Arctic 2-m temperature
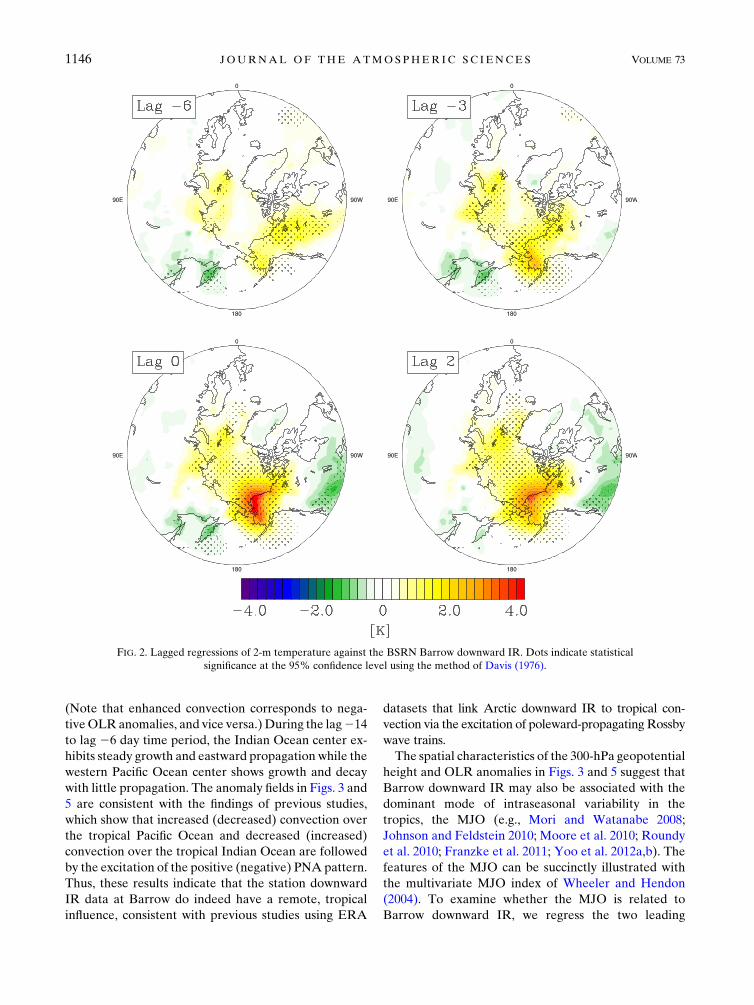
(Lee et al. 2011; Yoo et al. 2012b). We examine
whether a similar relationship occurs with station data
by regressing the 2-m temperature field against Barrow’s
BSRN downward IR (Fig. 2). Consistent with studies
that used ERA downward IR, there is a large statisti-
cally significant positive temperature anomaly centered
over northern Alaska, which attains its maximum value
at lag 0 days (Fig. 2). Another important characteristic
of the signal is that the time scales over which 2-m
temperature increases before lag 0 and decreases after
lag 0 are similar to the Barrow downward IR e-folding
time scale. These results suggest that increased down-
ward IR is an important contributor to the surface
warming in northern Alaska.
Is this downward IR, although taken at a single loca-
tion, linked to convection and the large-scale atmo-
spheric circulation at lower latitudes? To address this
question, we first compute the lagged regression be-
tween the downward IR at Barrow and the Northern
Hemisphere (NH) 300-hPa geopotential height field
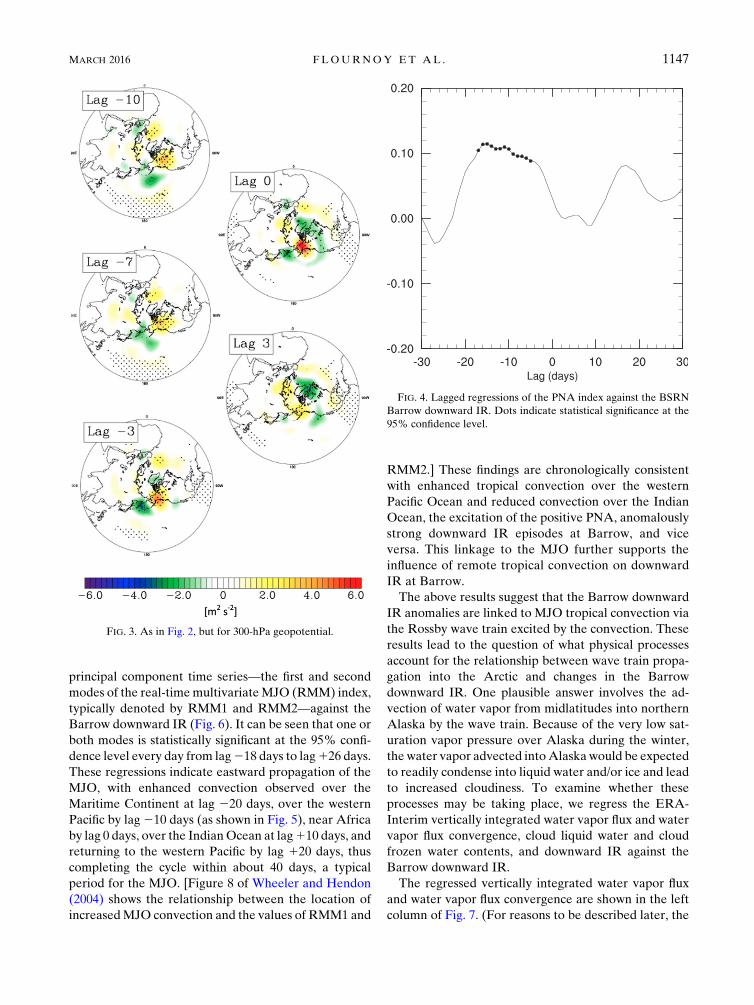
(see Fig. 3). A wave train is evident at lag210 days with
positive, statistically significant centers over the west-
central tropical Pacific and western Canada–Alaska,
along with a negative center (not statistically significant)
over the northeastern Pacific. Each of these three cen-
ters undergoes growth followed by decay, with the peak
amplitude occurring at lag 27 days for the west-central
tropical Pacific center, lag 23 days for the northeastern
Pacific center, and lag 0 days for the western Canada–
Alaska center. This timing, along with the northwest–
southeast horizontal tilt of the anomalies, indicates that
the wave train is propagating northeastward from the
tropical Pacific toward western Canada and Alaska. An
additional center extending from the southwestern
United States to northeastern Canada also experiences
growth and decay, reaching its peak at lag13 days. The
temporal evolution of this four-centered wave train re-
sembles that of the onset of the Pacific–North America
(PNA) teleconnection pattern (Feldstein 2002). This
relationship is also evident in regressions between the
Barrow downward IR and PNA index of the NOAA/
Climate Prediction Center (see Fig. 4), which show
statistically significant, positive values between lags217
and 25 days.
Consistent with the presence of the PNA-like pattern,
which typically occurs in conjunction with convection
anomalies over the tropical Indian and western Pacific
Oceans (e.g., Moore et al. 2010; Franzke et al. 2011; Yoo
et al. 2012a,b), the Barrow downward IR is also found to
be linked to tropical convection. The tropical OLR field
regressed against the Barrow downward IR reveals a
dipole pattern, with centers of opposite sign over the
tropical Indian and western Pacific Oceans (see Fig. 5).
FIG. 1. Lagged autocorrelation functions for the (top) Barrow
and (bottom) Ny-Ålesund BSRN downward IR time series. Au-
tocorrelations are calculated separately for each DJF season and
then time averaged.
MARCH 2016 F LOURNOY ET AL . 1145
(Note that enhanced convection corresponds to nega-
tiveOLRanomalies, and vice versa.)During the lag214
to lag 26 day time period, the Indian Ocean center ex-
hibits steady growth and eastward propagation while the
western Pacific Ocean center shows growth and decay
with little propagation. The anomaly fields in Figs. 3 and
5 are consistent with the findings of previous studies,
which show that increased (decreased) convection over
the tropical Pacific Ocean and decreased (increased)
convection over the tropical Indian Ocean are followed
by the excitation of the positive (negative) PNA pattern.
Thus, these results indicate that the station downward
IR data at Barrow do indeed have a remote, tropical
influence, consistent with previous studies using ERA
datasets that link Arctic downward IR to tropical con-
vection via the excitation of poleward-propagating Rossby
wave trains.
The spatial characteristics of the 300-hPa geopotential
height and OLR anomalies in Figs. 3 and 5 suggest that
Barrow downward IR may also be associated with the
dominant mode of intraseasonal variability in the
tropics, the MJO (e.g., Mori and Watanabe 2008;
Johnson and Feldstein 2010; Moore et al. 2010; Roundy
et al. 2010; Franzke et al. 2011; Yoo et al. 2012a,b). The
features of the MJO can be succinctly illustrated with
the multivariate MJO index of Wheeler and Hendon
(2004). To examine whether the MJO is related to
Barrow downward IR, we regress the two leading
FIG. 2. Lagged regressions of 2-m temperature against the BSRN Barrow downward IR. Dots indicate statistical
significance at the 95% confidence level using the method of Davis (1976).
1146 JOURNAL OF THE ATMOSPHER IC SC IENCES VOLUME 73
principal component time series—the first and second
modes of the real-timemultivariateMJO (RMM) index,
typically denoted by RMM1 and RMM2—against the
Barrow downward IR (Fig. 6). It can be seen that one or
both modes is statistically significant at the 95% confi-
dence level every day from lag218 days to lag126 days.
These regressions indicate eastward propagation of the
MJO, with enhanced convection observed over the
Maritime Continent at lag 220 days, over the western
Pacific by lag210 days (as shown in Fig. 5), near Africa
by lag 0 days, over the IndianOcean at lag110 days, and
returning to the western Pacific by lag 120 days, thus
completing the cycle within about 40 days, a typical
period for the MJO. [Figure 8 of Wheeler and Hendon
(2004) shows the relationship between the location of
increasedMJO convection and the values of RMM1 and
RMM2.] These findings are chronologically consistent
with enhanced tropical convection over the western
Pacific Ocean and reduced convection over the Indian
Ocean, the excitation of the positive PNA, anomalously
strong downward IR episodes at Barrow, and vice
versa. This linkage to the MJO further supports the
influence of remote tropical convection on downward
IR at Barrow.
The above results suggest that the Barrow downward
IR anomalies are linked to MJO tropical convection via
the Rossby wave train excited by the convection. These
results lead to the question of what physical processes
account for the relationship between wave train propa-
gation into the Arctic and changes in the Barrow
downward IR. One plausible answer involves the ad-
vection of water vapor from midlatitudes into northern
Alaska by the wave train. Because of the very low sat-
uration vapor pressure over Alaska during the winter,
the water vapor advected intoAlaskawould be expected
to readily condense into liquid water and/or ice and lead
to increased cloudiness. To examine whether these
processes may be taking place, we regress the ERA-
Interim vertically integrated water vapor flux and water
vapor flux convergence, cloud liquid water and cloud
frozen water contents, and downward IR against the
Barrow downward IR.
The regressed vertically integrated water vapor flux
and water vapor flux convergence are shown in the left
column of Fig. 7. (For reasons to be described later, the
FIG. 3. As in Fig. 2, but for 300-hPa geopotential.
FIG. 4. Lagged regressions of the PNA index against the BSRN
Barrow downward IR. Dots indicate statistical significance at the
95% confidence level.
MARCH 2016 F LOURNOY ET AL . 1147

water vapor flux convergence in Fig. 7 is multiplied by
the latent heat of vaporization.) The direction of the
water vapor flux vectors shows an anticyclonic circula-
tion centered over the Gulf of Alaska. A very similar
circulation is implied by the regressed sea level pressure
field (not shown), which suggests that a sizeable contri-
bution to the water vapor flux occurs in the lower
troposphere. [Based on potential vorticity dynamics
(Hoskins et al. 1985), the Rossby wave train in the upper
troposphere (Fig. 3) is expected to induce the sea level
pressure anomalies.] As can be seen, water vapor is
advected from the midlatitude northeastern Pacific
poleward toward Alaska, which results in a region of
enhanced water vapor flux convergence that shifts
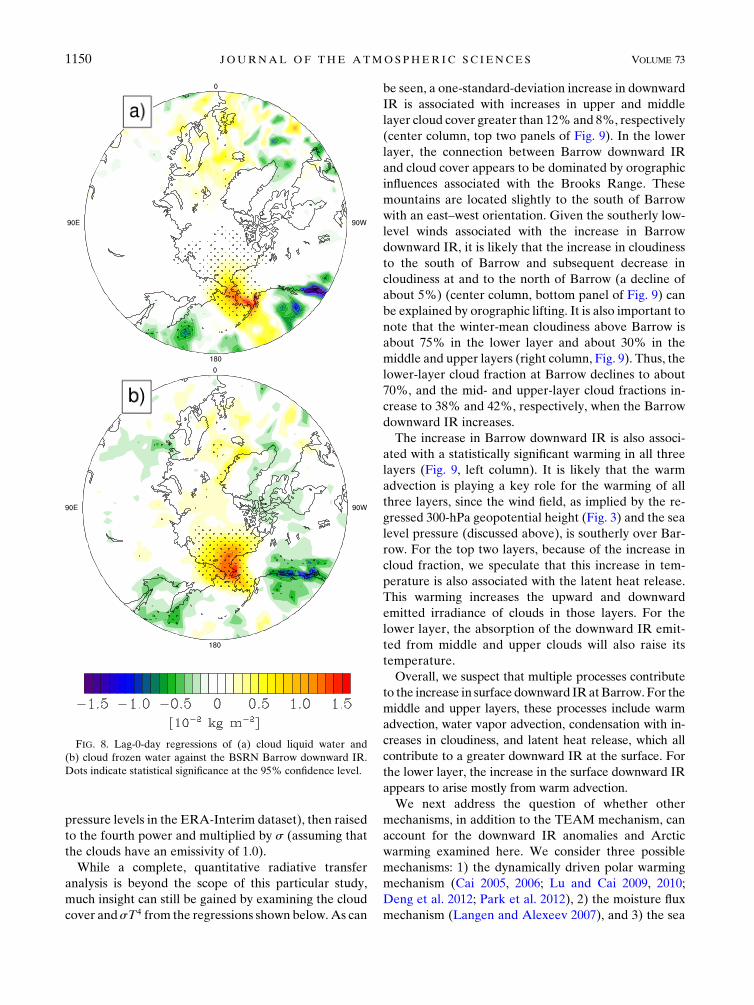
poleward toward Barrow from lag 22 to lag 0 days.
Consistently, we see an increase in both cloud liquid
water (Fig. 8a) and cloud frozen water (Fig. 8b) by lag
0 days, with the location of the latter being poleward of
the former. [Regressions of cloud liquid water flux
convergence were also performed (not shown); these
regressions were found to be weak and not statistically
significant.]
The regressed ERA-Interim downward IR is shown in
the center column of Fig. 7. [The regressed downward
IR attains its maximum lag-0-day value close to Barrow,
which gives us confidence that the ERA-Interim
downward IR is similar to that at the BSRN station;
this finding is consistent with Zib et al. (2012), who
showed with monthly mean data that ERA-Interim
downward IR compares reasonably well with the
FIG. 5. As in Fig. 2, but for OLR in the tropics.
FIG. 6. As in Fig. 4, but for the RMM1 and RMM2 indices.
1148 JOURNAL OF THE ATMOSPHER IC SC IENCES VOLUME 73
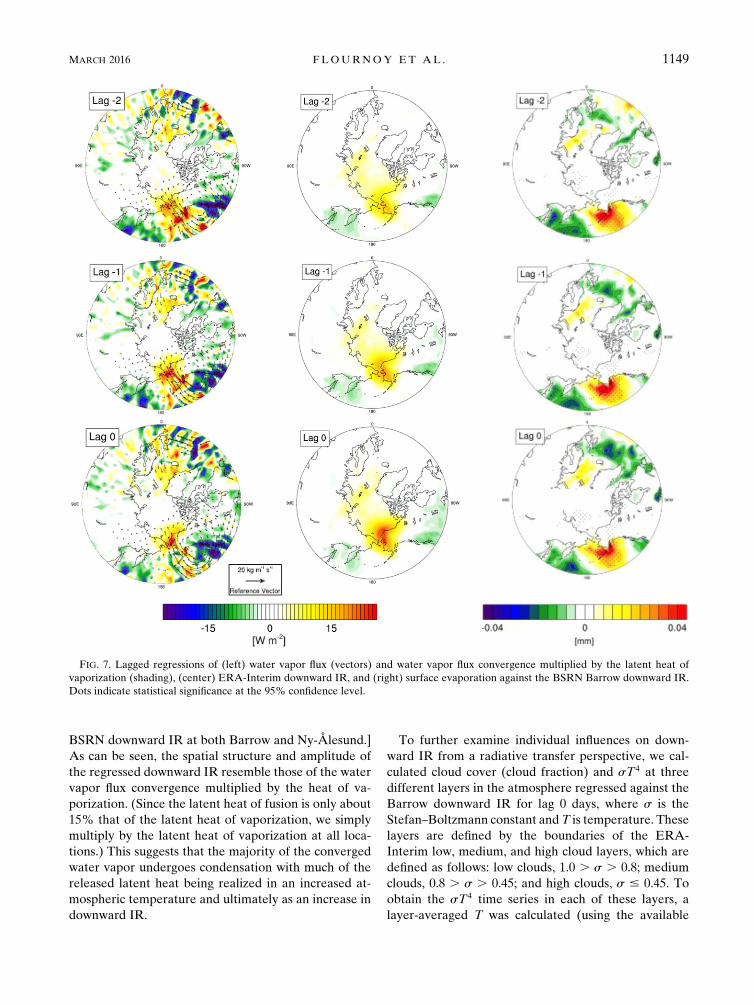
BSRN downward IR at both Barrow and Ny-Ålesund.]
As can be seen, the spatial structure and amplitude of
the regressed downward IR resemble those of the water
vapor flux convergence multiplied by the heat of va-
porization. (Since the latent heat of fusion is only about
15% that of the latent heat of vaporization, we simply
multiply by the latent heat of vaporization at all loca-
tions.) This suggests that the majority of the converged
water vapor undergoes condensation with much of the
released latent heat being realized in an increased at-
mospheric temperature and ultimately as an increase in
downward IR.
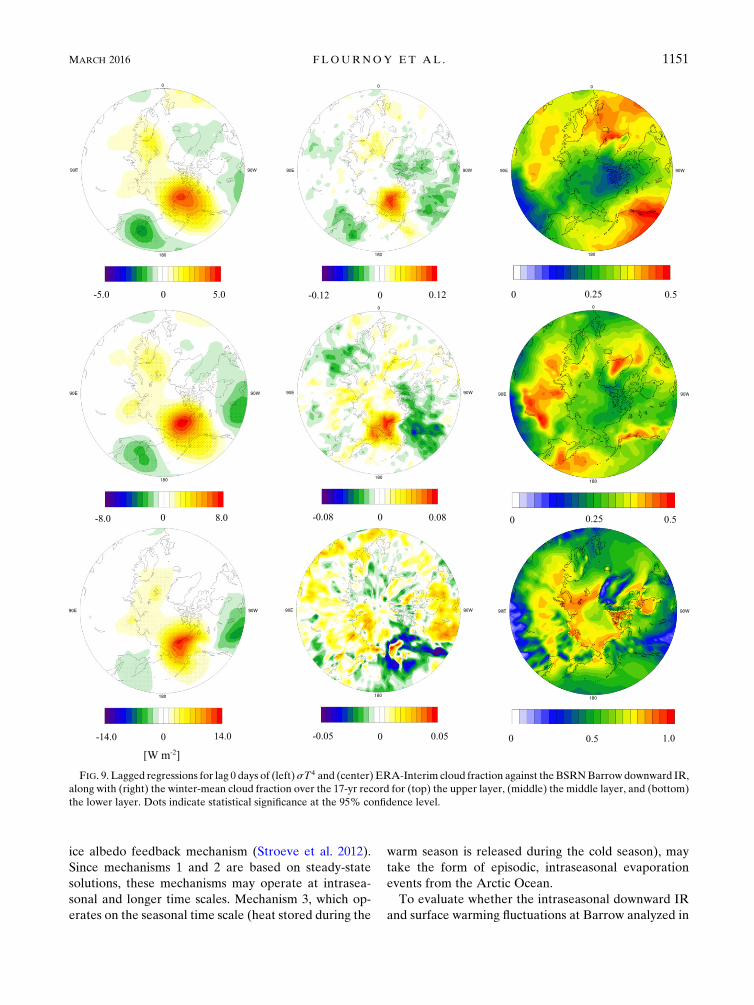
To further examine individual influences on down-
ward IR from a radiative transfer perspective, we cal-
culated cloud cover (cloud fraction) and sT4 at three
different layers in the atmosphere regressed against the
Barrow downward IR for lag 0 days, where s is the
Stefan–Boltzmann constant andT is temperature. These
layers are defined by the boundaries of the ERA-
Interim low, medium, and high cloud layers, which are
defined as follows: low clouds, 1.0 . s . 0.8; medium
clouds, 0.8 . s . 0.45; and high clouds, s # 0.45. To
obtain the sT4 time series in each of these layers, a
layer-averaged T was calculated (using the available
FIG. 7. Lagged regressions of (left) water vapor flux (vectors) and water vapor flux convergence multiplied by the latent heat of
vaporization (shading), (center) ERA-Interim downward IR, and (right) surface evaporation against the BSRN Barrow downward IR.
Dots indicate statistical significance at the 95% confidence level.
MARCH 2016 F LOURNOY ET AL . 1149
pressure levels in the ERA-Interim dataset), then raised
to the fourth power and multiplied by s (assuming that
the clouds have an emissivity of 1.0).
While a complete, quantitative radiative transfer
analysis is beyond the scope of this particular study,
much insight can still be gained by examining the cloud
cover andsT4 from the regressions shown below.As can
be seen, a one-standard-deviation increase in downward
IR is associated with increases in upper and middle
layer cloud cover greater than 12% and 8%, respectively
(center column, top two panels of Fig. 9). In the lower
layer, the connection between Barrow downward IR
and cloud cover appears to be dominated by orographic
influences associated with the Brooks Range. These
mountains are located slightly to the south of Barrow
with an east–west orientation. Given the southerly low-
level winds associated with the increase in Barrow
downward IR, it is likely that the increase in cloudiness
to the south of Barrow and subsequent decrease in
cloudiness at and to the north of Barrow (a decline of
about 5%) (center column, bottom panel of Fig. 9) can
be explained by orographic lifting. It is also important to
note that the winter-mean cloudiness above Barrow is
about 75% in the lower layer and about 30% in the
middle and upper layers (right column, Fig. 9). Thus, the
lower-layer cloud fraction at Barrow declines to about
70%, and the mid- and upper-layer cloud fractions in-
crease to 38% and 42%, respectively, when the Barrow
downward IR increases.
The increase in Barrow downward IR is also associ-
ated with a statistically significant warming in all three
layers (Fig. 9, left column). It is likely that the warm
advection is playing a key role for the warming of all
three layers, since the wind field, as implied by the re-
gressed 300-hPa geopotential height (Fig. 3) and the sea
level pressure (discussed above), is southerly over Bar-
row. For the top two layers, because of the increase in
cloud fraction, we speculate that this increase in tem-
perature is also associated with the latent heat release.
This warming increases the upward and downward
emitted irradiance of clouds in those layers. For the
lower layer, the absorption of the downward IR emit-
ted from middle and upper clouds will also raise its
temperature.
Overall, we suspect that multiple processes contribute
to the increase in surface downward IRatBarrow. For the
middle and upper layers, these processes include warm
advection, water vapor advection, condensation with in-
creases in cloudiness, and latent heat release, which all
contribute to a greater downward IR at the surface. For
the lower layer, the increase in the surface downward IR
appears to arise mostly from warm advection.
We next address the question of whether other
mechanisms, in addition to the TEAM mechanism, can
account for the downward IR anomalies and Arctic
warming examined here. We consider three possible
mechanisms: 1) the dynamically driven polar warming
mechanism (Cai 2005, 2006; Lu and Cai 2009, 2010;
Deng et al. 2012; Park et al. 2012), 2) the moisture flux
mechanism (Langen and Alexeev 2007), and 3) the sea
FIG. 8. Lag-0-day regressions of (a) cloud liquid water and
(b) cloud frozen water against the BSRN Barrow downward IR.
Dots indicate statistical significance at the 95% confidence level.
1150 JOURNAL OF THE ATMOSPHER IC SC IENCES VOLUME 73
ice albedo feedback mechanism (Stroeve et al. 2012).
Since mechanisms 1 and 2 are based on steady-state
solutions, these mechanisms may operate at intrasea-
sonal and longer time scales. Mechanism 3, which op-
erates on the seasonal time scale (heat stored during the
warm season is released during the cold season), may
take the form of episodic, intraseasonal evaporation
events from the Arctic Ocean.
To evaluate whether the intraseasonal downward IR
and surface warming fluctuations at Barrow analyzed in
FIG. 9. Lagged regressions for lag 0 days of (left)sT4 and (center) ERA-Interim cloud fraction against the BSRNBarrow downward IR,
along with (right) the winter-mean cloud fraction over the 17-yr record for (top) the upper layer, (middle) the middle layer, and (bottom)
the lower layer. Dots indicate statistical significance at the 95% confidence level.
MARCH 2016 F LOURNOY ET AL . 1151
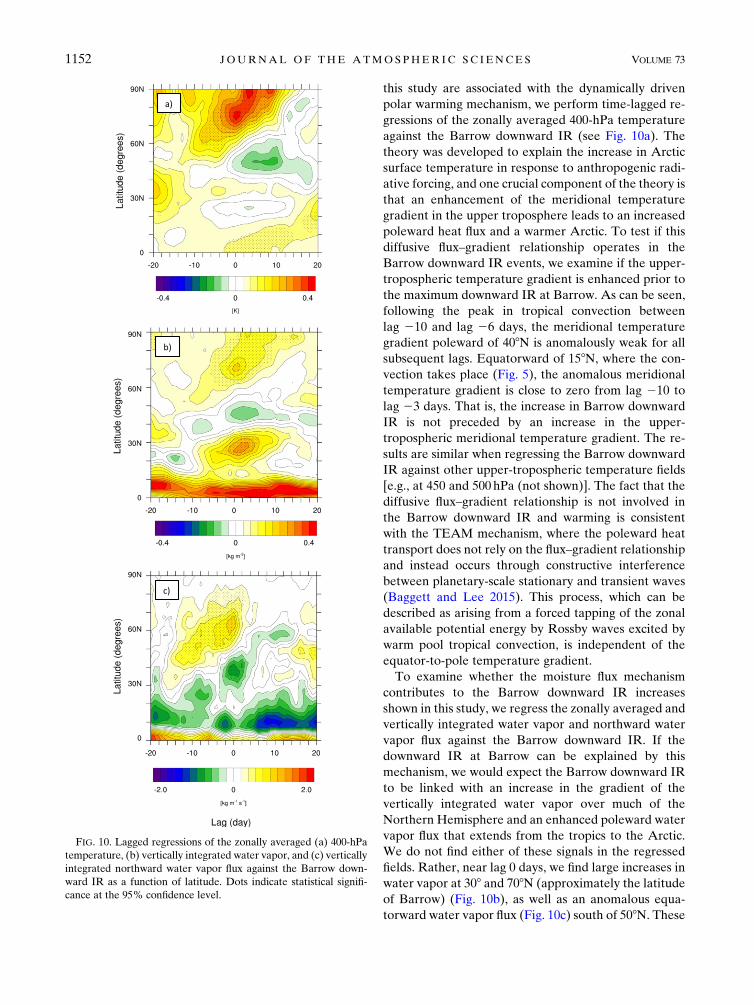
this study are associated with the dynamically driven
polar warming mechanism, we perform time-lagged re-
gressions of the zonally averaged 400-hPa temperature
against the Barrow downward IR (see Fig. 10a). The
theory was developed to explain the increase in Arctic
surface temperature in response to anthropogenic radi-
ative forcing, and one crucial component of the theory is
that an enhancement of the meridional temperature
gradient in the upper troposphere leads to an increased
poleward heat flux and a warmer Arctic. To test if this
diffusive flux–gradient relationship operates in the
Barrow downward IR events, we examine if the upper-
tropospheric temperature gradient is enhanced prior to
the maximum downward IR at Barrow. As can be seen,
following the peak in tropical convection between
lag 210 and lag 26 days, the meridional temperature
gradient poleward of 408N is anomalously weak for all
subsequent lags. Equatorward of 158N, where the con-
vection takes place (Fig. 5), the anomalous meridional
temperature gradient is close to zero from lag 210 to
lag 23 days. That is, the increase in Barrow downward
IR is not preceded by an increase in the upper-
tropospheric meridional temperature gradient. The re-
sults are similar when regressing the Barrow downward
IR against other upper-tropospheric temperature fields
[e.g., at 450 and 500 hPa (not shown)]. The fact that the
diffusive flux–gradient relationship is not involved in
the Barrow downward IR and warming is consistent
with the TEAM mechanism, where the poleward heat
transport does not rely on the flux–gradient relationship
and instead occurs through constructive interference
between planetary-scale stationary and transient waves
(Baggett and Lee 2015). This process, which can be
described as arising from a forced tapping of the zonal
available potential energy by Rossby waves excited by
warm pool tropical convection, is independent of the
equator-to-pole temperature gradient.
To examine whether the moisture flux mechanism
contributes to the Barrow downward IR increases
shown in this study, we regress the zonally averaged and
vertically integrated water vapor and northward water
vapor flux against the Barrow downward IR. If the
downward IR at Barrow can be explained by this
mechanism, we would expect the Barrow downward IR
to be linked with an increase in the gradient of the
vertically integrated water vapor over much of the
Northern Hemisphere and an enhanced poleward water
vapor flux that extends from the tropics to the Arctic.
We do not find either of these signals in the regressed
fields. Rather, near lag 0 days, we find large increases in
water vapor at 308 and 708N (approximately the latitude
of Barrow) (Fig. 10b), as well as an anomalous equa-
torward water vapor flux (Fig. 10c) south of 508N. These
a)
b)
c)
FIG. 10. Lagged regressions of the zonally averaged (a) 400-hPa
temperature, (b) vertically integrated water vapor, and (c) vertically
integrated northward water vapor flux against the Barrow down-
ward IR as a function of latitude. Dots indicate statistical signifi-
cance at the 95% confidence level.
1152 JOURNAL OF THE ATMOSPHER IC SC IENCES VOLUME 73
results suggest that this particular mechanism does not
contribute to the increase in the Barrow downward IR
found in this study. Furthermore, if the downward IR
fluctuations at Barrow were influenced solely by water
vapor fluxes, the enhanced emissivity due to the in-
creased water vapor and cloudiness would lead to a
decline in the upper-tropospheric temperature because
of greater radiative cooling. However, the increase in
the upper-tropospheric temperature (Fig. 10a) indicates
otherwise, suggesting that poleward heat fluxes play
an important role. In addition, the tilting of the largest
400-hPa temperature contours toward high latitudes
with increasing lag is also consistent with heat fluxes
contributing to the Arctic warming.
Last, to investigate the possible role of the sea ice
albedo feedback mechanism, we compute time-lagged
regressions of the surface evaporation against the Bar-
row downward IR (see the right column in Fig. 7). If the
sea ice albedo feedback from the previous summer was
influencing the intraseasonal downward IR fluctuations
at Barrow, we would expect to see an increase in the
surface evaporation over theArctic Ocean near Barrow.
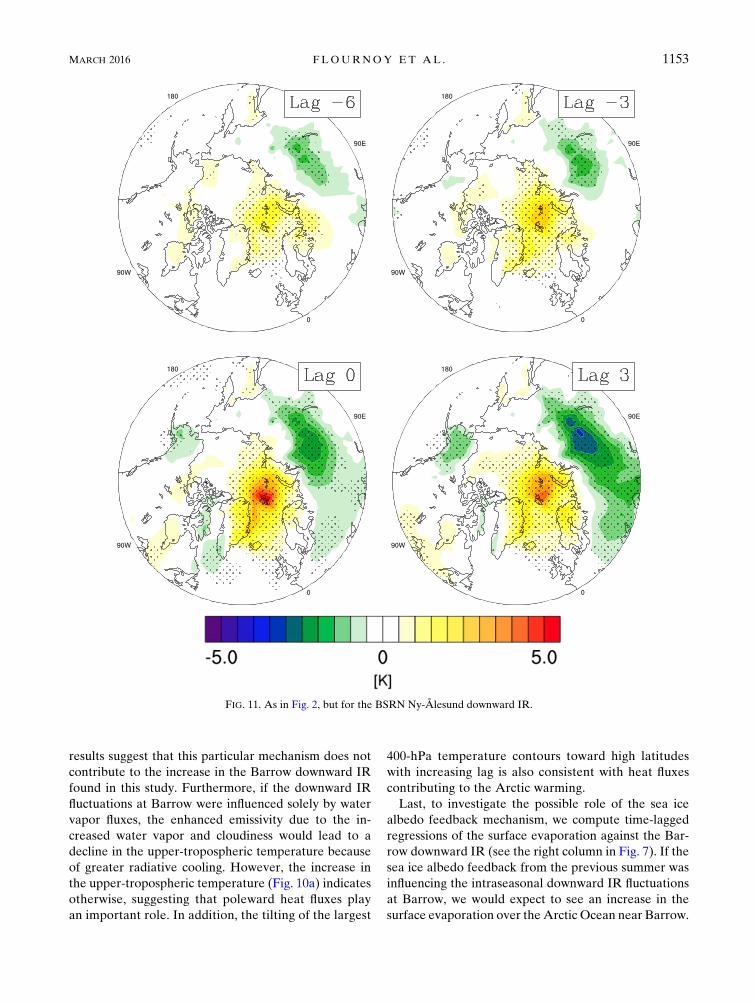
FIG. 11. As in Fig. 2, but for the BSRN Ny-Ålesund downward IR.
MARCH 2016 F LOURNOY ET AL . 1153

As can be seen, we find a strong connection between
increasing downward IR at Barrow and surface evap-
oration (i.e., from the ocean surface to the atmo-
sphere) from lag 22 to lag 0 days. However, these
surface evaporation anomalies occur in the Bering Sea
and Gulf of Alaska, far from Barrow, and well to the
south of the September marginal sea ice zone (http://
nsidc.org).
It is important to mention that the results shown in
Fig. 10 do not invalidate the above three mechanisms.
Rather, in the context of the intraseasonal downward IR
and surface warming fluctuations at Barrow, we did not
find evidence that these mechanisms are operating. In
fact, it is plausible that these mechanisms may play an
important role for other intraseasonal processes and for
longer-time-scale processes.
b. Ny-Ålesund downward IR
As for Barrow, the regression of the 2-m temperature
field against the Ny-Ålesund downward IR shows a
maximum value at lag 0 days (Fig. 11), with temperature
growth and decay time scales comparable to the down-
ward IR e-folding time scale. Next, the link between the
Ny-Ålesund downward IR and circulation at lower lat-
itudes is examined by regressing the 300-hPa geo-
potential height field against the Ny-Ålesund downward
IR (Fig. 12). As for Barrow, the Ny-Ålesund downward
IR is also preceded by a statistically significant Rossby
wave train, however this wave train is centered over the
northwestern Atlantic, northern Canada, and Scandi-
navia (Fig. 12), with the latter two centers reaching their
maximum amplitude at lag 0 days and decaying after-
ward. A weaker anomaly, which is also statistically sig-
nificant, is present over the northeastern Pacific.
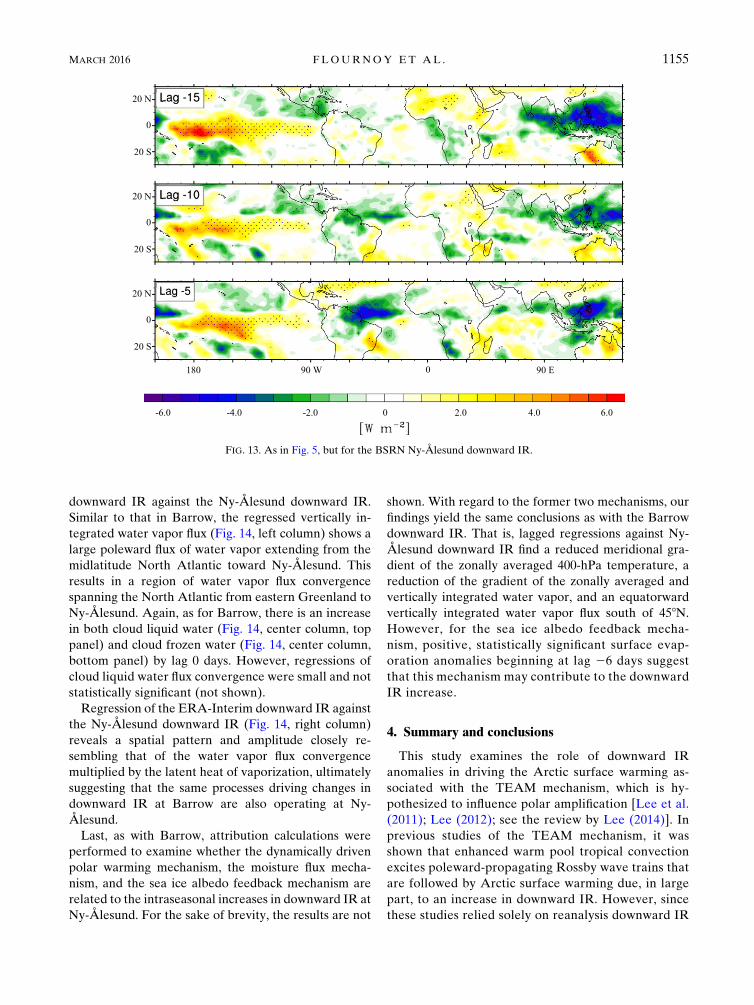
To investigate if this wave train is also associated with
tropical convection, the tropical OLR is regressed
against the Ny-Ålesund downward IR. Our results
suggest a tropical influence from both oceans (see
Fig. 13). At lag 215 days, one can see a large negative
OLR anomaly in the Pacific warm pool and a large
positive anomaly over the central tropical PacificOcean.
These OLR anomalies generally appear to weaken with
time but remain statistically significant. However, re-
gressions of theWheeler andHendon (2004)MJO index
(not shown) do not indicate a statistically significant link
to the MJO. The northeastern Pacific 300-hPa geo-
potential height anomaly in Fig. 12 is closer to the pos-
itive OLR anomaly over the central tropical Pacific
Ocean than to the negative anomaly over the Pacific
warm pool, which suggests that the Pacific wave train
may have central Pacific origins. However, the absence
of a large geopotential height anomaly over the sub-
tropical Pacific makes it difficult to determine with
confidence the source region for this wave train. A large
amplitude OLR anomaly that strengthens with time is
also observed over the western tropical Atlantic Ocean.
The presence of a positive 300-hPa geopotential height
anomaly over the northwestern Atlantic that is located
to the northwest of the negative tropical OLR anomaly
is consistent with the North Atlantic wave train being
driven by Atlantic tropical convection. As with Barrow,
these findings suggest that tropical convection also
contributes to the Ny-Ålesund Arctic downward IR
anomaly.
To examine the possible linkage between the down-
ward IR at Ny-Ålesund and moist processes, as for
Barrow, we regress the ERA-Interim vertically in-
tegrated water vapor flux and water vapor flux conver-
gence, cloud liquid and frozen water contents, and
FIG. 12. As in Fig. 3, but for the BSRN Ny-Ålesund downward IR.
1154 JOURNAL OF THE ATMOSPHER IC SC IENCES VOLUME 73
downward IR against the Ny-Ålesund downward IR.
Similar to that in Barrow, the regressed vertically in-
tegrated water vapor flux (Fig. 14, left column) shows a
large poleward flux of water vapor extending from the
midlatitude North Atlantic toward Ny-Ålesund. This
results in a region of water vapor flux convergence
spanning the North Atlantic from eastern Greenland to
Ny-Ålesund. Again, as for Barrow, there is an increase
in both cloud liquid water (Fig. 14, center column, top
panel) and cloud frozen water (Fig. 14, center column,
bottom panel) by lag 0 days. However, regressions of
cloud liquid water flux convergence were small and not
statistically significant (not shown).
Regression of the ERA-Interim downward IR against
the Ny-Ålesund downward IR (Fig. 14, right column)
reveals a spatial pattern and amplitude closely re-
sembling that of the water vapor flux convergence
multiplied by the latent heat of vaporization, ultimately
suggesting that the same processes driving changes in
downward IR at Barrow are also operating at Ny-
Ålesund.
Last, as with Barrow, attribution calculations were
performed to examine whether the dynamically driven
polar warming mechanism, the moisture flux mecha-
nism, and the sea ice albedo feedback mechanism are
related to the intraseasonal increases in downward IR at
Ny-Ålesund. For the sake of brevity, the results are not
shown. With regard to the former two mechanisms, our
findings yield the same conclusions as with the Barrow
downward IR. That is, lagged regressions against Ny-
Ålesund downward IR find a reduced meridional gra-
dient of the zonally averaged 400-hPa temperature, a
reduction of the gradient of the zonally averaged and
vertically integrated water vapor, and an equatorward
vertically integrated water vapor flux south of 458N.
However, for the sea ice albedo feedback mecha-
nism, positive, statistically significant surface evap-
oration anomalies beginning at lag 26 days suggest
that this mechanism may contribute to the downward
IR increase.
4. Summary and conclusions
This study examines the role of downward IR
anomalies in driving the Arctic surface warming as-
sociated with the TEAM mechanism, which is hy-
pothesized to influence polar amplification [Lee et al.
(2011); Lee (2012); see the review by Lee (2014)]. In
previous studies of the TEAM mechanism, it was
shown that enhanced warm pool tropical convection
excites poleward-propagating Rossby wave trains that
are followed by Arctic surface warming due, in large
part, to an increase in downward IR. However, since
these studies relied solely on reanalysis downward IR
FIG. 13. As in Fig. 5, but for the BSRN Ny-Ålesund downward IR.
MARCH 2016 F LOURNOY ET AL . 1155

data, which have an important modeling component,
we use in situ downward IR data from two Arctic
BSRN stations to further support the veracity of the
TEAM mechanism.
By regressing key variables against downward IR at
the Arctic BSRN stations, we found close agreement
with past studies, in that changes in station downward IR
are preceded by 1–2 weeks by anomalies in tropical
convection and poleward Rossby wave propagation. For
Barrow, an increase in downward IR is associated with
increased (decreased) convection over the western
tropical Pacific (Indian) Ocean, an active MJO, and a
wave train that closely resembles the PNA teleconnec-
tion pattern. For Ny-Ålesund, the increase in downward
IR is preceded by reduced (enhanced) convection over
the central tropical Pacific (Indo–western Pacific warm
pool), along with an increase in convection over the
western tropical Atlantic. In this case, the tropical con-
vection is not associated with theMJO, and the flow field
is dominated by a wave train extending over eastern
North America and the northwestern Atlantic. For both
Barrow and Ny-Ålesund, the location of the wave trains
FIG. 14. Lagged regressions of (left) water vapor flux (vectors) and water vapor flux convergence multiplied by the latent heat of
vaporization (shading), and (right) the ERA-Interim downward IR against the BSRNNy-Ålesund downward IR. (center) The lag-0-day
regression of the (top) cloud liquid water and (bottom) cloud frozen water against the BSRN Ny-Ålesund downward IR are also shown.
Dots indicate statistical significance at the 95% confidence level.
1156 JOURNAL OF THE ATMOSPHER IC SC IENCES VOLUME 73
relative to the convection is consistent with the wave
trains being excited by the convection.
We also used linear regressions to investigate the
physical mechanisms that link the Rossby wave train
and Arctic downward IR. It was found for both Barrow
and Ny-Ålesund that the wave train advects heat and
water vapor from midlatitudes into the Arctic. Since
the resulting water vapor flux convergence multiplied
by the latent heat of vaporization closely resembles the
increase in downward IR both in spatial pattern and in
amplitude, it appears that latent heat due to conden-
sation (both cloud liquid and frozen water increase)
contributed to an increase in atmospheric temperature
followed by increased downward IR. Furthermore, it is
found that warm advection throughout the troposphere
and increased cloud cover in the upper and middle
troposphere are also likely contributors to a larger
downward IR. In addition, at Ny-Ålesund, enhanced
surface evaporation anomalies suggest that the sea ice
albedo feedback mechanism may contribute to in-
creased downward IR at that location. Since ERA-
Interim downward IR closely resembles the BSRN
downward IR at Barrow and Ny-Ålesund, we speculate
that surface warming over much of the Arctic is driven
by the same processes. A full radiative transfer analysis
with station data, which involves vertical profiles of
cloudiness (both liquid and ice clouds), water vapor,
temperature, and radiative variables during periods of
large downward IR associated with the TEAM mech-
anism, is the focus of our next project.
Acknowledgments. This study is supported by Na-
tional Science Foundation Grants AGS-1139970,
AGS-1036858, and AGS-1401220 and National
Oceanic and Atmospheric Administration Grant
NA14OAR4310190. We thank two anonymous re-
viewers for their helpful comments. We also thank
the European Centre for Medium-Range Weather
Forecasts, the Climate Analysis Branch of the
NOAA Earth System Research Laboratory/Physical
Sciences Division, and the World Radiation Moni-
toring Center–Baseline Surface Radiation Network
for making available the ERA-Interim data, the
outgoing longwave radiation data, and the downward
IR station data, respectively.
REFERENCES
Baggett, C., and S. Lee, 2015: Arctic warming induced by tropi-
cally forced tapping of available potential energy and the role
of the planetary-scale waves. J. Atmos. Sci., 72, 1562–1568,
doi:10.1175/JAS-D-14-0334.1.
Cai,M., 2005: Dynamical amplification of polar warming.Geophys.
Res. Lett., 32, L22710, doi:10.1029/2005GL024481.
——, 2006: Dynamical greenhouse-plus feedback and polar
warming amplification. Part I: A dry radiative-transportive
climate model. Climate Dyn., 26, 661–675, doi:10.1007/
s00382-005-0104-6.
Davis, R. E., 1976: Predictability of sea surface temperature
and sea level pressure anomalies over the North Pacific
Ocean. J. Phys. Oceanogr., 6, 249–266, doi:10.1175/
1520-0485(1976)006,0249:POSSTA.2.0.CO;2.
Dee, D. P., and S. Uppala, 2009: Variational bias correction of
satellite radiance data in the ERA-Interim reanalysis. Quart.
J. Roy. Meteor. Soc., 135, 1830–1841, doi:10.1002/qj.493.
——, and Coauthors, 2011: The ERA-Interim reanalysis: Config-
uration and performance of the data assimilation system.
Quart. J. Roy. Meteor. Soc., 137, 553–597, doi:10.1002/qj.828.
Deng, Y., T.-W. Park, and M. Cai, 2012: Process-based de-
composition of the global surface temperature response to
El Niño in boreal winter. J. Atmos. Sci., 69, 1706–1712,
doi:10.1175/JAS-D-12-023.1.
Dutton, E. G., D. Halliwell, A. Herber, M. Maturilli, and
V. Kustov, 2014: Basic measurements of radiation from the
Baseline Surface Radiation Network (BSRN) of five stations
in the years 1993 to 2013 for the December, January, and
February seasons, reference list of 142 datasets. PANGEA,
accessed 1 June 2012, doi:10.1594/PANGAEA.150003.
Feldstein, S. B., 2002: The recent trend and variance increase
of the annular mode. J. Climate, 15, 88–94, doi:10.1175/
1520-0442(2002)015,0088:TRTAVI.2.0.CO;2.
Franzke, C., S. B. Feldstein, and S. Lee, 2011: Synoptic analysis of
the Pacific–North American teleconnection pattern. Quart.
J. Roy. Meteor. Soc., 137, 329–346, doi:10.1002/qj.768.
Hoskins, B. J., and D. J. Karoly, 1981: The steady linear re-
sponse of a spherical atmosphere to thermal and oro-
graphic forcing. J. Atmos. Sci., 38, 1179–1196, doi:10.1175/
1520-0469(1981)038,1179:TSLROA.2.0.CO;2.
——, M. E. McIntyre, and A. W. Robertson, 1985: On the use
and significance of isentropic potential vorticity maps.
Quart. J. Roy. Meteor. Soc., 111, 877–946, doi:10.1002/
qj.49711147002.
Johnson, N. C., and S. B. Feldstein, 2010: The continuum of North
Pacific sea level pressure patterns: Intraseasonal, interannual,
and interdecadal variability. J. Climate, 23, 851–867,
doi:10.1175/2009JCLI3099.1.
Langen, P. L., and V. A. Alexeev, 2007: Polar amplification as a
preferred response in an idealized aquaplanet GCM. Climate
Dyn., 29, 305–317, doi:10.1007/s00382-006-0221-x.
Lee, S., 2012: Testing of the tropically excited Arctic warming
mechanism (TEAM) with traditional El Niño and La Niña.J. Climate, 25, 4015–4022, doi:10.1175/JCLI-D-12-00055.1.
——, 2014: A theory for polar amplification from a general circu-
lation perspective. Asia-Pac. J. Atmos. Sci., 50, 31–43,
doi:10.1007/s13143-014-0024-7.
——, T. Gong, N. Johnson, S. B. Feldstein, and D. Pollard, 2011:
On the possible link between tropical convection and the
Northern Hemisphere Arctic surface air temperature change
between 1958 and 2001. J. Climate, 24, 4350–4367, doi:10.1175/
2011JCLI4003.1.
Lu, J., and M. Cai, 2009: Seasonality of polar surface warming
amplification in climate simulations. Geophys. Res. Lett., 36,
L16704, doi:10.1029/2009GL040133.
——, and ——, 2010: Quantifying contributions to polar
warming amplification in an idealized coupled general cir-
culation model. Climate Dyn., 34, 669–687, doi:10.1007/
s00382-009-0673-x.
MARCH 2016 F LOURNOY ET AL . 1157
Maturilli, M., A. Herber, and G. König-Langlo, 2014: Surface ra-
diation climatology for Ny-Ålesund, Svalbard (78.98N), basic
observations for trend detection. Theor. Appl. Climatol., 120,
331–339, doi:10.1007/s00704-014-1173-4.
Moore, R. W., O. Martius, and T. Spengler, 2010: The modulation
of the subtropical and extratropical atmosphere in the Pacific
basin in response to theMadden–Julian oscillation.Mon.Wea.
Rev., 138, 2761–2779, doi:10.1175/2010MWR3194.1.
Mori, M., and M. Watanabe, 2008: The growth and triggering
mechanisms of the PNA: A MJO–PNA coherence. J. Meteor.
Soc. Japan, 86, 213–236, doi:10.2151/jmsj.86.213.
Park, T.-W., Y. Deng, and M. Cai, 2012: Feedback attribution of
the El Niño–Southern Oscillation-related atmospheric and
surface temperature anomalies. J. Geophys. Res., 117, D23101,
doi:10.1029/2012JD018468.
Roundy, P. E., K. MacRitchie, J. Asuma, and T. Melino, 2010:
Modulation of the global atmospheric circulation by combined
activity in the Madden–Julian oscillation and the El Niño–Southern Oscillation during boreal winter. J. Climate, 23,4045–4059, doi:10.1175/2010JCLI3446.1.
Stroeve, J. C., M. C. Serreze, M. M. Holland, J. E. Kay, J. Malanik,
and A. P. Barrett, 2012: The Arctic’s rapidly shrinking sea ice
cover: A research synthesis. Climate Change, 110, 1005–1027,
doi:10.1007/s10584-011-0101-1.
Wheeler, M. C., and H. H. Hendon, 2004: An all-season real-time
multivariate MJO index: Development of an index for moni-
toring and prediction. Mon. Wea. Rev., 132, 1917–1932,
doi:10.1175/1520-0493(2004)132,1917:AARMMI.2.0.CO;2.
Yoo, C., S. Feldstein, and S. Lee, 2011: The impact of theMadden–
Julian Oscillation trend on the Arctic amplification of surface
air temperature during the 1979–2008 boreal winter.Geophys.
Res. Lett., 38, L24804, doi:10.1029/2011GL049881.
——, S. Lee, and S. B. Feldstein, 2012a:Arctic response to anMJO-
like tropical heating in an idealized GCM. J. Atmos. Sci., 69,2379–2393, doi:10.1175/JAS-D-11-0261.1.
——, ——, and ——, 2012b: Mechanisms of Arctic surface air
temperature change in response to the Madden–Julian
oscillation. J. Climate, 25, 5777–5790, doi:10.1175/
JCLI-D-11-00566.1.
Zib, B. J., X. Dong, B. Xi, and A. Kennedy, 2012: Evaluation
and intercomparison of cloud fraction and radiative fluxes
in recent reanalyses over the Arctic using BSRN surface
observations. J. Climate, 25, 2291–2305, doi:10.1175/
JCLI-D-11-00147.1.
1158 JOURNAL OF THE ATMOSPHER IC SC IENCES VOLUME 73