Embed Size (px)
Citation preview
Exploring the thermodynamics of a rubber band
David RoundyDepartment of Physics, Oregon State University, Corvallis, OR 97331
Michael RogersDepartment of Physics, Ithaca College, Ithaca, NY 14850
We describe an upper-division experiment in thermal physics where students measure the tensionof a rubber band as a function of temperature and length, and use a Maxwell relation to find thechange in internal energy and entropy for an isothermal stretch. This allows students to experimen-tally check the predictions of the entropic spring model for elastomers and observe that the entropydoes indeed decrease as a rubber band is stretched.
I. INTRODUCTION
Rubber bands provide an appealing subject for a ther-mal physics laboratory experiment. In contrast to mostsolids and liquids, which respond weakly to small changesin temperature, rubber’s tension noticably increases withincreasing temperature. This Gough-Joule effect—whichis contrary to student expectations—is a standard exam-ple in courses in statistical mechanics. Combined withlow cost and familiarity to students, these factors makethe lowly rubber band an almost ideal material for a ther-mal physics experiment.
Numerous laboratories and classroom demonstrationsaddress how the tension of rubber bands increases withtemperature,1–6 or to measure mechanical properties ofrubber bands at room temperature.7,8 However, few ofthese experiments involve carefully measuring a rubberband’s equation of state. The majority of the exper-iments that demonstrate the surprising dependence oftension on temperature make a purely qualitative demon-stration in which the temperature is changed, but notmeasured.2–5 Savarino and Fisch describe a laboratoryexperiment that involves measuring the tension in a rub-ber band as a function of temperature and extension,using a space heater to change the temperature of therubber band.6 Their experiment is used to teach dataanalysis methods by using multiple approaches to extractthe parameters in an equation of state for the rubberband; however, there is no thermodynamic analysis ofthe resulting values, nor do they address the applicabil-ity of the equation of state. In this paper, we introducea rubber band experiment that uses Maxwell relations tomeasure changes in entropy and internal energy.
II. THEORETICAL BACKGROUND
The thermodynamic identity for a rubber band is
dU = TdS + τdL, (1)
where T is the temperature, τ is the tension, U is theinternal energy of the rubber band, S is its entropy, andL is its length. This relation follows naturally from the
First Law of Thermodynamics, combined with the defini-tion of work as the dot product of force and displacement.We could use the differential relation given in Eq. (1), butsince we are working at constant T , the Helmholtz freeenergy F provides a more useful starting point
dF = τdL− SdT. (2)
The corresponding Maxwell relation
−(∂S
∂L
)
T
=
(∂τ
∂T
)
L
, (3)
tells us that we can determine how entropy changes withlength at fixed temperature by measuring how the ten-sion changes with temperature at fixed length. At thesame time, measurement of the tension reveals how thefree energy varies with isothermal changes in length
τ =
(∂F
∂L
)
T
. (4)
Thus, measurements of τ and (∂τ/∂T )L, as a function oflength, allow us to find ∆F , ∆S, and ultimately ∆U byintegration.
III. EXPERIMENTAL ARRANGEMENT
Figure 1 shows a photo and a schematic of the exper-imental setup. Students stretch a rubber band from ahook in a stopper at the bottom of a glass tube to achain connected to a force meter at the top of the tube.This setup allows the rubber band to be completely sub-merged when the tube is filled with water. It also allowsstudents to quickly alter the length of the rubber bandby changing which link of the chain is hooked onto theforce meter.
During the experiment, students adjust the tempera-ture by pouring water into the tube. They then measuretension as a function of rubber band length for differentwater temperatures. By emptying the water out of thetop of the tube, students can efficiently replace the wa-ter and change the temperature using water prepared bymixing boiling water, room-temperature water, and ice.
2
force
meter
thermometer
rubber
stopper
hook
chain
FIG. 1: A photograph and schematic of the experimental ap-paratus.
Once the water is added to the system, the temperatureis monitored with an electronic thermometer while stu-dents make their measurements; several measurementscan be made for different lengths before the temperaturehas dropped (or risen) by as much as 1 ◦C.
Unfortunately, deviations from ideal elastic behaviorpresent a major challenge. Ideally, a rubber band shouldreturn to its original state when released. However, rub-ber deviates from elastic behavior in two ways. First,rubber bands only slowly return to their original stateafter being released, leading to hysteresis in tensionmeasurements—a different tension is measured when arubber band is stretched to a given length than whenit is stretched further and relaxed to the same length.The second deviation is due to plasticity—if a rubberband remains stretched for too long, it never returns toits original length. Avoiding very high tensions (greaterthan about 6 N) and maintaining a relaxed state betweentension measurements (e.g. while changing the tempera-ture) reduces plastic behavior.
IV. ANALYSIS
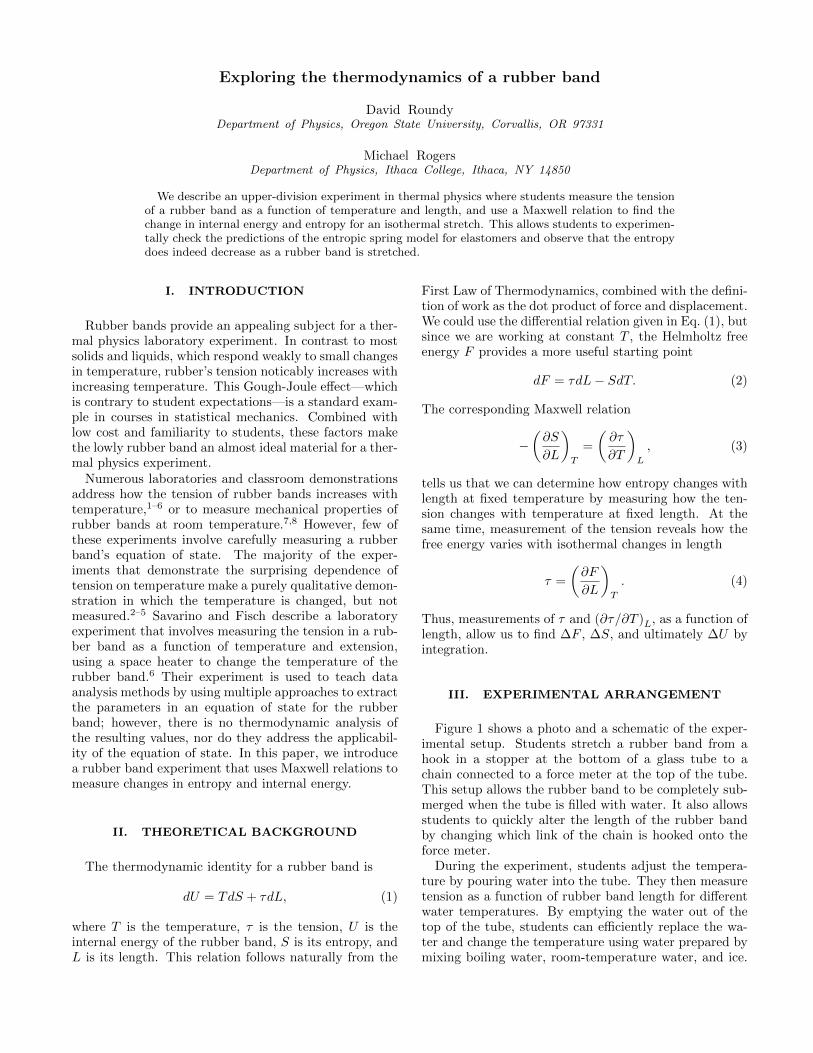
As shown in Fig. 2, students plot tension versus lengthfor a few different temperatures. The data in this figurewas taken starting at the shortest length (24.5 cm), mov-ing to the longest length (38.8 cm), and returning againto the shortest length. Solid lines show the tension asthe rubber band is stretched and dashed lines show thetension as it is subsequently relaxed. The close proximityof the measured curves shows that the variation of thetension due to temperature (∼ 0.2 N) is small comparedwith its variation with length (∼ 2 N). Figure 2 also showsthat the tension increases with increasing temperature,contrary to student expectations.
24 26 28 30 32 34 36 38 40Length (cm)
0.0
0.5
1.0
1.5
2.0
2.5
3.0
3.5
Tens
ion
(N)
67.0◦C1.4◦C
FIG. 2: (color online) Tension versus length at the highestand lowest temperatures measured. The solid lines are thetension as the rubber band is stretched and the dashed linesare the tension as it relaxes. The difference between the twocurves is due to hysteresis.
The hysteretic behavior of the rubber band is eas-ily visible in Fig. 2. The tension during stretching is∼ 0.1 N greater than the tension relaxing (at the maxi-mum length there is no hysteresis because this point wasonly measured once). Although this change in tensionis less than 10% of the measured value, it is comparableto the change in tension due to temperature. By mea-suring the tension for the same sequence of lengths—andin the same order—students can achieve reproducible re-sults that distinguish between the effects of temperatureand hysteresis.
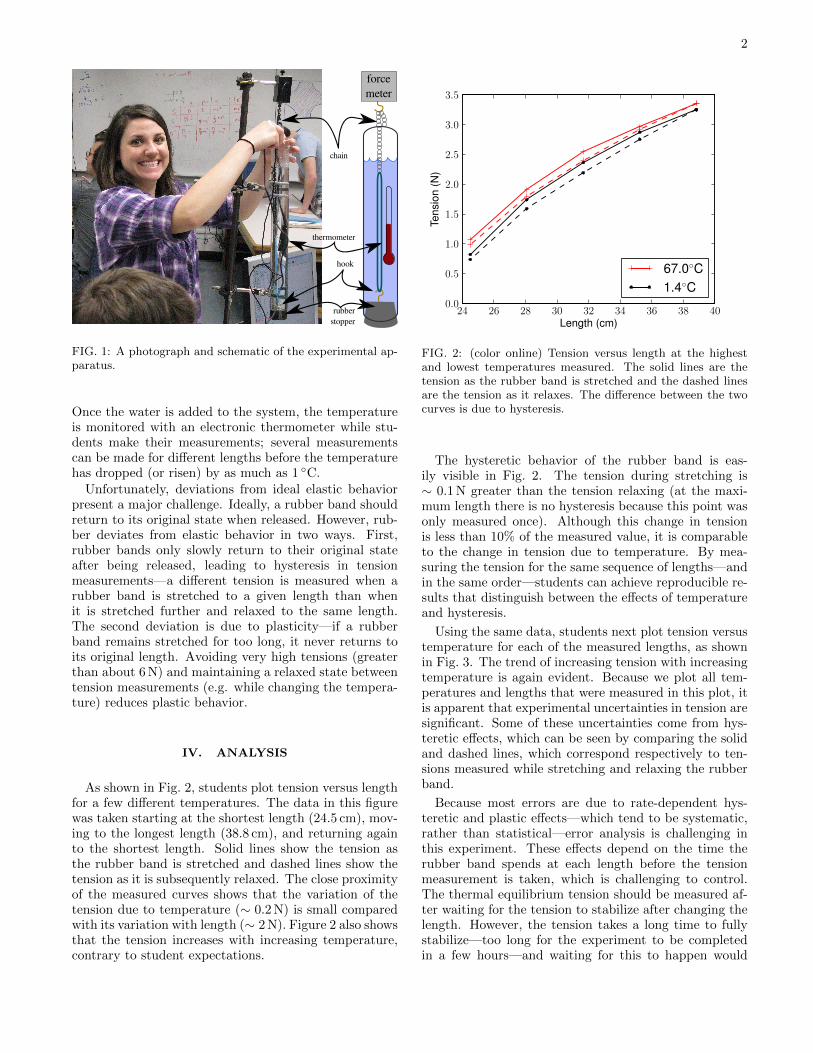
Using the same data, students next plot tension versustemperature for each of the measured lengths, as shownin Fig. 3. The trend of increasing tension with increasingtemperature is again evident. Because we plot all tem-peratures and lengths that were measured in this plot, itis apparent that experimental uncertainties in tension aresignificant. Some of these uncertainties come from hys-teretic effects, which can be seen by comparing the solidand dashed lines, which correspond respectively to ten-sions measured while stretching and relaxing the rubberband.
Because most errors are due to rate-dependent hys-teretic and plastic effects—which tend to be systematic,rather than statistical—error analysis is challenging inthis experiment. These effects depend on the time therubber band spends at each length before the tensionmeasurement is taken, which is challenging to control.The thermal equilibrium tension should be measured af-ter waiting for the tension to stabilize after changing thelength. However, the tension takes a long time to fullystabilize—too long for the experiment to be completedin a few hours—and waiting for this to happen would
3
0 10 20 30 40 50 60 70Temperature (◦C)
0.0
0.5
1.0
1.5
2.0
2.5
3.0
3.5Te
nsio
n(N
)
38.8 cm35.2 cm31.7 cm
28.1 cm24.5 cm
FIG. 3: (color online) Tension versus temperature for eachmeasured length. As in Fig. 2, the solid lines represent mea-surements taken with increasing length, while dashed linescorrespond to decreasing length.
Potential Change (J)T∆S −0.09∆F 0.22∆U 0.13
TABLE I: Results for changes in thermodynamic potentialsfound by integrating the curves in Figs. 2 and 4. This datacorresponds to an isothermal stretch of 14 cm at 30 ◦C.
allow the rubber band to plastically deform. Therefore,instead of waiting for the tension to completely stabilize,we merely wait for it to stop changing rapidly. This leadsto hysteresis in our measurements, and errors due to thehuman choice of how long is long enough to wait whilemaking each measurement. We avoid taking temperaturemeasurements in monotonic order so as to avoid any con-fusion between temperature dependence and the effect ofplasticity.
Students complete their analysis by calculating thechange in internal energy, free energy, and entropy foran isothermal stretch of their rubber band at a specifictemperature of their choosing. They first numericallyintegrate the tension with respect to length to get thework done on the rubber band, which is the change inHelmholtz free energy when their rubber band is isother-mally stretched
∆F |T =
∫τdL. (5)
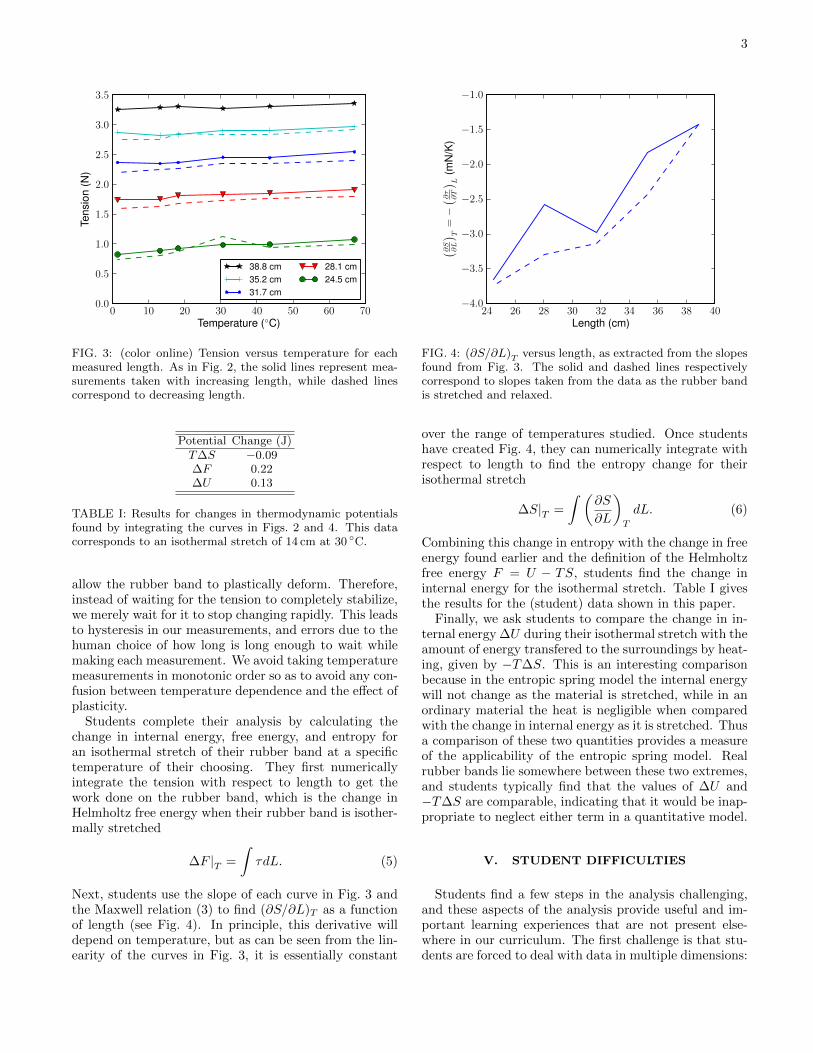
Next, students use the slope of each curve in Fig. 3 andthe Maxwell relation (3) to find (∂S/∂L)T as a functionof length (see Fig. 4). In principle, this derivative willdepend on temperature, but as can be seen from the lin-earity of the curves in Fig. 3, it is essentially constant
24 26 28 30 32 34 36 38 40Length (cm)
−4.0
−3.5
−3.0
−2.5
−2.0
−1.5
−1.0
( ∂S∂L
) T=−( ∂
τ∂T
) L(m
N/K
)
FIG. 4: (∂S/∂L)T versus length, as extracted from the slopesfound from Fig. 3. The solid and dashed lines respectivelycorrespond to slopes taken from the data as the rubber bandis stretched and relaxed.
over the range of temperatures studied. Once studentshave created Fig. 4, they can numerically integrate withrespect to length to find the entropy change for theirisothermal stretch
∆S|T =
∫ (∂S
∂L
)
T
dL. (6)
Combining this change in entropy with the change in freeenergy found earlier and the definition of the Helmholtzfree energy F = U − TS, students find the change ininternal energy for the isothermal stretch. Table I givesthe results for the (student) data shown in this paper.
Finally, we ask students to compare the change in in-ternal energy ∆U during their isothermal stretch with theamount of energy transfered to the surroundings by heat-ing, given by −T∆S. This is an interesting comparisonbecause in the entropic spring model the internal energywill not change as the material is stretched, while in anordinary material the heat is negligible when comparedwith the change in internal energy as it is stretched. Thusa comparison of these two quantities provides a measureof the applicability of the entropic spring model. Realrubber bands lie somewhere between these two extremes,and students typically find that the values of ∆U and−T∆S are comparable, indicating that it would be inap-propriate to neglect either term in a quantitative model.
V. STUDENT DIFFICULTIES
Students find a few steps in the analysis challenging,and these aspects of the analysis provide useful and im-portant learning experiences that are not present else-where in our curriculum. The first challenge is that stu-dents are forced to deal with data in multiple dimensions:
4
tension is measured as a function of both length and tem-perature and must be plotted as a function of each vari-able. This poses a purely computational difficulty, butalso serves to highlight the multidimensional nature ofthermodynamics, which causes particular challenges inthe context of partial derivatives.9,10 Our students typ-ically overcome this difficulty without the assistance ofspecifically targeted instruction.
The second challenge that students face is to find aderivative numerically from noisy experimental measure-ments of tension as a function of temperature. Some stu-dents select a small value of ∆T to perform a finite dif-ference derivative, a natural inclination given the math-ematical definition of a derivative. But such a procedurecan cause problems when there is noise in the data. Oneway we address this problem is by asking students toplot the entire curve so they get a sense of the big pic-ture. In this experiment, the data is essentially linear,which makes it easy to perform a curve fit to find theslope. Alternatively, some students perform a finite dif-ference calculation using two widely separated tempera-tures to reduce the effects of noise. Dealing with such anapproach requires little beyond having students plot thecurves before trying to find the slope.
Finally, most of our students struggle when required tonumerically integrate their experimental measurements.Before we started providing specific hints, we found thatmany students would attempt to perform an analytic in-tegral and would find themselves stymied by the lack ofa functional form. We now spend a few minutes in classtalking about what an integral really is—a summation—and explaining that students will need to perform a nu-merical integration.
We assign the analysis portion of this experiment inplace of a homework assignment so that students canwork at their own pace on this challenging assignment.Although the students struggle on this assignment, theyare able to find help during office hours and by workingtogether. Alternatively, the analysis could be done as anin-class activity, which would help address some of thesedifficulties. Doing the analysis in class, however, wouldlikely require that all students use the same software toperform the analysis, and could impose a prohibitive timeconstraint.
VI. CONCLUSIONS
In our experience, rubber bands provide a useful sys-tem for thermodynamic study. The Gough-Joule effect
is a classic demonstration of entropy in action havingan effect that is surprising to students, and the entropicspring model is a standard example in statistical mechan-ics. We describe an experiment that connects this sim-plified model with real rubber bands, in which studentsmake measurements that not only demonstrate the qual-itative prediction that tension increases with tempera-ture, but also demonstrate the dependence of internalenergy on tension—in contrast to the simplistic entropicspring model. Moreover, by using a Maxwell relation tomeasure entropy we drive home to students that entropyis a real, measurable state variable. The analysis more-over highlights the connection between Helmholtz freeenergy, internal energy, and entropy, and provides stu-dents with a concrete application in which the Helmholtzfree energy is useful.
This experiment is practical because temperaturestrongly influences the mechanical properties of rubberbands. Unfortunately, a related (and less desirable) prop-erty of rubber bands is their hysteretic behavior, whichmakes the experiment challenging while at the same timedemonstrating to students the need for careful data ac-quisition. This experiment also provides an opportunityto discuss the concept of thermal equilibrium in a contextthat is far more tangible than two abstracted systems inthermal contact. In our experience, the difficulties ofworking with rubber bands are well balanced by the ad-vantages, both in the behavior that can be observed aswell as in the student experience of applying thermody-namics to an everyday object.
Acknowledgments
The funding for this project was provided, in part,by the National Science Foundation under Grant Nos.DUE-0837829, DUE-0618877, DUE-0837214, and DUE-0837301. This experiment is based on a laboratory activ-ity developed by Allen Wasserman for the Paradigms inPhysics program at Oregon State University. A descrip-tion of this experiments is included in an appendix of histextbook on thermal physics.11 More information regard-ing the Paradigms in Physics curriculum is available onthe project webpage.12
1 J. B. Brown. “Thermodynamics of a rubber band.” Am.J. Phys. 31, pp. 397–397 (1963).
2 R. P. Feynman, R. B. Leighton, M. Sands, et al. TheFeynman lectures on physics, volume 2 (Addison-WesleyReading, MA, 1964).
3 M. Dole. “Lecture table experimental demonstration ofentropy.” J. Chem. Ed. 54 (12), pp. 754–754 (1977).
4 W. Hirsch. “Rubber bands, free energy, and Le Chatelier’sPrinciple.” J. Chem. Ed. 79 (2), pp. 200A–200B (2002).
5 M. I. Liff. “Polymer physics in an introductory general

5
physics course.” Phys. Teach. 42, pp. 536–540 (2004).6 G. Savarino and MR Fisch. “A general physics laboratory
investigation of the thermodynamics of a rubber band.”Am. J. Phys. 59, pp. 141–145 (1991).
7 J. Dowling and G.H. Mullen. “Rubber band lab.” Phys.Teach. 12 (4), pp. 231–233 (1974).
8 A. Filipponi, L. Di Michele, and C. Ferrante. “Viscoelasticbehavior of a mass-rubber band oscillator.” Am. J. Phys.78, pp. 437–444 (2010).
9 J. W. Cannon. “Connecting thermodynamics to students
calculus.” Am. J. Phys. 72, pp. 753–757 (2004).10 J. R. Thompson, C. A. Manogue, D. J. Roundy, and D. B.
Mountcastle. “Representations of partial derivatives inthermodynamics.” In “AIP Conf. Proc,” (2012), volume1413, pp. 85–88.
11 A. L. Wasserman. Thermal Physics: Concepts and Practice(Cambridge University Press, 2011).
12 Webpage of the Paradigms in Physics project.http://physics.oregonstate.edu/portfolioswiki.