Embed Size (px)
Citation preview

Exploring the State of Play of African Refining Dr Ekpen J. Omonbude
Economic Adviser, Governance & Natural Resources Advisory Services Division
Platts African Refining Summit, Cape Town, 17 November 2014

Disclaimer
The findings, interpretations, and conclusions expressed in
this presentation are those of the author and do not
necessarily reflect the views of the Commonwealth
Secretariat and its affiliated organisations, or those of the
executive leadership of the Commonwealth Secretariat or
the Commonwealth Member Governments. The
Commonwealth Secretariat does not guarantee the accuracy
of the data included in this work.

Outline
1. Background
2. African Oil Consumption
3. Global Refining Capacity Overview
4. African Refining Capacity Assessment
5. Refining Business Profitability
6. Marketing Considerations
7. Implications and Challenges
8. Concluding Remarks

Background
• Commonwealth Secretariat’s Governance & Natural Resources Advisory Services Division
• Ocean Governance & Natural Resources Management Section
• Diagnostic – identifying legislative and commercial barriers to investment
• Prescriptive – developing appropriate policy, legal, regulatory, institutional frameworks
• Transactional – Assisting in the negotiation process, maritime boundaries delimitation
• Objective of the presentation
• To provide a simple but candid assessment of the African downstream petroleum market in the context of the fundamentals
• Thesis/argument
• There is insufficient market justification for significant additional crude distillation capacity in the medium (and, some would argue, long) term
Introduction & Objective
African Oil Consumption
-
500
1,000
1,500
2,000
2,500
3,000
3,500
4,000
0.0%
1.0%
2.0%
3.0%
4.0%
5.0%
6.0%
7.0%
2004 2005 2006 2007 2008 2009 2010 2011 2012 2013
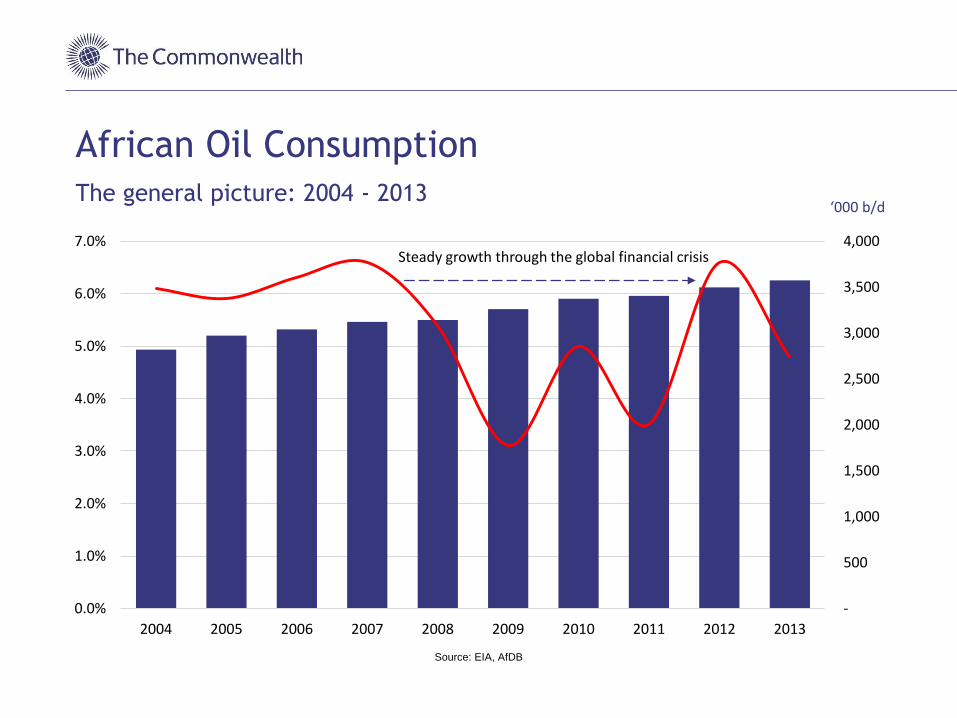
The general picture: 2004 - 2013
Source: EIA, AfDB
Steady growth through the global financial crisis
‘000 b/d

African Oil Consumption
-20 0 20 40 60 80 100 120 140 160
Rest of Africa
Libya
Tunisia
Ghana
Sudan & South Sudan
Kenya
Nigeria
Tanzania
Ethiopia
Morocco
Angola
South Africa
Egypt
Algeria
Oil Consumption Growth 2004 - 2013 ('000 b/d)
• Top 13 consumers account for 85% of current consumption (the top 5 – Egypt, South Africa, Algeria, Nigeria, Libya – account for 64%)
• Top 13 added 644 kb/d over the last decade
• Rest of Africa added 111 kb/d over the last decade
• Supported by strong economic growth – annual average GDP of the top 13 at 5.7%, despite uprising in North Africa & Sudan
Where we’ve come from
Source: EIA Source: EIA
-200
-100
0
100
200
300
400
500
600
700
800
1995 - 2005 2005 - 2013
Oil Consumption Growth by Product Grouping
Lights Middle Distillates Heavy Other

African Oil Consumption
0 50 100 150 200 250 300
Rest of Africa
Tunisia
Libya
Ghana
Tanzania
Sudan & South Sudan
Morocco
Kenya
Ethiopia
Angola
Algeria
South Africa
Egypt
Nigeria
Oil Consumption Growth 2013 - 2025 ('000 b/d)
• Expectation of some level of sustained growth pattern with top 13 as usual suspects
• Expected growth of about 153 kb/d by 2015; over 380 kb/d by 2020; about 395 kb/d by 2025. Additional 930+
kb/d over coming decade
• Conservative: about 380 kb/d fewer barrels added than in 2 decade period to 2013
• Strong growth in gasoline, diesel LPG, aviation fuel
Where we’re going?
Author’s forecast
0
500
1,000
1,500
2,000
2,500
3,000
3,500
4,000
4,500
5,000
1995 2005 2013 2015 2020 2025
African Oil Consumption to 2025 (‘000 b/d)
Mogas Jet Fuel Kero Diesel Residual Fuel Oil LPG Other
Author’s forecast
Forecast
African Oil Consumption
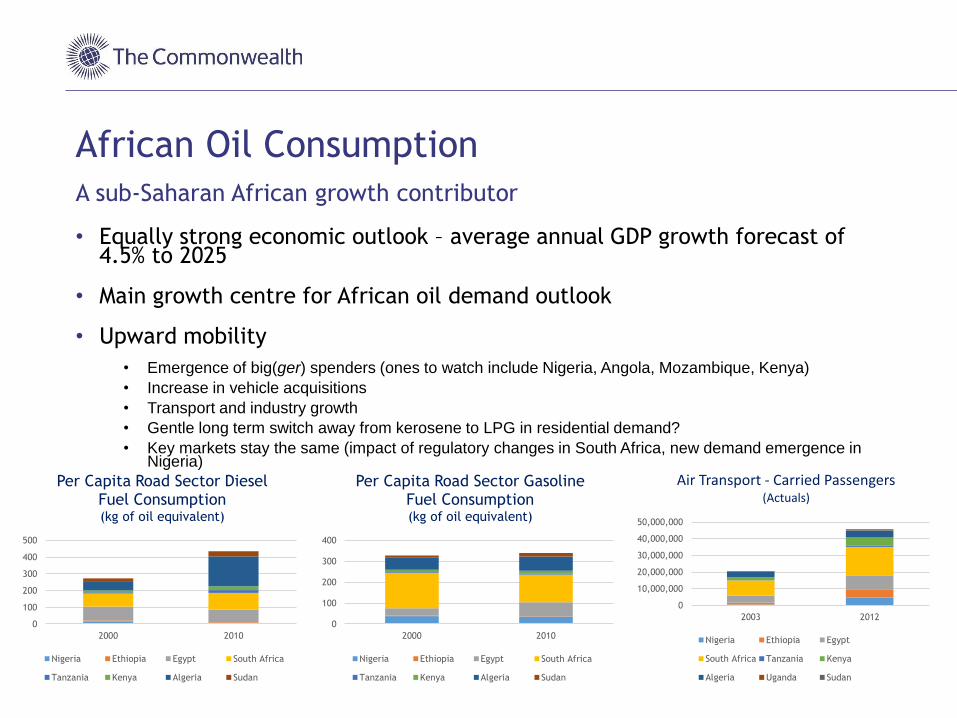
• Equally strong economic outlook – average annual GDP growth forecast of 4.5% to 2025
• Main growth centre for African oil demand outlook
• Upward mobility
• Emergence of big(ger) spenders (ones to watch include Nigeria, Angola, Mozambique, Kenya)
• Increase in vehicle acquisitions
• Transport and industry growth
• Gentle long term switch away from kerosene to LPG in residential demand?
• Key markets stay the same (impact of regulatory changes in South Africa, new demand emergence in Nigeria)
A sub-Saharan African growth contributor
0
10,000,000
20,000,000
30,000,000
40,000,000
50,000,000
2003 2012
Air Transport - Carried Passengers (Actuals)
Nigeria Ethiopia Egypt
South Africa Tanzania Kenya
Algeria Uganda Sudan
0
100
200
300
400
500
2000 2010
Per Capita Road Sector Diesel Fuel Consumption (kg of oil equivalent)
Nigeria Ethiopia Egypt South Africa
Tanzania Kenya Algeria Sudan
0
100
200
300
400
2000 2010
Per Capita Road Sector Gasoline Fuel Consumption (kg of oil equivalent)
Nigeria Ethiopia Egypt South Africa
Tanzania Kenya Algeria Sudan
20,000
20,200
20,400
20,600
20,800
21,000
21,200
21,400
21,600
2004 2008 2013
5,600
5,800
6,000
6,200
6,400
6,600
6,800
2004 2008 2013
23,000
23,500
24,000
24,500
25,000
2004 2008 2013
0
2,000
4,000
6,000
8,000
10,000
2004 2008 2013
2,800
3,000
3,200
3,400
3,600
2004 2008 2013
0
10,000
20,000
30,000
40,000
2004 2008 2013
Data Source: BP
Global Refining Capacity Overview
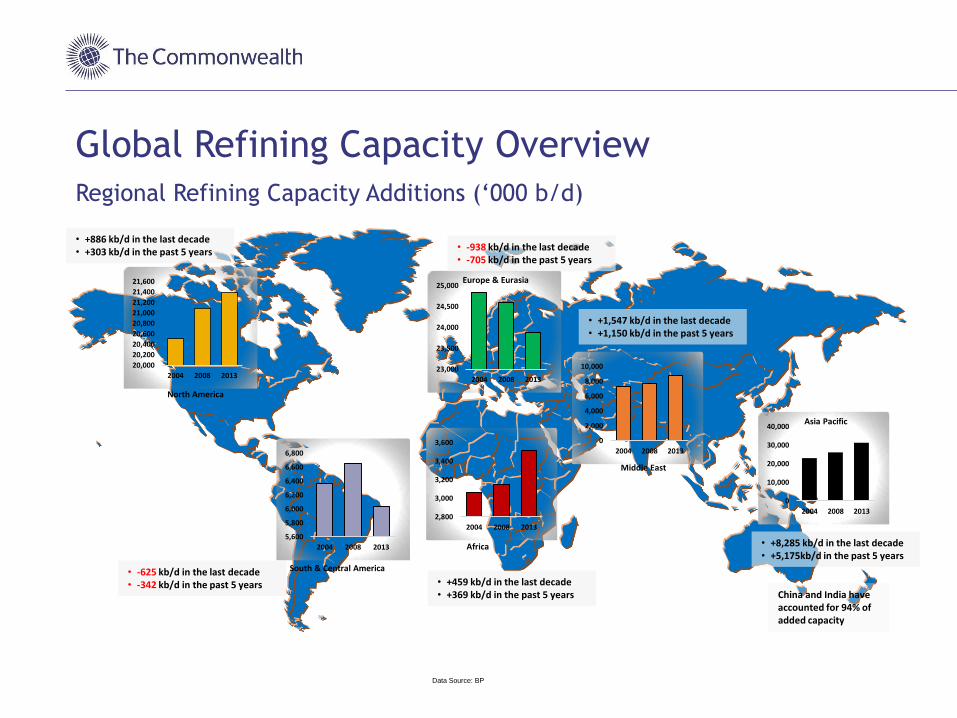
• +886 kb/d in the last decade • +303 kb/d in the past 5 years
• -625 kb/d in the last decade • -342 kb/d in the past 5 years
• -938 kb/d in the last decade • -705 kb/d in the past 5 years
• +459 kb/d in the last decade • +369 kb/d in the past 5 years
• +1,547 kb/d in the last decade • +1,150 kb/d in the past 5 years
Regional Refining Capacity Additions (‘000 b/d)
• +8,285 kb/d in the last decade • +5,175kb/d in the past 5 years
China and India have accounted for 94% of added capacity
North America
South & Central America
Europe & Eurasia
Africa
Middle East
Asia Pacific

African Refining Capacity Assessment
• Short capacity
• Acute long term?
• Except South Africa, insulation from market margin exposure
• Wide variety of diesel and motor gasoline specs
• Mogas: 1,500ppm in Kenya; 2,500ppm in Gabon
• Diesel: 50ppm already available in South Africa; Niger allows 10,000ppm!!
• Limited complexity
• Only Egypt and South Africa with coking capacity
• Catalytic cracking: Ghana, Morocco, Nigeria, South Africa
• Hydrocracking: Cote d’Ivoire, DRC, Egypt, South Africa
• 1.4 mb/d import justification?

African Refining Capacity Assessment
0
500
1,000
1,500
2,000
2,500
3,000
3,500
4,000
Total NameplateCapacity
75% NameplateCapacity
50% NameplateCapacity
2013 RefineryThroughput
Total CurrentConsumption
Net Product Import Justification ('000 b/d)
Sources: EIA, IEA, BP, Oil & Gas Journal
1.4 mb/d
3.5 mb/d

African Refining Capacity Assessment
1,251
334
150
400
0
200
400
600
800
1,000
1,200
1,400
Planned/Planning Under Construction Feasibility Engineering
Projected Refining Capacity Additions to 2018 ('000 b/d)
Future Additional Capacity: few possibilities, but are they really gonna happen?
• Planned • Libya: Mellita Refinery – 200+ kb/d • Morocco: Jorf Lasfar – vacuum distillation, 200+ kb/d • Mozambique: Maputo Province – 350 kb/d • South Africa: Port Elizabeth – 400 kb/d • South Sudan: Warap – 50 kb/d • Gabon: Mandji – 50 kb/d
• Under Construction • Angola: Lobito – 200 kb/d (1st phase of 120 kb/d by 2017) • Chad: Near N’Djamena – 40 kb/d • Cote d’Ivoire: Vridi District – 60 kb/d • Niger: Near Zinder – 20 kb/d • Nigeria: Eket – 14 kb/d (crude distillation, hydrotreater, reformer)
• Feasibility • Uganda: Refinery – 150 kb/d
• Engineering • Algeria: East Algeria – Refinery renovation; Algiers – refurbish • Cameroon: Limbe – crude distillation revamp; new vacuum
distillation, new catalytic reformer • Nigeria: Dangote Group – 400 kb/d
Source: Oil & Gas Journal
Optimistic: 2.1 mb/d added capacity
Pessimistic: 334 kb/d added capacity

Refining Business Profitability
• Coincidence of investment upturn and demand downturn in ‘08-’09 created bulge in global spare capacity
• Expected to overhang the market for much of the decade
• Low or negative margins + spate of closures likely to continue?
• The margin protection question
• Margins? What margins?
• 4Q 2013: $7.59 on the barrel (USGC Heavy Sour Coking); $2.89 (NWE Light Sweet Cracking); $1.30 (Singapore Medium Sour Hydrocracking) – source: BP
• Insulation from oil price volatility & market-based decisions to close – living a lie?
• Regulatory impact
• Most significant movement is from 500ppm to 10ppm in South Africa
• Cost and downtime implications on import requirement
• Movement towards low sulphur is not cheap; cost implications for governments maintaining import price parity systems
• Entry of global traders in retailing – added pressure on local refiners?
• Difficult to envisage mad dash of private investment
• Wider product spectrum needed to enhance competitiveness
• Larger, more complex refineries are not cheap!

Marketing Considerations
• Crucial to the outlook for African refining
• Hub focus? Or inland/regional market focus?
• Hub?
• What target market?
• Atlantic? Maturing markets and Latin America?
• Middle East? + 1.2 mb/d since 2008
• Asia Pacific? +5.2 mb/d since 2008
• Difficult to see immediate justification for placing bets on an international hub
• Inland market?
• Critical dependence on economic growth
• Will West, Central & East African consumption growth be big enough?
• Infrastructure considerations

Marketing Considerations
• Road infrastructure
• SSA’s total road network is only 204 km per 1,000 km2 of land area • only about 25% is paved, compared to the world average of 944 km per 1000 km2 of
land area
• Translates into 3.6 km of road per 1,000 persons for the region • World average of about 7 km per 1,000 persons
• Rail infrastructure
• 66,011 km of rail concentrated in coastal areas • Growth in “land-locked demand” for petroleum products
• EAC integration across transit corridors – diesel, fuel oil
• Port capacity expansion
• Pressure points: GDP growth, political stability, integration of regional economies with Asia, port sector privatisation, increased ship size and transhipment, terminal productivity increases
• Pipeline construction & networks
• Industrial demand
The enabling infrastructure question

Implications and Challenges
• Price structure
• The subsidy/price cap question
• Regulatory challenge
• Tightening of product specifications becoming inevitable?
• Market changes
• New upgraded units?
• Improved capacity utilisation?
• Growth in arbitrage?
• Lower freight rates?
• Liberalisation?
• Skills gap
• Limited trading experience and expertise
• Engineering
• Limited product & market knowledge?
• Limited procurement & logistics expertise
• The business case
• Is there sufficient market justification for investment in additional CD capacity?

Concluding Remarks
• There is insufficient market justification for additional crude distillation capacity in the medium to long term. The fundamentals do not sufficiently support supreme confidence.
• Focus more on capacity utilisation + configuration enhancement or shut down.
• Focus more on regional markets than an international hub?
• Increasing pressure on poor-spec products. Capability upgrades (very gradually) becoming necessary for survival.
• As markets open up, exposure to tight margins could impact on investment appetite.